Embed Size (px)
Citation preview
Research Methods (HDFS 3390), Alan Reifman, Texas Tech University
Intro to Statistics
Education scholars David Berliner and Bruce Biddle, in their 1995 book, The Manufactured Crisis: Myths, Fraud, and the Attack on America's Public Schools, make the following argument (p. 316):
...we cannot understand why a person who dislikes mathematics and does not want to work in a science field should be forced to take calculus... If we had to nominate a topic in mathematics that is needed today by all informed citizens, it would be statistics.
Similarly, Arthur Benjamin, the "Mathemagician," endorses the study of statistics and probability as the most useful aspect of mathematics for most people
Descriptive StatisticsMeasures of Central (Typical) Tendency
MEAN (average): Add up all scores and divide by number of people (most familiar).
MEDIAN: Score that same number of people fall above and fall below.
MODE (primarily for nominal variables): Most frequently occurring score.
Mean, Median, and Mode are the same in a normal, bell-shaped distribution (illustrated on this website, scroll down to heading “Normal Distribution”)
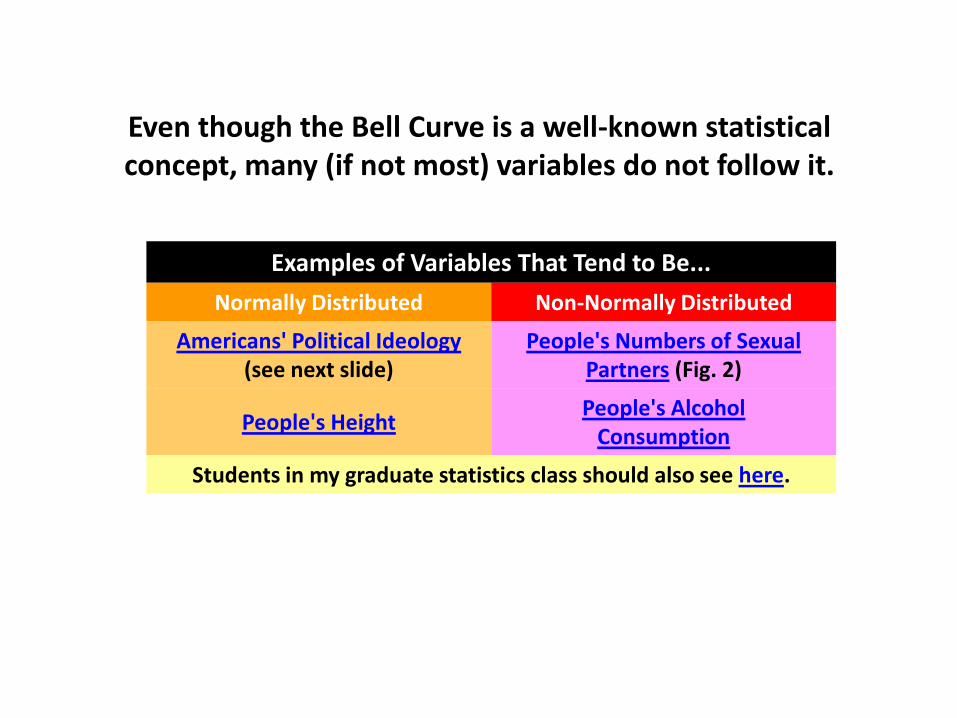
Examples of Variables That Tend to Be...
Normally Distributed Non-Normally Distributed
Americans' Political Ideology(see next slide)
People's Numbers of Sexual Partners (Fig. 2)
People's HeightPeople's Alcohol
Consumption
Students in my graduate statistics class should also see here.
Even though the Bell Curve is a well-known statistical concept, many (if not most) variables do not follow it.
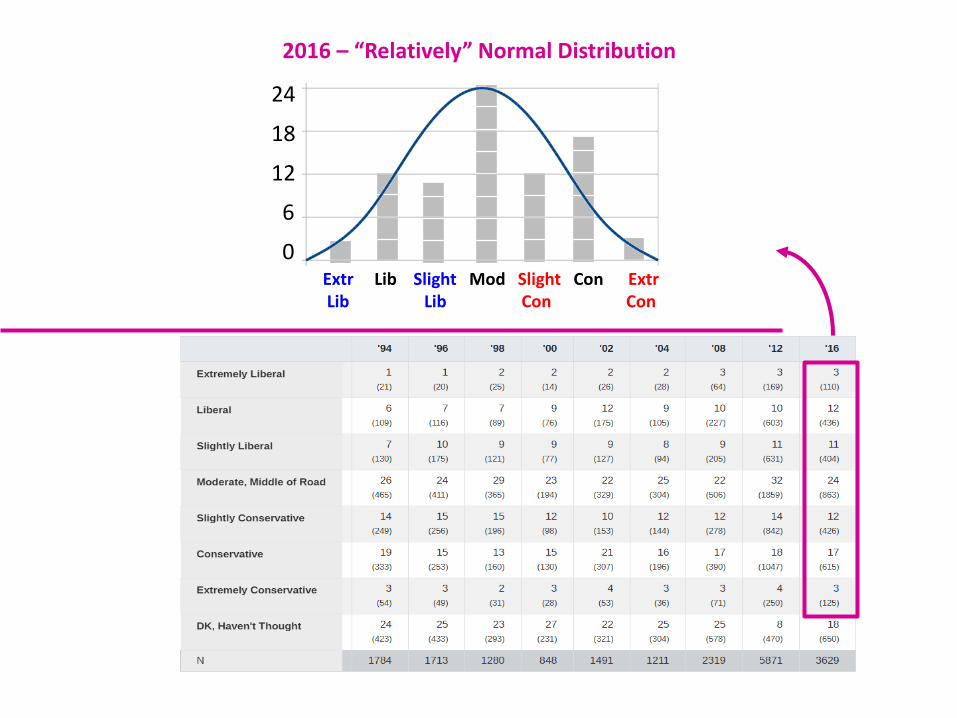
Extr Lib Slight Mod Slight Con ExtrLib Lib Con Con
2016 – “Relatively” Normal Distribution
24
18
12
6
0
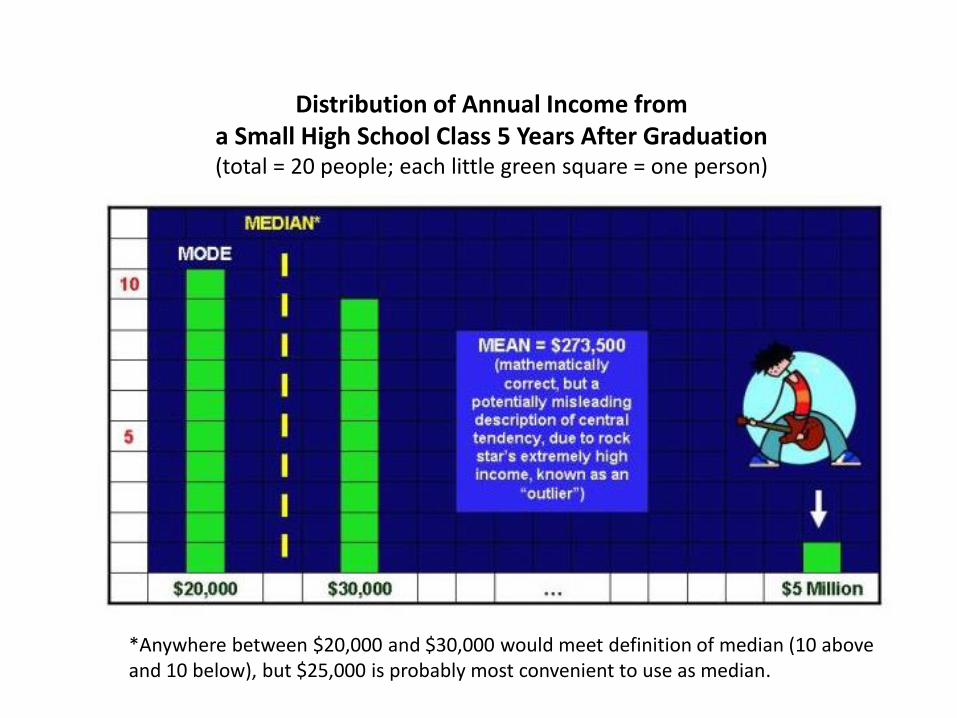
Distribution of Annual Income from a Small High School Class 5 Years After Graduation (total = 20 people; each little green square = one person)
*Anywhere between $20,000 and $30,000 would meet definition of median (10 above and 10 below), but $25,000 is probably most convenient to use as median.
The MeanLyrics by Alan Reifman(May be sung to the tune of “Jolene,” Dolly Parton)
The mean, the mean, the mean, the mean,You add up all the scores, and divide by N,The mean, the mean, the mean, the mean,The average you’ve computed, time and again,
You typically make sense to heed,But with outliers, you mislead,Because all exact values, it must know,
The median, won’t show much swing,How far away, is not its thing,Just so you’ve half above, and half below,
What comes up most, is called the mode, For nominal, the only road, Sometimes, multiple peaks, are in your frame,
When data shapes, follow the bell, There's only one thing, left to tell, Mean, median, and mode, are all the same,
The mean, the mean, the mean, the mean,A useful stat to know, but it’s not all,The mean, the mean, the mean, the mean,Into a trap, you do not want to fall...
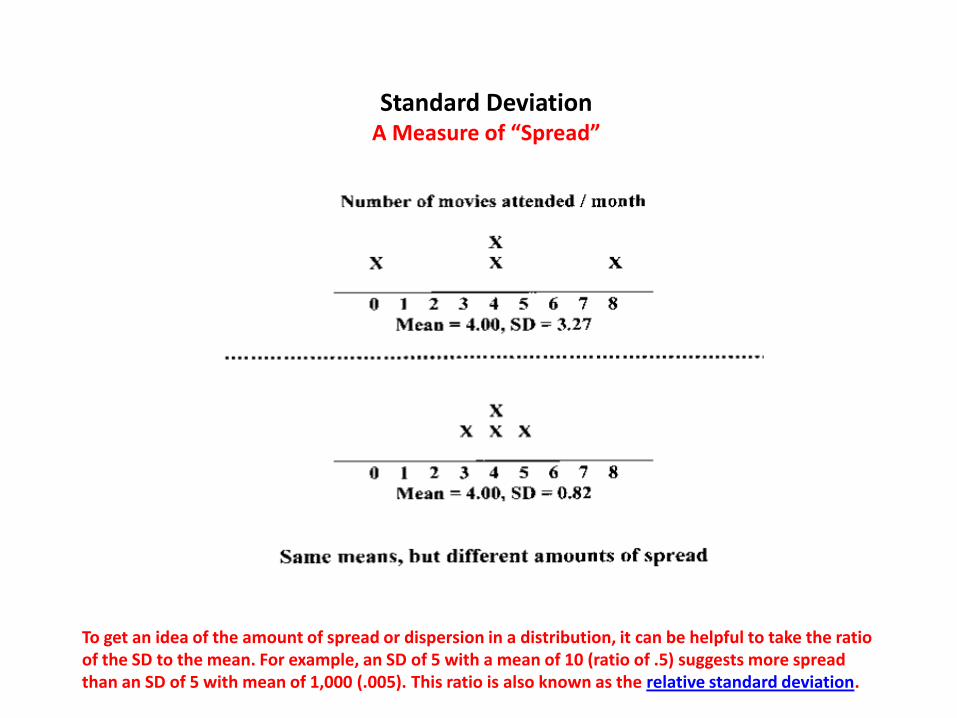
To get an idea of the amount of spread or dispersion in a distribution, it can be helpful to take the ratio of the SD to the mean. For example, an SD of 5 with a mean of 10 (ratio of .5) suggests more spread than an SD of 5 with mean of 1,000 (.005). This ratio is also known as the relative standard deviation.
Standard DeviationA Measure of “Spread”
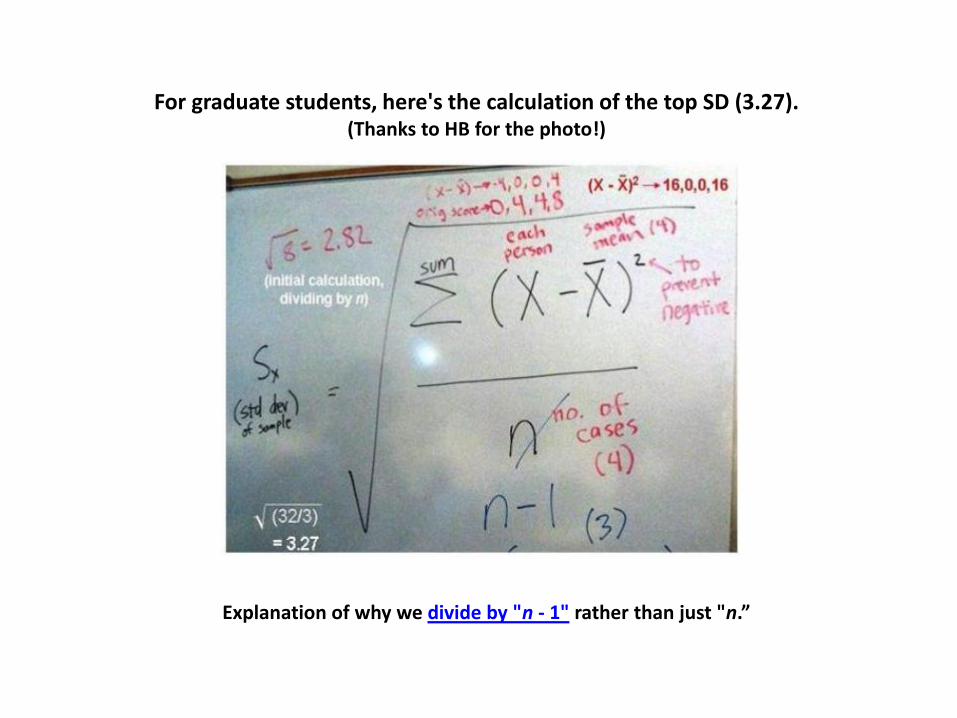
For graduate students, here's the calculation of the top SD (3.27). (Thanks to HB for the photo!)
Explanation of why we divide by "n - 1" rather than just "n.”
Concrete example of why the standard deviation can sometimes be important. Ian Ayres writes in his book Super Crunchers, which is about "number-crunching" statistical analyses, as follows:
When I taught at Stanford Law School, professors were required to award grades that had a 3.2 mean. ...[S]tudents would ask if a professor was a "spreader" [wide range, high SD] or "clumper" [narrow range, low SD]. Good students would want to avoid clumpers so that they would have a better chance at getting an A, while bad students hated the spreaders who handed out more As but also more Fs (p. 201; segments in red inserted by Dr. Reifman).
Dr. Reifman wonders how this grading requirement is enforced. Perhaps non-compliant professors are made to teach 8:00 a.m. courses, stripped of their parking privileges, or made to dress up as the Stanford tree mascot!
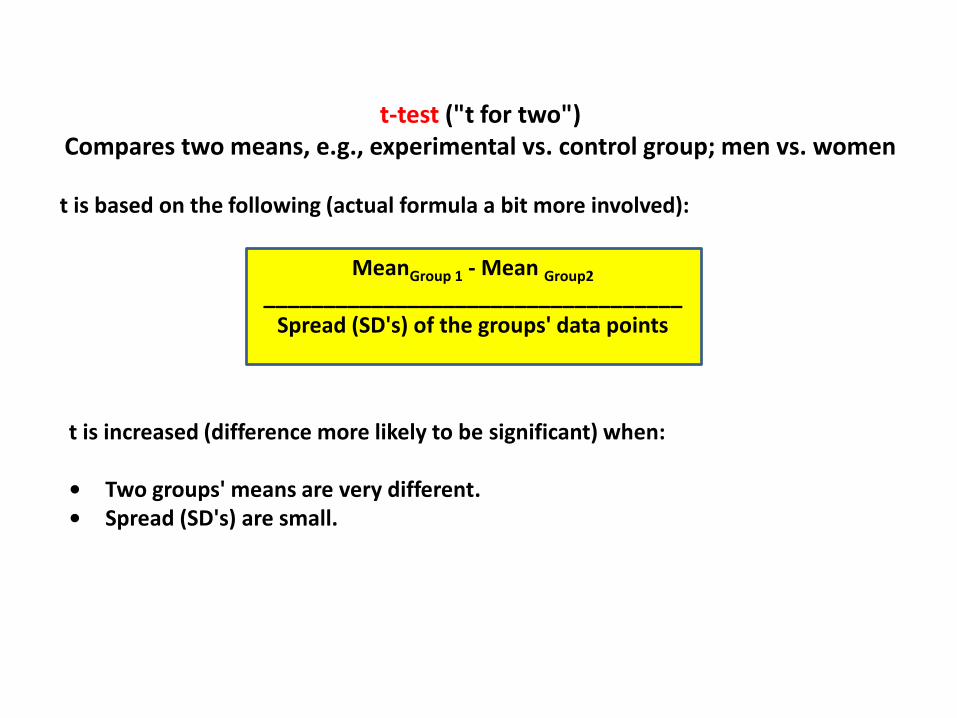
t-test ("t for two")Compares two means, e.g., experimental vs. control group; men vs. women
t is based on the following (actual formula a bit more involved):
MeanGroup 1 - Mean Group2
___________________________________Spread (SD's) of the groups' data points
t is increased (difference more likely to be significant) when:
• Two groups' means are very different.• Spread (SD's) are small.
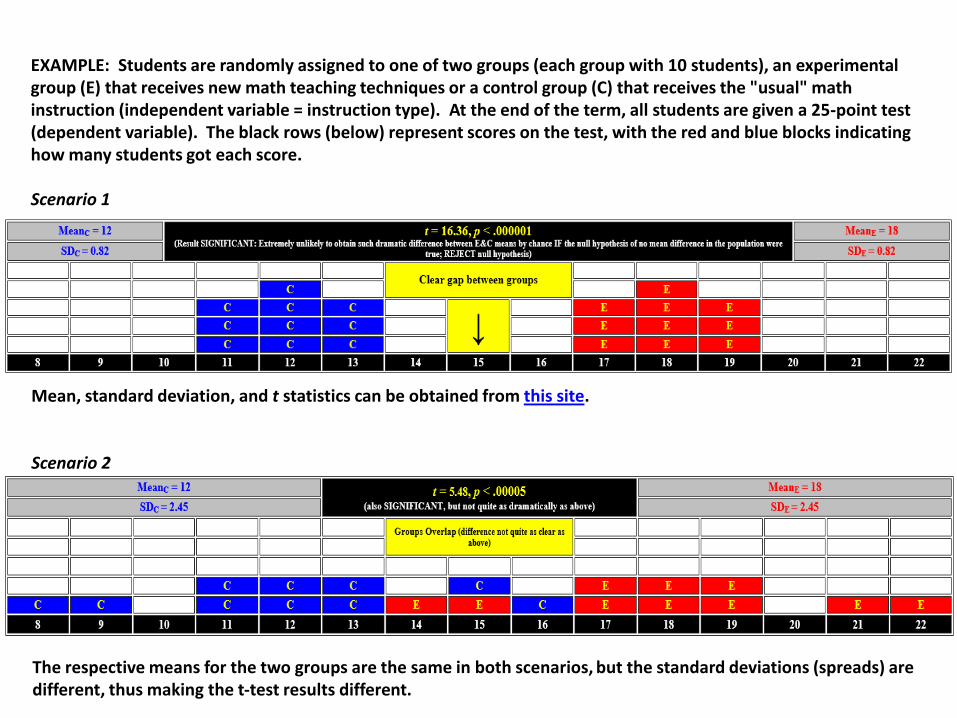
EXAMPLE: Students are randomly assigned to one of two groups (each group with 10 students), an experimental group (E) that receives new math teaching techniques or a control group (C) that receives the "usual" math instruction (independent variable = instruction type). At the end of the term, all students are given a 25-point test (dependent variable). The black rows (below) represent scores on the test, with the red and blue blocks indicating how many students got each score.
Scenario 1
Mean, standard deviation, and t statistics can be obtained from this site.
Scenario 2
The respective means for the two groups are the same in both scenarios, but the standard deviations (spreads) are different, thus making the t-test results different.
Statistical significance
Just because the means of two groups on a DV are different, it doesn't guarantee that the difference is authentic, substantial, or appreciable. The difference could be due to chance. As Westfall and Henning (2013) state, "When a difference is not easy to explain by chance alone, it is called a statistically significant difference" (p. 401).
Statistical significance (determined through various statistical tests) tells us if difference is so large, it is extremely unlikely to have resulted from chance. A common standard in the social sciences is whether a finding would come up by chance 5 times out of 100 or less often ( p <.05).
Study of "College Cuteness" compares the mean attractiveness of female students at different universities (t test is used to compare one school to another). I apologize in advance for the unbalanced nature of the study (only women are evaluated on attractiveness, not men), which many could consider sexist. However, the study presents significance testing in a very down-to-earth manner.
Hypothesis Testing
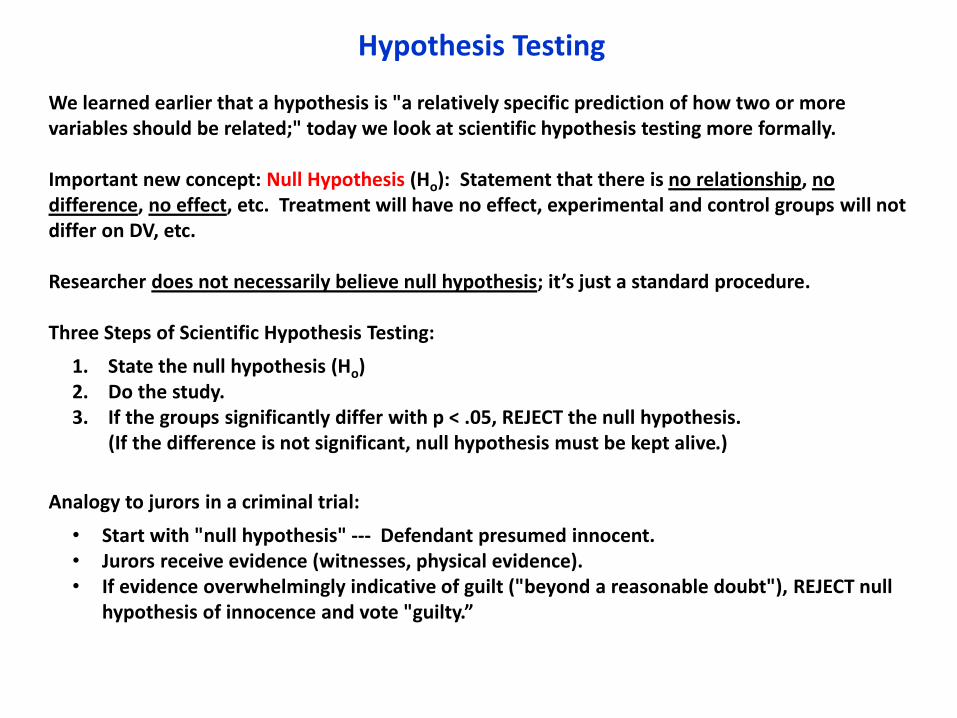
We learned earlier that a hypothesis is "a relatively specific prediction of how two or more variables should be related;" today we look at scientific hypothesis testing more formally.
Important new concept: Null Hypothesis (Ho): Statement that there is no relationship, no difference, no effect, etc. Treatment will have no effect, experimental and control groups will not differ on DV, etc.
Researcher does not necessarily believe null hypothesis; it’s just a standard procedure.
Three Steps of Scientific Hypothesis Testing:
1. State the null hypothesis (Ho)2. Do the study.3. If the groups significantly differ with p < .05, REJECT the null hypothesis.
(If the difference is not significant, null hypothesis must be kept alive.)
Analogy to jurors in a criminal trial:
• Start with "null hypothesis" --- Defendant presumed innocent.• Jurors receive evidence (witnesses, physical evidence).• If evidence overwhelmingly indicative of guilt ("beyond a reasonable doubt"), REJECT null
hypothesis of innocence and vote "guilty.”
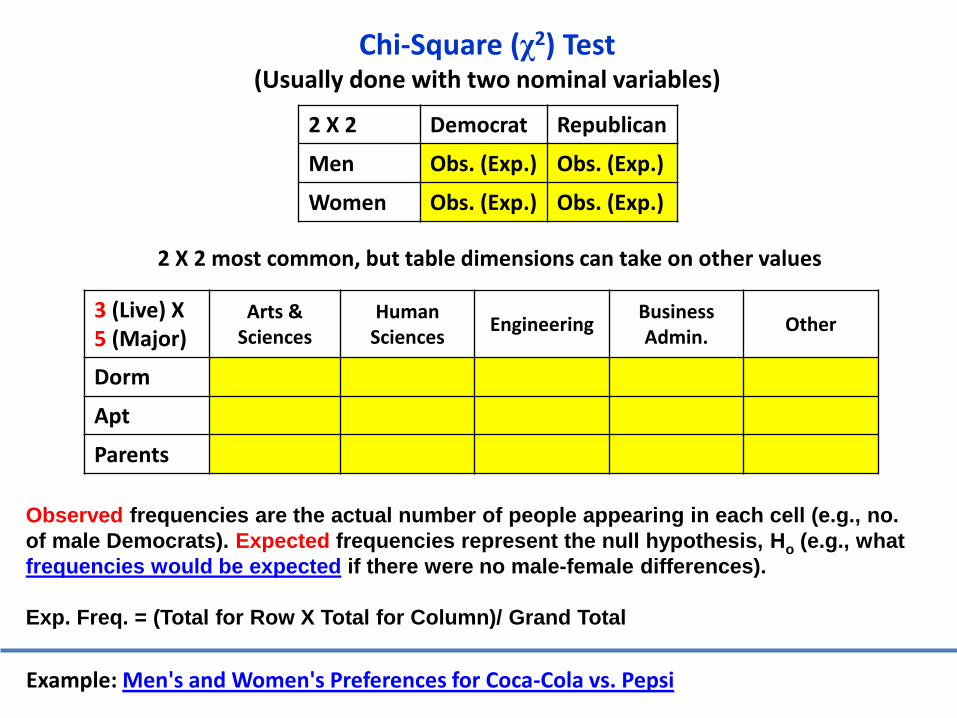
Observed frequencies are the actual number of people appearing in each cell (e.g., no.
of male Democrats). Expected frequencies represent the null hypothesis, Ho (e.g., what
frequencies would be expected if there were no male-female differences).
Exp. Freq. = (Total for Row X Total for Column)/ Grand Total
Example: Men's and Women's Preferences for Coca-Cola vs. Pepsi
Chi-Square (χ2) Test(Usually done with two nominal variables)
2 X 2 Democrat Republican
Men Obs. (Exp.) Obs. (Exp.)
Women Obs. (Exp.) Obs. (Exp.)
2 X 2 most common, but table dimensions can take on other values
3 (Live) X 5 (Major)
Arts & Sciences
Human Sciences
EngineeringBusiness Admin.
Other
Dorm
Apt
Parents
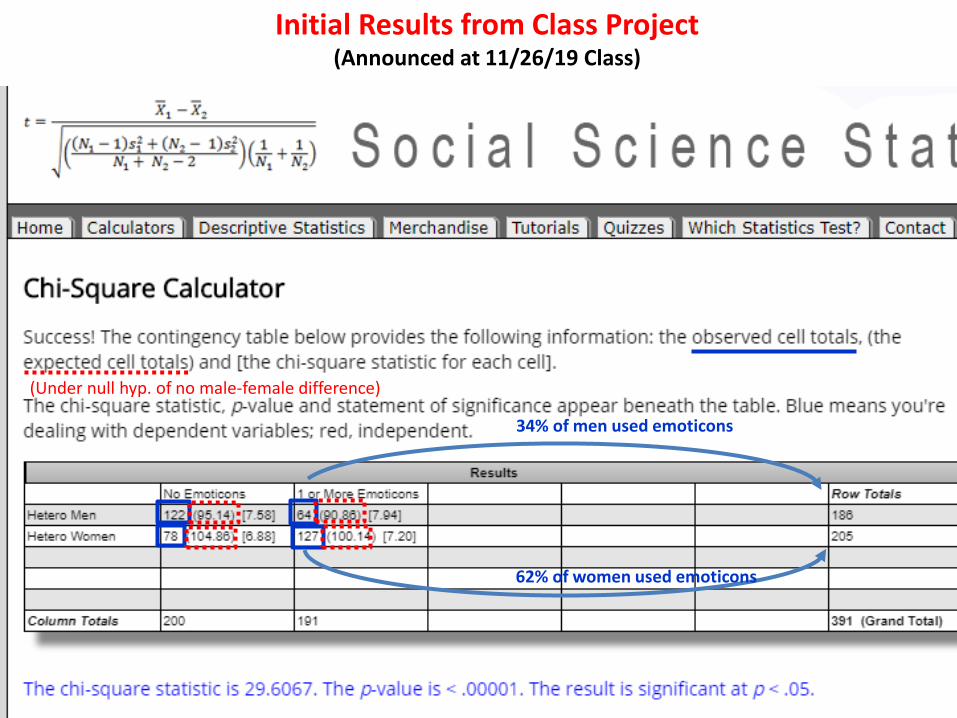
Initial Results from Class Project(Announced at 11/26/19 Class)
(Under null hyp. of no male-female difference)
34% of men used emoticons
62% of women used emoticons
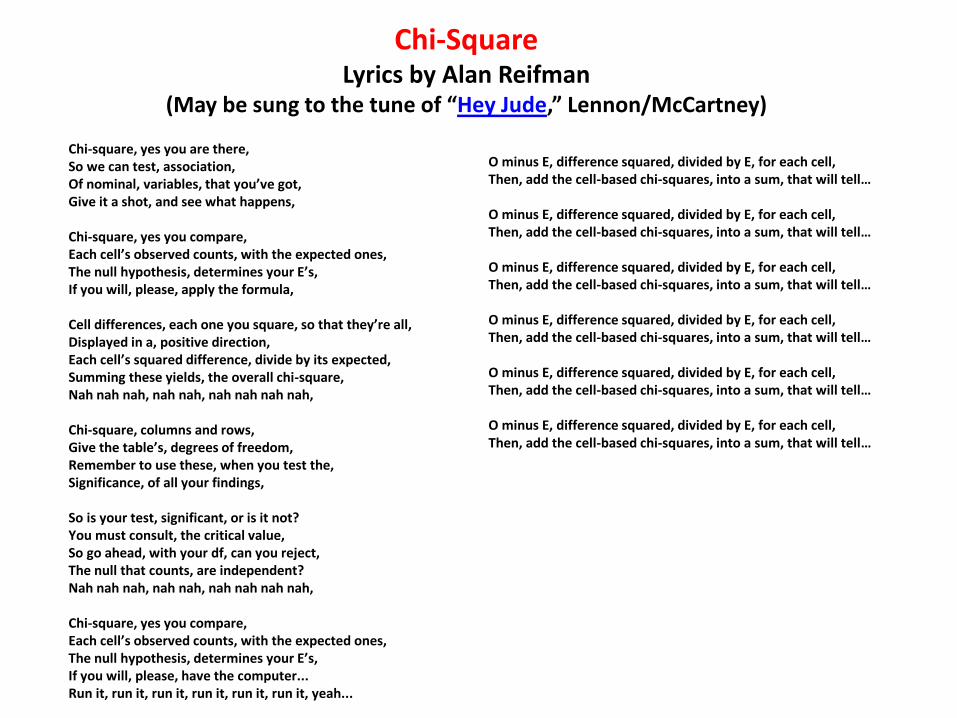
Chi-square, yes you are there,So we can test, association,Of nominal, variables, that you’ve got,Give it a shot, and see what happens,
Chi-square, yes you compare,Each cell’s observed counts, with the expected ones,The null hypothesis, determines your E’s,If you will, please, apply the formula,
Cell differences, each one you square, so that they’re all,Displayed in a, positive direction,Each cell’s squared difference, divide by its expected,Summing these yields, the overall chi-square,Nah nah nah, nah nah, nah nah nah nah,
Chi-square, columns and rows,Give the table’s, degrees of freedom,Remember to use these, when you test the,Significance, of all your findings,
So is your test, significant, or is it not?You must consult, the critical value,So go ahead, with your df, can you reject,The null that counts, are independent?Nah nah nah, nah nah, nah nah nah nah,
Chi-square, yes you compare,Each cell’s observed counts, with the expected ones,The null hypothesis, determines your E’s,If you will, please, have the computer...Run it, run it, run it, run it, run it, run it, yeah...
O minus E, difference squared, divided by E, for each cell,Then, add the cell-based chi-squares, into a sum, that will tell…
O minus E, difference squared, divided by E, for each cell,Then, add the cell-based chi-squares, into a sum, that will tell…
O minus E, difference squared, divided by E, for each cell,Then, add the cell-based chi-squares, into a sum, that will tell…
O minus E, difference squared, divided by E, for each cell,Then, add the cell-based chi-squares, into a sum, that will tell…
O minus E, difference squared, divided by E, for each cell,Then, add the cell-based chi-squares, into a sum, that will tell…
O minus E, difference squared, divided by E, for each cell,Then, add the cell-based chi-squares, into a sum, that will tell…
Chi-SquareLyrics by Alan Reifman
(May be sung to the tune of “Hey Jude,” Lennon/McCartney)
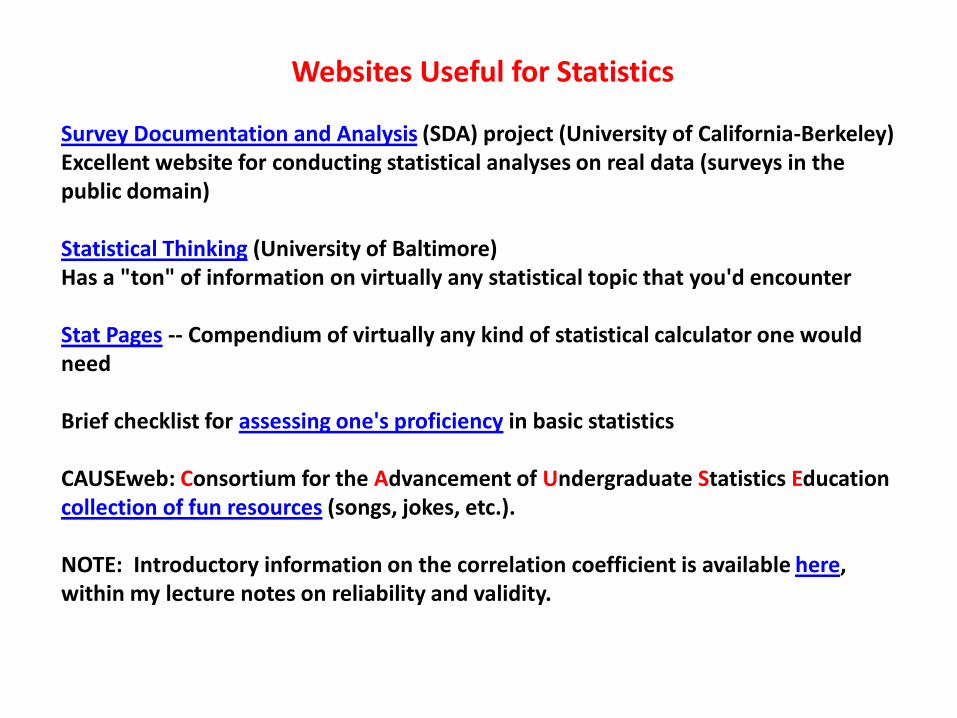
Websites Useful for Statistics
Survey Documentation and Analysis (SDA) project (University of California-Berkeley)Excellent website for conducting statistical analyses on real data (surveys in the public domain)
Statistical Thinking (University of Baltimore)Has a "ton" of information on virtually any statistical topic that you'd encounter
Stat Pages -- Compendium of virtually any kind of statistical calculator one would need
Brief checklist for assessing one's proficiency in basic statistics
CAUSEweb: Consortium for the Advancement of Undergraduate Statistics Education collection of fun resources (songs, jokes, etc.).
NOTE: Introductory information on the correlation coefficient is available here, within my lecture notes on reliability and validity.