Embed Size (px)
Citation preview
8/9/2019 Research Methodology_Group 7_Roll Nos 41-44-48!50!57 (1)
http://slidepdf.com/reader/full/research-methodologygroup-7roll-nos-41-44-485057-1 1/21
ITM BUSINESS SCHOOL,
KHARGHAR, NAVI MUMBAI
Survey of Consumer preferencesFor buying a Motorcycle
Research MethodologyPGDM Batch µA
Group 07
Arpit Verma 041
Neha Mishra 044
Zafar Idrisi 048
Arun Thakur 050
Aparna Katiyar 057
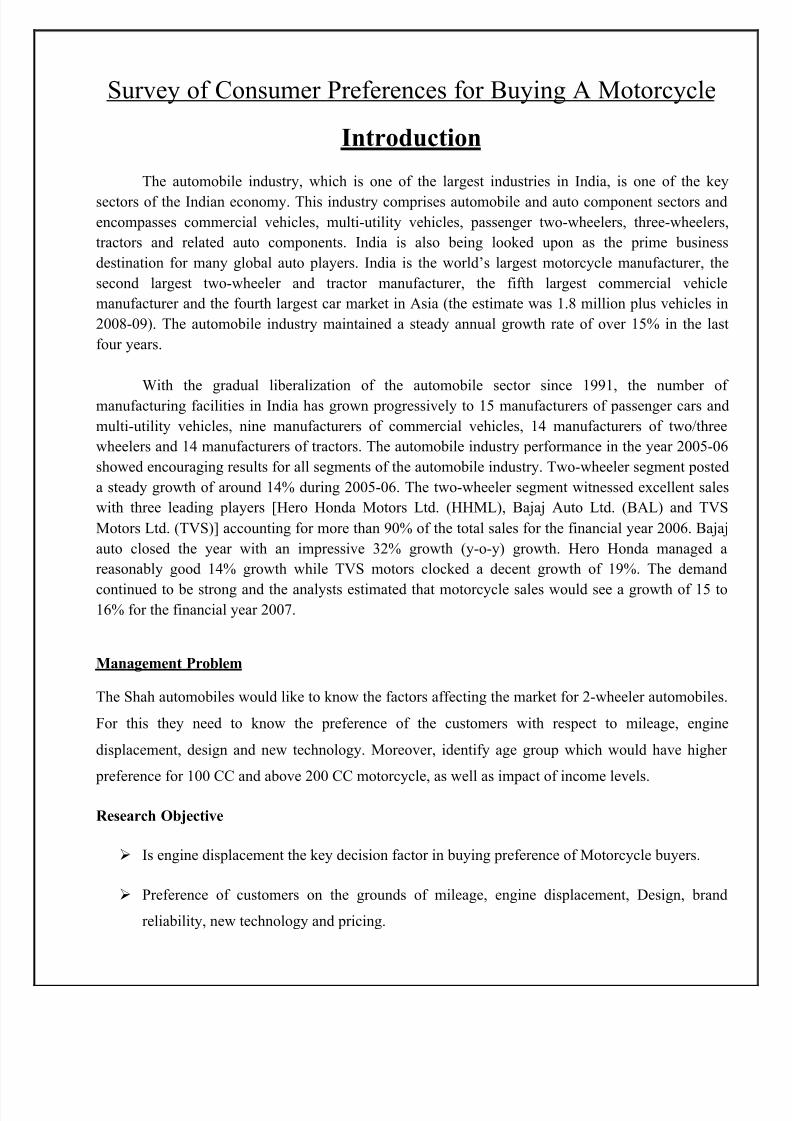
The key to success of automobile industry lies on various factors apart from having
good products. Increasing competitiveness in the Indian automobile industry has madealmost all automobile manufacturers have invested valuable resources on customer satisfaction as a tool to understand the needs and expectations of their customers.Increased presence of two-wheeler vehicles throughout the country has created a growingneed for providing service infrastructures, attractive design and higher performance. A studyon customer preference with reference to two-wheeler automobile industry was conducted inKharghar, Navi Mumbai a developing node of the economic hub of India, Mumbai. Primarydata was collected from 245 customers who purchased the motorbikes of various two-wheeler companies.
8/9/2019 Research Methodology_Group 7_Roll Nos 41-44-48!50!57 (1)
http://slidepdf.com/reader/full/research-methodologygroup-7roll-nos-41-44-485057-1 2/21
Survey of Consumer Preferences for Buying A Motorcycle
Introduction
The automobile industry, which is one of the largest industries in India, is one of the key
sectors of the Indian economy. This industry comprises automobile and auto component sectors andencompasses commercial vehicles, multi-utility vehicles, passenger two-wheelers, three-wheelers,tractors and related auto components. India is also being looked upon as the prime businessdestination for many global auto players. India is the world¶s largest motorcycle manufacturer, thesecond largest two-wheeler and tractor manufacturer, the fifth largest commercial vehiclemanufacturer and the fourth largest car market in Asia (the estimate was 1.8 million plus vehicles in2008-09). The automobile industry maintained a steady annual growth rate of over 15% in the lastfour years.
With the gradual liberalization of the automobile sector since 1991, the number of manufacturing facilities in India has grown progressively to 15 manufacturers of passenger cars andmulti-utility vehicles, nine manufacturers of commercial vehicles, 14 manufacturers of two/threewheelers and 14 manufacturers of tractors. The automobile industry performance in the year 2005-06showed encouraging results for all segments of the automobile industry. Two-wheeler segment posteda steady growth of around 14% during 2005-06. The two-wheeler segment witnessed excellent saleswith three leading players [Hero Honda Motors Ltd. (HHML), Bajaj Auto Ltd. (BAL) and TVSMotors Ltd. (TVS)] accounting for more than 90% of the total sales for the financial year 2006. Bajajauto closed the year with an impressive 32% growth (y-o-y) growth. Hero Honda managed areasonably good 14% growth while TVS motors clocked a decent growth of 19%. The demand
continued to be strong and the analysts estimated that motorcycle sales would see a growth of 15 to16% for the financial year 2007.
Management Problem
The Shah automobiles would like to know the factors affecting the market for 2-wheeler automobiles.
For this they need to know the preference of the customers with respect to mileage, engine
displacement, design and new technology. Moreover, identify age group which would have higher
preference for 100 CC and above 200 CC motorcycle, as well as impact of income levels.
Research Objective
Is engine displacement the key decision factor in buying preference of Motorcycle buyers.
Preference of customers on the grounds of mileage, engine displacement, Design, brand
reliability, new technology and pricing.

8/9/2019 Research Methodology_Group 7_Roll Nos 41-44-48!50!57 (1)
http://slidepdf.com/reader/full/research-methodologygroup-7roll-nos-41-44-485057-1 3/21
What percentage of people prefers 100 CC bike and the key features effecting their respective
decision?
Research Variable
Income groups
Age groups
Mileage level expected
Engine Displacement
K ey feature preferred as mileage/design/brand/

8/9/2019 Research Methodology_Group 7_Roll Nos 41-44-48!50!57 (1)
http://slidepdf.com/reader/full/research-methodologygroup-7roll-nos-41-44-485057-1 4/21
Research Questions for each objective.
1) Mark (¥) the range of your family¶s annual income (in Lac Rupees):
1 ± 3 5 ± 73 ± 5 7 ± 1010 ± 20
2) Mark your key preference in buying a 2-wheeler.
MileagePricingStyle or looks (Cruiser or Sport)Horse power/CC/DisplacementBrand reliabilityAfter sale service New Technology
3) Mark the CC/Displacement range you prefer?
100 CC125 ± 150 CCAbove 150 ± 200 CCAbove 200 CC
4) Which Mileage range is manageable for you?
High (above 70 K mpl)
Average (40 ± 70 K mpl)Low (up to ± 40 K mpl)
5) Tick (¥) mark the age range (in Yrs) you fall under.
18 ± 21 31 ± 4021 ± 25 41 ± 5026 ± 30 50 ± 60
8/9/2019 Research Methodology_Group 7_Roll Nos 41-44-48!50!57 (1)
http://slidepdf.com/reader/full/research-methodologygroup-7roll-nos-41-44-485057-1 5/21
Research Questions for Respective objective.
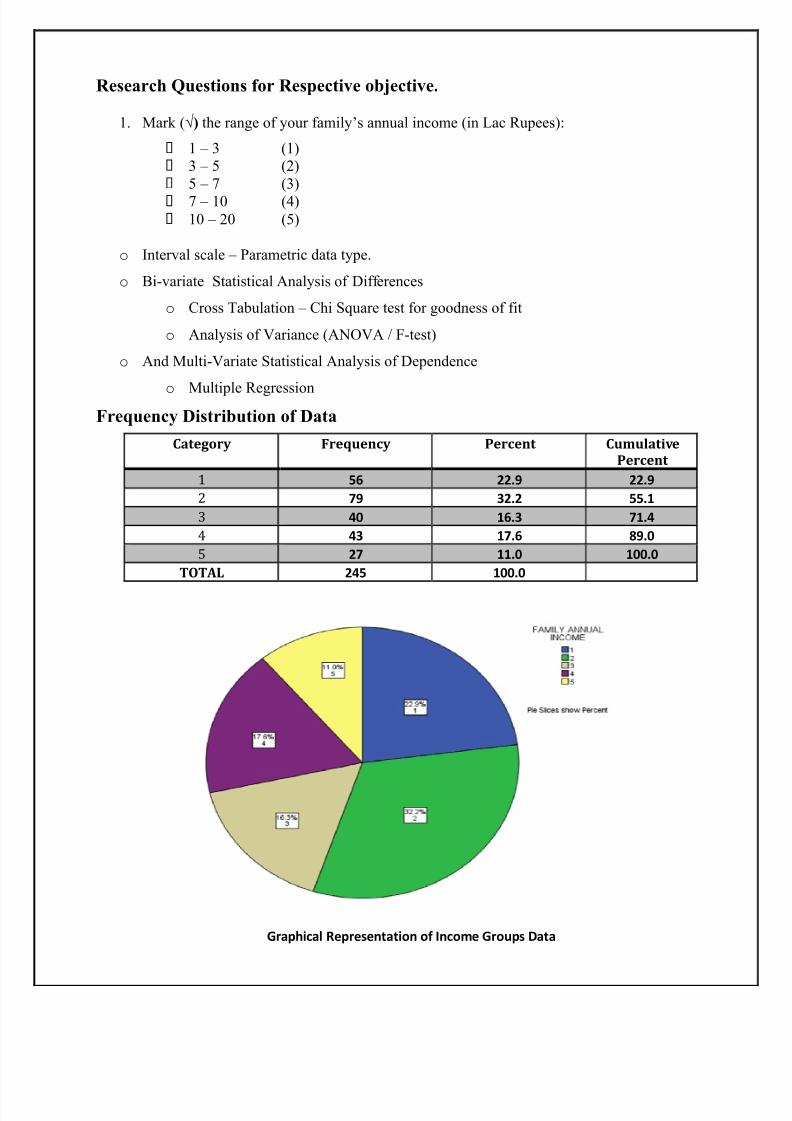
1. Mark (¥) the range of your family¶s annual income (in Lac Rupees):
1 ± 3 (1) 3 ± 5 (2) 5 ± 7 (3) 7 ± 10 (4) 10 ± 20 (5)
o Interval scale ± Parametric data type.
o Bi-variate Statistical Analysis of Differences
o Cross Tabulation ± Chi Square test for goodness of fit
o Analysis of Variance (ANOVA / F-test)
o And Multi-Variate Statistical Analysis of Dependence
o Multiple RegressionFrequency Distribution of Data
Category Frequency Percent Cumulative
Percent
1 56 22.9 22.9
2 79 32.2 55.1
3 40 16.3 71.4
4 43 17.6 89.0
5 27 11.0 100.0
TOTAL 245 100.0
Graphical Representation of Income Groups Data

8/9/2019 Research Methodology_Group 7_Roll Nos 41-44-48!50!57 (1)
http://slidepdf.com/reader/full/research-methodologygroup-7roll-nos-41-44-485057-1 6/21
Cross Tabulation
Chi Square Hypothesis
Hypothesis:
Ho: Preference of the engine displacement does not depend on the income category acustomer falls under.
H1: Buying preference varies with varying income category.
Chi Square Test Results
The critical or the likelihood value (21.269) is less than the calculated Chi square value(21.697) for degree of freedom 12.

8/9/2019 Research Methodology_Group 7_Roll Nos 41-44-48!50!57 (1)
http://slidepdf.com/reader/full/research-methodologygroup-7roll-nos-41-44-485057-1 7/21
From this we can infer that we have to reject the null hypothesis; hence the Income categorystrongly influences the buying preference of engine displacement.
Analysis of Variance (ANOVA)
y Null hypothesis:
y Engine Displacement preference for all income group is same.
y Result:
y calculated F- 4.24
y tabulated F- 3.84
Inference from this
Since Tabulated F < Calculated F, We reject the null hypothesis.
It means that the preference for displacement is different for different income groups.

8/9/2019 Research Methodology_Group 7_Roll Nos 41-44-48!50!57 (1)
http://slidepdf.com/reader/full/research-methodologygroup-7roll-nos-41-44-485057-1 8/21
Research Questions for Respective objective.
2. Tick (¥) mark the age range (in Yrs) you fall under.
18 ± 25 (1) 26 ± 30 (2) 31 ± 40 (3) 41 ± 50 (4) 50 ± 60 (5)
o Interval scale ± Parametric data type.
o Bi-variate Statistical Analysis
o Cross Tabulation ± Chi Square test for goodness of fit
o Analysis of Variance (ANOVA / F-test)
o And Multi-Variate Statistical Analysis
o Multiple Regression
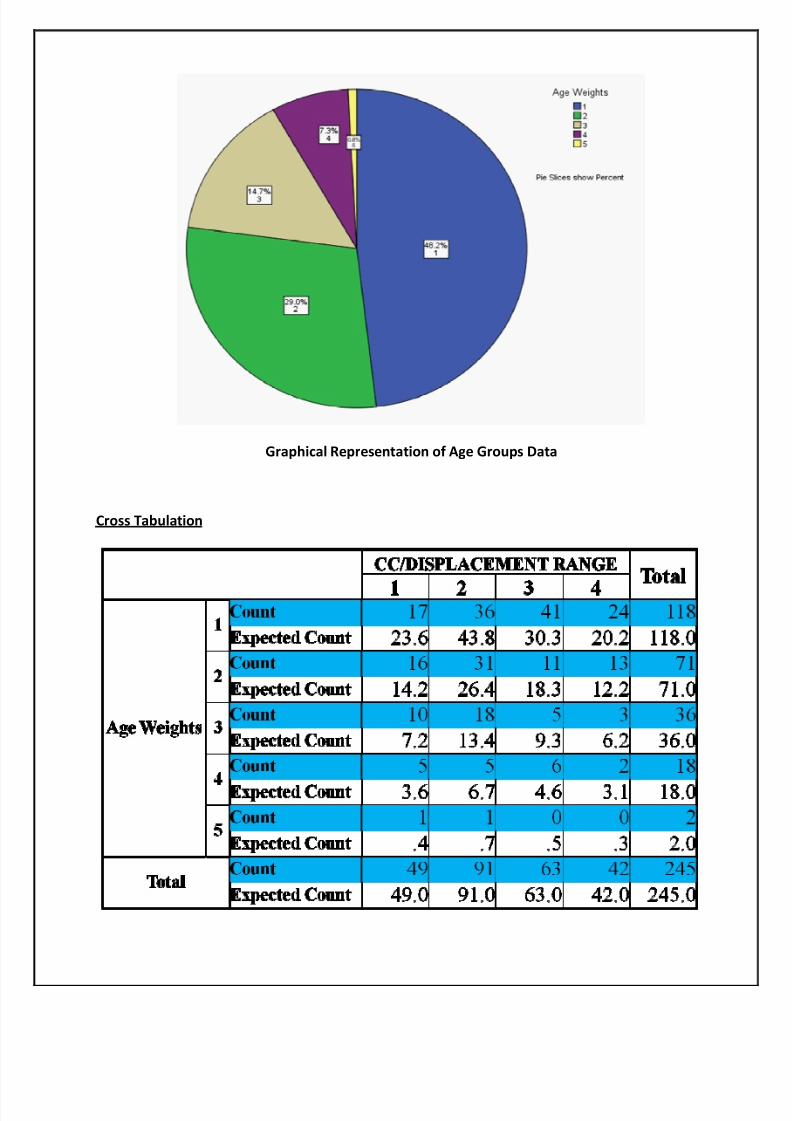
Frequency Distribution of Data
Age Group
Category Frequency Percent
Cumulative
Percent
1 118 48.2 48.2
2 71 29.0 77.1
3 36 14.7 91.8
4 18 7.3 99.2
5 2 .8 100.0
Total 245 100.0
8/9/2019 Research Methodology_Group 7_Roll Nos 41-44-48!50!57 (1)
http://slidepdf.com/reader/full/research-methodologygroup-7roll-nos-41-44-485057-1 9/21
Graphical Representation of Age Groups Data
Cross Tabulation

8/9/2019 Research Methodology_Group 7_Roll Nos 41-44-48!50!57 (1)
http://slidepdf.com/reader/full/research-methodologygroup-7roll-nos-41-44-485057-1 10/21
Chi Square Hypothesis
Hypothesis:
Ho: Preference of the engine displacement does not depend on the age group acustomer falls under.
H1: Buying preference varies with varying age group.
Chi Square Test Results
The critical or the likelihood value (21.069) is less than the calculated Chi square value(22.949) for degree of freedom 12.
From this we can infer that we have to reject the null hypothesis; hence the Age groupstrongly influences the buying preference of engine displacement.

8/9/2019 Research Methodology_Group 7_Roll Nos 41-44-48!50!57 (1)
http://slidepdf.com/reader/full/research-methodologygroup-7roll-nos-41-44-485057-1 11/21
Analysis of Variance (ANOVA)
y Null hypothesis:
y CC preference for all Age group is same.
y Result:
y calculated F- 43.95
y tabulated F- 3.84
Inference
Since Tabulated F < Calculated F
We reject the null hypothesis and accept the alternative hypothesis.
It means that displacement preference is different for different age groups.

8/9/2019 Research Methodology_Group 7_Roll Nos 41-44-48!50!57 (1)
http://slidepdf.com/reader/full/research-methodologygroup-7roll-nos-41-44-485057-1 12/21
Research Questions for Respective objective.
3. Which Mileage range is manageable for you?
High (above 70 K mpL) (3)
Average (40 ± 70 K mpL) (2)
Low (up to ± 40 K mpL) (1)
o Interval scale ± Parametric data type.
o Bi-variate Statistical Analysis
o Cross Tabulation ± Chi Square test for goodness of fit
o And Multi-Variate Statistical Analysis
o Multiple Regression
Frequency Distribution of Data
Cross Tabulation
8/9/2019 Research Methodology_Group 7_Roll Nos 41-44-48!50!57 (1)
http://slidepdf.com/reader/full/research-methodologygroup-7roll-nos-41-44-485057-1 13/21
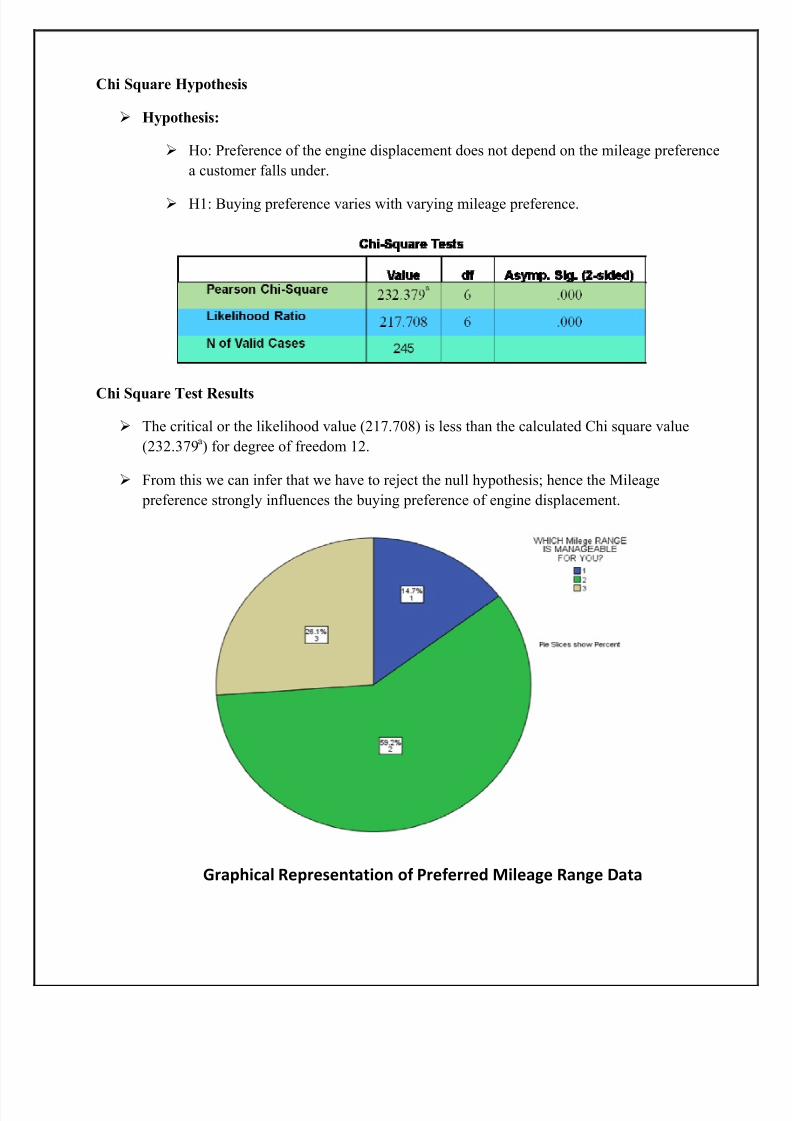
Chi Square Hypothesis
Hypothesis:
Ho: Preference of the engine displacement does not depend on the mileage preferencea customer falls under.
H1: Buying preference varies with varying mileage preference.
Chi Square Test Results
The critical or the likelihood value (217.708) is less than the calculated Chi square value(232.379a) for degree of freedom 12.
From this we can infer that we have to reject the null hypothesis; hence the Mileage preference strongly influences the buying preference of engine displacement.
Graphical Representation of Pref erred Mileage Range Data
8/9/2019 Research Methodology_Group 7_Roll Nos 41-44-48!50!57 (1)
http://slidepdf.com/reader/full/research-methodologygroup-7roll-nos-41-44-485057-1 14/21
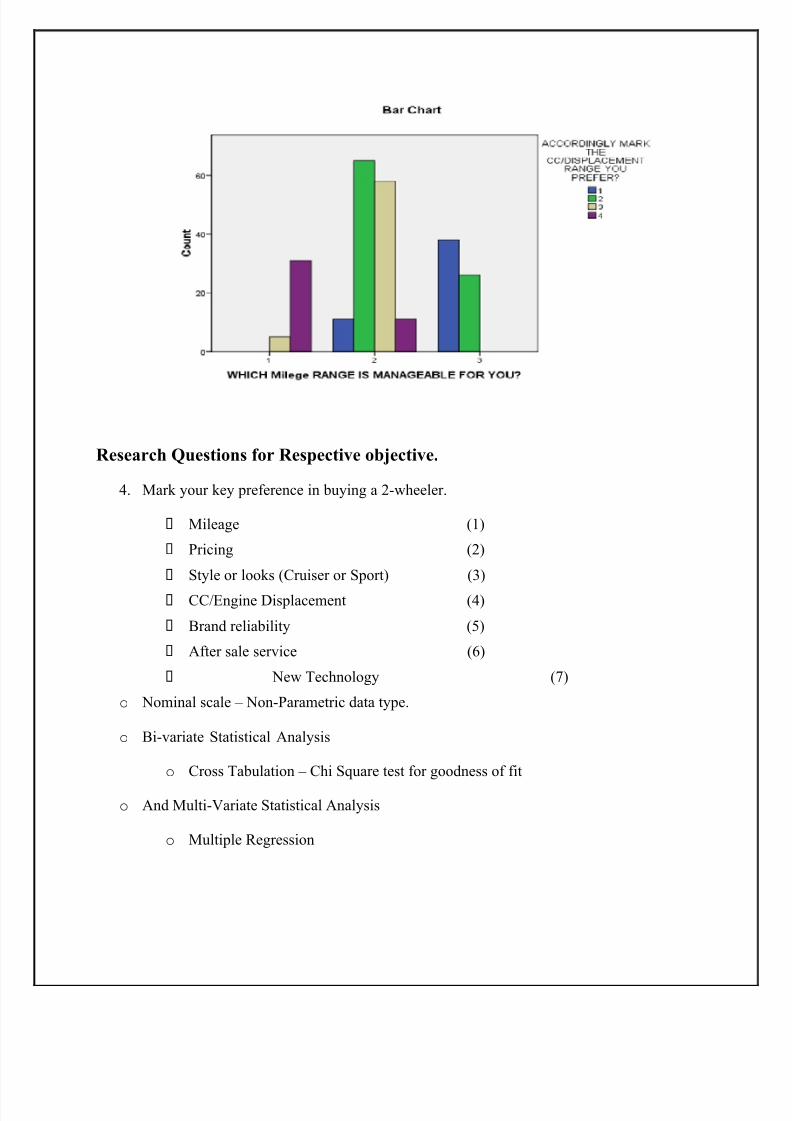
Research Questions for Respective objective.
4. Mark your key preference in buying a 2-wheeler.
Mileage (1)
Pricing (2)
Style or looks (Cruiser or Sport) (3)
CC/Engine Displacement (4)
Brand reliability (5)
After sale service (6)
New Technology (7)
o Nominal scale ± Non-Parametric data type.
o Bi-variate Statistical Analysis
o Cross Tabulation ± Chi Square test for goodness of fit
o And Multi-Variate Statistical Analysis
o Multiple Regression
8/9/2019 Research Methodology_Group 7_Roll Nos 41-44-48!50!57 (1)
http://slidepdf.com/reader/full/research-methodologygroup-7roll-nos-41-44-485057-1 15/21
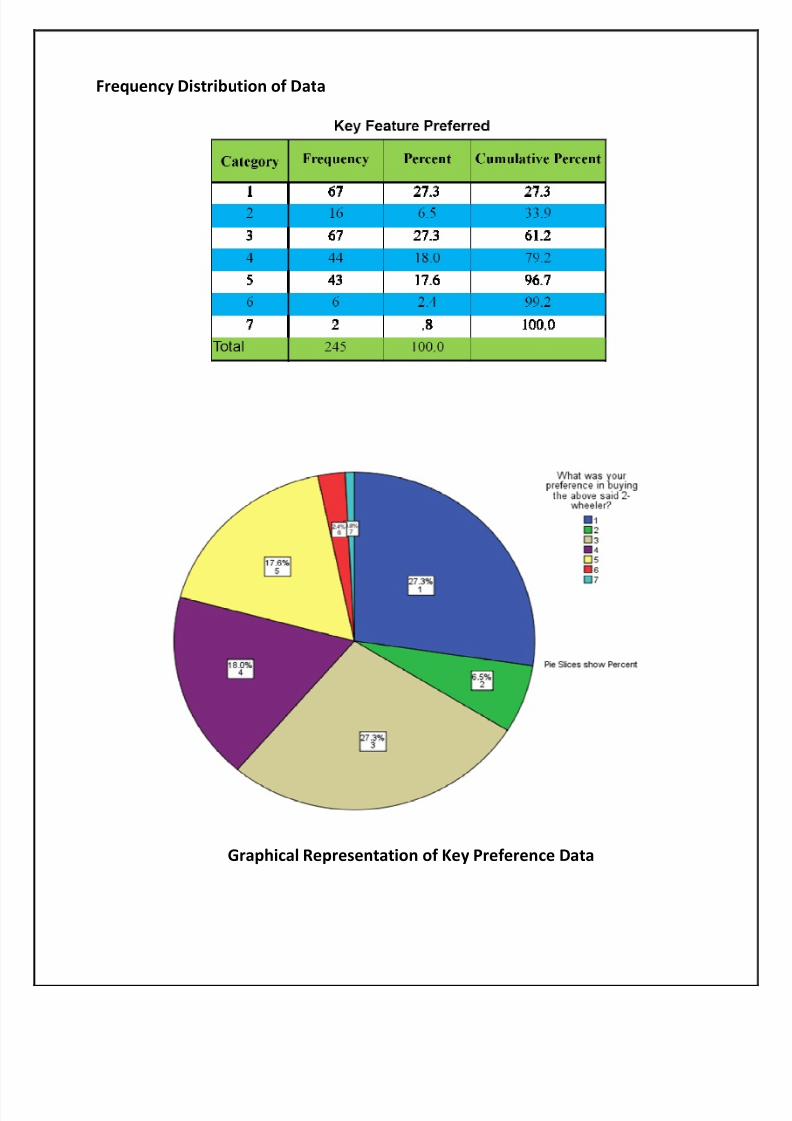
Frequency Distribution of Data
Graphical Representation of Key Pref erence Data

8/9/2019 Research Methodology_Group 7_Roll Nos 41-44-48!50!57 (1)
http://slidepdf.com/reader/full/research-methodologygroup-7roll-nos-41-44-485057-1 16/21
Comparing Proportions from Two subgroups of one random sample (Using Z
test)
A) A survey was conducted of people from the people to determine if the preference of bike was
consistent between features Displacement and Pricing. A random sample of 245 people
conducted. 18% respondent said that they go for Displacement when they buy a bike while6.5% respondent that they go for pricing when they buy a bike.
"Hypothesis´
Ho: There is no statistically significant difference between the proportion of people
who prefer a bike between according the features Displacement and Pricing.
H1: There is statistically significant difference between the proportion of people who
prefer a bike between according the feature Displacement and Pricing. Set the Rejection Criteria
Use "z-distribution" table to estimate critical value and Alpha=.05, Zcv = 1.96
Test Statistic: Z calculated= 3.885
Results of the Null Hypothesis
Since the test statistic 3.885 exceeds than the critical value of 1.96, we would reject the null
hypothesis and can conclude that there is a statistically significant difference between the proportionsthat buy the bike according the features between CC and Pricing.
B) A survey was conducted of people from the people to determine if the preference of bike was
consistent between features Displacement and Look& Style. A random sample of 245 people
conducted. 18% respondent said that they go for Displacement when they buy a bike while 27.3%
respondent that they go for Looks & Style when they buy a bike.
"Hypothesis´
Ho: There is no statistically significant difference between the proportion of people
who prefer a bike between according the features Displacement and Looks & Style.
H1: There is statistically significant difference between the proportion of people who
prefer a bike between according the feature Displacement and Looks & Style.
Set the Rejection Criteria:
Used "z-distribution" table for estimation of the critical value and taking Alpha = .05, Zcv =1.96

8/9/2019 Research Methodology_Group 7_Roll Nos 41-44-48!50!57 (1)
http://slidepdf.com/reader/full/research-methodologygroup-7roll-nos-41-44-485057-1 17/21
Test Statistic: Z calculated= -2.364
Results of the Null Hypothesis
Since the test statistic -2.364 lower than the critical value of -1.96, we would accept the null
hypothesis and can conclude that there is a statistically no significant difference between the
proportions that buy the bike according to the features between CC and Looks & Style.
C) A survey was conducted of people from the people to determine if the preference of bike was
consistent between features Displacement and Mileage. A random sample of 245 people conducted.
18% respondent said that they go for Displacement when they buy a bike while 27.3% respondent
that they go for Mileage when they buy a bike.
"Hypothesis´
Ho: There is no statistically significant difference between the proportion of peoplewho prefer a bike between according the features Displacement and Mileage.
H1: There is statistically significant difference between the proportion of people who
prefer a bike between according the feature Displacement and Mileage.
Set the Rejection Criteria
Use "z-distribution" table to estimate critical value with Alpha = .05, Zcv = 1.96
Test Statistic: Z calculated= -2.364
Results of the Null Hypothesis Since the test statistic -2.364 lower than the critical value of -1.96, we would reject the null
hypothesis and can conclude that there is a statistically significant difference between the proportions
that buy the bike according to the features between CC and Mileage.
D) A survey was conducted of people from the people to determine if the preference of bike was
consistent between features Displacement and Brand Reliability. Random sample of 245 people
conducted. 18% respondent said that they go for Displacement when they buy a bike while 17.6%
respondent that they go for Brand Reliability when they buy a bike.
"Hypothesis´ Ho: There is no statistically significant difference between the proportion of people
who prefer a bike between according the features Displacement and Brand Reliability.
H1: There is statistically significant difference between the proportion of people who
prefer a bike between according the feature Displacement and Reliability.
8/9/2019 Research Methodology_Group 7_Roll Nos 41-44-48!50!57 (1)
http://slidepdf.com/reader/full/research-methodologygroup-7roll-nos-41-44-485057-1 18/21
Set the Rejection Criteria
Use "z-distribution" table to estimate critical value Alpha =.05, Zcv = 1.96
Test Statistic: Z calculated= 0.12
Results of the Null Hypothesis Since the test statistic 0.12 lower than the critical value of 1.96, we would accept the null
hypothesis and can conclude that there is a statistically no significant difference between the
proportions that buy the bike according to the features between CC and Brand Reliability.
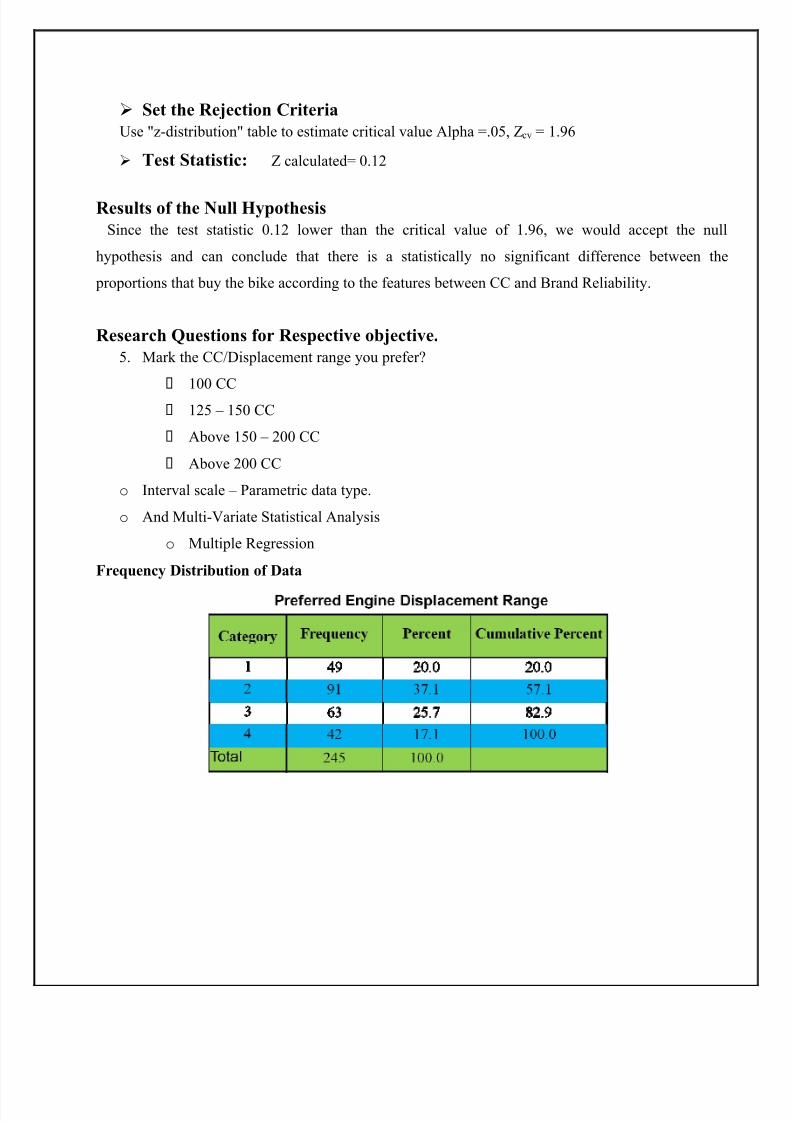
Research Questions for Respective objective.
5. Mark the CC/Displacement range you prefer?
100 CC
125 ± 150 CC
Above 150 ± 200 CC
Above 200 CC
o Interval scale ± Parametric data type.
o And Multi-Variate Statistical Analysis
o Multiple Regression
Frequency Distribution of Data

8/9/2019 Research Methodology_Group 7_Roll Nos 41-44-48!50!57 (1)
http://slidepdf.com/reader/full/research-methodologygroup-7roll-nos-41-44-485057-1 19/21
Graphical Representation of Pref erred Engine Displacement Data
Comparing Proportions from Two subgroups of one random sample (Using Z
test)
A) A survey was conducted of people from the people to determine if the preference of bike was
consistent with CC/Displacement. A random sample of 245 people conducted. For
CC/Displacement 100 cc bike prefer by 20% people and For CC/Displacement 125-150 cc bike
prefer by 37.1% people.
"Hypothesis
Ho: There is no statistically significant difference between the proportion of people who
prefer a 100cc bike and people who prefer 125-150 cc bikes.
H1: There is statistically significant difference between the proportion of people who prefer
a 100cc bike and people who prefer 125-150 cc bikes.
Set the Rejection Criteria and Use "z-distribution" table to estimate critical value taking
Alpha = .05, Zcv = 1.96
Test Statistic: Z calculated= -4.275
Results of the Null Hypothesis
Since the test statistic -4.275 lower than the critical value of -1.96, we would accept thenull hypothesis and can conclude that there is a statistically no significant difference between the proportions that prefer the bike of 100 cc with the people who prefer the bike of 125-150 cc.

8/9/2019 Research Methodology_Group 7_Roll Nos 41-44-48!50!57 (1)
http://slidepdf.com/reader/full/research-methodologygroup-7roll-nos-41-44-485057-1 20/21
B) A survey was conducted of people from the people to determine if the preference of bike was
consistent with CC/Displacement. A random sample of 245 people conducted. For
CC/Displacement 100 cc bike prefer by 20% people and For CC/Displacement 150 -200 cc
bikes prefer by 25.7% people.
"Hypothesis´ Ho: There is no statistically significant difference between the proportion of people
who prefer a 100 cc bike and people who prefer 150-200 cc bikes.
H1: There is statistically significant difference between the proportion of people who
prefer a 100 cc bike and people who prefer 150-200 cc bikes.
Set the Rejection Criteria
Use "z-distribution" table to estimate critical value; Taking Alpha =.05, Zcv = 1.96
Test Statistic: Z calculated= -1.51 Results of the Null Hypothesis
Since the test statistic -1.51 exceeds than the critical value of -1.96, we would reject the
null hypothesis and can conclude that there is a statistically significant difference between
the proportions that prefer the bike of 100 cc with the people who prefer the bike of 150-200
cc bike.
Multi-Variate Statistical Analysis - Multiple Regressions

8/9/2019 Research Methodology_Group 7_Roll Nos 41-44-48!50!57 (1)
http://slidepdf.com/reader/full/research-methodologygroup-7roll-nos-41-44-485057-1 21/21
Inf erence
y From the value of R square (0.5838), we can infer that these values have 58.38% effect of
buying preference of engine displacement.
y Age has a significance value of (- 0.00213754) which infers that it has a inverse impact. i.e.
with increasing age group the engine displacement preference is of lower engine capacity.
y Annual Income has a significance value of (0.051370266) which infers that it has a direct
impact. i.e with increasing income group the engine displacement preference is of higher
engine capacity.
Conclusion
y Engine Displacement shows high significance in customer preference; along with pricing and brand reliability. Whereas styling and mileage hold lower significance. New technology andafter sales service have negligible preference.
y It is also observed that age groups influence engine displacement preferences as well.Younger age categories prefer higher engine capacity.
y Income category influence engine displacement buying preference as well. Lower incomegroup prefer lower engine capacity.
Data Sheets
Survey Data Consolidation
Group 7_DataSheet.xlsx
Final sheet.xlsx
Test on Variables
ResearchMethodology_Test.xl