Embed Size (px)
DESCRIPTION
Chemistry, biology
Citation preview
Ambo University
Distance Education Coordination Office (DECO)
Module for Summer Chemistry students at Ambo University
on the course
Research methodology and Scientific writing
(Chem 453)
Prepared by:
Tesfaye Eshete Asrat
Edited by:
Zewdneh Genene
June 2012
Ambo, Ethiopia

ii
Introduction to the course
Progress in almost every field of science depends on the contributions made by scientific
research. Thus research is often viewed as the cornerstone of scientific progress. Broadly, the
purpose of research is to answer questions and acquire new knowledge. Research is the primary
tool used in virtually all areas of science to expand the frontiers of knowledge. For example,
research is used in such diverse scientific fields as chemistry, biology, medicine and physics, to
name just a few of the areas in which research makes valuable contributions to what we know
and how we think about things. Among other things, by conducting research, researchers attempt
to reduce the complexity of problems, discover the relationship between seemingly unrelated
events, and ultimately improve the way we live. Although research studies are conducted in
many diverse fields of science, the general goals and defining characteristics of research are
typically the same across disciplines. For example, across all types of science, research is
frequently used for describing a thing or event, discovering the relationship between phenomena,
or making predictions about future events. In short, research can be used for the purposes of
description, explanation, and prediction, all of which make important and valuable contributions
to the expansion of what we know and how we live our lives. In addition to sharing similar broad
goals, scientific research in virtually all fields of study shares certain defining characteristics,
including testing hypotheses, careful observation and measurement, systematic evaluation of
data, and drawing valid conclusions.

iii
Table of contents
CHAPTER ONE ................................................................................................................................1
Concept of a research ......................................................................................................................1
1.1. Meaning of research.........................................................................................................1
1.2. Objectives of research.......................................................................................................2
1.3. Motivation of research ......................................................................................................3
1.4. Types of research .............................................................................................................3
1.4.1. Applied vs. Fundamental ...........................................................................................3
1.4.2. Quantitative vs. Qualitative .......................................................................................4
1.4.3. Conceptual vs. Empirical...........................................................................................4
1.4.4. Descriptive vs. Analytical..........................................................................................4
1.5. Significance of research ....................................................................................................5
1.6. Research methods vs. methodology ...................................................................................6
1.7. Research and Scientific method .........................................................................................7
1.8. Importance of knowing how research is done .....................................................................8
1.9. Research process ..............................................................................................................9
1.10. Self-test exercise ........................................................................................................10
CHAPTER TWO..............................................................................................................................11
Formulation of a research Problem.................................................................................................11
2.1. Reflective thinking .........................................................................................................11
2.2. Scientific thinking ..........................................................................................................12
2.2.1. Characteristics of scientific thinking.........................................................................12
2.3. Identification of problem ................................................................................................13
2.4. Sources of problem.........................................................................................................14
2.5. Criteria for selection of problem ......................................................................................14
2.6. Defining a problem ........................................................................................................15

iv
2.7. Statement of problem .....................................................................................................15
2.7.1. Assumptions about problem.....................................................................................16
2.8. The research proposal or synopsis ...................................................................................16
2.9. Self-test exercise ............................................................................................................17
CHAPTER THREE ..........................................................................................................................18
Review of Literature .....................................................................................................................18
3.1. Need of review of literature.............................................................................................19
3.2. Nature of review of the literature .....................................................................................20
3.3. Sources of literature........................................................................................................21
3.3.1. Books and text books material .................................................................................21
3.3.2. Periodicals ..............................................................................................................21
3.3.3. Abstracts ................................................................................................................22
3.3.4. Encyclopedias ........................................................................................................22
3.3.5. Newspaper .............................................................................................................22
3.4. Functions of review of literature ......................................................................................23
3.5. How to conduct review of the literature............................................................................23
3.6. Reporting review of literature..........................................................................................24
3.7. Self-test exercise ............................................................................................................25
CHAPTER FOUR ............................................................................................................................26
Developing hypothesis ..................................................................................................................26
4.1. Meaning of hypothesis ....................................................................................................27
4.2. Nature of hypothesis .......................................................................................................29
4.3. Importance of a hypothesis..............................................................................................29
4.4. Kinds of hypothesis ........................................................................................................30
4.4.1. Question form of hypothesis ....................................................................................30
4.4.2. Declarative statement ..............................................................................................30
4.4.3. Directional hypothesis .............................................................................................31

v
4.4.4. Non-directional hypothesis ......................................................................................31
4.5. Types of errors ...............................................................................................................34
4.6. Variables in a hypothesis ................................................................................................34
4.6.1. Independent variable ...............................................................................................35
4.6.2. Dependent variable .................................................................................................35
4.6.3. Moderator variable ..................................................................................................35
4.6.4. Control variable ......................................................................................................36
4.6.5. Intervening variable ................................................................................................36
4.7. Sources of hypotheses.....................................................................................................37
4.8. Formulating hypothesis ...................................................................................................38
4.9. Fundamental bases of hypothesis .....................................................................................39
4.10. Testing the hypothesis .................................................................................................39
4.11. The role of hypothesis .................................................................................................40
4.12. Self-test exercise ........................................................................................................42
CHAPTER FIVE ..............................................................................................................................43
Designing a research and sampling.................................................................................................43
5.1. Meaning of research design.............................................................................................43
5.2. Definition of research design...........................................................................................44
5.3. Characteristics of good research design............................................................................44
5.4. Problems in research design ............................................................................................45
5.5. Shaping methodology of educational research ..................................................................45
5.6. Meaning of sampling ......................................................................................................46
5.7. Functions of population and sampling..............................................................................47
5.7.1. Randomization .......................................................................................................48
5.8. Types of sampling designs ..............................................................................................48
5.8.1. Probability Sampling...............................................................................................49
5.8.1.1. Characteristics of probability sampling .................................................................50

vi
5.8.1.2. Techniques of probability sampling ......................................................................50
5.8.2. Non-probability sampling ........................................................................................55
5.8.2.1. Characteristics of non-probability sampling ..........................................................55
5.9. Characteristics of a good sample .....................................................................................58
5.10. Size of sample ............................................................................................................58
5.11. Representatives of the sample ......................................................................................60
5.11.1. Identifying a representative sample ..........................................................................61
5.12. Self-test exercise ........................................................................................................62
CHAPTER SIX ................................................................................................................................63
Methods of research ......................................................................................................................63
6.1. Definition of methods of research ....................................................................................63
6.2. Scientific method ...........................................................................................................64
6.3. Survey method ...............................................................................................................65
6.3.1. Purpose of survey method .......................................................................................65
6.4. Historical method ...........................................................................................................66
6.5. Experimental method......................................................................................................66
6.5.1. Basic assumptions behind the experiment .................................................................67
6.6. Concept of cause and effect.............................................................................................67
6.7. Definition of variable......................................................................................................68
6.7.1. Types of variables ...................................................................................................68
6.8. Experimental control ......................................................................................................69
6.9. Characteristics of an experiment ......................................................................................69
6.10. The steps of the experimental method ..........................................................................70
6.11. Classification of experiments .......................................................................................72
6.12. Self-test exercise ........................................................................................................73
CHAPTER SEVEN ..........................................................................................................................74
Design of Experiments ..................................................................................................................74

vii
7.1. The need for precision ....................................................................................................74
7.2. Characteristics of a good experimental design ..................................................................75
7.3. Types of errors ...............................................................................................................76
7.4. Basic principles of experimental design ...........................................................................78
7.4.1. Randomization .......................................................................................................79
7.4.2. Replication .............................................................................................................79
7.4.3. Local control ..........................................................................................................79
7.5. Types of basic experimental designs ................................................................................80
7.6. Self-test exercise ............................................................................................................81
CHAPTER EIGHT ...........................................................................................................................82
Tools of research and data collection ..............................................................................................82
8.1. Significance of questionnaire ..........................................................................................82
8.2. Design of the questionnaire .............................................................................................83
8.3. Type of questionnaire items ............................................................................................83
8.4. Elements of questioner method........................................................................................84
8.5. Choosing the questions ...................................................................................................84
8.6. Need for data collection ..................................................................................................86
8.9. Meaning of data .............................................................................................................86
8.10. Difference between facts and data................................................................................87
8.11. Nature of data.............................................................................................................87
8.12. Quantification of variable ............................................................................................90
8.13. Characteristics of quantitative data...............................................................................90
8.14. Ways to quantify data‟s...............................................................................................91
8.15. Organization of data ...................................................................................................93
8.16. Self-test exercises .......................................................................................................94
CHAPTER NINE .............................................................................................................................95

viii
Analysis of data ............................................................................................................................95
9.1. Meaning of analysis of data.............................................................................................96
9.2. Need for analysis of data.................................................................................................97
9.3. Selecting the level of data ...............................................................................................97
9.4. Statistical analysis of data ...............................................................................................97
9.5. Descriptive data analysis .................................................................................................98
9.6. Inferential data analysis ..................................................................................................99
9.7. Inference from statistics to parameters .............................................................................99
9.8. Selecting the statistics ................................................................................................... 100
9.9. Planning for data analysis ............................................................................................. 102
9.10. Considerations for statistical analysis ......................................................................... 103
9.11. Presentation of data .................................................................................................. 103
9.12. Standard error of the mean (SEM)............................................................................... 104
9.13. Critical ratio (CR or Z).............................................................................................. 106
9.14. Level of significance................................................................................................. 106
9.15. Tests of significance ................................................................................................. 107
9.15.1. Student‟s distribution „t ‟, t-test.............................................................................. 107
9.15.2. Analysis of variance, f-test .................................................................................... 109
9.15.3. Dioxn test, Q-test .................................................................................................. 110
9.16. Self-test exercise ...................................................................................................... 112
CHAPTER TEN ............................................................................................................................. 113
Scientific writing and Presentation ............................................................................................... 113
10.1. Formats of research report ......................................................................................... 114
10.2. Research report......................................................................................................... 115
10.3. Need of research report ............................................................................................. 116
10.4. Format of research report .......................................................................................... 117

ix
10.4.1. Preliminary section ............................................................................................... 118
10.4.2. Main body of report .............................................................................................. 120
10.4.3. Reference section.................................................................................................. 122
10.5. Mechanics of report writing....................................................................................... 125
10.6. Writing research abstract ........................................................................................... 127
10.6.1. Importance of abstract ........................................................................................... 127
10.6.2. Format of abstract ................................................................................................. 128
10.6.3. Characteristics of a good abstract ........................................................................... 129
10.7. Research papers........................................................................................................ 129
10.7.1. Format of a research paper..................................................................................... 130
10.7.2. Essential parts of a research paper .......................................................................... 130
10.8. Writing research paper .............................................................................................. 133
10.8.1. Developing the concept ......................................................................................... 134
10.8.2. Preparing an outline .............................................................................................. 134
10.8.3. Writing the first draft ............................................................................................ 134
10.8.3.1. Editing the draft .............................................................................................. 136
10.8.4. Topping and tailing ............................................................................................... 136
10.8.5. Publishing research paper ...................................................................................... 137
10.8.6. Presentation of research paper................................................................................ 137
10.8.6.1. Preparation of slides and deliverying ................................................................ 138
10.8.7. Advantages of research Paper ................................................................................ 139
10.9. Plagiarism ................................................................................................................ 139
10.10. Self-test exercise ...................................................................................................... 141
Feedback for activities and self-test exercise: ............................................................................ 142
Reference: .............................................................................................................................. 148

x
Course objectives:
Up on completing this module, the student able to
- explain about the meaning of research, its types and processes in research
- describes about motivation and importance of research
- identify and define problem and write research proposal
- distinguish literatures relevant for a specific problem and summarizes
- summarizes sources, importance and functions of literature
- state meaning and definitions of hypothesis
- describe kinds and importance hypothesis
- state meaning of research design and design format of research proposal
- differentiate between population and sampling
- list different types of sampling designs and simple size
- describes methods of research and list the methods
- summarizes about design of experiments, data collection and analysis
- able to write, publish and present scientific paper

1
CHAPTER ONE
Concept of a research
Objectives:
After this chapter is completed, the student able to:
learn the meaning and objectives of research
know significance of research in the scientific world
define the term research methods and methodology
differentiate types of research
describe about research process
Dear student, before reading this study material, what is your present understanding about
the term research?
1.1. Meaning of research
Research is an academic activity that seeks the answer of certain questions which have not been
yet answered. One can also define research as a scientific and systematic search for pertinent
information on a specific topic. In fact, research is an art of scientific investigation. Different
explanations by different persons are given. The advanced learner‟s dictionary of current English
lays down the meaning of research as “a careful investigation or inquiry especially through
search for new facts in any branch of knowledge.” Redman and Mory define research as a
“systematized effort to gain new knowledge.” Some people consider research as a movement; it
is a movement from the known to the unknown.
The term „Research‟ consists of two words, Re and Search. „Re‟ means again and again and
„Search‟ means to find out something. Therefore, research is a process in which the researcher
observes the phenomena again and again, collects data and on the basis of the data collected
she/he draws some conclusions. Research is oriented towards the discovery of relationship that
exists among phenomena of the world in which we live.

2
We all possess the vital instinct of inquisitiveness for, when the unknown confronts us. We
wonder and our inquisitiveness makes us probe and attain full and fuller understanding of the
unknown. This inquisitiveness is the mother of all knowledge and the method, which man
employs for obtaining the knowledge of whatever the unknown, can be termed as research.
Research is an academic activity and the term should be used in a technical sense.
According to Clifford Woody research comprises defining and redefining problems, formulating
hypothesis or suggested solutions; collecting, organizing and evaluating data; making deductions
and reaching conclusions; and at last carefully testing the conclusions to determine whether they
fit the formulating hypothesis. D. Slesinger and M. Stephenson in the Encyclopaedia of Social
Sciences define research as “the manipulation of things, concepts or symbols for the purpose of
generalizing to extend, correct or verify knowledge, whether that knowledge aids in construction
of theory or in the practice of an art.” Research is, thus, an original contribution to the existing
stock of knowledge making for its advancement. It is the persuit of truth with the help of study,
observation, comparison and experiment. In short, the term „research‟ refers to the systematic
method consisting of enunciating the problem, formulating a hypothesis, collecting the facts or
data, analyzing the facts and reaching certain conclusions either in the form of solutions(s)
towards the concerned problem or in certain generalizations for some theoretical formulation.
Activity 1.1:
Define the term research.
1.2. Objectives of research
Nowadays, especially in developed countries, advancement in science and technology is
achieved through extensive research activities. Could you guess about the possible ultimate
objective of performing a research?
The main aim of research is to find out the truth which is hidden and which has not been yet
discovered. Each research study has its own specific purpose. It might be possible to categorize
research objectives into a number of broad groupings as follows:
- to gain familiarity with a phenomenon or to achieve new insights

3
- to portray accurately the characteristics of a particular individual, situation or a group
- to determine the frequency with which something occurs or with which it is
associated with something else
- to test a hypothesis of a causal relationship between variables
1.3. Motivation of research
Dear student, what do you think about the reason why people to undertake research?
There must be a driving force behind each researcher to undertake a research on his area of
interest. The possible expected motives may be either one or more of the following:
- to get a research degree along with its consequential benefits
- to face the challenge in solving the unsolved problems
- desire to get intellectual joy of doing some creative work
- desire to serve the society
- to get respectability.
However, these are not an exhaustive list of factors. Many more factors such as directives of
government, employment conditions, curiosity about new things, desire to understand causal
relationships, social thinking and awakening and other motives initiate people to perform
research operations.
Activity 1.2:
Mention at least two reasons of a researcher to perform research.
1.4. Types of research
1.4.1. Applied vs. Fundamental
Research can either be applied (action) or fundamental (basic or pure). Applied research aims at
finding a solution for an immediate problem facing a society or an industrial/business
organization. On the other hand, fundamental research is mainly concerned with generalizations
and formulation of theory. “Gathering knowledge for knowledge‟s sake is termed „pure‟ or
„basic‟ research.” The ultimate aim of applied research is to discover a solution for some
pressing practical problem, whereas basic research focuses on finding information that has a

4
broad base of applications and thus, adds to the already existing organized body of scientific
knowledge.
1.4.2. Quantitative vs. Qualitative
Quantitative research is based on the measurement of quantity or amount. It is applicable to
phenomena that can be expressed in terms of quantity. On the other hand, qualitative research is
concerned with qualitative phenomenon, phenomena relating to quality or kind. For instance, if
the researcher is interested to investigate the kind of metal ion(s) present in given water sample is
qualitative research. Whereas, applying appropriate analytical technique(s) to determine the
concentration is called quantitative research.
1.4.3. Conceptual vs. Empirical
Conceptual research is that related to some abstract idea(s) or theory. It is generally used by
philosophers and thinkers to develop new concepts or to reinterpret existing ones. On the other
hand, empirical research relies on experience or observation alone, often without due regard for
system and theory. It is data-based research coming up with conclusions which are capable of
being verified by observation or experiment. We can also call it as experimental type of research.
In such a research it is necessary to get at facts firsthand, at their source, and actively to go about
doing certain things to stimulate the production of desired information. In such a research, the
researcher must first provide himself with a working hypothesis or guess as to the probable
results. He then works to get enough facts (data) to prove or disprove his hypothesis. Such
research is thus characterized by the experimenter‟s control over the variables under study and
his deliberate manipulation of one of them to study its effects. Empirical research is appropriate
when proof is sought that certain variables affect other variables in some way. Evidence gathered
through experiments or empirical studies is today considered to be the most powerful support
possible for a given hypothesis.
1.4.4. Descriptive vs. Analytical
Descriptive research includes surveys and fact- finding enquiries of different kinds. The major
purpose of descriptive research is description of the state of affairs as it exists at present. In
social science and business research, the term ex post facto research is used often for descriptive

5
research studies. The main characteristic of this method is that the researcher ha s no control over
the variables, only what has happened or what is happening is reported. Most ex post facto
research projects are used for descriptive studies in which the researcher seeks to measure such
items as, for example, frequency of shopping, preferences of people, or similar data. Ex post
facto studies also include attempts by researchers to discover causes even when they cannot
control the variables. The methods of research utilized in descriptive research are survey
methods of all kinds, including comparative and correlational methods. In analytical research,
on the other hand, the researcher has to use facts or information already available, and analyze
these to make a critical evaluation of the material.
Activity 1.3:
Among the above discussed types of researches, which one is concerning about finding solutions
of immediate problems?
1.5. Significance of research
Dear student, what could be the possible outcome of researches particularly in Chemistry?
Research inculcates scientific and inductive thinking and it promotes the development of logical
habits of thinking and organization. All progress is born of inquiry. Doubt is often better than
overconfidence, it leads to inquiry and inquiry leads to invention, is an explanation from Hudson
Maxim. The role of research in several fields such as Applied Chemistry has great impact in the
modern scientific world. Advanced researches in Chemistry to resolve the hot issues of these
days, for instance, related with energy such as development efficient Li- ion battery and fuel cell:
in electronics, using polymers and other new materials for semiconductor applications and
related with health, in pharmaceuticals, drug delivery, implants and medical devices. In these
researches, the Chemistry behind each material governs functionality and their performance. It is
not questionable about significance of research especially in the field Chemistry for development
of a country. Every latest high technology outcomes are dependent on the Chemistry of the
materials used. In general, expanding researches in the areas of Chemistry helps to achieve good
progress in science and technology and sustainable development. Sustainable development is a
newly emerging concern of chemistry, deals on economical utilization and renewal of resources
coupled with hazardous waste reduction and concern for the environment.

6
1.6. Research methods vs. methodology
Dear student, do you mind that a difference is present in the two terms research methods
and research methodology?
It seems appropriate at this stage to explain the difference between research methods and
research methodology. Research methods may be understood as all those methods/techniques
that are used for conduction of research. It refers the behavior and instruments used in selecting
and constructing research technique. A distinction is made between research techniques and
research methods. Research techniques refer to the behavior and instruments we use in
performing research operations such as making observations, recording data, techniques of
processing data and the like.
Research methodology is a way to solve the research problem systematically. It may be
understood as a science of studying how research is done scientifically. The various steps that are
generally adopted by a researcher in studying his research problem along with the logic behind
them should be understood well. It is necessary for the researcher to know not only the research
methods/techniques but also the methodology. Researchers not only need to know how to
develop certain indices or tests, how to calculate the mean, the mode, the median or the standard
deviation or chi-square, how to apply particular research techniques, but also need to know
which of these methods or techniques are relevant and which are not, and what would they mean,
indicate and why. Researchers also need to understand the assumptions underlying various
techniques and they need to know the criteria by which they can decide that certain techniques
and procedures will be applicable to certain problems and others will not. This means it is
necessary for the researcher to design his methodology for his problem. Methodology may differ
from problem to problem. In general, when we talk about research methodology we not only talk
of the research methods but also consider the logic behind the methods. We use in the context of
our research study and explain why we are using a particular method or technique and why we
are not using others. Therefore, research results are capable of being evaluated either by the
researcher himself or by others.

7
Activity 1.4:
What is your understanding about significance of research?
1.7. Research and Scientific method
Understanding of the meaning of scientific method is very essential for a clear perception of the
term research. The two terms, research and scientific method, are closely related. As it is already
stated, research can be termed as “an inquiry into the nature of, the reasons for, and the
consequences of any particular set of circumstances, whether these circumstances are
experimentally controlled or recorded just as they occur”. Although researches may vary
considerably from one science to another, the philosophy is common to all research methods and
techniques. The situation is given the name of scientific method. In this context, Karl Pearson
writes, “The scientific method is one and same in the branches of science and that method is the
method of all logically trained minds … the unity of all sciences consists alone in its methods,
not its material. The man who classifies facts of any kind whatever, who sees their mutual
relation and describes their sequences, is applying the Scientific method and is a man of
science.” Scientific method is the pursuit of truth as determined by logical considerations.
The ideal of science is to achieve a systematic interrelation of facts. Sc ientific method attempts
to achieve “this ideal by experimentation, observation, logical arguments from accepted
postulates and a combination of these three in varying proportions.” In scientific method, logic
aids in formulating propositions explicitly and accurately so that their possible alternatives
become clear. Further, logic develops the consequences of such alternatives, and when these are
compared with observable phenomena, it becomes possible for the researcher or the scientist to
state which alternative is most in harmony with the observed facts. All this is done through
experimentation and survey investigations, which constitute the integral parts of scientific
method. Experimentation is done to test hypotheses and to discover new relationships.
The scientific method is based on certain basic postulates, which can be stated as follows.
- It relies on empirical evidence;
- It utilizes relevant concepts;
- It is committed to only objective considerations;
8
- It presupposes ethical neutrality, i.e., it aims at nothing but making only adequate and
correct statements about population objects;
- It results into probabilistic predictions;
- Its methodology is made known to all concerned for critical scrutiny is for use in
testing the conclusions through replication;
- It aims at formulating most general axioms
Thus, “the scientific method encourages a rigorous, impersonal mode of procedure dictated by
the demands of logic and objective procedure.” Accordingly, scientific method implies an
objective, logical and systematic method. That means a method free from personal bias or
prejudice, a method to ascertain demonstrable qualities of a phenomenon capable of being
verified. In scientific approach, it is a method in which the researcher is guided by the rules of
logical reasoning or a method wherein the investigation proceeds in an orderly manner and a
method that implies internal consistency.
1.8. Importance of knowing how research is done
The study of research methodology gives the student the necessary training in gathering material,
arranging and participation in the field work. Taking training on techniques for collection of data
appropriate to particular problems, use of statistics, questionnaires, controlling experimentation,
recording evidence and sorting it out and interpreting gives the chance to be good researcher. In
fact, importance of knowing the methodology of research or how research is done stems from the
following considerations:
For one who is preparing himself for a career of carrying out research, the importance of
knowing research methodology and research techniques is obvious since the same constitute the
tools of his trade. The knowledge of methodology provides good training especially to the new
research worker and enables him to do better research. It helps him to develop disciplined
thinking or a „bent of mind‟ to observe the field objectively.
Knowledge of how to do research will inculcate the ability to evaluate and use research
results with reasonable confidence.
When one knows how research is done, then one may have the satisfaction of acquiring a
new intellectual tool which can become a way of looking at the world and of judging every day
experience. Accordingly, it enables us to make intelligent decisions concerning problems facing

9
us in practical life at different points of time. In this scientific age, all of us are in many ways
consumers of research results and we can use them intelligently provided we are able to judge
the adequacy of the methods by which they have been obtained.
Activity 1.5:
Mention at least three postulates of scientific method.
1.9. Research process
Dear student, can you guess what process can be performed in research activity?
Research process is just like a journey. It consists of series of actions or steps necessary to
effectively carryout research and the desired sequencing of these steps. The process consists of a
number of closely related activities. However, such activities overlap continuously rather than
following a strictly prescribed sequence. At times, the first step determines the nature of the last
step to be undertaken. If subsequent procedures have not been taken into account in the early
stages, serious difficulties may arise which may even prevent the completion of the study. One
should remember that the various steps involved in a research process are not mutually
exclusive; nor are they separate and distinct. They do not necessarily follow each other in any
specific order and the researcher has to be constantly anticipating at each step in the research
process the requirements of the subsequent steps. However, the following order concerning
various steps of research provides a useful procedural guideline.
Formulating the research problem
Extensive literature survey
Developing the hypothesis
Preparing the research design
Determining sample design
Collecting the data
Execution of the project
Analysis of data
Generalizations and interpretation and
Scientific writing and reporting

10
1.10. Self-test exercise
I. Fill in the blank space with appropriate phrase or words
1. A research type, which related to abstract ideas, is _________________.
2. A method in which all logically trained minds use in common is ________________.
3. Discovery of relationships among phenomena of the word is __________________.
4. Gathering knowledge for knowledge sake is the objective of _____________________.
5. The desired sequence of steps to achieve the research effectively is called____________.
II. Give a brief explanation for the following questions
1. Describe the different steps involved in a research process.
2. What do you mean by research? Explain its significance in modern times.
3. Distinguish between research methods and research methodology.
4. Describe the different types of research.
5. Give an explanation for research design
11
CHAPTER TWO
Formulation of a research Problem
Objectives:
After completion of this chapter, the student able to:
explain about research problem and its source
learn ways of problem formulation,
identify criteria‟s for selection of problem
write statement of problem
write proposals
Dear student as we learnt from the first chapter, research is a means to solve problems;
however, this chapter is dealing about formulation of problem. What mean that?
The first step of a research process is to identify a problem. The selection of a problem is
governed by reflective thinking. Unthinking activity is governed too completely by tradition or
by emotion. Primitive life was largely without effective reflective thought, until some intelligent
individual conceived of a new solution for an old problem. Therefore, upper educational groups
ever do much careful ordered thinking. The normal human mind thinking may be classified into
four categories: convergent, divergent, reflective and scientific thinking. Convergent thinking is
the ability to give the correct answer to standard questions that do not require significant
creativity. Divergent thinking is a thought process or method used to generate creative ideas by
exploring many possible solutions. Reflective thinking requires creativity and individuals
conceived for a new solution of an old problem, but scientific thinking is in terms of carefully
organized reflection. Because of their great importance in formulation of research problems
further explanation is given on reflective and scientific thinking‟s.
2.1. Reflective thinking
The reflective thinking implies two components, mastery of the situation or content plus
divergent thinking or creative thinking. The reflective thinking acts in terms of problem
situation; therefore, it involves the following steps:

12
- The occurrence of a felt need or difficult
- Definition of the problem in terms of a problem statement
- Occurrence of a suggested explanation or possible solution or hypothesis
- The rationale elaboration of an idea through the development of its implication by means
of collection of data or evidences
- Collection of the ideas and formation of concluding belief through experimental
verification of the hypothesis
- Conclusions and formulation of generalizations
It is recognized that at every level of generalization the human mind may act through these
steps. The research process involves inductive-deductive mode of thinking which is known as
scientific thinking.
2.2. Scientific thinking
The scientific thinking is defined as an inductive-deductive mode of reasoning in which one
seeks to explain the uniformities of nature by appealing to experiences. Induction moves forward
from particular to the general whereas, deduction is backward movement from general to
particular. The scientific thinking starts with facts and continually returns to facts to test and
verify its hypotheses. It is based on empirical evidences and establishes cause and effect
relationship. The sources of evidences are based on the following methods: customs and
traditions, authority, personal experiences, syllogistic reasoning, self-evident proposition and
scientific inquiry and experimentation. These methods seeking truth have continued to the
present day and form human beings current intellectual equipment for solving problem of life.
2.2.1. Characteristics of scientific thinking
There are six main features of scientific thinking:
- it is based upon cause-effect relationship and evidences.
- it involves certain principles and certain assumptions.
- scientific thinking employs hypotheses to verify the concepts.
- it is free from emotional bias, personal prejudices and it is highly objective.
- it utilizes accurate measurement and observation to contribute in situation.

13
- Scientific thinking employs quantitative analysis in the treatment of data for drawing
conclusions.
Activity 2.1:
What is the difference between inductive and deductive thinking?
2.3. Identification of problem
Dear student, based on your understanding what could be the advantage of problem
identification?
The identification and analyzing a research problem is the first and most crucial step of research
process. A problem cannot be solved effectively unless a researcher possesses the intellect and
insight to isolate and understand the specific factors giving rise to the difficulty. The present
research scholars understand that identification of a problem means to select a topic of a research
or statement of the problem. It is wrong to think so. A topic or statement of the problem and
research problem are not synonymous but they are inclusive. The statement of problem concerns
with the functioning of the broader area of field studied whereas a topic or title or statement of
the problem is the verbal statement of the problem. The topic is the definition of the problem
which delimits or pin points the task of a researcher. It is the usual practice of the researches that
they select the topic of the study from different sources especially from research abstracts. They
do not identify the problem, but a problem is made on the basis of the topic. It results that the
researcher has no involvement in his research activities. Whatever they do, do mechanically.
Since identifying the exact nature and dimensions of a problem is of major importance in
research work. It is very essential that an investigator should learn how to recognize and define a
problem.
Activity 2.2:
What is your opinion about statement of problem?

14
2.4. Sources of problem
The selection of a suitable problem is not an easy task. It is a serious responsibility to commit
oneself to a problem that will inevitably require much time and energy, which is so academically
significant. The following are the main sources to which one may proceed for a suitable research
problem.
- Personal experiences of the investigator in the study area, for example, for a chemist,
academic or industrial experiences are the main source for identifying suitable problem.
- Extensive study of available literature-research abstracts, journals, hand-books of
research international abstracts etc. He can draw an analogy for selecting a research
problem or can think parallel problem in the field studied.
- The researcher has to decide his field of investigation, He/she should study the field
intensively in the specific area; this may enable him to identify a problem from the
specific field.
- The innovations, technological changes and curricular developments are constantly
bringing new problems and new-opportunities for Social Studies Research.
- Consulting supervisor, experts of the field and most experienced person of the field. They
may suggest most significant problem of the area. He can discuss certain issues of the
area to emerge a problem.
- It is a general practice that researchers suggest some problems in their research reports.
The researcher can pick up a suitable problem for his own study.
2.5. Criteria for selection of problem
Criteria‟s needs to be considered in the selection of a research problem can be categorized in to
external and personal. External criteria have to do with novelty and importance for the field
availability of data and method, and institutional or administrative cooperation. However,
personal criteria involved in consideration of interest, training, cost and time, etc. Criteria for
selection of the problem are sited here.
- Novelty and avoidance of unnecessary duplications.
- Importance for the field represented and implementation.
- Interest, intellectual curiosity, and drive.
- Training and personal qualifications.

15
- Availability of data and method.
- Special equipment and working conditions.
- Approachability of the sample.
- Sponsorship and administrative cooperation.
- Hazards, penalties and handicaps.
- Cost and returns and time factor.
Activity 2.3:
What are the possible sources of problem in research?
2.6. Defining a problem
Defining a problem means “To pin-point the problem to reach the core of the problem i.e.
threadbare analysis.” Defining the problem serves to:
- sets the direction of the study.
- reveals the methodology or procedure of the study.
- helps the researcher to control subjectivity or biases of the researcher.
- suggest and specify the variables to be taken up into the investigation through a
problem involved into so many variables.
- make the research work practicable.
2.7. Statement of problem
Dear student, could you define the term statement of problem before goes through this
material?
After selecting a problem and before starting planning for the study, it should be stated carefully
to delimit the task and isolate a specific problem. This type of decision is culminated in the
problem statement. Kerlinger has identified three criteria of good problem statements.
- A problem should be concerned with relation between two or more variables.
- It should be stated “clearly and unambiguously in question form.”
- It should be amenable to empirical testing.

16
Meeting these criteria in his problem statement will result in a clear and concise idea of what he
wants to do. This sets the stage for further planning.
Activity 2.4:
Which research stage is good to state a statement for research problem?
2.7.1. Assumptions about problem
A good statement of problem is based on some assumptions. An assumption is the supposition
that it is taken for granted to better establish the scope, frame of reference and conditions under
which the study will be conducted. The following are the major purposes of assumptions.
- It makes the research work feasible.
- It delimits the scope of the problem.
- It establishes the proper frame of reference.
- It sets forth certain conditions of the study.
- It aids in the development of testable hypotheses.
- It helps in establishing the population and extent of generalization.
- It also determines the statistical limits for accepting and rejecting of hypotheses.
2.8. The research proposal or synopsis
Dear student, could you explain what it mean research proposals?
Many universities and institutions require a research proposal or research synopsis or an outline
of proposed work. It serves as a useful basis for the evaluation of a project as well as a guide line
for the researcher. The synopsis contains a clear and concise statement of the problem, the
hypothesis involved, recognition of the significance of the problem, definitions of the important
terms, assumptions and limitations, a resume of related literature, an analysis of proposed
research producers, and a time schedule. The proposal is summited to the research degree
committee to examine and the committee at university level gives the final approval. It is like a
blue print of research project.

17
2.9. Self-test exercise
I. Choose the letter of the correct answer from the given choices
1. Based on this reading material, which thinking is not human mind thinking:
A. Convergent B. Divergent C. Absolute D. Critical
2. Selection of problem is governed by,
A. Reflective thinking B. Random thinking C. Unordered thinking D. All
3. Scientific thinking is a type of ______________.
A. Inductive thinking B. Deductive thinking C. Unordered thinking D. A and B
4. Which is not a criteria in selection problem:
A. Interest B. Environment C. Cost D. Time
5. Which one is not the importance of defining a problem:
A. to set the direction C. to reveal the methodology
B. to control subjectivity D. none
II. Give a detail explanation for the following questions
1. Research work is guided by reflective thinking, not by traditional or conventional
thinking. Comment on this statement.
2. Indicate the sources of research process. Mention the steps of the research process.
3. Give examples the sources of research problem and explain how a problem can
identified.
4. Explain why is it necessary to define a problem and delimiting a problem?

18
CHAPTER THREE
Review of Literature
Objectives:
At the end of this chapter the student able to:
discuss objectives of review of literature
learn sources of literature
explain about types of literature
explain ways of literature review
Dear student, what it means the term review of literature? Why it is important in research
Once the problem is formulated, a brief summary should be written down. It is compulsory for a
research worker writing a proposal the topic and submits to the necessary committee for
approval. At this juncture the researcher should undertake extensive literature survey connected
with the problem. For this purpose, the abstracting and indexing journals and published or
unpublished bibliographies are the materials can be used. Academic journals, conference
proceedings, government reports, books etc., must be tapped depend ing on the nature of the
problem. Earlier studies, if any, which are similar to the study in hand, should be carefully
studied. A good library will be a great help to the researcher at this stage. Different academicians
gave different explanations for literature. Some of these explanations are cited as:
According to W.R. Borg:
“The literature in any field forms the foundation upon which all future work will be built. If we
fail to build the foundation of knowledge provided by the review of literature our work is likely
to be shallow and naive and will often duplicate work that has already been done better by
someone else.”
According to Charter V. Good:
“The keys to the vast storehouse of published literature may open doors to sources of significant
problems and explanatory hypotheses and provide helpful orientation for definition of the

19
problem, background for selection of procedure, and comparative data for interpretation of
results. In order to be creative and original, one must read extensively and critically as a stimulus
to thinking.”
According to John W. Best:
“Practically all human knowledge can be found in books and libraries. Unlike other animals that
must start a new with each generation, man builds upon the accumulated and recorded
knowledge of the past. His constant adding to the vast store of knowledge makes possible
progress in all areas of human endeavor.”
Activity 3.1:
What materials can be used in literature survey?
3.1. Need of review of literature
Dear student, what is your opinion about need of literature review?
The review of literature is an essential step in research. Because it:
- gives the worker an indication of the direction.
- helps be obtain up-to-date information related to his own problem.
- avoids the replication of the study of findings to take an advantage from similar or related
literature as regards, methodology, techniques of data collection, procedure adopted and
conclusions drawn.
- serves as source of problem of study, an analogy may be drawn for identifying and
selecting his own problem of research.
- provides theories, ideas, explanations or hypothesis which may prove useful in the
formulation of a new problem.
- indicates whether the evidence already available solves the problem adequately without
requiring further investigation.
- provides the sources for hypothesis, the researcher can formulate research hypothesis on
the basis of available studies.
- suggests method, procedure, sources of data and statistical techniques appropriate to the
solution of the problem.

20
- locates comparative data and findings useful in the interpretation and discussion of
results.
- helps in developing experts and general scholarship of the investigator in the area
investigated.
- contributes towards the accurate knowledge of the evidence or literature in one‟s area of
activity is a good avenue towards making oneself. This knowledge is an asset ever
afterwards, whether one is employed in an institution of higher learning or a research
organization.
3.2. Nature of review of the literature
Through integration of current research thinking with post researches, we move knowledge
forward. For successful functioning, each researcher must know the past to design research and
build on what is already known and what is not. There are times when researchers lack this
knowledge. We see researches are being done on matters which have been demonstrated
sufficiently so as not to need further replication. When this is done the research becomes an
academic exercise of little interest in consequence to the discipline involved. Needless repetition
is only a waste of the researcher‟s time, money and energy, but new research that is unconnected
to previous thinking and research is a lost opportunity to move knowledge forward. When new
research is not based on a thorough review of the literature, it becomes an isolated entity bearing
at best accidental relevance to what has gone before. When it is based on the literature, we can
hope for cohesive and integrated approaches to our problems and for resolution and solution of
them through research.
Reviewing the literature has two phases. The first phase involves identifying all the relevant
published material in the problem area and reading the part which we are not thoroughly
familiar. As we read what others have done and/or thought about the problem area, we gradually
develop the foundation of ideas and results on which our own study will be built. The second
phase of the review of the literature involves writing this foundation of ideas into a section of the
research report. A distinction must be made between the literature that is reviewed, read by the
researcher and which is discussed in the study itself. It is referred to in the section or chapter
headed “Review of the Literature.” The section in the research report discussing the literature is

21
different matter. For the researcher, it establishes the framework or background in the field and
thus, provides the setting in which he reports the new study. For the reader, the section provides
a summary of the thinking and research necessary for him to understand the study. It also gives
the reader a good estimate of the researcher‟s scholarliness. One basis for this estimate is the
researcher‟s ability to distinguish the relevant from the irrelevant. How important this stage will
be depends, of course, on the richness of the literature.
Activity 3.2:
What are the two phases of literature review?
3.3. Sources of literature
Dear student, what sources of information you are using your Chemistry course study?
There are various sources of literature which may be used for this purpose. These sources can be
broadly classified into books and text-books materials, periodical literature and general
references.
3.3.1. Books and text books material
The most useful list of books published in the English language are the cumulative book index
and book review index, books review digest, subject guide to books indicates that books are in
print or press or forthcoming books. National Union Catalogue is also useful for this purpose.
The Cumulative Book Index is published monthly to provide the references, all books published
in the English language. Sources of information in the social sciences „organized‟ by subject area
and indexed by author and title, this work contains comprehensive list of reference books and
monographs.
3.3.2. Periodicals
A periodical is defined as a publication issued in successive parts, usually at regular intervals,
and as a rule, intended to be continued indefinitely. These include yearbook, documents,
almanacs, the cumulative book index, international abstracts, journals, newspapers, magazines
and international index to periodicals. Periodicals are generally placed in open shelves in the
periodical room. Their effective use is predicted on the use of an index to identify the articles on

22
subject matter under the study. The education index has served as a comprehensive index of
practically all publications in the area of education. Education Index New York, published
monthly, Canadian Education Index, Ottawa published by the Council of Education. Current
Index of Journals in Education, New York, it is published monthly. Index of Doctoral
Dissertations International, Ann Arbor, it is published annually and consolidates all dissertations
accepted American, Canadian and European Universities. Bibliographic Index, New York, this
guide indexes by subject current bibliographies of published books and educational periodicals
both in English and in foreign languages.
3.3.3. Abstracts
Another type of reference guide is the abstract, review, or digest. In addition to provide a
systematized list of reference sources, it includes a summary of the contents. Usually the brief
summaries of research studies are given in the form of abstract, educational abstracts,
International abstracts in humanities, ERIC, Educational documents abstracts, Washington DE.,
this annual publication includes abstracts of all reports which appeared in resources in Education
for the year. Education abstracts, psychological abstracts and Sociological abstracts are
published including research studies in these disciplines. A wide variety of indexes and general
references can be found to cover almost any area in which the modern researcher might be
interested.
3.3.4. Encyclopedias
Encyclopedias provide concise information on a number of subjects written by specialists. They
provide a convenient source of information, and often include illustrations and bibliographies.
Only specialized encyclopedias deal with restricted areas of knowledge. Encyclopedia of
Educational research New York, it is published in every ten years. It refers to important work on
educational problems.
3.3.5. Newspaper
The current newspapers provide up to-data information and speeches, reports and conferences.
New developments in field of education, current events and educational news are also reported in
newspapers. Exploring the literature moves the researcher to the frontiers of knowledge where he

23
can evaluate new findings in his field, gaps in knowledge contradictory findings and identifying
needed research. He will be familiar with methods and bibliographies that may prove useful in
his own investigation.
Activity 3.4:
Which type of literature source provides summery of contents?
3.4. Functions of review of literature
There are five functions of review of literature. These are used:
- to obtain conceptual frame of reference for the contemplated research.
- to understand the status of research in problem area.
- to obtain clues to the research approach, method, instrumentation and data analysis.
- to estimate the probability of success of the contemplated research
- to gain specific information required to interpret the definitions, assumptions, limitations
and hypotheses of research.
3.5. How to conduct review of the literature
Dear student, do you have some hint earlier on how to conduct review of literature? If
your answer is yes, mention it.
The place to begin a review of the literature varies, depending upon how familiar the researcher
is with the problem area. As we stated earlier, the thoroughly well- read researcher will need to
complete only a brief review of the latest writings and research. Since this researcher will also
know the major thinkers and sources of research in the field. He/she does not usually need help
in conducting this brief review. This section then, will assume that the researcher is not an expert
in the problem area and discuss how the non-expert reviews the literature. The non-expert should
begin by reviewing the conceptual literature, in which he/she can gain a better overview of
issues.
An excellent place to begin is with a general text in the problem area in an encyclopedia or
review of recent works. In education, we have excellent general texts in almost all areas as well
24
as general encyclopedias like the Encyclopedia of modern education and the Encyclopedia of
Educational research, and more specific works like the Encyclopedia of child care and guidance
or the Yearbook of the National Society for the study of education. When the research problem
has been specified, the researcher should take stock of his reading to date, particularly appraising
its relevance in the light of the newly specified research problem. He will want to ascertain
whether the conceptual literature already reviewed provides a thorough conceptual framework
for the specific problem that he has new decided upon, or whether further work is needed in the
conceptual literature. In other event, however, he will also want to move on new to the research
literature, and begin to see the what, when, where, who and how of previous research on his
specific research problem. In the course of reading the conceptual literature the researcher will
have come upon references to research studies. These may be a good first set of studies to locate
and read, preferably as complete report.
The researcher not already familiar with all of these resources should make it a point to become
familiar with each of the sources listed, since at some point in most research, any or all of them
might be useful. The non-expert begins this phase of his review by using the index or abstract
most relevant to his problem area. For example, for the researcher interested in developing a
research project in the area of teacher-education in the elementary school, the most relevant
index is the education index. To use the education index in the review of the literature for the
teacher education study, the non-expert would take the specific problem on teacher-education.
3.6. Reporting review of literature
Generally, review of literature is reported in the second chapter of the thesis or dissertation. The
purpose of reporting the review of literature is not to write down research abstracts one by one
which is usual practice of the researcher of the day. It provides information for the reader about
previous researches on the area and connects the recent findings with the past one. It is most
difficult and creative job on the part of researcher. The following procedure should be followed
in reporting literature review.
Activity 3.5:
What is the importance of reporting review of literature?
25
3.7. Self-test exercise
I. Fill the blank space with appropriate terms
1. The process of surveying information from previous study is _____________________.
2. A material used to obtain information about previous works is____________________.
3. A literature that provides concise information is called _____________________.
4. Type of literature source that is published in successive parts is called ____________.
II. Give a brief explanation for the following questions
1. Explain the term „review of literature‟
2. Explain the need and functions of review of literature.
3. Describe the role of review of literature in historical research and survey, experimental
type of research in education.
4. Enumerate the sources of review of literature and suggestions, for the use of library for
this purpose.

26
CHAPTER FOUR
Developing hypothesis
Objectives:
When this chapter is finished, the student will able to:
define the word hypothesis
explain about importance of hypothesis
discuss about the nature and functions of hypothesis
clarify how to develop hypothesis
Dear student, do you have some background knowledge about the term hypothesis?
After extensive literature survey, researcher should state in clear terms the working hypothesis or
hypotheses. Working hypothesis is tentative assumption made in order to draw out and test its
logical or empirical consequences. As such the manner in which research hypotheses are
developed is particularly important since they provide the focal point for research. They also
affect the manner in which tests must be conducted in the analysis of data and indirectly the
quality of data which is required for the analysis. In most types of research, the development of
working hypothesis plays an important role. Hypothesis should be very specific and limited to
the piece of research in hand because it has to be tested. The role of the hypothesis is to guide the
researcher by delimiting the area of research and to keep him on the right track. It sharpens his
thinking and focuses attention on the more important facets of the problem. It also indicates the
type of data required and the type of methods of data analysis to be used. How does one go about
developing working hypotheses? The answer is by using the following approach:
- discussions with colleagues and experts about the problem, its origin and the
objectives in seeking a solution;
- examination of data and records, if available, concerning the problem for possible
trends, peculiarities and other clues;
- review of similar studies in the area or of the studies on similar problems; and

27
- exploratory personal investigation which involves original field interviews on a
limited scale with interested parties and individuals with a view to secure greater
insight into the practical aspects of the problem.
Thus, working hypotheses arise as a result of a-priori thinking about the subject, examination of
the available data and material including related studies and the counsel of experts and interested
parties. Working hypotheses are more useful when stated in precise and clearly defined terms. It
may as well be remembered that occasionally we may encounter a problem where we do not
need working hypotheses, especially in the case of exploratory or formulative researches which
do not aim at testing the hypothesis. But as a general rule, specification of working hypotheses in
another basic step of the research process in most research problems.
4.1. Meaning of hypothesis
The word hypothesis is made up of two Greek words which mean that it is some sort of „sub-
statements‟, for it is the presumptive statement of a proposition, which the investigation seeks to
prove. This theory when stated testable proposition formally and clearly subjected to empirical or
experimental verification is known as a hypothesis. The hypothesis furnishes the germinal basis
of the whole investigation and remains to the end its corner stone, for the whole research is
directed to test it out by facts. At the start of investigation the hypothesis is a stimulus to critical
thoughts offers insights into the confusion of phenomena. At the end it comes to prominence as
the proposition to be accepted or rejected in the light of the findings.
The word hypothesis consists of two words, hypo and thesis. „Hypo‟ means tentative or subject
to the verification and „Thesis‟ means statement about solution of a problem. The world meaning
of the term hypothesis is a tentative statement about the solution of the problem. Hypothesis
offers a solution of the problem that is to be verified empirically and based on some rationale.
Another meaning of the word hypothesis which is composed of two words: „Hypo‟ means
composition of two or more variables which is to be verified. „Thesis‟ means position of these
variables in the specific frame of reference. This is the operational meaning of the term
hypothesis. Hypothesis is the composition of some variables which have some specific position
or role of the variables i.e. to be verified empirically. It is a proposition about the factual and
conceptual elements. Hypothesis is called a leap into the dark. It is a brilliant guess about the

28
solution of a problem. A tentative generalization or theory formulated about the character of
phenomena under observation are called hypothesis. It is a statement temporarily accepted as
true in the light of what is known at the time about the phenomena. It is the basis for planning
and action- in the research for new truth.
Activity 4.1:
Define the term hypothesis with your own words.
The term hypothesis has been defined in several ways. Some important definitions have been
given in the following paragraphs:
1. Hypothesis
- A tentative supposition or provisional guess “It is a tentative supposition or provisional
guess which seems to explain the situation under observation.” – James E. Greighton
2. Hypothesis
- A Lungberg thinks “A hypothesis is a tentative generalization the validity of which
remains to be tested. In its most elementary stage the hypothesis may be any hunch, guess,
imaginative idea which becomes the basis for further investigation.”
3. Hypothesis:
- According to John W. Best, “It is a shrewd guess or inference that is formulated and
provisionally adopted to explain observed facts or conditions and to guide in further
investigation.”
4. Hypothesis:
- According to A.D. Carmichael, “Science employs hypothesis in guiding the thinking
process. When our experience tells us that a given phenomenon follows regularly upon the
appearance of certain other phenomena, we conclude that the former is connected with the latter
by some sort of relationship and we form a hypothesis concerning this relationship.”
29
5. Hypothesis
- Goode and Han, “A hypothesis states what we are looking for. A hypothesis looks
forward. It is a proposition which can be put to a test to determine its validity. It may prove
to be correct or incorrect.
6. Hypothesis
- Bruce W. Tuckman, “A hypothesis then could be defined as an expectation about event
based on generalization of the assumed relationship between variables.”
4.2. Nature of hypothesis
Hypothesis has the following main features.
- It is conceptual in nature.
- It is a verbal statement in a declarative form.
- It has the empirical referent.
- It has a forward or future reference.
- It is future oriented.
- It is the pivot of a scientific research.
All the research activities are designed for its verification. The nature of hypothesis can be well
understood by differentiating it with other terms like assumption and postulate.
4.3. Importance of a hypothesis
Dear student, what is your expectation on importance of hypothesis?
Some of importance‟s can be gained from hypothesis are:
- Hypothesis is the “Eyes” investigator‟s:
- It focuses research:
- It places clear and specific goals:
- It avoids blind research and it serves a sort of guiding light.
Activity 4.2:
Mention at least three importance of hypothesis.

30
4.4. Kinds of hypothesis
Hypotheses vary in form and some extent, form is determined by some function. Thus a working
hypothesis or a tentative hypothesis is described as the best guess or statement derivable from
known or available evidence. The amount of evidence and the certainty or quality of it
determines other forms of hypotheses. In other cases, the type of statistical treatment generates a
need for a particular form of hypothesis. The following kinds of hypotheses and their examples
represent an attempt to order the more commonly observed varieties as well as to provide some
general guidelines for hypothesis, development and statement. There are four kinds of
hypotheses:
4.4.1. Question form of hypothesis
Some writers assert that a hypothesis may be stated as a question; however, there is no general
consensus on this view. At best, it represents the simplest level of empirical observation. In fact,
it fails to fit most definitions of hypothesis. It is included simply that it frequently appears in the
lists. There are cases of simple investigation and search which can be adequately implemented
by raising a question, rather than dichotomize hypothesis forms into acceptable/rejectable
categories.
4.4.2. Declarative statement
A hypothesis may be developed as a declarative that provides an anticipated relationship or
difference between variables. The anticipation of a difference between variables would imply
that the hypothesis developer has examined existing evidence which led the researcher to believe
a difference may be anticipated as processes additional evidence.
In declarative statement, H stands for representation of declaration about presence of significant
effect by independent variables on the criterion variable. It means it is merely a declaration of the
independent variables effect on the criterion (dependent) variable.
- Example :
H: There is significant change in solubility with presence of change in pH of the system.
31
4.4.3. Directional hypothesis
A hypothesis may be directional which connotes an expected direction in the relationship or
difference between variables. The above hypothesis has been written in directional statement
form as follows:
H: Solubility increases at lower pH than higher pH systems. The hypothesis developer of this
type appears more certain of his anticipated evidence than would be the case if he had used either
of the previous examples. If seeking a tenable hypothesis is the general interest of the researcher,
this kind of hypothesis is less safe than the others because it reveals two possible conditions.
These conditions are matter of degree. The first condition is that the problem of seeking
relationship between variables is so obvious that additional evidence is scarcely needed. The
second condition derives because researcher has examined the variables very thoroughly and the
available evidence supports the statement of particular anticipated outcomes. An example of the
obviously safe hypothesis would be „strong electrolytes are more soluble than weak electrolytes.
The above hypothesis is in the directional statement form but it requires evidence for the
relationship of these two variables reinforcement and personality.
4.4.4. Non-directional hypothesis
A hypothesis may be stated in the null form which is an assertion that no relationship or no
difference exists between or among the variables. This form null hypothesis is a statistical
hypothesis which is testable within the framework of probability theory. It is also a non-
directional form of hypothesis. H0 is used to represent absence of relationship between variables.
For example, from the example under section 4.4.2, which is represented by H, if the researcher
expects that there is no relationship between the variable, it will declared by H0, as follows
- Example :
H0: There is no change in solubility with change in pH of the system.

32
- Null hypothesis
Dear student, before reading the next portion, could you give a simple explanation for the
term null hypothesis?
A null hypothesis states that there is no significant difference between two or more parameters. It
is concerned with a judgment as to whether apparent differences are real differences or whether
they merely result from sampling error. The experimenter formulates a null hypothesis, a no
difference hypothesis. What he hypothesizes, is that any apparent difference between the mean
achievements of the two sample group at the end of the experiment is simply the result of
sampling error, as explained by the central limit theorem. If the difference between the mean
achievement of the experimental group and control group is too great to attribute to the normal
fluctuations that result from sampling error, he may refute or reject the null hypothesis, saying, in
effect, that it is not true that the apparent difference is merely the result of sampling error. These
means no longer behave as two random sample means from the same population. Something has
happened to, or affected, the experimental group in such a way that it behaves like a sample from
a different or changed population. Thus, the researcher may conclude the experimental treatment
not sampling error accounted for the difference in performance. The experimenter is using a
statistical test to discount chance or sampling error as a variable. If the difference between means
was not great enough to reject the null hypothesis, the researcher accepts it. He concludes that
there was no significant difference and that the sampling error probably‟ explained the apparent
difference.
A null hypothesis is accepted tentatively to stating that on the basis of evidence tested it could be
that there is no difference. If the null hypothesis is rejected, there is a difference but we do not
know the alternative or the differences. In this form of hypothesis, researcher has not to
anticipate or give the rationale for the declaration or directional form. Secondly, it does not make
researcher biased or prejudiced. He/she can be objective about the expected outcomes of the
research or findings. Actually, this is a form of hypothesis but is a statistical hypothesis, which is
self-explanatory null hypothesis means zero hypotheses. A researcher has not to do anything in
developing such form of hypothesis. In the process of reflective thinking research hypothesis is

33
second step whereas null hypothesis is fifth step of research process. In order to accommodate
the object of the inquiry for extracting this information, a null hypothesis is an appropriate form.
A null hypothesis does not necessarily reflect the expectations of the researcher so much as the
utility of the null form as the best fitted to the logic of chance in statistical knowledge or science.
A statistical hypothesis must be testable within the framework of probability theory. The theory
requires one or the other of two hypotheses forms: the „null‟ form and the „delta‟ form. The null
form is the no difference form i.e. there is no difference or relationship between or among
variables under certain conditions. The „delta‟ form for a test hypothesis is simply that A is
greater or lesser than B under conditions. Null hypothesis provides the basis of accepting or
rejecting the general hypothesis.
Null Hypothesis is a statistical hypothesis, which is used in analyzing the data. It assumes that
observed difference is attributable by sampling error and true difference is zero.
Null Hypothesis Programmed Method Lecture Method
Mean M1 M2
S.D 1 2
Size N1 N2
H0 (M1 = M2) or (M1 – M2 = 0)
The statistical tests of significance are used to accept and reject the null hypothesis. If it is
rejected, the general hypothesis is accepted. This class of hypothesis is known as null hypothesis
so-called because of it „nullifies‟ the positive argument of the findings or non-directional
statement of the generalization. This type of hypothesis is also termed as statistical hypothesis or
non-directional hypothesis or zero hypotheses because it denies the existence of any systematic
principles apart from the effect of chance. This hypothesis assumes that no or zero difference
exists between the two population means or the treatments.
H0 (µ1-µ2=0) or (µ1 = µ2)
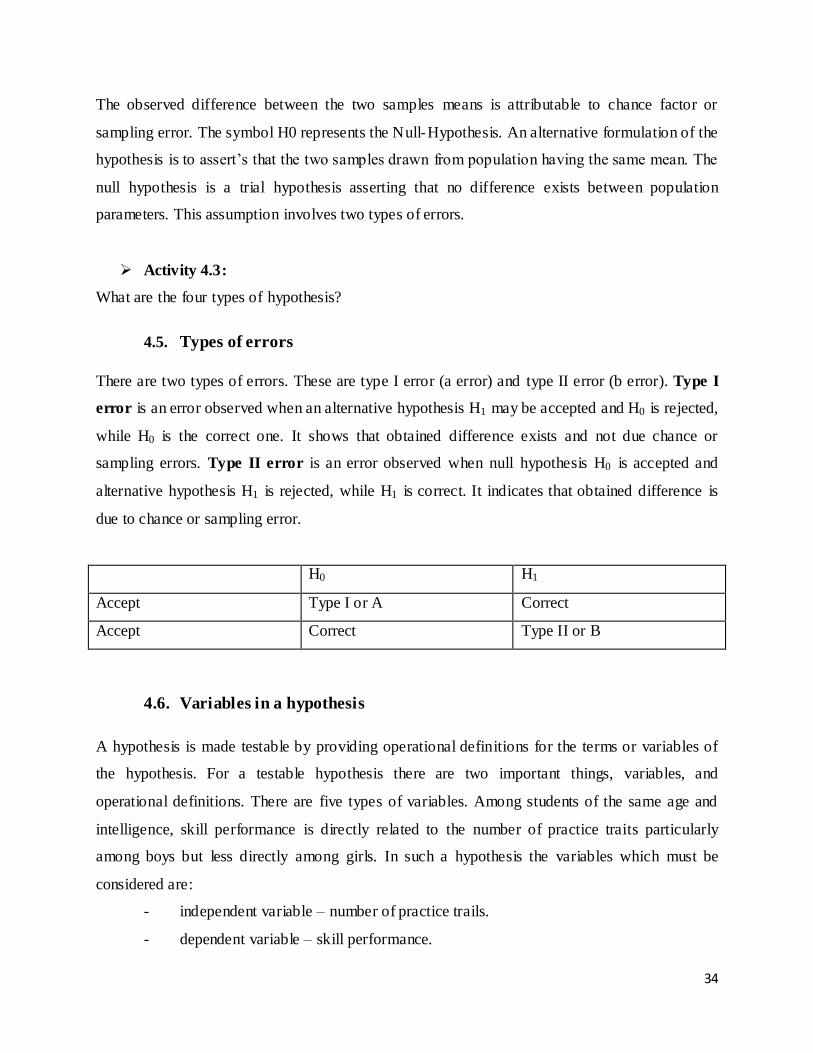
34
The observed difference between the two samples means is attributable to chance factor or
sampling error. The symbol H0 represents the Null-Hypothesis. An alternative formulation of the
hypothesis is to assert‟s that the two samples drawn from population having the same mean. The
null hypothesis is a trial hypothesis asserting that no difference exists between population
parameters. This assumption involves two types of errors.
Activity 4.3:
What are the four types of hypothesis?
4.5. Types of errors
There are two types of errors. These are type I error (a error) and type II error (b error). Type I
error is an error observed when an alternative hypothesis H1 may be accepted and H0 is rejected,
while H0 is the correct one. It shows that obtained difference exists and not due chance or
sampling errors. Type II error is an error observed when null hypothesis H0 is accepted and
alternative hypothesis H1 is rejected, while H1 is correct. It indicates that obtained difference is
due to chance or sampling error.
H0 H1
Accept Type I or A Correct
Accept Correct Type II or B
4.6. Variables in a hypothesis
A hypothesis is made testable by providing operational definitions for the terms or variables of
the hypothesis. For a testable hypothesis there are two important things, variables, and
operational definitions. There are five types of variables. Among students of the same age and
intelligence, skill performance is directly related to the number of practice traits particularly
among boys but less directly among girls. In such a hypothesis the variables which must be
considered are:
- independent variable – number of practice trails.
- dependent variable – skill performance.
35
- moderator variable – sex.
- control variable – age, intelligence.
- intervening variable – learning.
4.6.1. Independent variable
Independent variable is a stimulus variable or input operates either within a person or within
environment to affect the behavior. It is the factor which is measured, manipulated or selected by
the experimenter to determine its relationship to an observed phenomenon. If a researcher is
studying the relationship between two variables X and Y and if X is independent variable, then it
affects the variable Y, which is dependent. The characteristics of independent variables are,
- cause change in other variables.
- interesting only it affects the other variable, not in what affects it.
4.6.2. Dependent variable
The dependent variable is response variable or output. It is an observed aspect of the behavior of
an organism that has been stimulated. The dependent variable is the factor which is observed and
measured to determine the effect of the independent variables. It is the variable that will change
as a result of variations in the independent variable. It is considered dependent because its value
depends upon the value of the independent variable. It represents the consequence of change in
the parson or situation studied.
- Relationship between independent and dependent Variables
Most experiments involve many variables when two continuous variables are compared, as in
correlation studies, deciding which variable to call independent and which dependent is
sometimes arbitrary. In such cases variables are often not labeled as independent or dependent
since there is no real distinction. Independent variables may be called factor and their variation
may be called levels.
4.6.3. Moderator variable
The term moderator variable describes a special type of independent variable. A secondary
independent variable selected for study to determine if it affects the relationship between the

36
primary independent variable and the dependent variable. The moderator variable is defined as
that factor which is measured, manipulated or selected by the experimenter to discover whether it
modifies the relationship of independent variable to an observed phenomenon. The sex and rural
urban generally function as moderator variables.
4.6.4. Control variable
All the variables in a situation cannot be studied at the same time, some must be neutralized to
guarantee that they will not have a differential or moderating effect on the relationship between
the independent and dependent variables. These variables whose effects must be neutralized or
controlled are known as control variables. They are defined as those factors which are controlled
by experimenter to cancel out or neutralize any effect they might otherwise have on the observed
phenomena. While the effects of the control variables are neutralized, the effect of moderator
variables is studied. Certain variables appear repeatedly as control variables, although they
occasionally serve as moderator variables. For example sex, intelligence and socio-economic
status are three subject variables that are commonly controlled, noise, task order and task content
are common control variables in the situation.
4.6.5. Intervening variable
The experimenter can manipulate the independent, moderator, and control variable. Each
variation can be observed by him as it affects the dependent variable. Often these variables are
not concrete but hypothetical, the relationship between a hypothetical underlying or intervening
variable and dependent variable. An intervening variable is that factor which affects the observed
phenomenon but cannot be seen and measured or manipulated, its effect must be inferred from
the effects of the Independent and moderator variables on the observed phenomena. The attitude,
learning process, habit and interest function as Intervening variables.
Activity 4.4:
What are dependent variables?

37
4.7. Sources of hypotheses
Dear student, what sources being used to developed hypothesis?
Hypotheses are originated from essentially the same background that serves to reveal problem.
These sources are namely theoretical background, knowledge, insight and imagination that come
from instructional program and wide reading experiences, familiarity with existing practices. The
major sources of hypotheses are,
- specialization on the area
- reading: published studies, abstracts research journals, hand books, seminars on the
issue, current trends on the research area.
- instructional programs persuaded.
- analysis of the area studied.
- considering existing practices and needs.
- extension of the investigation.
- offshoots of research studies in the field.
Researcher employs these sources for formulating hypotheses of his investigation. He has to use
two logical processes to drawn upon in developing a hypothesis. The processes are known as
deductive thinking and inductive thinking. Deduction is a process which goes from the general
to the specific. When general expectations about problems or events based on presumed
relationships between variables are used to arrive at more specific expectations, the process is
called deduction. Induction is a process which goes from the specific to the general: In the
induction process researcher starts with specific observations and combines them to produce a
more general statement of relationship namely a hypothesis. Many researchers begin by
searching the literature for relevant specific findings in order to induce a hypothesis, and other
often run a series of exploratory studies before attempting to induce a hypothesis. Induction
begins with data and observations or empirical events and proceeds toward hypothesis and
theories.

38
4.8. Formulating hypothesis
From any problem statement, it is generally possible to derive more than one hypothesis. There
are three simple hypotheses generated from this problem to determine, “the effect of” massive,
positive, verbal rewards on the reading achievement of children.” At first glance, these three
hypotheses might be offered rewarded:
- increases reading achievement.
- decreases reading achievement.
- has no effect on reading achievement.
Evidence has already been obtained in the laboratory to support the hypothesis (A) rewards
increase performance. However, upon closer examination, the primary purpose of this study is to
process for the formulation of theories determines whether the enhancing effect of rewards can
be incorporated into a class-room setting to facilitate children‟s learning to read. This theory is
based on the assumption that the „law‟ of learning should apply in classroom. If perhaps more
subtly than in a laboratory and on the laboratory findings that support the assumed relationship
between reward and performance, the logical conclusion would be that rewards would have a
demonstrable enhancing effect on classroom performance. This conclusion is based on the first
assumption arrived at deductively and the second arrived at inductively. Both induction and
deduction are needed to choose among the possibilities. Many theories, both psychological and
educational deal with stabilization (and rigidifying) of behavior patterns as a function of their
use.
Researchers formulate hypotheses using induction and deduction, one of the goals of researcher
is to produce that piece for generalizable bodies of theory which will provide answers to
practical problems. Hypothesis construction and testing enable researchers to generalize their
findings beyond the specific conditions which they were obtained. Since a hypothesis is a
formulation of anticipated findings, students are advised to develop a hypothesis as a means of
demonstrating the basis for their study to themselves and their reader. The task of introducing a
study and discussing the findings are facilitated by existence of a hypothesis.
Activity 4.5:
Mention some of the sources to develop hypothesis.

39
4.9. Fundamental bases of hypothesis
The researcher deals with reality on two levels, the operational and conceptual level. On the
operational level, researcher must define events in observable terms in order to operate with the
reality necessary to do researches. On the conceptual level she/he must define events in terms of
underlying communality (usually causal) with other events. Defining at a conceptual level, the
researcher can abstract from single specific instance to general dues and thus, begin to
understand how phenomena operate and variables interrelate. The formulation of a hypothesis
frequently requires going from the operational or concrete level to the conceptual or abstract
level. It is this movement to the conceptual level which enables that the result to be generalized
beyond the specific conditions of a particular study and thus to be of wider applicability.
Research requires the ability to move from the operational to the conceptual level and vice-versa.
This ability is required not only in constructing experiments but also in applying their findings as
well. Consider a hypothetical study in which programmed instruction is being compared to
traditional instruction. The terms „Programmed Instruction” and “Traditional Instruction” are
operational term; these operational terms should be examined for underlying conceptual
similarities and differences. This process of making conceptual contrasts between operational
programs is called conceptualization or dimentionalization. Moving from the operational to the
conceptual level and vice-versa is a critical ingredient of the research to demonstration process.
- Difficulties in the formation of useful Hypothesis
The following are the difficulties in the formation of hypothesis:
- absence of knowledge of a clear theoretical framework.
- lack of ability to make use of the theoretical framework logically.
- lack of acquaintance with available research technique resulting in failure to be able to
phrase the hypothesis properly.
4.10. Testing the hypothesis
The evidence of the work of hypothesis lies in its abilities to meet test of its validity. The
purpose of testing a hypothesis is to determine the probability that it is supported by fact.

40
Hypothesis is a general expectation about the relationship between variables. There is an
extremely large number of instances under which it can be tested, and it would be impractical to
attempt to gain support in all of these instances. Validity of a hypothesis is established in two
stages:
1. The statement of hypothesis allows the investigator to develop deduction and certain
implications which when stated in operational terms can lead to reject ion of hypothesis that
are in conflict with accepted knowledge at the logical level. For example a hypothesis which
says, for instance, that nondirective teachers are more effective than directive teachers would
have to be tested for many groups of teachers, in many subjects and many settings, and with
many criteria before it could be accepted. If, on the basis of limited testing the hypothesis
fails to yield confirming results, then it would be fair to reject it.
2. If a hypothesis passes the test of logic, it then must be subjected to an empirical test, perhaps
through an experiment or a series of measurement. The hypothesis that boys are stronger or
taller than girls, for example, can be verified through measurements. A hypothesis is never
proved it is merely sustained or rejected. If it fails to meet the test of its validity, it must be
modified or rejected.
The confirmation of a hypothesis, on the other hand, is always, tentative and relative, subject to
later revision and even rejection as further evidence appears or as more adequate hypotheses is
introduced. The form of the hypotheses to be tested can be very controversial. The null form‟ is
probably preferred by most experienced research personnel. The null hypothesis states that there
is no difference between two groups or treatments. It is generally used to spell out what would be
the case if the null hypotheses were true. The no difference statement assumes that the two
groups will be tested and found to be equal.
4.11. The role of hypothesis
Dear student, what do you think about the role of hypothesis in scientific investigation?
The hypothesis is the basis of a scientific investigation education. It is the pivot of the research
process. All the research activities are oriented towards the verification of the hypotheses. Apart

41
from this role it has a significant role in the formulation of theory, principles and laws. It is also
known as tentative theory, after verification it takes the shape of final theory. A theory embers
new hypotheses, these are subjected to verification, after the verification it becomes a new theory
in field studies.
The hypotheses play significant role in the scientific studies. The following are some of the
important roles of a hypothesis
The purpose of stating hypothesis, like the purpose of theories that may be involved, is to
provide a framework for the research procedure and methodology.
A research project needs to proceed from a statement of hypotheses. Such hypotheses are
not ends in themselves but rather aids to the research process.
A hypothesis takes on some characteristics of a theory which is usually considered as a
larger set of generalization about a certain phenomenon.
The verification of a hypothesis does not prove or disprove it; it merely sustains or
refutes the hypotheses.
The hypotheses may imply research procedures to be used and necessary data to be
organized.
Such hypotheses are not ends in themselves but rather aids to the research process.
The conclusions of the research problem may also be stated in the context of the initial
hypotheses.
The stating hypotheses in experimental research provide the basis for designing the
experiment and collecting evidences empirically for its verification so as to formulate
new theory in field of education.
The hypothesis orients the research process for its verification rather than finding out the
solution of the problem.

42
4.12. Self-test exercise
I. Choose the letter of the correct answer
1. A name given to those, which makes hypothesis to be testable is _____________.
2. A type of hypothesis, which states about absence of differences between two treatments,
is called ____________________.
3. A special type of independent variable, which is selected by the researcher to modify the
relationship between independent variable and dependent variable is _______________.
4. In some situations, it is difficult to decide which variable is independent and which the
other is dependent. The one, which tend as independent is called___________________.
II. Give an explanation for the following questions
1. Explain the term „Hypothesis‟.
2. Explain the nature and functions of a hypothesis in a research process.
3. Explain the reason why researchers prefer non-directional hypotheses.
4. Mention the types of variables included in stating a hypothesis.
5. Differentiate between research hypotheses and null hypotheses and illustrate your answer
with suitable examples.
43
CHAPTER FIVE
Designing a research and sampling
Objectives:
After completing of the chapter the student able to:
discuss about meaning of research planning and sampling
learn about different sampling techniques
explain about population and samples
identify different sampling techniques
5.1. Meaning of research design
Research design is a choice of an investigator about the components of his project and
development of certain components of the design. A design of research does not consist of an
ordered sequential procedure. It is a planning stage of research which is usually made logically
visualizing its practicability. The selection of research components is done keeping in view of
the objectives of the research. Research hypotheses also provide the basis for designing a
research work. A research design includes the following components:
- research method or research strategy.
- sampling design.
- choice of research tools and
- choice of statistical techniques.
Whether the design of research is good or not, it is judged by standards such as the degree of
accuracy attainable on the level of relevant evidence sought. Above all, a good research design
must be practical. The review of the literature and related research reports are set as an important
component of design. Also the classification and development of the classes of inquiry and their
models are offered as major aspects of research design. Designing of research may be described
as a mapping, because the research design components tend to fit into three distinct but
interrelated parts.

44
Kerlinger asserts that research design has two basic purposes,
- to provide answers to research questions, and
- to control the variance.
A research design components and proposals should be given an adequate attention to each
appropriate and applicable design components.
5.2. Definition of research design
Reduced to the simplest of terms, research design is a mapping strategy. It is essentially a
statement of the object of the inquiry and the strategies for collecting the evidences, analyzing
the evidences and reporting the findings. It should be made clear that the design components are
in part mandatory and in part choices made by the researcher. The object of the inquiry often
determines the class of inquiry or model to be utilized, so too, the model or class of inquiry
determines the consideration and development of certain of the design components. In fact, it is
essentially the variation in some of the design components that differentiates among the classes
of inquiry.
5.3. Characteristics of good research design
Dear student, what kinds of characteristics you expect to be a good research design?
In a general sense we could answer the question (what makes for good research design)? With
such statements as the design should be appropriate for the hypotheses or the design should be
feasible within the limits of available resources. A good research design should be from bias and
confounding effect.
A good research design eliminates confounding of variables or kept it to a minimum so the
results can be interpreted separately. There should be a statistical precision. The hypotheses can
be tested by employing most appropriate statistical technique. There should be enough scope to
impose the control over the situation. Basically, there are four ways by which control can be
enhanced. These are performed through:
- method of randomization.
- holding conditions or factors constant.

45
- building conditions or factors into the design as independent variables.
- statistical adjustment.
Activity 5.1:
What is the meaning of research design?
5.4. Problems in research design
There are several difficulties which make poor research design. Among theses the following can
be mentioned.
- Inadequately stating and testing hypotheses.
- Missing or unusable data.
- Bias in sampling.
- Inadequate measurement.
- Lack of precision in statistical technique or inappropriate statistical devices.
Research methodology involves the systematic procedures by which the researcher starts from
the initial identification of the problem to its final conclusions. The role of the methodology is to
carry on the research work in a scientific and valid manner. The method of research provides the
tools and techniques by which the research problem is attacked. The methodology consists of
procedures and techniques for conducting a study. Research procedures are of little value unless
they are used properly.
5.5. Shaping methodology of educational research
Webster has defined methodology as “the science of method or arrangement” which is not a
particularly useful definition. Method is defined as orderliness and regularly or habitual practice
of them in action. “By placing stress on „arrangement‟, orderliness regularity and habitual
practice the methodologies derive their substance essentially from the classically ideal controlled
experiment which permeates rightly or otherwise. In the literature of educational research, the
methodology means with reference to research that it is a type of inquiry. Suitability as a
criterion for consideration of a type of inquiry is like that of utility but suitability of educational
research methodology requires two conditions, internal validity (control), and external validity
(sampling).

46
Kish referred to internal validity as control and to external validity as representation of sample.
Thus, internal validity (control) is the condition which permits blaming the independent
information variable for the findings or being certain that the observation was produced by the
information variable. External validity (sampling or representation) is a condition permitting the
generalization or inference for the findings to the population from which the sample was drawn.
The crucial issue of social studies research design, it is difficult to design a research project that
meets both of these conditions. The classical ideal controlled experiment is endowed with both
of these attributes. However, in education the controlled experiment will te nd to be strong on
internal validity and less strong on representation (external validity). There is visually no claim
to external validity in more control observation.
At this risk of over simplification, the investigation may be described as possessing less control
concern than does the study and even less of a claim to external validity. The choice of this type
of inquiry depends, in part, on the attainability of control and/or representation with a given
research project and in part, on the relative need for control and/or representativeness. The other
type of inquiry is „action research‟. Control or internal validity and representativeness or external
validity are desirable conditions. However, „action research‟ is a flexible methodology and the
conditions of control and/or representativeness are special applications. Thus, they are discussed
as they are individually applied.
5.6. Meaning of sampling
Sampling is indispensable technique of behavioral research. The research work cannot be
undertaken without use of sampling. The study of the total population is not possible and it is
also impracticable. The practical limitation like cost, time and other factors which are usually
operative in the situation stand in the way of studying the total population. The concept of
sampling has been introduced with a view to making the research findings economical and
accurate.
The research design is based on the sampling of the study. A good research design provides
information concerning with the selection of the sample population treatments and controls to be

47
imposed. Generalizability of the research findings is, of course, dependent upon the sampling
procedures followed. An ideally either a representative or random sample would be desirable to
provide maximum information about the generalizability of research data. W.G. Cocharn defined
the term sampling as “In every branch of science we lack the resources, to study more than a
fragment of the phenomena that might advance our knowledge.” In this definition a „fragment‟ is
the sample and „phenomena‟ is the population. The sample observations are applied to the
phenomena i.e. generalization. „Sampling design‟ in fact means the joint procedure of selection
and estimation. In fact sampling is the part of the strategy of research and has by now acquired
the status of technical job. In physical sciences there is no problem of sampling, any fragment or
piece of a phenomena is the true representative, therefore, the generalization based on the sample
is true. But in behavioral and social sciences sampling is the crucial problem to have a
representative sample. Sampling means selection of individuals from the population in such a
way that every individual has the equal chance to be taken into the sample population.
Activity 5.2:
How could you define the term sampling?
5.7. Functions of population and sampling
Dear student, what is your idea about population and sample?
Research work is guided by inductive thinking. The researcher proceeds from specificity to
generality. The sample observation is the specific situation which is applied to the population, it
is the general situation. The sampling is the fundamental to all the statistical techniques and
statistical analysis. The measures of a sample are known as statistics and measures of a
population are termed as parameters. Mean, Standard deviation and coefficient of correlation of
sample observations are known statistics and are called parameters. Generally parameters are
estimated on the basis of sample statistics. The accuracy of the parameters depends on sample
representativeness or statistics. In research work generalization is made by estimating parameters
on the basis of sample statistics.

48
5.7.1. Randomization
Randomization is a method of sampling in which each individual of the population has equal
chance or probability to be selected for constituting a sample. The choice of one individual is in
no way tied with other. The individuals of a sample are independently drawn from the
population. All members of the population have essentially the same probability of being
selected. The following are the main characteristics of randomization:
- each individual of the population has equal chance of being picked up into the sample.
- one individual does not effect in selection of the other. There is no tie with one another.
- it is free from subjective factor or personal error or bias and prejudices or imagination of
the investigator.
- it ensures that the sample formed by this method. may be representative of the
population.
The main methods in randomization are:
- lottery method of randomization.
- tossing a coin (head or tail) method.
- throwing a dice.
- blind folded method.
- random tables (tiptt‟s table of randomization).
The randomization can be done by employing either of the methods for selecting sample subjects
from the population. Generally random tables are used for constituting a sample in educational
research.
Activity 5.3:
What makes randomization unique in selection of sample?
5.8. Types of sampling designs
Several methods have been devised to select representative samples. In general, two types of
techniques of sampling are used.

49
5.8.1. Probability Sampling
Dear student, before reading the next section, what is your opinion about probability sampling
Method of sampling which gives the probability that our sample is representative of population is
known as probability sampling. A Probability sample is one that has been selected in such a way
that every element chosen has a known probability of being included. Generally probability
sampling is used in fundamental research. There are two laws of probability sampling are:
- law of statistical regularity, and
- law of inertia of large Sample.
Law of statistical regularity
This law involves the probability principle. A small sample may be good representative of the
population, if the subjects of sample are selected at random. The conclusions drawn from the
sample may be generalized for the population. The sample „statistics‟ are the estimates of the
population parameters. The parametric test of significance can be used for this purpose.
Law of inertia of large sample
It is the corollary of the first law. A large sample is more stable or good representative as
compared with small sample. The sample error (SE) is inversely in proportion to the size of
sample. It can be shown with the help of the following formula:
SEM = σ/√n
Where, SEM is Sample error mean, σ = standard deviation of the population and
n is size of the sample
If n size of the sample increases the sampling error or standard error of the mean decrease and if
it tends to infinity, the sampling error will be zero.
SEM = σ/√α = 0
Therefore, parametric tests are used for inferential purpose.
50
5.8.1.1. Characteristics of probability sampling
The main characteristics of probability sampling are:
- In probability sampling we refer from the sample as well as the population.
- every individual of the population has equal probability to be taken into the sample.
- Probability sample may be representative of the population.
- the observations (data) of the probability sample are used for the inferential purpose.
- Inferential or parametric statistics are used for probability sample.
- there is a risk for drawing conclusions from probability sample.
- the probability is comprehensive.
Activity 5.4:
In which type of research probability sampling is more appropriate?
5.8.1.2. Techniques of probability sampling
There are a number of techniques of taking probability sample. But here only six important
techniques have been discussed as follows:
Simple random sampling
A simple random sample is one in which each element of the population has an equal and
independent chance of being included in the sample i.e. a sample selected by randomization
method is known as simple-random sample and this technique is simple random-sampling.
Advantages of simple random sampling
- It requires a minimum knowledge of population.
- It is free from subjectivity and free from personal error.
- It provides appropriate data for our purpose.
- The observations of the sample can be used for inferential purpose.
Disadvantages of simple random sampling
The representativeness of a sample cannot be ensured by this method.

51
This method does not use the knowledge about the population.
The inferential accuracy of the finding depends upon the size of the sample.
Systematic sampling
Systematic sampling is an improvement over the simple random sampling. This method requires
the complete information about the population. There should be a list of information‟s of all the
individuals of the population in any systematic way. Now we decide the size of the sample.
Let sample size = n and population size = N
Now we select each N/nth individual from the list and thus we have the desired size of sample
which is known as systematic sample. Thus for this technique of sampling population should be
arranged in any systematic way.
Advantages of systematic sampling
- This is a simple method of selecting a sample.
- It reduces the field cost.
- Inferential statistics may be used.
- Sample may be comprehensive and representative of population.
- Observations of the sample may be used for drawing conclusions and
generalizations.
Disadvantages of systematic sampling
- This is not free from error, since there is subjectivity due to different ways of
systematic list by different individuals. Knowledge of population is essential.
- Information of each individual is essential.
- This method can‟t ensure the representativeness.
- There is a risk in drawing conclusions from the observations of the sample.
Stratified sampling
When employing this technique, the researcher divides his population in strata on the basis of
some characteristics and from each of these smaller homogeneous groups (strata) draws at
random a predetermined number of units. Researcher should choose that characteristic or

52
criterion which seems to be more relevant in his research work. There are three types of stratified
sampling.
- Disproportionate sampling
It means that the size of the sample in each unit is not proportionate to the size of the unit but
depends upon considerations involving personal judgment and convenience. This method of
sampling is more effective for comparing strata which have different error possibilities. It is less
efficient for determining population characteristics.
- Proportionate sampling
It refers to the selection from each sampling unit of a sample that is proportionate to the size of
the unit. Advantages of this procedure include representativeness with respect to variables used
as the basis of classifying categories and increased chances of being able to make comparisons
between strata. Lack of information on proportion of the population in each category and faulty
classification may be listed as disadvantages of this method.
- Optimum allocation stratified sampling
It is representative as well as comprehensive than other stratified samples. It refers to selecting
units from each stratum should be in proportion to the corresponding stratum the population.
Thus sample obtained is known as optimum allocation stratified sample.
Advantages of stratified sampling
- It is a good representative of the population.
- It is an improvement over the earlier.
- It is an objective method of sampling.
- Observations can be used for inferential purpose.
Disadvantages of stratified sampling
- It is difficult for the researcher to decide the relevant criterion for stratification.
- Only one criterion can be used for stratification, but it generally seems more than
one criterion relevant for stratification.
- It is costly and time consuming method.

53
- Selected sample may be representative with reference to the used criterion but not
for the other.
Repetitive sampling
Generally this is not a new method but only a new application of the samplings we discussed
above. This is most frequently used for establishing the reliability of a sample. When employing
a mailed questionnaire, double sampling is sometimes used to obtain a „more representative
sample. This is done because some randomly selected subjects who are sent questionnaires may
not return them. Obviously, the missing data will bias the result of the study, if the people who
fail to reply the‟ query d iffer in some fundamental way from the others in respect to the
phenomena being studied. To eliminate this bias, a second sample may be drawn at random from
the non-respondents and the people interviewed to obtain the desired information. Thus this
technique is also known as repeated or multiple sampling. This double sampling technique
enables one to check on the reliability of the information obtained from the first sample. Thus,
double sampling, wherein one sample is analyzed, and information obtained is used to draw the
next sample to examine the problem further.
Advantages of repetitive sampling
- This sampling procedure leads to the inferences of free determine precision based
on a number of observations.
- This technique of sampling reduces the error.
- This method maintains the procedure of the finding evaluate the reliability of the
sample.
Disadvantages of repetitive sampling
- This technique of sampling cannot be used for a large sample.
- This technique is time consuming, costly, and requires more competition.
- Planning and administration is more complicated.

54
Multi-stage sampling
This sample is more comprehensive and representative of the population. In this type of
sampling primary sample units are inclusive groups and secondary units are sub-groups within
these ultimate units to be selected which belong to one and only one group. Stages of a
population are usually available within a group or population, whenever stratification is done by
the researcher. The Individuals are selected from different stages for constituting the multi-stage
sampling.
Advantages of multi-stage sampling
- It is a good representative of the population.
- Multi-stage sampling is an improvement over the earlier methods.
- It is an objective procedure of sampling.
- The observations from multi-stage sample may be used for inferential purpose.
Disadvantages of multi-stage sampling
- It is a difficult and complex method of samplings.
- It involves errors when we consider the primary and secondary stages.
- It is again a subjective phenomenon.
Cluster sampling
To select the intact group as a whole is known as a cluster sampling. In cluster sampling the
sample units contain groups of elements (clusters) instead of individual members or items in the
population. Rather than listing all elementary school children in a given city and randomly
selecting 15 per cent of these students for the sample, a researcher lists all of the elementary
schools in the city, selects at random 15 per cent of these clusters of units, and uses all of the
children in the selected schools as the sample.
Advantages of cluster sampling
- It may be a good representative of the population.
- It is an easy method.
- It is an economical method.

55
- It is practicable and highly applicable in education.
- Observations can be used for inferential purpose.
Disadvantages of cluster sampling
- Cluster sampling is not free from error.
- It is not comprehensive.
Activity 5.5:
What is the advantage of disproportionate sampling?
5.8.2. Non-probability sampling
If there is no such idea of probability then the method of sampling is known as non-probability
sampling. Non-probability is also known as non-parametric sampling which are used for certain
purpose.
5.8.2.1. Characteristics of non-probability sampling
The main characteristics of non-probability sampling are:
- There is no idea of population in non-probability sampling.
- There is no probability of selecting any individual.
- Non-probability sample has free distribution.
- The observations of non-probability sample are not used for generalization purpose.
- Non-parametric or non-inferential statistics are used in non-probability sample.
- There is no risk for drawing conclusions from non-probability sample.
Types of non-probability sampling:
There are the following four types of non-probability sample:
- Incidental or accidental sample.
- Purposive sample.
- Quota sample and
- Judgment sample.

56
Incidental assignment
The term incidental or accidental applied to those samples that are taken because they are most
frequently available, i.e. this refers to groups which are used as samples of a population because
they are readily available or because the researcher is unable to employ more acceptable
sampling methods.
Advantages of incidental assignment
- It is very easy method of sampling.
- It is frequently used in behavioral sciences.
- It reduces the time, money and energy i.e. it is an economical method.
Disadvantages of incidental assignment
- It is not a representative of the population.
- It is not free from error.
- Parametric statistics cannot be used.
Judgment sampling
This involves the selection of a group from the population on the basis of available information
thought. The selection of a group is by intuition on the basis of criterion deemed to be self-
evident. Generally investigator should take the judgment carefully unless, this sampling is highly
risky.
Advantages of judgment sampling
- Knowledge of the investigator can be best used in this technique of sampling.
- This technique of sampling is also economical.
Disadvantages of judgment sampling
- This technique is objective.
- It is not free from error.
- It includes uncontrolled variation.

57
- Inferential statistics cannot be used for the observations of this sampling, as a result
generalization is not possible.
Purposive sampling
The purposive sampling is selected by some arbitrary method because it is known to be
representative of the total population. The idea is to pick out the sample in relation to some
criterion, which is considered important for the particular study. This method is appropriate
when the study places special emphasis upon the control of certain specific variables.
Advantages of purposive sampling
- Uses of the best available knowledge concerning the sample subjects.
- Better control of significant variables is possible.
- Sample groups data can be easily matched.
- Homogeneity of subjects can be used in the sample.
Disadvantages of purposive sampling
- Reliability of the criterion is questionable.
- Knowledge of population is essential.
- Errors in classifying sampling subjects.
- Inability to utilize the inferential parametric statistics.
- Inability to make generalization concerning total population.
Quota sampling
This combined both judgment sampling and probability sampling. On the basis of judgment or
assumption or the previous knowledge, the population is classified into several categories and
the proportion of population falling into each category is decided. Thereafter a quota of cases to
be drawn is fixed and the observer is allowed to sample out. Quota sampling is very arbitrary and
likely to figure in municipal survey
Advantages of quota sampling
- It is an improvement over the judgment sampling.

58
- It is an easy sampling technique.
- It is most frequently used in social surveys.
Disadvantages of quota sampling
- It is not a representative sample.
- It is not free from error.
- It has the influence of regional geographical and social factors.
Since research design is a plan by which research samples may be selected from a population and
under which experimental treatments are administered and controlled, their effect upon the
sample may be measured. Therefore, a second step in the establishment of an experimental
design is to select the treatments that will be used to control sources of learning change in the
sample subjects.
5.9. Characteristics of a good sample
The main characteristics of a good sample:
- is the true representative of the population corresponding to its properties.
- is free from bias, the sample does not permit prejudices the learning and preconception,
imaginations of the investigator to influence its choice.
- is an objective one, it refers objectivity in selecting procedure or absence of subjective
elements from the situation.
- maintains accuracy, it yields an accurate statistics and does not involve errors.
- is comprehensive in nature. This feature of a sample is closely linked with true-
representativeness. Comprehensiveness is a quality of a sample which is controlled by
specific purpose of the investigation.
- is economical from energy, time and money point of view.
- makes the research work more feasible.
- has the practicability for research situation.
5.10. Size of sample
Dear student, what do you think about size of sample taken for investigation?
59
One of the first questions that the researcher typically asks, concerns with the number of subjects
that need to be included in his sample. Technically, the size of the sample depends upon the
precision the researcher desires in estimating the population parameter at a particular confidence
level. There is no single rule that can be used to determine sample size. The best answer to the
question of size is to use as large a sample as possible. A larger sample is much more likely to be
representative of the population. Furthermore with a large sample the data are likely to be more
accurate and precise. It was pointed out in that the larger the sample, the smaller the standard
error.
In general, the standard error of a sample mean is inversely proportional to the square root of n.
Thus, in order to double the precision of one‟s estimation, the sample size would need to be
quadrupled. It is often suggested that one should include at least 30 subjects in a sample since
this number permits the use of large sample statistics. Statistically speaking, a sample n = 30 is
considered large, since with this n, the t-distribution and the normal curve are practically the
same for hypothesis testing purposes. In experimental research, one should select a sample that
will permit at least 30 in each group. Descriptive research typically uses larger samples; it is
sometimes suggested that one should select 10-20 per cent of the accessible population for the
sample.
How to determine the size of sample in a research?
It is the crucial problem for the research scholars to determine the size of sample. In an
experimental study, it is essential to equate the control and experimental groups, but in survey
study sample should be representative of population. Therefore, size of sample is an important
aspect for the representativeness. It is a common belief that the precision of data is determined
primarily by the size of the sample, rather than by the percentage of the population represented in
the sample. The term „large sample‟ is vague, it varies with nature of study. The exact procedure
by which to determine the sample size required varies with the nature of the variable and its
sampling distribution. The basic procedure can be illustrated in connection with the mean of
random samples based on normal probability distribution. The chances are 95 to 5 that a sample
in separated sampling will fall within the interval M ± 1.96 SEM.

60
The next question is the degree of accuracy required. Generally 95 to 99 per cent confidence
intervals are acceptable i.e. 5 to 1 per cent error. If the variable of the study is the intelligence
and the sampling errors were kept within 5 per cent at the 95 per cent confidence level. The
investigator can use the formula for the standard error of the mean to provide the required size of
sample.
1.96 SEM = 5,
1.96 σ/√n= 5
Where: σ = Standard deviation of the population
n = Size of the sample
5 is percent of sampling error
In this illustration I.Q. distribution s = 16
√ n=1.96× 16/5=9.30
n = 96
If the investigator wants more precise, the sampling error is kept within 1 per cent at the 99 per
cent confidence level. The following formula is used for determining the size of sample:
2.58 SEM = 1; 2.58 σ/√n=1
2.58 × 16 = √n √n = 41.28
n =16
Thus, he would need a sample of 96 cases in order to meet the conditions of 5 per cent error at 95
per cent confidence level. He would require a sample 1681 case for 1 per cent error at the 99 per
cent confidence level. Generally in behavioral research more than one variable are taken into a
study. In such situation he should consider standard deviations of the distributions of the
variables. The highest standard deviation is to be considered for calculating the size of the
sample. In this way a researcher can determine the exact size of sample indicating the sampling
error in per cent. He should not use an arbitrary criterion for determining the size of his sample.
5.11. Representatives of the sample
When the various samples can be considered as representative of the population and universe,
completing the sample cycle by applying findings and generalization to the population and
universe makes sense in one set of circumstances. But as the sample cycle is intended to
illustrate and emphasize, representativeness is a securing concern throughout the sample process.

61
When we identify the universe of relevance for our respondents and research problem and select
the population, we face the first representative question, can the population be considered
representative of the universe? If it can move on to identify and select the invited sample, and
from this derive the accepting sample. The next section discuss briefly about representativeness
of a sample.
5.11.1. Identifying a representative sample
The representative issue comes to the four first in the identification of the population within the
universe. For every research problem there is one completely relevant universe, but any number
of population. For example, for a study concerned with the relative teaching ability of liberal acts
of graduates and school of education graduates, the obvious universe of relevance is all liberal
acts and education graduates functioning as a teacher who graduates two year prior to the date at
which the study will collect its data. But clearly no researcher will have access to this universe.
Next step in the sampling cycle is the identification of the invited sample at this stage we can
seek to guarantee that the invited sample is representative of the population on selected
characteristics. In doing so we must consider two different aspects of representativeness,
assuring that all significant aspects of characteristics are represented in the sample, and assuring
that each aspect is of the same proportion of the sample as it is of the population.
Assuring that all significant aspects of a characteristic are represented in the sample is achieved
through a process called stratification. This involves in dividing the population into sub-groups
or strata on the basis of the characteristics for which we seek representativeness and creating our
sample by separate selections for each stratum. In summary, it might be repeated that there is no
best sampling design. Validity of sample data, like validity of all data, is a specific concept to be
evaluated from the standpoint of the specific case. It is, therefore, difficult to generalize.
Nevertheless, it is generally true that the aspect of sampling to which investigators of educational
problems might most profitably devote their attention is minimizing possible bias rather than
devising complicated design.
Activity 5.6:
How is possible to assure that all the required characteristic is represented in the sample or not?

62
5.12. Self-test exercise
I. Fill the blank space with appropriate terms
1. A method of sampling, which each individual of the population has equal chance or
probability to be selected ______________________.
2. A type of probability sampling which involves the selection of a group from the
population on the basis of available information thought is __________________.
3. Among experimental methods, a suitable sampling method is____________________.
4. The choice of one individual with no way tied with other one is ____________________.
II. Give an explanation for the following questions
1. Explain the term research design.
2. Differentiate between research methodology and research design.
3. Mention the characteristics of good research design and indicate potential problems in
preparing a research design.
4. Explain the term „sampling‟, differentiate between sample and population, and illustrate
your answer with examples.
5. Distinguish between probability sampling and non-probability sampling.
6. Indicate the methods of randomization and their advantages and limitations.

63
CHAPTER SIX
Methods of research
Objectives:
After completion this chapter the student should able to
explain about research methods
know about different research methods
know the meaning of scientific method
identify variables
Research has threefold objective, theoretical, factual and application. These objectives are
achieved by employing different methods and strategies of research. A research scholar should
know the meaning of the term method and strategy of research.
6.1. Definition of methods of research
Dear student before reading the following material, what is your understanding about
methods of research?
Method is a style of conducting a research work which is determined by the nature of the
problem. M.Verma has defined the term method as “Method is only in the abstract as logical
entities that we can distinguish between matter and methods, in reality, they form an organic
whole and matter determines method analogously as objective determines means, content and
spirit determine style and form in literature.” M. Verma has presented broad meaning of the term
method. According to him matter is important for determining method. The common types of
matter may be three types;
- Theoretical problem – survey, experimental method.
- Factual problem – historical, case study and genetic methods.
- Application problem – action research.
64
The term method covers both strategy and tactics of teaching and involves the choice of what is
to be taught, and the order in which it is to be taught. Method is more general, it includes
techniques. The research techniques are ways of implementing a method. Different techniques
may be employed within the same method. Webster defined methodology as “the science of
method or arrangement” which is not a particularly useful definition. Method is defined as
“orderliness and regularity or habitual practice of them in action”. By placing stress on
“arrangement”, orderliness, regularity and habitual practice, the methodologies derive their
substance essentially from the classically ideal controlled experiment which permeates rightly or
otherwise, the literature of educational research. The methodology means with reference to
research that it is a type of inquiry.
6.2. Scientific method
The scientific method is a general set of procedures or steps through which the systematic
approach is developed. The scientific method and systematic approach are synonymous. It is a
more specific research process. A series of steps are used in the scientific method of research.
The initial step of the scientific method is observing some phenomenon represents an insight into
some experience. The need to resolve the problem is felt and the individual prepares to do
something about the need. The second step is to identify the problem more precisely. It involves
the formulation of hypotheses based on observed phenomenon. The third step of the scientific
method is to develop and apply a design for the solution of the problem and testing the
hypotheses. The fourth step usually identified is a continuation of the third step - that continued
testing hypotheses. Results are subjected to further analyses and tests. The final step is that of
drawing conclusions based on data and “tests and integrating these conclusions with the existing
body of knowledge.
The following assumptions are considered in scientific method:
- It is assumed that we are living in a real world i.e. there exists an objective reality,
independent of whether or not. It has been discovered.
- The assumption of the uniformity of nature is that what has been found to be true
will continue to be true and that similarity of circumstances will produce consistently
similar results.

65
Activity 6.1:
What is the difference between scientific methods and systematic approach?
6.3. Survey method
It is concerned with the present attempts to determine the status of the phenomena under
investigation. The method has been further classified into four categories:
Descriptive survey:
It includes survey testing method, questionnaire survey method and interview survey method.
Analytical survey:
It contains five types of survey. These are documentary frequency, observational survey, rating
survey, critical incident and factor analysis.
6.3.1. Purpose of survey method
Although the major purpose of survey method in research is to tell „„what is”? i.e., to describe
the problem or phenomenon, but many surveys go beyond a mere description of the existing
situation. For example, the survey dealing with curriculum courses help us in obtaining
information about not only the strength and weaknesses of the current curriculum but also can
elicit recommendations for change. Descriptive surveys or normative surveys are often carried
out as preliminary step to be followed by researcher employing more vigorous control and more
objective methods. It also serves as direct sources of valuable knowledge concerning human
behavior. Descriptive studies are helpful for us in planning various educational programs, school
census, in perhaps, the most universal application of the descriptive method to educational
planning, school surveys are conducted to help, solve the problems of various aspects of school
i.e. school plants, school maintenance, teaching staff, curriculum, teaching methods, learning
objectives and the like.
The survey method helps to collect the following three types of information‟s. The information is
about of what exists, of what we want, and of how to get there. The information of what exists is
gathered by studying and analyzing important aspects of present situation. The information of

66
what we want, is obtained by clarifying goods, goals, and objectives possibly through a study of
the conditions existing elsewhere or what experts consider being desirable. The Information of
how to get these is collected through discovering the possible means of achieving the goals on
the basis of the experiences of others or of opinions of experts.
6.4. Historical method
This method is concerned with the past and which attempts to trace the past as a means for
seeing the present prospective. The historical method can be classified as historical, legal, and
documentary.
6.5. Experimental method
As a Chemistry student, you are familiar with experiments. Can you give explanation about
experimental method by now?
Experimental method is oriented towards the discovery of basic relationship among phenomena
as means of predicting and eventually, controlling their occurrence. It is classified into four
types. Simple experimental design, multio-variate analysis, case study, and predictive or
correlation are classifications of experimental method. Different professionals give different
explanations for experimental methods. Some of them are sited as follows.
“An experiment is a question framed on the basis of what is known and addressed to nature to
elicit further knowledge. It transcends simple observations or collection of materials; it is
consciously directed, purposeful observation.” – E.B. Wilson
“It is a method of testing hypothesis” “Experiment is the proof of a hypothesis which seeks to
make up two factors into a causal relationship through the study of contrasting situations which
have been controlled on all factors the one of interest, the latter being either the hypothetical
cause or the hypothetical effect.”- Johada and others:
“The essence of an experiment may be described as observing the effect on a dependent variable
of the manipulation of an independent variable.” – Festinger

67
“Experimentation is the name given to the type of educational research in which the investigator
controls the educative factors to which a child of group of children is subjected during the period
of inquiry and observes the resulting achievement. - W.S. Monore
6.5.1. Basic assumptions behind the experiment
Experimental research in the original form is based on the assumption of the established law of
single variable. If two situations are similar in every respect, and one element is added or
subtracted from one but not the other, any difference that develops is the result of the operation
of that element added or subtracted will be considered. It means if two situations are identical in
all respects the addition or subtraction of one variable contributes for differences or change in
two situations than the difference or effect is said to be the cause of the single additional or the
single variable. For example, if the additional or subtracted variables cause the difference
between the two identical situations then it may be attributable to the variable.
Activity 6.2:
Mention the types of experimental methods.
6.6. Concept of cause and effect
The focus of scientific study is to analyze the functional relationship of the variables. The
functional relationship refers to the cause and effect relation between the variables. The cause
and effect relationship can be studied by applying the „Law of Single Variable‟. For instance, a
researcher wants to study the effectiveness of new teaching strategy, i.e., programmed
instruction. For this purpose two equivalent groups are selected, one group will be taught through
new strategy or programmed instruction and another group with lecture method. Same content
will be taught and same criterion test or achievement test will be administered on both groups.
The performance of programmed instruction group is significantly higher than that of lecture
method group. It may be concluded that programmed instruction strategy is effective than the
lecture method, because the performance of experimental group is caused by the new strategy of
teaching or programmed instruction treatment.

68
6.7. Definition of variable
Dear student based on your understanding what variables are?
On the experimental study, the main functioning proceeds around the variables. Cause and effect
is the focus of the study and further question “Of what” gives the word „Variable‟. Observation
of the effect of variables is the purpose of experimental study. Kerlinger says: “Variable is a
property that takes on different value.” A variable is any feature or aspect of an event function or
process, its presence and nature, affects some other event or process, which is being studied.
6.7.1. Types of variables
Variables can be classified in various ways. For example, programmed instruction strategy may
be an experimental variable. However, in general, four types of variables are employed in
conducting an experiment in education.
- Experimental variable
An experiment is conducted to examine the effect of a variable or treatment which is known as
experimental variable. The main attention is given in the experiment to observe its effect.
- Controlled variable
The effectiveness is the relative term; therefore the effectiveness of an experimental variable is
examined by comparing with other variable which is known as controlled variable. The
effectiveness of programmed instruction strategy is studied by comparing with the lecture or
traditional method of teaching. The lecture method is the controlled variable. The control group
subjects should not get the exposure of the experimental variable.
- Criterion variable or dependent variable
The basis on which the effectiveness of the experimental variable is established or studied is
known as the criterion variable. The achievement may be the criterion or dependent variable. The
learning outcomes or achievement or change of behavior are usually the criterion variable in
education or psychology. If we want to study the effectiveness of schedules of reinforcement, it

69
will be examined in terms of student achievement through different schedules of reinforcement.
The student achievement is the criterion variable.
- Intervening variable
There are a number of abstract variables in educational experiment which intervene the effect of
experimental variable on criterion variable. The learner‟s attitudes, motivation and learning
process are the intervening variables. A researcher should be careful about intervening variables
in conducting an experiment to obtain the true effect of the treatment.
Activity 6.3:
Why we conduct an experiment in Chemistry?
6.8. Experimental control
The main problem in experiment method is the experimental control. For an accurate conclusion,
it is essential that all variables except experimental variable should be controlled. Different
explanations are given for experimental control. The term control means to hold over the
situations in this way that a change at any time can be brought about and could control the effect.
According to McGuigan, the word „Control‟ implies that the experimenter has a certain power
over the conditions of this experiment.
Researcher needs to study the effect of the independent variable. For this he has to control all the
other relevant variables which effect the activation of experimental variable. Researcher has to
design and conduct the experiment in such a way that the experimental group should not be
exposed other than experimental variable or the treatment
6.9. Characteristics of an experiment
The purpose of experimentation is to identify functional relationships. Experimentation can be
considered a technique of deliberately staging a situation designed to force nature to provide a
“yes” or “no” answer to a specific hypothesis concerning the phenomena under discussion.
Experimentation is to provide a meaningful solution to a problem, it is essential that the

70
experiment contains, within itself, the means for answering its own questions. This, in turn, calls
for the satisfaction of three basic and inter-related conditions control, randomization and
replication. Unless these conditions are, fulfilled, the experiment cannot be interpreted. More
specifically the experiment must provide the basis for calculating the probability that the
phenomena that did occur were the result of the experimental factor rather than of the operation
of extraneous factors. The experimental method in educational research is the application and
adaptation of the classical method of the science laboratory. It is the most exacting and difficult
of all methods and also the most important from the strictly scientific point of view.
Activity 6.4:
During performing an experiment, what is the need to control all other variables except the
experimental variable in experimentation?
6.10. The steps of the experimental method
The steps of the experimental method are essentially those of the scientific method. For the sake
of clarification, they may be listed as follows.
- Selecting and delimiting the problem:
The problems should be amenable to experimentation generally, can be converted into a
hypothesis that can be verified of refuted by the experimental data. The variables to be
investigated should be defined in operational terms for example, the scores on a test of
acceptable validity.
- Reviewing the literature
- Preparing the experimental design
It should include a clarification of such basic aspects of the design as the place and the duration
of the experiment. This section should place primary emphasis on the questions of control,
randomization, and replication. Because of the complexity of an experiment, it is generally
advisable to conduct a pilot study in order to ensure the adequacy of the design.
- Defining the population:
It is necessary to define the population precisely so that there can be no question about the
population to which the conclusions are to apply.
71
- Carrying out the experiment:
It is necessary here to insist on close adherence to plans, especially as they relate to the factors
of control, randomization and replication. The variable under investigation should be given
sufficient time to promote changes that can be measured and to nullify the influence of such
extraneous factors as novelty.
- Measuring the outcomes:
Careful consideration must be given to the selection of the criterion on the basis of which the
results are to be measured.
- Analyzing and interpreting the outcomes:
The investigator is concerned with the operation of the factor under study. He/she must be
sensitive to the possibility that the results of the study arose through the operation of
uncontrolled extraneous factors. He must further exclude, at a given probability level, the
possibility that the experimental findings are simply the results of chance. Of course, statistics
cannot correct fulfills in the design or overcome inadequacies in the basic data. The investigator
must recognize that statistical tools do not relieve the scientist responsibility for planning the
study, controlling extraneous factors and for obtaining valid and precise measurements. It can
also be argued that there is limited justification for high-powered statistical refinement in the
early exploration of a problem area or in instances where the data involved are essentially crude
and imprecise.
- Drawing up the conclusions:
The conclusions of the study must be restricted to the population. Care must be taken not to over
generalize the results. The results should relate only to the conditions under which they were
derived and since control may have distorted the natural situation care must be taken to restrict
the conclusions to the conditions actually present in the experiment. The investigator must not
forget that the conclusions are based on the concept of probability; especially he/she must not
fail to recognize the limitations underlying the conclusions and/or the special conditions that
restrict their applicability.
- Reporting the result:
The study must be reported in sufficient detail so that the reader can make a judgment as to its
adequacy.

72
Activity 6.5:
What is the advantage of defining the population precisely?
6.11. Classification of experiments
The usual bases observed for classification of experiments are:
- Type of control: scientific or practical, formal or informal, actual or inferred
- Means of approach: analytical, comparative, quantitative or qualitative
- Place where conducted: laboratory, field or classroom
- Grouping of subjects: in groups or individually
- Treatment of subjects: in groups or individually
- Function or purpose: to study direct effects, indirect effects or causes.
- Time involved: tong or short duration.
- Sponsorship: independently or cooperatively but an individual or an institution
Among the several bases of classification listed above the most significant, perhaps is the one
which takes into account the grouping of subjects because the design of an experiment is largely
determined by this factor. Experimental designs vary in complexity and adequacy, depending on
such factors as the nature of the problem under investigation, the nature of the data, the facilities
for carrying out the study, and especially, the research sophistication and competence of the
investigator. Although there are a number of combinations of the various experimental
procedures, there are three basic procedures in experimentation.
1. Single individual or single group experimentation
2. Parallel or equated groups experimentation; there are four ways for equating the groups.
- Randomization for equating groups
- By comparing mean scores of the two groups
- Matched pair‟s method for parallel groups
- Co-twins method for equating groups
3. Rotational procedure, it is two types, single group rotation, and parallel or equated group
rotation.

73
6.12. Self-test exercise
I. Fill the blank space with appropriate terms
1. A method, which is oriented towards the discovery of basic relationship among
phenomena as means of predicting and eventually, controlling their occurrence is called
____________.
2. Experimental variables are examined by comparing with _______________________.
3. In experimental study, the main functioning precedes rounds at ____________________.
II. Give a brief explanation for the following questions
1. Mention the basic assumption of an experiment and explain the „Law of Single Variable‟.
2. Explain the following types of variables:
Experimental variable
Controlled variable
Intervening variable
Moderator variable
3. Describe the characteristics and uses of an experiment in educational research.
4. Indicate the steps of the experimental method.
5. Discuss about the basic procedures employed in the experimental method

74
CHAPTER SEVEN
Design of Experiments
Objectives:
After completing the chapter the student able to
learn about how to design experiments
describe types of experimental design
to know about types of errors
Dear student, what is your opinion on experimental design? Do you expect that any
similarity is there with that of designs in engineering areas such as construction works?
An experimental design sets up is a framework for adequate tests of the relations among
variables. Design tells us what observations to make, how to make them, and how to analyze the
quantitative representations of the observations. In strictly speaking, design does not tell us
precisely what to do, but rather suggests the directions of observations making and analysis. A
design suggests which variables are active and which are assigned. We can then act to
manipulate the active variables and to control the assigned variables. A design also suggests
what type of statistical analysis to use and what may be the inferences by a particular technique
applied. The results obtained in a study dealing with human behavior can never be considered
absolutely accurate due to numerous variables. A design tells us how far we have been able to
control the experimental errors. Most technical function of an experimental design is to control
the error variances.
7.1. The need for precision
The precision of any experiment may be defined as the degree to which the observed differences
in results are due to the only differences, which have been deliberately introduced treatments.
Depending upon the success with which all factors, which might affect the result, other than the
deliberate variations in treatment have been controlled. Absolute precision is, of course,
impossible, in other words it is always possible that any observed difference in results is not
always due to the treatment differences. However, uncontrolled and unmeasured variations in

75
factors extraneous to the purpose of the experiment are suspected. It is impossible to determine
the magnitude and direction of these errors, we only can calculate or determine the possibility
that the errors arising from certain sources will exceed a given magnitude and estimate the
maximum error which is reasonable to suppose might arise from these sources.
7.2. Characteristics of a good experimental design
Dear student, try to mention the essential characteristics of good experimental design
before reading the next part.
The essential characteristics of a good experimental design may be summarized as follows. It:
- ensures that the observed treatment effects are unbiased estimates of the true effects.
- permits a quantitative description of the observed treatment effects regarded as estimates
of the “true” effects. It will ensure that the observed treatment effects will have whatever
degree of precision is required by the broader purpose of the experiment.
- makes possible an objective test of a specified hypothesis concerning the true effects, that
is, it will permit the computation of the relative frequency with which the observed
discrepancy between observation and hypothesis would be exceeded if the hypotheses
were true.
- will satisfy these requirements at the minimum cost broadly conceived.
The usefulness of an experimental is primarily depending upon many other factors. The
important decisions to be made in designing the experiment are considered with:
the definition of the “treatments.”
the selection or exact definition of the population to be investigated.
the selection of a criterion.
the identification of the factors to be controlled and the level or levels at which each is
to be controlled.
the final restatement of the problem, and
the selection of a specific experimental design.
76
The decisions are independent; a decision made at a particular stage in the planning may require
modifications in previous tentative decisions, which may in turn affect other previous decisions
etc. The selection of the experimental design is usually the last step taken, but as already noted,
even it may suggest desirable modifications in other decisions previously made.
Activity 7.1:
What is meaning of the term precision?
7.3. Types of errors
Dear student, as a chemistry student you are familiar in with types of errors. Could you
remember what types of errors are expected in experimental works and their possible sources?
Generally, in an experimental study, errors may be classified as chance error and systematic
error.
1. Chance Error:
This type of error is raised due to the individual differences. For example, if we are studying the
superiority of programmed method over traditional method, then the differences in intelligence,
learning ability, socio-economic status, established habit of study, etc. may affect our study.
Such error exists with these factors is called chance error. In chance error two categories may be
according to the sources of errors.
- Sampling error:
The error is due to the differences within the sample chosen for study is known as sampling
error, e.g., in the above study habit of study, intelligence etc.
- Measurement error:
It is due to inability of measuring instruments to produce accurate results.
2. Systematic Error:
In spite of precautions taken, other factors those involved in study may affect our experiment. It
causes results to vary in a particular direction. Systematic error causes bias in study and it is far
more likely surprising to the researcher than does chance error. Whenever a new method or
77
treatment is studied, the researcher try to prove it better, no matter which is actually superior.
Generally, the researcher wants to prove his hypothesis this way or that way however this kind of
effect cannot be controlled completely. Every researcher tries to control these errors through
experimental designs. According to Kerlinger explanations, three ways that a researcher attempts
for error variance control are pointed out. Kerlinger explanations states about Maximincon
principle, its meaning is maximization of experimental variance, minimization of error variance
and control of extraneous variables.
- Maximizing the variance of desired variables
The experimenter‟s most obvious concern is to maximize the experimental variance. It simply
refers to the variance presumably introduced into dependent variable by the independent
variables being manipulated or controlled. It is variance of the independent variables of the
substantive hypothesis. If the independent variable does not vary substantially, there is little
chance of separating its effect from the total variance of the dependent variable, so much of
which is often due to chance. It is necessary to give the independent variables a chance to show
their variances, to separate themselves from total variance which is a composite of variances due
to various variables. Remembering this Maximincon principle, we can write a research percept
as design, plan and conduct research so that the experimental conditions are as different as
possible.
Activity 7.2:
How a researcher can control systematic errors?
- Controlling the variance of extraneous variables
The influences of independent variables extraneous to the purposes of study are minimized, or
isolated. In other words the variance of such undesired variables is in effect reduced to zero or
near zero. It is done in the following ways:
- Eliminating the variance as variable e.g. if we are studying achievement and racial
membership is a possible contributing factor to the variance of achievement, it can be
eliminated by using only members of one race.

78
- Randomization, if we do randomization then the experimental groups can be considered
statistically equal in all possible ways. Group can be unequal by chance, but the
probability of their being equal is much greater, with proper randomization, than the
probability of their not being equal.
- Building the variance right into the design as an independent variable, e.g., sex was to be
controlled in any experiment and it was not possible to assign subjects to groups at
random. One could add another independent variable sex, to the design.
- Splitting a variable into two or more parts and randomize within each level.
- Minimizing random variance
Variance is the variability of measures generated by random fluctuations whose basic
characteristics are that they are self-compensating varying this way or that way. Random errors
tend to balance each other but the error variance is unpredictable. Variation of responses from
trial to trial is due to the factors associated with individual differences. So we try to reduce the
errors of measurement through controlled conditions and by increasing reliability of measures.
Reason to reduce error variance is to give systematic variances. This gives a chance to show their
significance if they are significant. The sampling error is reduced by controlling extraneous
variables and applying the Maximinicon Principle. The error of measurement can be controlled
by minimizing the error variances and using reliable instruments. Systematic error may be
reduced with proper care by investigator to some extent. The degree of error to which we were
able to eliminate or control depends upon the experimental design used. These experimental
designs are based on some principles. Each design has its own assumptions, lay-out and
technique of analysis.
7.4. Basic principles of experimental design
There are three principles of experimental design namely the indispensability of replication,
randomization and the desirability of local control. The modern experimental designs have been
evolved from these principles.
79
7.4.1. Randomization
It is essential for a valid to estimate the experimental error and to minimize bias in results.
Cochran and Cox stated states randomization as “Randomization is analogous to insurance in
that it is a precaution against disturbances that may or may not occur, and that may or may not be
serious if they do occur.” Also, designs we frequently use analysis of variance which holds the
assumption of independence of variances, randomization is a device to achieve this
independence of variances, and randomization is a device to achieve this independence of errors.
Randomization by itself is not sufficient for the validity of the experiment. It only forms the
basis for validity. Randomization may be done by any technique by lottery or Fisher bowl
technique or random number tables.
7.4.2. Replication
In order to obtain a more reliable estimate than is possible from a single observation, a treatment
should be repeated in a number of times. It is apparent that the function of replication is twofold:
- Along with randomization, it provides an estimate of the error to which comparisons
are subjected, and
- Along with local control it reduces the experimental error. The most effective way to
increase the precision of an experiment is to repeat the experiment.
7.4.3. Local control
In simplest case, experimental units are divided into homogenous groups. The variation among
these groups is eliminated to control error and thereby efficiency is increased. The choice of size
and shape of experimental units, environmental conditions etc. have also some effect on
experiment, causing errors. It may be controlled by using analysis of co-variance also. Local
control helps in controlling the systematic error or general factors or say “G” error,
Randomization controls the sampling error or “S” error and also a little “G” error. Replication
mainly controls the variations in treatment effects from replication to replication due neither to
“S” nor “G” type of errors. Let us call it “R” error. Measurement error is controlled by
replication. Replication with randomization would be able to control all the three errors and with
local control, the “G” error and measurement error. So replication is a very important principle.

80
Activity 7.3:
How reliable results can be obtained?
7.5. Types of basic experimental designs
These basic principles are applied to all experimental designs. Therefore, the designs are also
known as basic experimental designs. Various experimental designs which are being summarized
by E.F. Lindquist are listed here.
- Simple random design,
- Treatment X Level design,
- Subject X Treatment design,
- Random replication design,
- Group within treatment design, and
- Factorial design.
These are known as basic designs because, their focus is to eliminate three basic types of errors,
type „S‟ errors, type „R‟ errors and type „G‟ errors.
- Type ‘S’ Errors:
An error observed with treatment effect, which is due solely to the assignment of subjects to
treatment groups.
- Type ‘R’ Errors:
Variations in treatment effects from replication to replication, due neither to type „S‟ nor type
„G‟ errors, but genuinely characteristics of the individual replications or subpopulations are
referred to as type „R‟ errors.
- Type ‘G’ Errors:
Those are errors due to the operation of extraneous factors, which tend to have the same effect on
all members of any given treatment groups, but different effects on different treatment groups in
any simple replication.
Activity 7.4:
What mean by G types of errors?

81
7.6. Self-test exercise
I. Among the given choices, choose the correct one
1. A systematic error introduced because of use of a new method is called_____________.
2. Local control is helpful to control___________________.
3. Replication allows controlling of_________________________.
4. Variability of measurements generated by random fluctuations is called
________________.
5. Undesired variable, which influence independent variables is called_______________.
II. Give a brief explanation for the following questions
1. Explain the term experiment.
2. Differentiate between research design and experimental design.
3. Enumerate the essential characteristics of a good experimental design and purpose in
research studies.
4. Describe the basic principles of experimental designs.
5. Mention the basic type‟s errors of experiment.

82
CHAPTER EIGHT
Tools of research and data collection
Objectives:
After successful completion of this chapter, the student will able to
discuss about tools used in research
learn importance of questioner
learn nature of data
describe about types of data
Dear student, based on your previous knowledge, could you guess what it mean tools of
research? Is it like tools used in agricultural purpose?
Different kinds of research tools are being used to perform researches. Questioner and
observation method can be mentioned here. According to Barr, Davis and Johnson “A
questionnaire is a systematic compilation of questions that are submitted to a sampling of
population from which information is desired.” As the term generally used in educational
researches, “the questionnaire consists of a sense of questions or statements to which individuals
are asked to respond the questions frequently asked for facts or the opinions, attitudes or
preferences of the respondents.” Goode and Hatt have given an illustrated definition of
questionnaire. “In general words questionnaire refers to a device for securing answers to
questions by using a form which the respondent fills in himself.” Questionnaire forms are used
and the respondents fill in by themselves. Thus questionnaire places a heavy reliance on the
validity of the verbal reports. This approach is widely used by researchers for a number of
reasons.
8.1. Significance of questionnaire
Beginners are more commonly tempted to this tool, because they imagine that planning and
using a questionnaire is easier than the use of other tools. It is also considered to be the most
flexible of tools and possesses a unique advantage over others in collecting both qualitative and
quantitative information. Critics speak of it as the lazy man‟s way of gaining information,

83
because it is comparatively easy to plan and administer a questionnaire. “As a matter of fact,
preparation of a good questionnaire takes a great deal of time, ingenuity and hard work.”
8.2. Design of the questionnaire
In order the questionnaire gets acceptance, the researcher should design an appealing format.
Many unattractive questionnaires end up in a wastebasket rather in the hands of the sender. To
improve the attractiveness of the instrument, choose a title that is clear, concise, and descriptive
of the research project, and use well typed or printed questions that are properly spaced and easy
to read. It is generally advisable to group questions of a similar nature together.
Activity 8.1:
What kind of questioner gains more acceptances by the respondents?
8.3. Type of questionnaire items
The two commonly used types of questionnaire items are the unrestricted, or open form items,
and the restricted, or close form items. Each type has its advantages and disadvantages, so the
researcher must decide which is more likely to yield the data needed in a particular research
project. The open formed item is referred to as the open end, short-answer, or free-response item
because offer the question there is a space provided in which the respondent is asked to write his
answer. This type of item permits explanation, but responses can be difficult to summarize and
tabulate. The responses also may be too brief, or the respondent may have omitted important
information. The open form item is of most value when unrestricted, in depth responses are
needed. An example of this type of questionnaire item follows: In your opinion, what might your
high school have done to prepare you more adequately for college?
The closed form item sometimes is referred to as the “restricted” or “structured” type. It consists
of a question or a statement to which a person responds by selecting one or more choices, such as
“Yes” or “No”. In one variation of this type the respondent may be asked to underline award
from the two or more alternatives. Another variation requires the ranking of choices. The close
form item facilities the tabulation and analysis of data. It also improves the reliability and
consistency of the data. One limitation of this kind of item is that the respondent does not have

84
the opportunity to explain why he has given certain responses, and this may be important in
some kinds of research studies. The close form item also limits the scope and depth of responses,
so its use in measuring attitudes, feelings and certain aspects of behavior may be limited.
Dear student, do you understand well about the use of questioner as a research tool? If
your answer is yes, how much questioner is applicable in chemistry research?
8.4. Elements of questioner method
There are six elements to be considered up on using questioning method.
- The content of the questioning; which includes both why the researcher is asking the
questions and why the respondent believes they are being asked, since these are not
necessarily the same;
- Content of the questioning;
- The question which can be defined as the verbal stimulus to which the respondent will be
exposed;
- The provision for answering which refers to the response the respondent will be.
- The way in which the response will be recorded, which refers to variation like writing or
speaking or recording;
8.5. Choosing the questions
Questioning stage is a stage to define the problem precisely. It is desirable also to define at an
early stage the population to whom the question is to be directed and to decide the nature of the
sample to be drawn, as this may influence the drafting of the question. The definition of the
problem should set out the aspects of the problem to be explored. Stage II follows with
construction of questions or items to deal with each aspect in turn. The question should be
compiled with definite hypotheses or theories in mind. Each question should contribute clear
information on a specific aspect to be explored or else the question should be discarded
ruthlessly. If the investigation is on a small scale and the investigator himself will classify all the
responses, it may not be necessary to put all questions into a multiple choice pattern. Multiple
choices can be tiresome, especially if the alternatives offered for choice do not express

85
adequately the response a subject wishes to express opinion questions. It may be necessary to
choose questions and to specify possible answers in such a way as to facilitate coding.
The art of drafting a question consists of being able to do this without forcing your respondents
into an uneasy choice a difficulty which they can too easily resolve by giving up altogether. The
questionnaire should start with simple factual questions, so that the person completing it gets off
to a good start. Complex or awkward topics should come towards the end. An open ended-
general question at the end will allow expression of points which the responder thinks important,
though they are not covered by the questionnaire. A questionnaire needs not to be restricted to
questions attitude scales ratings and check lists. It may include brief and straight forward and the
instructions are kept simple. Similarity and brevity are cardinal virtues.
The questionnaire is not a scientific instrument. It is a cheap, easy and rapid method of obtaining
information and non- information one never knows which he points the weaknesses of both
questionnaire and interview-the tested-validity of the responses. Questionnaires show what
people say, not what do or are. Any form of questionnaire implies a certain frame of reference
and thereby influences the answer given.
Research tools are administered on the sample subjects for collecting evidences or data. Most
educational research will lead to the gathering of data by means of some standardized test or self-
constructed research tools. It should provide objective data for interpretation of results achieved
in the study. The data may be obtained by administering questionnaires, testing, personal
observations, interviews and many other techniques of collecting quantitative and qualitative
evidence. The researcher must know how much and what kind of data collection will take place
and when. He/she must also be sure that the types of data obtainable from the selected
instruments will be usable in whatever statistical model she/he uses latter to bring out the
significance of the study. The data collection is the accumulation of specific evidence that will
enable the researcher to properly analyze the results of all activities by his research design and
procedures. The main purpose of data collection is to verify the research hypotheses. It will be
discussed further in the next topic.

86
Activity 8.2:
What are the two types of questioner items?
8.6. Need for data collection
Data is needed in a research work for the following reasons.
o It provides a solid foundation for it.
o It is something like the raw material that is used in the production of data.
o It provides a definite direction and answer to a research inquiry.
o It is important to substantiate the various arguments in research findings.
o It helps to verify the hypotheses.
o It helps to develop estimation of population parameters, which helps in drawing
generalization.
o It allows testing hypotheses of any investigation.
o It helps to collect qualitative data are used to find out the facts and quantitative data are
employed to formulate new theory or principles.
o It is employed to ascertain the effectiveness of new device for its practical utility.
o It is are necessary to provide the solution of the problem.
8.9. Meaning of data
Data means observations or evidences obtained through experimentation or questioner. The
scientific educational researches acquire the data by means of some standardized research tools
or self-designed instrument. Data can be qualitative and quantitative in nature. Score is the
numerical description of an individual with regard to some characteristics or variables.
Measurement process is employed to quantify a variable. Data are collected for both variables as
well as attributes. These are gathered in terms of frequency and scores. It depends on the type of
instrument employed for its measurement. Generally tests yield the data in the form of scores and
questionnaires provide the data in the form of frequency. Data and facts are used in educational
research; therefore, it is essential to understand them clearly. The difference between the two
terms is explained in the next section.

87
8.10. Difference between facts and data
Facts and data have been distinguished in the following manner:
- Facts are organized in their original form whereas data are organized in systematic order.
- Facts do not have any coherence of system whereas data have an organic unity like body.
- Facts are difficult to interpret. The interpretation of facts is usually subjective and employs
the imagination of the researcher. Data can be interpreted easily and most objectively.
- Facts are mysterious in nature we have to explore the facts but data have no mystery at all.
- Facts are descriptive in nature whereas data are explanatory.
- Facts are not amenable to objective statistical treatments whereas data can be easily
subjected to in objective statistical treatment.
- Facts may not be directly the basis of findings or research conclusions, but data are directly
linked with research conclusions.
- Facts are usually too broad and are not linked and a purposive way whereas data are always
collected with a sense of purpose.
- Facts are collected in historical or survey research whereas data are gathered in a scientific
and experimental research.
Activity 8.3:
Mention at least one difference between facts and data
8.11. Nature of data
The research studies in behavioral science or mainly concerned with the characteristics or traits.
Thus, tools are administered to quantify these characteristics, but all traits or characteristics
cannot be quantified. The data can be classified into two broad categories, qualitative data or
attributes, quantitative data or variables.
- Qualitative data or attributes:
The characteristics or traits for which numerical value cannot be assigned, are called attributes,
e.g. motivation, confidence, honesty integrity etc.

88
- Quantitative data or variables:
The characteristics or traits for which numerical value can be assigned, are called variables, e.g.
achievement intelligent, aptitude height, weight etc.
The distinction is based on the process of measurement rather than on the properties inherent in
the phenomenon or trait, for generally properties considered qualitative can be made quantitative
by measuring them with an instrument designed to assign numerical values to the various
degrees to which they exist. The decision to research a given phenomenon on the basis of its
attributes or on the basis of its quantitative aspects is frequently a matter of choice, depending on
such considerations as the need of precision and the ease of manipulation of data. In fact, the
quantification of phenomenon is generally considered essential to the progress of a science
particularly at the more advanced levels. Quantification provides a greater refinement and
possesses definite advantages by virtue of its statistical treatment.
The quantitative data provide the nature of the characteristic or trait. They have the verbal
exposition of the trait. There is much scope for logical manipulation is the interpretation of
result. The trait is not quantifiable. The qualitative data provide the extent and nature of the
distribution of the trait or variable measured. The tools are available to measure the variable. In
the experimental research data are collected in the controlled situation to study the functional
relationship of variables. Quantification is the process of assigning numerical values to the trait
of the subjects of sample which normally would be quantitative. This can be performed through
Observations or information by firsthand experience.
Systematic collection and analysis of factual data. This is done in historical research.
Scales and inventories are designed to explore or reveal the interests, attitude and
personality. It is used in the case of study and survey research.
Questionnaire and interview are designed to gain information. This is employed in survey
research.
Educational and psychological tools are administered to quantify the variables more
accurately. These tools are used in scientific research studies. Various types of research
tools are employed to collect the data.

89
Activity 8.4:
What are the two types of data‟s?
- Constants
A constant is all characteristic or condition that is the same for all the observed units or sample
subjects of a study. A variable, on the other hand is a characteristic which takes on different
values for different sample subjects or for all the observed units. The use of variable and constant
has been illustrated with the help of the following example. Suppose a study is conducted for
determine the effect of three different teaching methods upon the achievement in chemistry at
Ambo university. Each of the two section taught by the same teacher, using one of the methods.
Both boys and girls are included in each method. In this study grade level, school and teacher are
recognized as constants. It assumes that the teacher can hold constant teaching effectiveness
except for the method. The independent variable in the study is the teaching method and
achievement in chemistry is known as the dependent variable or criterion variable. A dependent
variable is the consequent of the independent variable. The functional relationship is analyzed
between the two variables. The precision of the data is governed by the constants, if these
conditions remain unchanged during experimentation. A researcher should be conscious enough
about the constants of his investigation.
Dear student, concerning variables used in Chemistry experiments like temperature
pressure, absorbance etc., what is the importance of these variables to obtain qualitative and
quantitative information?
Variables are parameters, which vary from person to person and can be quantified by employing
measuring instrument. The sample or group variation can be ascertained in terms of numerical
values. The characteristic or the trait in the behavioral science that can be quantified is termed as
variable. Variables can be classified into two categories, Continuous variables and d iscrete
variables.

90
8.12. Quantification of variable
Dear student, could you define the term quantification of variables at this level?
Quantification is the process of assigning numeral value to extend or amount of a variable of an
individual. The quantification is done by employing the process of measurement. This process
yields data and scores. Many studies in education produce data for the verification of research
hypotheses so as to draw conclusions. Some other studies in education produce evidences that
require evaluation by subjective methods, which do not readily permit the use of statistical
analysis, are termed as qualitative data. These qualitative data may be converted first into their
quantitative data. The statistical techniques may be applied to test the significance of data. If
qualitative data cannot be converted into quantitative data, a descriptive interpretation is done.
8.13. Characteristics of quantitative data
The quantitative data are collected by administering the research tools. These should possess the
following characteristics:
o The quantitative data should be collected through standardized tests. If self-made
test is used it should be reliable and valid.
o They are highly reliable and valid. Therefore, generalization and conclusions can be
made easily with certain level of accuracy.
o The obtained results through quantitative data can be easily interpreted with
scientific accuracy. The level of significance can also be determined.
o The scoring system of quantitative data is highly objective.
o The use of quantitative data is always based upon the purpose of the study. The
specific psychometric tests are used in difficult investigation.
o The inferential statistical can be used with the help of quantitative data.
o The precision and accuracy of the results can be obtained by using quantitative data
in an educational research.

91
8.14. Ways to quantify data’s
Dear student, could you mention types of data you know before reading the next section?
There are four basic ways of quantifying the variables. They are also called levels of
measurement or scales of measurement. These are commonly referred to as nominal scale,
ordinal or rank scale, equal- interval scale, and ratio scale.
The nominal scale is the least precise or crude of the four basic scales of measurement. It simply
implies the classification of an item into two or more categories without any extent or magnitude.
There is no particular order assigned to them. The frequency or numbers are used to give a name
to something that may be used for determining per cent, mode. For example boys and girls; pass
and fail; rural and urban. In classroom observation the measurement is done at nominal scale.
The teaching and instruction are organized considering the mode of the students, because teacher
cannot pace with each and every student in his teaching and learning process.
The ordinal scale is more precise scale than the nominal scale. It allows the teacher to assign
values by placing of arranging the observations in relative rank order. No value is assigned to the
distances to the positions of ranking. This scale assigns observations to categories by number and
arranges them in some logical order. It does not require the relationship of equivalence but also
requires one observation to be greater or lesser than the other. This scale is used frequently in the
schools for prize distribution and to provide the motivation by the technique of competition. In
asking the questions teacher considers the place of students in the class.
The equal interval scale is more precise and refined scale than nominal and ordinal scales. This
scale has all the characteristics and relationship of the ordinal scale, besides which d istances
between any two numbers on the scale are known. The zero point and the unit of measurement
used on the scale are arbitrary assumed. A linear relationship is established in the equal- interval
scale. The equal- interval scale has the greater use in teaching- learning situation, educational
administration, educational guidance and counseling and educational research. The effectiveness
of any instructional procedure can be evaluated precisely by collecting the data on this scale. The
measurement in education is usually done on equal interval scale.

92
Ratio scale has the properties of equal- interval scale plus two additional characteristics:
- This scale has a true, rather than arbitrary „zero‟. It is possible to indicate the complete
absence of property. The zero point on a centimeter scale indicates the absence of height.
However, the zero point on a Fahrenheit temperature scale does not indicate the absence of
temperature; this is a scale with zero defined arbitrarily.
- The ratio scale numerals have the qualities of real numbers, and can be added, subtracted,
multiplied; or divided. A may be so many units greater than B and may also be so many times as
great as B. Fifteen grams is three times five grams and fifteen grams is ten more than five grams.
Proceeding from nominal to ratio scale in order each type makes possible more information
about the property described. If the variable permit its application, the type of scale provide the
maximum amount of information should be used.
Other types of research tools are used to collect‟ the data. For example, „observation technique‟
is most frequently used to collect the data, which yields the data at nominal scale and also at
equal- interval scale.
Classification of tools and research with regard to the level o f measurement scale tools of
research statistics
1. Nominal Scale: is applicable in questionnaire, interview model, frequency percentage
schedule observation
2. Ordinal scale: is used in observation rank scale median, spearman‟s rank correlation X2
test median test etc.
3. Equal- interval scale: is used psychological and mean, Sd. pearson‟s correlation
educational tests,„t‟ test and „f‟ test etc.
4. Ratio scale: is used physical measurement, arithmetic mean, pearson‟s correlation
mathematics is used.
The types of data depend on nature of research tool employed for this purpose. Statistical
techniques are virtually selected by considering the nature of research tool and data collected at
nominal, ordinal or equal interval scales. It is not the statistical technique but type data which
determine the fate of research project. Any researcher who involves human sample subjects in
his research has certain responsibilities towards them. Since the activities of the sample subjects

93
are often closely associated with data collection process, it is appropriate to consider ethical
considerations here.
Any researcher anticipating “the use of human sample subjects should consult on „ethics‟
statements such as those mentioned above, a researcher should not mention the name of subjects
anywhere in the report. If possible name of institutions where sample subjects have selected for
data collection should not be mentioned even in the appendix. The code number should be used
for this purpose. As a general rule, he must respect the human sample subjects selected in his
specific research study. Precautions in Data Collection
Activity 8.5:
What are the four type‟s scales to quantify data‟s?
8.15. Organi zation of data
After the data have been collected, it must be organized and analyzed to draw proper inferences.
The mass of data collected through the use of various tools. However it should be reliable, valid
and adequate even though not yet processed. It needs to be systematized and organized i.e. edited
classified and tabulated. Editing implies the checking of gathered data for accuracy, utility and
completeness. Classifying refers to the dividing of the information into different categories
classes or heads, for the use. Tabulating denotes the recording of the classified material in
accurate mathematical terms e.g. marking and counting frequency tallies for different items on
which Information is gathered. Tabulating machines and other mechanical aids for tabulating are
becoming current. Once the data have been collected with the measuring instruments, some type
of tabulation and possibly a transformation of data in preparation for the analysis may be
necessary. Research study that includes the collection of considerable data using standardized
tests should make provision for machine scoring. There are IBM answer sheets with space of
responses up to 150 items. Test scoring machines provide for obtaining the actual scores, they
commonly provide tabulations, summaries, and conversions to various types of standard score.
In some cases the machines are connected to a computer to provide certain kinds of analysis.
94
8.16. Self-test exercises
I. Fill in the blank space with appropriate terms
1. An item of questioner, which permits the respondent to give explanation, is
_____________.
2. Evidences obtained through experimentation or questioner is called_______________.
3. A trait in which numerical data cannot be assigned is called___________________.
4. The least precise type of scale in measurement is ____________________.
5. A condition of a parameter in sample study in which there is no change is observed at all,
the parameter is called________________________.
II. Give an explanation for the following questions
1. Explain the term „data‟, How it is different from „facts‟?
2. Indicate the need for data collection and describe the nature of data.
3. Differentiate between questionnaire data and quantitative data.
4. Indicate the ethical consideration in data collection and their justification in conducting a
research.
5. What do you understand by the term „organisation of data‟? Discuss the need and
importance of data organization in conducting educational research.

95
CHAPTER NINE
Analysis of data
Objectives:
After successful completion of the chapter, the student able to
explain what it mean data analysis
describe how data can be processed
discuss the different types of data analysis techniques
learn about statistical techniques for data analysis
Dear student, could you define well the term data and mention what it mean data analysis?
A prime responsibility of the researcher is that of being able to make either a probability or
logical inference covering the tenability of his testable hypothesis. The acceptance or rejection of
these hypotheses will ultimately determine what contribution the study makes to the scientific
development of a particular area. This is especially tried in the analysis for interpretation of data.
The analysis and interpretation of data represent the application of deductive and inductive logic
to the research process. The data are often classified by division into, subgroups, and are then
analyzed and synthesized in such a way that hypothesis may be verified or rejected. The final
result may be a new principle or generalization. Data are examined in terms of comparison
between the more homogeneous segments within the group any by comparison with some
outside criteria. Analysis of data includes comparison of the outcomes of the various treatments
upon the several groups and the making of a decision as to the achievement of the goals of
research.
Data relevant to each hypothesis must be assembled in quantitative form and tested to determine
whether or not there is a significant difference in the results obtained from the controlled groups.
Usually the analysis develops as a comparison between groups however; sometimes the type of
data obtainable tends itself better to the existing differences by contrast or by summing up. It is
virtually impossible to complete a scientific analysis without using some form of statistical
processing. This may involve depicting differences by complicated inferential statistics such as

96
the analysis of variance, and analysis of covariance technique. Each statistical method is based
upon its own or specific assumptions regarding the sample, population and research conditions.
Unless these factors are considered in advance, the researcher may find that it is impossible to
make valid comparison for purpose of inferences.
9.1. Meaning of analysis of data
Analysis of data means studying the tabulated material in order to determine inherent facts or
meanings. It involves breaking down existing complex factors into simpler parts and putting the
parts together in new arrangements for the purpose of interpretation. A plan of analysis can and
should be prepared in advance before the actual collection of material. A preliminary analysis on
the skeleton plan should as the investigation proceeds, develop into a complete final analysis
enlarged and reworked as and when necessary. This process requires an alert, flexible and open
mind. Caution is necessary at every step, in case where a plan of analysis has not been made
beforehand. Good. Barr and Scates suggest four helpful modes to get started on analyzing the
gathered data,
o To think in terms of significant tables that the data permit
o To examine carefully the statement of the problem and the earlier analysis and to
study the original records of the data.
o To get away from the data and to think about the problem in layman‟s terms
o To attack the data by making various simple statistical calculations
In the process of analysis of research data, statistical method has contributed a great deal. Simple
statistical calculation finds a place in almost any research study dealing with large or even small
groups of individuals, while complex statistical computations form the basis of many types of
research. It may not be out of place, therefore to enumerate some statistical methods of analysis
used in educational research.
Activity 9.1:
What processes involved in analysis of data?

97
9.2. Need for analysis of data
After administering and scoring research tools scripts, data collected and organized. The
collected data are known as „raw data.‟ The raw data are meaningless unless certain statistical
treatment is given to them. Analysis of data means to make the raw data meaningful or to draw
some results from the data after the proper treatment. The „null hypotheses‟ are tested with the
help of analysis data to obtain some significant results. Analysis of data serves to:
- make the raw data meaningful,
- test null hypothesis,
- obtain the significant results,
- draw some inferences or make generalization, and
- estimate parameters.
9.3. Selecting the level of data
If we are working with variables, which do have a quantitative aspect we can use the data
collecting process of measurement. In this process we attempt to achieve some quantitative
estimate of the variable or, more realistically of the amount of the variable which each of our
research subject has. We can aspire to four different levels of measurement nominal, ordinal,
interval and ratio and which are listed from the weakest level (nominal) to the strongest level
(ratio). Here is seldom any question in labeling nominal data for no quantitative data are
typically obvious to researcher and reader alike. However, for quantitative data, the distinction
between ordinal and interval or ratio data is a critical one. Some research specialists or guides
advise as a general principle in planning data analysis that the researcher considers the data
ordinal, unless he can specifically identify a rationale other than the assignment of consecutive
digits to consider them interval data.
9.4. Statistical analysis of data
Dear student, what is your understanding about statistical analysis?
Statistics is the body of mathematical techniques or processes for gathering, describing
organizing and interpreting numerical data. Since research often yields such quantitative data,
statistics is a basic tool of measurement and research. The research worker who uses statistics is

98
concerned with more than the manipulation of data, statistical methods goes back to fundamental
purposes of analysis. Research in education may deal with two types of statistical data
application, descriptive and inferential statistical analysis.
- Descriptive statistical analysis
Descriptive statistical analysis is concerned with numerical description of a particular group
observed and any similarity to those outside the group cannot be taken for granted. The data
describe one group and that one group only. Much simple educational research involves
descriptive statistics and provides valuable information about the nature of a particular group or
class.
- Inferential statistical analysis
Inferential statistical analysis involves the process of sampling, the selection for study of a small
group that is assumed to be related to the large group from which it is drawn. The small group is
known as the sample and the large group is the population or universe. A statistics is a measure
based on a sample. A statistic computed from a sample may be used to estimate a parameter, the
corresponding value in the population which it is selected.
Activity 9.2:
What are the two types of statistical data analysis types?
9.5. Descriptive data analysis
Data collected from tests and experiments often have little meaning or s ignificance until they
have been classified or rearranged in a systematic way. This procedure leads to the organisation
of materials into few heads.
- Determination of range of the interval between the largest and smallest scores
- Decision as to the number and size of the group to be used in classification. Class interval
is therefore, helpful for grouping the data in suitable units and the number and size of these class
intervals will depend upon the range of scores and the kinds of measures with which one is
dealing. The number of class intervals, which a given range will yield can be determined
approximately by dividing the range by the interval chosen tentatively. Most commonly used
methods of analysis data are:

99
- calculating frequency distribution usually in percentages of items under study
- testing data for normality of distribution skewness and kurtosis
- calculating percentiles and percentile ranks.
- calculating measures of central tendency-mean, median and mode and establishing norms
- calculating measures of dispersion-standard deviation mean deviation, quartile deviation
and range
- calculating measures of relationship-coefficient of correlation, reliability and validity by
the rank-difference and product moment methods
- graphical presentation of data frequency polygon curve, histogram, cumulative frequency
polygon.
9.6. Inferential data analysis
The primary purpose of research is to discover principles‟ that have universal application.
However, to study a whole population in order to arrive at generalization would be
impracticable. A measured value based upon sample data is statistic. A population value
estimated from a statistic is a parameter. A sample is a small proportion of a population selected
for analysis. By observing the sample, certain inferences may be made about the population.
Samples are not selected haphazardly, but are chosen in a deliberate way so that the influence of
chance or probability can be estimated. Several types of sampling procedures are described each
one is particularly appropriate in a given set of circumstances.
9.7. Inference from statistics to parameters
The basic ideas of inference are to estimate the parameters with the help of sample statistics
which play an extremely important role in educational research. These basic ideals, of which the
concept of underlying distribution is a part, comprise the foundation for testing hypotheses using
statistical techniques. The chain of reasoning from statistics to parameters is a part of what we
call inferential statistics. The inference is from the statistics to the parameters.
We have a population and want to make decisions about measures of the population namely
parameters.

100
- We have a random sample and compute measures of the sample which are termed as
statistics.
- The statistics are used to estimate parameters with sample fluctuation.
- We have to obtain the sample statistics, which are the facts that we have to infer back to
the parameters in the light of the underlying distribution and probability.
We have a population and we want to know something about the descriptive measures of this
population, namely the parameters. It is desirable or impossible to measure the entire population,
so a random sample is selected from the population. The descriptive measures of the sample are
known as statistics and the statistics can be determined. Since the sample is a random sample, we
know that the statistics can be employed to estimate the population parameters within fluctuation
due to sampling.
Activity 9.3:
What it mean that term inferential data analysis?
9.8. Selecting the statistics
The researcher should consider two sections of the research report in which statistics will be
relevant. The first of these is the section in which the data producing sample is described and in
which may also be compared to the selected sample and to the population. In describing the
sample, the basic descriptive statistics of the summary frequency distribution and the appropriate
measures of central tendency and variability serve to provide the reader with some insight into
the nature of the respondents. Researchers are interested in the usual demographic characteristics
such as gender, age, occupation and educational level, but in addition anyone project will suggest
other descriptive variables about which data should be collected. Provided the data are available,
the researcher should also employ inferential statistics such as Chi-square or the t-test to
determine whether or not the data producing sample differs from his selected sample. Or
population by selecting which analysis he will prefer at his early stage, the researcher structures
the kinds of data he will need to produce about the population and can incorporate the search for
these data into his data gathering plan.

101
The second section of the report in which statistical p rocedures plays role is in the reporting of
research results. The selection of these procedures should be well structured by this point if the
researcher has stated specific hypotheses and research questions. The necessity to test the
hypothesis provides guidance to statistical procedures at the general level, with the decision as to
the level of data available providing the key to which specific procedures are to employ. Thus,
hypothesis, which refers to the expected a relationship between two variables immediately,
indicates the need for a correctional analysis. Once the researcher decides that the two variables
will yield ordinal data, for example, he can move directly to the specification of the rank order
correlation. The specification of statistical analysis at this stage of the research also enables the
researcher to estimate his data analysis cost both, in time and money, and make whatever
arrangements are necessary to reserve time on data processing facilities.
While analysis of data is performed, the investigator usually makes use of as many of the above
simple statistical devices as necessary for the purpose for their study. There are some other
complicated devices of statistical analysis listed below which researcher use in particular
experimental or complex casual comparative studies and investigations. The following are the
special statistical techniques of analysis.
Test of students „t‟ and analysis of variance for testing significance of differences
between statistics especially between means
Chi-square test for testing null hypothesis
Calculation of Biserial „r‟ and Tetrachoric „r‟ for finding out relationship between
different phenomena in complex situations
Calculation of partial and multiple correlations and of Bivariate and multivariate
regression equations for findings out causal relationship between various phenomena
involved in a situation
Factorial Analysis for analyzing the composition of certain complex phenomena
Analysis of co-variance for estimating the true effect of the treatment after adjusting the
initial effect

102
9.9. Planning for data analysis
The next aspect of the data analysis is planning to scan the data gathering instruments in the
context of data analysis. During the process of selecting a method and developing an instrument,
the researcher is usually oriented to content and procedure that he ignores the relatively minor
issues in instrument development, such as whether or not there is a place for the respondent to
indicate his name, age, class, or any other data that will be required for data analysis. After the
data are collected and analyzed it is often too late to capture this information. Thus, it is at this
point of planning the data analysis that the researcher can profitability refer to the list below of
characteristics of the data gathering instrument that will expedite data analysis.
There should be a place for name, school, class, age, sex or any other classifying
information the researcher will need in data analysis.
Every item should be numbered, and every option within an item should be separately
numbered or lettered, for case of data analysis.
Options should not overlap on structured questions, that is, if one option is 5-10, the next
should begin with 11.
It is preferable to have options circled rather than checked. This expedites the analysis of
data and also eliminates the possibility that the check below means „high school‟ to some
respondents rather than „College‟ as the researcher intended.
The orders in which items appear on an instrument reflect the priority of information
sought.
The researcher must recognize that respondents and observers tire and if they do the items which
appear late in the instrument are answered less carefully or omitted entirely. The order of the
items has been planned with the processing of data in mind. If two pieces of data are to be
analyzed simultaneously, this analysis can be expedited considerably if they are physically close
together on the instrument. If some sub-analysis within the instrument is planned, such as
computing the number of items correct on a sub-test or the number of positive responses on an
interest inventory, the layout of the instrument should consider the placement of those items on
each sub-test. The instrument should provide the respondent with a way of indicating inability or
unwillingness to answer a question, record an observation, or respond to a measure. The
possibility of pre-coding instruments, or printing them on different color paper as an aid to data
103
analysis should be considered. Instrument used in the pre-and-post administration of any
technique should be easily distinguishable and so impossible to confuse.
9.10. Considerations for statistical analysis
There are various statistical techniques for analyzing data. To choose an appropriate technique of
statistical analysis is the challenging task to a researcher. It has two main functions,
interpretation of results, and presentation of data. The major types of tests are employed for
analyzing data to interpret the results are parametric statistics or tests, and non-parametric
statistics or tests. A researcher has to select either of these approaches for analyzing his own
research data. The following are the criteria for choosing an appropriate statistical approach.
- Considerations for parametric statistics
Parametric statistical analysis may be employed effectively in the following conditions.
Probability or representative sample has been employed in the investigation
Variables of the study can be qualified at interval scale
Specific assumptions are fulfilled. The obtained data are normally distributed or not
free distribution
The population of the study has been clearly defined
- Considerations for on-parametric statistics
Non-parametric statistical analysis may be used effectively in the following situations.
When non-probability sample is selected in the research study
The variables of the study are quantified at any level of measurement, mainly,
nominal and ordinal scale. It may be in the discrete form
No assumption is required for this approach
Free distribution of data, may be skewed or may be normally distributed
9.11. Presentation of data
Presentation of data is an important aspect of analyzing of data. The purpose of presentation of
data is to highlight the results and to make data or results more illustrative. Visual presentation of
data or results is simple and easy to understand. The graphical and pictorial presentation provides

104
the geometrical image of data. It enables us to comprehend the essential features of the frequency
distribution. It also helps in observing the assumptions of the statistical analysis applied for the
treatment of data. It is basic for selecting a statistical test types and number of independent
variables. Presentation of data serves the following functions:
to visualize data
makes the data to comprehend easily
helps in understanding the nature of the distribution of data
the assumptions of statistical analysis can also be observed.
Generally, the following types of graphical presentation are used.
Bar diagrams and Histogram
Graphical presentation
Polygons and curve or Cumulative frequency curve
Pie diagrams
Activity 9.4:
List the types of graphical representation used in presentation of data.
9.12. Standard error of the mean (SEM)
Standard error of the mean, (SEM), is the means of randomly selected samples, has their own
standard deviation known as the standard deviation or standard error of the mean. The standard
error of mean of a sample is computed from the formula,
SEM or σM =
Where, SEM is standard error of mean, s is standard deviation of sample scores and n is size of
the sample
The standard error of sample means has a smaller value than the standard deviation of the
individual scores. This is understandable because in computing the means, which are middle

105
score values. From the formula SEM = , it is apparent that as the size of the sample increases,
the standard error of means decreases. As the sample n approaches infinity, the mean approaches
the population and the standard error of mean approaches zero.
SEM = = 0
As n is reduced in size and approaches one, the standard error of the mean approaches the value
of the standard deviation of the individual scores.
SEM = = S/1 = S
This analysis suggests that, other factors being equal statistical inferences based upon small
samples have larger margins of error than those based upon larger samples. The value of the true
mean of an infinite population is not known, for it cannot be calculated. But a particular mean
calculated from a randomly selected sample can be related to the population mean in the
following way. Approximately: 68 per cent of sample means will lie within a range of ± 1 SEM
of the population mean. 95 per cent of sample means will lie within ± 1.96 SEM of the population
mean. 99 per cent of sample means will lie within ± 2.58 SEM of the population mean.
The Standard error of the difference between two sample means the standard error of difference
between two independent sample means may be calculated by the following formula,
SE (M1-M2) = √[(s12/n1) + (s2
2/n2)]
Where, n1 = number of cases in first sample
n2 = number of cases in second sample
s1 = standard deviation of first sample
s2 = standard deviation of second sample.

106
9.13. Critical ratio (CR or Z)
Using this value, we may calculate the statistical significance of the differences between an
experimental and a control means, if the experimental sample group and the control sample
group are randomly selected from the same population. When the size of samples is large (more
than 30) we may calculate what is known as the critical ratio, (CR/Z) a ratio of the difference
between experimental and control means (numerator), and the standard error of the difference
between the two means (denominator).
CR = Z = (M1-M2)/ √[(s12/n1) + (s2
2/n2)]
Let us assume that an experiment is set up to compare the effectiveness of two methods of
teaching reading. Two groups are randomly selected from the same population, one designated
as the experimental group is taught by the initial teaching alphabet approach, while the other is
taught by the traditional alphabet method. At the end of the year a standardized reading test is
administered and the mean scores for each group are computed. The effectiveness of the
experimental group method as compared, with the effectiveness of the control group method is
the issue; with the end of year mean scores of each group, the basis of comparison. A mere
quantitative superiority of the experimental group means score over the control group mean
score is not conclusive proof of its superiority. Since we know that means drawn from same
population are not necessarily identical, any difference could possibly be attributed to sampling
error. The difference must be greater than that reasonably attributed to sampling error to be
statistically significant.
9.14. Level of significance
The rejection or acceptance of a null hypothesis is based upon some level of significance as a
criterion. In psychological and educational circle the 5 per cent level of significance (0.05) is
often accepted as a standard for rejection. Rejecting the null hypothesis at the 5 per cent level
indicates that a difference in means as large as that found between the experimental and control
group means would not likely have resulted from sampling error in more than 5 out of 100
replication of the experiment. This suggests 95 per cent likelihood or probability that the

107
difference was due to the experimental variable. A more rigorous test of significant is the 1 per
cent level (0.01). When the samples are large (more than 30) the critical ratio is expressed as Z,
or probability, score. If the critical ratio value exceeds 2.58, we may conclude that the difference
between means is significant at the 1 per cent level. If the critical ratio value is between 1.96 and
2.58, we may conclude that the difference between means is significant at 5 per cent, but not at 1
per cent level. If the critical ratio is less than 1.96 the null hypothesis must be accepted at the 5
per cent level. The following tests are used to confirm about acceptance or rejection of data‟s.
9.15. Tests of significance
9.15.1. Student’s distribution ‘t ’, t-test
Dear student, you learned about t-test in Analytical Chemistry course. Do you remember
the purpose of using this test?
This test is used to compare the experimental means of two sets of data or to compare the
experimental mean of one set of data with a reference value. It is also important to note that a
finding that is statistically significant may not useful in making a practical decision. When small
samples, fewer than 30 observations in number, are involved t-test is used to determine the
statistical significance. The concept of small sample size was developed by Gosset. Gosset
determined that the distribution curves of small samples were somewhat different from the
normal curve. Small sample distributions were observed to be higher at the mean and lower at
the tails or ends of distribution.
Gosset‟s distribution, carefully calculated for small samples, is partially reproduced in t-table.
The values necessary for rejection of a null hypothesis are higher for small samples at a given
level of significance. As the sample size increases, the„t‟ values approaches the size „z‟ values of
the normal probability table. To find the appropriate value necessary for rejection of the null
hypothesis the number of degrees of freedom should be calculated. For the test of significance of
the difference between two means the number of degrees of freedom would be:

108
(N1 – 1) + (N2 – 1) = N1 + N2 – 2, where N is number of cases
There are three possible situations in which student t can be considered.
Case 1: We measure a quantity several times, obtaining an average value and standard deviation.
We need to compare our answer with an accepted answer. The average is not exactly the same as
the accepted answer. Does our measured answer agree with the accepted answer “within
experimental error”?
Where x and µ calculated and true mean, s is pooled standard deviation and N is number of
replication
Case 2 We measure a quantity multiple times by two different methods that give two different
answers, each with its own standard deviation. Do the two results agree with each other “within
experimental error”?
Where XA and XB calculated means of two different data, s is pooled standard deviation and N
and M is number of replication
Case 3 Sample A is measured once by method 1 and once by method 2; the two measurements
do not give exactly the same result. Then a different sample, designated B, is measured once by
method 1 and once by method 2; and, again, the results are not exactly equal. The procedure is
repeated for n different samples. Do the two methods agree with each other “within experimental
error”?
Where xd difference of two means, s is difference of two standard deviation and N is number of
replication

109
For a test of significance of a small sample coefficient of correlation the number of degrees of
freedom would be (N – 2). Many „t‟ tables list values at various degrees of freedom for rejection
of the null hypothesis at 0.05 and the 0.01 level of significance. Some t-values of 95 % and 99
% level are given in table 9.1.
No of degrees of freedom 95 % level 99 % level
2 4.30 9.92
5 2.57 4.03
10 2.23 3.10
18 2.10 2.88
Table 9.1: Critical values of t at 95 % and 99 % (P = 0.05 and 0.01) levels for two-tailed test.
Using the appropriate equation, an experimental value, texptl, is calculated and compared with a
tabulated value, ttab, at a defined probability level, usually between 90% and 99%, and for N-1
degrees of freedom. If texptl < ttab, then the null hypothesis that there is no significant difference
between the two experimental means or between the experimental mean and a known value is
accepted. However, if texptl > ttab, there is a significant difference indicating a bias.
9.15.2. Analysis of variance, f-test
This test is used to compare the precisions of two sets of data which may originate from two
analysts in the same laboratory, two different methods of analysis for the same analyte or results
from two different laboratories.
A statistic, f, is defined as the ratio of the population variances, σ12/σ2
2, or the sample variances,
s12/s2
2, of the two sets of data where the larger variance is always placed in the numerator so that
F ≥1. If the variation of sample means from the grand mean is greater enough than the variance
of the individual scores from their sample means, the samples are different enough to reject a
null hypothesis or sampling error explanation. That means, as Fexptl is greater than Ftab, the null

110
hypothesis is rejected; the two methods are giving significantly different precisions. If the
among groups variance is not substantially greater than the within group variance, the samples
are not significantly different and probably behave as random samples from the same population.
- Example:
A proposed new method for the determination of sulfate in an industrial waste effluent is
compared with an existing method, giving the following results:
Method Mean/g dm-3 No. of replicates No. of degrees freedom s/mg dm-3
Existing 72 8 7 3.38
New 72 8 7 1.50
Is there a significant difference between the precisions of the two methods?
Fexptl = s2existing⁄s2
new = (3.38)2/(1.50)2 = 5.08
The two-tailed tabular value for F with 7 degrees of freedom for both the numerator and the
denominator is F7,7 = 5.00 at the 95% probability level. As Fexptl is greater than Ftab, the null
hypothesis is rejected; the two methods are giving significantly different precisions.
9.15.3. Dioxn test, Q-test
Also known as rejection test, this is one of several that have been devised to test suspected
outliers in a set of replicat. It involves the calculation of a ratio, Qexptl, defined as the absolute
difference between a suspect value and the value closest to it divided by the spread of all the
values in the set:
Qexptl = |suspect value − nearest value|/(largest value − smallest value)
Qexptl is then compared with a tabulated value, Qtab, at a selected level of probability, usually 90%
or 95%, for a set of n values. Some values Q are given in table 9.2.
Sample size Critical value
4 0.831
5 0.717
6 0.621
7 0.570
8 0.524
Table 9.2: Critical values of Q at the 95% (P = 0.05) level for a two-tailed test

111
If Qexptl < Qtab, then the null hypothesis that there is no significant difference between the suspect
value and the other values in the set is accepted, and the suspect value is retained for further data
processing. However, if Qexptl > Qtab, then the suspect value is regarded as an outlier and is
rejected. A rejected value should not be used in the remaining calculations.
Example:
Four replicate values were obtained for the determination of a pesticide in river water 0.403,
0.410, 0.401, 0.380 µg dm-3
Inspection of the data suggests that 0.380 µg dm-3 is a possible outlier.
Qexptl = |0.380 - 0.401|/(0.410 - 0.380) = 0.021/0.03 = 0.70
Qtab = 0.83 for four values at the 95% probability level
As Qexptl < Qtab, 0.380 µg dm-3 is not an outlier at the 95% level and should be retained.
Non-parametric tests
Non-parametric, or distribution free tests are used when the nature of the population distribution
is not known or when the data are expressed as nominal or ordinal measures. The variables in a
non-parametric test are usually presented in rank order or discrete values. Discrete data could
represent such classifications as high, medium or low, urban or rural or male or female, counting
number in each category. Non-parametric Statistics for the Behavioral Sciences Sidney Siegel
There are many types of non-parametric tests, which are most frequently used in the educational
research studies.

112
9.16. Self-test exercise
I. Fill the blank space with appropriate terms
1. A type of statistical data analysis that deals about numerical description of certain group
is ______________________.
2. The means of randomly selected samples having their own standard deviation is
called____________________.
3. A test applied when the nature of distribution of the data is not known is _____________.
4. The ratio of the difference between experimental means to standard error of the
difference between the two means is _____________.
5. A type of test, which is used to test presence of significant difference between means of
two sets of data is ____________.
II. Give an explanation for the following questions
1. Explain the phrase „analysis of data‟ or „treatment of data‟. Indicate the need and
importance of data analysis.
2. Differentiate between descriptive statistical analysis and inferential statistical analysis.
3. Distinguish between parametric statistics and non-parametric statistics. Indicate their uses
in different types of data or researches.
4. Describe the role of statistics and parameters in analyzing the data.

113
CHAPTER TEN
Scientific writing and Presentation
Objectives:
Up on successful completion of this chapter, the student able to
know what it mean scientific writing
learn about formats of research report
learn about research report and presentation of data
discuss about mechanic of report writing
explain about research paper
Dear student, do you some hint on scientific writing? What is the difference between
scientific writing and other types of writing?
The importance of a research study is to evaluate both scholastically and practically the contents
of the written proposal and report of the study. The merit of the problem and its adequacy is
examined based on research proposal and the contribution of the study is judged on the basis of
research report. However, scientific writing is not a simple task, it requires organizing ideas,
collecting supportive documents and creating a well organized structure.
Organizing ideas
The natural way we think is by creating structures. In order to understand any one piece of
information in more detail, we need to break it into pieces and see how those pieces fit together.
If we can perform those two operations on your message, it is possible to create a structure that
the reader's mind will find most natural to understand. That structure is made up of ideas. Ideas
can only be organized logically and not in any other way the structuring principle for the
document must be logic of some kind.
The task of writing requires organizing the message into pieces and writing them in a logical
sequence. Organizing information, here in this module is cited in three steps:

114
• creating a structure of ideas;
• collecting the evidence that will support those ideas;
• writing an outline that will show the key ideas and their relationships.
Creating a structure
Creating the structure of your document is done in two stages:
• First-stage thinking: generating ideas
• Second-stage thinking: organizing the ideas into a robust structure
First-stage thinking is sometimes called 'divergent' or 'radiant' thinking. During this stage, we
explore and gather anything and everything that we think we might be of interest or use. By
contrast, second-stage thinking is sometimes called 'convergent' or 'focused' thinking. This
organizes the material we have collected to support one or another of our ideas. Every bit of
evidence that we include must justify its existence, it can only do so in support of an idea.
We tend to be much better at second-stage thinking than at first-stage thinking. If we ignore first-
stage thinking, the amount of excellent second stage thinking can compensate for poor or
inadequate ideas. It is good to spend time in generating ideas before trying to assemble them into
a structure.
There are two techniques which can help the writer do develop good ideas.
• Mind-maps are powerful devices in first-stage thinking to help the writer gather and
initially sort ideas.
• Grouping and summarizing is a second-stage technique that helps the writer construct the
final pyramid of your ideas.
Activity 10.1:
What are the two stages in creating structure in writing?
10.1. Formats of research report
There are various formats of research writings; a researcher must understand its meaning and
purpose. The following are the major writings ways of a research work.
Research proposal or synopsis
Research report or thesis
115
Research summary and Research abstracts.
A short explanation for each of the above listed research writings is given here.
- A research proposal deals with problem or topic that is to be investigated. It has a variety
of formats, which vary in their length. Writing a research proposal or synopsis includes an
introductory section: problem hypotheses objectives, assumptions, method of study tools,
justification and implications of the study. It is written in present or future tense. It covers four to
ten pages. It is submitted for the final approval before starting the actual research work.
Preparation of research proposal is significant in the development and pursuit of a research
project. It is planning phase of a research work which is produced in the written form to judge its
worth.
- A research report deals with results of completed research work. After completing a
research work, it is generally produced in the written „form, and is called research report or
thesis. A detailed explanation on research report is given under section 10.2.
- A research summary is the condensed version of research report. It provides the
important aspects of research report or thesis. The purpose of research summary is to facilitate
the readers or other scholars to understand about work done at a glance because to go through a
research report, it is very time consuming and difficult. Therefore, the main features of research
report are summarized. It takes the form of research journal article or paper. A research abstract
is the condensed version of research summary.
- The main essence of the research work when reduced to a page or paragraph is called
research abstract. It includes title, method, sample and findings of the study. These abstracts are
published in the journal as abstracts.
10.2. Research report
Research report is a written document or oral presentation based on a written document that
communicates the purpose, scope, objective(s), hypotheses, methodology, findings, limitations
and finally, recommendations of a research project to others. Writing of research report is usually
the concluding task of the research. Everything is combined together during the writing of the
report. It is the point at which the research must be essentially reproduced in written form. It is a
matter of communicating what was done, what occurred, and what the results mean in a concise,

116
understandable, accurate and logical manner. This is not the difficult task because the researcher
has gone through these tasks which he has to reproduce in the same order. Good research reports
are not easily written.
Report writing is a skill it must be acquired by the researcher. Since the written report is an
account of research project, the organization of the report follows quite closely the organization
of the research project. The writing of the report is usually associated with the close of the
research for project; few portions of writing may be done while the research study is in progress.
The preliminary drafts of the review of the literature can be written and revised and brought up
to-date later. Research procedures can be recorded as the project is conducted and while it is
fresh in the researcher‟s mind. It is difficult to write from memory and avoid serious omissions.
The writer should assemble the available information‟s before taking to the writing work.
Mechanical procedures for presenting footnotes, references, figures, tables and the like should be
well in mind. In the interest of efficiency and continuity, relatively lot of time should be reserved
for the writing work. The research report should contain all the necessary data and at the same
time it should be brief and to the point. There is usually considerable changing and rewriting
before the final draft. The report is also known as thesis or dissertation.
Activity 10.2:
Could you define the term research report?
10.3. Need of research report
Dear student, could you explain the need of research report before reading the next portion?
A good research report requires sufficient experience and insight about his research activities.
Writing a research report is due to the following reasons:
• The research must be reported in full and its results should be subjected to a criticism and
verification.
• The research work is done for the benefit of human being; therefore, it must be
communicable to the general public for the practical use.
• The research should be considered to be the culminating act for reflective thinking. It
encourages other persons to take up some problem for further investigation.

117
• The research report requires the creative thinking of a researcher to review the related
studies and discussing the result of the study and also suggest some new problems for
further studies.
• The research report is also necessary for giving shape and form to the investigation.
• It is needed for providing a clear picture of research method, sample and techniques used in
conducting the research work.
• The research report is for popularizing the new contributions in the discipline.
10.4. Format of research report
A written format of a research work is known as thesis or research report. A research report or
thesis is an organized format of research work done. Research works may differ considerably in
scope of treatment and details of presentation. Even though all types of research reports are
expected to follow a general uniform, common pattern of format, style and structure. It is
organized in to three major categories preliminary, main body and references.
Preliminary section
• Title page
• Preface or acknowledgements
• Table of content
• List of tables
• List of figures
Main body of report
Introduction
- Statement of the problem
- Objectives of the study
- Hypotheses to be tested
- Significance of the problem
- Assumptions and delimitations
- Definitions of Important terms used
Review of related literature.
Design of the study

118
- Method and procedure used
- Tools of research or sources of data
- Techniques of data collection
- Description of techniques used.
Analysis and presentation of data
- Analysis of data
- Tables and interpretation
- Figures and interpretation
Conclusions
- Discussion of results
- Main Findings and inferences
- Implication of the findings and limitations
- Suggestions for further studies
Reference Section
• Bibliography
• Appendices
• Index or glossary
Activity 10.3:
Mention the three main sections of a report.
10.4.1. Preliminary section
As the preliminaries form a significant part of the whole thesis report, care should be taken in
preparing them. If some colleges or universities already lay down the specifications, it should be
observed. However, a general standard pattern suggested here in each case will be helpful for a
researcher.
- Title page
Title page is the first page of a thesis or a dissertation. It includes title of thesis, name of the
candidate, purpose or relationship of the thesis to the course or degree requirement college
and/or department in which the candidate has been admitted for the degree, name of the

119
university to which it is submitted and month and year of submission or acceptance. The title
should be specific, accurate, concise and clearly printed in capital letters. It should convey the
main theme of the problem investigated and if possible, one should give a clue about the method
or type of research involved.
- Preface or acknowledgement
A preface is different from introduction. It is a brief account of the purport or the origin and the
utility of the study for which the thesis is presented. It also includes the acknowledgement to the
persons and sources that have been helpful to the investigator. If the researcher does not want to
mention anything about the study on this page except acknowledging debt to others, it will be
desirable to use the title simple and restrained without flattery and effusive recognition for help
by the family members and others. The preface should not be too long with too many details
about the research work or its organization, which can appear in introduction. It should be
written in an impressive way.
- Table of contents
This section contains lists of all the main chapter headings and the essential sub-heading in each
with the appropriate page numbers against each. The listing of main chapters is generally
preceded by some preliminaries like preface or acknowledgement, list of tables, list of figures,
abstract or synopsis and the respective pages are given in small Roman numbers. Contents
should neither be too detailed nor too sketchy. The table of contents should serve an important
purpose in providing an outline of the contents of the report.
- List of tables
The table of contents is followed by the list of tables on a separate page. This list of tables
consists of the titles or captions of the tables included “in the thesis along with the page number
where these can be located. It has been illustrated here. The capitalized title „LIST OF TABLES‟
should be the central heading of the page.

120
- List of figures and illustrations
If any charts graphs or any other illustrations are used in the thesis, a list of figures on a separate
page is prepared in the same form as the list of tables except that they are numbered with Arabic
numbers.
10.4.2. Main body of report
The text of the thesis is the most important section in the organization of research report. The
quality of worth of thesis is mainly examined with the content of the main body. It is the original
result of the researcher. The report main body serves for the function of demonstrating the
competence of the researcher. If any sentence, paragraph, concept fails to serve the single
function within a given section or chapter, it is irrelevant to the subject matter. Generally the
main body of the research report consists of five or six chapters.
Chapter I: Introduction or theoretical frame work
The main purpose of this chapter is to indicate the need and scope of the study. It consists
essentially of the statement of research inquiry. The problem objectives, hypotheses, assumptions
and delimitations of the study are reported precisely. The researcher should make certain that it is
an introduction that generates an interest and appropriate mental set which introductions are
regarded as capable of producing. It must be long enough to do its jobs and nothing more.
Chapter II: Review of related literature
This chapter is essential in most of the research studies. It presents the comprehensive
development of the problem background. It indicates what has already been studied by others,
which has a bearing upon the present study. The review of literature stresses two aspects: the
first is the consideration of the subject matter and it is likely more important than the other. The
second is related to methodology and design. The review chapter is devoted to the development
of the problem statement or the object of the inquiry. The review is utilized to retain a direct
relevancy to the study in hand. It is the balancing chapter of the research report.

121
Chapter III: Design or methodology
This chapter indicates the line of approach of the study. The first aspect deals with the method,
population and sample of the study and the second part provides the tools and techniques
employed in the research. It also presents the procedure of the study. The whole plan of the study
should be discussed in detail under this chapter. Administration of tools and scoring procedure
are reported systematically. The data organization and presentation should be given in this
section.
Chapter IV: Experimentation or administration of tools and scoring
In this chapter analysis and results are reported so as to draw the inferences of the study. The
analysis of data is presented in tabular form and in figures or pictorial presentation. The results
are interpreted at length. This chapter provides information about contribution of the researcher.
Communicative accuracy is required in this chapter. The text must be developed to ensure an
effective ordering of the evidences.
Chapter V: Analysis and interpretation of data
It is the most important chapter of research report. It requires the creative and reflective aspect of
the researcher. The results are discussed to make them more meaningful comparison of the
results with the evidence in the review section should be woven into the text whenever such a
discussion can serve to clarify the points being reported. This is the final chapter of a report, thus
findings of the study are summarized and suggestions for the further studies are also given here.
The implications and delimitations of the findings are also mentioned in this section. The main
thrust in the section is the answer of the question or solution of the problem. The validity of the
findings should be mentioned.
Chapter VI: Conclusions and suggestions for the further researches
It is the third section of a research report. It consists of bibliography and appendices. It is also
essential to include glossary and index for the convenience of the readers. The bibliography,
appendix, glossary and index all these are written on a separate page.

122
10.4.3. Reference section
It consists of generally the bibliography and appendices. It is also essential to include glossary
and index for the convenience of the readers. The bibliography, appendix, glossary and index all
these are written on a separate page.
Bibliography
Bibliography is a list of information sources utilized in the research work. The publications used
for information yield but not quoted in the report may also be included in the bibliography. The
format of the bibliography depends on the footnote style. If the footnotes references in the text
are numbered to refer to the source in the bibliography, the entries must be numerically listed in
the order of appearance in the text. The various format manuals include information on form for
the bibliography. If the list of sources is too large the bibliography should be categorized in the
following sections: Books, monographs, documents and reports, periodicals and journals, essay
and articles, unpublished thesis and material and newspapers. If selected source is reported, it
should be specified as „selected bibliography‟. In writing bibliography, the surname is written
first than initials, year of publication, title of the book, publishers name, place and total number
of pages is written sequentially. Some examples of writing bibliography are given here.
Example for single author:
Best, John. W (1977) „Research in Education‟, 3rd ed., New Jersy : Prentice-Hall Inc.
Englewood Cliffs, 403 pp.
Example for two authors:
The only difference is that second author‟s name is written differently i.e. initial first and
surname at the end in a usual manner.
McGrath, J.H. and D. Gene Watts on (1970) „Research Methods and Designs for
Education‟ Pennsylvania: International Text-Book Company, 222 pp.
Example for three or more authors:
Selltiz, Claire et al. (1959) “Research Method in Social Relations‟, New York: Holt,
Rinehart and Winston, 424 pp.
Example for editor as author:
Buros, Oscar K. ed. (1965) „The Sixth Mental Measurement‟, Yearbook: Highland Park,

123
N.J. : Gryphon Press 1163 pp.
Example for author not given:
Author‟s Guide (1955) Englewood Cliffs, N.J. Prentice Hall, 121 pp.
Example for publication of an association, Agency or Society:
National Society for the study of Education (1955), „Modern Philosophies of Education‟
54th Yearbook, Part-I, The University of Chicago Press, Chicago 37 pp.
Or „Modern Philosophies of Education‟ (1955), National Society for the Study of
Education, 54th Yearbook Part-I, Chicago: The Chicago University Press 374 pp.
Example for unpublished thesis:
Sharma, R.A. (1972), „Some Predictors of Teacher Effectiveness‟ Unpublished” Ph.D.
Thesis Submitted to Meerut University, 320 pp.
Article in an Encyclopaedia and Hand Book:
Barr, A.S. (1944), „Criteria of Teacher-Effectiveness‟ Ebel‟s Encyclopaedia of
Educational Research, 742 p.
Smith, B.O. (1964), „Relationship of Teaching and Learning‟, Gage, Hand Book of
Research in Teaching, 426 p.
Example for Journals and Periodicals:
Bar, A.S. (1940), „The Measurement and Prediction of Teaching Efficiency,‟ Review of
Educational Research, Vol. 10, No. 4, pp. 185-190.
Leeds, C.H. (1969), Predictive Validity of MTAII‟, The Journal of Teacher Education,
Vol.20 No.1.
A chapter written by an author other than the editor:
Maccoby E.E. (1954), „The interview: A tool of social science‟,‟ Chapter 12, in the Hand
Book of Social Psychology, Addison, Wesley Cambridge Mass.
Quotations primary source cannot be located:
Kelley, E.P. (1950), „Education for what is real‟, As cited by Edward A. Krug,
„Curriculum Planning‟, New York: Harper and Row Publishers, 55 pp.
The place of publication may be written before the home of publishers e.g. New York:
Harper and Row Publishers, 55 pp

124
A bibliography reference is written in the following manner and arranged alphabetically.
• Name of the author with the last name first and initials afterwards
• The year of publication is given in bracket after the name of the author and authors
• Title of the book or the work is written, underlined and followed by a full stop (.)
• Place of Publication followed by a colon (:)
• Name of the publishing agency and publishers and followed by comma (,)
• Total pages of the book are given.
The above sequence is employed in preparing bibliographical references. It is also used forgiving
footnotes reference with a little deviation. In footnote the name of the author with the Initials
first followed by surname or last name is given. The specific page number of the work or the
book is given not the total pages. Other things remain the same as mentioned in the bibliography.
The bibliography pages are also written in Arabic figure in the sequence of main body of the
report.
Appendix
An appendix includes the material, which cannot be logically included in the main body or
textual body of the research report or the relevant materials too unwieldy to include in the main
body. The appendix usually includes tools of research, statistical tables and sometime raw-data
(when data were processed through computer). Even the material of minor importance e.g.
forms, letters, reminders, interview sheets, blank questionnaires, charts, tables, lengthy questions,
report of cases (if follow-up or case studies have been conducted). The tools and other material
should be placed first and tables at the end and page numbers should be assigned in Roman
numbers (i, ii, xxi). The appendix serves for the function of providing greater clarity and
authenticity for the readers or consumers of the thesis. The items of the appendix are very
essential for a good research report.
Index and glossary
When a research report is published, index must be given. The index includes authors, subjects
and topics or words in alphabetical order. In the report glossary should be provided. It includes
the meanings or definitions of some words and terms „used in the research report. Some
notations symbols or abbreviations should be explained what actually they mean or indicate.

125
Activity 10.4:
What is the importance of appendix in report?
10.5. Mechanics of report writing
Dear student, could you guess the meaning of mechanics of report writing?
Research report writing is a highly technical activity. It includes various mechanics for a smooth
flow of the thesis. The mechanical aspect must be followed by researcher has been standardized
in preparing a thesis. Such mechanics involve the following issues:
Footnotes and references,
Style of writing,
Headings,
Tables,
Figures,
Pagination,
Proof reading, and
Binding and submission
- Footnotes
Sometimes it is desirable to quote some authoritative views or statements from written works of
others in the research report. It may be necessary from various purposes viz. to review the related
literature, to support to give the rationale for one‟s viewpoint. Each quotation must have a
footnote or reference indicating the sources from which it is borrowed. All these sources and
authority should be acknowledged both for intellectual honesty and for validity of one‟s research.
Footnotes serve a number of purposes. They enable the researcher to substantiate his presentation
by quotations or citations of other authorities, to give credit to sources of material that he has
reported and to provide the reader with specific sources that he may use to verify the authenticity
and accuracy of material quoted.
The citation or quoted statements are written in single spaced whereas the text is written double
spaced. The footnotes are placed at the bottom of the page and are separated from the text by a

126
three cms horizontal line drawn from the left margin. Footnotes are numbered consecutively
within a chapter. The recent approach is that references are given in the place of footnotes. The
reference of quoted material is inserted in parentheses at the end of the sentence. For example,
(4: 72) indicates that the statement refers to the bibliography listing number 4, page 72. Another
procedure is that all the references are placed on one page at the end of the chapter in the
sequence of quoted statements.
Method of writing footnotes:
Usually the footnotes are given at bottom of the page at the end of the text according to the
number of quotations provided on it. The following examples illustrate the style of writing
footnotes:
Single author
John W. Best. (1977), „Research in Education‟ 3rd ed. New Jersey: Prentice-Hall,
Inc., Englewood Cliff, 84 p.
Two authors:
J.H. MC. Grath and D. Gene Wattson (1970), „Research Methods and Designs for
Education‟, Pennsylvania International Text-book Company, 124 p.
It may be noted that in footnotes and bibliography that the author‟s last name or surname is
written first in bibliography while last name or surname is given in usual way or in the last.
Second difference between these two can be gathered regarding page total number pages of the
book are written in bibliography and specific page number of the book is recorded on the foot
notes (p stands for a specific page number and pp for total pages) where the quotation has been
given in the book. In this way eleven types of bibliography have been illustrated in this chapter,
with this difference eleven types of footnotes can also be written. To avoid repetition and making
economy of time and space some abbreviations are used in writing the footnotes references.
Usually the following three types of abbreviation are employed.
Ibid, in consecutive reference to the same work the Latin abbreviation, Ibid (Indicates same page
as earlier footnote), Ibid p. 36 (same work, but a different page 36) is used.

127
Op. Ci., when a reference to the same work is not used in consecutive but after some other
references, the Latin abbreviation op. cit. (indicates the work already cited in the report). The
surname of the author and op. cit. is used. If the page number of the book is different, in this
situation op. cit. and page number along the surname is used. The examples are as follows:
- Chaube, op. it (the work cited).
- Chaucer, op. cit. page 48 (the work cited on page 48).
Loc. Chi., when a second but non-consecutive reference follows, referring to the same work and
same page, the Latin abbreviation Loc-cit (previously cited) may be used. The authors surname
along Loc. cit must be included. An example is given below:
- Chaturvedi, Loc. cit (previously cited on page 48)
10.6. Writing research abstract
Dear student, could you say something about abstract before going through the next
reading?
A well-written abstract is a great service to everyone who is going through the research process.
Abstracts are main method, which is used to communicate research findings and contributions to
the works of the field studied. Generally, a researcher has to prepare an abstract after completing
his research thesis or report. There are two procedures in this regard:
• The abstract is provided in the main body of the research report in the form of last chapter
of the thesis.
• The abstract or summary of the report is prepared separately in a booklet form.
Most of the universities require some copies of the abstract at the time of a submission of a thesis
for evaluation purpose. It facilitates the examiners or experts to evaluate a research thesis
properly.
10.6.1. Importance of abstract
- Research reports are voluminous and hence these require time and energy to go through
them. An abstract provides the awareness of the research work at a glance. It facilitates the

128
readers and other research works to comprehend it easily and quickly. It means to communicate a
research contribution in the field.
- The experts or examiners make use of the abstract in evaluating research thesis. „It
communicates the work done by researcher and reviews of the same aspects wherever they
require further clarifications. Other researchers of the field to review the studies conducted in
this area can use the abstracts.
It is an economical device for reviewing the related studies. The research papers are prepared
with the help of the abstract. These papers are published in research journals and papers to
disseminate the knowledge in the area. The research organizations universities and institutes can
register the research abstracts for financial assistance. The research thesis is approved for
publication on the basis of reviewing abstract and financial assistance is granted for its
publication.
10.6.2. Format of abstract
A summary of a research report or thesis is prepared in the form of abstract. It provides the brief
description of main points of research report. The main theme is given in the abstract of a
research work. It should be able to communicate the whole work comprehensively. There are
two formats for preparing abstract:
First type format
It includes main points and theme of research work in brief. Introduction, main body of the text
and conclusions included. The introduction part covers the problem, adjectives, hypothesis and
theoretical aspect. The main body of the text includes, method sample techniques, tools used
results. The last part of abstract provides the conclusions of the study in the statement form along
with their implications in the field.
Second type format
It includes the summary of the chapters of the research report. The main theme of each chapter is
given in this type of format of abstract. This format is used in philosophical, historical and
descriptive type of research in the area of education.

129
Usually a research abstract consists of three main parts, introduction, main body of the report,
and conclusions. The introductory part emphasizes the significance of the problem, objectives
and hypotheses (if any) of the study. The main body includes methods, sampling, techniques,
tools and results of the study. The last part provides contributions or conclusions of the study.
The implication of the findings is also highlighted at the end. The structure of the report is also
given and most important references are also written in the form of bibliography. The abstract is
written in past tense and in the third person.
10.6.3. Characteristics of a good abstract
A good abstract has the following characteristics:
It is economical device to communicate the contributions of a research work.
It is written in simple and clear language.
An abstract disseminates the new knowledge in field studied.
It avoids the repetition of research studies.
It helps the researcher to review the related study in an economical way from time,
money and energy point of view.
The specialist or experts give their comments and suggestions for further
investigation.
A good abstract provides the basis for preparing research papers.
10.7. Research papers
Dear student, do you know about research paper? Do you expect that any similarity is
there with research report?
A scientific experiment is not complete until the results have been published and understood.
The ultimate goal of scientific research is publication. A research (scientific) paper is a written
and published report describing original research results. It is defined as an accepted original
scientific publication containing scientific information. The purpose of scientific writing is to
communicate new scientific findings. Thus, it has to be clear, simple and well ordered
communication to transmit new scientific findings

130
Unlike the research report, the research paper describes about a single topic. Research report or
thesis may present all or most of the data obtained in the student‟s thesis related research and
longer than a scientific paper. However, research paper is presentation of the result of such a
critical inquiry. It must be the first publication of original research results,
1. In a form whereby peers of the author can repeat the experiments and test the
conclusions, and
2. In a journal or other source document readily available within the scientific community
10.7.1. Format of a research paper
There is no fixed format for writing a research paper. Each individual has to develop his own
approach. However, a broad guideline can be evolved on the basis of experiences of many
researchers. An outline of the research paper should be prepared before details are written down.
A good outline will help in the proper structuring or designing of a research paper. It will involve
all the relevant points in an effective sequence, which will provide direction to the flow of
writing research paper. Before an outline is prepared, it will be necessary to make a list of all the
points and to determine their status either as major or supplementary materials. A working
outline can be prepared by combining these points in sequence.
10.7.2. Essential parts of a research paper
Title: Describes concisely the core contents of the paper
A good title is defined as the fewest possible words that adequately describe the contents of the
paper. The title is extremely important and must be chosen with great care as it will be read by
thousands, whereas few will read the entire paper Indexing and abstracting of the paper depends
on the accuracy of the title. An improperly titled paper will get lost and will never be read. Waste
words such as studies on, investigations on, a, an, the etc should not be used. Syntax (word
order) must be considered and contain the keywords that reflect the contents of the paper. It
should be meaning full, concise, specific and informative. Moreover, should capture the
fundamental nature of the experiments and findings.

131
Abstract: Summarizes the major elements of the paper
An abstract can be defined as a summary of the information in a document. It is of fundamental
importance that the abstract be written clearly and simply, as it is the first and sometimes the
only part of the manuscript read. It should provide a brief summary of each of the main sections
of the paper the principal objective, scope of the investigation, methods used, results, and state
the principal conclusions
Introduction: provides context and rationale for the study
The introduction should answer questions of, what was I studying? Why was this an important
question? What did I know about this topic before I did this study? What was I testing? And
what approach did I take in this study?
Materials and methods : Describes the experimental design and procedures
It provides full details so that the experiments are reproducible. The methods should be
organized under subheadings, with related methods described together (e.g. subjects,
experimental design, Measurement of…, etc…). Some results should not be mixed and past tense
must be used.
Results: Summarizes the findings without interpretation
It is the core or heart of the paper. It needs to be clear and stated simply since it constitutes the
new knowledge contributed to the world. The purpose of this section is to summarize and
illustrate the findings in an orderly and logical sequence, without interpretation The text should
guide the reader through the findings, by giving stress to the major points.
Discussion: Interprets the findings of the study
It is the hardest section to write. Its primary purpose is to show the relationships among observed
facts. It should end with a short summary or conclusion regarding the significance of the work.
PPrinciples, relationships, and generalizations shown by the results should be discussed. Under
this part, exceptions or any lack of correlation and unsettled points should be pointed out,
comparison between the present work interpretations and the previous study should be done and
the theoretical implications of the work should be stated and concluded as clearly as possible.

132
Summary: Summarizes the findings
Acknowledgement: Gives credit to those who helped you
Any significant technical help that have received from any individual in laboratory or elsewhere,
source of special equipment, cultures, or any other material, outside financial assistance, such as
grants, contracts or fellowships should be acknowledged. Do not use the word “wish”, simply
write “I thank …..” and not “I wish to thank…”
References: List all scientific papers, books and websites that are cited
Referencing is a standardized way of acknowledging the sources of information and ideas that
you have used in your document. All the references used in the text must be listed under this
section. Different scholars are using different formats of reference writing. The most widely used
ones are: Harvard format (the name and year system), Alphabet-Number system, Citation order
system
Name and year system:
It is mostly used referencing way. Citation in the text is followed by the author‟s last name and
year of publication between parentheses.
– If two authors are there, both last names will be written. Example, A. Asa & B. Emmer
(2011)
– If more than two authors involved, the first author‟s name is written followed by the
abbreviation et al, For example, S. Emma et at (2012)
If a single statement requires more than one citation then the references will be arranged
chronologically from oldest to more recent, separated by semicolons. If more than one reference
shares the same year then they will be arranged alphabetically within the year. The reference list
is arranged alphabetically by author. If an item has no author, it is cited by title, and included in
the alphabetical list using the first significant word of the title. If more than one item has the
same author, list the items chronologically, starting with the earliest publication. Each reference
appears on a new line. There is no indentation of the references and no numbering of the
references is required.

133
Alphabet-number system:
It is a modified form of name and year system. Citation by number from an alphabetically
arranged numbered reference list is given. It the same as name and year citation except number is
given to each reference.
Example:
1. Robert Day (1995): How to write and publish a scientific paper. 4 th Edition, Cambridge
University Press
Citation order system:
In this citation method, reference list is arranged by the number given to the citation order as it
was mentioned in the text.
10.8. Writing research paper
Dear student, what procedures should be followed in writing research report?
Writing a research paper involves certain procedures that is followed in proper sequence, might
avoid waste of time, energy and resources. The writer of a research article has to rely on two
kinds of source of information called as primary and secondary on the basis of the evaluation of
their trust worthiness. Similarly, he has to be extremely cautious in the discrimination between
facts and opinions though both are important elements in the arguments and chain of reasoning.
A „fact‟ is anything which is known to exist or which is accepted as true. There is no need to
substantiate well known facts like the birth dates of contemporary leaders or events. A research
paper has to present a number of opinions as expressed by others or researcher himself. It is
necessary to document those opinions of others by pin- pointing their sources so that anyone if in
doubt can verify them. It is a sound policy and good convention to keep facts separated from
opinions, especially the author‟s own, in a research paper. Any mixture of them there will lower
the credibility of the paper as a scholarly piece of writing. Writing a paper has the following five
steps.

134
10.8.1. Developing the concept
Important questions such as why we want to publish; what specific topic we want to write about;
what is the most important message we want to convey; who we are writing for; which journal
we plan to submit your paper to should be clarified before starting the writing. Creating a
message and Organizing ideas is the first step before start to write. The structure of such papers
is largely determined by the content of the arguments presented. You will find all the help you
need in writing such papers in that section.
10.8.2. Preparing an outline
Preparing an outline is the most important step - after defining your message. This helps to
clarify the thinking and establish a framework for writing the paper. Preparing a quick sketch of
outline helps you to gain an overview of your paper. To write well, you need an outline. To
prepare an outline, you need to make notes on main message, the principal objectives or
hypotheses, materials and methods, principal findings, main conclusions and on the key points of
introduction.
10.8.3. Writing the first draft
Using the outline that you have sketched, we will prompt you with a series of questions designed
to ensure that you have covered all the major issues, core ideas, that the referees are likely to be
concerned about. A detailed note that can be used to write your draft paper must present in your
hand. Some of it will already be written, some of it will need to be translated into a narrative
form. It is advisable to take a break before start to write, take a break and do something
completely different from the writing task. One the writing task is started, the following
approaches are strongly recommended.
- Writing quickly
Once the writing is started don't consider over the correctness of words, keep going and leave
gaps if necessary. It is good to focus for achievement of natural flow.
- Using one’s own way of writing
Write in your own way, using your own expression will help you to say what you mean more
exactly. That is your voice and it will be easier for the reader if they can 'hear' you.

135
- Writing without interruption
Arrange the situation to find a time and place where you can think and write without distractions.
- Writing without editing
It is not advisable to edit simultaneously with writing. Never expect to get everything write in
first draft. Resist the temptation to edit as you go. If so you will tend to get stuck and waste time.
- Keeping to the outline
To focus what the researcher want to say it is recommended to use the sentences from your
outline. If the writer find himself/herself wandering from the point, it is good to stop and move
on to the next sentence in the outline.
Styles in writing research paper
Writing for paper is different from most other forms of writing because journals insist on a
uniformity of style in the papers that they publish. If you understand the conventions established
by journals, you will find it easier to write your paper. There are four things that cause most
people difficulties: those are use of verb tense; use of we, I or it; writing to suit the habits of the
reader; and brevity.
- Verb tense
Although the standard rule is that you should write in the past tense, in practice things are not
that simple. In English, the tense changes depending on what you are writing about. When
writing a report what you found or what you did, and what happened in your study must be
written in past tense. However, when you describe findings in other people's publications, it
should be written with present tense. For example, Gedde and Ferriccio showed (past tense) that
there is (present tense) no association between with tense. Because in English, the present tense
implies that what is being described has the status of an established truth and it implies that this
is an accepted and established truth. When we refer to anything that has been published in the
scientific press by others, you show respect for their work by using the present tense. But you are
expected to be modest about your own work. In fact, anything that can be taken as established
fact is referred to in the present tense.

136
- Using I, we and/or it
In the past it was conventional for papers to be written in the third person. Authors would
describe how, for example, The experiments were performed.... instead of We performed the
experiments ....can be used. You will find many publications in which authors use the passive
voice because they believe they are demonstrating their objectivity, that they are presenting data
in a neutral way. Although some editors still prefer the passive voice, a growing number will
permit, or insist that you use, the active voice. Researchers should, they believe, take
responsibility for their work by using 'I' or 'we'. The advantage of using the first person (I/we) is
that it encourages the writer to use active rather than passive verbs. Active verbs are more
powerful than passive. However, don't be dogmatic and it often helps to vary the style it makes
the text easier to read.
10.8.3.1. Editing the draft
Editing means making wise choices on the words should be used and the order to put them in.
There is never a single correct answer. Effective editing can be done with the following
approaches.
- Ask for a second opinion: It strongly recommended giving to a colleague or friend,
whose opinion you respect. It's important, however, that you make the final editing choices.
- Edit on paper, not on screen: Editing on paper (hard copy) helps to look at more
objectively than on a screen.
- Edit for clarity: It is recommended to use plain English. Plain English means activate
passive verbs; strong, clear, specific verbs; and remove unnecessary words.
- Edit systematically: Three levels editing is recommended. Those are paragraphs,
sentences and words editing. Trying to improve your work word by word is time-consuming and
tedious. Before publication showing the draft to a colleague and asking them to point out errors
and where the writing is not clear is very important.
10.8.4. Topping and tailing
Title, abstract, list of authors, references, acknowledgements and the other embellishments that
are required by journals are written at this stage. At this stage the writing is completed and being
137
ready for publication, however not yet published to be a research paper and called a manuscript.
Giving appropriate title is crucial issue because many more peoples will the title with reading the
content. That means improperly titled paper couldn‟t achieve the desired objective. Traditionally,
the title is considered as a summary of scientific paper to deliver accurate information. Abstract
is of research paper is a summary of the work that contains important things what we want to
deliver in shortest way, not more than 400 words or a single paragraph. In some journals key
words also require to be cited with the abstract. The purpose putting key words is for indexing
purpose.
10.8.5. Publishing research paper
After the paper is edited effectively, the writer should be aware of the journal's guidelines for
authors to makes sure you comply precisely with the instructions. When the paper is accepted for
publication, the editor may make a number of changes to it like correcting any grammar and
spelling mistakes; standardizing spellings, abbreviations, units of measurements, etc, according
to the journal's house style. This process is known as copy-editing. The paper then goes to the
typesetter, who will produce proofs. These proofs will usually look like the pages of the
published journal. Finally, a copy of the proofs sent to the researcher and asked to check them
carefully for any errors.
The importance of proof-reading is to make sure that the printed paper is correct in every way.
The most common errors are typographical: misspelled words, incorrect punctuation marks,
figures transposed. Even if you submitted your paper on disk after carefully checking it for
mistakes, do not assume that there will be no typographical mistakes in the proofs. Errors might
have been introduced during copy-editing or typesetting. The researcher should proof-read the
paper twice. It requires checking the proof against copy, i.e. checking every word and figuring
against the original typescript.
10.8.6. Presentation of research paper
If a scientific research has done, it is expected to make a slide presentation in the departmental
seminar, at a professional meeting or at a job interview. Before any oral presentation, the
presenter needs to prepare him/herself for the intensity that feels while speaking. Practicing is
important, but the presenter also needs to be relaxed and enthusiastic about the speech. Knowing

138
the audience is the other important thing. The audience might be Scientists expert in your field,
Scientists not expert in your field Students or non experts. Most likely, a mix so have something
for all these audience is expected and the presenter try to address all of them. Present specific
aspects that show the “meat” of your work, if you were convincing they will read your paper,
leave the rest out. Don‟t fill up your slides with lots of equations and prepare back-up slides to
answer questions. Timing is critical during the speech and the presenter should recognize the
time allotted for presentation during preparation of slides and delivery the talk.
10.8.6.1. Preparation of slides and deliverying
Dear student, what is important to perform presentation?
- Preparetion of slides
Prepare the slides in advance and show them to friends for correction. Less is more, an important
proverb here. Put only key words and fill in with narration not words. It is advisable to use
animation sparingly. To emphasize some points use colors, however, limit too few types, not
more than three types. Consistency in the choice and use of color font size/type is very
important. To obtain the audience attention on what you are saying, show one point at a time and
helps to focus the presentation. Use different size fonts for main points and secondary points
and use a standard font like Times New Roman or Arial with appropriate background. It is
recommended to use graphs rather than just charts and words. Data in graphs is easier to
comprehend & retain than is raw data and becomes easier to visualize in graph form however,
title your graphs. Practicing ahead with friends and accepting comments helps to perform good
presentation.
- Delivering the talk
The presenter should dress properly and stand face to the audience with good body language.
The talk should be started with introducing him/herself, the advisor. Up on delivering the talk
she/he has to be enthusiastic, unless he/she is not enthusiastic how the audience does so. Having
an eye contact with the audience, identify a few nodders, and speak on them makes the
presentation more preferable. Point at the screen not the computer and it is not advisable to read
directly from the slide. Finish on time and anticipate questions and suggestion from audiences.
Give clarification for questions raised but never allow them to postpone the talk on raised issues.
139
10.8.7. Advantages of research Paper
- The new contribution in the specific area is disseminated among other research scholars.
- The repetition can be avoided others will not take up the same problem.
- It comes before textbooks and application products. - It‟s an important medium for scientific discussion and debate
- It saves the time energy and money in the research area.
- A research worker is also known through the research papers that he is working in a
particular field.
- The experts of the area may comment or suggest for the researcher to design further study.
- The research worker learns and gains experience for writing good research paper.
10.9. Plagiarism
Dear student, did you heard about plagiarism earlier?
The word plagiarism is defined as “use or close imitation of the language and thoughts of
another author and the representation of them as one's own original work ”. (Random House
compact Unabridged Dictionary, 1995)
To avoid plagiarism acknowledge both quotations and use paraphrasing. Paraphrasing is an
indirect quotation by restatement of a text using other words. Failing to cite a source for any of
the ideas or facts taken is also considered as plagiarism. Writing with one‟s own words by taking
ideas from others is strongly recommended. Instead of coping someone‟s ideas even the writing
ways, the researcher is expected to generate ideas for his findings and to explain the situation
with his/hers own writing way. This leads to progress in the scientific development and through
this process the writer enable to develop a new insight to the study area. The following example
provides you about the acceptable and unacceptable form of paraphrasing.
Original text:
The rise of industry, the growth of cities, and the expansion of the population were the three
great developments of late nineteenth century American history. As new, larger, steam-powered
factories became a feature of the American landscape in the East, they transformed farm hands
into industrial laborers, and provided jobs for a rising tide of immigrants. With industry came

140
urbanization the growth of large cities (like Fall River, Massachusetts, where the Bordens lived)
which became the centers of production as well as of commerce and trade.
Acceptable paraphrase:
Fall River, where the Borden family lived, was typical of northeastern industrial cities of the
nineteenth century. Steam powered production had shifted labor from agriculture to
manufacturing, and as immigrants arrived in the US, they found work in these new factories. As
a result, populations grew, and large urban areas arose. Fall River was one of these
manufacturing and commercial centers (Williams 1)
Unacceptable paraphrase:
The increase of industry, the growth of cities, and the explosion of the population were three
large factors of nineteenth century America. As steam-driven companies became more visible in
the eastern part of the country, they changed farm hands into factory workers and provided jobs
for the large wave of immigrants. With industry came the growth of large cities like Fall River
where the Bordens lived that turned into centers of commerce and trade as well as production.

141
10.10. Self-test exercise
I. Fill the blank space with appropriate terms
1. A written format of a research work is called_______________________.
2. Use or close imitation of the language and thoughts of another author and the
representation of them as one's own original work____________________.
3. A written and published report describing original research results is ____________.
4. A part of preliminary section which contains title of the report________________.
5. An important chapter, in the main body of report, which requires creativity and
critical thinking, is called____________________.
6. List of information sources used in the research work is called ________________.
7. The part of report, which includes relevant materials too unwieldy to include in the
main body is _________________.
II. Give an explanation for the following questions
1. Explain the following terms used in a research.
• Research proposal
• Research report, or thesis or dissertation,
2. What do you understand by research report or thesis? Indicate its need and importance in
the research work.
3. Distinguish between research report and research paper.
4. Discuss the general format of research report.
5. Differentiate between bibliography and footnotes or references.
6. Point out the mechanics of report writing and illustrate your answer with examples.
142
Feedback for activities and self-test exercise:
CHAPTER ONE:
Activity 1.1: It is a systematized effort to gain new knowledge.
Activity 1.2: facing the challenges of solving unresolved problems and serving the society
Activity 1.3: Applied research
Activity 1.4: Research is the factor for development. Especially habit of research in Chemistry is
very essential to bring advancement in all aspects such of life
Activity 1.5: It relies on empirical evidence, utilizes relevant concepts, t is committed to only
objective considerations etc.
- Self-test exercise:
1. Conceptual research
2. Scientific method
3. Research
4. Fundamental research
5. Research process
CHAPTER TWO:
Activity 2.1: Inductive thinking is about from particular to the general whereas, deductive
thinking goes general to particular.
Activity 2.2: It is the statement concerns with the functioning of the broader area of field
studied
Activity 2.3: personal experience, technological changes, extensive reading, etc.
Activity 2.4: After selecting the problem and before planning

143
- Self-test exercise:
1. C 2. A 3. D 4. B 5. D
CHAPTER THREE:
Activity 3.1: abstract and index, journals and published or unpublished bibliographies
Activity 3.2: first phase, identifying and reading all the relevant published material in the
problem area. Second phase, involves writing this foundation of ideas into a
section of the research report.
Activity 3.3: Abstract
Activity 3.4: to provide sufficient information to the reader about the connection of the new
finding with that of the previous one
- Self-test exercise:
1. Literature review
2. Literature
3. Encyclopedia
4. Periodicals
CHAPTER FOUR:
Activity 4.1: temporary assumption about solution of a given problem
Activity 4.2: helps to focus a research, serves as a guiding light and places clear and specific
goals
Activity 4.3: declarative, directional, non-directional and question form
Activity 4.4: a variable undergoes a change as a result of variations in independent variable.
Activity 4.5: Specialization in study area, reading etc.

144
- Self-test exercise:
1. Variables
2. Null hypothesis
3. Moderator
4. Factor
CHAPTER FIVE:
Activity 5.1: It is a stage of research, which is made to logically visualize its practicability.
Activity 5.2: Sampling means selection of individuals from the population
Activity 5.3: Individuals of a sample are independently drawn from the population
Activity 5.4: Fundamental research
Activity 5.5: It is more effective for comparing strata, which have different error possibilities.
Activity 5.6: through dividing the population into sub-groups or strata on the basis of the
characteristics, called stratification
- Self-test exercise:
1. Random sampling
2. Judgment sampling
3. Stratified sampling
4. Randomization
CHAPTER SIX:
Activity 6.1: There is no difference, they are synonymous
Activity 6.2: Simple experimental design, multio-variate analysis, case study, and predictive or
correlation
Activity 6.3: to observe/understand the effect of experimental variable

145
Activity 6.4: because the effect of other variables should be managed properly to understand the
effect of experimental variable
Activity 6.5: Because no question will be raised about the population to which the conclusions
are to apply.
- Self-test exercise:
1. Experimental method
2. Controlled variable
3. variable
CHAPTER SEVEN:
Activity 7.1: the degree in which the observed differences in results are due to the only
differences that have been deliberately introduced treatments
Activity 7.2: through good experimental design
Activity 7.3: through replication, a treatment should be repeated in a number of times
Activity 7.4: errors due to the operation of extraneous factors which tend to have the same effect
on all members of any given treatment groups
- Self-test exercise:
1. Hawthorne effect
2. Systematic error
3. S and G types of errors
4. Variance
5. Extraneous variables

146
CHAPTER EIGHT:
Activity 8.1: questioners with a clear, concise, and descriptive of the research project title, and
typed or printed questions that are easy to read.
Activity 8.2: unrestricted and restricted items
Activity 8.3: Facts are descriptive in nature whereas data are explanatory.
Activity 8.4: qualitative and quantitative data‟s
Activity 8.5: nominal scale, ordinal or rank scale, equal- interval scale, and ratio scale.
- Self-test exercise:
1. Open end
2. Data
3. Qualitative data
4. Nominal scale
5. Constant
CHAPTER NINE:
Activity 9.1: It involves breaking down existing complex factors into simpler parts and putting
the parts together in new arrangements
Activity 9.2: descriptive and inferential statistical data analysis
Activity 9.3: a process of selecting a sample group that can represent the population and a
generalization is given to the population based on the data obtained
Activity 9.4: Bar diagrams and Histogram, graphical presentation, polygons and curve or
cumulative frequency curve, pie diagrams

147
- Self-test exercise:
1. Descriptive statistical data analysis
2. Standard mean error
3. Non-parametric test
4. Critical ratio
5. t-test
CHAPTER TEN:
Activity 10.1: generating ideas and organizing the ideas in to robust structure
Activity 10.2: it is a final report written by combining all the information gained throughout the
research process
Activity 10.3: preliminary section, main body and reference
Activity 10.4: to include materials that is not included in the main body of the research report
Activity 10.5:
- Self-test exercise:
1. Report /thesis
2. Plagiarism
3. Title page
4. Research paper
5. Chapter five/ analysis of data
6. Bibliography and
7. Appendix

148
Reference:
1. Y. K. Sign (2006): Fundamentals of research methodology and statistics, New Delhi, New
age international (p) limited, publishers.
2. C.R. Kotarin (2004): Research methodology, New Delh i, New age international (p)
limited, publishers
3. Hilary Glasman-Deal (2010): Science research writing, UK, Imperial College Press.
4. Abhik Ghosh ed. (2011): Letter to a young Chemist, Canada, A John Wiley & Sons, Inc.,
Publication
5. Geoffrey Marczyk, et.al ed. (2005): Essentials of research design and methodology,
Canada, John Wiley & Sons, Inc
6. Author‟s Guide (2009): On being a Scientist, 3rd edition, Washington, DC, The national
academies press.
7. Daniel C. Harris (2010): Quantitative chemical analysis, 8th edition, New York, W. H.
Freeman and Company
8. http://research.microsoft.com/~simonpj/papers/giving-a-talk/writing-a-paper-slides.pdf
9. http://wit.tuwien.ac.at/research/tips/good_research_talk_slides.pdf
10. http://research.microsoft.com/~simonpj/papers/giving-a-talk/giving-a-talk-html.html
11. http://www.library.uq.edu.au/training/citation/harvard_6.pdf