Embed Size (px)
Citation preview
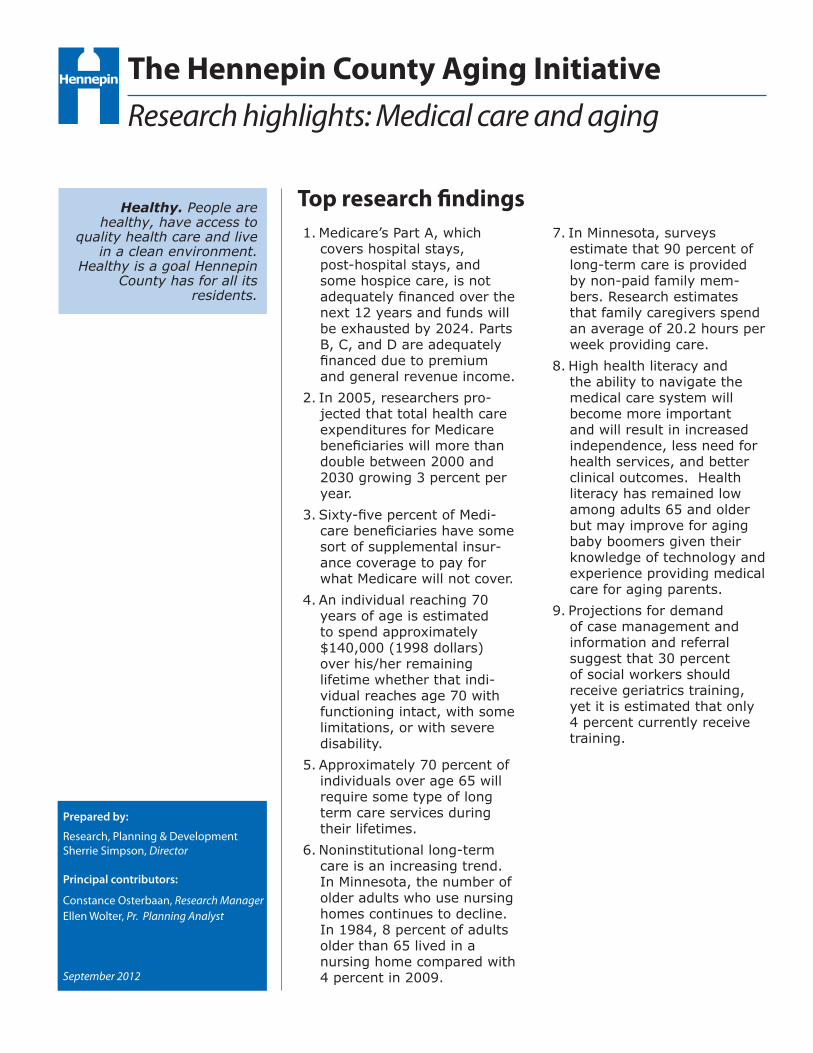
Research highlights: Medical care and aging
Top research findings
The Hennepin County Aging Initiative
Prepared by:
Research, Planning & Development Sherrie Simpson, Director
Principal contributors:
Constance Osterbaan, Research ManagerEllen Wolter, Pr. Planning Analyst
September 2012
1. Medicare’s Part A, which covers hospital stays, post-hospital stays, and some hospice care, is not adequately financed over the next 12 years and funds will be exhausted by 2024. Parts B, C, and D are adequately financed due to premium and general revenue income.
2. In 2005, researchers pro-jected that total health care expenditures for Medicare beneficiaries will more than double between 2000 and 2030 growing 3 percent per year.
3. Sixty-five percent of Medi-care beneficiaries have some sort of supplemental insur-ance coverage to pay for what Medicare will not cover.
4. An individual reaching 70 years of age is estimated to spend approximately $140,000 (1998 dollars) over his/her remaining lifetime whether that indi-vidual reaches age 70 with functioning intact, with some limitations, or with severe disability.
5. Approximately 70 percent of individuals over age 65 will require some type of long term care services during their lifetimes.
6. Noninstitutional long-term care is an increasing trend. In Minnesota, the number of older adults who use nursing homes continues to decline. In 1984, 8 percent of adults older than 65 lived in a nursing home compared with 4 percent in 2009.
7. In Minnesota, surveys estimate that 90 percent of long-term care is provided by non-paid family mem-bers. Research estimates that family caregivers spend an average of 20.2 hours per week providing care.
8. High health literacy and the ability to navigate the medical care system will become more important and will result in increased independence, less need for health services, and better clinical outcomes. Health literacy has remained low among adults 65 and older but may improve for aging baby boomers given their knowledge of technology and experience providing medical care for aging parents.
9. Projections for demand of case management and information and referral suggest that 30 percent of social workers should receive geriatrics training, yet it is estimated that only 4 percent currently receive training.
Healthy. People are healthy, have access to
quality health care and live in a clean environment.
Healthy is a goal Hennepin County has for all its
residents.

2
Older adults rely on medical care services to support their ability to age successfully. Individuals over 65 use a disproportionate amount of medical services due to their higher rates of chronic illness and disability. For in-stance, older adults visit health care providers twice as often as younger adults and undergo more medical procedures. In 2004, older adults comprised one third of hospitalizations and the rate of medical procedures among adults older than 65 was more than double the rate of adults aged 45-64. Older adults also spend three times more on out of pocket prescription drug costs than people under 65.
Due to disproportionate use of medical services, an increas-ingly large aging population will impact public health services, long-term care, and health care financing and delivery. The literature review below describes current medical care service delivery and identifies future issues that will affect medical care delivery for older adults.
Medicare and medicaid overview
In the United States, Medicare is provided to older adults to prevent disease, to manage disease, and to obtain end of life care. The majority of individuals 65 and older utilize Medicare in some form. Medicare is the largest public health program in the United States and in 2008 provided coverage to 38 million people 65 and older. Originally, Medicare aimed to provide ‘mainstream acute health care—hospital, physician and related services to persons 65 and older.’ Since 1965, the basic structure of Medicare has remained the same despite numerous additions.1
Medical Care & Aging
•PartA covers inpatient care in hospital stays, skilled (short-term) nursing home stays (after a hospital stay), and some hospice and home care services for beneficiaries meeting certain require-ments. Part A is financed through payroll taxes and most people do not pay a premium for this benefit. Persons who did not work or did not pay enough Medicare taxes while they worked may purchase Part A ($451 per month in 2012). A deductible is required for almost all hospital services and cover-age ceases if hospital stay is longer than 150 days.
•PartB covers 80 percent of doctors’ services and outpatient care as well as therapists and some home care when these services and supplies are medically neces-sary and the insured person has paid a yearly deductible. In 2007, the premium became tied to income. In 2012, a beneficiary earning less than $85,000 a year paid $99.90 per month and a beneficiary earning more than $214,000 per year paid $259.70 per month.
More than a quarter of Medicare recipients can qualify for assistance through Medicaid to pay for the entire Part B premium. This increased monthly premium paid by that group has been projected to save Medicare almost $21 billion by 2017 significantly improving the Medicare program. Individu-als who qualify for Medicare and Medicaid are responsible for deductibles. The yearly deductible in 2012 was $140 and the copay amounted to approximately 20 percent of each service.1
3
•PartC allows individuals to purchase additional coverage. Part C is also referred to as Medicare Advantage. In 1997, Medicare Advantage (Medicare + a Choice program) was added to allow beneficiaries to receive com-bined benefits from Parts A, B & D through health mainte-nance organizations (HMOs) and preferred provider organizations (PPOs). HMOs and PPOs aim to reduce out of pocket costs through care and provider coordination. Approximately 19 percent of Medicare beneficiaries were enrolled in Medicare Advan-tage in 2008.1
Individuals can also choose to purchase a Medigap policy or Medicare supplemental policy, which is not considered Medi-care Advantage. The majority of Medicare beneficiaries have some sort of supplemental coverage. In 2006, 43 per-cent of beneficiaries received supplemental coverage from an employer and 22 percent purchased a Medigap policy from insurance companies.2
•PartD aims to cover prescription drugs and was added in 2006. Individuals with incomes less than 150 percent of the Federal Poverty Level are eligible for subsidies for prescription drugs. Beneficiaries typically have expenses covered up to a point where they enter a period of non-coverage called “the donut hole” where they must spend a pre-specified out of pocket amount before the subsidy can begin again.1
In 2009, 90 percent of Medicare beneficiaries had prescription drug coverage with 60 percent receiving coverage through Part D. Ten percent of beneficiaries remain without coverage.3
Dual eligibles: Medicare and medicaid beneficiaries
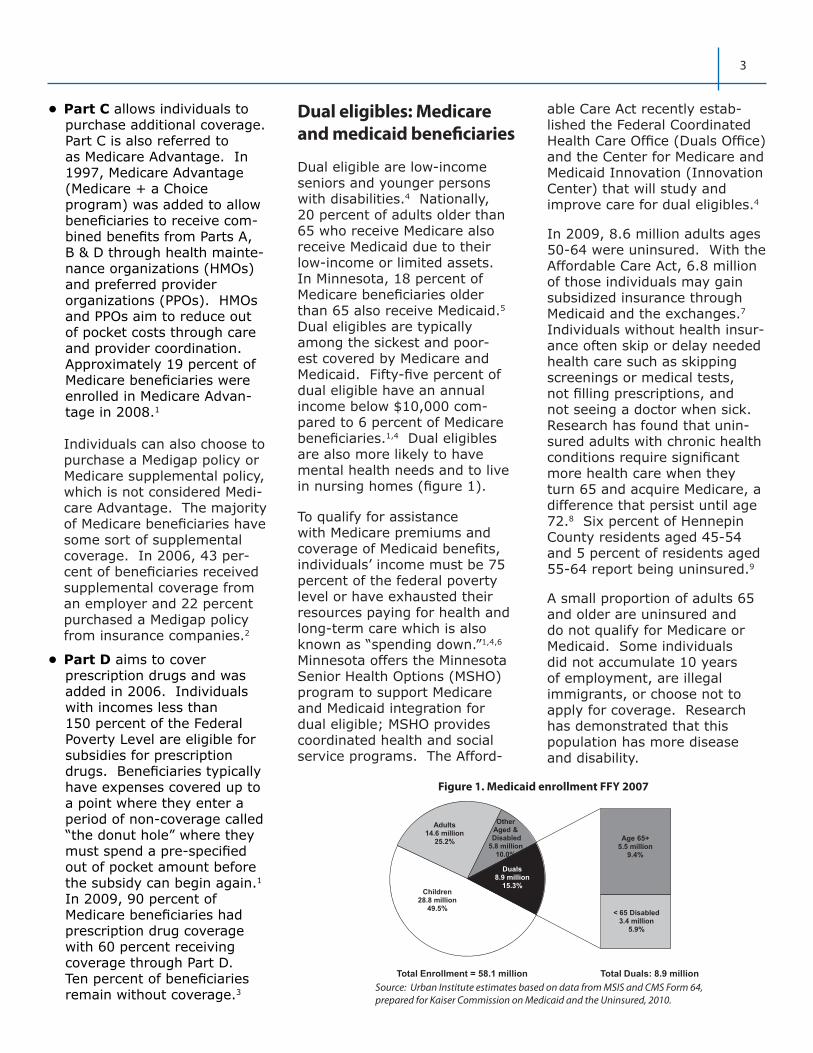
Dual eligible are low-income seniors and younger persons with disabilities.4 Nationally, 20 percent of adults older than 65 who receive Medicare also receive Medicaid due to their low-income or limited assets. In Minnesota, 18 percent of Medicare beneficiaries older than 65 also receive Medicaid.5 Dual eligibles are typically among the sickest and poor-est covered by Medicare and Medicaid. Fifty-five percent of dual eligible have an annual income below $10,000 com-pared to 6 percent of Medicare beneficiaries.1,4 Dual eligibles are also more likely to have mental health needs and to live in nursing homes (figure 1).
To qualify for assistance with Medicare premiums and coverage of Medicaid benefits, individuals’ income must be 75 percent of the federal poverty level or have exhausted their resources paying for health and long-term care which is also known as “spending down.”1,4,6 Minnesota offers the Minnesota Senior Health Options (MSHO) program to support Medicare and Medicaid integration for dual eligible; MSHO provides coordinated health and social service programs. The Afford-
able Care Act recently estab-lished the Federal Coordinated Health Care Office (Duals Office) and the Center for Medicare and Medicaid Innovation (Innovation Center) that will study and improve care for dual eligibles.4
In 2009, 8.6 million adults ages 50-64 were uninsured. With the Affordable Care Act, 6.8 million of those individuals may gain subsidized insurance through Medicaid and the exchanges.7 Individuals without health insur-ance often skip or delay needed health care such as skipping screenings or medical tests, not filling prescriptions, and not seeing a doctor when sick. Research has found that unin-sured adults with chronic health conditions require significant more health care when they turn 65 and acquire Medicare, a difference that persist until age 72.8 Six percent of Hennepin County residents aged 45-54 and 5 percent of residents aged 55-64 report being uninsured.9
A small proportion of adults 65 and older are uninsured and do not qualify for Medicare or Medicaid. Some individuals did not accumulate 10 years of employment, are illegal immigrants, or choose not to apply for coverage. Research has demonstrated that this population has more disease and disability.
Children28.8 million
49.5%
Adults14.6 million
25.2%
Other Aged &Disabled
5.8 million10.0%
Duals8.9 million
15.3%
Age 65+5.5 million
9.4%
< 65 Disabled3.4 million
5.9%
Total Enrollment = 58.1 million Total Duals: 8.9 million
Figure 1. Medicaid enrollment FFY 2007
Source: Urban Institute estimates based on data from MSIS and CMS Form 64, prepared for Kaiser Commission on Medicaid and the Uninsured, 2010.

4
The future aging population will rely heavily on medical care sys-tem, as did their predecessors, to address their health care needs. However, the health care system is changing rapidly. Below are the major medical care trends that a large aging population will face in the coming years.
Rising health care costs
National and individual health costs continue to rise rapidly. For aging individuals the rapidly ris-ing cost of health care will contin-ue to be an issue. From 2007 to 2008 health insurance premiums increased 5 percent compared with workers’ earnings at 3.5 percent.10 In 2005, researchers projected that total health care expenditures for Medicare ben-eficiaries will more than double between 2000 and 2030 growing 3 percent per year, regardless of increases or decreases in disabil-ity rates among older adults.1,20
Research has found that on average a person with Medicare will spend $2,022 a year (2003 dollars). However, those in poor health are likely to spend 50 percent more on out of pocket health care costs than those in good or excellent health.11 Another study found that an individual reaching 70 is likely to spend approximately $140,000 (in 1998 dollars) over his or her remaining lifetime regardless of whether that individual reaches age 70 with a severe disability.1,12 Chronic disease plays a central role in the health care costs of individuals. Forty-three percent of total Medicare expenditures go to the 12 percent of Medicare beneficiaries with six or more chronic conditions.13 Research demonstrates that 20 percent of Medicare expenditures are due to 10 percent of Medicare beneficia-ries who are in poor health.1,14
Opportunities and Challenges: Medical Care Service Delivery Trends
In addition, technological break-throughs will further increase spending.1 Some have also argued that the widely variable practice patterns observed across the US suggest that there is much excess waste in the current chronic care system.1,15 These research-ers propose that savings and improved care could emerge by transitioning to a system of coordinated care, one in which medical providers are paid for their performance based on measurable cost-effectiveness outcomes. Others have argued that prevention and wellness programs could result in substantial cost savings, however this would depend on care choices about the types of prevention, the groups targeted, and costs of such measures.1,16
The future of medicare financing
According to the 2012 CMS Medicare trustees report, Part A is not adequately financed over the next 12 years and will be exhausted by 2024.1,17 Parts B and D are adequately financed for the next 10 years because premium and general revenue income for these programs reset each year (premiums are collected each year for these programs). Some researchers believe Part D reduce medical problems and hospitalization costs enough to offset a signifi-cant portion of its cost.1,18 The 2010 Affordable Care Act also aims to address solvency issues, as detailed in the section below.
Health care reform: affordable Care Act
Preventative medical careBeginning in 2011, no coinsur-ance or deductibles are charged

5
in traditional Medicare for pre-ventative services rated highly by the US Preventative Task Force (e.g., diabetes screening, cancer screenings, and cardio-vascular screenings). In addi-tion, no coinsurance or deduct-ibles are charged in traditional Medicare for a yearly wellness visit which used to be adminis-tered only when a person en-rolled in Medicare. The wellness exam includes a physical exam, cardiovascular screening, dia-betes, self-management train-ing, smoking, and tobacco-use cessation counseling, abdominal aortic aneurysm screening, and health risk assessments.19
Immunizations including the flu shot, pneumonia, and tetanus booster are also included. Screenings and immunizations can be very effective tools for reducing health care costs related to hospitalizations and needed care. Recent studies found substantial reductions in hospitalizations for pneumonia, cardiac disease, and stroke and mortality for those who received flu vaccines.20 However, there are low rates of Medicare beneficiaries who actually get screenings. In 2006, half of Medicare beneficiaries received cardiovascular screenings and this was the most utilized screening. Persons of color, particularly African-Americans have lower rates of preventive services than White beneficia-ries.1
Prescription drugsThe Affordable Care Act aims to support the 14 percent of Medicare beneficiaries who fall into the prescription drug “donut hole” which covers prescription drugs expenses up to $2,840 at which point benefits cease until beneficiaries have spent $4,550 out of pocket costs on prescrip-tion drugs.23
Beginning in 2011, a 50 percent discount was offered on brand name drugs with the full cost of those drugs counting toward the annual out of pocket spending allowing beneficiaries to reach their out of pocket spending faster. In addition, prescription drug coinsurance and deductible payments are waived for dual eligibles.23
Cost: provider payments and premiumsAdditional changes aim to increase payments to primary care physicians, increase ben-eficiary premiums for those with higher incomes, and create an independent commission to restrain spending growth.23
Technology
Rapidly changing technology provides an opportunity to better serve an aging popula-tion. Telemedicine and remote monitoring systems may pro-vide a way for home-based care to be safe and feasible. Ideally, medical professionals could provide advice remotely and vital signs would be monitored allowing nurses time to devote to other tasks.21 In Europe, the Warwick program (Aging Well in the Information Society) aims to create digital technologies that will improve the lives of older people at home, at work, and in society in general. Companies in the US, Europe and Japan are working to create technology to supplement human skills so that geriatric professionals can be freed up. For example, in Japan, nurse robots and voice activated systems are being developed to assist elderly patients at home with tasks such as opening doors, handling trays and camera remote moni-toring. Voice-based systems may also support similar tasks.25
Researchers are also working to create devices that can “read” disabilities so that physical therapies can be programmed to an individual’s needs. Currently, Intel Corporation researches hospital and home environments to better understand how to integrate technology into older adults’ everyday lives. Product development currently exists to address chronic-disease man-agement, memory assistance, social connectivity, safety, and the desire for a sense of purpose.25
Geriatric workforce shortage
The Institute of Medicine projects there will be a severe shortage of geriatric medical, social work, and allied health professionals. The US has roughly one-half of the geriatrics specialists it needs and their absolute number has declined over the last decade. By 2030, it is estimated that the US will have just one-quarter of the estimated geriatricians it will need.22 Projections also suggest that 30 percent of social workers should receive geriatrics training yet only 4 percent currently have this training. Aging specialists recommend that a new genera-tion of community workers have expertise in aging issues. These specialists believe there will need to be a “mainstreaming” of aging issues so that healthcare and social service professionals have adequate knowledge of the healthcare needs of older people.25 Geriatrics pioneer Robert Butler says “it is striking that doctors are not well trained to deal with old people, even though they tend to show dif-ferent symptoms and reactions to treatments than younger people with similar ailments.”25

6
Currently, 11 of the 145 medical schools in the United States have geriatric departments. In 2010, Obama’s budget included $11 million dollars to target geriatric training programs.
Minnesota demographers proj-ect there will be increased de-mand for scarce younger work-ers, specifically in the long-term care industry including home and community-based services. In Minnesota, the Department of Human Services offers the Nursing Facility Employee Scholarship Program and the Home and Community-Based (HCBS) Employee program to support geriatric workforce development.23
Comprehensive care models
Families are supported by the medical sector but also by the aging services sector that pro-vides the bulk of meals, trans-portation, home modification, social visiting, daily monitoring, house cleaning, and medica-tion management that families are unable to provide to elders with disabilities. However, the medical services and aging ser-
vices sector operate in silos that rarely interact. Comprehensive care aims to connect these silos to improve health outcomes for older adults with chronic illness and reduce overall health care costs.1,24,25
Health care experts recommend implementing comprehensive care models. However, there is limited research on which comprehensive care models improve outcomes. A 2008 review of comprehensive care models identified 15 models that improved quality of care, quality of life, functional auton-omy, survival, and/or decreased use of health services. The 15 models focused on providing various components including interdisciplinary primary care, delivery health care and case management, preventive home visits, comprehensive geriatric assessments, pharmaceutical care, chronic disease self-man-agement, proactive rehabilita-tion, caregiver education and support, transitional care, care in nursing homes, and compre-hensive inpatient care.28
San Francisco’s On Lok program is one example of a comprehen-sive care program. This pro-
gram evolved into what is now known as PACE (Program of All-inclusive Care for the Elderly) program which is an integrated, community-based program that includes all medical and social services that older adults need. PACE, which is funded by Medicare and Medicaid, provides funding for individual patients that must be managed within this integrated system of care. PACE has achieved positive outcomes including low hospital readmission rates.1,28
The state of Minnesota offers a comprehensive care model, Minnesota Senior Health Options (MSHO), to low-income seniors on Medicare and Medicaid. The program aims to coordinate Medicare and Medicaid services including community-based primary and specialty care, acute care hospital services, and long-term nursing home care.26 Research found that MSHO enrollees had fewer short-term nursing home admissions, lower use of emergency services, and some significant changes in functional status.27

7
Medicare’s payment complexity requires individuals to pay close attention to monthly premiums, copays, yearly deductibles and what is covered by the various “parts.” For instance, Medicare does not cover all needed services or reimburse fully for the services it does cover. National figures show that Medicare covers only about half of the health care costs of those 65 years and older.1 Significant medical expenses such as nurs-ing home care, vision screening and eye glasses, hearing screening, hearing aids, and dental care, are not covered. Unlike most private insurance plans, Medicare places no cap on what a person has to pay out of pocket.1
The importance of health literacy is crucial for elderly
consumers who are required to obtain, process, and understand basic health information and services needed to make ap-propriate health decisions.1 People with limited health literacy have difficulty finding healthcare providers, filling out forms, accurately sharing medical history, taking medica-tions according to directions and following other instructions from providers for managing conditions. Individuals must have the ability to search, comprehend, and use informa-tion from multiple sources. The Federal Interagency Form on Aging Related Statistics has found that health literacy is improving. However, in 2003 60-70% of people age 65 and over had below basic or basic health literacy skills, depending on the measurement.1,28
Navigating Medical Care: Health Care Literacy

8
Typically long-term care is grouped into two categories, non-institutional (home/community-based) care and institutional (nursing home/resi-dential) care. Long-term care is typically thought of as a nursing home but long-term care provides a spectrum of services in the community. Long-term care may include adult day programs, support from a home care agency, medical supplies or assistive technology, residence in a nursing home, home deliv-ered meals, and case manage-ment to secure services.1
Only 5 percent of individuals 65 and older and 17 percent of individuals 85 and older live in nursing homes. Today, the oldest and sickest seniors reside in nursing homes.1 An individual aged 65 in 2005 is likely to need long term care services for 3 years of his or her remaining lifespan.29 Although long term care needs will vary substantially, researchers estimate that adults 65 and older will spend an average of 2 years receiving home care and 1 year in a nursing or assisted living facility.33 In Minnesota, the number of older adults who use nursing homes continues to decline.24 In 1984, 8 percent of adults older than 65 lived in a nursing home compared with 4 percent in 2009. For adults older than 85, the decline was more substantial. Thirty-six percent of adults older than 85 lived in a nursing home in 1984 compared with 15 percent in 2009. A recent report on long-term care in Minnesota reports that nursing home utilization may be decreasing due to the availability of home and com-munity based services, changing consumer preferences, and increased availability of short stay specialty care.24
Long-term care will be a sig-nificant issue as the population ages due to its extremely high costs. Research estimates that 70 percent of individuals over the age of 65 will require some type of long term care services during their lifetimes with 20 percent needing care for more than five years and 40 percent spending at least some time in a skilled nursing facility.29 Long-term care is the leading cause of catastrophic out of pocket costs for families. Unfortunate-ly, research has shown that the future aging population has not planned for long-term care and misunderstands the long term care services the government will pay for. Approximately 13 million Americans need Long-term care services including 10.9 million community resi-dents and 1.8 million individuals residing in nursing homes.30
Long-term care provides a spectrum of services and supports aimed to meet the health and personal care needs for individuals in a disabled state over an extended period of time. Long-term care is supportive rather than curative and is designed to maximize the independence of individuals with health limitations.1 For many families, it is often hard to dis-tinguish what long-term care is and when it begins. Long-term care typically begins gradually and requires increasing levels of supportive care. Visiting nurses and other home health care services are normally linked to post-hospital care and are limited by Medicare to a 90 day cycle.1 Families often use the services immediately following hospital care until they are able to establish long term services because the discharged elder can no longer function indepen-dently.1
Long-Term Care

9
Long-term care costs
Long-term care costs are a substantial burden for families. In 2011, the annual cost for assisted living was $41,724 compared with $78,110 for a semi-private room in a nursing home. Average annual costs for community based care included $18,200 for 5 days of adult day services and $27,664 to 30,576 for 4 hours of home care services 7 days per week.24,31
The medium income of people 80 and older is approximately $15,000. To afford long-term care, more than half of older adults living in long-term care facilities spend down their sav-ings and have to go on Medic-aid.32 Research demonstrates that by 2040 baby boomers will require extensive funding as well as community and familial support.33
In 2008, only 29 percent of long-term care costs in the United States were paid out of pocket and just 7 percent of this was through private insur-ance.34 Sixty percent of long-term care costs are paid for by Medicare and Medicaid. Medic-aid pays for 40 percent of long term care costs and Medicare pays for 20 percent.34 How-ever, as discussed above, these programs pay only for limited services and/or require individ-uals to become impoverished.34
Research suggests that by 2030, many older adults will not have the income and assets needed to cover long-term care expenses. Researchers believe older adults will face serious challenges attaining long-term care services if savings rates are not increased and gov-ernment programs are not strengthened.35,36
For more information on long-term care financing and cost, please see the Aging economic security and public finances page on this site.
Family caregivers
The majority of caregiving is provided by informal family support systems. Nationally, approximately 78 percent of older adults depend on informal caregivers as their only source of care. Fourteen percent of older adults receive a combination of informal and formal care and 8 percent used formal care only.37 Using informal caregiving as the only type of long-term care has grown nationally since the mid-1990s. Research estimates that in 2009 informal caregiving was valued at $450 billion dollars.38
In Minnesota, surveys estimate that 90 percent of long-term care is provided by non-paid family members.27,39 Spouse and children provide the majority of care in Minnesota (figure 2). In the coming years, there will be fewer children to care for older adults resulting in an increased demand for paid caregiving.
Providing care to older family members is typically challenging for families. Research estimates that family caregivers spend an
average of 20.2 hours per week providing care. Seventeen percent of caregivers provide 40 hours per week of care or more.1,39 Research estimates that families of individuals with dementia will spend an average of 7 years and 48 hours per week providing nonpaid care. Other studies have found that family members spent an aver-age of 57 hours per week caring for individuals with moderate forms of dementia. Individuals with severe dementia are typi-cally institutionalized but still require on average 112 hours per week with 30 of those hours provided by family caregiv-ers.1,40
Research has demonstrated negative consequences of caring for an older family member. Caregiving is associated with poorer work performance—employees reporting elder caregiving responsibilities are more likely to report certain chronic conditions such as diabetes, poorer attention to their own health, greater overall medical care costs and greater absenteeism. Caregiving strain has also been linked to mortality risk.41
Family caregiving is often referred to as a “women’s issue” because women represent two-thirds of all caregivers.
Source: Survey of Older Minnesotans, 2005
Figure 2. Percent sources of assistance for activities of daily living, 2005
Sources of Assistance for Activities of Daily Living, 2005
8
7
18
35
43
0 10 20 30 40 50
Agency
"Hired help"
Friend or other relative
Child/in-law
Spouse

10
However, recent evidence has shown this is changing as male caregivers are increasing.1 In addition, given women’s partici-pation in the workforce in the past 30 years, family structures have changed and there are more women living alone and less available to provide elder-care.
In the past 10 years, families have turned more often to paid caregivers to supplement care needs. Children are now less likely to provide care to their parents. In 1995, over 50 percent of older adults received care from their children and in 2005 35 percent received care from their children.27 Minnesota researchers expect that the baby boomer generation will demand more choice for their long-term care including more paid help. The market is cur-
rently beginning to reflect this trend with older adults already relying more on “hired help” to help with care needs. Now referred to as a “gray market,” older adults are hiring out needs as opposed to relying on “agency-based” home health care.42
Raising awareness in Minnesota
The University of Minnesota recently created a campaign to educate baby boomers about saving for long-term care. The “Own Your Future” campaign is a two year pilot education pro-gram to encourage individuals to save for long term care. For more information please see: http://www.mnaging.org/pdf/OwnYourFutureCampaign_Fact-Sheet_2012.pdf

11
References1 Albert, S. & Freedman, V. (2010). Public health and aging: maximizing function and well-being. New York: Spring Publishing.
2 Gold, M. (2008). Medicare advantage in 2008. Prepared for The Henry J. Kaiser Family Foundation. Retrieved June 20, 2011 from: http://www.kff.org/medicare/upload/7775.pdf
3 Kaiser Family Foundation. (2006). Prescription drug coverage among Medicare beneficiaries 2010. Retrieved June 17, 2011 from: http://facts.kff.org/chart.aspx?cb=58&sctn=164&ch=1743
4 Kaiser Commission on Medicaid and the Uninsured. (May 2011). Dual eligible: Medicaid’s role for low-income Medicare ben-eficiaries. The Henry J. Kaiser Family Foundation. Retrieved January 11th, 2012 from: http://www.kff.org/medicaid/up-load/4091-08.pdf
5 Kaiser Commission on Medicaid and the Uninsured and Urban Institute estimates based on data from FY 2008 MSIS, 2012. Re-trieved June 26, 2012 from: http://www.kff.org/medicare/upload/8138-02.pdf
6 For more information, please refer to the “Retirement security, health care and late life” brief.
7 Collins R, Doty M, and Garber T. (2010). Realizing health reform’s potential: adults ages 50-64 and the Affordable Care Act of 2010. New York: The Commonwealth Fund.
8 McWilliams JM, Meara E, Zaslavsky AM et al. (2007). Use of health services by previously uninsured Medicare beneficiaries. NEJM 357(2): 143-53.
9 Hennepin County Human Services and Public Health Department. SHAPE 2010, Survey of the Health of All the Population and the Environment, Minneapolis, Minnesota.
10 HRET/Kaiser Family Foundation. Employer Health Benefits Survey, 2008.
11 Goldman D and Zissimopoulos. (2003). High out-of-pocket health care spending by the elderly. Health Affairs, (22)3: 194-202.
12 Lubitz, J., Cai, L., Kramarow, E., & Lentzner, H. (2003). Health, life expectancy, and health care spending among the elderly. New England Journal of Medicine, 349(11): 1048-1055.
13 Centers for Medicare and Medicaid Services (2008). Chronic conditions among Medicare beneficiaries, Chart book. Baltimore, MD. 2011.
14 Medicare Payment Advisory Commission (MedPac). (2009). Health care spending and the Medicare program. Washington, D.C. Retrieved February 12, 2011 from: http://www.medpac.gov/documents/jun09_entirereport.pdf
15 Wennberg JE, Fisher ES, Skinner JS, and Bronner KK. (2007). Extending the P4P agenda, part 2: How Medicare can reduce waste and improve the care of the chronically ill. Health Affairs (Project Hope), 26(6): 1575-1585.
16 Russell LB. (2009). Preventing chronic disease: an important investment, but don’t count on cost savings. Health Affairs (Proj-ect Hope), 28(1): 42-45.
17 Centers for Medicare and Medicaid Services. (2012). Trustees report. Retrieved April 15, 2012 from: http://www.cms.gov/Research-Statistics-Data-and-Systems/Statistics-Trends-and-Reports/ReportsTrustFunds/Downloads/TR2012.pdf
18 Raebel, M.A., Delate, T., Ellis, J.L., & Bayliss, E.A. (2008). Effects of reaching the drug benefit threshold on Medicare members’ healthcare utilization during the first year of Medicare Part D. Medical Care, 46(10): 1116-1122.
19 Moon, M. (2012). Medicare and the affordable care act. Journal of Aging & Social Policy, 24: 233-247.
20 Nichol KL, Nordin JD, Nelson DB, Mullooly JP & Hak E. (2007). Effectiveness of influenza vaccine in the community-dwelling el-derly. NEJM, 357(14): 1373-1381.
21 Economist Intelligence Unit. (2009). Healthcare strategies for an ageing society. The Economist. Retrieved January 10, 2012 from: http://graphics.eiu.com/upload/eb/Philips_Healthcare_ageing_3011WEB.pdf
22 Institute of Medicine. (2008). Retooling for an aging American: Building the health care workforce. Washington, DC: National Academies Press.
23 Minnesota Department of Human Services. (2010). Status of long-term care in Minnesota 2010: A report to the Minnesota legis-lature. Retrieved March 31, 2011 from: http://www.agingservicesmn.org/inc/data/PDF/Status_of_LTC_In_MN_8.15.10.pdf
24 Boult, C., Green, A.F., Boult, L., Pacala, J., Snyder, C. & Leff, B. (2009). Successful models of comprehensive care for older adults with chronic conditions: evidence for the Institute of Medicine’s “Retooling for an Aging America” report. J Am Geriatr Soc, 57: 2328-2337.
25 Institute of Medicine. (2001). Crossing the quality chasm: A new health system for the 21st century. Washington, DC: National Academy Press.
26 Robert Wood Johnson Foundation. (2009). Minnesota’s Senior Health Options integrates long-term and acute care: Program results report. Retrieved February 12, 2011 from: http://www.rwjf.org/files/research/27464.final.pdf
27 Bershadsky, B. (2005). The quality of care under a managed-care program for dual eligibles. The Gerontologist, 45(4): 525-534.
28 Federal Interagency Forum on Aging-Related Statistics. (2008). Older Americans 2008: Key Indicators of Well-Being. Washing-ton, DC: U.S. Government Printing Office.
29 Kemper, P., Komisar, H.L., & Alecxih, L. (2005/2006 Winter). Long-term care over an uncertain future: what can current retirees expect? Inquiry, 42(4): 335-350.

12
30 Kaye, H.S., Harrington, C., & LaPlante, M.P. (2010). Long-term care in the United States: Who gets it, who provides it, who pays, and how much does it cost? Health Affairs, 29(1): 1-11.
31 Miller, E.A. (2012). The Affordable Care Act and long-term care: comprehensive reform or just tinkering around the edges? Journal of Aging & Social Policy, 24: 101-117.
32 Gawande, A. (April 30, 2007). The way we age now. The New Yorker. Retrieved October 5, 2011 from: http://www.newyorker.com/reporting/2007/04/30/070430fa_fact_gawande
33 Johnson, M., Toohey, D., & Weiner, J. (2007). Meeting the long-term care needs of the baby boomers: how changing families will affect paid helpers and institutions. Urban Institute. Retrieved February 5, 2011 from: http://www.urban.org/Uploaded-PDF/311451_Meeting_Care.pdf
34 Shugarman, L.R. & Steenhausen, S. (2010). The financing of long-term care. Long Beach, CA: The SCAN Foundation.
35 Family Caregiver Alliance. (2005). Fact Sheet: Selected Long-Term Care Statistics. Retrieved December 8, 2011 from: http://www.caregiver.org/caregiver/jsp/content_node.jsp?nodeid=440
36 VanDerhei, J., & Copeland, C. (2003). Can Americans afford tomorrow’s retirees: results from the EBRI-ERF retirement security projection model Washington DC: Employee Benefit Research Institute.
37 Thompson, L. (2004). Long-term care: support for family caregivers [Issue Brief]. Washington, D.C.: Georgetown University.
38 Feinberg, L., Reinhard, S., Houser, A., & Choula, R. (2011). Valuing the invaluable: 2011 Update, The growing contributions and costs of family caregiving. AARP Public Policy Institute Report. Retrieved January 11, 2011 from http://assets.aarp.org/rg-center/ppi/ltc/fs229-ltc.pdf
39 Minnesota Board on Aging, 2005 Survey of Older Minnesotans.
40 Albert, S.M., Sano, M., Bell, K., Merchant, C., Small, S., and Stern, Y. (1998). Hourly care received by people with Alzheimer’s disease: Results from an urban, community-based survey. The Gerontologist, 38(6): 704-714.
41 Schulz, R. & Beach, S.R. (1999). Caregiving as a risk factor for mortality: the Caregiver Health Effects Study. JAMA, 282 (23): 2215-2219.
42 Brennen Center for Justice. (March 1, 2007). Unregulated work in the home health care industry. New York Times.