Embed Size (px)
Citation preview
Dental Services: Use, Expenses, Source of Payment, Coverage and Procedure Type, 1996–2015
Agency for Healthcare Research and Quality U.S. Department of Health & Human Services November 2017
#38

i
Abstract
This report presents data from the 1996 through 2015 Medical Expenditure Panel Survey (MEPS) describing dental use, expenses, source of payments, coverage and procedure type for the U.S civilian noninstitutionalized (community) population. MEPS is sponsored by the Agency for Healthcare Research and Quality (AHRQ). Estimates are presented for the total population as well as for specific population groups categorized in terms of sex, race/ethnicity, age, income, dental insurance coverage, employment, and education. This report is presented as part of a series of updates to Chartbook 17: Dental Use, Expenses, Dental Coverage, and Changes, 1996 and 2004. Only differences that are statistically significant at the 0.05 level are discussed in the text.
Suggested Citation
Manski RJ and Rohde F. Dental Services: Use, Expenses, Source of Payment, Coverage and Procedure Type, 1996–2015: Research Findings No. 38. November 2017. Agency for Healthcare Research and Quality, Rockville, MD. https://meps.ahrq.gov/data_files/publications/rf38/rf38.pdf
* * * The estimates in this report are based on the most recent data available at the time the report was written. However, selected elements of MEPS data may be revised on the basis of additional analyses, which could result in slightly different estimates from those shown here. Please check the MEPS Web site for the most current file releases.
Center for Financing, Access, and Cost Trends Agency for Healthcare Research and Quality 5600 Fishers Lane, Mailstop 07W41A Rockville, MD 20857 http://www.meps.ahrq.gov/
ii
The Medical Expenditure Panel Survey (MEPS)
Background
The Medical Expenditure Panel Survey (MEPS) is conducted to provide nationally representative estimates of health care use, expenditures, sources of payment, and insurance coverage for the U.S. civilian noninstitutionalized population. MEPS is co-sponsored by the Agency for Healthcare Research and Quality (AHRQ) and the National Center for Health Statistics (NCHS).
MEPS comprises three component surveys: the Household Component (HC), Medical Provider Component (MPC), and Insurance Component (IC). Together these surveys yield comprehensive data that provide national estimates of the level and distribution of health care use and expenditures, support health services research, and can be used to assess health care policy implications.
MEPS is the third in a series of national probability surveys conducted by AHRQ on the financing and use of medical care in the United States. The National Medical Care Expenditure Survey (NMCES) was conducted in 1977, the National Medical Expenditure Survey (NMES) in 1987. Beginning in 1996, MEPS continues this series with design enhancements and efficiencies that provide a more current data resource to capture the changing dynamics of the health care delivery and insurance system.
The design efficiencies incorporated into MEPS are in accordance with the Department of Health and Human Services (DHHS) Survey Integration Plan of June 1995, which focused on consolidating DHHS surveys, achieving cost efficiencies, reducing respondent burden, and enhancing analytical capacities. To accommodate these goals, MEPS design features include linkage with the National Health Interview Survey (NHIS), from which the sample for the MEPS-HC is drawn, thereby enabling enhanced longitudinal data collection.
Household Component
The MEPS-HC, a nationally representative survey of the U.S. civilian noninstitutionalized population, collects medical expenditure data at both the person and household levels. The HC collects detailed data on demographic characteristics, health conditions, health status, use of medical care services, charges and payments, access to care, satisfaction with care, health insurance coverage, income, and employment.
The HC uses an overlapping panel design in which data are collected through a preliminary contact followed by a series of five rounds of interviews over a two-and-a-half year period. Using computer-assisted personal interviewing (CAPI) technology, data on medical expenditures and use for two calendar years are collected from each household. This series of data collection rounds is launched each subsequent year on a new sample of households to provide overlapping panels of survey data and, when combined with other ongoing panels, will provide continuous and current estimates of health care expenditures.
The sampling frame for the MEPS-HC is drawn from respondents to NHIS, conducted by NCHS. NHIS provides a nationally representative sample of the U.S. civilian noninstitutionalized population, with oversampling of Hispanics, blacks, and additionally Asians starting in 2006.
iii
Medical Provider Component
The MEPS-MPC supplements and validates information on medical care events reported in the MEPS-HC by contacting medical providers and pharmacies identified by household respondents. The MPC sample includes all hospitals, hospital physicians, home health agencies, and pharmacies reported in the HC. Also included in the MPC are all office-based physicians:
• Providing care for HC respondents receiving Medicaid.• Associated with a 75 percent sample of households receiving care through an HMO
(health maintenance organization) or managed care plan.• Associated with a variable sample of the remaining households. Data are collected on
medical and financial characteristics of medical and pharmacy events reported by HCrespondents, including:
- Diagnoses coded according to ICD-9 (9th Revision, International Classification ofDiseases) and DSMIV (Fourth Edition, Diagnostic and Statistical Manual of Mental Disorders).
- Physician procedure codes classified by CPT-4 (Current Procedural Terminology,Version 4). Inpatient stay codes classified by DRG (diagnosis related group).
- Prescriptions coded by national drug code (NDC), medication names, strength,and quantity dispensed.
- Charges, payments, and the reasons for any difference between charges andpayments. The MPC is conducted through telephone interviews and records provided by the medical provider.
Insurance Component
The MEPS-IC collects data on health insurance plans obtained through private and public sector employers. Data obtained in the IC include the number and types of private insurance plans offered, benefits associated with these plans, premiums, contributions by employers and employees, and employer characteristics.
Establishments participating in the MEPS-IC are selected through two sampling frames:
• A Bureau of the Census list frame of private sector business establishments• The Census of Governments from the U.S. Census Bureau
Data from these sampling frames are collected to provide annual national and state estimates of the supply of private health insurance available to American workers and to evaluate policy issues pertaining to health insurance. Since 2000, the Bureau of Economic Analysis has used national estimates of employer contributions to group health insurance from the MEPS-IC in the computation of Gross Domestic Product (GDP).
The MEPS-IC is an annual panel survey. Data are collected from the selected organizations through a prescreening telephone interview, a mailed questionnaire, and a telephone follow- up for non-respondents.
iv
Survey Management
MEPS data are collected under the authority of the Public Health Service Act. They are edited and published in accordance with the confidentiality provisions of this act and the Privacy Act. NCHS provides consultation and technical assistance.
As soon as data collection and editing are completed, the MEPS survey data are released to the public in staged releases of summary reports and microdata files. Summary reports and microdata files are available through the Internet on the MEPS Web site: http://www.meps.ahrq.gov/.
For more information, visit the MEPS Web site or e-mail [email protected].
v
Table of Contents
Abstract ................................................................................................................................................................ i Suggested Citation ............................................................................................................................................... i The Medical Expenditure Panel Survey (MEPS) Background ........................................................................... ii Table of Contents ................................................................................................................................................ v Introduction ......................................................................................................................................................... 1 Highlights ............................................................................................................................................................ 1 Findings ............................................................................................................................................................... 2
Dental Insurance Coverage .......................................................................................................................... 2 Use of Dental Care ...................................................................................................................................... 2 Expenditures and Source of Payment .......................................................................................................... 3 Dental Procedure Type and Distribution ..................................................................................................... 3
Summary and Conclusions .................................................................................................................................. 3 References ........................................................................................................................................................... 4 Table 1. Total population (thousands); 1996–2015 ............................................................................................ 5 Table 2. Percent population with any dental coverage; 1996–2015 .................................................................... 7 Table 3. Percent population with private dental coverage; 1996–2015 .............................................................. 9 Table 4. Percent population with public dental coverage; 1996–2015 ............................................................. 11 Table 5. Percent population with no dental coverage; 1996–2015 ................................................................... 13 Table 6. Percent population with a dental visit; 1996–2015 ............................................................................. 15 Table 7. Conditional mean number visits per person; 1996–2015 .................................................................... 17 Table 8. Total dental visits (thousands); 1996–2015 ........................................................................................ 19 Table 9. Total expense (millions) in dollars; 1996–2015 .................................................................................. 21 Table 10. Total expense (millions) in 2015 dollars; 1996–2015 ....................................................................... 23 Table 11. Mean expense per person in dollars; 1996–2015 .............................................................................. 25 Table 12. Mean expense per person in 2015 dollars; 1996–2015 ..................................................................... 27 Table 13. Mean out-of-pocket expense per person in dollars; 1996–2015 ....................................................... 29 Table 14. Mean out-of-pocket expense per person in 2015 dollars; 1996–2015 .............................................. 31 Table 15. Mean private dental insurance expense per person in dollars; 1996–2015 ....................................... 33 Table 16. Mean private dental insurance expense per person in 2015 dollars; 1996–2015 .............................. 35 Table 17. Mean public expense per person in dollars; 1996–2015 ................................................................... 37 Table 18. Mean Public Expense Per Person In 2015 Dollars; 1996–2015 ........................................................ 39 Table 19. Mean other expense per person in dollars; 1996–2015 ..................................................................... 41 Table 20. Mean other expense per person in 2015 dollars; 1996–2015 ............................................................ 43 Table 21. Percent total expense paid out-of-pocket; 1996–2015 ...................................................................... 45 Table 22. Percent total expense paid by private dental insurance; 1996–2015 ................................................. 47 Table 23. Percent total expense paid by public coverage; 1996–2015 ............................................................. 49 Table 24. Percent total expense paid by other sources; 1996–2015 .................................................................. 51 Table 25. Total dental procedures (thousands); 1996–2015 ............................................................................. 53 Table 26. Percent of total dental procedures – diagnostic; 1996–2015 ............................................................. 55 Table 27. Percent of total dental procedures – preventive; 1996–2015 ............................................................ 57 Table 28. Percent of total dental procedures – restorative; 1996–2015 ............................................................ 59 Table 29. Percent of total dental procedures – prosthetic; 1996–2015 ............................................................. 61 Table 30. Percent of total dental procedures – oral surgical; 1996–2015 ......................................................... 63 Table 31. Percent of total dental procedures – orthodontic; 1996–2015 ........................................................... 65 Table 32. Percent of total dental procedures – other; 1996–2015 ..................................................................... 67 Technical Appendix .......................................................................................................................................... 69

1
Dental Services: Use, Expenses, Source of Payment, Coverage and Procedure Type, 1996–2015 Richard J. Manski, DDS, MBA, PhD and Frederick Rohde, MA, Agency for Healthcare Research and Quality
Introduction
This report presents data from the 1996 through 2015 Medical Expenditure Panel Survey (MEPS) describing dental use, expenses, source of payments, coverage and procedure type for the U.S civilian noninstitutionalized (community) population. MEPS is sponsored by the Agency for Healthcare Research and Quality (AHRQ).
Estimates are presented for the total population as well as for specific population groups categorized in terms of sex, race/ethnicity, age, income, dental insurance coverage, employment, and education. This report is presented as part of a series of updates to Chartbook 17: Dental Use, Expenses, Dental Coverage, and Changes, 1996 and 2004. Only differences that are statistically significant at the 0.05 level are d e discussed in the text.
The estimates in this report are based on the most recent data available from MEPS at the time the report was written. However, selected elements of MEPS data may be revised on the basis of additional analyses, which could result in slightly different estimates from those shown here. Please check the MEPS Web site (http://www.meps.ahrq.gov/) for the most current file releases.
See the Technical Appendix for information and definitions of the categories used throughout this report. This Research Findings report and other MEPS publications are available electronically on the MEPS Web site at http://www.meps.ahrq.gov/.
Highlights
• Seventy-one percent of the community population had private or public dental coverage in 2015,increasing from 64 percent in 1996.
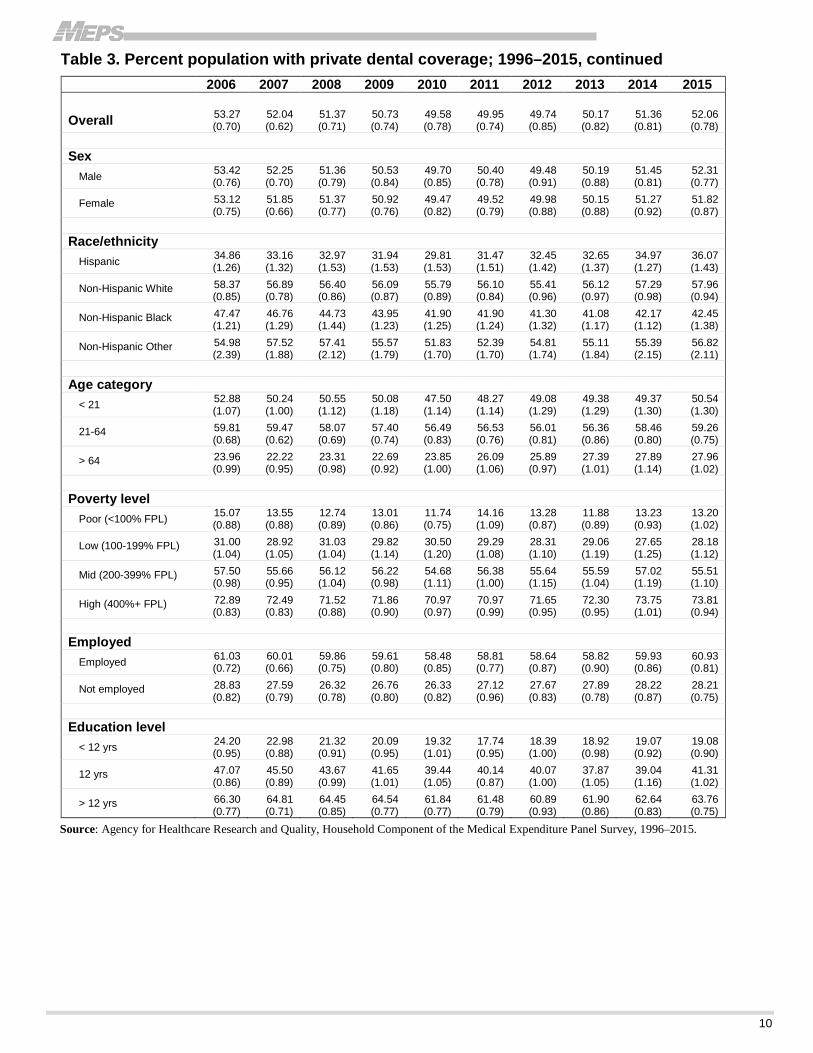
• Fifty-two percent of the community population had private dental coverage in 2015.
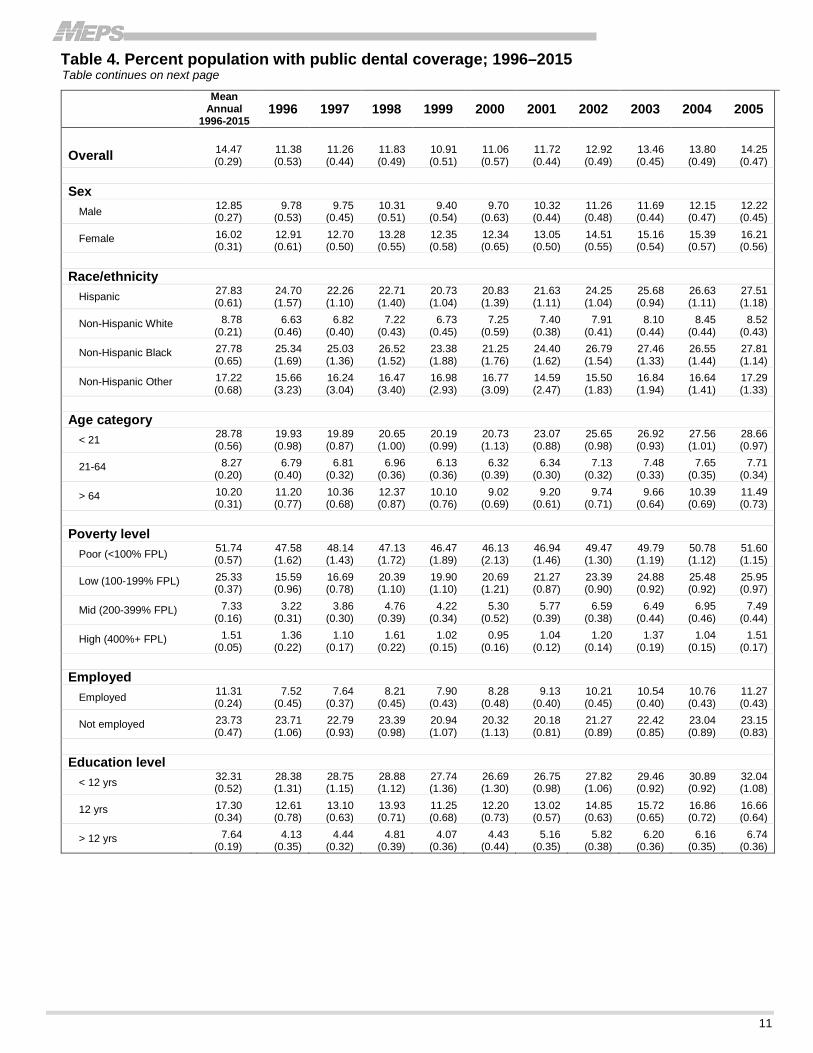
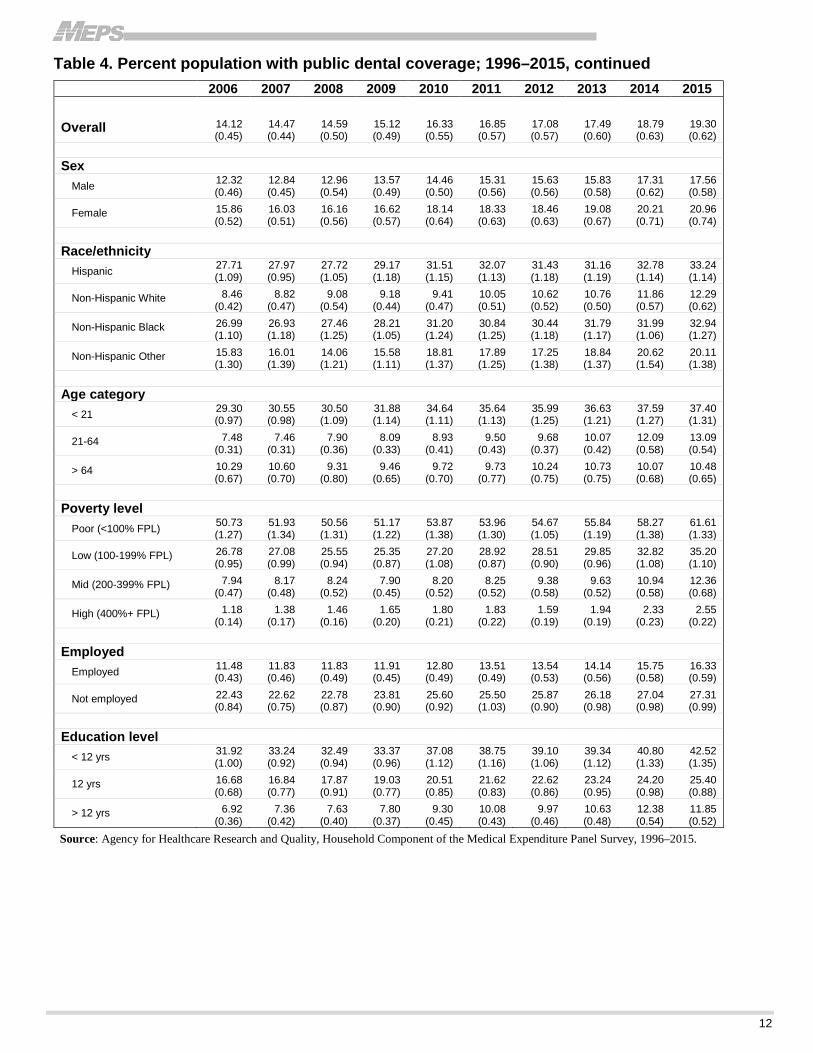
• Slightly more than 19 percent of the community population had public dental coverage in 2015,increasing from slightly more than 11 percent in 1996.
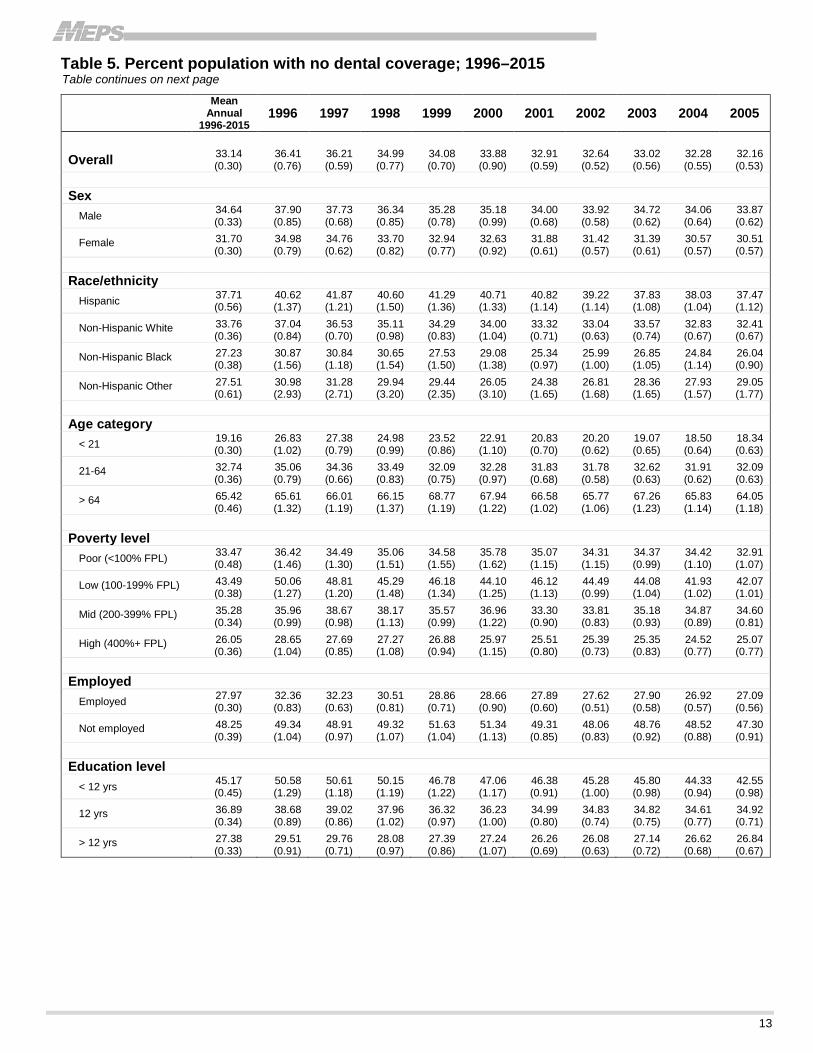
• Approximately 29 percent of the community population did not have dental coverage in 2015,decreasing from slightly more than 36 percent in 1996.
• Forty-three percent of the community population had a dental visit in 2015.
• While 56 percent of those with private dental coverage had a visit during 2015, only 33 percent withpublic dental coverage, and 26 percent with no dental coverage had a visit. The impact of havingpublic dental coverage on the likelihood of having a dental visit increased from 27 percent in 1996 to33 percent in 2015. However, the impact of having no dental coverage on the likelihood of having adental visit decreased from 29 percent in 1996 to 26 percent in 2015.
• The mean annual expense for persons with a visit was $696 in 2015 increasing from $374 ($564adjusted for inflation) in 1996.
• The average annual number of visits per person for persons with a visit decreased from 2.55 in 1996to 2.22 in 2015.
2
Findings
The report covers a twenty-year period from 1996 to and including 2015. This period included the enactment of the Children’s Health Insurance Program (CHIP) in 1997, which provided dental coverage to eligible children not otherwise eligible for Medicaid. This period also included the enactment of the Affordable Care Act (ACA) in 2010 extending dental coverage to eligible children not otherwise eligible for Medicaid or CHIP. Child dental benefits were also included as an essential health benefit—requiring that they be offered within health exchanges. The period was also witness to the Great Recession, which began in December 2007 and lasted until June 2009. It is likely that each of these events had some impact on the provision of dental care. The purpose of this report is to present detailed estimates providing a better understanding of oral health and dental care in the United States during a time when access-to-care-altering events and policy changes occurred.
Dental Insurance Coverage
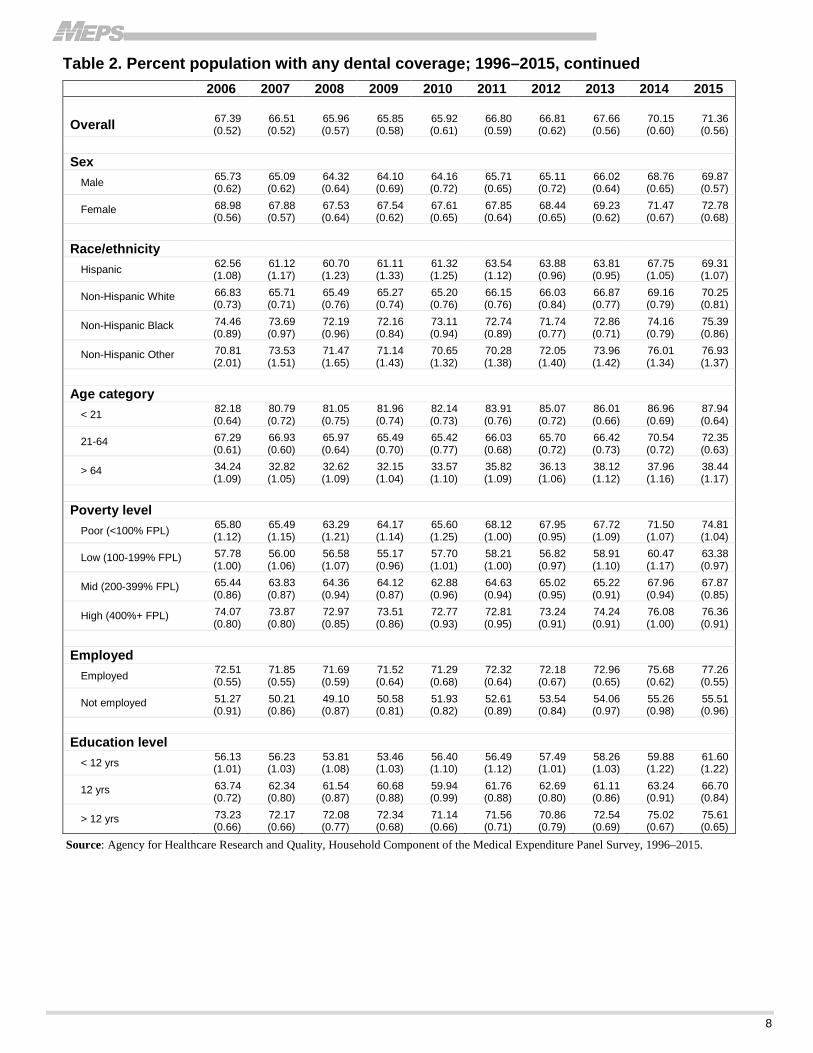
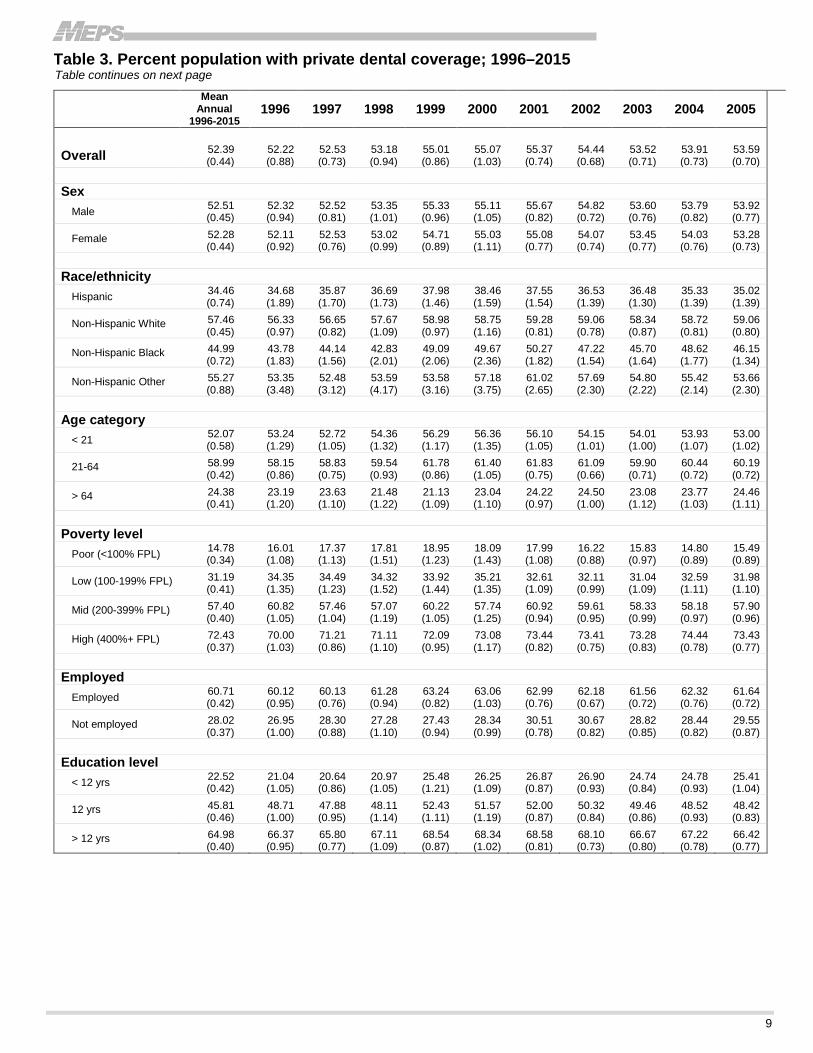
Overall, 71 percent of the community population had dental coverage in 2015, increasing from 64 percent in 1996 (Table 2). The mean annual rate of dental coverage among the community population during the 1996 to 2015 period was 67 percent. In 2015, dental coverage varied by age, family income, race/ethnicity, and education. About 72 percent of adults (ages 21–64) and 38 percent of older adults (age 65 and over) had dental coverage during 2015. Approximately 88 percent of children (birth to age 20) had dental coverage in 2015, increasing from 73 percent in 1996. Hispanics were more likely to have dental coverage in 2015 than in 1996 (69 vs. 59 percent). Persons with less than a high school education were less likely to have dental coverage in 2015 and in 1996 than persons with at least some college. However, this education gap in having dental coverage decreased during this twenty-year period. During this twenty-year period, public dental coverage increased. Specifically, 19 percent of the community population had public dental coverage in 2015, an increase from 11 percent in 1996 (Table 4). Overall, 29 percent of the community population did not have any dental coverage in 2015 (Table 5), which was a decrease from 36.4 percent in 1996.
Use of Dental Care
Overall, 43 percent of the community population had a dental visit in 2015 (Table 6). The mean annual rate of having a dental visit among the community population during the 1996 to 2015 period was 43 percent. In 2015, dental use varied by age, family income, race/ethnicity, dental insurance, employment and education. About 47 percent of older adults (age 65 and over) and 48 percent of children (birth to age 20) had a dental visit in 2015, increasing from 40 percent among older adults and 42 percent amongchildren in 1996. Slightly less than 40 percent of adults (ages 21 to 64) had a dental visit in 2015, decreasing from 44 percent in 1996. Persons from lower income families were less likely to have a dental visit in 2015 and in 1996 than persons from a family with higher income. Hispanics were more likely to have a dental visit in 2015 than in 1996 (33 vs. 29 percent). Hispanics and non-Hispanic blacks were less likely to have a dental visit in 2015 than non-Hispanic whites. Persons with private dental coverage were more likely to have a dental visit (56 percent) than persons with public coverage (33 percent) or persons without dental coverage (26 percent). The access-to-oral-health gap among persons with public dental coverage narrowed (27 percent in 1996 vs. 33 percent in 2015) during this twenty-year period. The employed were more likely to have a dental visit than persons who were not employed. Persons with less education were less likely to have a dental visit than persons with more education. Overall, the conditional mean number of dental visits decreased from 2.55 visits per person for those with a visit in 1996 to 2.22 visits per person in 2015 (Table 7).
3
Expenditures and Source of Payment
Overall, total expenditures for dental care increased from $43 billion ($65 billion adjusted for inflation) in 1996 to $96 billion in 2015 (Tables 9 and 10). The mean expense per person with an expense was $696 in 2015, increasing from $374 ($565 adjusted for inflation) in 1996 (Tables 11 and 12). The mean annual expense per person was $570 ($674 adjusted for inflation) during this twenty-year period. The mean out-of-pocket expense per person with an expense was $307 in 2015, increasing from $192 ($291 adjusted for inflation—no significant change observed in real terms) in 1996 (Tables 13 and 14). The mean private dental coverage expense per person with an expense was $299 in 2015, increasing from $159 ($240 adjusted for inflation) in 1996 (Tables 15 and 16). The mean public dental coverage expense per person with an expense was $58 in 2015, increasing from $11 ($16 adjusted for inflation) in 1996 (Tables 17 and 18). The percent of total expense paid out of pocket was 44 percent in 2015, decreasing from 51 percent in 1996 (Table 21). The percentage of total expense paid by private dental insurance was 43 percent in 2015 (Table 22). The percentage of total expense paid by public dental coverage was 8.4 percent in 2015, increasing from 2.8 percent in 1996 (Table 23).
Dental Procedure Type and Distribution
In 2015, approximately 138 million people with at least one dental visit (data not shown) received about 589 million dental procedures in the United States increasing from 496 million in 1996 (Table 25). Together, approximately 77 percent of all procedures were diagnostic (43.3 percent) or preventive (34.0 percent) during 2015, increasing from 69 percent (40.2 percent diagnostic and 29.0 percent preventive) in 1996 (Tables 26 and 27). As a percentage of all procedures, diagnostic and preventive procedures increased while restorative, prosthetic, surgical, and orthodontic procedures decreased from 1996 to 2015 (Tables 26 to 31).
Summary and Conclusions
This report presents data from the 1996 through 2015 Medical Expenditure Panel Survey (MEPS) describing dental use, expenses, sources of payment, coverage, and procedure types for the U.S. civilian noninstitutionalized (community) population. MEPS is sponsored by the Agency for Healthcare Research and Quality (AHRQ). This report is presented as part of a series of updates to Chartbook 17: Dental Use, Expenses, Dental Coverage, and Changes, 1996 and 2004. Estimates are presented for the total population as well as for specific population groups categorized in terms of sex, race/ethnicity, age, income, dental insurance coverage, employment, and education. This report presents detailed estimates providing a better understanding of oral health and the delivery of dental care in the United States during a time when significant access-to-dental-care-altering events and policy changes occurred. Overall, this twenty-year period was witness to many improvements in dental care delivery across a number of metrics and population subgroups.

4
References
Brown E, Manski R. Dental services: use, expenses, and sources of payment, 1996–2000. Rockville (MD): Agency for Healthcare Research and Quality; 2004. MEPS Research Findings No. 20. AHRQ Pub. No. 04-0018.
Cohen J. Design and Methods of the Medical Expenditure Panel Survey Household Component. MEPS Methodology Report No. 1. AHCPR Pub. No. 97-0026. Rockville, MD: Agency for Health Care Policy and Research, 1997. http://www.meps.ahrq.gov/mepsweb/data_files/publications/mr1/mr1.shtml (Accessed July 17, 2012.)
Cohen S. Design Strategies and Innovations in the Medical Expenditure Panel Survey. Medical Care, July 2003: 41(7) Supplement: III-5–III-12.
Ezzati-Rice TM, Rohde F, Greenblatt J. Sample Design of the Medical Expenditure Panel Survey Household Component, 1998‒2007. Methodology Report No. 22. March 2008. Agency for Healthcare Research and Quality, Rockville, MD. http://www.meps.ahrq.gov/mepsweb/data_files/publications/mr22/mr22.pdf
Manski RJ, Brown E. Dental Use, Expenses, Private Dental Coverage, and Changes, 1996 and 2004. Rockville (MD): Agency for Healthcare Research and Quality; 2007. MEPS Chartbook No.17. https://meps.ahrq.gov/data_files/publications/cb17/cb17.pdf
Monheit AC, Wilson R, Arnett RH. Informing American health care policy: the dynamics of medical expenditure and insurance surveys, 1977–1996. San Francisco: Jossey-Bass, 1999.

5
Table 1. Total population (thousands); 1996–2015 Table continues on next page
1996 1997 1998 1999 2000 2001 2002 2003 2004 2005
Overall 268,905 (13,731)
271,279 (9,435)
273,534 (16,008)
276,411 (14,339)
278,406 (22,543)
284,247 (13,110)
288,182 (13,549)
290,604 (13,575)
293,527 (13,721)
296,185 (13,998)
Sex Male 131,527
(6,718) 132,605 (4,685)
133,614 (7,900)
134,603 (7,115)
135,882 (11,105)
138,631 (6,443)
140,802 (6,663)
142,265 (6,707)
143,869 (6,807)
145,116 (6,890)
Female 137,379 (7,113)
138,673 (4,884)
139,919 (8,216)
141,808 (7,329)
142,524 (11,522)
145,616 (6,754)
147,380 (6,965)
148,340 (6,954)
149,658 (7,007)
151,069 (7,207)
Race/ethnicity Hispanic 29,979
(2,473) 31,111 (1,590)
32,058 (2,635)
33,031 (2,225)
33,955 (3,506)
37,685 (2,375)
39,665 (2,809)
40,696 (2,854)
42,212 (2,925)
43,576 (3,094)
Non-Hispanic White 193,708 (10,604)
195,030 (7,890)
196,359 (12,672)
197,468 (11,263)
198,164 (17,887)
198,174 (10,291)
195,463 (10,135)
196,304 (10,152)
196,305 (10,226)
196,514 (10,327)
Non-Hispanic Black 33,668 (3,020)
34,086 (1,858)
34,458 (3,214)
34,781 (3,062)
35,049 (4,083)
34,987 (2,155)
34,875 (2,925)
35,278 (2,848)
35,548 (2,947)
35,880 (2,961)
Non-Hispanic Other 11,550 (1,232)
11,052 (982)
10,658 (1,184)
11,131 (1,212)
11,237 (1,392)
13,402 (1,339)
18,179 (1,384)
18,327 (1,440)
19,461 (1,448)
20,214 (1,514)
Age category < 21 82,485
(4,493) 82,942 (3,178)
83,641 (5,024)
84,146 (4,539)
84,983 (6,911)
85,149 (4,114)
84,989 (4,152)
85,276 (4,119)
85,554 (4,123)
85,720 (4,216)
21-64 152,370 (7,856)
154,151 (5,339)
155,583 (9,357)
157,589 (8,329)
158,641 (13,123)
163,263 (7,658)
166,937 (7,912)
168,629 (7,969)
170,931 (8,071)
172,987 (8,246)
> 64 34,050 (1,953)
34,185 (1,470)
34,309 (2,136)
34,676 (2,007)
34,782 (2,966)
35,835 (1,824)
36,256 (1,979)
36,699 (2,062)
37,042 (2,074)
37,477 (2,036)
Poverty level Poor (<100% FPL) 38,298
(2,423) 36,415 (1,798)
35,303 (2,512)
32,795 (2,114)
32,053 (2,923)
33,713 (1,771)
35,618 (2,048)
36,827 (2,067)
37,707 (2,160)
37,915 (2,218)
Low (100-199% FPL) 53,406 (3,068)
50,957 (2,110)
48,436 (3,001)
51,250 (2,809)
49,255 (3,972)
52,465 (2,623)
52,639 (2,745)
53,950 (2,793)
53,964 (2,777)
54,033 (2,948)
Mid (200-399% FPL) 88,262 (5,060)
89,981 (3,619)
88,324 (5,458)
86,182 (5,002)
90,343 (7,638)
89,901 (4,453)
91,063 (4,575)
90,163 (4,604)
93,355 (4,757)
92,693 (4,800)
High (400%+ FPL) 88,939 (5,095)
93,926 (3,981)
101,470 (6,811)
106,184 (6,261)
106,754 (9,532)
108,168 (5,882)
108,862 (5,651)
109,664 (5,659)
108,500 (5,759)
111,543 (5,809)
Dental insurance Some private 140,410
(7,791) 142,494 (5,458)
145,479 (9,398)
152,049 (8,810)
153,314 (13,671)
157,386 (8,025)
156,878 (7,794)
155,533 (7,783)
158,252 (7,859)
158,728 (7,896)
Only public 30,598 (2,062)
30,546 (1,523)
32,354 (2,223)
30,157 (1,945)
30,781 (2,784)
33,305 (1,789)
37,234 (2,231)
39,116 (2,197)
40,515 (2,302)
42,213 (2,366)
Neither 97,897 (5,219)
98,239 (3,760)
95,701 (5,577)
94,205 (4,862)
94,310 (7,250)
93,557 (4,368)
94,070 (4,534)
95,955 (4,595)
94,759 (4,639)
95,243 (4,736)
Employed Employed 204,710
(10,726) 206,534 (7,413)
208,492 (12,610)
212,918 (11,488)
214,397 (17,666)
217,619 (10,224)
217,448 (10,394)
219,344 (10,446)
220,732 (10,500)
221,939 (10,662)
Not employed 64,021 (3,351)
64,632 (2,434)
64,915 (3,750)
63,294 (3,266)
63,882 (5,194)
66,570 (3,188)
70,571 (3,467)
71,176 (3,485)
72,631 (3,556)
74,031 (3,656)
Education level < 12 yrs 48,796
(3,068) 45,015 (1,994)
45,726 (2,893)
51,310 (2,794)
51,010 (4,201)
52,057 (2,498)
54,253 (2,860)
51,868 (2,754)
49,811 (2,564)
50,710 (2,713)
12 yrs 89,439 (4,857)
86,578 (3,437)
87,553 (5,323)
89,541 (4,942)
88,649 (7,453)
92,377 (4,365)
92,402 (4,725)
91,714 (4,663)
92,177 (4,684)
91,858 (4,645)
> 12 yrs 130,422 (7,201)
139,342 (5,345)
139,606 (8,886)
133,398 (7,702)
136,957 (11,727)
138,294 (7,084)
140,084 (6,873)
145,470 (7,213)
149,925 (7,506)
152,082 (7,695)

6
Table 1. Total population (thousands); 1996–2015, continued 2006 2007 2008 2009 2010 2011 2012 2013 2014 2015
Overall 299,267 (14,298)
301,309 (9,072)
304,376 (6,957)
306,661 (6,802)
308,574 (6,723)
311,126 (6,766)
313,490 (6,846)
315,722 (6,924)
318,440 (7,444)
321,423 (7,594)
Sex
Male 146,942 (7,047)
147,629 (4,524)
149,362 (3,549)
150,587 (3,442)
151,577 (3,404)
152,053 (3,407)
153,191 (3,469)
154,100 (3,659)
155,866 (3,764)
157,168 (3,752)
Female 152,325 (7,323)
153,680 (4,672)
155,014 (3,609)
156,073 (3,552)
156,997 (3,538)
159,073 (3,585)
160,299 (3,548)
161,622 (3,531)
162,574 (3,882)
164,255 (4,034)
Race/ethnicity
Hispanic 45,161 (3,138)
46,390 (2,473)
47,858 (3,111)
49,136 (3,225)
50,322 (3,192)
52,717 (3,276)
53,517 (3,410)
54,536 (3,253)
55,840 (3,266)
57,063 (3,385)
Non-Hispanic White 197,070 (10,477)
197,611 (6,896)
198,750 (5,704)
198,961 (5,433)
198,723 (5,472)
198,127 (5,715)
197,943 (5,753)
196,560 (5,696)
194,571 (5,965)
194,013 (6,082)
Non-Hispanic Black 36,285 (2,990)
36,704 (2,118)
37,012 (2,176)
36,888 (2,064)
37,444 (2,222)
37,322 (2,115)
37,888 (1,968)
37,967 (2,174)
38,926 (2,165)
39,533 (1,951)
Non-Hispanic Other 20,751 (1,631)
20,605 (1,300)
20,755 (1,657)
21,675 (1,548)
22,084 (1,763)
22,961 (1,927)
24,143 (1,778)
26,659 (1,711)
29,103 (2,237)
30,814 (2,405)
Age category
< 21 86,246 (4,298)
86,138 (2,894)
87,600 (2,781)
88,293 (2,556)
87,581 (2,516)
87,086 (2,626)
87,145 (2,632)
87,119 (2,604)
87,481 (2,811)
87,393 (2,752)
21-64 175,041 (8,373)
176,477 (5,421)
177,034 (3,902)
178,030 (4,027)
179,836 (4,083)
180,473 (3,960)
181,074 (3,992)
182,140 (3,968)
182,999 (4,319)
184,437 (4,542)
> 64 37,980 (2,104)
38,694 (1,497)
39,742 (1,574)
40,338 (1,354)
41,158 (1,319)
43,566 (1,563)
45,271 (1,629)
46,463 (1,563)
47,961 (1,639)
49,593 (1,653)
Poverty level
Poor (<100% FPL) 37,365 (2,084)
38,158 (1,621)
40,592 (1,661)
43,995 (1,830)
46,824 (1,826)
46,825 (1,858)
46,993 (1,905)
46,312 (1,784)
47,182 (1,986)
43,503 (1,873)
Low (100-199% FPL) 54,305 (2,947)
53,772 (1,927)
56,430 (1,875)
57,544 (1,907)
57,103 (1,836)
60,020 (1,906)
60,454 (1,911)
60,788 (1,927)
59,328 (1,961)
58,560 (1,848)
Mid (200-399% FPL) 93,404 (4,871)
93,234 (3,297)
94,931 (2,782)
94,122 (2,763)
92,977 (2,496)
94,385 (2,707)
94,168 (2,569)
93,399 (2,808)
92,119 (2,850)
91,925 (2,878)
High (400%+ FPL) 114,194 (6,028)
116,145 (4,380)
112,422 (3,588)
111,000 (3,660)
111,669 (3,628)
109,895 (3,576)
111,875 (3,820)
115,223 (3,706)
119,811 (3,912)
127,436 (4,383)
Dental insurance
Some private 159,405 (7,913)
156,813 (5,215)
156,352 (4,152)
155,558 (4,203)
153,005 (4,291)
155,416 (4,351)
155,918 (4,490)
158,395 (4,515)
163,537 (5,180)
167,330 (5,273)
Only public 42,259 (2,411)
43,592 (1,798)
44,403 (1,808)
46,371 (1,783)
50,392 (1,977)
52,426 (2,008)
53,534 (2,089)
55,231 (2,189)
59,836 (2,334)
62,029 (2,219)
Neither 97,603 (4,932)
100,904 (3,365)
103,621 (3,013)
104,732 (2,928)
105,177 (2,824)
103,284 (2,783)
104,038 (2,905)
102,096 (2,750)
95,067 (2,494)
92,065 (2,567)
Employed
Employed 227,140 (11,068)
227,359 (7,052)
227,512 (5,289)
223,833 (5,111)
223,229 (5,296)
224,344 (5,433)
223,519 (5,354)
227,589 (5,349)
232,403 (5,907)
236,313 (6,212)
Not employed 71,997 (3,599)
73,710 (2,444)
76,579 (2,433)
82,673 (2,405)
85,033 (2,321)
86,491 (2,456)
89,794 (2,523)
87,959 (2,430)
85,799 (2,262)
84,883 (2,369)
Education level
< 12 yrs 49,720 (2,724)
48,583 (1,959)
45,996 (1,701)
46,684 (1,675)
43,414 (1,727)
37,621 (1,565)
39,494 (1,494)
40,352 (1,596)
39,014 (1,476)
35,239 (1,210)
12 yrs 90,131 (4,665)
90,355 (3,147)
92,693 (2,775)
91,495 (2,411)
83,378 (2,179)
87,598 (2,325)
83,543 (2,341)
79,004 (2,135)
78,322 (2,080)
88,503 (2,576)
> 12 yrs 157,657 (7,920)
160,284 (5,321)
163,654 (4,529)
166,579 (4,320)
179,847 (4,382)
184,218 (4,913)
188,737 (4,880)
194,590 (4,997)
199,876 (5,705)
196,226 (5,631)
Source: Agency for Healthcare Research and Quality, Household Component of the Medical Expenditure Panel Survey, 1996–2015.

7
Table 2. Percent population with any dental coverage; 1996–2015 Table continues on next page
Mean Annual
1996-2015 1996 1997 1998 1999 2000 2001 2002 2003 2004 2005
Overall 66.86 (0.30)
63.59 (0.76)
63.79 (0.59)
65.01 (0.77)
65.92 (0.70)
66.12 (0.90)
67.09 (0.59)
67.36 (0.52)
66.98 (0.56)
67.72 (0.55)
67.84 (0.53)
Sex
Male 65.36 (0.33)
62.10 (0.85)
62.27 (0.68)
63.66 (0.85)
64.72 (0.78)
64.82 (0.99)
66.00 (0.68)
66.08 (0.58)
65.28 (0.62)
65.94 (0.64)
66.13 (0.62)
Female 68.30 (0.30)
65.02 (0.79)
65.24 (0.62)
66.30 (0.82)
67.06 (0.77)
67.37 (0.92)
68.12 (0.61)
68.58 (0.57)
68.61 (0.61)
69.43 (0.57)
69.49 (0.57)
Race/ethnicity
Hispanic 62.29 (0.56)
59.38 (1.37)
58.13 (1.21)
59.40 (1.50)
58.71 (1.36)
59.29 (1.33)
59.18 (1.14)
60.78 (1.14)
62.17 (1.08)
61.97 (1.04)
62.53 (1.12)
Non-Hispanic White 66.24 (0.36)
62.96 (0.84)
63.47 (0.70)
64.89 (0.98)
65.71 (0.83)
66.00 (1.04)
66.68 (0.71)
66.96 (0.63)
66.43 (0.74)
67.17 (0.67)
67.59 (0.67)
Non-Hispanic Black 72.77 (0.38)
69.13 (1.56)
69.16 (1.18)
69.35 (1.54)
72.47 (1.50)
70.92 (1.38)
74.66 (0.97)
74.01 (1.00)
73.15 (1.05)
75.16 (1.14)
73.96 (0.90)
Non-Hispanic Other 72.49 (0.61)
69.02 (2.93)
68.72 (2.71)
70.06 (3.20)
70.56 (2.35)
73.95 (3.10)
75.62 (1.65)
73.19 (1.68)
71.64 (1.65)
72.07 (1.57)
70.95 (1.77)
Age category
< 21 80.84 (0.30)
73.17 (1.02)
72.62 (0.79)
75.02 (0.99)
76.48 (0.86)
77.09 (1.10)
79.17 (0.70)
79.80 (0.62)
80.93 (0.65)
81.50 (0.64)
81.66 (0.63)
21-64 67.26 (0.36)
64.94 (0.79)
65.64 (0.66)
66.51 (0.83)
67.91 (0.75)
67.72 (0.97)
68.17 (0.68)
68.22 (0.58)
67.38 (0.63)
68.09 (0.62)
67.91 (0.63)
> 64 34.58 (0.46)
34.39 (1.32)
33.99 (1.19)
33.85 (1.37)
31.23 (1.19)
32.06 (1.22)
33.42 (1.02)
34.23 (1.06)
32.74 (1.23)
34.17 (1.14)
35.95 (1.18)
Poverty level
Poor (<100% FPL) 66.53 (0.48)
63.58 (1.46)
65.51 (1.30)
64.94 (1.51)
65.42 (1.55)
64.22 (1.62)
64.93 (1.15)
65.69 (1.15)
65.63 (0.99)
65.58 (1.10)
67.09 (1.07)
Low (100-199% FPL) 56.51 (0.38)
49.94 (1.27)
51.19 (1.20)
54.71 (1.48)
53.82 (1.34)
55.90 (1.25)
53.88 (1.13)
55.51 (0.99)
55.92 (1.04)
58.07 (1.02)
57.93 (1.01)
Mid (200-399% FPL) 64.72 (0.34)
64.04 (0.99)
61.33 (0.98)
61.83 (1.13)
64.43 (0.99)
63.04 (1.22)
66.70 (0.90)
66.19 (0.83)
64.82 (0.93)
65.13 (0.89)
65.40 (0.81)
High (400%+ FPL) 73.95 (0.36)
71.35 (1.04)
72.31 (0.85)
72.73 (1.08)
73.12 (0.94)
74.03 (1.15)
74.49 (0.80)
74.61 (0.73)
74.65 (0.83)
75.48 (0.77)
74.93 (0.77)
Employed
Employed 72.03 (0.30)
67.64 (0.83)
67.77 (0.63)
69.49 (0.81)
71.14 (0.71)
71.34 (0.90)
72.11 (0.60)
72.38 (0.51)
72.10 (0.58)
73.08 (0.57)
72.91 (0.56)
Not employed 51.75 (0.39)
50.66 (1.04)
51.09 (0.97)
50.68 (1.07)
48.37 (1.04)
48.66 (1.13)
50.69 (0.85)
51.94 (0.83)
51.24 (0.92)
51.48 (0.88)
52.70 (0.91)
Education level
< 12 yrs 54.83 (0.45)
49.42 (1.29)
49.39 (1.18)
49.85 (1.19)
53.22 (1.22)
52.94 (1.17)
53.62 (0.91)
54.72 (1.00)
54.20 (0.98)
55.67 (0.94)
57.45 (0.98)
12 yrs 63.11 (0.34)
61.32 (0.89)
60.98 (0.86)
62.04 (1.02)
63.68 (0.97)
63.77 (1.00)
65.01 (0.80)
65.17 (0.74)
65.18 (0.75)
65.39 (0.77)
65.08 (0.71)
> 12 yrs 72.62 (0.33)
70.49 (0.91)
70.24 (0.71)
71.92 (0.97)
72.61 (0.86)
72.76 (1.07)
73.74 (0.69)
73.92 (0.63)
72.86 (0.72)
73.38 (0.68)
73.16 (0.67)
8
Table 2. Percent population with any dental coverage; 1996–2015, continued 2006 2007 2008 2009 2010 2011 2012 2013 2014 2015
Overall 67.39 (0.52)
66.51 (0.52)
65.96 (0.57)
65.85 (0.58)
65.92 (0.61)
66.80 (0.59)
66.81 (0.62)
67.66 (0.56)
70.15 (0.60)
71.36 (0.56)
Sex Male 65.73
(0.62) 65.09 (0.62)
64.32 (0.64)
64.10 (0.69)
64.16 (0.72)
65.71 (0.65)
65.11 (0.72)
66.02 (0.64)
68.76 (0.65)
69.87 (0.57)
Female 68.98 (0.56)
67.88 (0.57)
67.53 (0.64)
67.54 (0.62)
67.61 (0.65)
67.85 (0.64)
68.44 (0.65)
69.23 (0.62)
71.47 (0.67)
72.78 (0.68)
Race/ethnicity Hispanic 62.56
(1.08) 61.12 (1.17)
60.70 (1.23)
61.11 (1.33)
61.32 (1.25)
63.54 (1.12)
63.88 (0.96)
63.81 (0.95)
67.75 (1.05)
69.31 (1.07)
Non-Hispanic White 66.83 (0.73)
65.71 (0.71)
65.49 (0.76)
65.27 (0.74)
65.20 (0.76)
66.15 (0.76)
66.03 (0.84)
66.87 (0.77)
69.16 (0.79)
70.25 (0.81)
Non-Hispanic Black 74.46 (0.89)
73.69 (0.97)
72.19 (0.96)
72.16 (0.84)
73.11 (0.94)
72.74 (0.89)
71.74 (0.77)
72.86 (0.71)
74.16 (0.79)
75.39 (0.86)
Non-Hispanic Other 70.81 (2.01)
73.53 (1.51)
71.47 (1.65)
71.14 (1.43)
70.65 (1.32)
70.28 (1.38)
72.05 (1.40)
73.96 (1.42)
76.01 (1.34)
76.93 (1.37)
Age category < 21 82.18
(0.64) 80.79 (0.72)
81.05 (0.75)
81.96 (0.74)
82.14 (0.73)
83.91 (0.76)
85.07 (0.72)
86.01 (0.66)
86.96 (0.69)
87.94 (0.64)
21-64 67.29 (0.61)
66.93 (0.60)
65.97 (0.64)
65.49 (0.70)
65.42 (0.77)
66.03 (0.68)
65.70 (0.72)
66.42 (0.73)
70.54 (0.72)
72.35 (0.63)
> 64 34.24 (1.09)
32.82 (1.05)
32.62 (1.09)
32.15 (1.04)
33.57 (1.10)
35.82 (1.09)
36.13 (1.06)
38.12 (1.12)
37.96 (1.16)
38.44 (1.17)
Poverty level Poor (<100% FPL) 65.80
(1.12) 65.49 (1.15)
63.29 (1.21)
64.17 (1.14)
65.60 (1.25)
68.12 (1.00)
67.95 (0.95)
67.72 (1.09)
71.50 (1.07)
74.81 (1.04)
Low (100-199% FPL) 57.78 (1.00)
56.00 (1.06)
56.58 (1.07)
55.17 (0.96)
57.70 (1.01)
58.21 (1.00)
56.82 (0.97)
58.91 (1.10)
60.47 (1.17)
63.38 (0.97)
Mid (200-399% FPL) 65.44 (0.86)
63.83 (0.87)
64.36 (0.94)
64.12 (0.87)
62.88 (0.96)
64.63 (0.94)
65.02 (0.95)
65.22 (0.91)
67.96 (0.94)
67.87 (0.85)
High (400%+ FPL) 74.07 (0.80)
73.87 (0.80)
72.97 (0.85)
73.51 (0.86)
72.77 (0.93)
72.81 (0.95)
73.24 (0.91)
74.24 (0.91)
76.08 (1.00)
76.36 (0.91)
Employed Employed 72.51
(0.55) 71.85 (0.55)
71.69 (0.59)
71.52 (0.64)
71.29 (0.68)
72.32 (0.64)
72.18 (0.67)
72.96 (0.65)
75.68 (0.62)
77.26 (0.55)
Not employed 51.27 (0.91)
50.21 (0.86)
49.10 (0.87)
50.58 (0.81)
51.93 (0.82)
52.61 (0.89)
53.54 (0.84)
54.06 (0.97)
55.26 (0.98)
55.51 (0.96)
Education level < 12 yrs 56.13
(1.01) 56.23 (1.03)
53.81 (1.08)
53.46 (1.03)
56.40 (1.10)
56.49 (1.12)
57.49 (1.01)
58.26 (1.03)
59.88 (1.22)
61.60 (1.22)
12 yrs 63.74 (0.72)
62.34 (0.80)
61.54 (0.87)
60.68 (0.88)
59.94 (0.99)
61.76 (0.88)
62.69 (0.80)
61.11 (0.86)
63.24 (0.91)
66.70 (0.84)
> 12 yrs 73.23 (0.66)
72.17 (0.66)
72.08 (0.77)
72.34 (0.68)
71.14 (0.66)
71.56 (0.71)
70.86 (0.79)
72.54 (0.69)
75.02 (0.67)
75.61 (0.65)
Source: Agency for Healthcare Research and Quality, Household Component of the Medical Expenditure Panel Survey, 1996–2015.
9
Table 3. Percent population with private dental coverage; 1996–2015 Table continues on next page
Mean Annual
1996-2015 1996 1997 1998 1999 2000 2001 2002 2003 2004 2005
Overall 52.39 (0.44)
52.22 (0.88)
52.53 (0.73)
53.18 (0.94)
55.01 (0.86)
55.07 (1.03)
55.37 (0.74)
54.44 (0.68)
53.52 (0.71)
53.91 (0.73)
53.59 (0.70)
Sex
Male 52.51 (0.45)
52.32 (0.94)
52.52 (0.81)
53.35 (1.01)
55.33 (0.96)
55.11 (1.05)
55.67 (0.82)
54.82 (0.72)
53.60 (0.76)
53.79 (0.82)
53.92 (0.77)
Female 52.28 (0.44)
52.11 (0.92)
52.53 (0.76)
53.02 (0.99)
54.71 (0.89)
55.03 (1.11)
55.08 (0.77)
54.07 (0.74)
53.45 (0.77)
54.03 (0.76)
53.28 (0.73)
Race/ethnicity
Hispanic 34.46 (0.74)
34.68 (1.89)
35.87 (1.70)
36.69 (1.73)
37.98 (1.46)
38.46 (1.59)
37.55 (1.54)
36.53 (1.39)
36.48 (1.30)
35.33 (1.39)
35.02 (1.39)
Non-Hispanic White 57.46 (0.45)
56.33 (0.97)
56.65 (0.82)
57.67 (1.09)
58.98 (0.97)
58.75 (1.16)
59.28 (0.81)
59.06 (0.78)
58.34 (0.87)
58.72 (0.81)
59.06 (0.80)
Non-Hispanic Black 44.99 (0.72)
43.78 (1.83)
44.14 (1.56)
42.83 (2.01)
49.09 (2.06)
49.67 (2.36)
50.27 (1.82)
47.22 (1.54)
45.70 (1.64)
48.62 (1.77)
46.15 (1.34)
Non-Hispanic Other 55.27 (0.88)
53.35 (3.48)
52.48 (3.12)
53.59 (4.17)
53.58 (3.16)
57.18 (3.75)
61.02 (2.65)
57.69 (2.30)
54.80 (2.22)
55.42 (2.14)
53.66 (2.30)
Age category
< 21 52.07 (0.58)
53.24 (1.29)
52.72 (1.05)
54.36 (1.32)
56.29 (1.17)
56.36 (1.35)
56.10 (1.05)
54.15 (1.01)
54.01 (1.00)
53.93 (1.07)
53.00 (1.02)
21-64 58.99 (0.42)
58.15 (0.86)
58.83 (0.75)
59.54 (0.93)
61.78 (0.86)
61.40 (1.05)
61.83 (0.75)
61.09 (0.66)
59.90 (0.71)
60.44 (0.72)
60.19 (0.72)
> 64 24.38 (0.41)
23.19 (1.20)
23.63 (1.10)
21.48 (1.22)
21.13 (1.09)
23.04 (1.10)
24.22 (0.97)
24.50 (1.00)
23.08 (1.12)
23.77 (1.03)
24.46 (1.11)
Poverty level
Poor (<100% FPL) 14.78 (0.34)
16.01 (1.08)
17.37 (1.13)
17.81 (1.51)
18.95 (1.23)
18.09 (1.43)
17.99 (1.08)
16.22 (0.88)
15.83 (0.97)
14.80 (0.89)
15.49 (0.89)
Low (100-199% FPL) 31.19 (0.41)
34.35 (1.35)
34.49 (1.23)
34.32 (1.52)
33.92 (1.44)
35.21 (1.35)
32.61 (1.09)
32.11 (0.99)
31.04 (1.09)
32.59 (1.11)
31.98 (1.10)
Mid (200-399% FPL) 57.40 (0.40)
60.82 (1.05)
57.46 (1.04)
57.07 (1.19)
60.22 (1.05)
57.74 (1.25)
60.92 (0.94)
59.61 (0.95)
58.33 (0.99)
58.18 (0.97)
57.90 (0.96)
High (400%+ FPL) 72.43 (0.37)
70.00 (1.03)
71.21 (0.86)
71.11 (1.10)
72.09 (0.95)
73.08 (1.17)
73.44 (0.82)
73.41 (0.75)
73.28 (0.83)
74.44 (0.78)
73.43 (0.77)
Employed
Employed 60.71 (0.42)
60.12 (0.95)
60.13 (0.76)
61.28 (0.94)
63.24 (0.82)
63.06 (1.03)
62.99 (0.76)
62.18 (0.67)
61.56 (0.72)
62.32 (0.76)
61.64 (0.72)
Not employed 28.02 (0.37)
26.95 (1.00)
28.30 (0.88)
27.28 (1.10)
27.43 (0.94)
28.34 (0.99)
30.51 (0.78)
30.67 (0.82)
28.82 (0.85)
28.44 (0.82)
29.55 (0.87)
Education level
< 12 yrs 22.52 (0.42)
21.04 (1.05)
20.64 (0.86)
20.97 (1.05)
25.48 (1.21)
26.25 (1.09)
26.87 (0.87)
26.90 (0.93)
24.74 (0.84)
24.78 (0.93)
25.41 (1.04)
12 yrs 45.81 (0.46)
48.71 (1.00)
47.88 (0.95)
48.11 (1.14)
52.43 (1.11)
51.57 (1.19)
52.00 (0.87)
50.32 (0.84)
49.46 (0.86)
48.52 (0.93)
48.42 (0.83)
> 12 yrs 64.98 (0.40)
66.37 (0.95)
65.80 (0.77)
67.11 (1.09)
68.54 (0.87)
68.34 (1.02)
68.58 (0.81)
68.10 (0.73)
66.67 (0.80)
67.22 (0.78)
66.42 (0.77)
10
Table 3. Percent population with private dental coverage; 1996–2015, continued 2006 2007 2008 2009 2010 2011 2012 2013 2014 2015
Overall 53.27 (0.70)
52.04 (0.62)
51.37 (0.71)
50.73 (0.74)
49.58 (0.78)
49.95 (0.74)
49.74 (0.85)
50.17 (0.82)
51.36 (0.81)
52.06 (0.78)
Sex
Male 53.42 (0.76)
52.25 (0.70)
51.36 (0.79)
50.53 (0.84)
49.70 (0.85)
50.40 (0.78)
49.48 (0.91)
50.19 (0.88)
51.45 (0.81)
52.31 (0.77)
Female 53.12 (0.75)
51.85 (0.66)
51.37 (0.77)
50.92 (0.76)
49.47 (0.82)
49.52 (0.79)
49.98 (0.88)
50.15 (0.88)
51.27 (0.92)
51.82 (0.87)
Race/ethnicity
Hispanic 34.86 (1.26)
33.16 (1.32)
32.97 (1.53)
31.94 (1.53)
29.81 (1.53)
31.47 (1.51)
32.45 (1.42)
32.65 (1.37)
34.97 (1.27)
36.07 (1.43)
Non-Hispanic White 58.37 (0.85)
56.89 (0.78)
56.40 (0.86)
56.09 (0.87)
55.79 (0.89)
56.10 (0.84)
55.41 (0.96)
56.12 (0.97)
57.29 (0.98)
57.96 (0.94)
Non-Hispanic Black 47.47 (1.21)
46.76 (1.29)
44.73 (1.44)
43.95 (1.23)
41.90 (1.25)
41.90 (1.24)
41.30 (1.32)
41.08 (1.17)
42.17 (1.12)
42.45 (1.38)
Non-Hispanic Other 54.98 (2.39)
57.52 (1.88)
57.41 (2.12)
55.57 (1.79)
51.83 (1.70)
52.39 (1.70)
54.81 (1.74)
55.11 (1.84)
55.39 (2.15)
56.82 (2.11)
Age category
< 21 52.88 (1.07)
50.24 (1.00)
50.55 (1.12)
50.08 (1.18)
47.50 (1.14)
48.27 (1.14)
49.08 (1.29)
49.38 (1.29)
49.37 (1.30)
50.54 (1.30)
21-64 59.81 (0.68)
59.47 (0.62)
58.07 (0.69)
57.40 (0.74)
56.49 (0.83)
56.53 (0.76)
56.01 (0.81)
56.36 (0.86)
58.46 (0.80)
59.26 (0.75)
> 64 23.96 (0.99)
22.22 (0.95)
23.31 (0.98)
22.69 (0.92)
23.85 (1.00)
26.09 (1.06)
25.89 (0.97)
27.39 (1.01)
27.89 (1.14)
27.96 (1.02)
Poverty level
Poor (<100% FPL) 15.07 (0.88)
13.55 (0.88)
12.74 (0.89)
13.01 (0.86)
11.74 (0.75)
14.16 (1.09)
13.28 (0.87)
11.88 (0.89)
13.23 (0.93)
13.20 (1.02)
Low (100-199% FPL) 31.00 (1.04)
28.92 (1.05)
31.03 (1.04)
29.82 (1.14)
30.50 (1.20)
29.29 (1.08)
28.31 (1.10)
29.06 (1.19)
27.65 (1.25)
28.18 (1.12)
Mid (200-399% FPL) 57.50 (0.98)
55.66 (0.95)
56.12 (1.04)
56.22 (0.98)
54.68 (1.11)
56.38 (1.00)
55.64 (1.15)
55.59 (1.04)
57.02 (1.19)
55.51 (1.10)
High (400%+ FPL) 72.89 (0.83)
72.49 (0.83)
71.52 (0.88)
71.86 (0.90)
70.97 (0.97)
70.97 (0.99)
71.65 (0.95)
72.30 (0.95)
73.75 (1.01)
73.81 (0.94)
Employed
Employed 61.03 (0.72)
60.01 (0.66)
59.86 (0.75)
59.61 (0.80)
58.48 (0.85)
58.81 (0.77)
58.64 (0.87)
58.82 (0.90)
59.93 (0.86)
60.93 (0.81)
Not employed 28.83 (0.82)
27.59 (0.79)
26.32 (0.78)
26.76 (0.80)
26.33 (0.82)
27.12 (0.96)
27.67 (0.83)
27.89 (0.78)
28.22 (0.87)
28.21 (0.75)
Education level
< 12 yrs 24.20 (0.95)
22.98 (0.88)
21.32 (0.91)
20.09 (0.95)
19.32 (1.01)
17.74 (0.95)
18.39 (1.00)
18.92 (0.98)
19.07 (0.92)
19.08 (0.90)
12 yrs 47.07 (0.86)
45.50 (0.89)
43.67 (0.99)
41.65 (1.01)
39.44 (1.05)
40.14 (0.87)
40.07 (1.00)
37.87 (1.05)
39.04 (1.16)
41.31 (1.02)
> 12 yrs 66.30 (0.77)
64.81 (0.71)
64.45 (0.85)
64.54 (0.77)
61.84 (0.77)
61.48 (0.79)
60.89 (0.93)
61.90 (0.86)
62.64 (0.83)
63.76 (0.75)
Source: Agency for Healthcare Research and Quality, Household Component of the Medical Expenditure Panel Survey, 1996–2015.
11
Table 4. Percent population with public dental coverage; 1996–2015 Table continues on next page
Mean Annual
1996-2015 1996 1997 1998 1999 2000 2001 2002 2003 2004 2005
Overall 14.47 (0.29)
11.38 (0.53)
11.26 (0.44)
11.83 (0.49)
10.91 (0.51)
11.06 (0.57)
11.72 (0.44)
12.92 (0.49)
13.46 (0.45)
13.80 (0.49)
14.25 (0.47)
Sex
Male 12.85 (0.27)
9.78 (0.53)
9.75 (0.45)
10.31 (0.51)
9.40 (0.54)
9.70 (0.63)
10.32 (0.44)
11.26 (0.48)
11.69 (0.44)
12.15 (0.47)
12.22 (0.45)
Female 16.02 (0.31)
12.91 (0.61)
12.70 (0.50)
13.28 (0.55)
12.35 (0.58)
12.34 (0.65)
13.05 (0.50)
14.51 (0.55)
15.16 (0.54)
15.39 (0.57)
16.21 (0.56)
Race/ethnicity
Hispanic 27.83 (0.61)
24.70 (1.57)
22.26 (1.10)
22.71 (1.40)
20.73 (1.04)
20.83 (1.39)
21.63 (1.11)
24.25 (1.04)
25.68 (0.94)
26.63 (1.11)
27.51 (1.18)
Non-Hispanic White 8.78 (0.21)
6.63 (0.46)
6.82 (0.40)
7.22 (0.43)
6.73 (0.45)
7.25 (0.59)
7.40 (0.38)
7.91 (0.41)
8.10 (0.44)
8.45 (0.44)
8.52 (0.43)
Non-Hispanic Black 27.78 (0.65)
25.34 (1.69)
25.03 (1.36)
26.52 (1.52)
23.38 (1.88)
21.25 (1.76)
24.40 (1.62)
26.79 (1.54)
27.46 (1.33)
26.55 (1.44)
27.81 (1.14)
Non-Hispanic Other 17.22 (0.68)
15.66 (3.23)
16.24 (3.04)
16.47 (3.40)
16.98 (2.93)
16.77 (3.09)
14.59 (2.47)
15.50 (1.83)
16.84 (1.94)
16.64 (1.41)
17.29 (1.33)
Age category
< 21 28.78 (0.56)
19.93 (0.98)
19.89 (0.87)
20.65 (1.00)
20.19 (0.99)
20.73 (1.13)
23.07 (0.88)
25.65 (0.98)
26.92 (0.93)
27.56 (1.01)
28.66 (0.97)
21-64 8.27 (0.20)
6.79 (0.40)
6.81 (0.32)
6.96 (0.36)
6.13 (0.36)
6.32 (0.39)
6.34 (0.30)
7.13 (0.32)
7.48 (0.33)
7.65 (0.35)
7.71 (0.34)
> 64 10.20 (0.31)
11.20 (0.77)
10.36 (0.68)
12.37 (0.87)
10.10 (0.76)
9.02 (0.69)
9.20 (0.61)
9.74 (0.71)
9.66 (0.64)
10.39 (0.69)
11.49 (0.73)
Poverty level
Poor (<100% FPL) 51.74 (0.57)
47.58 (1.62)
48.14 (1.43)
47.13 (1.72)
46.47 (1.89)
46.13 (2.13)
46.94 (1.46)
49.47 (1.30)
49.79 (1.19)
50.78 (1.12)
51.60 (1.15)
Low (100-199% FPL) 25.33 (0.37)
15.59 (0.96)
16.69 (0.78)
20.39 (1.10)
19.90 (1.10)
20.69 (1.21)
21.27 (0.87)
23.39 (0.90)
24.88 (0.92)
25.48 (0.92)
25.95 (0.97)
Mid (200-399% FPL) 7.33 (0.16)
3.22 (0.31)
3.86 (0.30)
4.76 (0.39)
4.22 (0.34)
5.30 (0.52)
5.77 (0.39)
6.59 (0.38)
6.49 (0.44)
6.95 (0.46)
7.49 (0.44)
High (400%+ FPL) 1.51 (0.05)
1.36 (0.22)
1.10 (0.17)
1.61 (0.22)
1.02 (0.15)
0.95 (0.16)
1.04 (0.12)
1.20 (0.14)
1.37 (0.19)
1.04 (0.15)
1.51 (0.17)
Employed
Employed 11.31 (0.24)
7.52 (0.45)
7.64 (0.37)
8.21 (0.45)
7.90 (0.43)
8.28 (0.48)
9.13 (0.40)
10.21 (0.45)
10.54 (0.40)
10.76 (0.43)
11.27 (0.43)
Not employed 23.73 (0.47)
23.71 (1.06)
22.79 (0.93)
23.39 (0.98)
20.94 (1.07)
20.32 (1.13)
20.18 (0.81)
21.27 (0.89)
22.42 (0.85)
23.04 (0.89)
23.15 (0.83)
Education level
< 12 yrs 32.31 (0.52)
28.38 (1.31)
28.75 (1.15)
28.88 (1.12)
27.74 (1.36)
26.69 (1.30)
26.75 (0.98)
27.82 (1.06)
29.46 (0.92)
30.89 (0.92)
32.04 (1.08)
12 yrs 17.30 (0.34)
12.61 (0.78)
13.10 (0.63)
13.93 (0.71)
11.25 (0.68)
12.20 (0.73)
13.02 (0.57)
14.85 (0.63)
15.72 (0.65)
16.86 (0.72)
16.66 (0.64)
> 12 yrs 7.64 (0.19)
4.13 (0.35)
4.44 (0.32)
4.81 (0.39)
4.07 (0.36)
4.43 (0.44)
5.16 (0.35)
5.82 (0.38)
6.20 (0.36)
6.16 (0.35)
6.74 (0.36)
12
Table 4. Percent population with public dental coverage; 1996–2015, continued
2006 2007 2008 2009 2010 2011 2012 2013 2014 2015
Overall 14.12 (0.45)
14.47 (0.44)
14.59 (0.50)
15.12 (0.49)
16.33 (0.55)
16.85 (0.57)
17.08 (0.57)
17.49 (0.60)
18.79 (0.63)
19.30 (0.62)
Sex
Male 12.32 (0.46)
12.84 (0.45)
12.96 (0.54)
13.57 (0.49)
14.46 (0.50)
15.31 (0.56)
15.63 (0.56)
15.83 (0.58)
17.31 (0.62)
17.56 (0.58)
Female 15.86 (0.52)
16.03 (0.51)
16.16 (0.56)
16.62 (0.57)
18.14 (0.64)
18.33 (0.63)
18.46 (0.63)
19.08 (0.67)
20.21 (0.71)
20.96 (0.74)
Race/ethnicity
Hispanic 27.71 (1.09)
27.97 (0.95)
27.72 (1.05)
29.17 (1.18)
31.51 (1.15)
32.07 (1.13)
31.43 (1.18)
31.16 (1.19)
32.78 (1.14)
33.24 (1.14)
Non-Hispanic White 8.46 (0.42)
8.82 (0.47)
9.08 (0.54)
9.18 (0.44)
9.41 (0.47)
10.05 (0.51)
10.62 (0.52)
10.76 (0.50)
11.86 (0.57)
12.29 (0.62)
Non-Hispanic Black 26.99 (1.10)
26.93 (1.18)
27.46 (1.25)
28.21 (1.05)
31.20 (1.24)
30.84 (1.25)
30.44 (1.18)
31.79 (1.17)
31.99 (1.06)
32.94 (1.27)
Non-Hispanic Other 15.83 (1.30)
16.01 (1.39)
14.06 (1.21)
15.58 (1.11)
18.81 (1.37)
17.89 (1.25)
17.25 (1.38)
18.84 (1.37)
20.62 (1.54)
20.11 (1.38)
Age category
< 21 29.30 (0.97)
30.55 (0.98)
30.50 (1.09)
31.88 (1.14)
34.64 (1.11)
35.64 (1.13)
35.99 (1.25)
36.63 (1.21)
37.59 (1.27)
37.40 (1.31)
21-64 7.48 (0.31)
7.46 (0.31)
7.90 (0.36)
8.09 (0.33)
8.93 (0.41)
9.50 (0.43)
9.68 (0.37)
10.07 (0.42)
12.09 (0.58)
13.09 (0.54)
> 64 10.29 (0.67)
10.60 (0.70)
9.31 (0.80)
9.46 (0.65)
9.72 (0.70)
9.73 (0.77)
10.24 (0.75)
10.73 (0.75)
10.07 (0.68)
10.48 (0.65)
Poverty level
Poor (<100% FPL) 50.73 (1.27)
51.93 (1.34)
50.56 (1.31)
51.17 (1.22)
53.87 (1.38)
53.96 (1.30)
54.67 (1.05)
55.84 (1.19)
58.27 (1.38)
61.61 (1.33)
Low (100-199% FPL) 26.78 (0.95)
27.08 (0.99)
25.55 (0.94)
25.35 (0.87)
27.20 (1.08)
28.92 (0.87)
28.51 (0.90)
29.85 (0.96)
32.82 (1.08)
35.20 (1.10)
Mid (200-399% FPL) 7.94 (0.47)
8.17 (0.48)
8.24 (0.52)
7.90 (0.45)
8.20 (0.52)
8.25 (0.52)
9.38 (0.58)
9.63 (0.52)
10.94 (0.58)
12.36 (0.68)
High (400%+ FPL) 1.18 (0.14)
1.38 (0.17)
1.46 (0.16)
1.65 (0.20)
1.80 (0.21)
1.83 (0.22)
1.59 (0.19)
1.94 (0.19)
2.33 (0.23)
2.55 (0.22)
Employed
Employed 11.48 (0.43)
11.83 (0.46)
11.83 (0.49)
11.91 (0.45)
12.80 (0.49)
13.51 (0.49)
13.54 (0.53)
14.14 (0.56)
15.75 (0.58)
16.33 (0.59)
Not employed 22.43 (0.84)
22.62 (0.75)
22.78 (0.87)
23.81 (0.90)
25.60 (0.92)
25.50 (1.03)
25.87 (0.90)
26.18 (0.98)
27.04 (0.98)
27.31 (0.99)
Education level
< 12 yrs 31.92 (1.00)
33.24 (0.92)
32.49 (0.94)
33.37 (0.96)
37.08 (1.12)
38.75 (1.16)
39.10 (1.06)
39.34 (1.12)
40.80 (1.33)
42.52 (1.35)
12 yrs 16.68 (0.68)
16.84 (0.77)
17.87 (0.91)
19.03 (0.77)
20.51 (0.85)
21.62 (0.83)
22.62 (0.86)
23.24 (0.95)
24.20 (0.98)
25.40 (0.88)
> 12 yrs 6.92 (0.36)
7.36 (0.42)
7.63 (0.40)
7.80 (0.37)
9.30 (0.45)
10.08 (0.43)
9.97 (0.46)
10.63 (0.48)
12.38 (0.54)
11.85 (0.52)
Source: Agency for Healthcare Research and Quality, Household Component of the Medical Expenditure Panel Survey, 1996–2015.
13
Table 5. Percent population with no dental coverage; 1996–2015 Table continues on next page
Mean Annual
1996-2015 1996 1997 1998 1999 2000 2001 2002 2003 2004 2005
Overall 33.14 (0.30)
36.41 (0.76)
36.21 (0.59)
34.99 (0.77)
34.08 (0.70)
33.88 (0.90)
32.91 (0.59)
32.64 (0.52)
33.02 (0.56)
32.28 (0.55)
32.16 (0.53)
Sex
Male 34.64 (0.33)
37.90 (0.85)
37.73 (0.68)
36.34 (0.85)
35.28 (0.78)
35.18 (0.99)
34.00 (0.68)
33.92 (0.58)
34.72 (0.62)
34.06 (0.64)
33.87 (0.62)
Female 31.70 (0.30)
34.98 (0.79)
34.76 (0.62)
33.70 (0.82)
32.94 (0.77)
32.63 (0.92)
31.88 (0.61)
31.42 (0.57)
31.39 (0.61)
30.57 (0.57)
30.51 (0.57)
Race/ethnicity
Hispanic 37.71 (0.56)
40.62 (1.37)
41.87 (1.21)
40.60 (1.50)
41.29 (1.36)
40.71 (1.33)
40.82 (1.14)
39.22 (1.14)
37.83 (1.08)
38.03 (1.04)
37.47 (1.12)
Non-Hispanic White 33.76 (0.36)
37.04 (0.84)
36.53 (0.70)
35.11 (0.98)
34.29 (0.83)
34.00 (1.04)
33.32 (0.71)
33.04 (0.63)
33.57 (0.74)
32.83 (0.67)
32.41 (0.67)
Non-Hispanic Black 27.23 (0.38)
30.87 (1.56)
30.84 (1.18)
30.65 (1.54)
27.53 (1.50)
29.08 (1.38)
25.34 (0.97)
25.99 (1.00)
26.85 (1.05)
24.84 (1.14)
26.04 (0.90)
Non-Hispanic Other 27.51 (0.61)
30.98 (2.93)
31.28 (2.71)
29.94 (3.20)
29.44 (2.35)
26.05 (3.10)
24.38 (1.65)
26.81 (1.68)
28.36 (1.65)
27.93 (1.57)
29.05 (1.77)
Age category
< 21 19.16 (0.30)
26.83 (1.02)
27.38 (0.79)
24.98 (0.99)
23.52 (0.86)
22.91 (1.10)
20.83 (0.70)
20.20 (0.62)
19.07 (0.65)
18.50 (0.64)
18.34 (0.63)
21-64 32.74 (0.36)
35.06 (0.79)
34.36 (0.66)
33.49 (0.83)
32.09 (0.75)
32.28 (0.97)
31.83 (0.68)
31.78 (0.58)
32.62 (0.63)
31.91 (0.62)
32.09 (0.63)
> 64 65.42 (0.46)
65.61 (1.32)
66.01 (1.19)
66.15 (1.37)
68.77 (1.19)
67.94 (1.22)
66.58 (1.02)
65.77 (1.06)
67.26 (1.23)
65.83 (1.14)
64.05 (1.18)
Poverty level
Poor (<100% FPL) 33.47 (0.48)
36.42 (1.46)
34.49 (1.30)
35.06 (1.51)
34.58 (1.55)
35.78 (1.62)
35.07 (1.15)
34.31 (1.15)
34.37 (0.99)
34.42 (1.10)
32.91 (1.07)
Low (100-199% FPL) 43.49 (0.38)
50.06 (1.27)
48.81 (1.20)
45.29 (1.48)
46.18 (1.34)
44.10 (1.25)
46.12 (1.13)
44.49 (0.99)
44.08 (1.04)
41.93 (1.02)
42.07 (1.01)
Mid (200-399% FPL) 35.28 (0.34)
35.96 (0.99)
38.67 (0.98)
38.17 (1.13)
35.57 (0.99)
36.96 (1.22)
33.30 (0.90)
33.81 (0.83)
35.18 (0.93)
34.87 (0.89)
34.60 (0.81)
High (400%+ FPL) 26.05 (0.36)
28.65 (1.04)
27.69 (0.85)
27.27 (1.08)
26.88 (0.94)
25.97 (1.15)
25.51 (0.80)
25.39 (0.73)
25.35 (0.83)
24.52 (0.77)
25.07 (0.77)
Employed
Employed 27.97 (0.30)
32.36 (0.83)
32.23 (0.63)
30.51 (0.81)
28.86 (0.71)
28.66 (0.90)
27.89 (0.60)
27.62 (0.51)
27.90 (0.58)
26.92 (0.57)
27.09 (0.56)
Not employed 48.25 (0.39)
49.34 (1.04)
48.91 (0.97)
49.32 (1.07)
51.63 (1.04)
51.34 (1.13)
49.31 (0.85)
48.06 (0.83)
48.76 (0.92)
48.52 (0.88)
47.30 (0.91)
Education level
< 12 yrs 45.17 (0.45)
50.58 (1.29)
50.61 (1.18)
50.15 (1.19)
46.78 (1.22)
47.06 (1.17)
46.38 (0.91)
45.28 (1.00)
45.80 (0.98)
44.33 (0.94)
42.55 (0.98)
12 yrs 36.89 (0.34)
38.68 (0.89)
39.02 (0.86)
37.96 (1.02)
36.32 (0.97)
36.23 (1.00)
34.99 (0.80)
34.83 (0.74)
34.82 (0.75)
34.61 (0.77)
34.92 (0.71)
> 12 yrs 27.38 (0.33)
29.51 (0.91)
29.76 (0.71)
28.08 (0.97)
27.39 (0.86)
27.24 (1.07)
26.26 (0.69)
26.08 (0.63)
27.14 (0.72)
26.62 (0.68)
26.84 (0.67)

14
Table 5. Percent population with no dental coverage; 1996–2015, continued
2006 2007 2008 2009 2010 2011 2012 2013 2014 2015
Overall 32.61 (0.52)
33.49 (0.52)
34.04 (0.57)
34.15 (0.58)
34.08 (0.61)
33.20 (0.59)
33.19 (0.62)
32.34 (0.56)
29.85 (0.60)
28.64 (0.56)
Sex
Male 34.27 (0.62)
34.91 (0.62)
35.68 (0.64)
35.90 (0.69)
35.84 (0.72)
34.29 (0.65)
34.89 (0.72)
33.98 (0.64)
31.24 (0.65)
30.13 (0.57)
Female 31.02 (0.56)
32.12 (0.57)
32.47 (0.64)
32.46 (0.62)
32.39 (0.65)
32.15 (0.64)
31.56 (0.65)
30.77 (0.62)
28.53 (0.67)
27.22 (0.68)
Race/ethnicity
Hispanic 37.44 (1.08)
38.88 (1.17)
39.30 (1.23)
38.89 (1.33)
38.68 (1.25)
36.46 (1.12)
36.12 (0.96)
36.19 (0.95)
32.25 (1.05)
30.69 (1.07)
Non-Hispanic White 33.17 (0.73)
34.29 (0.71)
34.51 (0.76)
34.73 (0.74)
34.80 (0.76)
33.85 (0.76)
33.97 (0.84)
33.13 (0.77)
30.84 (0.79)
29.75 (0.81)
Non-Hispanic Black 25.54 (0.89)
26.31 (0.97)
27.81 (0.96)
27.84 (0.84)
26.89 (0.94)
27.26 (0.89)
28.26 (0.77)
27.14 (0.71)
25.84 (0.79)
24.61 (0.86)
Non-Hispanic Other 29.19 (2.01)
26.47 (1.51)
28.53 (1.65)
28.86 (1.43)
29.35 (1.32)
29.72 (1.38)
27.95 (1.40)
26.04 (1.42)
23.99 (1.34)
23.07 (1.37)
Age category
< 21 17.82 (0.64)
19.21 (0.72)
18.95 (0.75)
18.04 (0.74)
17.86 (0.73)
16.09 (0.76)
14.93 (0.72)
13.99 (0.66)
13.04 (0.69)
12.06 (0.64)
21-64 32.71 (0.61)
33.07 (0.60)
34.03 (0.64)
34.51 (0.70)
34.58 (0.77)
33.97 (0.68)
34.30 (0.72)
33.58 (0.73)
29.46 (0.72)
27.65 (0.63)
> 64 65.76 (1.09)
67.18 (1.05)
67.38 (1.09)
67.85 (1.04)
66.43 (1.10)
64.18 (1.09)
63.87 (1.06)
61.88 (1.12)
62.04 (1.16)
61.56 (1.17)
Poverty level
Poor (<100% FPL) 34.20 (1.12)
34.51 (1.15)
36.71 (1.21)
35.83 (1.14)
34.40 (1.25)
31.88 (1.00)
32.05 (0.95)
32.28 (1.09)
28.50 (1.07)
25.19 (1.04)
Low (100-199% FPL) 42.22 (1.00)
44.00 (1.06)
43.42 (1.07)
44.83 (0.96)
42.30 (1.01)
41.79 (1.00)
43.18 (0.97)
41.09 (1.10)
39.53 (1.17)
36.62 (0.97)
Mid (200-399% FPL) 34.56 (0.86)
36.17 (0.87)
35.64 (0.94)
35.88 (0.87)
37.12 (0.96)
35.37 (0.94)
34.98 (0.95)
34.78 (0.91)
32.04 (0.94)
32.13 (0.85)
High (400%+ FPL) 25.93 (0.80)
26.13 (0.80)
27.03 (0.85)
26.49 (0.86)
27.23 (0.93)
27.19 (0.95)
26.76 (0.91)
25.76 (0.91)
23.92 (1.00)
23.64 (0.91)
Employed
Employed 27.49 (0.55)
28.15 (0.55)
28.31 (0.59)
28.48 (0.64)
28.71 (0.68)
27.68 (0.64)
27.82 (0.67)
27.04 (0.65)
24.32 (0.62)
22.74 (0.55)
Not employed 48.73 (0.91)
49.79 (0.86)
50.90 (0.87)
49.42 (0.81)
48.07 (0.82)
47.39 (0.89)
46.46 (0.84)
45.94 (0.97)
44.74 (0.98)
44.49 (0.96)
Education level
< 12 yrs 43.87 (1.01)
43.77 (1.03)
46.19 (1.08)
46.54 (1.03)
43.60 (1.10)
43.51 (1.12)
42.51 (1.01)
41.74 (1.03)
40.12 (1.22)
38.40 (1.22)
12 yrs 36.26 (0.72)
37.66 (0.80)
38.46 (0.87)
39.32 (0.88)
40.06 (0.99)
38.24 (0.88)
37.31 (0.80)
38.89 (0.86)
36.76 (0.91)
33.30 (0.84)
> 12 yrs 26.77 (0.66)
27.83 (0.66)
27.92 (0.77)
27.66 (0.68)
28.86 (0.66)
28.44 (0.71)
29.14 (0.79)
27.46 (0.69)
24.98 (0.67)
24.39 (0.65)
Source: Agency for Healthcare Research and Quality, Household Component of the Medical Expenditure Panel Survey, 1996–2015.

15
Table 6. Percent population with a dental visit; 1996–2015 Table continues on next page
Mean Annual
1996-2015 1996 1997 1998 1999 2000 2001 2002 2003 2004 2005
Overall 42.58 (0.34)
42.93 (0.75)
41.79 (0.68)
42.40 (0.80)
43.05 (0.69)
41.60 (0.82)
42.62 (0.55)
43.49 (0.62)
44.04 (0.67)
43.63 (0.64)
43.31 (0.65)
Sex
Male 39.20 (0.33)
39.69 (0.84)
38.55 (0.76)
38.82 (0.84)
39.36 (0.75)
38.16 (0.86)
38.96 (0.65)
39.90 (0.66)
40.33 (0.73)
40.08 (0.66)
39.95 (0.74)
Female 45.81 (0.36)
46.03 (0.80)
44.90 (0.72)
45.83 (0.93)
46.56 (0.80)
44.88 (0.91)
46.10 (0.60)
46.92 (0.70)
47.60 (0.74)
47.04 (0.75)
46.53 (0.71)
Race/ethnicity
Hispanic 28.58 (0.37)
28.50 (1.21)
26.76 (0.95)
25.73 (1.05)
25.05 (1.02)
25.66 (1.14)
27.15 (0.91)
26.40 (0.78)
27.22 (0.93)
28.92 (0.97)
27.81 (0.99)
Non-Hispanic White 48.48 (0.37)
48.31 (0.86)
47.12 (0.77)
47.83 (0.88)
49.04 (0.79)
47.30 (0.94)
48.66 (0.61)
50.28 (0.68)
50.65 (0.80)
49.44 (0.72)
49.48 (0.74)
Non-Hispanic Black 29.37 (0.39)
26.07 (1.11)
26.33 (1.00)
28.18 (1.36)
27.75 (1.32)
26.84 (1.31)
27.38 (1.04)
28.10 (0.89)
28.88 (1.12)
30.17 (1.00)
30.40 (1.11)
Non-Hispanic Other 38.95 (0.53)
39.28 (2.67)
37.84 (2.22)
38.49 (3.14)
38.09 (2.73)
35.26 (2.51)
36.44 (2.16)
37.35 (1.77)
39.82 (1.68)
41.50 (1.70)
39.68 (1.59)
Age category
< 21 44.47 (0.39)
42.24 (1.06)
40.77 (0.91)
41.22 (1.08)
41.47 (1.02)
41.91 (1.09)
42.26 (0.85)
43.73 (0.85)
45.42 (0.88)
45.42 (0.92)
45.29 (0.97)
21-64 41.46 (0.37)
43.89 (0.79)
42.88 (0.73)
43.66 (0.88)
44.11 (0.73)
41.68 (0.97)
43.30 (0.64)
43.64 (0.71)
43.78 (0.75)
42.87 (0.70)
42.02 (0.71)
> 64 43.31 (0.50)
40.26 (1.40)
39.38 (1.24)
39.57 (1.36)
42.08 (1.39)
40.47 (1.43)
40.35 (1.01)
42.27 (1.12)
42.05 (1.39)
42.98 (1.25)
44.75 (1.32)
Poverty level
Poor (<100% FPL) 26.72 (0.28)
26.22 (1.12)
24.19 (0.91)
26.02 (1.20)
26.68 (1.14)
25.86 (1.15)
25.17 (0.97)
25.87 (0.95)
26.16 (0.88)
26.54 (0.89)
27.08 (0.92)
Low (100-199% FPL) 29.60 (0.30)
28.88 (1.05)
29.83 (0.99)
27.00 (1.13)
26.68 (1.10)
28.75 (1.15)
28.78 (0.83)
29.45 (0.89)
30.10 (0.87)
29.91 (0.87)
29.69 (0.88)
Mid (200-399% FPL) 40.98 (0.35)
44.92 (0.97)
42.09 (0.87)
42.00 (1.04)
42.11 (0.96)
40.23 (1.00)
41.22 (0.79)
41.10 (0.80)
42.41 (0.96)
41.88 (0.87)
41.55 (0.95)
High (400%+ FPL) 56.16 (0.37)
56.57 (0.94)
54.83 (0.92)
55.81 (0.98)
56.77 (0.98)
53.42 (1.04)
55.92 (0.77)
58.05 (0.75)
58.26 (0.91)
57.90 (0.86)
56.88 (0.87)
Dental insurance
Some private 55.84 (0.34)
56.05 (0.85)
54.97 (0.78)
55.48 (0.88)
54.78 (0.88)
52.46 (0.97)
54.01 (0.66)
56.03 (0.70)
56.88 (0.82)
56.87 (0.79)
56.60 (0.76)
Only public 30.21 (0.35)
26.86 (1.25)
25.20 (0.88)
26.62 (1.13)
26.10 (1.17)
27.84 (1.39)
27.10 (0.94)
28.21 (0.90)
30.22 (1.01)
30.22 (0.87)
30.60 (0.96)
Neither 27.01 (0.35)
29.13 (0.89)
27.85 (0.73)
27.86 (0.91)
29.56 (0.88)
28.44 (0.92)
28.97 (0.73)
28.63 (0.71)
28.88 (0.84)
27.24 (0.71)
26.79 (0.79)
Employed
Employed 44.13 (0.34)
44.33 (0.78)
43.32 (0.69)
44.03 (0.83)
44.50 (0.75)
43.10 (0.84)
44.07 (0.61)
45.14 (0.66)
45.53 (0.73)
45.45 (0.68)
44.71 (0.68)
Not employed 38.09 (0.40)
38.53 (1.05)
36.97 (1.00)
37.26 (1.12)
38.28 (0.95)
36.64 (1.08)
37.88 (0.81)
38.48 (0.87)
39.50 (0.93)
38.18 (0.91)
39.22 (0.99)
Education level
< 12 yrs 23.41 (0.29)
23.23 (0.92)
23.03 (0.82)
21.82 (0.93)
22.71 (0.83)
23.02 (0.97)
24.27 (0.85)
23.77 (0.68)
23.30 (0.78)
22.95 (0.71)
24.47 (0.79)
12 yrs 35.89 (0.34)
38.25 (0.91)
36.25 (0.90)
35.45 (0.94)
37.24 (0.84)
36.84 (0.94)
37.89 (0.74)
38.98 (0.75)
39.53 (0.76)
37.59 (0.82)
38.03 (0.82)
> 12 yrs 52.09 (0.33)
53.55 (0.86)
51.37 (0.73)
53.62 (0.92)
55.21 (0.82)
51.94 (0.87)
52.96 (0.68)
54.31 (0.69)
54.61 (0.80)
54.54 (0.72)
53.11 (0.75)

16
Table 6. Percent population with a dental visit; 1996–2015, continued
2006 2007 2008 2009 2010 2011 2012 2013 2014 2015
Overall 43.11 (0.62)
43.59 (0.56)
42.23 (0.56)
42.20 (0.61)
41.27 (0.63)
41.11 (0.62)
41.44 (0.63)
42.41 (0.53)
42.64 (0.60)
42.88 (0.66)
Sex
Male 39.90 (0.67)
39.85 (0.66)
38.50 (0.69)
38.75 (0.65)
37.94 (0.66)
37.97 (0.70)
38.41 (0.73)
39.31 (0.60)
39.70 (0.71)
39.98 (0.77)
Female 46.21 (0.70)
47.17 (0.62)
45.82 (0.63)
45.52 (0.70)
44.48 (0.77)
44.11 (0.68)
44.34 (0.68)
45.37 (0.62)
45.46 (0.71)
45.66 (0.70)
Race/ethnicity
Hispanic 26.46 (0.83)
28.90 (1.04)
28.24 (0.79)
27.84 (0.78)
28.73 (0.91)
29.87 (1.02)
30.01 (0.83)
31.56 (0.81)
31.09 (0.81)
33.18 (1.02)
Non-Hispanic White 49.68 (0.66)
49.85 (0.67)
48.11 (0.72)
48.23 (0.79)
46.74 (0.84)
46.80 (0.87)
47.13 (0.80)
47.81 (0.72)
48.56 (0.82)
48.66 (0.84)
Non-Hispanic Black 30.76 (1.08)
30.77 (1.08)
29.63 (1.02)
30.15 (0.98)
31.15 (0.95)
29.59 (0.90)
30.17 (1.08)
32.08 (0.83)
31.58 (0.81)
30.20 (0.97)
Non-Hispanic Other 38.54 (1.68)
39.43 (1.63)
40.62 (1.62)
39.90 (1.46)
37.68 (1.43)
36.53 (1.45)
37.86 (1.61)
39.48 (1.49)
39.99 (1.25)
40.72 (1.24)
Age category
< 21 45.76 (0.91)
45.96 (0.83)
43.30 (0.88)
44.23 (0.93)
44.37 (1.03)
44.40 (1.03)
46.50 (1.02)
48.36 (0.87)
48.20 (0.97)
47.95 (1.04)
21-64 41.71 (0.68)
42.20 (0.63)
41.33 (0.67)
40.74 (0.66)
39.28 (0.68)
38.65 (0.68)
38.33 (0.64)
38.78 (0.62)
38.89 (0.70)
39.45 (0.75)
> 64 43.55 (1.14)
44.63 (1.11)
43.86 (1.15)
44.19 (1.08)
43.33 (1.20)
44.69 (1.19)
44.16 (1.33)
45.48 (1.21)
46.78 (1.31)
46.72 (1.13)
Poverty level
Poor (<100% FPL) 26.08 (0.93)
27.58 (0.92)
26.22 (0.78)
26.80 (0.90)
26.50 (0.89)
26.65 (0.76)
27.40 (0.85)
28.13 (0.86)
29.38 (0.81)
28.02 (0.99)
Low (100-199% FPL) 28.79 (1.00)
30.06 (0.87)
30.12 (0.87)
29.27 (0.86)
30.72 (0.84)
29.70 (0.88)
28.64 (0.90)
31.92 (0.97)
30.30 (0.99)
32.34 (0.97)
Mid (200-399% FPL) 40.84 (0.87)
41.17 (0.86)
40.51 (0.87)
40.37 (0.78)
38.71 (0.95)
39.68 (0.99)
40.32 (1.01)
40.28 (0.93)
39.22 (0.97)
39.39 (0.91)
High (400%+ FPL) 57.36 (0.81)
57.05 (0.84)
55.53 (0.90)
56.55 (1.02)
54.98 (0.98)
54.72 (1.03)
55.20 (0.92)
55.41 (0.87)
56.59 (0.95)
55.32 (0.94)
Dental insurance
Some private 56.54 (0.70)
57.36 (0.71)
56.41 (0.76)
57.21 (0.77)
56.32 (0.90)
55.18 (0.92)
55.25 (0.83)
56.31 (0.69)
56.30 (0.73)
55.68 (0.85)
Only public 30.41 (0.98)
31.28 (0.86)
29.84 (0.99)
30.94 (1.02)
30.61 (1.03)
30.56 (0.91)
31.34 (0.82)
33.67 (1.03)
33.41 (0.90)
33.09 (0.86)
Neither 26.68 (0.83)
27.50 (0.75)
26.13 (0.73)
24.88 (0.77)
24.47 (0.86)
25.28 (0.79)
25.94 (0.93)
25.58 (0.74)
24.94 (0.85)
26.22 (0.74)
Employed
Employed 44.41 (0.65)
44.89 (0.62)
43.67 (0.66)
43.80 (0.66)
43.52 (0.71)
42.93 (0.67)
43.15 (0.70)
43.93 (0.57)
43.89 (0.64)
44.32 (0.75)
Not employed 39.10 (0.93)
39.68 (0.83)
38.06 (0.77)
37.93 (0.85)
35.42 (0.85)
36.46 (0.88)
37.25 (0.91)
38.56 (0.92)
39.35 (0.95)
39.05 (0.82)
Education level
< 12 yrs 22.54 (0.74)
24.75 (0.91)
23.47 (0.79)
22.44 (0.73)
22.68 (0.81)
22.89 (0.81)
22.96 (0.80)
24.99 (0.86)
23.90 (0.83)
25.38 (0.91)
12 yrs 37.18 (0.83)
36.54 (0.76)
35.40 (0.76)
34.53 (0.74)
33.04 (0.83)
31.78 (0.84)
32.59 (0.89)
32.14 (0.85)
32.79 (0.87)
34.08 (0.81)
> 12 yrs 53.23 (0.69)
53.45 (0.70)
51.62 (0.72)
52.10 (0.76)
49.79 (0.76)
49.57 (0.77)
49.41 (0.73)
50.43 (0.62)
50.29 (0.69)
50.59 (0.77)
Source: Agency for Healthcare Research and Quality, Household Component of the Medical Expenditure Panel Survey, 1996–2015.
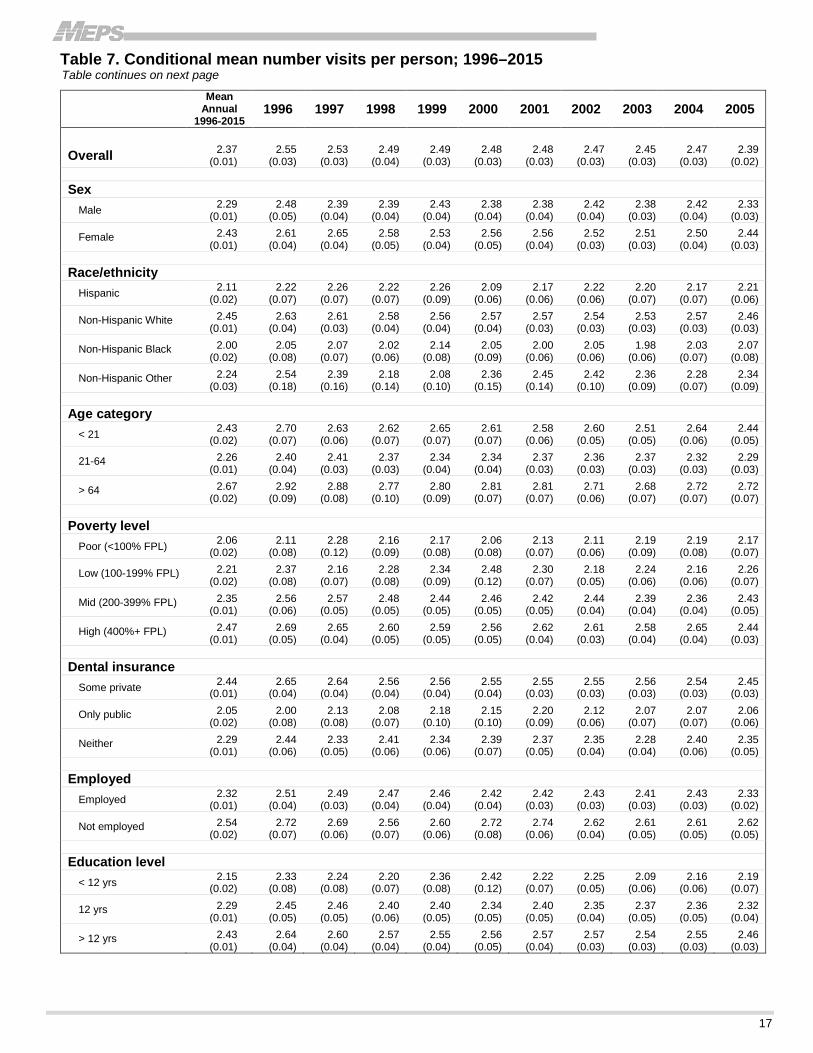
17
Table 7. Conditional mean number visits per person; 1996–2015 Table continues on next page
Mean
Annual 1996-2015
1996 1997 1998 1999 2000 2001 2002 2003 2004 2005
Overall 2.37 (0.01)
2.55 (0.03)
2.53 (0.03)
2.49 (0.04)
2.49 (0.03)
2.48 (0.03)
2.48 (0.03)
2.47 (0.03)
2.45 (0.03)
2.47 (0.03)
2.39 (0.02)
Sex
Male 2.29 (0.01)
2.48 (0.05)
2.39 (0.04)
2.39 (0.04)
2.43 (0.04)
2.38 (0.04)
2.38 (0.04)
2.42 (0.04)
2.38 (0.03)
2.42 (0.04)
2.33 (0.03)
Female 2.43 (0.01)
2.61 (0.04)
2.65 (0.04)
2.58 (0.05)
2.53 (0.04)
2.56 (0.05)
2.56 (0.04)
2.52 (0.03)
2.51 (0.03)
2.50 (0.04)
2.44 (0.03)
Race/ethnicity
Hispanic 2.11 (0.02)
2.22 (0.07)
2.26 (0.07)
2.22 (0.07)
2.26 (0.09)
2.09 (0.06)
2.17 (0.06)
2.22 (0.06)
2.20 (0.07)
2.17 (0.07)
2.21 (0.06)
Non-Hispanic White 2.45 (0.01)
2.63 (0.04)
2.61 (0.03)
2.58 (0.04)
2.56 (0.04)
2.57 (0.04)
2.57 (0.03)
2.54 (0.03)
2.53 (0.03)
2.57 (0.03)
2.46 (0.03)
Non-Hispanic Black 2.00 (0.02)
2.05 (0.08)
2.07 (0.07)
2.02 (0.06)
2.14 (0.08)
2.05 (0.09)
2.00 (0.06)
2.05 (0.06)
1.98 (0.06)
2.03 (0.07)
2.07 (0.08)
Non-Hispanic Other 2.24 (0.03)
2.54 (0.18)
2.39 (0.16)
2.18 (0.14)
2.08 (0.10)
2.36 (0.15)
2.45 (0.14)
2.42 (0.10)
2.36 (0.09)
2.28 (0.07)
2.34 (0.09)
Age category
< 21 2.43 (0.02)
2.70 (0.07)
2.63 (0.06)
2.62 (0.07)
2.65 (0.07)
2.61 (0.07)
2.58 (0.06)
2.60 (0.05)
2.51 (0.05)
2.64 (0.06)
2.44 (0.05)
21-64 2.26 (0.01)
2.40 (0.04)
2.41 (0.03)
2.37 (0.03)
2.34 (0.04)
2.34 (0.04)
2.37 (0.03)
2.36 (0.03)
2.37 (0.03)
2.32 (0.03)
2.29 (0.03)
> 64 2.67 (0.02)
2.92 (0.09)
2.88 (0.08)
2.77 (0.10)
2.80 (0.09)
2.81 (0.07)
2.81 (0.07)
2.71 (0.06)
2.68 (0.07)
2.72 (0.07)
2.72 (0.07)
Poverty level
Poor (<100% FPL) 2.06 (0.02)
2.11 (0.08)
2.28 (0.12)
2.16 (0.09)
2.17 (0.08)
2.06 (0.08)
2.13 (0.07)
2.11 (0.06)
2.19 (0.09)
2.19 (0.08)
2.17 (0.07)
Low (100-199% FPL) 2.21 (0.02)
2.37 (0.08)
2.16 (0.07)
2.28 (0.08)
2.34 (0.09)
2.48 (0.12)
2.30 (0.07)
2.18 (0.05)
2.24 (0.06)
2.16 (0.06)
2.26 (0.07)
Mid (200-399% FPL) 2.35 (0.01)
2.56 (0.06)
2.57 (0.05)
2.48 (0.05)
2.44 (0.05)
2.46 (0.05)
2.42 (0.05)
2.44 (0.04)
2.39 (0.04)
2.36 (0.04)
2.43 (0.05)
High (400%+ FPL) 2.47 (0.01)
2.69 (0.05)
2.65 (0.04)
2.60 (0.05)
2.59 (0.05)
2.56 (0.05)
2.62 (0.04)
2.61 (0.03)
2.58 (0.04)
2.65 (0.04)
2.44 (0.03)
Dental insurance
Some private 2.44 (0.01)
2.65 (0.04)
2.64 (0.04)
2.56 (0.04)
2.56 (0.04)
2.55 (0.04)
2.55 (0.03)
2.55 (0.03)
2.56 (0.03)
2.54 (0.03)
2.45 (0.03)
Only public 2.05 (0.02)
2.00 (0.08)
2.13 (0.08)
2.08 (0.07)
2.18 (0.10)
2.15 (0.10)
2.20 (0.09)
2.12 (0.06)
2.07 (0.07)
2.07 (0.07)
2.06 (0.06)
Neither 2.29 (0.01)
2.44 (0.06)
2.33 (0.05)
2.41 (0.06)
2.34 (0.06)
2.39 (0.07)
2.37 (0.05)
2.35 (0.04)
2.28 (0.04)
2.40 (0.06)
2.35 (0.05)
Employed
Employed 2.32 (0.01)
2.51 (0.04)
2.49 (0.03)
2.47 (0.04)
2.46 (0.04)
2.42 (0.04)
2.42 (0.03)
2.43 (0.03)
2.41 (0.03)
2.43 (0.03)
2.33 (0.02)
Not employed 2.54 (0.02)
2.72 (0.07)
2.69 (0.06)
2.56 (0.07)
2.60 (0.06)
2.72 (0.08)
2.74 (0.06)
2.62 (0.04)
2.61 (0.05)
2.61 (0.05)
2.62 (0.05)
Education level
< 12 yrs 2.15 (0.02)
2.33 (0.08)
2.24 (0.08)
2.20 (0.07)
2.36 (0.08)
2.42 (0.12)
2.22 (0.07)
2.25 (0.05)
2.09 (0.06)
2.16 (0.06)
2.19 (0.07)
12 yrs 2.29 (0.01)
2.45 (0.05)
2.46 (0.05)
2.40 (0.06)
2.40 (0.05)
2.34 (0.05)
2.40 (0.05)
2.35 (0.04)
2.37 (0.05)
2.36 (0.05)
2.32 (0.04)
> 12 yrs 2.43 (0.01)
2.64 (0.04)
2.60 (0.04)
2.57 (0.04)
2.55 (0.04)
2.56 (0.05)
2.57 (0.04)
2.57 (0.03)
2.54 (0.03)
2.55 (0.03)
2.46 (0.03)
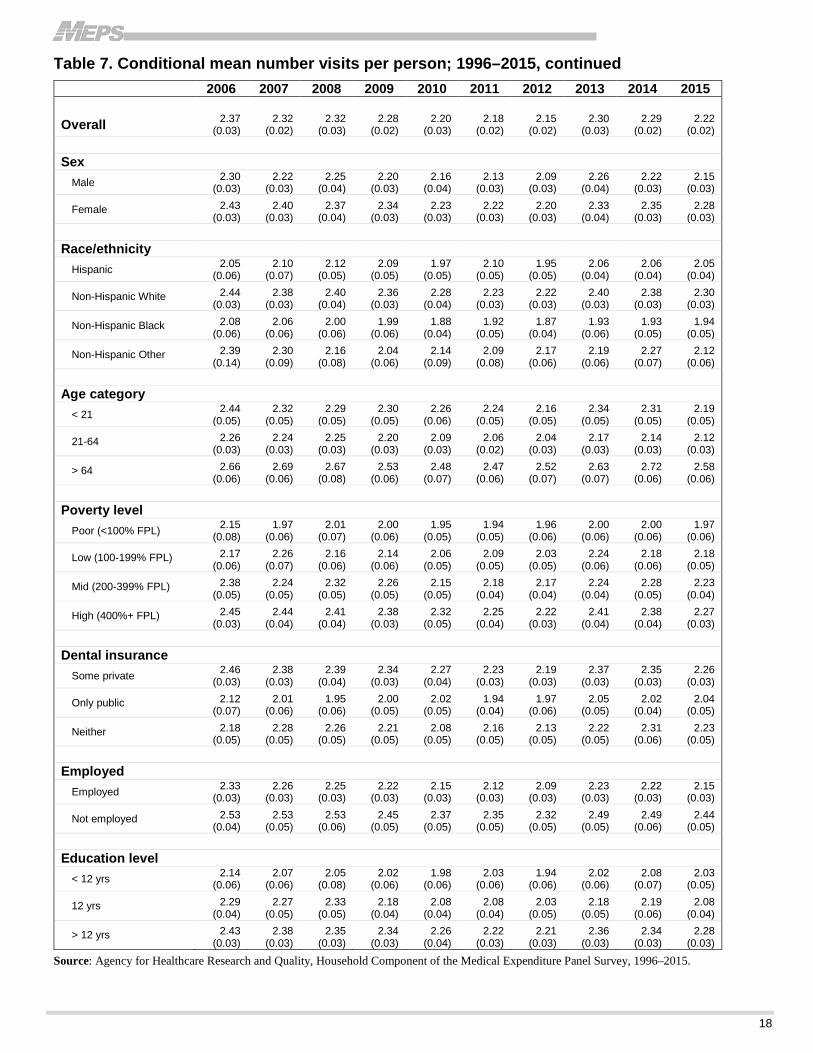
18
Table 7. Conditional mean number visits per person; 1996–2015, continued
2006 2007 2008 2009 2010 2011 2012 2013 2014 2015
Overall 2.37 (0.03)
2.32 (0.02)
2.32 (0.03)
2.28 (0.02)
2.20 (0.03)
2.18 (0.02)
2.15 (0.02)
2.30 (0.03)
2.29 (0.02)
2.22 (0.02)
Sex
Male 2.30 (0.03)
2.22 (0.03)
2.25 (0.04)
2.20 (0.03)
2.16 (0.04)
2.13 (0.03)
2.09 (0.03)
2.26 (0.04)
2.22 (0.03)
2.15 (0.03)
Female 2.43 (0.03)
2.40 (0.03)
2.37 (0.04)
2.34 (0.03)
2.23 (0.03)
2.22 (0.03)
2.20 (0.03)
2.33 (0.04)
2.35 (0.03)
2.28 (0.03)
Race/ethnicity
Hispanic 2.05 (0.06)
2.10 (0.07)
2.12 (0.05)
2.09 (0.05)
1.97 (0.05)
2.10 (0.05)
1.95 (0.05)
2.06 (0.04)
2.06 (0.04)
2.05 (0.04)
Non-Hispanic White 2.44 (0.03)
2.38 (0.03)
2.40 (0.04)
2.36 (0.03)
2.28 (0.04)
2.23 (0.03)
2.22 (0.03)
2.40 (0.03)
2.38 (0.03)
2.30 (0.03)
Non-Hispanic Black 2.08 (0.06)
2.06 (0.06)
2.00 (0.06)
1.99 (0.06)
1.88 (0.04)
1.92 (0.05)
1.87 (0.04)
1.93 (0.06)
1.93 (0.05)
1.94 (0.05)
Non-Hispanic Other 2.39 (0.14)
2.30 (0.09)
2.16 (0.08)
2.04 (0.06)
2.14 (0.09)
2.09 (0.08)
2.17 (0.06)
2.19 (0.06)
2.27 (0.07)
2.12 (0.06)
Age category
< 21 2.44 (0.05)
2.32 (0.05)
2.29 (0.05)
2.30 (0.05)
2.26 (0.06)
2.24 (0.05)
2.16 (0.05)
2.34 (0.05)
2.31 (0.05)
2.19 (0.05)
21-64 2.26 (0.03)
2.24 (0.03)
2.25 (0.03)
2.20 (0.03)
2.09 (0.03)
2.06 (0.02)
2.04 (0.03)
2.17 (0.03)
2.14 (0.03)
2.12 (0.03)
> 64 2.66 (0.06)
2.69 (0.06)
2.67 (0.08)
2.53 (0.06)
2.48 (0.07)
2.47 (0.06)
2.52 (0.07)
2.63 (0.07)
2.72 (0.06)
2.58 (0.06)
Poverty level
Poor (<100% FPL) 2.15 (0.08)
1.97 (0.06)
2.01 (0.07)
2.00 (0.06)
1.95 (0.05)
1.94 (0.05)
1.96 (0.06)
2.00 (0.06)
2.00 (0.06)
1.97 (0.06)
Low (100-199% FPL) 2.17 (0.06)
2.26 (0.07)
2.16 (0.06)
2.14 (0.06)
2.06 (0.05)
2.09 (0.05)
2.03 (0.05)
2.24 (0.06)
2.18 (0.06)
2.18 (0.05)
Mid (200-399% FPL) 2.38 (0.05)
2.24 (0.05)
2.32 (0.05)
2.26 (0.05)
2.15 (0.05)
2.18 (0.04)
2.17 (0.04)
2.24 (0.04)
2.28 (0.05)
2.23 (0.04)
High (400%+ FPL) 2.45 (0.03)
2.44 (0.04)
2.41 (0.04)
2.38 (0.03)
2.32 (0.05)
2.25 (0.04)
2.22 (0.03)
2.41 (0.04)
2.38 (0.04)
2.27 (0.03)
Dental insurance
Some private 2.46 (0.03)
2.38 (0.03)
2.39 (0.04)
2.34 (0.03)
2.27 (0.04)
2.23 (0.03)
2.19 (0.03)
2.37 (0.03)
2.35 (0.03)
2.26 (0.03)
Only public 2.12 (0.07)
2.01 (0.06)
1.95 (0.06)
2.00 (0.05)
2.02 (0.05)
1.94 (0.04)
1.97 (0.06)
2.05 (0.05)
2.02 (0.04)
2.04 (0.05)
Neither 2.18 (0.05)
2.28 (0.05)
2.26 (0.05)
2.21 (0.05)
2.08 (0.05)
2.16 (0.05)
2.13 (0.05)
2.22 (0.05)
2.31 (0.06)
2.23 (0.05)
Employed
Employed 2.33 (0.03)
2.26 (0.03)
2.25 (0.03)
2.22 (0.03)
2.15 (0.03)
2.12 (0.03)
2.09 (0.03)
2.23 (0.03)
2.22 (0.03)
2.15 (0.03)
Not employed 2.53 (0.04)
2.53 (0.05)
2.53 (0.06)
2.45 (0.05)
2.37 (0.05)
2.35 (0.05)
2.32 (0.05)
2.49 (0.05)
2.49 (0.06)
2.44 (0.05)
Education level
< 12 yrs 2.14 (0.06)
2.07 (0.06)
2.05 (0.08)
2.02 (0.06)
1.98 (0.06)
2.03 (0.06)
1.94 (0.06)
2.02 (0.06)
2.08 (0.07)
2.03 (0.05)
12 yrs 2.29 (0.04)
2.27 (0.05)
2.33 (0.05)
2.18 (0.04)
2.08 (0.04)
2.08 (0.04)
2.03 (0.05)
2.18 (0.05)
2.19 (0.06)
2.08 (0.04)
> 12 yrs 2.43 (0.03)
2.38 (0.03)
2.35 (0.03)
2.34 (0.03)
2.26 (0.04)
2.22 (0.03)
2.21 (0.03)
2.36 (0.03)
2.34 (0.03)
2.28 (0.03)
Source: Agency for Healthcare Research and Quality, Household Component of the Medical Expenditure Panel Survey, 1996–2015.

19
Table 8. Total dental visits (thousands); 1996–2015 Table continues on next page
1996 1997 1998 1999 2000 2001 2002 2003 2004 2005
Overall 294,540 (16,346)
286,892 (12,630)
289,093 (19,533)
295,912 (17,719)
287,430 (25,574)
300,797 (15,185)
309,850 (16,200)
313,793 (16,477)
315,713 (16,212)
307,058 (15,784)
Sex
Male 129,229 (7,538)
122,201 (5,783)
123,979 (8,407)
128,561 (8,125)
123,584 (11,476)
128,631 (6,853)
135,760 (7,416)
136,764 (7,417)
139,401 (7,429)
135,335 (7,390)
Female 165,311 (9,474)
164,691 (7,495)
165,113 (11,659)
167,351 (10,092)
163,847 (14,466)
172,166 (8,890)
174,090 (9,191)
177,029 (9,506)
176,312 (9,283)
171,723 (8,959)
Race/ethnicity
Hispanic 18,931 (1,469)
18,780 (1,133)
18,327 (1,577)
18,675 (1,539)
18,197 (2,038)
22,174 (1,444)
23,275 (1,808)
24,344 (1,961)
26,543 (2,246)
26,755 (2,169)
Non-Hispanic White 246,077 (14,437)
239,498 (11,631)
242,164 (17,649)
247,765 (15,800)
240,583 (22,854)
247,522 (13,389)
250,069 (14,174)
252,003 (14,323)
249,026 (13,956)
238,997 (13,550)
Non-Hispanic Black 17,991 (1,871)
18,614 (1,338)
19,642 (1,818)
20,669 (2,079)
19,317 (2,624)
19,148 (1,435)
20,052 (1,790)
20,223 (1,787)
21,722 (2,074)
22,575 (2,197)
Non-Hispanic Other 11,541 (1,699)
10,000 (1,222)
8,961 (1,248)
8,803 (1,115)
9,333 (1,416)
11,953 (1,403)
16,455 (1,701)
17,223 (1,752)
18,422 (1,734)
18,731 (1,771)
Age category
< 21 93,998 (6,201)
88,887 (4,671)
90,461 (6,922)
92,369 (6,152)
93,123 (8,588)
92,678 (5,343)
96,455 (5,569)
97,165 (5,797)
102,646 (5,851)
94,765 (5,397)
21-64 160,522 (9,009)
159,248 (7,244)
160,981 (11,278)
162,698 (10,046)
154,732 (14,365)
167,448 (8,734)
171,820 (9,285)
175,238 (9,493)
169,831 (8,933)
166,725 (8,712)
> 64 40,020 (2,980)
38,757 (2,422)
37,650 (3,112)
40,845 (3,226)
39,575 (4,010)
40,671 (2,523)
41,575 (2,755)
41,390 (3,009)
43,235 (3,140)
45,568 (3,271)
Poverty level
Poor (<100% FPL) 21,145 (1,757)
20,119 (1,687)
19,821 (1,890)
19,013 (1,663)
17,070 (1,792)
18,042 (1,345)
19,450 (1,425)
21,141 (1,668)
21,899 (1,629)
22,268 (1,683)
Low (100-199% FPL) 36,536 (2,707)
32,880 (2,109)
29,872 (2,431)
32,063 (2,659)
35,089 (3,998)
34,760 (2,248)
33,793 (2,163)
36,316 (2,368)
34,786 (2,268)
36,236 (2,510)
Mid (200-399% FPL) 101,388 (6,631)
97,168 (5,139)
91,909 (6,459)
88,612 (6,020)
89,343 (8,687)
89,596 (5,234)
91,376 (5,478)
91,227 (5,607)
92,456 (5,563)
93,643 (5,527)
High (400%+ FPL) 135,471 (8,771)
136,726 (7,043)
147,491 (11,443)
156,223 (10,551)
145,928 (13,649)
158,399 (9,335)
165,231 (9,602)
165,109 (9,854)
166,572 (9,611)
154,912 (8,847)
Dental insurance
Some private 211,218 (8,550)
206,774 (9,831)
206,935 (15,038)
213,494 (14,020)
204,950 (19,199)
216,757 (11,851)
224,204 (12,435)
226,179 (12,590)
228,322 (12,355)
220,430 (11,994)
Only public 26,497 (968)
16,412 (1,183)
17,936 (1,633)
17,142 (1,643)
18,412 (2,335)
19,887 (1,506)
22,254 (1,690)
24,448 (1,914)
25,359 (1,926)
26,671 (1,923)
Neither 60,612 (2,310)
63,706 (3,354)
64,221 (4,673)
65,276 (4,339)
64,068 (5,847)
64,154 (3,728)
63,392 (3,665)
63,166 (3,904)
62,032 (3,761)
59,957 (3,668)
Employed
Employed 227,530 (13,062)
222,559 (10,061)
227,105 (15,830)
232,924 (14,727)
223,852 (20,311)
231,646 (12,111)
238,570 (12,838)
240,361 (12,998)
243,338 (12,685)
230,878 (12,050)
Not employed 66,996 (4,249)
64,318 (3,491)
61,986 (4,580)
62,967 (4,056)
63,579 (5,935)
69,127 (3,885)
71,263 (4,175)
73,361 (4,351)
72,367 (4,490)
76,107 (4,515)
Education level
< 12 yrs 26,395 (2,207)
23,202 (1,605)
21,988 (1,708)
27,460 (2,056)
28,361 (2,934)
28,019 (1,782)
28,984 (1,749)
25,285 (1,749)
24,711 (1,667)
27,123 (1,775)
12 yrs 83,676 (5,118)
77,204 (4,368)
74,434 (5,380)
79,921 (5,290)
76,265 (7,637)
84,124 (4,590)
84,582 (5,113)
86,071 (5,140)
81,673 (4,782)
81,136 (4,843)
> 12 yrs 184,380 (11,485)
186,376 (8,690)
192,449 (14,013)
187,831 (12,215)
182,330 (16,624)
188,061 (10,353)
195,543 (10,655)
202,009 (11,178)
208,768 (11,445)
198,424 (10,969)
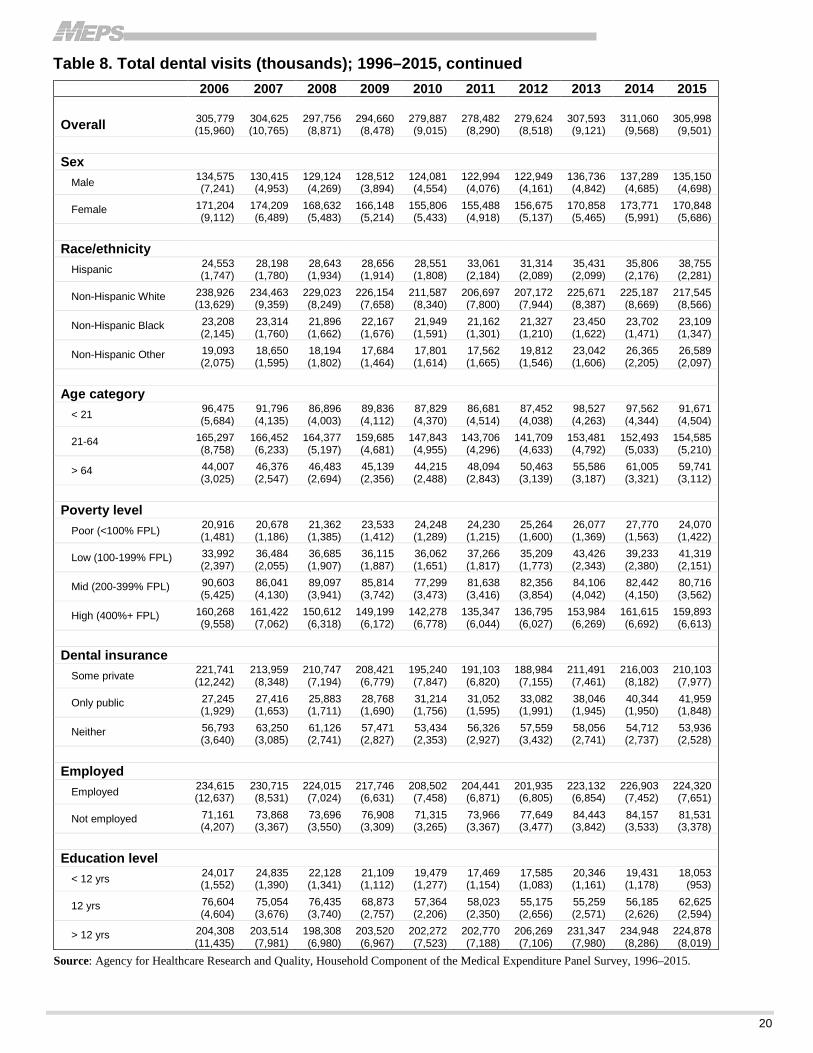
20
Table 8. Total dental visits (thousands); 1996–2015, continued
2006 2007 2008 2009 2010 2011 2012 2013 2014 2015
Overall 305,779 (15,960)
304,625 (10,765)
297,756 (8,871)
294,660 (8,478)
279,887 (9,015)
278,482 (8,290)
279,624 (8,518)
307,593 (9,121)
311,060 (9,568)
305,998 (9,501)
Sex
Male 134,575 (7,241)
130,415 (4,953)
129,124 (4,269)
128,512 (3,894)
124,081 (4,554)
122,994 (4,076)
122,949 (4,161)
136,736 (4,842)
137,289 (4,685)
135,150 (4,698)
Female 171,204 (9,112)
174,209 (6,489)
168,632 (5,483)
166,148 (5,214)
155,806 (5,433)
155,488 (4,918)
156,675 (5,137)
170,858 (5,465)
173,771 (5,991)
170,848 (5,686)
Race/ethnicity
Hispanic 24,553 (1,747)
28,198 (1,780)
28,643 (1,934)
28,656 (1,914)
28,551 (1,808)
33,061 (2,184)
31,314 (2,089)
35,431 (2,099)
35,806 (2,176)
38,755 (2,281)
Non-Hispanic White 238,926 (13,629)
234,463 (9,359)
229,023 (8,249)
226,154 (7,658)
211,587 (8,340)
206,697 (7,800)
207,172 (7,944)
225,671 (8,387)
225,187 (8,669)
217,545 (8,566)
Non-Hispanic Black 23,208 (2,145)
23,314 (1,760)
21,896 (1,662)
22,167 (1,676)
21,949 (1,591)
21,162 (1,301)
21,327 (1,210)
23,450 (1,622)
23,702 (1,471)
23,109 (1,347)
Non-Hispanic Other 19,093 (2,075)
18,650 (1,595)
18,194 (1,802)
17,684 (1,464)
17,801 (1,614)
17,562 (1,665)
19,812 (1,546)
23,042 (1,606)
26,365 (2,205)
26,589 (2,097)
Age category
< 21 96,475 (5,684)
91,796 (4,135)
86,896 (4,003)
89,836 (4,112)
87,829 (4,370)
86,681 (4,514)
87,452 (4,038)
98,527 (4,263)
97,562 (4,344)
91,671 (4,504)
21-64 165,297 (8,758)
166,452 (6,233)
164,377 (5,197)
159,685 (4,681)
147,843 (4,955)
143,706 (4,296)
141,709 (4,633)
153,481 (4,792)
152,493 (5,033)
154,585 (5,210)
> 64 44,007 (3,025)
46,376 (2,547)
46,483 (2,694)
45,139 (2,356)
44,215 (2,488)
48,094 (2,843)
50,463 (3,139)
55,586 (3,187)
61,005 (3,321)
59,741 (3,112)
Poverty level
Poor (<100% FPL) 20,916 (1,481)
20,678 (1,186)
21,362 (1,385)
23,533 (1,412)
24,248 (1,289)
24,230 (1,215)
25,264 (1,600)
26,077 (1,369)
27,770 (1,563)
24,070 (1,422)
Low (100-199% FPL) 33,992 (2,397)
36,484 (2,055)
36,685 (1,907)
36,115 (1,887)
36,062 (1,651)
37,266 (1,817)
35,209 (1,773)
43,426 (2,343)
39,233 (2,380)
41,319 (2,151)
Mid (200-399% FPL) 90,603 (5,425)
86,041 (4,130)
89,097 (3,941)
85,814 (3,742)
77,299 (3,473)
81,638 (3,416)
82,356 (3,854)
84,106 (4,042)
82,442 (4,150)
80,716 (3,562)
High (400%+ FPL) 160,268 (9,558)
161,422 (7,062)
150,612 (6,318)
149,199 (6,172)
142,278 (6,778)
135,347 (6,044)
136,795 (6,027)
153,984 (6,269)
161,615 (6,692)
159,893 (6,613)
Dental insurance
Some private 221,741 (12,242)
213,959 (8,348)
210,747 (7,194)
208,421 (6,779)
195,240 (7,847)
191,103 (6,820)
188,984 (7,155)
211,491 (7,461)
216,003 (8,182)
210,103 (7,977)
Only public 27,245 (1,929)
27,416 (1,653)
25,883 (1,711)
28,768 (1,690)
31,214 (1,756)
31,052 (1,595)
33,082 (1,991)
38,046 (1,945)
40,344 (1,950)
41,959 (1,848)
Neither 56,793 (3,640)
63,250 (3,085)
61,126 (2,741)
57,471 (2,827)
53,434 (2,353)
56,326 (2,927)
57,559 (3,432)
58,056 (2,741)
54,712 (2,737)
53,936 (2,528)
Employed
Employed 234,615 (12,637)
230,715 (8,531)
224,015 (7,024)
217,746 (6,631)
208,502 (7,458)
204,441 (6,871)
201,935 (6,805)
223,132 (6,854)
226,903 (7,452)
224,320 (7,651)
Not employed 71,161 (4,207)
73,868 (3,367)
73,696 (3,550)
76,908 (3,309)
71,315 (3,265)
73,966 (3,367)
77,649 (3,477)
84,443 (3,842)
84,157 (3,533)
81,531 (3,378)
Education level
< 12 yrs 24,017 (1,552)
24,835 (1,390)
22,128 (1,341)
21,109 (1,112)
19,479 (1,277)
17,469 (1,154)
17,585 (1,083)
20,346 (1,161)
19,431 (1,178)
18,053 (953)
12 yrs 76,604 (4,604)
75,054 (3,676)
76,435 (3,740)
68,873 (2,757)
57,364 (2,206)
58,023 (2,350)
55,175 (2,656)
55,259 (2,571)
56,185 (2,626)
62,625 (2,594)
> 12 yrs 204,308 (11,435)
203,514 (7,981)
198,308 (6,980)
203,520 (6,967)
202,272 (7,523)
202,770 (7,188)
206,269 (7,106)
231,347 (7,980)
234,948 (8,286)
224,878 (8,019)
Source: Agency for Healthcare Research and Quality, Household Component of the Medical Expenditure Panel Survey, 1996–2015.
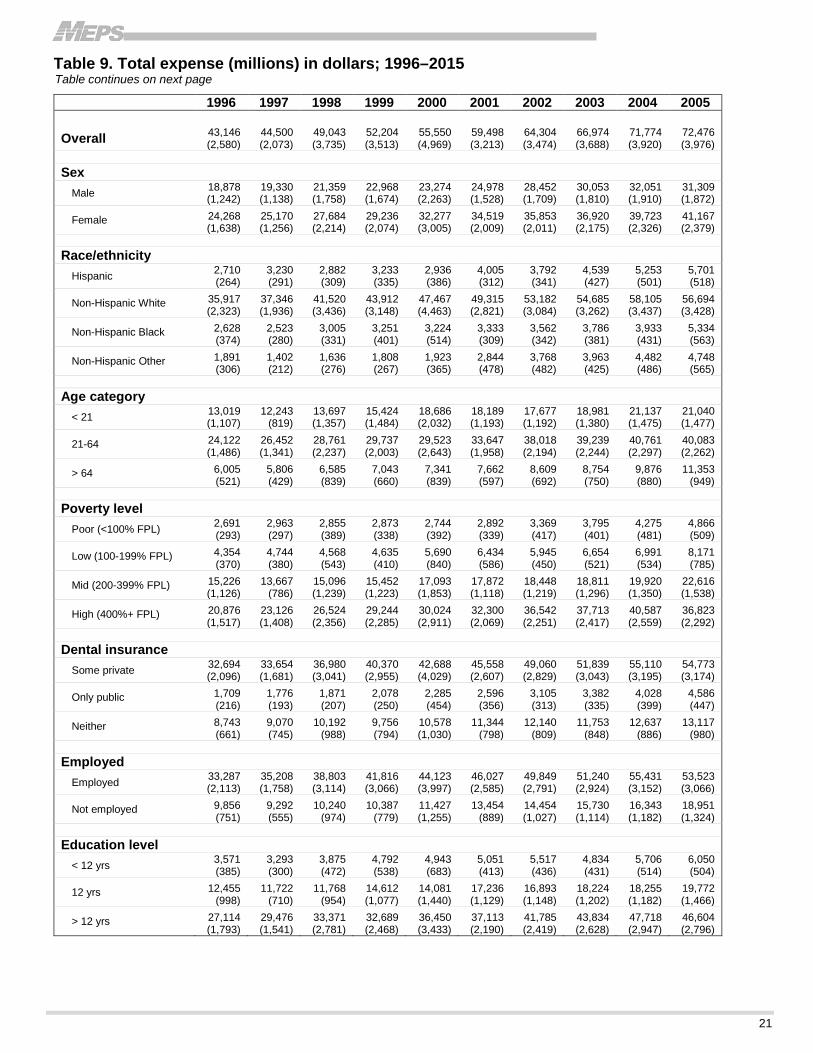
21
Table 9. Total expense (millions) in dollars; 1996–2015 Table continues on next page
1996 1997 1998 1999 2000 2001 2002 2003 2004 2005
Overall 43,146 (2,580)
44,500 (2,073)
49,043 (3,735)
52,204 (3,513)
55,550 (4,969)
59,498 (3,213)
64,304 (3,474)
66,974 (3,688)
71,774 (3,920)
72,476 (3,976)
Sex
Male 18,878 (1,242)
19,330 (1,138)
21,359 (1,758)
22,968 (1,674)
23,274 (2,263)
24,978 (1,528)
28,452 (1,709)
30,053 (1,810)
32,051 (1,910)
31,309 (1,872)
Female 24,268 (1,638)
25,170 (1,256)
27,684 (2,214)
29,236 (2,074)
32,277 (3,005)
34,519 (2,009)
35,853 (2,011)
36,920 (2,175)
39,723 (2,326)
41,167 (2,379)
Race/ethnicity
Hispanic 2,710 (264)
3,230 (291)
2,882 (309)
3,233 (335)
2,936 (386)
4,005 (312)
3,792 (341)
4,539 (427)
5,253 (501)
5,701 (518)
Non-Hispanic White 35,917 (2,323)
37,346 (1,936)
41,520 (3,436)
43,912 (3,148)
47,467 (4,463)
49,315 (2,821)
53,182 (3,084)
54,685 (3,262)
58,105 (3,437)
56,694 (3,428)
Non-Hispanic Black 2,628 (374)
2,523 (280)
3,005 (331)
3,251 (401)
3,224 (514)
3,333 (309)
3,562 (342)
3,786 (381)
3,933 (431)
5,334 (563)
Non-Hispanic Other 1,891 (306)
1,402 (212)
1,636 (276)
1,808 (267)
1,923 (365)
2,844 (478)
3,768 (482)
3,963 (425)
4,482 (486)
4,748 (565)
Age category
< 21 13,019 (1,107)
12,243 (819)
13,697 (1,357)
15,424 (1,484)
18,686 (2,032)
18,189 (1,193)
17,677 (1,192)
18,981 (1,380)
21,137 (1,475)
21,040 (1,477)
21-64 24,122 (1,486)
26,452 (1,341)
28,761 (2,237)
29,737 (2,003)
29,523 (2,643)
33,647 (1,958)
38,018 (2,194)
39,239 (2,244)
40,761 (2,297)
40,083 (2,262)
> 64 6,005 (521)
5,806 (429)
6,585 (839)
7,043 (660)
7,341 (839)
7,662 (597)
8,609 (692)
8,754 (750)
9,876 (880)
11,353 (949)
Poverty level
Poor (<100% FPL) 2,691 (293)
2,963 (297)
2,855 (389)
2,873 (338)
2,744 (392)
2,892 (339)
3,369 (417)
3,795 (401)
4,275 (481)
4,866 (509)
Low (100-199% FPL) 4,354 (370)
4,744 (380)
4,568 (543)
4,635 (410)
5,690 (840)
6,434 (586)
5,945 (450)
6,654 (521)
6,991 (534)
8,171 (785)
Mid (200-399% FPL) 15,226 (1,126)
13,667 (786)
15,096 (1,239)
15,452 (1,223)
17,093 (1,853)
17,872 (1,118)
18,448 (1,219)
18,811 (1,296)
19,920 (1,350)
22,616 (1,538)
High (400%+ FPL) 20,876 (1,517)
23,126 (1,408)
26,524 (2,356)
29,244 (2,285)
30,024 (2,911)
32,300 (2,069)
36,542 (2,251)
37,713 (2,417)
40,587 (2,559)
36,823 (2,292)
Dental insurance
Some private 32,694 (2,096)
33,654 (1,681)
36,980 (3,041)
40,370 (2,955)
42,688 (4,029)
45,558 (2,607)
49,060 (2,829)
51,839 (3,043)
55,110 (3,195)
54,773 (3,174)
Only public 1,709 (216)
1,776 (193)
1,871 (207)
2,078 (250)
2,285 (454)
2,596 (356)
3,105 (313)
3,382 (335)
4,028 (399)
4,586 (447)
Neither 8,743 (661)
9,070 (745)
10,192 (988)
9,756 (794)
10,578 (1,030)
11,344 (798)
12,140 (809)
11,753 (848)
12,637 (886)
13,117 (980)
Employed
Employed 33,287 (2,113)
35,208 (1,758)
38,803 (3,114)
41,816 (3,066)
44,123 (3,997)
46,027 (2,585)
49,849 (2,791)
51,240 (2,924)
55,431 (3,152)
53,523 (3,066)
Not employed 9,856 (751)
9,292 (555)
10,240 (974)
10,387 (779)
11,427 (1,255)
13,454 (889)
14,454 (1,027)
15,730 (1,114)
16,343 (1,182)
18,951 (1,324)
Education level
< 12 yrs 3,571 (385)
3,293 (300)
3,875 (472)
4,792 (538)
4,943 (683)
5,051 (413)
5,517 (436)
4,834 (431)
5,706 (514)
6,050 (504)
12 yrs 12,455 (998)
11,722 (710)
11,768 (954)
14,612 (1,077)
14,081 (1,440)
17,236 (1,129)
16,893 (1,148)
18,224 (1,202)
18,255 (1,182)
19,772 (1,466)
> 12 yrs 27,114 (1,793)
29,476 (1,541)
33,371 (2,781)
32,689 (2,468)
36,450 (3,433)
37,113 (2,190)
41,785 (2,419)
43,834 (2,628)
47,718 (2,947)
46,604 (2,796)

22
Table 9. Total expense (millions) in dollars; 1996–2015, continued
2006 2007 2008 2009 2010 2011 2012 2013 2014 2015
Overall 76,322 (4,128)
82,044 (3,135)
84,085 (3,003)
83,398 (3,010)
83,115 (3,363)
85,154 (3,449)
84,818 (3,640)
91,830 (3,523)
91,879 (3,251)
95,918 (3,394)
Sex
Male 33,064 (1,973)
34,264 (1,557)
36,945 (1,628)
35,716 (1,496)
36,351 (1,692)
38,094 (1,968)
36,517 (1,771)
41,425 (1,918)
40,105 (1,818)
42,024 (1,727)
Female 43,258 (2,495)
47,780 (2,047)
47,140 (2,032)
47,681 (1,970)
46,764 (2,363)
47,059 (2,098)
48,301 (2,511)
50,405 (2,441)
51,774 (2,214)
53,894 (2,304)
Race/ethnicity
Hispanic 5,106 (575)
6,743 (520)
7,369 (632)
6,682 (527)
7,977 (657)
10,096 (799)
8,243 (656)
8,960 (649)
9,932 (717)
11,051 (906)
Non-Hispanic White 60,687 (3,590)
63,461 (2,757)
65,150 (2,707)
65,100 (2,670)
64,663 (3,115)
62,603 (3,083)
63,881 (3,422)
68,393 (3,319)
67,212 (2,933)
68,056 (3,120)
Non-Hispanic Black 5,432 (580)
6,507 (654)
5,712 (602)
6,098 (592)
5,319 (443)
6,128 (474)
5,962 (437)
6,708 (692)
6,700 (504)
7,547 (576)
Non-Hispanic Other 5,097 (630)
5,333 (574)
5,854 (838)
5,517 (683)
5,157 (562)
6,327 (747)
6,732 (649)
7,768 (731)
8,034 (958)
9,263 (994)
Age category
< 21 22,753 (1,585)
22,278 (1,338)
23,542 (1,425)
22,979 (1,385)
23,422 (1,902)
24,932 (2,039)
25,576 (1,996)
24,151 (1,509)
26,945 (1,769)
26,670 (1,913)
21-64 42,388 (2,356)
46,788 (1,889)
46,842 (2,044)
47,253 (2,063)
45,497 (1,812)
45,280 (1,732)
42,279 (1,841)
50,472 (2,197)
45,296 (1,763)
48,101 (1,900)
> 64 11,182 (987)
12,978 (1,032)
13,702 (1,088)
13,166 (980)
14,196 (1,113)
14,942 (1,252)
16,962 (1,542)
17,207 (1,240)
19,639 (1,389)
21,147 (1,439)
Poverty level
Poor (<100% FPL) 4,603 (480)
4,351 (438)
4,710 (471)
5,286 (427)
5,428 (425)
5,504 (427)
6,419 (597)
6,265 (675)
6,607 (590)
7,207 (797)
Low (100-199% FPL) 7,329 (587)
9,025 (677)
10,817 (919)
9,134 (625)
9,785 (668)
9,998 (743)
9,507 (703)
10,654 (763)
11,021 (1,010)
11,187 (755)
Mid (200-399% FPL) 22,655 (1,446)
22,701 (1,391)
24,385 (1,284)
23,645 (1,356)
23,661 (1,392)
25,583 (1,457)
24,427 (1,337)
27,073 (1,645)
23,894 (1,296)
25,304 (1,392)
High (400%+ FPL) 41,735 (2,720)
45,967 (2,161)
44,172 (2,188)
45,332 (2,326)
44,240 (2,663)
44,069 (2,604)
44,465 (2,872)
47,837 (2,404)
50,356 (2,444)
52,220 (2,570)
Dental insurance
Some private 58,748 (3,287)
62,269 (2,642)
62,172 (2,614)
61,832 (2,390)
62,002 (3,041)
62,204 (2,952)
60,420 (3,110)
68,851 (3,162)
68,711 (2,966)
68,437 (2,886)
Only public 4,574 (461)
4,920 (444)
4,944 (419)
5,567 (512)
6,285 (482)
6,520 (444)
6,646 (627)
7,043 (464)
7,898 (537)
9,977 (697)
Neither 13,000 (1,097)
14,855 (912)
16,969 (1,073)
15,999 (1,228)
14,828 (826)
16,430 (1,284)
17,751 (1,503)
15,937 (942)
15,269 (896)
17,504 (1,159)
Employed
Employed 59,573 (3,377)
61,389 (2,452)
61,531 (2,290)
61,564 (2,472)
61,144 (2,735)
62,141 (2,762)
60,828 (2,982)
66,321 (2,523)
64,961 (2,455)
67,180 (2,603)
Not employed 16,748 (1,120)
20,648 (1,273)
22,540 (1,628)
21,833 (1,335)
21,964 (1,221)
23,003 (1,409)
23,975 (1,566)
25,505 (1,811)
26,918 (1,531)
28,669 (1,652)
Education level
< 12 yrs 5,726 (454)
5,469 (398)
5,560 (511)
4,847 (380)
5,316 (450)
4,548 (365)
4,560 (384)
4,972 (406)
5,856 (608)
5,347 (496)
12 yrs 18,855 (1,325)
20,650 (1,314)
21,007 (1,361)
20,041 (1,193)
16,994 (950)
17,609 (1,105)
15,735 (1,042)
15,893 (1,007)
15,739 (963)
20,221 (1,169)
> 12 yrs 51,509 (3,015)
55,567 (2,399)
57,339 (2,428)
58,200 (2,398)
60,594 (2,933)
62,910 (3,011)
64,272 (3,229)
70,781 (3,164)
70,159 (2,759)
70,182 (2,885)
Source: Agency for Healthcare Research and Quality, Household Component of the Medical Expenditure Panel Survey, 1996–2015.

23
Table 10. Total expense (millions) in 2015 dollars; 1996–2015 Table continues on next page
1996 1997 1998 1999 2000 2001 2002 2003 2004 2005
Overall 65,178 (3,898)
65,715 (3,061)
71,313 (5,431)
74,269 (4,997)
76,460 (6,839)
79,627 (4,300)
84,721 (4,577)
86,271 (4,750)
90,057 (4,919)
87,958 (4,826)
Sex
Male 28,518 (1,876)
28,546 (1,680)
31,059 (2,557)
32,676 (2,382)
32,034 (3,115)
33,429 (2,045)
37,485 (2,252)
38,713 (2,332)
40,216 (2,396)
37,997 (2,272)
Female 36,660 (2,475)
37,169 (1,854)
40,254 (3,220)
41,593 (2,951)
44,426 (4,136)
46,198 (2,689)
47,236 (2,649)
47,559 (2,802)
49,841 (2,919)
49,961 (2,887)
Race/ethnicity
Hispanic 4,094 (399)
4,769 (430)
4,191 (449)
4,599 (476)
4,042 (531)
5,360 (417)
4,996 (449)
5,846 (550)
6,591 (628)
6,919 (628)
Non-Hispanic White 54,257 (3,510)
55,150 (2,859)
60,373 (4,996)
62,473 (4,479)
65,333 (6,143)
66,000 (3,775)
70,067 (4,063)
70,442 (4,201)
72,906 (4,312)
68,804 (4,160)
Non-Hispanic Black 3,970 (565)
3,726 (413)
4,370 (482)
4,624 (571)
4,438 (707)
4,461 (414)
4,693 (450)
4,877 (491)
4,935 (541)
6,473 (683)
Non-Hispanic Other 2,856 (462)
2,070 (312)
2,379 (401)
2,573 (380)
2,647 (503)
3,806 (639)
4,964 (635)
5,105 (548)
5,624 (610)
5,762 (685)
Age category
< 21 19,667 (1,672)
18,080 (1,210)
19,916 (1,973)
21,944 (2,111)
25,719 (2,797)
24,342 (1,597)
23,290 (1,570)
24,450 (1,778)
26,521 (1,851)
25,535 (1,793)
21-64 36,440 (2,245)
39,062 (1,980)
41,821 (3,253)
42,306 (2,850)
40,636 (3,637)
45,031 (2,621)
50,088 (2,890)
50,545 (2,890)
51,144 (2,882)
48,645 (2,745)
> 64 9,071 (786)
8,573 (634)
9,576 (1,221)
10,020 (940)
10,105 (1,155)
10,254 (799)
11,343 (911)
11,277 (967)
12,392 (1,104)
13,778 (1,152)
Poverty level
Poor (<100% FPL) 4,065 (443)
4,375 (439)
4,151 (565)
4,088 (481)
3,777 (539)
3,871 (454)
4,439 (550)
4,889 (517)
5,364 (604)
5,906 (618)
Low (100-199% FPL) 6,578 (559)
7,006 (561)
6,642 (790)
6,593 (583)
7,831 (1,156)
8,610 (785)
7,833 (592)
8,572 (671)
8,772 (670)
9,916 (953)
Mid (200-399% FPL) 23,000 (1,701)
20,183 (1,161)
21,951 (1,802)
21,983 (1,740)
23,526 (2,551)
23,919 (1,497)
24,304 (1,606)
24,231 (1,670)
24,994 (1,693)
27,447 (1,866)
High (400%+ FPL) 31,535 (2,291)
34,151 (2,079)
38,569 (3,427)
41,605 (3,250)
41,326 (4,007)
43,228 (2,769)
48,144 (2,965)
48,579 (3,113)
50,926 (3,210)
44,689 (2,782)
Dental insurance
Some private 49,389 (3,166)
49,698 (2,482)
53,772 (4,422)
57,433 (4,205)
58,756 (5,545)
60,971 (3,490)
64,636 (3,727)
66,776 (3,920)
69,147 (4,008)
66,473 (3,852)
Only public 2,582 (327)
2,623 (286)
2,721 (301)
2,957 (356)
3,145 (625)
3,474 (476)
4,090 (413)
4,357 (432)
5,054 (501)
5,566 (543)
Neither 13,207 (999)
13,394 (1,099)
14,820 (1,437)
13,879 (1,130)
14,559 (1,418)
15,182 (1,067)
15,995 (1,065)
15,139 (1,093)
15,856 (1,111)
15,919 (1,189)
Employed
Employed 50,285 (3,193)
51,993 (2,596)
56,423 (4,527)
59,491 (4,361)
60,731 (5,502)
61,600 (3,460)
65,676 (3,677)
66,004 (3,766)
69,550 (3,955)
64,955 (3,721)
Not employed 14,888 (1,134)
13,721 (820)
14,890 (1,416)
14,777 (1,109)
15,729 (1,728)
18,005 (1,189)
19,043 (1,353)
20,262 (1,435)
20,506 (1,483)
22,999 (1,607)
Education level
< 12 yrs 5,395 (582)
4,863 (443)
5,634 (687)
6,818 (766)
6,803 (940)
6,760 (553)
7,268 (575)
6,227 (555)
7,160 (645)
7,342 (611)
12 yrs 18,814 (1,507)
17,311 (1,048)
17,112 (1,387)
20,788 (1,532)
19,381 (1,982)
23,067 (1,511)
22,256 (1,513)
23,475 (1,548)
22,905 (1,483)
23,995 (1,779)
> 12 yrs 40,959 (2,709)
43,528 (2,276)
48,524 (4,044)
46,506 (3,512)
50,170 (4,726)
49,669 (2,930)
55,052 (3,187)
56,464 (3,385)
59,873 (3,698)
56,559 (3,393)
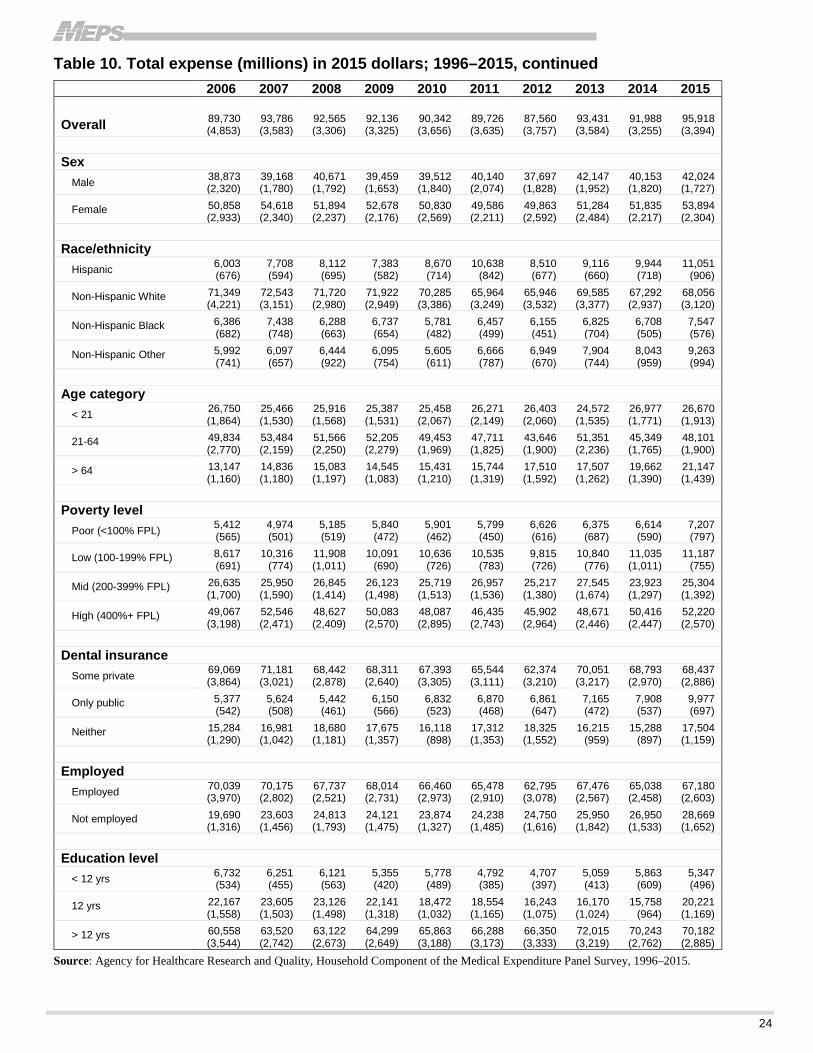
24
Table 10. Total expense (millions) in 2015 dollars; 1996–2015, continued
2006 2007 2008 2009 2010 2011 2012 2013 2014 2015
Overall 89,730 (4,853)
93,786 (3,583)
92,565 (3,306)
92,136 (3,325)
90,342 (3,656)
89,726 (3,635)
87,560 (3,757)
93,431 (3,584)
91,988 (3,255)
95,918 (3,394)
Sex
Male 38,873 (2,320)
39,168 (1,780)
40,671 (1,792)
39,459 (1,653)
39,512 (1,840)
40,140 (2,074)
37,697 (1,828)
42,147 (1,952)
40,153 (1,820)
42,024 (1,727)
Female 50,858 (2,933)
54,618 (2,340)
51,894 (2,237)
52,678 (2,176)
50,830 (2,569)
49,586 (2,211)
49,863 (2,592)
51,284 (2,484)
51,835 (2,217)
53,894 (2,304)
Race/ethnicity
Hispanic 6,003 (676)
7,708 (594)
8,112 (695)
7,383 (582)
8,670 (714)
10,638 (842)
8,510 (677)
9,116 (660)
9,944 (718)
11,051 (906)
Non-Hispanic White 71,349 (4,221)
72,543 (3,151)
71,720 (2,980)
71,922 (2,949)
70,285 (3,386)
65,964 (3,249)
65,946 (3,532)
69,585 (3,377)
67,292 (2,937)
68,056 (3,120)
Non-Hispanic Black 6,386 (682)
7,438 (748)
6,288 (663)
6,737 (654)
5,781 (482)
6,457 (499)
6,155 (451)
6,825 (704)
6,708 (505)
7,547 (576)
Non-Hispanic Other 5,992 (741)
6,097 (657)
6,444 (922)
6,095 (754)
5,605 (611)
6,666 (787)
6,949 (670)
7,904 (744)
8,043 (959)
9,263 (994)
Age category
< 21 26,750 (1,864)
25,466 (1,530)
25,916 (1,568)
25,387 (1,531)
25,458 (2,067)
26,271 (2,149)
26,403 (2,060)
24,572 (1,535)
26,977 (1,771)
26,670 (1,913)
21-64 49,834 (2,770)
53,484 (2,159)
51,566 (2,250)
52,205 (2,279)
49,453 (1,969)
47,711 (1,825)
43,646 (1,900)
51,351 (2,236)
45,349 (1,765)
48,101 (1,900)
> 64 13,147 (1,160)
14,836 (1,180)
15,083 (1,197)
14,545 (1,083)
15,431 (1,210)
15,744 (1,319)
17,510 (1,592)
17,507 (1,262)
19,662 (1,390)
21,147 (1,439)
Poverty level
Poor (<100% FPL) 5,412 (565)
4,974 (501)
5,185 (519)
5,840 (472)
5,901 (462)
5,799 (450)
6,626 (616)
6,375 (687)
6,614 (590)
7,207 (797)
Low (100-199% FPL) 8,617 (691)
10,316 (774)
11,908 (1,011)
10,091 (690)
10,636 (726)
10,535 (783)
9,815 (726)
10,840 (776)
11,035 (1,011)
11,187 (755)
Mid (200-399% FPL) 26,635 (1,700)
25,950 (1,590)
26,845 (1,414)
26,123 (1,498)
25,719 (1,513)
26,957 (1,536)
25,217 (1,380)
27,545 (1,674)
23,923 (1,297)
25,304 (1,392)
High (400%+ FPL) 49,067 (3,198)
52,546 (2,471)
48,627 (2,409)
50,083 (2,570)
48,087 (2,895)
46,435 (2,743)
45,902 (2,964)
48,671 (2,446)
50,416 (2,447)
52,220 (2,570)
Dental insurance
Some private 69,069 (3,864)
71,181 (3,021)
68,442 (2,878)
68,311 (2,640)
67,393 (3,305)
65,544 (3,111)
62,374 (3,210)
70,051 (3,217)
68,793 (2,970)
68,437 (2,886)
Only public 5,377 (542)
5,624 (508)
5,442 (461)
6,150 (566)
6,832 (523)
6,870 (468)
6,861 (647)
7,165 (472)
7,908 (537)
9,977 (697)
Neither 15,284 (1,290)
16,981 (1,042)
18,680 (1,181)
17,675 (1,357)
16,118 (898)
17,312 (1,353)
18,325 (1,552)
16,215 (959)
15,288 (897)
17,504 (1,159)
Employed
Employed 70,039 (3,970)
70,175 (2,802)
67,737 (2,521)
68,014 (2,731)
66,460 (2,973)
65,478 (2,910)
62,795 (3,078)
67,476 (2,567)
65,038 (2,458)
67,180 (2,603)
Not employed 19,690 (1,316)
23,603 (1,456)
24,813 (1,793)
24,121 (1,475)
23,874 (1,327)
24,238 (1,485)
24,750 (1,616)
25,950 (1,842)
26,950 (1,533)
28,669 (1,652)
Education level
< 12 yrs 6,732 (534)
6,251 (455)
6,121 (563)
5,355 (420)
5,778 (489)
4,792 (385)
4,707 (397)
5,059 (413)
5,863 (609)
5,347 (496)
12 yrs 22,167 (1,558)
23,605 (1,503)
23,126 (1,498)
22,141 (1,318)
18,472 (1,032)
18,554 (1,165)
16,243 (1,075)
16,170 (1,024)
15,758 (964)
20,221 (1,169)
> 12 yrs 60,558 (3,544)
63,520 (2,742)
63,122 (2,673)
64,299 (2,649)
65,863 (3,188)
66,288 (3,173)
66,350 (3,333)
72,015 (3,219)
70,243 (2,762)
70,182 (2,885)
Source: Agency for Healthcare Research and Quality, Household Component of the Medical Expenditure Panel Survey, 1996–2015.
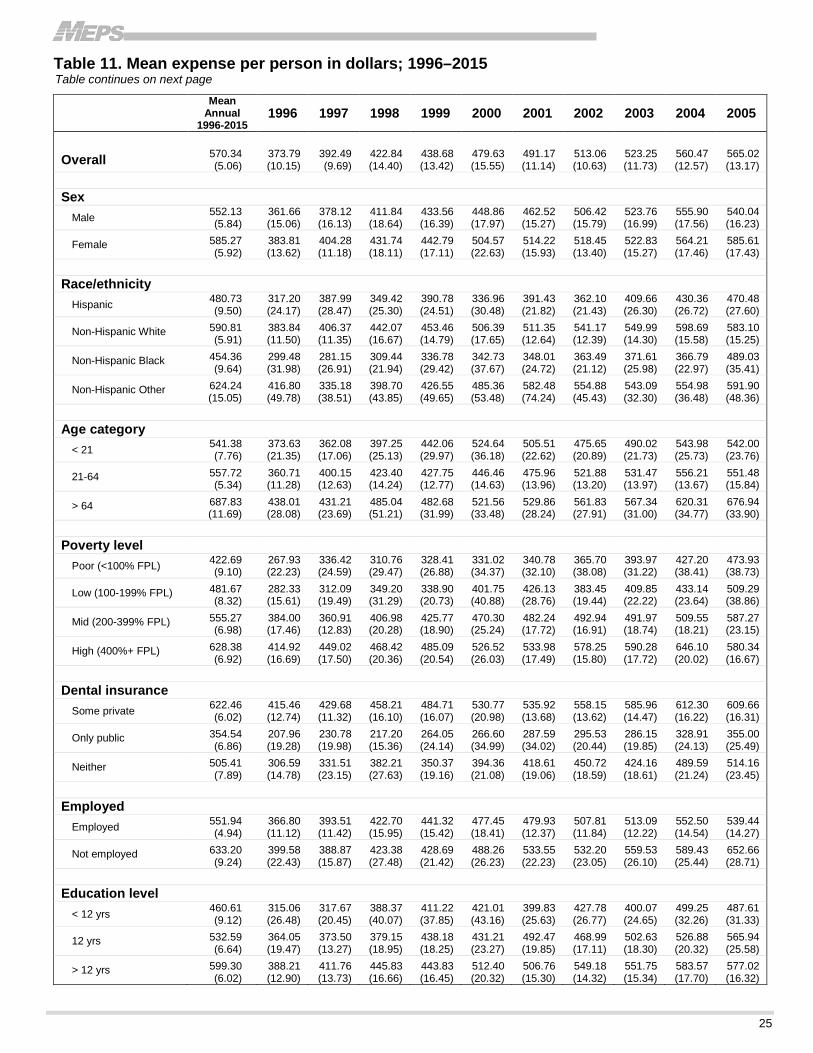
25
Table 11. Mean expense per person in dollars; 1996–2015 Table continues on next page
Mean Annual
1996-2015 1996 1997 1998 1999 2000 2001 2002 2003 2004 2005
Overall 570.34 (5.06)
373.79 (10.15)
392.49 (9.69)
422.84 (14.40)
438.68 (13.42)
479.63 (15.55)
491.17 (11.14)
513.06 (10.63)
523.25 (11.73)
560.47 (12.57)
565.02 (13.17)
Sex
Male 552.13 (5.84)
361.66 (15.06)
378.12 (16.13)
411.84 (18.64)
433.56 (16.39)
448.86 (17.97)
462.52 (15.27)
506.42 (15.79)
523.76 (16.99)
555.90 (17.56)
540.04 (16.23)
Female 585.27 (5.92)
383.81 (13.62)
404.28 (11.18)
431.74 (18.11)
442.79 (17.11)
504.57 (22.63)
514.22 (15.93)
518.45 (13.40)
522.83 (15.27)
564.21 (17.46)
585.61 (17.43)
Race/ethnicity
Hispanic 480.73 (9.50)
317.20 (24.17)
387.99 (28.47)
349.42 (25.30)
390.78 (24.51)
336.96 (30.48)
391.43 (21.82)
362.10 (21.43)
409.66 (26.30)
430.36 (26.72)
470.48 (27.60)
Non-Hispanic White 590.81 (5.91)
383.84 (11.50)
406.37 (11.35)
442.07 (16.67)
453.46 (14.79)
506.39 (17.65)
511.35 (12.64)
541.17 (12.39)
549.99 (14.30)
598.69 (15.58)
583.10 (15.25)
Non-Hispanic Black 454.36 (9.64)
299.48 (31.98)
281.15 (26.91)
309.44 (21.94)
336.78 (29.42)
342.73 (37.67)
348.01 (24.72)
363.49 (21.12)
371.61 (25.98)
366.79 (22.97)
489.03 (35.41)
Non-Hispanic Other 624.24 (15.05)
416.80 (49.78)
335.18 (38.51)
398.70 (43.85)
426.55 (49.65)
485.36 (53.48)
582.48 (74.24)
554.88 (45.43)
543.09 (32.30)
554.98 (36.48)
591.90 (48.36)
Age category
< 21 541.38 (7.76)
373.63 (21.35)
362.08 (17.06)
397.25 (25.13)
442.06 (29.97)
524.64 (36.18)
505.51 (22.62)
475.65 (20.89)
490.02 (21.73)
543.98 (25.73)
542.00 (23.76)
21-64 557.72 (5.34)
360.71 (11.28)
400.15 (12.63)
423.40 (14.24)
427.75 (12.77)
446.46 (14.63)
475.96 (13.96)
521.88 (13.20)
531.47 (13.97)
556.21 (13.67)
551.48 (15.84)
> 64 687.83 (11.69)
438.01 (28.08)
431.21 (23.69)
485.04 (51.21)
482.68 (31.99)
521.56 (33.48)
529.86 (28.24)
561.83 (27.91)
567.34 (31.00)
620.31 (34.77)
676.94 (33.90)
Poverty level
Poor (<100% FPL) 422.69 (9.10)
267.93 (22.23)
336.42 (24.59)
310.76 (29.47)
328.41 (26.88)
331.02 (34.37)
340.78 (32.10)
365.70 (38.08)
393.97 (31.22)
427.20 (38.41)
473.93 (38.73)
Low (100-199% FPL) 481.67 (8.32)
282.33 (15.61)
312.09 (19.49)
349.20 (31.29)
338.90 (20.73)
401.75 (40.88)
426.13 (28.76)
383.45 (19.44)
409.85 (22.22)
433.14 (23.64)
509.29 (38.86)
Mid (200-399% FPL) 555.27 (6.98)
384.00 (17.46)
360.91 (12.83)
406.98 (20.28)
425.77 (18.90)
470.30 (25.24)
482.24 (17.72)
492.94 (16.91)
491.97 (18.74)
509.55 (18.21)
587.27 (23.15)
High (400%+ FPL) 628.38 (6.92)
414.92 (16.69)
449.02 (17.50)
468.42 (20.36)
485.09 (20.54)
526.52 (26.03)
533.98 (17.49)
578.25 (15.80)
590.28 (17.72)
646.10 (20.02)
580.34 (16.67)
Dental insurance
Some private 622.46 (6.02)
415.46 (12.74)
429.68 (11.32)
458.21 (16.10)
484.71 (16.07)
530.77 (20.98)
535.92 (13.68)
558.15 (13.62)
585.96 (14.47)
612.30 (16.22)
609.66 (16.31)
Only public 354.54 (6.86)
207.96 (19.28)
230.78 (19.98)
217.20 (15.36)
264.05 (24.14)
266.60 (34.99)
287.59 (34.02)
295.53 (20.44)
286.15 (19.85)
328.91 (24.13)
355.00 (25.49)
Neither 505.41 (7.89)
306.59 (14.78)
331.51 (23.15)
382.21 (27.63)
350.37 (19.16)
394.36 (21.08)
418.61 (19.06)
450.72 (18.59)
424.16 (18.61)
489.59 (21.24)
514.16 (23.45)
Employed
Employed 551.94 (4.94)
366.80 (11.12)
393.51 (11.42)
422.70 (15.95)
441.32 (15.42)
477.45 (18.41)
479.93 (12.37)
507.81 (11.84)
513.09 (12.22)
552.50 (14.54)
539.44 (14.27)
Not employed 633.20 (9.24)
399.58 (22.43)
388.87 (15.87)
423.38 (27.48)
428.69 (21.42)
488.26 (26.23)
533.55 (22.23)
532.20 (23.05)
559.53 (26.10)
589.43 (25.44)
652.66 (28.71)
Education level
< 12 yrs 460.61 (9.12)
315.06 (26.48)
317.67 (20.45)
388.37 (40.07)
411.22 (37.85)
421.01 (43.16)
399.83 (25.63)
427.78 (26.77)
400.07 (24.65)
499.25 (32.26)
487.61 (31.33)
12 yrs 532.59 (6.64)
364.05 (19.47)
373.50 (13.27)
379.15 (18.95)
438.18 (18.25)
431.21 (23.27)
492.47 (19.85)
468.99 (17.11)
502.63 (18.30)
526.88 (20.32)
565.94 (25.58)
> 12 yrs 599.30 (6.02)
388.21 (12.90)
411.76 (13.73)
445.83 (16.66)
443.83 (16.45)
512.40 (20.32)
506.76 (15.30)
549.18 (14.32)
551.75 (15.34)
583.57 (17.70)
577.02 (16.32)
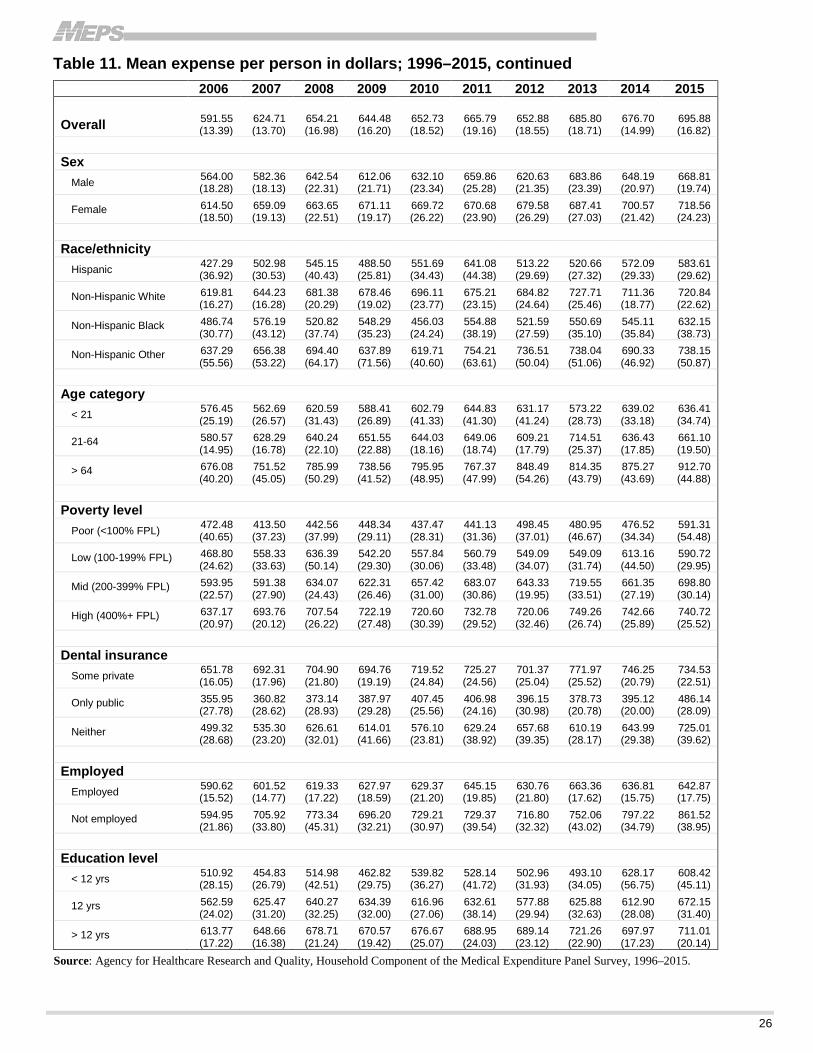
26
Table 11. Mean expense per person in dollars; 1996–2015, continued
2006 2007 2008 2009 2010 2011 2012 2013 2014 2015
Overall 591.55 (13.39)
624.71 (13.70)
654.21 (16.98)
644.48 (16.20)
652.73 (18.52)
665.79 (19.16)
652.88 (18.55)
685.80 (18.71)
676.70 (14.99)
695.88 (16.82)
Sex
Male 564.00 (18.28)
582.36 (18.13)
642.54 (22.31)
612.06 (21.71)
632.10 (23.34)
659.86 (25.28)
620.63 (21.35)
683.86 (23.39)
648.19 (20.97)
668.81 (19.74)
Female 614.50 (18.50)
659.09 (19.13)
663.65 (22.51)
671.11 (19.17)
669.72 (26.22)
670.68 (23.90)
679.58 (26.29)
687.41 (27.03)
700.57 (21.42)
718.56 (24.23)
Race/ethnicity
Hispanic 427.29 (36.92)
502.98 (30.53)
545.15 (40.43)
488.50 (25.81)
551.69 (34.43)
641.08 (44.38)
513.22 (29.69)
520.66 (27.32)
572.09 (29.33)
583.61 (29.62)
Non-Hispanic White 619.81 (16.27)
644.23 (16.28)
681.38 (20.29)
678.46 (19.02)
696.11 (23.77)
675.21 (23.15)
684.82 (24.64)
727.71 (25.46)
711.36 (18.77)
720.84 (22.62)
Non-Hispanic Black 486.74 (30.77)
576.19 (43.12)
520.82 (37.74)
548.29 (35.23)
456.03 (24.24)
554.88 (38.19)
521.59 (27.59)
550.69 (35.10)
545.11 (35.84)
632.15 (38.73)
Non-Hispanic Other 637.29 (55.56)
656.38 (53.22)
694.40 (64.17)
637.89 (71.56)
619.71 (40.60)
754.21 (63.61)
736.51 (50.04)
738.04 (51.06)
690.33 (46.92)
738.15 (50.87)
Age category
< 21 576.45 (25.19)
562.69 (26.57)
620.59 (31.43)
588.41 (26.89)
602.79 (41.33)
644.83 (41.30)
631.17 (41.24)
573.22 (28.73)
639.02 (33.18)
636.41 (34.74)
21-64 580.57 (14.95)
628.29 (16.78)
640.24 (22.10)
651.55 (22.88)
644.03 (18.16)
649.06 (18.74)
609.21 (17.79)
714.51 (25.37)
636.43 (17.85)
661.10 (19.50)
> 64 676.08 (40.20)
751.52 (45.05)
785.99 (50.29)
738.56 (41.52)
795.95 (48.95)
767.37 (47.99)
848.49 (54.26)
814.35 (43.79)
875.27 (43.69)
912.70 (44.88)
Poverty level
Poor (<100% FPL) 472.48 (40.65)
413.50 (37.23)
442.56 (37.99)
448.34 (29.11)
437.47 (28.31)
441.13 (31.36)
498.45 (37.01)
480.95 (46.67)
476.52 (34.34)
591.31 (54.48)
Low (100-199% FPL) 468.80 (24.62)
558.33 (33.63)
636.39 (50.14)
542.20 (29.30)
557.84 (30.06)
560.79 (33.48)
549.09 (34.07)
549.09 (31.74)
613.16 (44.50)
590.72 (29.95)
Mid (200-399% FPL) 593.95 (22.57)
591.38 (27.90)
634.07 (24.43)
622.31 (26.46)
657.42 (31.00)
683.07 (30.86)
643.33 (19.95)
719.55 (33.51)
661.35 (27.19)
698.80 (30.14)
High (400%+ FPL) 637.17 (20.97)
693.76 (20.12)
707.54 (26.22)
722.19 (27.48)
720.60 (30.39)
732.78 (29.52)
720.06 (32.46)
749.26 (26.74)
742.66 (25.89)
740.72 (25.52)
Dental insurance
Some private 651.78 (16.05)
692.31 (17.96)
704.90 (21.80)
694.76 (19.19)
719.52 (24.84)
725.27 (24.56)
701.37 (25.04)
771.97 (25.52)
746.25 (20.79)
734.53 (22.51)
Only public 355.95 (27.78)
360.82 (28.62)
373.14 (28.93)
387.97 (29.28)
407.45 (25.56)
406.98 (24.16)
396.15 (30.98)
378.73 (20.78)
395.12 (20.00)
486.14 (28.09)
Neither 499.32 (28.68)
535.30 (23.20)
626.61 (32.01)
614.01 (41.66)
576.10 (23.81)
629.24 (38.92)
657.68 (39.35)
610.19 (28.17)
643.99 (29.38)
725.01 (39.62)
Employed
Employed 590.62 (15.52)
601.52 (14.77)
619.33 (17.22)
627.97 (18.59)
629.37 (21.20)
645.15 (19.85)
630.76 (21.80)
663.36 (17.62)
636.81 (15.75)
642.87 (17.75)
Not employed 594.95 (21.86)
705.92 (33.80)
773.34 (45.31)
696.20 (32.21)
729.21 (30.97)
729.37 (39.54)
716.80 (32.32)
752.06 (43.02)
797.22 (34.79)
861.52 (38.95)
Education level
< 12 yrs 510.92 (28.15)
454.83 (26.79)
514.98 (42.51)
462.82 (29.75)
539.82 (36.27)
528.14 (41.72)
502.96 (31.93)
493.10 (34.05)
628.17 (56.75)
608.42 (45.11)
12 yrs 562.59 (24.02)
625.47 (31.20)
640.27 (32.25)
634.39 (32.00)
616.96 (27.06)
632.61 (38.14)
577.88 (29.94)
625.88 (32.63)
612.90 (28.08)
672.15 (31.40)
> 12 yrs 613.77 (17.22)
648.66 (16.38)
678.71 (21.24)
670.57 (19.42)
676.67 (25.07)
688.95 (24.03)
689.14 (23.12)
721.26 (22.90)
697.97 (17.23)
711.01 (20.14)
Source: Agency for Healthcare Research and Quality, Household Component of the Medical Expenditure Panel Survey, 1996–2015.

27
Table 12. Mean expense per person in 2015 dollars; 1996–2015 Table continues on next page
Mean Annual
1996-2015 1996 1997 1998 1999 2000 2001 2002 2003 2004 2005
Overall 673.74 (5.48)
564.66 (15.33)
579.60 (14.31)
614.85 (20.94)
624.10 (19.10)
660.17 (21.41)
657.35 (14.91)
675.95 (14.00)
674.02 (15.11)
703.23 (15.77)
685.71 (15.98)
Sex
Male 651.93 (6.35)
546.33 (22.75)
558.39 (23.82)
598.85 (27.11)
616.81 (23.32)
617.82 (24.74)
619.00 (20.43)
667.21 (20.81)
674.68 (21.88)
697.50 (22.04)
655.40 (19.70)
Female 691.63 (6.53)
579.79 (20.58)
597.01 (16.51)
627.78 (26.33)
629.95 (24.34)
694.49 (31.14)
688.20 (21.32)
683.05 (17.65)
673.48 (19.67)
707.92 (21.91)
710.70 (21.15)
Race/ethnicity
Hispanic 552.98 (10.19)
479.17 (36.51)
572.97 (42.04)
508.09 (36.79)
555.95 (34.87)
463.80 (41.95)
523.86 (29.20)
477.06 (28.23)
527.70 (33.88)
539.99 (33.52)
570.98 (33.49)
Non-Hispanic White 702.50 (6.37)
579.85 (17.37)
600.11 (16.77)
642.80 (24.24)
645.13 (21.04)
697.00 (24.29)
684.35 (16.91)
712.99 (16.33)
708.46 (18.42)
751.18 (19.54)
707.66 (18.51)
Non-Hispanic Black 530.48 (10.48)
452.40 (48.31)
415.18 (39.73)
449.95 (31.90)
479.12 (41.85)
471.73 (51.85)
465.75 (33.09)
478.89 (27.82)
478.69 (33.46)
460.22 (28.82)
593.50 (42.97)
Non-Hispanic Other 712.99 (16.03)
629.63 (75.20)
494.97 (56.88)
579.75 (63.76)
606.84 (70.64)
668.05 (73.62)
779.55 (99.35)
731.05 (59.86)
699.57 (41.61)
696.35 (45.77)
718.34 (58.69)
Age category
< 21 640.91 (9.08)
564.42 (32.25)
534.70 (25.20)
577.63 (36.54)
628.91 (42.64)
722.12 (49.79)
676.54 (30.27)
626.67 (27.52)
631.22 (27.99)
682.54 (32.29)
657.77 (28.83)
21-64 662.05 (5.84)
544.90 (17.04)
590.92 (18.65)
615.66 (20.70)
608.55 (18.17)
614.52 (20.14)
636.99 (18.68)
687.57 (17.39)
684.60 (18.00)
697.89 (17.15)
669.28 (19.22)
> 64 796.06 (12.35)
661.67 (42.41)
636.79 (34.98)
705.29 (74.46)
686.70 (45.51)
717.88 (46.08)
709.12 (37.80)
740.20 (36.77)
730.81 (39.93)
778.32 (43.62)
821.54 (41.14)
Poverty level
Poor (<100% FPL) 494.09 (10.72)
404.74 (33.58)
496.80 (36.32)
451.87 (42.85)
467.23 (38.24)
455.61 (47.31)
456.07 (42.96)
481.80 (50.17)
507.49 (40.22)
536.02 (48.20)
575.16 (47.00)
Low (100-199% FPL) 563.74 (9.13)
426.50 (23.59)
460.87 (28.78)
507.77 (45.49)
482.14 (29.50)
552.97 (56.27)
570.29 (38.49)
505.20 (25.61)
527.94 (28.62)
543.48 (29.66)
618.08 (47.17)
Mid (200-399% FPL) 659.31 (7.71)
580.08 (26.37)
532.97 (18.94)
591.79 (29.49)
605.73 (26.89)
647.32 (34.74)
645.39 (23.72)
649.44 (22.28)
633.72 (24.14)
639.35 (22.85)
712.71 (28.09)
High (400%+ FPL) 742.54 (7.38)
626.78 (25.21)
663.09 (25.85)
681.12 (29.61)
690.13 (29.21)
724.71 (35.83)
714.64 (23.41)
761.84 (20.82)
760.37 (22.82)
810.67 (25.12)
704.30 (20.24)
Dental insurance
Some private 736.90 (6.39)
627.61 (19.24)
634.52 (16.71)
666.28 (23.41)
689.58 (22.87)
730.55 (28.88)
717.24 (18.31)
735.36 (17.94)
754.80 (18.64)
768.27 (20.35)
739.88 (19.79)
Only public 404.69 (8.06)
314.14 (29.12)
340.80 (29.51)
315.83 (22.34)
375.65 (34.35)
366.95 (48.17)
384.89 (45.54)
389.36 (26.92)
368.60 (25.57)
412.69 (30.27)
430.83 (30.93)
Neither 598.73 (8.33)
463.15 (22.33)
489.55 (34.18)
555.77 (40.18)
498.46 (27.26)
542.80 (29.01)
560.23 (25.51)
593.82 (24.49)
546.37 (23.98)
614.30 (26.65)
623.99 (28.45)
Employed
Employed 655.13 (5.71)
554.10 (16.80)
581.11 (16.86)
614.65 (23.20)
627.85 (21.93)
657.16 (25.34)
642.30 (16.56)
669.03 (15.60)
660.93 (15.75)
693.23 (18.24)
654.67 (17.32)
Not employed 737.37 (9.71)
603.61 (33.89)
574.26 (23.44)
615.64 (39.96)
609.88 (30.47)
672.04 (36.11)
714.06 (29.75)
701.16 (30.37)
720.75 (33.62)
739.57 (31.92)
792.07 (34.84)
Education level
< 12 yrs 554.93 (11.37)
475.93 (40.00)
469.12 (30.20)
564.73 (58.27)
585.04 (53.85)
579.48 (59.41)
535.10 (34.29)
563.59 (35.27)
515.34 (31.75)
626.42 (40.48)
591.77 (38.02)
12 yrs 639.50 (7.67)
549.94 (29.41)
551.57 (19.60)
551.32 (27.56)
623.38 (25.96)
593.52 (32.03)
659.08 (26.57)
617.89 (22.54)
647.46 (23.57)
661.09 (25.49)
686.83 (31.04)
> 12 yrs 702.67 (6.37)
586.45 (19.49)
608.06 (20.27)
648.28 (24.22)
631.43 (23.40)
705.28 (27.97)
678.20 (20.47)
723.54 (18.87)
710.73 (19.76)
732.22 (22.20)
700.27 (19.81)
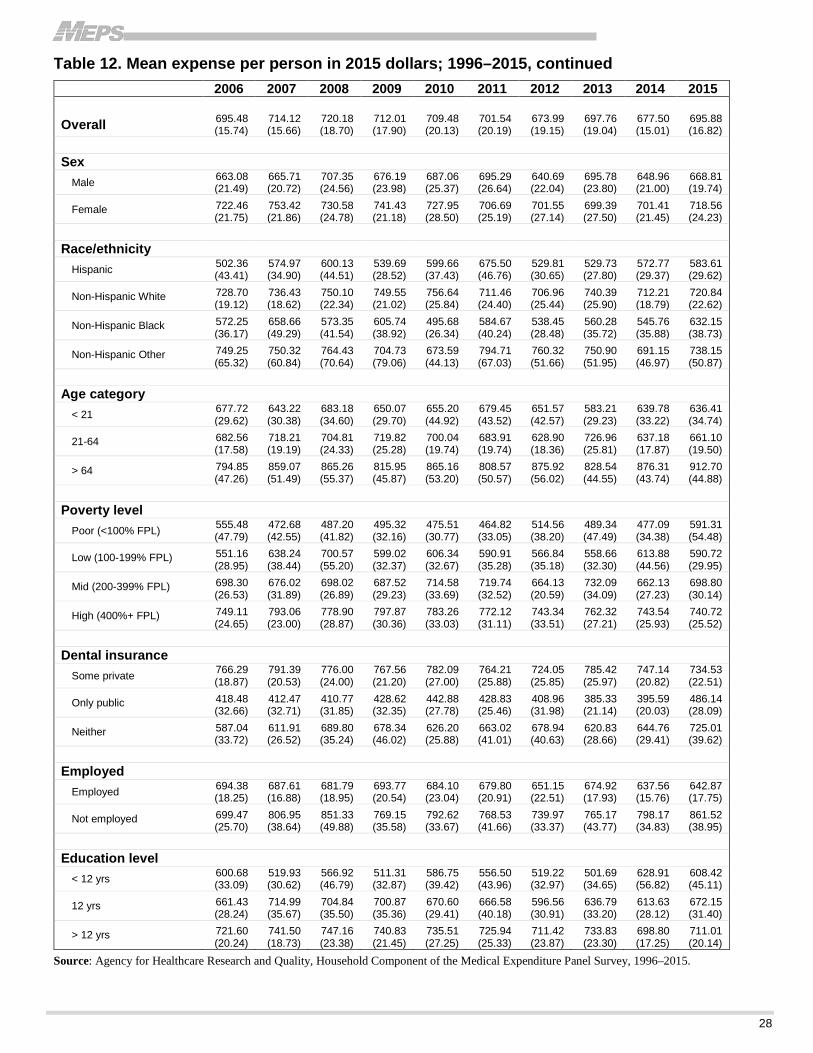
28
Table 12. Mean expense per person in 2015 dollars; 1996–2015, continued
2006 2007 2008 2009 2010 2011 2012 2013 2014 2015
Overall 695.48 (15.74)
714.12 (15.66)
720.18 (18.70)
712.01 (17.90)
709.48 (20.13)
701.54 (20.19)
673.99 (19.15)
697.76 (19.04)
677.50 (15.01)
695.88 (16.82)
Sex
Male 663.08 (21.49)
665.71 (20.72)
707.35 (24.56)
676.19 (23.98)
687.06 (25.37)
695.29 (26.64)
640.69 (22.04)
695.78 (23.80)
648.96 (21.00)
668.81 (19.74)
Female 722.46 (21.75)
753.42 (21.86)
730.58 (24.78)
741.43 (21.18)
727.95 (28.50)
706.69 (25.19)
701.55 (27.14)
699.39 (27.50)
701.41 (21.45)
718.56 (24.23)
Race/ethnicity
Hispanic 502.36 (43.41)
574.97 (34.90)
600.13 (44.51)
539.69 (28.52)
599.66 (37.43)
675.50 (46.76)
529.81 (30.65)
529.73 (27.80)
572.77 (29.37)
583.61 (29.62)
Non-Hispanic White 728.70 (19.12)
736.43 (18.62)
750.10 (22.34)
749.55 (21.02)
756.64 (25.84)
711.46 (24.40)
706.96 (25.44)
740.39 (25.90)
712.21 (18.79)
720.84 (22.62)
Non-Hispanic Black 572.25 (36.17)
658.66 (49.29)
573.35 (41.54)
605.74 (38.92)
495.68 (26.34)
584.67 (40.24)
538.45 (28.48)
560.28 (35.72)
545.76 (35.88)
632.15 (38.73)
Non-Hispanic Other 749.25 (65.32)
750.32 (60.84)
764.43 (70.64)
704.73 (79.06)
673.59 (44.13)
794.71 (67.03)
760.32 (51.66)
750.90 (51.95)
691.15 (46.97)
738.15 (50.87)
Age category
< 21 677.72 (29.62)
643.22 (30.38)
683.18 (34.60)
650.07 (29.70)
655.20 (44.92)
679.45 (43.52)
651.57 (42.57)
583.21 (29.23)
639.78 (33.22)
636.41 (34.74)
21-64 682.56 (17.58)
718.21 (19.19)
704.81 (24.33)
719.82 (25.28)
700.04 (19.74)
683.91 (19.74)
628.90 (18.36)
726.96 (25.81)
637.18 (17.87)
661.10 (19.50)
> 64 794.85 (47.26)
859.07 (51.49)
865.26 (55.37)
815.95 (45.87)
865.16 (53.20)
808.57 (50.57)
875.92 (56.02)
828.54 (44.55)
876.31 (43.74)
912.70 (44.88)
Poverty level
Poor (<100% FPL) 555.48 (47.79)
472.68 (42.55)
487.20 (41.82)
495.32 (32.16)
475.51 (30.77)
464.82 (33.05)
514.56 (38.20)
489.34 (47.49)
477.09 (34.38)
591.31 (54.48)
Low (100-199% FPL) 551.16 (28.95)
638.24 (38.44)
700.57 (55.20)
599.02 (32.37)
606.34 (32.67)
590.91 (35.28)
566.84 (35.18)
558.66 (32.30)
613.88 (44.56)
590.72 (29.95)
Mid (200-399% FPL) 698.30 (26.53)
676.02 (31.89)
698.02 (26.89)
687.52 (29.23)
714.58 (33.69)
719.74 (32.52)
664.13 (20.59)
732.09 (34.09)
662.13 (27.23)
698.80 (30.14)
High (400%+ FPL) 749.11 (24.65)
793.06 (23.00)
778.90 (28.87)
797.87 (30.36)
783.26 (33.03)
772.12 (31.11)
743.34 (33.51)
762.32 (27.21)
743.54 (25.93)
740.72 (25.52)
Dental insurance
Some private 766.29 (18.87)
791.39 (20.53)
776.00 (24.00)
767.56 (21.20)
782.09 (27.00)
764.21 (25.88)
724.05 (25.85)
785.42 (25.97)
747.14 (20.82)
734.53 (22.51)
Only public 418.48 (32.66)
412.47 (32.71)
410.77 (31.85)
428.62 (32.35)
442.88 (27.78)
428.83 (25.46)
408.96 (31.98)
385.33 (21.14)
395.59 (20.03)
486.14 (28.09)
Neither 587.04 (33.72)
611.91 (26.52)
689.80 (35.24)
678.34 (46.02)
626.20 (25.88)
663.02 (41.01)
678.94 (40.63)
620.83 (28.66)
644.76 (29.41)
725.01 (39.62)
Employed
Employed 694.38 (18.25)
687.61 (16.88)
681.79 (18.95)
693.77 (20.54)
684.10 (23.04)
679.80 (20.91)
651.15 (22.51)
674.92 (17.93)
637.56 (15.76)
642.87 (17.75)
Not employed 699.47 (25.70)
806.95 (38.64)
851.33 (49.88)
769.15 (35.58)
792.62 (33.67)
768.53 (41.66)
739.97 (33.37)
765.17 (43.77)
798.17 (34.83)
861.52 (38.95)
Education level
< 12 yrs 600.68 (33.09)
519.93 (30.62)
566.92 (46.79)
511.31 (32.87)
586.75 (39.42)
556.50 (43.96)
519.22 (32.97)
501.69 (34.65)
628.91 (56.82)
608.42 (45.11)
12 yrs 661.43 (28.24)
714.99 (35.67)
704.84 (35.50)
700.87 (35.36)
670.60 (29.41)
666.58 (40.18)
596.56 (30.91)
636.79 (33.20)
613.63 (28.12)
672.15 (31.40)
> 12 yrs 721.60 (20.24)
741.50 (18.73)
747.16 (23.38)
740.83 (21.45)
735.51 (27.25)
725.94 (25.33)
711.42 (23.87)
733.83 (23.30)
698.80 (17.25)
711.01 (20.14)
Source: Agency for Healthcare Research and Quality, Household Component of the Medical Expenditure Panel Survey, 1996–2015.
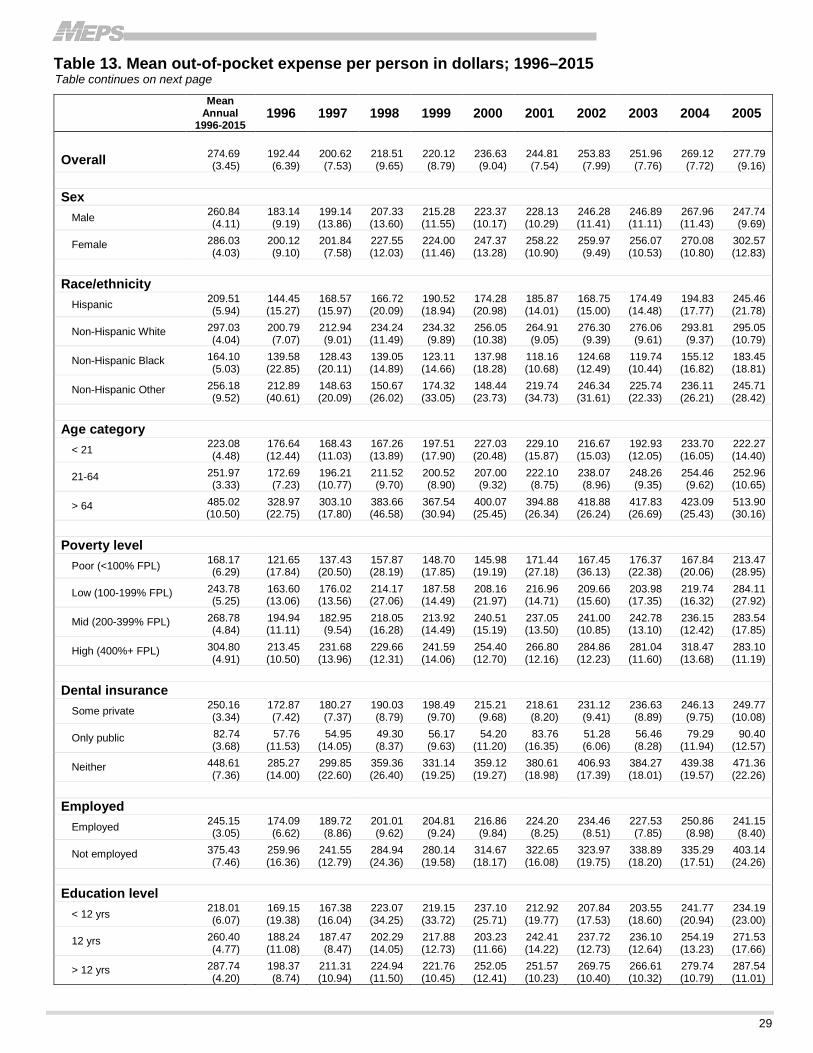
29
Table 13. Mean out-of-pocket expense per person in dollars; 1996–2015 Table continues on next page
Mean Annual
1996-2015 1996 1997 1998 1999 2000 2001 2002 2003 2004 2005
Overall 274.69 (3.45)
192.44 (6.39)
200.62 (7.53)
218.51 (9.65)
220.12 (8.79)
236.63 (9.04)
244.81 (7.54)
253.83 (7.99)
251.96 (7.76)
269.12 (7.72)
277.79 (9.16)
Sex
Male 260.84 (4.11)
183.14 (9.19)
199.14 (13.86)
207.33 (13.60)
215.28 (11.55)
223.37 (10.17)
228.13 (10.29)
246.28 (11.41)
246.89 (11.11)
267.96 (11.43)
247.74 (9.69)
Female 286.03 (4.03)
200.12 (9.10)
201.84 (7.58)
227.55 (12.03)
224.00 (11.46)
247.37 (13.28)
258.22 (10.90)
259.97 (9.49)
256.07 (10.53)
270.08 (10.80)
302.57 (12.83)
Race/ethnicity
Hispanic 209.51 (5.94)
144.45 (15.27)
168.57 (15.97)
166.72 (20.09)
190.52 (18.94)
174.28 (20.98)
185.87 (14.01)
168.75 (15.00)
174.49 (14.48)
194.83 (17.77)
245.46 (21.78)
Non-Hispanic White 297.03 (4.04)
200.79 (7.07)
212.94 (9.01)
234.24 (11.49)
234.32 (9.89)
256.05 (10.38)
264.91 (9.05)
276.30 (9.39)
276.06 (9.61)
293.81 (9.37)
295.05 (10.79)
Non-Hispanic Black 164.10 (5.03)
139.58 (22.85)
128.43 (20.11)
139.05 (14.89)
123.11 (14.66)
137.98 (18.28)
118.16 (10.68)
124.68 (12.49)
119.74 (10.44)
155.12 (16.82)
183.45 (18.81)
Non-Hispanic Other 256.18 (9.52)
212.89 (40.61)
148.63 (20.09)
150.67 (26.02)
174.32 (33.05)
148.44 (23.73)
219.74 (34.73)
246.34 (31.61)
225.74 (22.33)
236.11 (26.21)
245.71 (28.42)
Age category
< 21 223.08 (4.48)
176.64 (12.44)
168.43 (11.03)
167.26 (13.89)
197.51 (17.90)
227.03 (20.48)
229.10 (15.87)
216.67 (15.03)
192.93 (12.05)
233.70 (16.05)
222.27 (14.40)
21-64 251.97 (3.33)
172.69 (7.23)
196.21 (10.77)
211.52 (9.70)
200.52 (8.90)
207.00 (9.32)
222.10 (8.75)
238.07 (8.96)
248.26 (9.35)
254.46 (9.62)
252.96 (10.65)
> 64 485.02 (10.50)
328.97 (22.75)
303.10 (17.80)
383.66 (46.58)
367.54 (30.94)
400.07 (25.45)
394.88 (26.34)
418.88 (26.24)
417.83 (26.69)
423.09 (25.43)
513.90 (30.16)
Poverty level
Poor (<100% FPL) 168.17 (6.29)
121.65 (17.84)
137.43 (20.50)
157.87 (28.19)
148.70 (17.85)
145.98 (19.19)
171.44 (27.18)
167.45 (36.13)
176.37 (22.38)
167.84 (20.06)
213.47 (28.95)
Low (100-199% FPL) 243.78 (5.25)
163.60 (13.06)
176.02 (13.56)
214.17 (27.06)
187.58 (14.49)
208.16 (21.97)
216.96 (14.71)
209.66 (15.60)
203.98 (17.35)
219.74 (16.32)
284.11 (27.92)
Mid (200-399% FPL) 268.78 (4.84)
194.94 (11.11)
182.95 (9.54)
218.05 (16.28)
213.92 (14.49)
240.51 (15.19)
237.05 (13.50)
241.00 (10.85)
242.78 (13.10)
236.15 (12.42)
283.54 (17.85)
High (400%+ FPL) 304.80 (4.91)
213.45 (10.50)
231.68 (13.96)
229.66 (12.31)
241.59 (14.06)
254.40 (12.70)
266.80 (12.16)
284.86 (12.23)
281.04 (11.60)
318.47 (13.68)
283.10 (11.19)
Dental insurance
Some private 250.16 (3.34)
172.87 (7.42)
180.27 (7.37)
190.03 (8.79)
198.49 (9.70)
215.21 (9.68)
218.61 (8.20)
231.12 (9.41)
236.63 (8.89)
246.13 (9.75)
249.77 (10.08)
Only public 82.74 (3.68)
57.76 (11.53)
54.95 (14.05)
49.30 (8.37)
56.17 (9.63)
54.20 (11.20)
83.76 (16.35)
51.28 (6.06)
56.46 (8.28)
79.29 (11.94)
90.40 (12.57)
Neither 448.61 (7.36)
285.27 (14.00)
299.85 (22.60)
359.36 (26.40)
331.14 (19.25)
359.12 (19.27)
380.61 (18.98)
406.93 (17.39)
384.27 (18.01)
439.38 (19.57)
471.36 (22.26)
Employed
Employed 245.15 (3.05)
174.09 (6.62)
189.72 (8.86)
201.01 (9.62)
204.81 (9.24)
216.86 (9.84)
224.20 (8.25)
234.46 (8.51)
227.53 (7.85)
250.86 (8.98)
241.15 (8.40)
Not employed 375.43 (7.46)
259.96 (16.36)
241.55 (12.79)
284.94 (24.36)
280.14 (19.58)
314.67 (18.17)
322.65 (16.08)
323.97 (19.75)
338.89 (18.20)
335.29 (17.51)
403.14 (24.26)
Education level
< 12 yrs 218.01 (6.07)
169.15 (19.38)
167.38 (16.04)
223.07 (34.25)
219.15 (33.72)
237.10 (25.71)
212.92 (19.77)
207.84 (17.53)
203.55 (18.60)
241.77 (20.94)
234.19 (23.00)
12 yrs 260.40 (4.77)
188.24 (11.08)
187.47 (8.47)
202.29 (14.05)
217.88 (12.73)
203.23 (11.66)
242.41 (14.22)
237.72 (12.73)
236.10 (12.64)
254.19 (13.23)
271.53 (17.66)
> 12 yrs 287.74 (4.20)
198.37 (8.74)
211.31 (10.94)
224.94 (11.50)
221.76 (10.45)
252.05 (12.41)
251.57 (10.23)
269.75 (10.40)
266.61 (10.32)
279.74 (10.79)
287.54 (11.01)
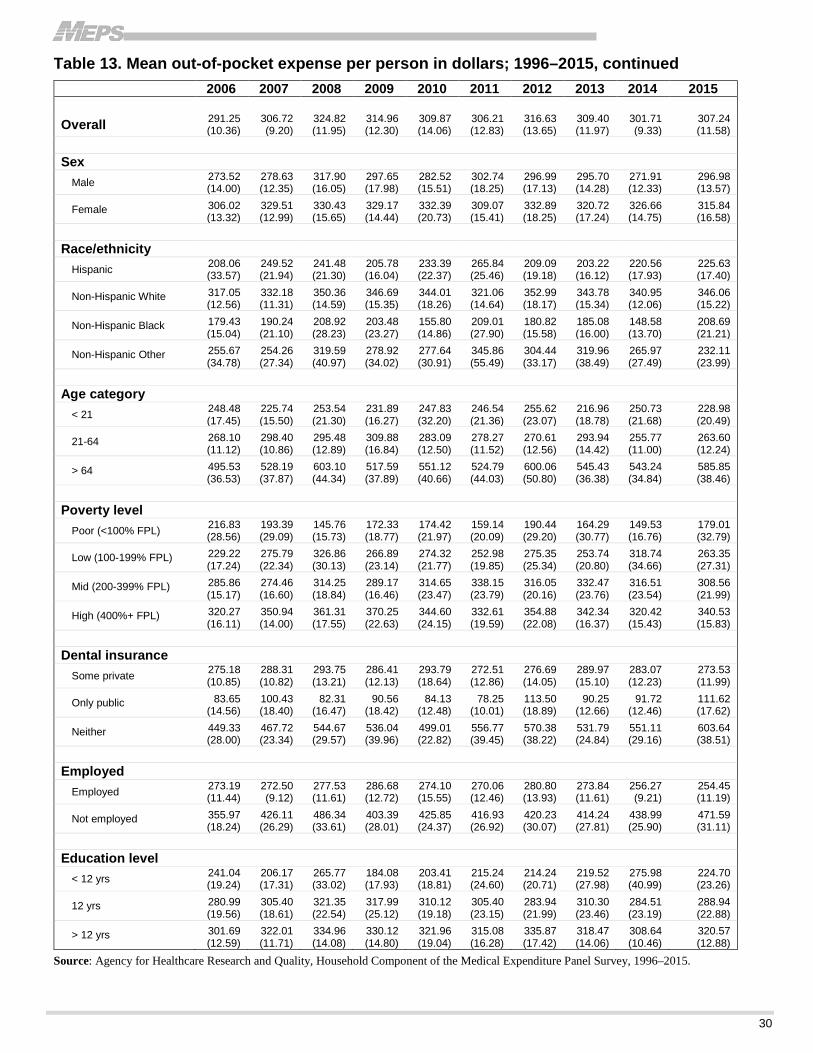
30
Table 13. Mean out-of-pocket expense per person in dollars; 1996–2015, continued
2006 2007 2008 2009 2010 2011 2012 2013 2014 2015
Overall 291.25 (10.36)
306.72 (9.20)
324.82 (11.95)
314.96 (12.30)
309.87 (14.06)
306.21 (12.83)
316.63 (13.65)
309.40 (11.97)
301.71 (9.33)
307.24 (11.58)
Sex
Male 273.52 (14.00)
278.63 (12.35)
317.90 (16.05)
297.65 (17.98)
282.52 (15.51)
302.74 (18.25)
296.99 (17.13)
295.70 (14.28)
271.91 (12.33)
296.98 (13.57)
Female 306.02 (13.32)
329.51 (12.99)
330.43 (15.65)
329.17 (14.44)
332.39 (20.73)
309.07 (15.41)
332.89 (18.25)
320.72 (17.24)
326.66 (14.75)
315.84 (16.58)
Race/ethnicity
Hispanic 208.06 (33.57)
249.52 (21.94)
241.48 (21.30)
205.78 (16.04)
233.39 (22.37)
265.84 (25.46)
209.09 (19.18)
203.22 (16.12)
220.56 (17.93)
225.63 (17.40)
Non-Hispanic White 317.05 (12.56)
332.18 (11.31)
350.36 (14.59)
346.69 (15.35)
344.01 (18.26)
321.06 (14.64)
352.99 (18.17)
343.78 (15.34)
340.95 (12.06)
346.06 (15.22)
Non-Hispanic Black 179.43 (15.04)
190.24 (21.10)
208.92 (28.23)
203.48 (23.27)
155.80 (14.86)
209.01 (27.90)
180.82 (15.58)
185.08 (16.00)
148.58 (13.70)
208.69 (21.21)
Non-Hispanic Other 255.67 (34.78)
254.26 (27.34)
319.59 (40.97)
278.92 (34.02)
277.64 (30.91)
345.86 (55.49)
304.44 (33.17)
319.96 (38.49)
265.97 (27.49)
232.11 (23.99)
Age category
< 21 248.48 (17.45)
225.74 (15.50)
253.54 (21.30)
231.89 (16.27)
247.83 (32.20)
246.54 (21.36)
255.62 (23.07)
216.96 (18.78)
250.73 (21.68)
228.98 (20.49)
21-64 268.10 (11.12)
298.40 (10.86)
295.48 (12.89)
309.88 (16.84)
283.09 (12.50)
278.27 (11.52)
270.61 (12.56)
293.94 (14.42)
255.77 (11.00)
263.60 (12.24)
> 64 495.53 (36.53)
528.19 (37.87)
603.10 (44.34)
517.59 (37.89)
551.12 (40.66)
524.79 (44.03)
600.06 (50.80)
545.43 (36.38)
543.24 (34.84)
585.85 (38.46)
Poverty level
Poor (<100% FPL) 216.83 (28.56)
193.39 (29.09)
145.76 (15.73)
172.33 (18.77)
174.42 (21.97)
159.14 (20.09)
190.44 (29.20)
164.29 (30.77)
149.53 (16.76)
179.01 (32.79)
Low (100-199% FPL) 229.22 (17.24)
275.79 (22.34)
326.86 (30.13)
266.89 (23.14)
274.32 (21.77)
252.98 (19.85)
275.35 (25.34)
253.74 (20.80)
318.74 (34.66)
263.35 (27.31)
Mid (200-399% FPL) 285.86 (15.17)
274.46 (16.60)
314.25 (18.84)
289.17 (16.46)
314.65 (23.47)
338.15 (23.79)
316.05 (20.16)
332.47 (23.76)
316.51 (23.54)
308.56 (21.99)
High (400%+ FPL) 320.27 (16.11)
350.94 (14.00)
361.31 (17.55)
370.25 (22.63)
344.60 (24.15)
332.61 (19.59)
354.88 (22.08)
342.34 (16.37)
320.42 (15.43)
340.53 (15.83)
Dental insurance
Some private 275.18 (10.85)
288.31 (10.82)
293.75 (13.21)
286.41 (12.13)
293.79 (18.64)
272.51 (12.86)
276.69 (14.05)
289.97 (15.10)
283.07 (12.23)
273.53 (11.99)
Only public 83.65 (14.56)
100.43 (18.40)
82.31 (16.47)
90.56 (18.42)
84.13 (12.48)
78.25 (10.01)
113.50 (18.89)
90.25 (12.66)
91.72 (12.46)
111.62 (17.62)
Neither 449.33 (28.00)
467.72 (23.34)
544.67 (29.57)
536.04 (39.96)
499.01 (22.82)
556.77 (39.45)
570.38 (38.22)
531.79 (24.84)
551.11 (29.16)
603.64 (38.51)
Employed
Employed 273.19 (11.44)
272.50 (9.12)
277.53 (11.61)
286.68 (12.72)
274.10 (15.55)
270.06 (12.46)
280.80 (13.93)
273.84 (11.61)
256.27 (9.21)
254.45 (11.19)
Not employed 355.97 (18.24)
426.11 (26.29)
486.34 (33.61)
403.39 (28.01)
425.85 (24.37)
416.93 (26.92)
420.23 (30.07)
414.24 (27.81)
438.99 (25.90)
471.59 (31.11)
Education level
< 12 yrs 241.04 (19.24)
206.17 (17.31)
265.77 (33.02)
184.08 (17.93)
203.41 (18.81)
215.24 (24.60)
214.24 (20.71)
219.52 (27.98)
275.98 (40.99)
224.70 (23.26)
12 yrs 280.99 (19.56)
305.40 (18.61)
321.35 (22.54)
317.99 (25.12)
310.12 (19.18)
305.40 (23.15)
283.94 (21.99)
310.30 (23.46)
284.51 (23.19)
288.94 (22.88)
> 12 yrs 301.69 (12.59)
322.01 (11.71)
334.96 (14.08)
330.12 (14.80)
321.96 (19.04)
315.08 (16.28)
335.87 (17.42)
318.47 (14.06)
308.64 (10.46)
320.57 (12.88)
Source: Agency for Healthcare Research and Quality, Household Component of the Medical Expenditure Panel Survey, 1996–2015.

31
Table 14. Mean out-of-pocket expense per person in 2015 dollars; 1996–2015 Table continues on next page
Mean Annual
1996-2015 1996 1997 1998 1999 2000 2001 2002 2003 2004 2005
Overall 326.00 (3.75)
290.71 (9.65)
296.26 (11.12)
317.74 (14.04)
313.15 (12.51)
325.69 (12.44)
327.63 (10.10)
334.42 (10.52)
324.56 (10.00)
337.68 (9.69)
337.13 (11.11)
Sex
Male 309.72 (4.58)
276.66 (13.88)
294.07 (20.47)
301.48 (19.78)
306.27 (16.43)
307.44 (14.00)
305.32 (13.77)
324.47 (15.04)
318.03 (14.31)
336.21 (14.34)
300.66 (11.76)
Female 339.35 (4.44)
302.31 (13.75)
298.06 (11.19)
330.88 (17.49)
318.68 (16.30)
340.49 (18.28)
345.58 (14.59)
342.50 (12.51)
329.86 (13.56)
338.88 (13.55)
367.20 (15.58)
Race/ethnicity
Hispanic 243.02 (6.71)
218.21 (23.07)
248.94 (23.58)
242.42 (29.22)
271.04 (26.95)
239.88 (28.88)
248.76 (18.75)
222.33 (19.76)
224.77 (18.65)
244.46 (22.30)
297.89 (26.44)
Non-Hispanic White 354.23 (4.39)
303.32 (10.68)
314.45 (13.30)
340.61 (16.70)
333.36 (14.07)
352.43 (14.28)
354.53 (12.11)
364.02 (12.37)
355.61 (12.37)
368.65 (11.75)
358.07 (13.10)
Non-Hispanic Black 193.56 (5.84)
210.85 (34.52)
189.66 (29.70)
202.19 (21.65)
175.14 (20.86)
189.92 (25.17)
158.13 (14.29)
164.26 (16.46)
154.24 (13.45)
194.63 (21.11)
222.64 (22.83)
Non-Hispanic Other 293.34 (10.35)
321.59 (61.35)
219.49 (29.67)
219.08 (37.84)
248.00 (47.02)
204.31 (32.66)
294.08 (46.48)
324.56 (41.65)
290.78 (28.77)
296.25 (32.88)
298.19 (34.49)
Age category
< 21 266.12 (5.17)
266.84 (18.79)
248.73 (16.29)
243.21 (20.20)
280.99 (25.46)
312.48 (28.19)
306.61 (21.24)
285.47 (19.80)
248.51 (15.52)
293.23 (20.13)
269.75 (17.47)
21-64 300.90 (3.76)
260.87 (10.92)
289.75 (15.90)
307.56 (14.11)
285.27 (12.65)
284.92 (12.82)
297.24 (11.71)
313.65 (11.80)
319.80 (12.05)
319.28 (12.07)
306.99 (12.93)
> 64 564.81 (11.29)
496.95 (34.36)
447.60 (26.28)
557.88 (67.74)
522.89 (44.01)
550.66 (35.03)
528.48 (35.25)
551.87 (34.57)
538.22 (34.38)
530.86 (31.90)
623.67 (36.60)
Poverty level
Poor (<100% FPL) 199.64 (7.45)
183.77 (26.95)
202.95 (30.27)
229.56 (41.00)
211.55 (25.39)
200.93 (26.42)
229.45 (36.37)
220.62 (47.60)
227.19 (28.83)
210.59 (25.17)
259.07 (35.14)
Low (100-199% FPL) 287.47 (5.91)
247.14 (19.73)
259.94 (20.03)
311.42 (39.34)
266.86 (20.61)
286.51 (30.24)
290.37 (19.68)
276.22 (20.56)
262.75 (22.35)
275.71 (20.48)
344.80 (33.89)
Mid (200-399% FPL) 320.34 (5.34)
294.48 (16.78)
270.17 (14.09)
317.06 (23.68)
304.34 (20.61)
331.04 (20.90)
317.24 (18.06)
317.51 (14.30)
312.73 (16.88)
296.31 (15.58)
344.11 (21.66)
High (400%+ FPL) 361.39 (5.40)
322.45 (15.85)
342.13 (20.61)
333.94 (17.90)
343.70 (20.01)
350.15 (17.47)
357.07 (16.27)
375.31 (16.11)
362.02 (14.94)
399.59 (17.17)
343.58 (13.57)
Dental insurance
Some private 297.15 (3.63)
261.15 (11.21)
266.21 (10.89)
276.33 (12.78)
282.39 (13.80)
296.22 (13.32)
292.57 (10.98)
304.50 (12.40)
304.82 (11.45)
308.82 (12.23)
303.12 (12.23)
Only public 94.40 (4.16)
87.26 (17.42)
81.15 (20.75)
71.68 (12.18)
79.91 (13.70)
74.60 (15.41)
112.10 (21.88)
67.56 (7.98)
72.72 (10.66)
99.49 (14.98)
109.71 (15.26)
Neither 533.42 (7.94)
430.93 (21.14)
442.80 (33.37)
522.54 (38.39)
471.10 (27.38)
494.30 (26.53)
509.37 (25.40)
536.13 (22.90)
495.00 (23.20)
551.30 (24.55)
572.05 (27.01)
Employed
Employed 292.64 (3.48)
262.98 (10.00)
280.17 (13.09)
292.29 (13.98)
291.38 (13.15)
298.49 (13.54)
300.05 (11.04)
308.90 (11.21)
293.09 (10.11)
314.76 (11.26)
292.67 (10.20)
Not employed 439.80 (8.10)
392.70 (24.71)
356.71 (18.89)
414.32 (35.42)
398.55 (27.85)
433.11 (25.01)
431.81 (21.51)
426.82 (26.02)
436.53 (23.45)
420.69 (21.98)
489.26 (29.45)
Education level
< 12 yrs 266.17 (7.56)
255.52 (29.27)
247.18 (23.68)
324.37 (49.80)
311.78 (47.98)
326.35 (35.39)
284.95 (26.46)
273.83 (23.10)
262.20 (23.96)
303.35 (26.28)
284.21 (27.91)
12 yrs 313.46 (5.48)
284.36 (16.74)
276.84 (12.51)
294.15 (20.43)
309.97 (18.10)
279.73 (16.06)
324.42 (19.03)
313.19 (16.78)
304.13 (16.28)
318.94 (16.60)
329.54 (21.43)
> 12 yrs 338.87 (4.55)
299.66 (13.21)
312.05 (16.16)
327.08 (16.72)
315.49 (14.87)
346.93 (17.08)
336.68 (13.69)
355.39 (13.70)
343.43 (13.29)
350.99 (13.54)
348.96 (13.36)
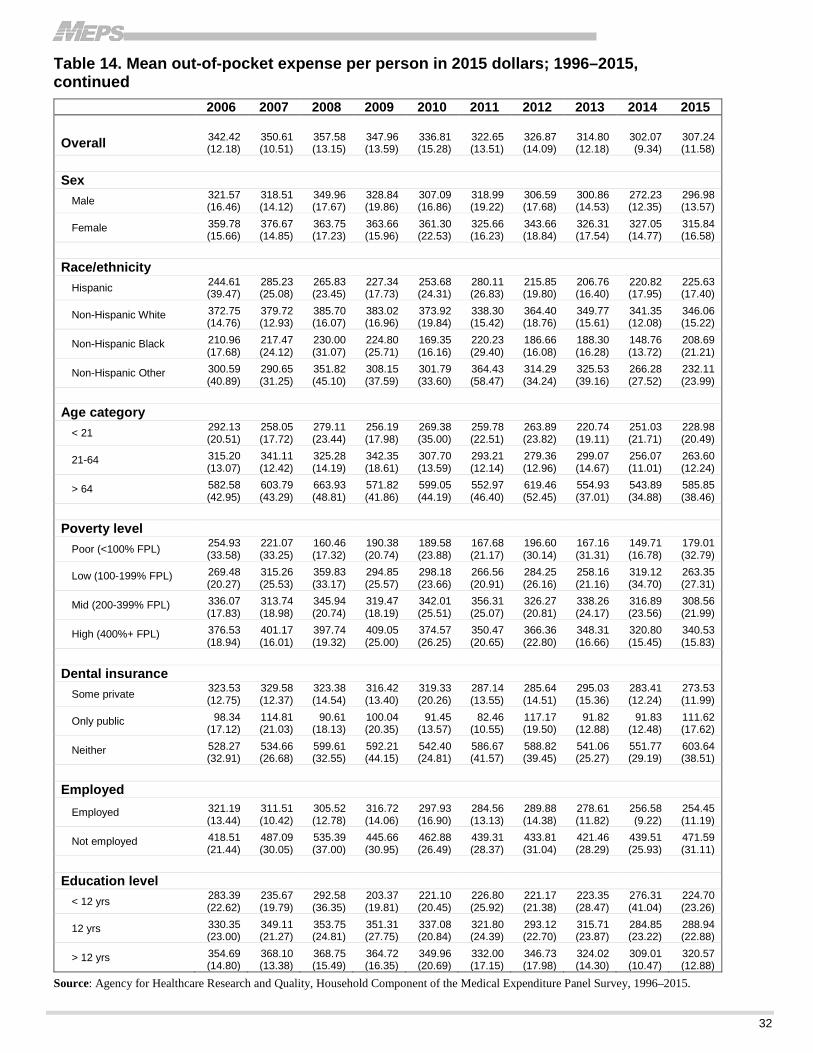
32
Table 14. Mean out-of-pocket expense per person in 2015 dollars; 1996–2015, continued
2006 2007 2008 2009 2010 2011 2012 2013 2014 2015
Overall 342.42 (12.18)
350.61 (10.51)
357.58 (13.15)
347.96 (13.59)
336.81 (15.28)
322.65 (13.51)
326.87 (14.09)
314.80 (12.18)
302.07 (9.34)
307.24 (11.58)
Sex
Male 321.57 (16.46)
318.51 (14.12)
349.96 (17.67)
328.84 (19.86)
307.09 (16.86)
318.99 (19.22)
306.59 (17.68)
300.86 (14.53)
272.23 (12.35)
296.98 (13.57)
Female 359.78 (15.66)
376.67 (14.85)
363.75 (17.23)
363.66 (15.96)
361.30 (22.53)
325.66 (16.23)
343.66 (18.84)
326.31 (17.54)
327.05 (14.77)
315.84 (16.58)
Race/ethnicity
Hispanic 244.61 (39.47)
285.23 (25.08)
265.83 (23.45)
227.34 (17.73)
253.68 (24.31)
280.11 (26.83)
215.85 (19.80)
206.76 (16.40)
220.82 (17.95)
225.63 (17.40)
Non-Hispanic White 372.75 (14.76)
379.72 (12.93)
385.70 (16.07)
383.02 (16.96)
373.92 (19.84)
338.30 (15.42)
364.40 (18.76)
349.77 (15.61)
341.35 (12.08)
346.06 (15.22)
Non-Hispanic Black 210.96 (17.68)
217.47 (24.12)
230.00 (31.07)
224.80 (25.71)
169.35 (16.16)
220.23 (29.40)
186.66 (16.08)
188.30 (16.28)
148.76 (13.72)
208.69 (21.21)
Non-Hispanic Other 300.59 (40.89)
290.65 (31.25)
351.82 (45.10)
308.15 (37.59)
301.79 (33.60)
364.43 (58.47)
314.29 (34.24)
325.53 (39.16)
266.28 (27.52)
232.11 (23.99)
Age category
< 21 292.13 (20.51)
258.05 (17.72)
279.11 (23.44)
256.19 (17.98)
269.38 (35.00)
259.78 (22.51)
263.89 (23.82)
220.74 (19.11)
251.03 (21.71)
228.98 (20.49)
21-64 315.20 (13.07)
341.11 (12.42)
325.28 (14.19)
342.35 (18.61)
307.70 (13.59)
293.21 (12.14)
279.36 (12.96)
299.07 (14.67)
256.07 (11.01)
263.60 (12.24)
> 64 582.58 (42.95)
603.79 (43.29)
663.93 (48.81)
571.82 (41.86)
599.05 (44.19)
552.97 (46.40)
619.46 (52.45)
554.93 (37.01)
543.89 (34.88)
585.85 (38.46)
Poverty level
Poor (<100% FPL) 254.93 (33.58)
221.07 (33.25)
160.46 (17.32)
190.38 (20.74)
189.58 (23.88)
167.68 (21.17)
196.60 (30.14)
167.16 (31.31)
149.71 (16.78)
179.01 (32.79)
Low (100-199% FPL) 269.48 (20.27)
315.26 (25.53)
359.83 (33.17)
294.85 (25.57)
298.18 (23.66)
266.56 (20.91)
284.25 (26.16)
258.16 (21.16)
319.12 (34.70)
263.35 (27.31)
Mid (200-399% FPL) 336.07 (17.83)
313.74 (18.98)
345.94 (20.74)
319.47 (18.19)
342.01 (25.51)
356.31 (25.07)
326.27 (20.81)
338.26 (24.17)
316.89 (23.56)
308.56 (21.99)
High (400%+ FPL) 376.53 (18.94)
401.17 (16.01)
397.74 (19.32)
409.05 (25.00)
374.57 (26.25)
350.47 (20.65)
366.36 (22.80)
348.31 (16.66)
320.80 (15.45)
340.53 (15.83)
Dental insurance
Some private 323.53 (12.75)
329.58 (12.37)
323.38 (14.54)
316.42 (13.40)
319.33 (20.26)
287.14 (13.55)
285.64 (14.51)
295.03 (15.36)
283.41 (12.24)
273.53 (11.99)
Only public 98.34 (17.12)
114.81 (21.03)
90.61 (18.13)
100.04 (20.35)
91.45 (13.57)
82.46 (10.55)
117.17 (19.50)
91.82 (12.88)
91.83 (12.48)
111.62 (17.62)
Neither 528.27 (32.91)
534.66 (26.68)
599.61 (32.55)
592.21 (44.15)
542.40 (24.81)
586.67 (41.57)
588.82 (39.45)
541.06 (25.27)
551.77 (29.19)
603.64 (38.51)
Employed
Employed 321.19 (13.44)
311.51 (10.42)
305.52 (12.78)
316.72 (14.06)
297.93 (16.90)
284.56 (13.13)
289.88 (14.38)
278.61 (11.82)
256.58 (9.22)
254.45 (11.19)
Not employed 418.51 (21.44)
487.09 (30.05)
535.39 (37.00)
445.66 (30.95)
462.88 (26.49)
439.31 (28.37)
433.81 (31.04)
421.46 (28.29)
439.51 (25.93)
471.59 (31.11)
Education level
< 12 yrs 283.39 (22.62)
235.67 (19.79)
292.58 (36.35)
203.37 (19.81)
221.10 (20.45)
226.80 (25.92)
221.17 (21.38)
223.35 (28.47)
276.31 (41.04)
224.70 (23.26)
12 yrs 330.35 (23.00)
349.11 (21.27)
353.75 (24.81)
351.31 (27.75)
337.08 (20.84)
321.80 (24.39)
293.12 (22.70)
315.71 (23.87)
284.85 (23.22)
288.94 (22.88)
> 12 yrs 354.69 (14.80)
368.10 (13.38)
368.75 (15.49)
364.72 (16.35)
349.96 (20.69)
332.00 (17.15)
346.73 (17.98)
324.02 (14.30)
309.01 (10.47)
320.57 (12.88)
Source: Agency for Healthcare Research and Quality, Household Component of the Medical Expenditure Panel Survey, 1996–2015.
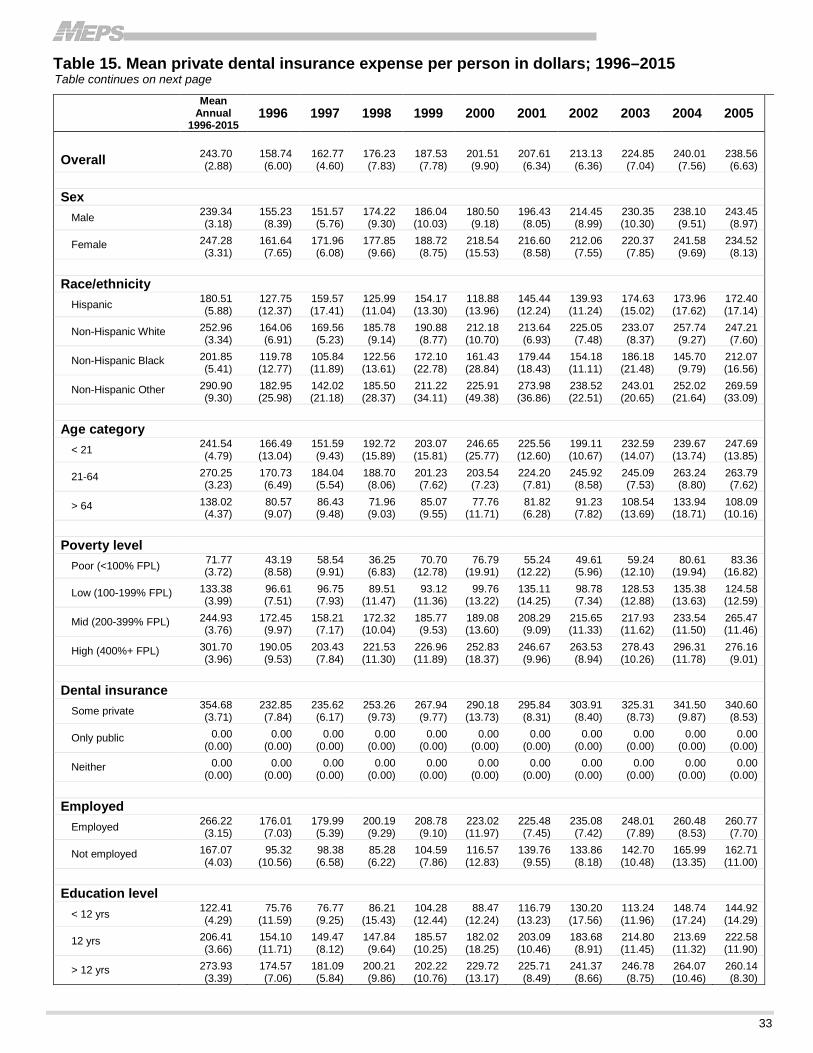
33
Table 15. Mean private dental insurance expense per person in dollars; 1996–2015 Table continues on next page
Mean Annual
1996-2015 1996 1997 1998 1999 2000 2001 2002 2003 2004 2005
Overall 243.70 (2.88)
158.74 (6.00)
162.77 (4.60)
176.23 (7.83)
187.53 (7.78)
201.51 (9.90)
207.61 (6.34)
213.13 (6.36)
224.85 (7.04)
240.01 (7.56)
238.56 (6.63)
Sex
Male 239.34 (3.18)
155.23 (8.39)
151.57 (5.76)
174.22 (9.30)
186.04 (10.03)
180.50 (9.18)
196.43 (8.05)
214.45 (8.99)
230.35 (10.30)
238.10 (9.51)
243.45 (8.97)
Female 247.28 (3.31)
161.64 (7.65)
171.96 (6.08)
177.85 (9.66)
188.72 (8.75)
218.54 (15.53)
216.60 (8.58)
212.06 (7.55)
220.37 (7.85)
241.58 (9.69)
234.52 (8.13)
Race/ethnicity
Hispanic 180.51 (5.88)
127.75 (12.37)
159.57 (17.41)
125.99 (11.04)
154.17 (13.30)
118.88 (13.96)
145.44 (12.24)
139.93 (11.24)
174.63 (15.02)
173.96 (17.62)
172.40 (17.14)
Non-Hispanic White 252.96 (3.34)
164.06 (6.91)
169.56 (5.23)
185.78 (9.14)
190.88 (8.77)
212.18 (10.70)
213.64 (6.93)
225.05 (7.48)
233.07 (8.37)
257.74 (9.27)
247.21 (7.60)
Non-Hispanic Black 201.85 (5.41)
119.78 (12.77)
105.84 (11.89)
122.56 (13.61)
172.10 (22.78)
161.43 (28.84)
179.44 (18.43)
154.18 (11.11)
186.18 (21.48)
145.70 (9.79)
212.07 (16.56)
Non-Hispanic Other 290.90 (9.30)
182.95 (25.98)
142.02 (21.18)
185.50 (28.37)
211.22 (34.11)
225.91 (49.38)
273.98 (36.86)
238.52 (22.51)
243.01 (20.65)
252.02 (21.64)
269.59 (33.09)
Age category
< 21 241.54 (4.79)
166.49 (13.04)
151.59 (9.43)
192.72 (15.89)
203.07 (15.81)
246.65 (25.77)
225.56 (12.60)
199.11 (10.67)
232.59 (14.07)
239.67 (13.74)
247.69 (13.85)
21-64 270.25 (3.23)
170.73 (6.49)
184.04 (5.54)
188.70 (8.06)
201.23 (7.62)
203.54 (7.23)
224.20 (7.81)
245.92 (8.58)
245.09 (7.53)
263.24 (8.80)
263.79 (7.62)
> 64 138.02 (4.37)
80.57 (9.07)
86.43 (9.48)
71.96 (9.03)
85.07 (9.55)
77.76 (11.71)
81.82 (6.28)
91.23 (7.82)
108.54 (13.69)
133.94 (18.71)
108.09 (10.16)
Poverty level
Poor (<100% FPL) 71.77 (3.72)
43.19 (8.58)
58.54 (9.91)
36.25 (6.83)
70.70 (12.78)
76.79 (19.91)
55.24 (12.22)
49.61 (5.96)
59.24 (12.10)
80.61 (19.94)
83.36 (16.82)
Low (100-199% FPL) 133.38 (3.99)
96.61 (7.51)
96.75 (7.93)
89.51 (11.47)
93.12 (11.36)
99.76 (13.22)
135.11 (14.25)
98.78 (7.34)
128.53 (12.88)
135.38 (13.63)
124.58 (12.59)
Mid (200-399% FPL) 244.93 (3.76)
172.45 (9.97)
158.21 (7.17)
172.32 (10.04)
185.77 (9.53)
189.08 (13.60)
208.29 (9.09)
215.65 (11.33)
217.93 (11.62)
233.54 (11.50)
265.47 (11.46)
High (400%+ FPL) 301.70 (3.96)
190.05 (9.53)
203.43 (7.84)
221.53 (11.30)
226.96 (11.89)
252.83 (18.37)
246.67 (9.96)
263.53 (8.94)
278.43 (10.26)
296.31 (11.78)
276.16 (9.01)
Dental insurance
Some private 354.68 (3.71)
232.85 (7.84)
235.62 (6.17)
253.26 (9.73)
267.94 (9.77)
290.18 (13.73)
295.84 (8.31)
303.91 (8.40)
325.31 (8.73)
341.50 (9.87)
340.60 (8.53)
Only public 0.00 (0.00)
0.00 (0.00)
0.00 (0.00)
0.00 (0.00)
0.00 (0.00)
0.00 (0.00)
0.00 (0.00)
0.00 (0.00)
0.00 (0.00)
0.00 (0.00)
0.00 (0.00)
Neither 0.00 (0.00)
0.00 (0.00)
0.00 (0.00)
0.00 (0.00)
0.00 (0.00)
0.00 (0.00)
0.00 (0.00)
0.00 (0.00)
0.00 (0.00)
0.00 (0.00)
0.00 (0.00)
Employed
Employed 266.22 (3.15)
176.01 (7.03)
179.99 (5.39)
200.19 (9.29)
208.78 (9.10)
223.02 (11.97)
225.48 (7.45)
235.08 (7.42)
248.01 (7.89)
260.48 (8.53)
260.77 (7.70)
Not employed 167.07 (4.03)
95.32 (10.56)
98.38 (6.58)
85.28 (6.22)
104.59 (7.86)
116.57 (12.83)
139.76 (9.55)
133.86 (8.18)
142.70 (10.48)
165.99 (13.35)
162.71 (11.00)
Education level
< 12 yrs 122.41 (4.29)
75.76 (11.59)
76.77 (9.25)
86.21 (15.43)
104.28 (12.44)
88.47 (12.24)
116.79 (13.23)
130.20 (17.56)
113.24 (11.96)
148.74 (17.24)
144.92 (14.29)
12 yrs 206.41 (3.66)
154.10 (11.71)
149.47 (8.12)
147.84 (9.64)
185.57 (10.25)
182.02 (18.25)
203.09 (10.46)
183.68 (8.91)
214.80 (11.45)
213.69 (11.32)
222.58 (11.90)
> 12 yrs 273.93 (3.39)
174.57 (7.06)
181.09 (5.84)
200.21 (9.86)
202.22 (10.76)
229.72 (13.17)
225.71 (8.49)
241.37 (8.66)
246.78 (8.75)
264.07 (10.46)
260.14 (8.30)
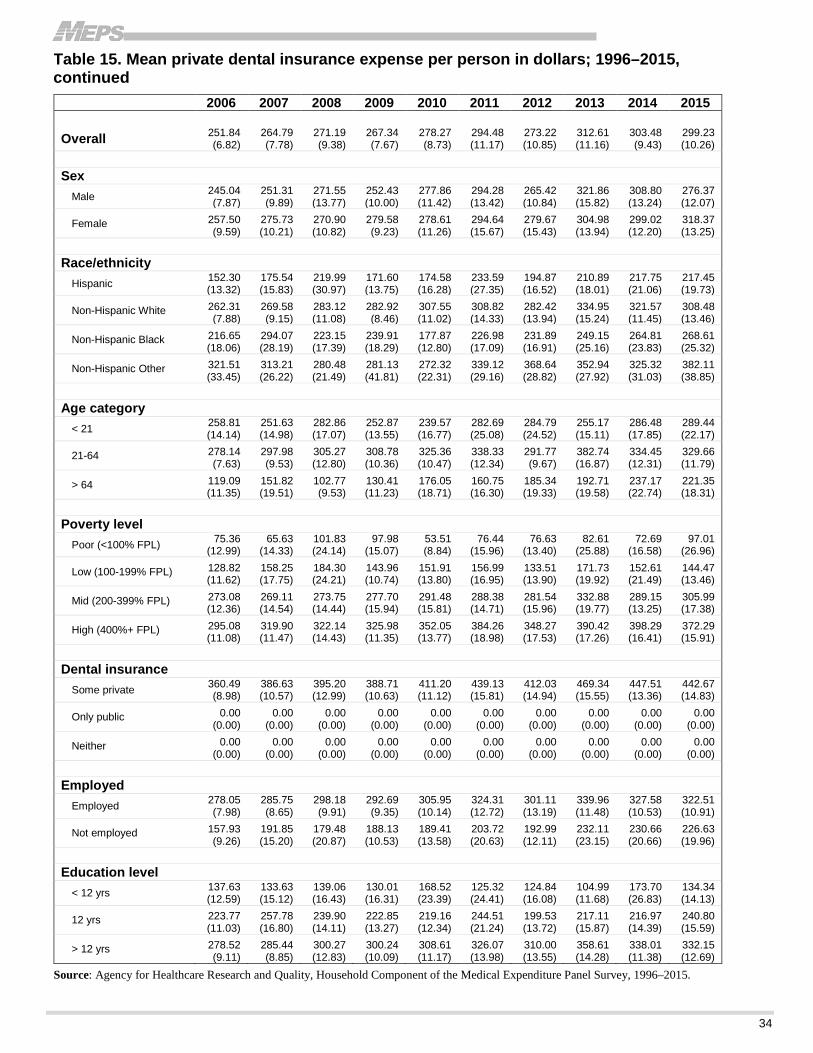
34
Table 15. Mean private dental insurance expense per person in dollars; 1996–2015, continued
2006 2007 2008 2009 2010 2011 2012 2013 2014 2015
Overall 251.84 (6.82)
264.79 (7.78)
271.19 (9.38)
267.34 (7.67)
278.27 (8.73)
294.48 (11.17)
273.22 (10.85)
312.61 (11.16)
303.48 (9.43)
299.23 (10.26)
Sex
Male 245.04 (7.87)
251.31 (9.89)
271.55 (13.77)
252.43 (10.00)
277.86 (11.42)
294.28 (13.42)
265.42 (10.84)
321.86 (15.82)
308.80 (13.24)
276.37 (12.07)
Female 257.50 (9.59)
275.73 (10.21)
270.90 (10.82)
279.58 (9.23)
278.61 (11.26)
294.64 (15.67)
279.67 (15.43)
304.98 (13.94)
299.02 (12.20)
318.37 (13.25)
Race/ethnicity
Hispanic 152.30 (13.32)
175.54 (15.83)
219.99 (30.97)
171.60 (13.75)
174.58 (16.28)
233.59 (27.35)
194.87 (16.52)
210.89 (18.01)
217.75 (21.06)
217.45 (19.73)
Non-Hispanic White 262.31 (7.88)
269.58 (9.15)
283.12 (11.08)
282.92 (8.46)
307.55 (11.02)
308.82 (14.33)
282.42 (13.94)
334.95 (15.24)
321.57 (11.45)
308.48 (13.46)
Non-Hispanic Black 216.65 (18.06)
294.07 (28.19)
223.15 (17.39)
239.91 (18.29)
177.87 (12.80)
226.98 (17.09)
231.89 (16.91)
249.15 (25.16)
264.81 (23.83)
268.61 (25.32)
Non-Hispanic Other 321.51 (33.45)
313.21 (26.22)
280.48 (21.49)
281.13 (41.81)
272.32 (22.31)
339.12 (29.16)
368.64 (28.82)
352.94 (27.92)
325.32 (31.03)
382.11 (38.85)
Age category
< 21 258.81 (14.14)
251.63 (14.98)
282.86 (17.07)
252.87 (13.55)
239.57 (16.77)
282.69 (25.08)
284.79 (24.52)
255.17 (15.11)
286.48 (17.85)
289.44 (22.17)
21-64 278.14 (7.63)
297.98 (9.53)
305.27 (12.80)
308.78 (10.36)
325.36 (10.47)
338.33 (12.34)
291.77 (9.67)
382.74 (16.87)
334.45 (12.31)
329.66 (11.79)
> 64 119.09 (11.35)
151.82 (19.51)
102.77 (9.53)
130.41 (11.23)
176.05 (18.71)
160.75 (16.30)
185.34 (19.33)
192.71 (19.58)
237.17 (22.74)
221.35 (18.31)
Poverty level
Poor (<100% FPL) 75.36 (12.99)
65.63 (14.33)
101.83 (24.14)
97.98 (15.07)
53.51 (8.84)
76.44 (15.96)
76.63 (13.40)
82.61 (25.88)
72.69 (16.58)
97.01 (26.96)
Low (100-199% FPL) 128.82 (11.62)
158.25 (17.75)
184.30 (24.21)
143.96 (10.74)
151.91 (13.80)
156.99 (16.95)
133.51 (13.90)
171.73 (19.92)
152.61 (21.49)
144.47 (13.46)
Mid (200-399% FPL) 273.08 (12.36)
269.11 (14.54)
273.75 (14.44)
277.70 (15.94)
291.48 (15.81)
288.38 (14.71)
281.54 (15.96)
332.88 (19.77)
289.15 (13.25)
305.99 (17.38)
High (400%+ FPL) 295.08 (11.08)
319.90 (11.47)
322.14 (14.43)
325.98 (11.35)
352.05 (13.77)
384.26 (18.98)
348.27 (17.53)
390.42 (17.26)
398.29 (16.41)
372.29 (15.91)
Dental insurance
Some private 360.49 (8.98)
386.63 (10.57)
395.20 (12.99)
388.71 (10.63)
411.20 (11.12)
439.13 (15.81)
412.03 (14.94)
469.34 (15.55)
447.51 (13.36)
442.67 (14.83)
Only public 0.00 (0.00)
0.00 (0.00)
0.00 (0.00)
0.00 (0.00)
0.00 (0.00)
0.00 (0.00)
0.00 (0.00)
0.00 (0.00)
0.00 (0.00)
0.00 (0.00)
Neither 0.00 (0.00)
0.00 (0.00)
0.00 (0.00)
0.00 (0.00)
0.00 (0.00)
0.00 (0.00)
0.00 (0.00)
0.00 (0.00)
0.00 (0.00)
0.00 (0.00)
Employed
Employed 278.05 (7.98)
285.75 (8.65)
298.18 (9.91)
292.69 (9.35)
305.95 (10.14)
324.31 (12.72)
301.11 (13.19)
339.96 (11.48)
327.58 (10.53)
322.51 (10.91)
Not employed 157.93 (9.26)
191.85 (15.20)
179.48 (20.87)
188.13 (10.53)
189.41 (13.58)
203.72 (20.63)
192.99 (12.11)
232.11 (23.15)
230.66 (20.66)
226.63 (19.96)
Education level
< 12 yrs 137.63 (12.59)
133.63 (15.12)
139.06 (16.43)
130.01 (16.31)
168.52 (23.39)
125.32 (24.41)
124.84 (16.08)
104.99 (11.68)
173.70 (26.83)
134.34 (14.13)
12 yrs 223.77 (11.03)
257.78 (16.80)
239.90 (14.11)
222.85 (13.27)
219.16 (12.34)
244.51 (21.24)
199.53 (13.72)
217.11 (15.87)
216.97 (14.39)
240.80 (15.59)
> 12 yrs 278.52 (9.11)
285.44 (8.85)
300.27 (12.83)
300.24 (10.09)
308.61 (11.17)
326.07 (13.98)
310.00 (13.55)
358.61 (14.28)
338.01 (11.38)
332.15 (12.69)
Source: Agency for Healthcare Research and Quality, Household Component of the Medical Expenditure Panel Survey, 1996–2015.
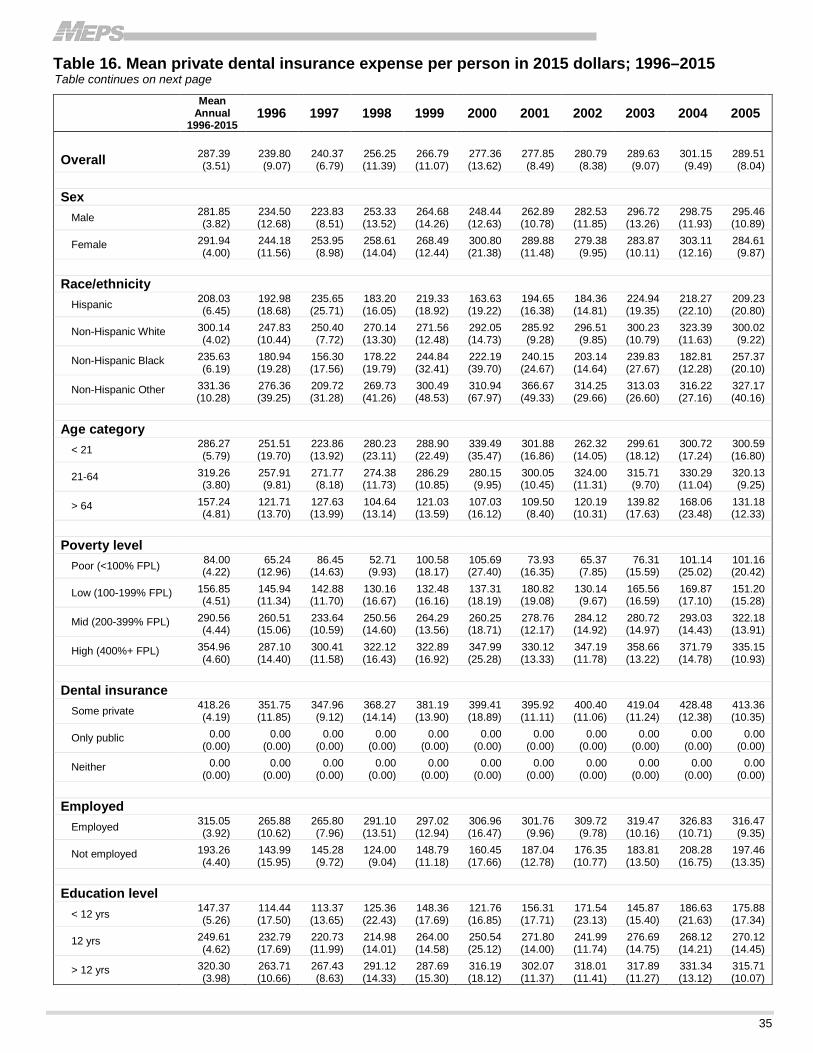
35
Table 16. Mean private dental insurance expense per person in 2015 dollars; 1996–2015 Table continues on next page
Mean Annual
1996-2015 1996 1997 1998 1999 2000 2001 2002 2003 2004 2005
Overall 287.39 (3.51)
239.80 (9.07)
240.37 (6.79)
256.25 (11.39)
266.79 (11.07)
277.36 (13.62)
277.85 (8.49)
280.79 (8.38)
289.63 (9.07)
301.15 (9.49)
289.51 (8.04)
Sex
Male 281.85 (3.82)
234.50 (12.68)
223.83 (8.51)
253.33 (13.52)
264.68 (14.26)
248.44 (12.63)
262.89 (10.78)
282.53 (11.85)
296.72 (13.26)
298.75 (11.93)
295.46 (10.89)
Female 291.94 (4.00)
244.18 (11.56)
253.95 (8.98)
258.61 (14.04)
268.49 (12.44)
300.80 (21.38)
289.88 (11.48)
279.38 (9.95)
283.87 (10.11)
303.11 (12.16)
284.61 (9.87)
Race/ethnicity
Hispanic 208.03 (6.45)
192.98 (18.68)
235.65 (25.71)
183.20 (16.05)
219.33 (18.92)
163.63 (19.22)
194.65 (16.38)
184.36 (14.81)
224.94 (19.35)
218.27 (22.10)
209.23 (20.80)
Non-Hispanic White 300.14 (4.02)
247.83 (10.44)
250.40 (7.72)
270.14 (13.30)
271.56 (12.48)
292.05 (14.73)
285.92 (9.28)
296.51 (9.85)
300.23 (10.79)
323.39 (11.63)
300.02 (9.22)
Non-Hispanic Black 235.63 (6.19)
180.94 (19.28)
156.30 (17.56)
178.22 (19.79)
244.84 (32.41)
222.19 (39.70)
240.15 (24.67)
203.14 (14.64)
239.83 (27.67)
182.81 (12.28)
257.37 (20.10)
Non-Hispanic Other 331.36 (10.28)
276.36 (39.25)
209.72 (31.28)
269.73 (41.26)
300.49 (48.53)
310.94 (67.97)
366.67 (49.33)
314.25 (29.66)
313.03 (26.60)
316.22 (27.16)
327.17 (40.16)
Age category
< 21 286.27 (5.79)
251.51 (19.70)
223.86 (13.92)
280.23 (23.11)
288.90 (22.49)
339.49 (35.47)
301.88 (16.86)
262.32 (14.05)
299.61 (18.12)
300.72 (17.24)
300.59 (16.80)
21-64 319.26 (3.80)
257.91 (9.81)
271.77 (8.18)
274.38 (11.73)
286.29 (10.85)
280.15 (9.95)
300.05 (10.45)
324.00 (11.31)
315.71 (9.70)
330.29 (11.04)
320.13 (9.25)
> 64 157.24 (4.81)
121.71 (13.70)
127.63 (13.99)
104.64 (13.14)
121.03 (13.59)
107.03 (16.12)
109.50 (8.40)
120.19 (10.31)
139.82 (17.63)
168.06 (23.48)
131.18 (12.33)
Poverty level
Poor (<100% FPL) 84.00 (4.22)
65.24 (12.96)
86.45 (14.63)
52.71 (9.93)
100.58 (18.17)
105.69 (27.40)
73.93 (16.35)
65.37 (7.85)
76.31 (15.59)
101.14 (25.02)
101.16 (20.42)
Low (100-199% FPL) 156.85 (4.51)
145.94 (11.34)
142.88 (11.70)
130.16 (16.67)
132.48 (16.16)
137.31 (18.19)
180.82 (19.08)
130.14 (9.67)
165.56 (16.59)
169.87 (17.10)
151.20 (15.28)
Mid (200-399% FPL) 290.56 (4.44)
260.51 (15.06)
233.64 (10.59)
250.56 (14.60)
264.29 (13.56)
260.25 (18.71)
278.76 (12.17)
284.12 (14.92)
280.72 (14.97)
293.03 (14.43)
322.18 (13.91)
High (400%+ FPL) 354.96 (4.60)
287.10 (14.40)
300.41 (11.58)
322.12 (16.43)
322.89 (16.92)
347.99 (25.28)
330.12 (13.33)
347.19 (11.78)
358.66 (13.22)
371.79 (14.78)
335.15 (10.93)
Dental insurance
Some private 418.26 (4.19)
351.75 (11.85)
347.96 (9.12)
368.27 (14.14)
381.19 (13.90)
399.41 (18.89)
395.92 (11.11)
400.40 (11.06)
419.04 (11.24)
428.48 (12.38)
413.36 (10.35)
Only public 0.00 (0.00)
0.00 (0.00)
0.00 (0.00)
0.00 (0.00)
0.00 (0.00)
0.00 (0.00)
0.00 (0.00)
0.00 (0.00)
0.00 (0.00)
0.00 (0.00)
0.00 (0.00)
Neither 0.00 (0.00)
0.00 (0.00)
0.00 (0.00)
0.00 (0.00)
0.00 (0.00)
0.00 (0.00)
0.00 (0.00)
0.00 (0.00)
0.00 (0.00)
0.00 (0.00)
0.00 (0.00)
Employed
Employed 315.05 (3.92)
265.88 (10.62)
265.80 (7.96)
291.10 (13.51)
297.02 (12.94)
306.96 (16.47)
301.76 (9.96)
309.72 (9.78)
319.47 (10.16)
326.83 (10.71)
316.47 (9.35)
Not employed 193.26 (4.40)
143.99 (15.95)
145.28 (9.72)
124.00 (9.04)
148.79 (11.18)
160.45 (17.66)
187.04 (12.78)
176.35 (10.77)
183.81 (13.50)
208.28 (16.75)
197.46 (13.35)
Education level
< 12 yrs 147.37 (5.26)
114.44 (17.50)
113.37 (13.65)
125.36 (22.43)
148.36 (17.69)
121.76 (16.85)
156.31 (17.71)
171.54 (23.13)
145.87 (15.40)
186.63 (21.63)
175.88 (17.34)
12 yrs 249.61 (4.62)
232.79 (17.69)
220.73 (11.99)
214.98 (14.01)
264.00 (14.58)
250.54 (25.12)
271.80 (14.00)
241.99 (11.74)
276.69 (14.75)
268.12 (14.21)
270.12 (14.45)
> 12 yrs 320.30 (3.98)
263.71 (10.66)
267.43 (8.63)
291.12 (14.33)
287.69 (15.30)
316.19 (18.12)
302.07 (11.37)
318.01 (11.41)
317.89 (11.27)
331.34 (13.12)
315.71 (10.07)
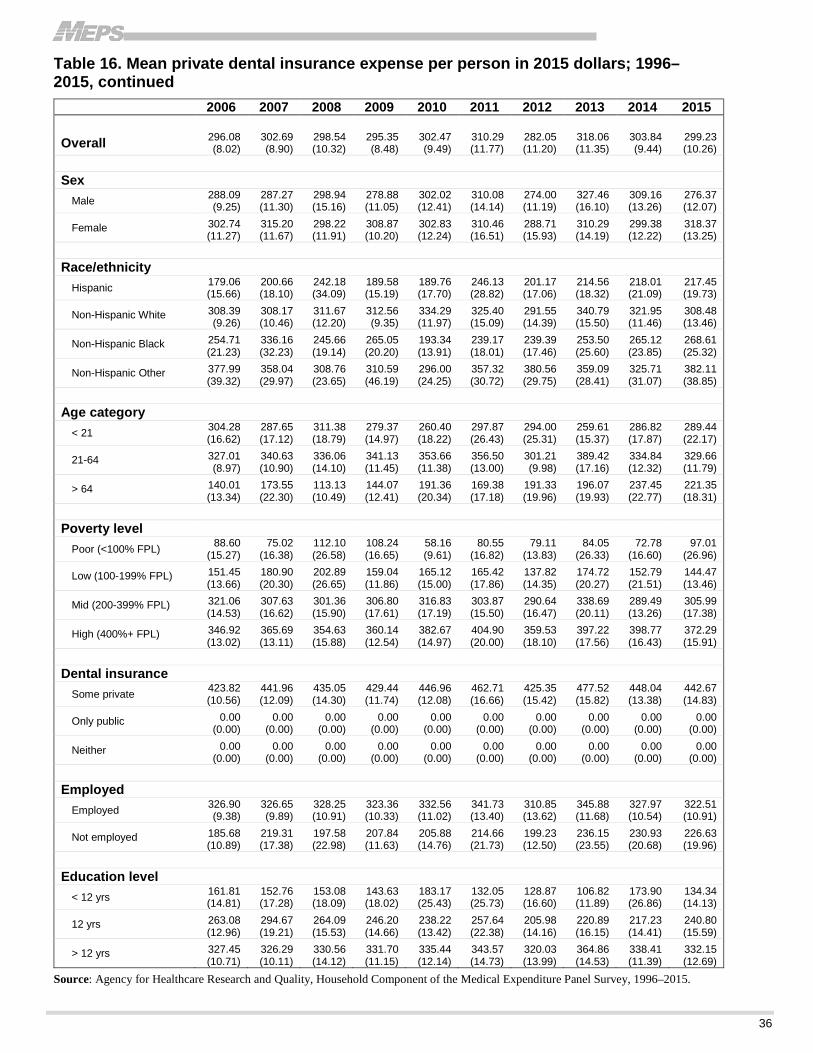
36
Table 16. Mean private dental insurance expense per person in 2015 dollars; 1996–2015, continued
2006 2007 2008 2009 2010 2011 2012 2013 2014 2015
Overall 296.08 (8.02)
302.69 (8.90)
298.54 (10.32)
295.35 (8.48)
302.47 (9.49)
310.29 (11.77)
282.05 (11.20)
318.06 (11.35)
303.84 (9.44)
299.23 (10.26)
Sex
Male 288.09 (9.25)
287.27 (11.30)
298.94 (15.16)
278.88 (11.05)
302.02 (12.41)
310.08 (14.14)
274.00 (11.19)
327.46 (16.10)
309.16 (13.26)
276.37 (12.07)
Female 302.74 (11.27)
315.20 (11.67)
298.22 (11.91)
308.87 (10.20)
302.83 (12.24)
310.46 (16.51)
288.71 (15.93)
310.29 (14.19)
299.38 (12.22)
318.37 (13.25)
Race/ethnicity
Hispanic 179.06 (15.66)
200.66 (18.10)
242.18 (34.09)
189.58 (15.19)
189.76 (17.70)
246.13 (28.82)
201.17 (17.06)
214.56 (18.32)
218.01 (21.09)
217.45 (19.73)
Non-Hispanic White 308.39 (9.26)
308.17 (10.46)
311.67 (12.20)
312.56 (9.35)
334.29 (11.97)
325.40 (15.09)
291.55 (14.39)
340.79 (15.50)
321.95 (11.46)
308.48 (13.46)
Non-Hispanic Black 254.71 (21.23)
336.16 (32.23)
245.66 (19.14)
265.05 (20.20)
193.34 (13.91)
239.17 (18.01)
239.39 (17.46)
253.50 (25.60)
265.12 (23.85)
268.61 (25.32)
Non-Hispanic Other 377.99 (39.32)
358.04 (29.97)
308.76 (23.65)
310.59 (46.19)
296.00 (24.25)
357.32 (30.72)
380.56 (29.75)
359.09 (28.41)
325.71 (31.07)
382.11 (38.85)
Age category
< 21 304.28 (16.62)
287.65 (17.12)
311.38 (18.79)
279.37 (14.97)
260.40 (18.22)
297.87 (26.43)
294.00 (25.31)
259.61 (15.37)
286.82 (17.87)
289.44 (22.17)
21-64 327.01 (8.97)
340.63 (10.90)
336.06 (14.10)
341.13 (11.45)
353.66 (11.38)
356.50 (13.00)
301.21 (9.98)
389.42 (17.16)
334.84 (12.32)
329.66 (11.79)
> 64 140.01 (13.34)
173.55 (22.30)
113.13 (10.49)
144.07 (12.41)
191.36 (20.34)
169.38 (17.18)
191.33 (19.96)
196.07 (19.93)
237.45 (22.77)
221.35 (18.31)
Poverty level
Poor (<100% FPL) 88.60 (15.27)
75.02 (16.38)
112.10 (26.58)
108.24 (16.65)
58.16 (9.61)
80.55 (16.82)
79.11 (13.83)
84.05 (26.33)
72.78 (16.60)
97.01 (26.96)
Low (100-199% FPL) 151.45 (13.66)
180.90 (20.30)
202.89 (26.65)
159.04 (11.86)
165.12 (15.00)
165.42 (17.86)
137.82 (14.35)
174.72 (20.27)
152.79 (21.51)
144.47 (13.46)
Mid (200-399% FPL) 321.06 (14.53)
307.63 (16.62)
301.36 (15.90)
306.80 (17.61)
316.83 (17.19)
303.87 (15.50)
290.64 (16.47)
338.69 (20.11)
289.49 (13.26)
305.99 (17.38)
High (400%+ FPL) 346.92 (13.02)
365.69 (13.11)
354.63 (15.88)
360.14 (12.54)
382.67 (14.97)
404.90 (20.00)
359.53 (18.10)
397.22 (17.56)
398.77 (16.43)
372.29 (15.91)
Dental insurance
Some private 423.82 (10.56)
441.96 (12.09)
435.05 (14.30)
429.44 (11.74)
446.96 (12.08)
462.71 (16.66)
425.35 (15.42)
477.52 (15.82)
448.04 (13.38)
442.67 (14.83)
Only public 0.00 (0.00)
0.00 (0.00)
0.00 (0.00)
0.00 (0.00)
0.00 (0.00)
0.00 (0.00)
0.00 (0.00)
0.00 (0.00)
0.00 (0.00)
0.00 (0.00)
Neither 0.00 (0.00)
0.00 (0.00)
0.00 (0.00)
0.00 (0.00)
0.00 (0.00)
0.00 (0.00)
0.00 (0.00)
0.00 (0.00)
0.00 (0.00)
0.00 (0.00)
Employed
Employed 326.90 (9.38)
326.65 (9.89)
328.25 (10.91)
323.36 (10.33)
332.56 (11.02)
341.73 (13.40)
310.85 (13.62)
345.88 (11.68)
327.97 (10.54)
322.51 (10.91)
Not employed 185.68 (10.89)
219.31 (17.38)
197.58 (22.98)
207.84 (11.63)
205.88 (14.76)
214.66 (21.73)
199.23 (12.50)
236.15 (23.55)
230.93 (20.68)
226.63 (19.96)
Education level
< 12 yrs 161.81 (14.81)
152.76 (17.28)
153.08 (18.09)
143.63 (18.02)
183.17 (25.43)
132.05 (25.73)
128.87 (16.60)
106.82 (11.89)
173.90 (26.86)
134.34 (14.13)
12 yrs 263.08 (12.96)
294.67 (19.21)
264.09 (15.53)
246.20 (14.66)
238.22 (13.42)
257.64 (22.38)
205.98 (14.16)
220.89 (16.15)
217.23 (14.41)
240.80 (15.59)
> 12 yrs 327.45 (10.71)
326.29 (10.11)
330.56 (14.12)
331.70 (11.15)
335.44 (12.14)
343.57 (14.73)
320.03 (13.99)
364.86 (14.53)
338.41 (11.39)
332.15 (12.69)
Source: Agency for Healthcare Research and Quality, Household Component of the Medical Expenditure Panel Survey, 1996–2015.

37
Table 17. Mean public expense per person in dollars; 1996–2015 Table continues on next page
Mean Annual
1996-2015 1996 1997 1998 1999 2000 2001 2002 2003 2004 2005
Overall 27.48 (0.95)
10.61 (1.34)
11.91 (1.21)
12.90 (1.37)
13.49 (1.80)
19.34 (4.17)
12.82 (1.15)
19.61 (2.09)
20.08 (1.96)
23.60 (2.32)
25.58 (2.63)
Sex
Male 25.71 (1.07)
10.09 (1.76)
9.95 (1.32)
12.69 (1.77)
14.02 (2.48)
20.65 (7.30)
11.94 (1.36)
17.01 (2.12)
21.34 (2.64)
18.86 (2.06)
22.79 (2.85)
Female 28.93 (1.07)
11.03 (1.51)
13.52 (1.66)
13.07 (1.64)
13.06 (2.10)
18.28 (3.61)
13.52 (1.49)
21.73 (2.71)
19.05 (2.06)
27.48 (3.39)
27.89 (3.40)
Race/ethnicity
Hispanic 60.79 (2.83)
26.89 (4.74)
35.06 (5.18)
41.76 (7.26)
24.24 (3.63)
24.60 (4.00)
30.95 (4.36)
24.03 (3.37)
20.89 (2.39)
38.78 (7.01)
29.47 (3.21)
Non-Hispanic White 18.55 (0.87)
7.78 (1.41)
8.04 (1.25)
7.02 (1.03)
10.53 (1.82)
15.38 (4.61)
8.62 (1.01)
15.82 (2.14)
16.78 (2.35)
18.60 (2.57)
21.24 (3.22)
Non-Hispanic Black 56.90 (2.70)
22.97 (4.30)
29.31 (5.19)
32.33 (4.26)
29.65 (7.52)
24.36 (4.58)
31.62 (5.64)
40.85 (6.07)
40.05 (4.46)
41.67 (6.38)
46.44 (7.04)
Non-Hispanic Other 43.64 (3.95)
14.25 (6.37)
13.61 (5.50)
43.51 (19.92)
23.22* (10.11)
89.41* (52.67)
20.86 (9.25)
37.06 (9.25)
35.87 (9.83)
36.82 (7.03)
44.06 (8.37)
Age category
< 21 58.71 (2.06)
18.68 (2.56)
26.04 (3.09)
27.62 (3.10)
26.96 (4.21)
37.70 (7.80)
30.08 (2.88)
38.42 (4.48)
42.29 (4.73)
43.70 (4.04)
51.59 (5.89)
21-64 14.96 (0.84)
7.89 (1.47)
5.87 (0.68)
7.59 (1.23)
8.62 (1.65)
13.08 (6.20)
6.11 (0.81)
12.27 (1.86)
11.53 (1.55)
14.36 (2.56)
14.26 (2.42)
> 64 9.56 (1.06)
3.36 (1.26)
6.07 (3.37)
2.07 (0.69)
4.50 (1.62)
2.27 (0.71)
2.66 (0.87)
8.89 (3.00)
5.23 (1.33)
17.06 (5.41)
14.44 (6.48)
Poverty level
Poor (<100% FPL) 150.52 (4.63)
86.54 (12.68)
119.67 (12.88)
100.57 (12.96)
90.65 (14.70)
73.44 (14.05)
85.59 (8.90)
113.79 (12.36)
131.71 (19.01)
156.75 (20.63)
151.27 (20.21)
Low (100-199% FPL) 68.93 (2.85)
14.00 (3.48)
13.11 (1.86)
32.74 (5.88)
39.10 (8.07)
70.58 (28.60)
33.84 (3.72)
52.20 (6.70)
54.67 (6.49)
53.77 (5.68)
61.99 (10.25)
Mid (200-399% FPL) 16.41 (1.02)
2.77 (1.13)
1.57 (0.44)
3.28 (0.78)
6.52 (2.33)
15.62 (6.80)
6.70 (1.34)
10.62 (1.98)
8.46 (1.33)
13.11 (2.74)
15.58 (3.70)
High (400%+ FPL) 2.09 (0.20)
0.59 (0.27)
0.73 (0.38)
0.39 (0.11)
0.68 (0.26)
1.12 (0.44)
1.10 (0.32)
3.22 (1.59)
1.41 (0.41)
1.17 (0.44)
2.11 (0.63)
Dental insurance
Some private 3.15 (0.29)
0.95 (0.40)
1.29 (0.38)
1.52 (0.42)
1.47 (0.44)
7.55 (4.56)
1.67 (0.34)
2.04 (0.50)
2.08 (0.46)
2.54 (0.50)
1.82 (0.40)
Only public 246.50 (5.61)
139.85 (15.75)
162.32 (13.42)
159.44 (14.17)
188.40 (22.51)
190.50 (26.23)
156.24 (11.73)
216.94 (19.91)
201.83 (16.71)
228.15 (19.92)
241.37 (21.38)
Neither 0.00 (0.00)
0.00 (0.00)
0.00 (0.00)
0.00 (0.00)
0.00 (0.00)
0.00 (0.00)
0.00 (0.00)
0.00 (0.00)
0.00 (0.00)
0.00 (0.00)
0.00 (0.00)
Employed
Employed 22.05 (0.85)
6.05 (0.99)
8.38 (1.13)
9.33 (1.19)
11.84 (1.93)
18.13 (4.59)
10.78 (1.03)
14.79 (1.76)
15.35 (1.84)
17.42 (1.99)
17.20 (1.84)
Not employed 45.94 (2.07)
27.37 (4.32)
25.11 (3.44)
26.42 (4.22)
19.90 (3.15)
24.13 (5.18)
20.56 (2.76)
37.06 (5.14)
36.73 (4.01)
45.97 (6.59)
54.25 (8.26)
Education level
< 12 yrs 89.82 (4.21)
53.09 (7.97)
45.18 (5.98)
60.36 (11.23)
63.50 (11.07)
74.84* (33.57)
43.73 (4.92)
61.99 (7.66)
61.82 (7.52)
71.10 (8.58)
82.56 (13.20)
12 yrs 38.48 (1.65)
12.08 (2.04)
18.17 (3.12)
17.36 (2.73)
15.60 (3.05)
20.66 (4.20)
16.28 (2.02)
22.70 (2.86)
28.21 (5.30)
33.10 (5.06)
42.28 (6.87)
> 12 yrs 15.01 (0.66)
2.93 (0.87)
4.30 (0.66)
4.46 (0.77)
4.26 (1.28)
9.62 (3.49)
5.85 (0.92)
10.94 (2.16)
9.93 (1.32)
12.64 (1.89)
9.48 (1.10)
38
Table 17. Mean public expense per person in dollars; 1996–2015, continued
2006 2007 2008 2009 2010 2011 2012 2013 2014 2015
Overall 26.49 (2.57)
26.56 (2.44)
30.15 (2.94)
32.49 (3.12)
37.81 (3.50)
36.68 (2.79)
36.09 (3.52)
38.66 (2.63)
44.79 (2.75)
58.31 (3.90)
Sex
Male 24.12 (3.71)
22.65 (2.80)
27.87 (3.31)
29.90 (3.57)
41.52 (5.58)
32.02 (3.12)
30.04 (2.79)
38.73 (3.83)
40.95 (3.11)
55.44 (5.22)
Female 28.47 (3.06)
29.73 (3.69)
32.00 (3.93)
34.62 (4.03)
34.76 (3.89)
40.52 (3.63)
41.10 (5.75)
38.60 (3.41)
48.01 (3.79)
60.72 (4.68)
Race/ethnicity
Hispanic 44.75 (4.86)
52.37 (4.91)
55.42 (12.39)
61.84 (8.12)
104.99 (12.78)
97.43 (9.26)
73.48 (6.36)
76.17 (5.12)
106.15 (8.41)
110.88 (8.33)
Non-Hispanic White 19.40 (2.90)
17.11 (1.97)
23.96 (3.25)
23.90 (3.46)
20.38 (3.23)
20.40 (2.62)
25.89 (4.45)
26.34 (3.20)
25.24 (2.78)
38.74 (4.03)
Non-Hispanic Black 64.79 (10.46)
50.96 (7.92)
44.70 (4.93)
61.40 (7.76)
88.03 (13.49)
88.18 (13.32)
69.97 (6.52)
74.07 (8.47)
95.02 (8.95)
117.91 (10.10)
Non-Hispanic Other 32.61 (6.31)
64.52* (29.30)
40.97 (13.64)
44.21 (9.93)
45.30 (8.22)
34.78 (6.76)
32.08 (6.81)
46.31 (6.96)
58.90 (8.67)
69.52 (19.20)
Age category
< 21 53.34 (5.20)
63.43 (7.35)
67.68 (8.35)
73.45 (8.49)
93.84 (9.61)
88.11 (7.50)
74.63 (5.89)
89.90 (7.26)
92.49 (5.66)
104.79 (8.36)
21-64 15.47 (3.04)
11.81 (1.67)
15.83 (3.26)
14.70 (2.09)
13.49 (2.17)
15.64 (2.25)
21.64 (5.56)
16.65 (2.49)
25.34 (2.63)
45.06 (5.07)
> 64 11.09 (3.01)
5.63 (1.76)
8.61 (3.20)
15.15 (4.50)
12.10 (5.13)
9.96 (3.82)
8.13 (2.10)
10.04 (2.20)
16.84 (5.61)
15.86 (3.52)
Poverty level
Poor (<100% FPL) 160.14 (23.34)
134.15 (13.07)
144.42 (19.64)
136.38 (12.17)
176.43 (18.07)
171.88 (12.10)
171.45 (15.67)
194.96 (19.90)
216.72 (14.56)
273.01 (28.25)
Low (100-199% FPL) 77.43 (11.35)
69.67 (8.35)
84.46 (10.09)
90.77 (11.74)
93.86 (12.37)
84.62 (10.10)
85.69 (13.69)
80.08 (6.46)
102.03 (7.76)
139.48 (12.70)
Mid (200-399% FPL) 13.95 (2.60)
22.63 (6.48)
21.02 (4.36)
24.04 (5.97)
20.12 (4.11)
23.92 (4.10)
22.50 (6.66)
24.23 (4.24)
28.48 (3.79)
44.96 (6.79)
High (400%+ FPL) 1.76 (0.53)
1.22 (0.43)
1.51 (0.48)
2.46 (0.73)
4.15 (2.46)
2.37 (1.19)
2.31 (0.75)
2.68 (0.69)
3.16 (0.63)
6.25 (1.27)
Dental insurance
Some private 1.72 (0.33)
2.61 (0.54)
2.93 (0.58)
3.29 (0.68)
3.14 (0.56)
2.86 (0.56)
3.97 (0.90)
4.12 (0.72)
6.32 (1.37)
8.41 (1.23)
Only public 253.96 (22.63)
238.58 (21.53)
272.97 (24.83)
272.64 (22.82)
294.60 (23.94)
277.55 (18.33)
259.09 (23.36)
258.61 (15.73)
275.14 (11.55)
353.45 (22.08)
Neither 0.00 (0.00)
0.00 (0.00)
0.00 (0.00)
0.00 (0.00)
0.00 (0.00)
0.00 (0.00)
0.00 (0.00)
0.00 (0.00)
0.00 (0.00)
0.00 (0.00)
Employed
Employed 20.90 (2.51)
23.19 (2.72)
24.36 (3.21)
26.27 (3.34)
30.68 (3.42)
28.70 (2.19)
30.57 (3.62)
33.17 (3.20)
35.48 (2.57)
52.19 (3.91)
Not employed 46.52 (6.42)
38.34 (5.43)
49.53 (6.67)
51.94 (6.38)
60.91 (9.00)
61.01 (7.94)
51.64 (8.59)
54.83 (5.51)
72.93 (6.63)
77.54 (8.92)
Education level
< 12 yrs 101.72 (13.28)
78.97 (9.97)
83.39 (11.88)
109.08 (16.16)
130.86 (15.16)
143.18 (13.59)
118.59 (13.21)
126.05 (13.15)
145.01 (12.49)
214.87 (35.88)
12 yrs 35.94 (4.36)
37.60 (7.30)
50.20 (7.82)
55.81 (8.46)
53.68 (7.98)
47.04 (3.98)
62.04 (10.20)
62.77 (5.93)
76.28 (7.91)
92.02 (9.24)
> 12 yrs 12.68 (2.59)
14.94 (2.11)
15.64 (2.75)
14.49 (1.86)
22.58 (3.39)
23.06 (2.83)
20.38 (3.08)
23.53 (2.61)
27.31 (2.32)
33.32 (2.90)
* Relative standard error is greater than 30 percent. Source: Agency for Healthcare Research and Quality, Household Component of the Medical Expenditure Panel Survey, 1996–2015.

39
Table 18. Mean Public Expense Per Person In 2015 Dollars; 1996–2015 Table continues on next page
Mean Annual
1996-2015 1996 1997 1998 1999 2000 2001 2002 2003 2004 2005
Overall 31.38 (1.08)
16.02 (2.02)
17.59 (1.78)
18.75 (1.99)
19.19 (2.57)
26.62 (5.74)
17.15 (1.54)
25.84 (2.76)
25.86 (2.53)
29.61 (2.92)
31.05 (3.19)
Sex
Male 29.36 (1.23)
15.25 (2.67)
14.69 (1.96)
18.45 (2.57)
19.95 (3.52)
28.42* (10.04)
15.98 (1.82)
22.41 (2.79)
27.49 (3.39)
23.67 (2.59)
27.66 (3.46)
Female 33.03 (1.21)
16.67 (2.29)
19.97 (2.45)
19.00 (2.39)
18.59 (2.99)
25.16 (4.96)
18.09 (1.99)
28.63 (3.57)
24.54 (2.65)
34.48 (4.25)
33.85 (4.12)
Race/ethnicity
Hispanic 67.43 (2.99)
40.61 (7.16)
51.77 (7.65)
60.73 (10.55)
34.48 (5.16)
33.86 (5.51)
41.42 (5.84)
31.66 (4.43)
26.91 (3.08)
48.66 (8.80)
35.77 (3.90)
Non-Hispanic White 21.48 (1.02)
11.76 (2.14)
11.87 (1.85)
10.20 (1.50)
14.99 (2.59)
21.18 (6.34)
11.53 (1.35)
20.84 (2.81)
21.62 (3.02)
23.33 (3.23)
25.77 (3.91)
Non-Hispanic Black 64.71 (2.99)
34.70 (6.49)
43.29 (7.66)
47.00 (6.19)
42.18 (10.70)
33.53 (6.30)
42.32 (7.54)
53.83 (8.00)
51.59 (5.74)
52.28 (8.01)
56.36 (8.55)
Non-Hispanic Other 49.78 (4.73)
21.53 (9.63)
20.10 (8.13)
63.27* (28.96)
33.03* (14.38)
123.06* (72.50)
27.92* (12.38)
48.83 (12.18)
46.20 (12.66)
46.20 (8.83)
53.47 (10.16)
Age category
< 21 66.83 (2.29)
28.22 (3.86)
38.45 (4.57)
40.16 (4.50)
38.35 (5.99)
51.89 (10.73)
40.25 (3.86)
50.62 (5.91)
54.48 (6.10)
54.84 (5.07)
62.61 (7.15)
21-64 17.21 (0.99)
11.92 (2.22)
8.67 (1.00)
11.03 (1.79)
12.26 (2.35)
18.01 (8.53)
8.17 (1.08)
16.17 (2.45)
14.85 (2.00)
18.02 (3.21)
17.31 (2.93)
> 64 10.86 (1.17)
5.07 (1.90)
8.96 (4.98)
3.01 (1.00)
6.40 (2.31)
3.12 (0.98)
3.56 (1.16)
11.71 (3.95)
6.73 (1.71)
21.41 (6.79)
17.52 (7.87)
Poverty level
Poor (<100% FPL) 173.28 (5.39)
130.72 (19.15)
176.72 (19.02)
146.24 (18.84)
128.97 (20.92)
101.08 (19.34)
114.54 (11.92)
149.91 (16.28)
169.66 (24.49)
196.68 (25.89)
183.58 (24.53)
Low (100-199% FPL) 78.47 (3.30)
21.15 (5.26)
19.36 (2.75)
47.61 (8.55)
55.63 (11.48)
97.15* (39.37)
45.29 (4.97)
68.77 (8.83)
70.43 (8.35)
67.47 (7.12)
75.23 (12.44)
Mid (200-399% FPL) 18.50 (1.15)
4.18 (1.70)
2.32 (0.65)
4.77 (1.13)
9.28 (3.31)
21.50 (9.36)
8.97 (1.79)
13.99 (2.60)
10.89 (1.72)
16.44 (3.44)
18.91 (4.50)
High (400%+ FPL) 2.36 (0.23)
0.89 (0.41)
1.08 (0.56)
0.57 (0.16)
0.96 (0.37)
1.54 (0.61)
1.47 (0.43)
4.24 (2.09)
1.81 (0.53)
1.47 (0.55)
2.56 (0.77)
Dental insurance
Some private 3.64 (0.37)
1.44 (0.61)
1.90 (0.56)
2.21 (0.61)
2.09 (0.62)
10.39 (6.28)
2.24 (0.46)
2.69 (0.66)
2.68 (0.59)
3.19 (0.63)
2.21 (0.48)
Only public 281.23 (6.65)
211.25 (23.79)
239.71 (19.81)
231.84 (20.60)
268.03 (32.03)
262.20 (36.10)
209.11 (15.69)
285.81 (26.23)
259.98 (21.52)
286.26 (24.99)
292.93 (25.94)
Neither 0.00 (0.00)
0.00 (0.00)
0.00 (0.00)
0.00 (0.00)
0.00 (0.00)
0.00 (0.00)
0.00 (0.00)
0.00 (0.00)
0.00 (0.00)
0.00 (0.00)
0.00 (0.00)
Employed
Employed 25.12 (0.97)
9.14 (1.49)
12.38 (1.67)
13.57 (1.72)
16.85 (2.75)
24.95 (6.32)
14.43 (1.38)
19.48 (2.31)
19.78 (2.36)
21.86 (2.50)
20.87 (2.23)
Not employed 52.68 (2.36)
41.35 (6.52)
37.08 (5.08)
38.42 (6.14)
28.31 (4.48)
33.22 (7.13)
27.52 (3.69)
48.83 (6.77)
47.32 (5.17)
57.68 (8.26)
65.84 (10.03)
Education level
< 12 yrs 105.10 (5.10)
80.20 (12.04)
66.71 (8.83)
87.77 (16.33)
90.33 (15.75)
103.01* (46.21)
58.53 (6.59)
81.67 (10.09)
79.64 (9.69)
89.21 (10.76)
100.19 (16.02)
12 yrs 44.13 (1.87)
18.25 (3.08)
26.84 (4.61)
25.24 (3.97)
22.19 (4.34)
28.43 (5.78)
21.79 (2.70)
29.91 (3.77)
36.34 (6.83)
41.53 (6.35)
51.31 (8.34)
> 12 yrs 16.74 (0.72)
4.43 (1.32)
6.35 (0.98)
6.48 (1.12)
6.07 (1.83)
13.24 (4.80)
7.83 (1.23)
14.41 (2.85)
12.79 (1.70)
15.86 (2.37)
11.50 (1.33)
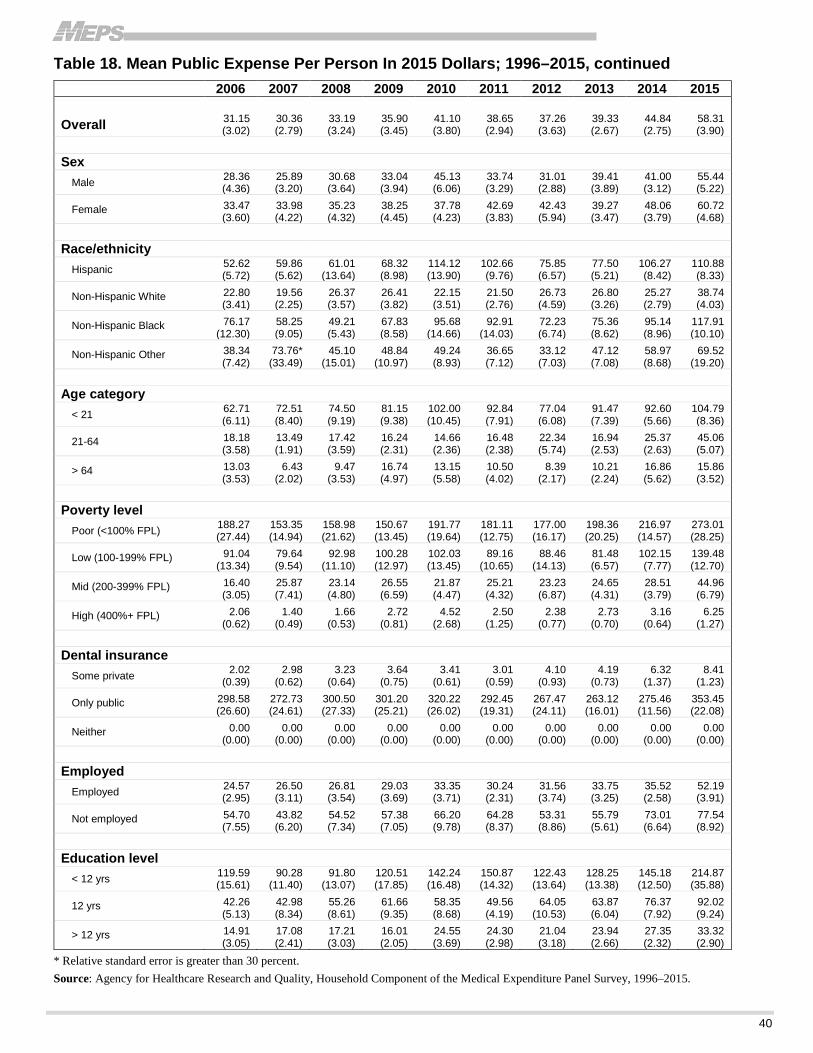
40
Table 18. Mean Public Expense Per Person In 2015 Dollars; 1996–2015, continued
2006 2007 2008 2009 2010 2011 2012 2013 2014 2015
Overall 31.15 (3.02)
30.36 (2.79)
33.19 (3.24)
35.90 (3.45)
41.10 (3.80)
38.65 (2.94)
37.26 (3.63)
39.33 (2.67)
44.84 (2.75)
58.31 (3.90)
Sex
Male 28.36 (4.36)
25.89 (3.20)
30.68 (3.64)
33.04 (3.94)
45.13 (6.06)
33.74 (3.29)
31.01 (2.88)
39.41 (3.89)
41.00 (3.12)
55.44 (5.22)
Female 33.47 (3.60)
33.98 (4.22)
35.23 (4.32)
38.25 (4.45)
37.78 (4.23)
42.69 (3.83)
42.43 (5.94)
39.27 (3.47)
48.06 (3.79)
60.72 (4.68)
Race/ethnicity
Hispanic 52.62 (5.72)
59.86 (5.62)
61.01 (13.64)
68.32 (8.98)
114.12 (13.90)
102.66 (9.76)
75.85 (6.57)
77.50 (5.21)
106.27 (8.42)
110.88 (8.33)
Non-Hispanic White 22.80 (3.41)
19.56 (2.25)
26.37 (3.57)
26.41 (3.82)
22.15 (3.51)
21.50 (2.76)
26.73 (4.59)
26.80 (3.26)
25.27 (2.79)
38.74 (4.03)
Non-Hispanic Black 76.17 (12.30)
58.25 (9.05)
49.21 (5.43)
67.83 (8.58)
95.68 (14.66)
92.91 (14.03)
72.23 (6.74)
75.36 (8.62)
95.14 (8.96)
117.91 (10.10)
Non-Hispanic Other 38.34 (7.42)
73.76* (33.49)
45.10 (15.01)
48.84 (10.97)
49.24 (8.93)
36.65 (7.12)
33.12 (7.03)
47.12 (7.08)
58.97 (8.68)
69.52 (19.20)
Age category
< 21 62.71 (6.11)
72.51 (8.40)
74.50 (9.19)
81.15 (9.38)
102.00 (10.45)
92.84 (7.91)
77.04 (6.08)
91.47 (7.39)
92.60 (5.66)
104.79 (8.36)
21-64 18.18 (3.58)
13.49 (1.91)
17.42 (3.59)
16.24 (2.31)
14.66 (2.36)
16.48 (2.38)
22.34 (5.74)
16.94 (2.53)
25.37 (2.63)
45.06 (5.07)
> 64 13.03 (3.53)
6.43 (2.02)
9.47 (3.53)
16.74 (4.97)
13.15 (5.58)
10.50 (4.02)
8.39 (2.17)
10.21 (2.24)
16.86 (5.62)
15.86 (3.52)
Poverty level
Poor (<100% FPL) 188.27 (27.44)
153.35 (14.94)
158.98 (21.62)
150.67 (13.45)
191.77 (19.64)
181.11 (12.75)
177.00 (16.17)
198.36 (20.25)
216.97 (14.57)
273.01 (28.25)
Low (100-199% FPL) 91.04 (13.34)
79.64 (9.54)
92.98 (11.10)
100.28 (12.97)
102.03 (13.45)
89.16 (10.65)
88.46 (14.13)
81.48 (6.57)
102.15 (7.77)
139.48 (12.70)
Mid (200-399% FPL) 16.40 (3.05)
25.87 (7.41)
23.14 (4.80)
26.55 (6.59)
21.87 (4.47)
25.21 (4.32)
23.23 (6.87)
24.65 (4.31)
28.51 (3.79)
44.96 (6.79)
High (400%+ FPL) 2.06 (0.62)
1.40 (0.49)
1.66 (0.53)
2.72 (0.81)
4.52 (2.68)
2.50 (1.25)
2.38 (0.77)
2.73 (0.70)
3.16 (0.64)
6.25 (1.27)
Dental insurance
Some private 2.02 (0.39)
2.98 (0.62)
3.23 (0.64)
3.64 (0.75)
3.41 (0.61)
3.01 (0.59)
4.10 (0.93)
4.19 (0.73)
6.32 (1.37)
8.41 (1.23)
Only public 298.58 (26.60)
272.73 (24.61)
300.50 (27.33)
301.20 (25.21)
320.22 (26.02)
292.45 (19.31)
267.47 (24.11)
263.12 (16.01)
275.46 (11.56)
353.45 (22.08)
Neither 0.00 (0.00)
0.00 (0.00)
0.00 (0.00)
0.00 (0.00)
0.00 (0.00)
0.00 (0.00)
0.00 (0.00)
0.00 (0.00)
0.00 (0.00)
0.00 (0.00)
Employed
Employed 24.57 (2.95)
26.50 (3.11)
26.81 (3.54)
29.03 (3.69)
33.35 (3.71)
30.24 (2.31)
31.56 (3.74)
33.75 (3.25)
35.52 (2.58)
52.19 (3.91)
Not employed 54.70 (7.55)
43.82 (6.20)
54.52 (7.34)
57.38 (7.05)
66.20 (9.78)
64.28 (8.37)
53.31 (8.86)
55.79 (5.61)
73.01 (6.64)
77.54 (8.92)
Education level
< 12 yrs 119.59 (15.61)
90.28 (11.40)
91.80 (13.07)
120.51 (17.85)
142.24 (16.48)
150.87 (14.32)
122.43 (13.64)
128.25 (13.38)
145.18 (12.50)
214.87 (35.88)
12 yrs 42.26 (5.13)
42.98 (8.34)
55.26 (8.61)
61.66 (9.35)
58.35 (8.68)
49.56 (4.19)
64.05 (10.53)
63.87 (6.04)
76.37 (7.92)
92.02 (9.24)
> 12 yrs 14.91 (3.05)
17.08 (2.41)
17.21 (3.03)
16.01 (2.05)
24.55 (3.69)
24.30 (2.98)
21.04 (3.18)
23.94 (2.66)
27.35 (2.32)
33.32 (2.90)
* Relative standard error is greater than 30 percent. Source: Agency for Healthcare Research and Quality, Household Component of the Medical Expenditure Panel Survey, 1996–2015.
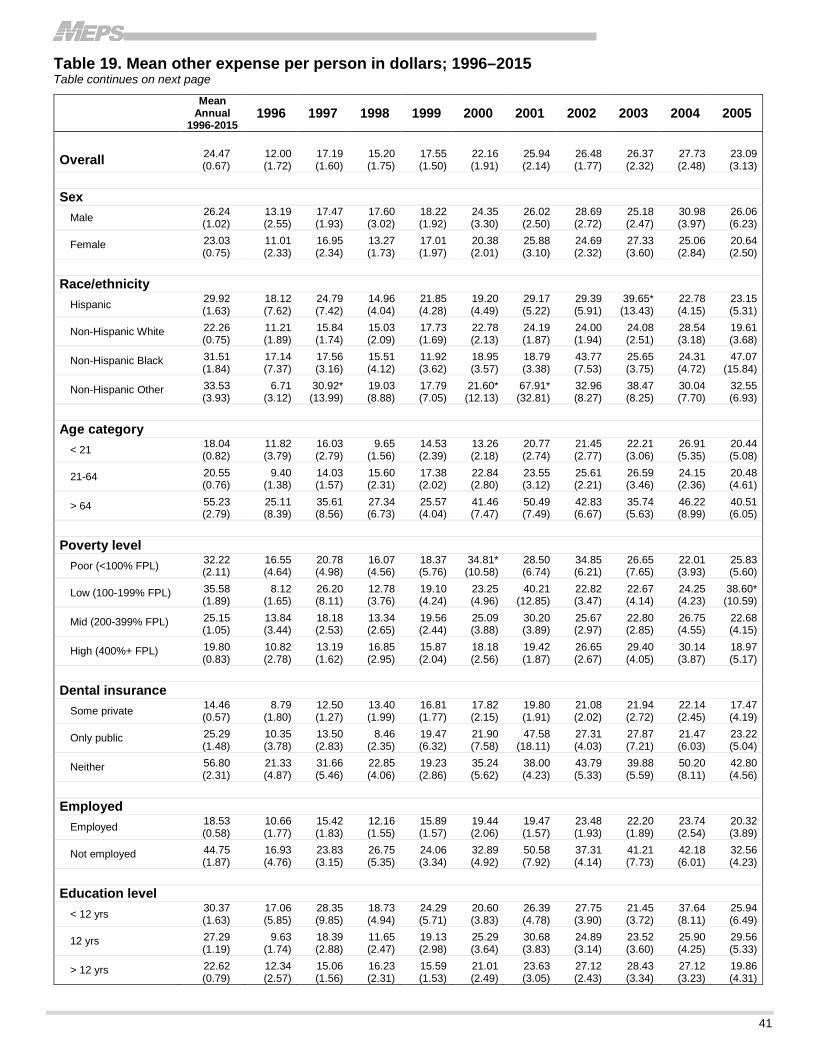
41
Table 19. Mean other expense per person in dollars; 1996–2015 Table continues on next page
Mean Annual
1996-2015 1996 1997 1998 1999 2000 2001 2002 2003 2004 2005
Overall 24.47 (0.67)
12.00 (1.72)
17.19 (1.60)
15.20 (1.75)
17.55 (1.50)
22.16 (1.91)
25.94 (2.14)
26.48 (1.77)
26.37 (2.32)
27.73 (2.48)
23.09 (3.13)
Sex
Male 26.24 (1.02)
13.19 (2.55)
17.47 (1.93)
17.60 (3.02)
18.22 (1.92)
24.35 (3.30)
26.02 (2.50)
28.69 (2.72)
25.18 (2.47)
30.98 (3.97)
26.06 (6.23)
Female 23.03 (0.75)
11.01 (2.33)
16.95 (2.34)
13.27 (1.73)
17.01 (1.97)
20.38 (2.01)
25.88 (3.10)
24.69 (2.32)
27.33 (3.60)
25.06 (2.84)
20.64 (2.50)
Race/ethnicity
Hispanic 29.92 (1.63)
18.12 (7.62)
24.79 (7.42)
14.96 (4.04)
21.85 (4.28)
19.20 (4.49)
29.17 (5.22)
29.39 (5.91)
39.65* (13.43)
22.78 (4.15)
23.15 (5.31)
Non-Hispanic White 22.26 (0.75)
11.21 (1.89)
15.84 (1.74)
15.03 (2.09)
17.73 (1.69)
22.78 (2.13)
24.19 (1.87)
24.00 (1.94)
24.08 (2.51)
28.54 (3.18)
19.61 (3.68)
Non-Hispanic Black 31.51 (1.84)
17.14 (7.37)
17.56 (3.16)
15.51 (4.12)
11.92 (3.62)
18.95 (3.57)
18.79 (3.38)
43.77 (7.53)
25.65 (3.75)
24.31 (4.72)
47.07 (15.84)
Non-Hispanic Other 33.53 (3.93)
6.71 (3.12)
30.92* (13.99)
19.03 (8.88)
17.79 (7.05)
21.60* (12.13)
67.91* (32.81)
32.96 (8.27)
38.47 (8.25)
30.04 (7.70)
32.55 (6.93)
Age category
< 21 18.04 (0.82)
11.82 (3.79)
16.03 (2.79)
9.65 (1.56)
14.53 (2.39)
13.26 (2.18)
20.77 (2.74)
21.45 (2.77)
22.21 (3.06)
26.91 (5.35)
20.44 (5.08)
21-64 20.55 (0.76)
9.40 (1.38)
14.03 (1.57)
15.60 (2.31)
17.38 (2.02)
22.84 (2.80)
23.55 (3.12)
25.61 (2.21)
26.59 (3.46)
24.15 (2.36)
20.48 (4.61)
> 64 55.23 (2.79)
25.11 (8.39)
35.61 (8.56)
27.34 (6.73)
25.57 (4.04)
41.46 (7.47)
50.49 (7.49)
42.83 (6.67)
35.74 (5.63)
46.22 (8.99)
40.51 (6.05)
Poverty level
Poor (<100% FPL) 32.22 (2.11)
16.55 (4.64)
20.78 (4.98)
16.07 (4.56)
18.37 (5.76)
34.81* (10.58)
28.50 (6.74)
34.85 (6.21)
26.65 (7.65)
22.01 (3.93)
25.83 (5.60)
Low (100-199% FPL) 35.58 (1.89)
8.12 (1.65)
26.20 (8.11)
12.78 (3.76)
19.10 (4.24)
23.25 (4.96)
40.21 (12.85)
22.82 (3.47)
22.67 (4.14)
24.25 (4.23)
38.60* (10.59)
Mid (200-399% FPL) 25.15 (1.05)
13.84 (3.44)
18.18 (2.53)
13.34 (2.65)
19.56 (2.44)
25.09 (3.88)
30.20 (3.89)
25.67 (2.97)
22.80 (2.85)
26.75 (4.55)
22.68 (4.15)
High (400%+ FPL) 19.80 (0.83)
10.82 (2.78)
13.19 (1.62)
16.85 (2.95)
15.87 (2.04)
18.18 (2.56)
19.42 (1.87)
26.65 (2.67)
29.40 (4.05)
30.14 (3.87)
18.97 (5.17)
Dental insurance
Some private 14.46 (0.57)
8.79 (1.80)
12.50 (1.27)
13.40 (1.99)
16.81 (1.77)
17.82 (2.15)
19.80 (1.91)
21.08 (2.02)
21.94 (2.72)
22.14 (2.45)
17.47 (4.19)
Only public 25.29 (1.48)
10.35 (3.78)
13.50 (2.83)
8.46 (2.35)
19.47 (6.32)
21.90 (7.58)
47.58 (18.11)
27.31 (4.03)
27.87 (7.21)
21.47 (6.03)
23.22 (5.04)
Neither 56.80 (2.31)
21.33 (4.87)
31.66 (5.46)
22.85 (4.06)
19.23 (2.86)
35.24 (5.62)
38.00 (4.23)
43.79 (5.33)
39.88 (5.59)
50.20 (8.11)
42.80 (4.56)
Employed
Employed 18.53 (0.58)
10.66 (1.77)
15.42 (1.83)
12.16 (1.55)
15.89 (1.57)
19.44 (2.06)
19.47 (1.57)
23.48 (1.93)
22.20 (1.89)
23.74 (2.54)
20.32 (3.89)
Not employed 44.75 (1.87)
16.93 (4.76)
23.83 (3.15)
26.75 (5.35)
24.06 (3.34)
32.89 (4.92)
50.58 (7.92)
37.31 (4.14)
41.21 (7.73)
42.18 (6.01)
32.56 (4.23)
Education level
< 12 yrs 30.37 (1.63)
17.06 (5.85)
28.35 (9.85)
18.73 (4.94)
24.29 (5.71)
20.60 (3.83)
26.39 (4.78)
27.75 (3.90)
21.45 (3.72)
37.64 (8.11)
25.94 (6.49)
12 yrs 27.29 (1.19)
9.63 (1.74)
18.39 (2.88)
11.65 (2.47)
19.13 (2.98)
25.29 (3.64)
30.68 (3.83)
24.89 (3.14)
23.52 (3.60)
25.90 (4.25)
29.56 (5.33)
> 12 yrs 22.62 (0.79)
12.34 (2.57)
15.06 (1.56)
16.23 (2.31)
15.59 (1.53)
21.01 (2.49)
23.63 (3.05)
27.12 (2.43)
28.43 (3.34)
27.12 (3.23)
19.86 (4.31)
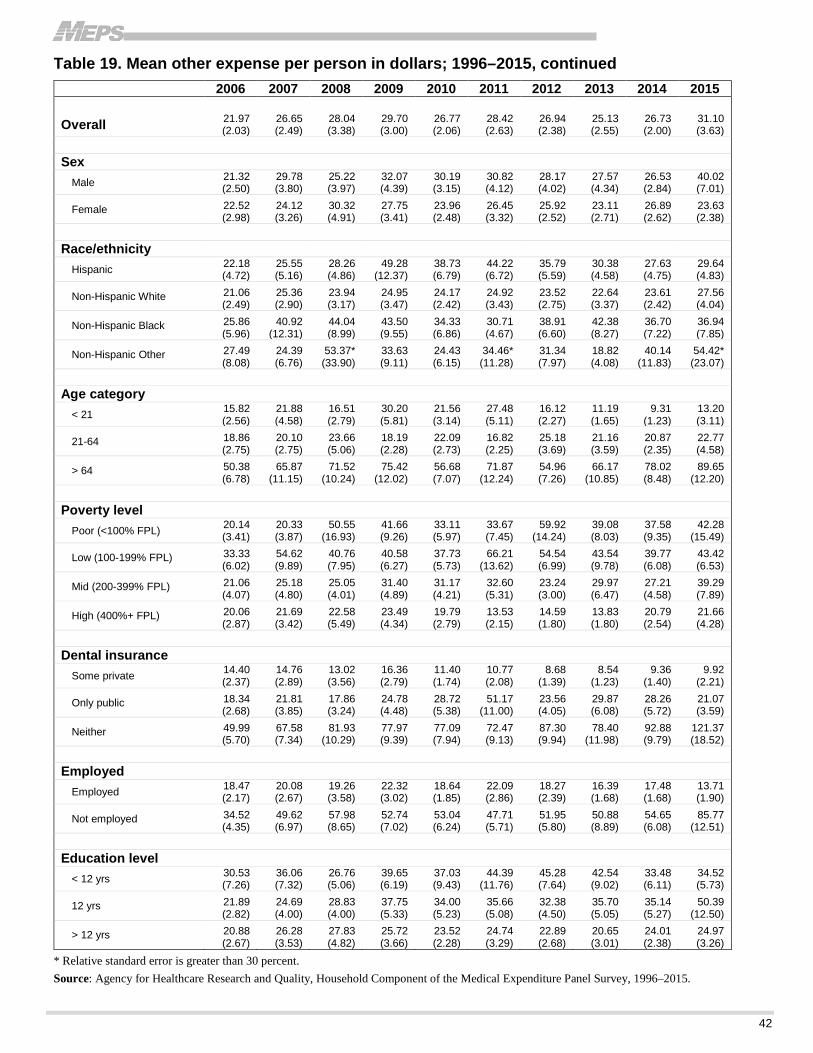
42
Table 19. Mean other expense per person in dollars; 1996–2015, continued
2006 2007 2008 2009 2010 2011 2012 2013 2014 2015
Overall 21.97 (2.03)
26.65 (2.49)
28.04 (3.38)
29.70 (3.00)
26.77 (2.06)
28.42 (2.63)
26.94 (2.38)
25.13 (2.55)
26.73 (2.00)
31.10 (3.63)
Sex
Male 21.32 (2.50)
29.78 (3.80)
25.22 (3.97)
32.07 (4.39)
30.19 (3.15)
30.82 (4.12)
28.17 (4.02)
27.57 (4.34)
26.53 (2.84)
40.02 (7.01)
Female 22.52 (2.98)
24.12 (3.26)
30.32 (4.91)
27.75 (3.41)
23.96 (2.48)
26.45 (3.32)
25.92 (2.52)
23.11 (2.71)
26.89 (2.62)
23.63 (2.38)
Race/ethnicity
Hispanic 22.18 (4.72)
25.55 (5.16)
28.26 (4.86)
49.28 (12.37)
38.73 (6.79)
44.22 (6.72)
35.79 (5.59)
30.38 (4.58)
27.63 (4.75)
29.64 (4.83)
Non-Hispanic White 21.06 (2.49)
25.36 (2.90)
23.94 (3.17)
24.95 (3.47)
24.17 (2.42)
24.92 (3.43)
23.52 (2.75)
22.64 (3.37)
23.61 (2.42)
27.56 (4.04)
Non-Hispanic Black 25.86 (5.96)
40.92 (12.31)
44.04 (8.99)
43.50 (9.55)
34.33 (6.86)
30.71 (4.67)
38.91 (6.60)
42.38 (8.27)
36.70 (7.22)
36.94 (7.85)
Non-Hispanic Other 27.49 (8.08)
24.39 (6.76)
53.37* (33.90)
33.63 (9.11)
24.43 (6.15)
34.46* (11.28)
31.34 (7.97)
18.82 (4.08)
40.14 (11.83)
54.42* (23.07)
Age category
< 21 15.82 (2.56)
21.88 (4.58)
16.51 (2.79)
30.20 (5.81)
21.56 (3.14)
27.48 (5.11)
16.12 (2.27)
11.19 (1.65)
9.31 (1.23)
13.20 (3.11)
21-64 18.86 (2.75)
20.10 (2.75)
23.66 (5.06)
18.19 (2.28)
22.09 (2.73)
16.82 (2.25)
25.18 (3.69)
21.16 (3.59)
20.87 (2.35)
22.77 (4.58)
> 64 50.38 (6.78)
65.87 (11.15)
71.52 (10.24)
75.42 (12.02)
56.68 (7.07)
71.87 (12.24)
54.96 (7.26)
66.17 (10.85)
78.02 (8.48)
89.65 (12.20)
Poverty level
Poor (<100% FPL) 20.14 (3.41)
20.33 (3.87)
50.55 (16.93)
41.66 (9.26)
33.11 (5.97)
33.67 (7.45)
59.92 (14.24)
39.08 (8.03)
37.58 (9.35)
42.28 (15.49)
Low (100-199% FPL) 33.33 (6.02)
54.62 (9.89)
40.76 (7.95)
40.58 (6.27)
37.73 (5.73)
66.21 (13.62)
54.54 (6.99)
43.54 (9.78)
39.77 (6.08)
43.42 (6.53)
Mid (200-399% FPL) 21.06 (4.07)
25.18 (4.80)
25.05 (4.01)
31.40 (4.89)
31.17 (4.21)
32.60 (5.31)
23.24 (3.00)
29.97 (6.47)
27.21 (4.58)
39.29 (7.89)
High (400%+ FPL) 20.06 (2.87)
21.69 (3.42)
22.58 (5.49)
23.49 (4.34)
19.79 (2.79)
13.53 (2.15)
14.59 (1.80)
13.83 (1.80)
20.79 (2.54)
21.66 (4.28)
Dental insurance
Some private 14.40 (2.37)
14.76 (2.89)
13.02 (3.56)
16.36 (2.79)
11.40 (1.74)
10.77 (2.08)
8.68 (1.39)
8.54 (1.23)
9.36 (1.40)
9.92 (2.21)
Only public 18.34 (2.68)
21.81 (3.85)
17.86 (3.24)
24.78 (4.48)
28.72 (5.38)
51.17 (11.00)
23.56 (4.05)
29.87 (6.08)
28.26 (5.72)
21.07 (3.59)
Neither 49.99 (5.70)
67.58 (7.34)
81.93 (10.29)
77.97 (9.39)
77.09 (7.94)
72.47 (9.13)
87.30 (9.94)
78.40 (11.98)
92.88 (9.79)
121.37 (18.52)
Employed
Employed 18.47 (2.17)
20.08 (2.67)
19.26 (3.58)
22.32 (3.02)
18.64 (1.85)
22.09 (2.86)
18.27 (2.39)
16.39 (1.68)
17.48 (1.68)
13.71 (1.90)
Not employed 34.52 (4.35)
49.62 (6.97)
57.98 (8.65)
52.74 (7.02)
53.04 (6.24)
47.71 (5.71)
51.95 (5.80)
50.88 (8.89)
54.65 (6.08)
85.77 (12.51)
Education level
< 12 yrs 30.53 (7.26)
36.06 (7.32)
26.76 (5.06)
39.65 (6.19)
37.03 (9.43)
44.39 (11.76)
45.28 (7.64)
42.54 (9.02)
33.48 (6.11)
34.52 (5.73)
12 yrs 21.89 (2.82)
24.69 (4.00)
28.83 (4.00)
37.75 (5.33)
34.00 (5.23)
35.66 (5.08)
32.38 (4.50)
35.70 (5.05)
35.14 (5.27)
50.39 (12.50)
> 12 yrs 20.88 (2.67)
26.28 (3.53)
27.83 (4.82)
25.72 (3.66)
23.52 (2.28)
24.74 (3.29)
22.89 (2.68)
20.65 (3.01)
24.01 (2.38)
24.97 (3.26)
* Relative standard error is greater than 30 percent. Source: Agency for Healthcare Research and Quality, Household Component of the Medical Expenditure Panel Survey, 1996–2015.
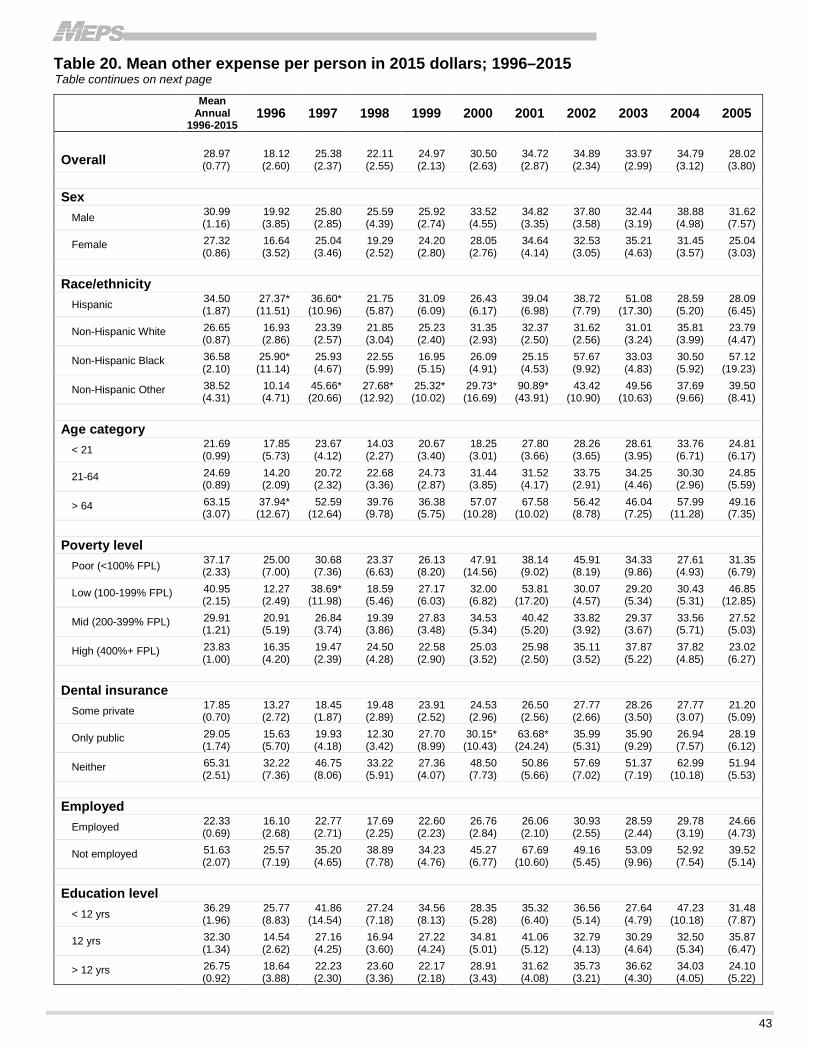
43
Table 20. Mean other expense per person in 2015 dollars; 1996–2015 Table continues on next page
Mean Annual
1996-2015 1996 1997 1998 1999 2000 2001 2002 2003 2004 2005
Overall 28.97 (0.77)
18.12 (2.60)
25.38 (2.37)
22.11 (2.55)
24.97 (2.13)
30.50 (2.63)
34.72 (2.87)
34.89 (2.34)
33.97 (2.99)
34.79 (3.12)
28.02 (3.80)
Sex
Male 30.99 (1.16)
19.92 (3.85)
25.80 (2.85)
25.59 (4.39)
25.92 (2.74)
33.52 (4.55)
34.82 (3.35)
37.80 (3.58)
32.44 (3.19)
38.88 (4.98)
31.62 (7.57)
Female 27.32 (0.86)
16.64 (3.52)
25.04 (3.46)
19.29 (2.52)
24.20 (2.80)
28.05 (2.76)
34.64 (4.14)
32.53 (3.05)
35.21 (4.63)
31.45 (3.57)
25.04 (3.03)
Race/ethnicity
Hispanic 34.50 (1.87)
27.37* (11.51)
36.60* (10.96)
21.75 (5.87)
31.09 (6.09)
26.43 (6.17)
39.04 (6.98)
38.72 (7.79)
51.08 (17.30)
28.59 (5.20)
28.09 (6.45)
Non-Hispanic White 26.65 (0.87)
16.93 (2.86)
23.39 (2.57)
21.85 (3.04)
25.23 (2.40)
31.35 (2.93)
32.37 (2.50)
31.62 (2.56)
31.01 (3.24)
35.81 (3.99)
23.79 (4.47)
Non-Hispanic Black 36.58 (2.10)
25.90* (11.14)
25.93 (4.67)
22.55 (5.99)
16.95 (5.15)
26.09 (4.91)
25.15 (4.53)
57.67 (9.92)
33.03 (4.83)
30.50 (5.92)
57.12 (19.23)
Non-Hispanic Other 38.52 (4.31)
10.14 (4.71)
45.66* (20.66)
27.68* (12.92)
25.32* (10.02)
29.73* (16.69)
90.89* (43.91)
43.42 (10.90)
49.56 (10.63)
37.69 (9.66)
39.50 (8.41)
Age category
< 21 21.69 (0.99)
17.85 (5.73)
23.67 (4.12)
14.03 (2.27)
20.67 (3.40)
18.25 (3.01)
27.80 (3.66)
28.26 (3.65)
28.61 (3.95)
33.76 (6.71)
24.81 (6.17)
21-64 24.69 (0.89)
14.20 (2.09)
20.72 (2.32)
22.68 (3.36)
24.73 (2.87)
31.44 (3.85)
31.52 (4.17)
33.75 (2.91)
34.25 (4.46)
30.30 (2.96)
24.85 (5.59)
> 64 63.15 (3.07)
37.94* (12.67)
52.59 (12.64)
39.76 (9.78)
36.38 (5.75)
57.07 (10.28)
67.58 (10.02)
56.42 (8.78)
46.04 (7.25)
57.99 (11.28)
49.16 (7.35)
Poverty level
Poor (<100% FPL) 37.17 (2.33)
25.00 (7.00)
30.68 (7.36)
23.37 (6.63)
26.13 (8.20)
47.91 (14.56)
38.14 (9.02)
45.91 (8.19)
34.33 (9.86)
27.61 (4.93)
31.35 (6.79)
Low (100-199% FPL) 40.95 (2.15)
12.27 (2.49)
38.69* (11.98)
18.59 (5.46)
27.17 (6.03)
32.00 (6.82)
53.81 (17.20)
30.07 (4.57)
29.20 (5.34)
30.43 (5.31)
46.85 (12.85)
Mid (200-399% FPL) 29.91 (1.21)
20.91 (5.19)
26.84 (3.74)
19.39 (3.86)
27.83 (3.48)
34.53 (5.34)
40.42 (5.20)
33.82 (3.92)
29.37 (3.67)
33.56 (5.71)
27.52 (5.03)
High (400%+ FPL) 23.83 (1.00)
16.35 (4.20)
19.47 (2.39)
24.50 (4.28)
22.58 (2.90)
25.03 (3.52)
25.98 (2.50)
35.11 (3.52)
37.87 (5.22)
37.82 (4.85)
23.02 (6.27)
Dental insurance
Some private 17.85 (0.70)
13.27 (2.72)
18.45 (1.87)
19.48 (2.89)
23.91 (2.52)
24.53 (2.96)
26.50 (2.56)
27.77 (2.66)
28.26 (3.50)
27.77 (3.07)
21.20 (5.09)
Only public 29.05 (1.74)
15.63 (5.70)
19.93 (4.18)
12.30 (3.42)
27.70 (8.99)
30.15* (10.43)
63.68* (24.24)
35.99 (5.31)
35.90 (9.29)
26.94 (7.57)
28.19 (6.12)
Neither 65.31 (2.51)
32.22 (7.36)
46.75 (8.06)
33.22 (5.91)
27.36 (4.07)
48.50 (7.73)
50.86 (5.66)
57.69 (7.02)
51.37 (7.19)
62.99 (10.18)
51.94 (5.53)
Employed
Employed 22.33 (0.69)
16.10 (2.68)
22.77 (2.71)
17.69 (2.25)
22.60 (2.23)
26.76 (2.84)
26.06 (2.10)
30.93 (2.55)
28.59 (2.44)
29.78 (3.19)
24.66 (4.73)
Not employed 51.63 (2.07)
25.57 (7.19)
35.20 (4.65)
38.89 (7.78)
34.23 (4.76)
45.27 (6.77)
67.69 (10.60)
49.16 (5.45)
53.09 (9.96)
52.92 (7.54)
39.52 (5.14)
Education level
< 12 yrs 36.29 (1.96)
25.77 (8.83)
41.86 (14.54)
27.24 (7.18)
34.56 (8.13)
28.35 (5.28)
35.32 (6.40)
36.56 (5.14)
27.64 (4.79)
47.23 (10.18)
31.48 (7.87)
12 yrs 32.30 (1.34)
14.54 (2.62)
27.16 (4.25)
16.94 (3.60)
27.22 (4.24)
34.81 (5.01)
41.06 (5.12)
32.79 (4.13)
30.29 (4.64)
32.50 (5.34)
35.87 (6.47)
> 12 yrs 26.75 (0.92)
18.64 (3.88)
22.23 (2.30)
23.60 (3.36)
22.17 (2.18)
28.91 (3.43)
31.62 (4.08)
35.73 (3.21)
36.62 (4.30)
34.03 (4.05)
24.10 (5.22)
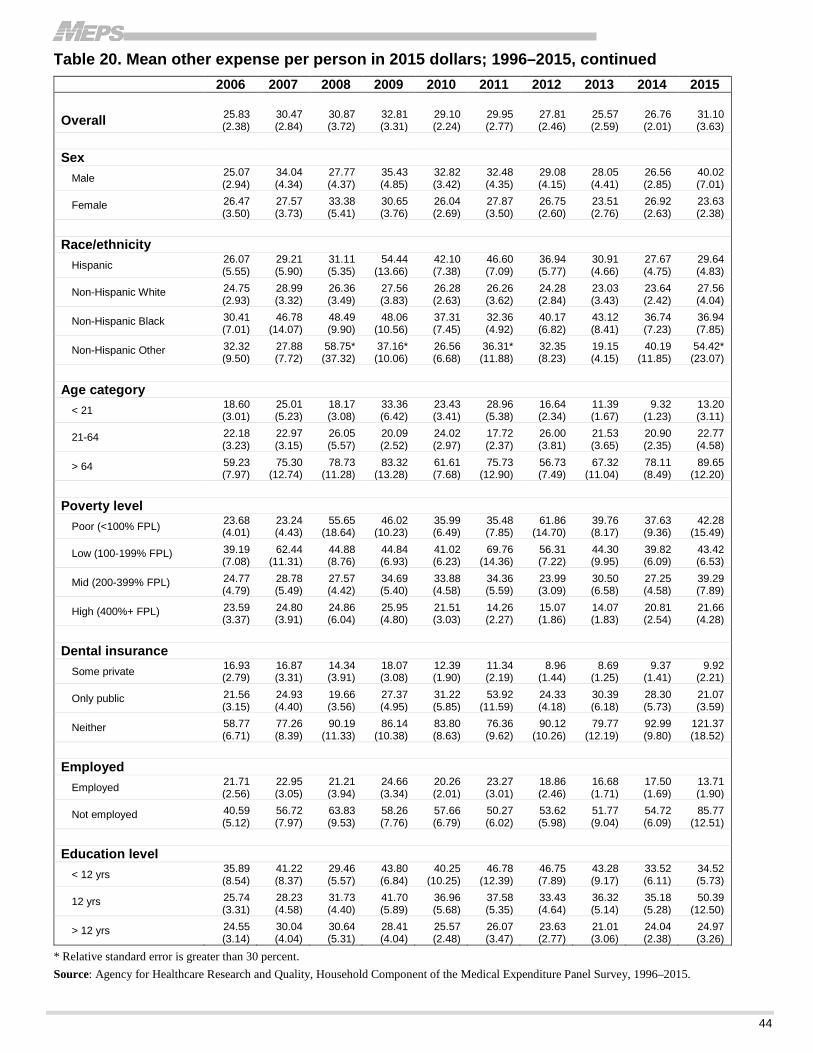
44
Table 20. Mean other expense per person in 2015 dollars; 1996–2015, continued 2006 2007 2008 2009 2010 2011 2012 2013 2014 2015
Overall 25.83 (2.38)
30.47 (2.84)
30.87 (3.72)
32.81 (3.31)
29.10 (2.24)
29.95 (2.77)
27.81 (2.46)
25.57 (2.59)
26.76 (2.01)
31.10 (3.63)
Sex
Male 25.07 (2.94)
34.04 (4.34)
27.77 (4.37)
35.43 (4.85)
32.82 (3.42)
32.48 (4.35)
29.08 (4.15)
28.05 (4.41)
26.56 (2.85)
40.02 (7.01)
Female 26.47 (3.50)
27.57 (3.73)
33.38 (5.41)
30.65 (3.76)
26.04 (2.69)
27.87 (3.50)
26.75 (2.60)
23.51 (2.76)
26.92 (2.63)
23.63 (2.38)
Race/ethnicity
Hispanic 26.07 (5.55)
29.21 (5.90)
31.11 (5.35)
54.44 (13.66)
42.10 (7.38)
46.60 (7.09)
36.94 (5.77)
30.91 (4.66)
27.67 (4.75)
29.64 (4.83)
Non-Hispanic White 24.75 (2.93)
28.99 (3.32)
26.36 (3.49)
27.56 (3.83)
26.28 (2.63)
26.26 (3.62)
24.28 (2.84)
23.03 (3.43)
23.64 (2.42)
27.56 (4.04)
Non-Hispanic Black 30.41 (7.01)
46.78 (14.07)
48.49 (9.90)
48.06 (10.56)
37.31 (7.45)
32.36 (4.92)
40.17 (6.82)
43.12 (8.41)
36.74 (7.23)
36.94 (7.85)
Non-Hispanic Other 32.32 (9.50)
27.88 (7.72)
58.75* (37.32)
37.16* (10.06)
26.56 (6.68)
36.31* (11.88)
32.35 (8.23)
19.15 (4.15)
40.19 (11.85)
54.42* (23.07)
Age category
< 21 18.60 (3.01)
25.01 (5.23)
18.17 (3.08)
33.36 (6.42)
23.43 (3.41)
28.96 (5.38)
16.64 (2.34)
11.39 (1.67)
9.32 (1.23)
13.20 (3.11)
21-64 22.18 (3.23)
22.97 (3.15)
26.05 (5.57)
20.09 (2.52)
24.02 (2.97)
17.72 (2.37)
26.00 (3.81)
21.53 (3.65)
20.90 (2.35)
22.77 (4.58)
> 64 59.23 (7.97)
75.30 (12.74)
78.73 (11.28)
83.32 (13.28)
61.61 (7.68)
75.73 (12.90)
56.73 (7.49)
67.32 (11.04)
78.11 (8.49)
89.65 (12.20)
Poverty level
Poor (<100% FPL) 23.68 (4.01)
23.24 (4.43)
55.65 (18.64)
46.02 (10.23)
35.99 (6.49)
35.48 (7.85)
61.86 (14.70)
39.76 (8.17)
37.63 (9.36)
42.28 (15.49)
Low (100-199% FPL) 39.19 (7.08)
62.44 (11.31)
44.88 (8.76)
44.84 (6.93)
41.02 (6.23)
69.76 (14.36)
56.31 (7.22)
44.30 (9.95)
39.82 (6.09)
43.42 (6.53)
Mid (200-399% FPL) 24.77 (4.79)
28.78 (5.49)
27.57 (4.42)
34.69 (5.40)
33.88 (4.58)
34.36 (5.59)
23.99 (3.09)
30.50 (6.58)
27.25 (4.58)
39.29 (7.89)
High (400%+ FPL) 23.59 (3.37)
24.80 (3.91)
24.86 (6.04)
25.95 (4.80)
21.51 (3.03)
14.26 (2.27)
15.07 (1.86)
14.07 (1.83)
20.81 (2.54)
21.66 (4.28)
Dental insurance
Some private 16.93 (2.79)
16.87 (3.31)
14.34 (3.91)
18.07 (3.08)
12.39 (1.90)
11.34 (2.19)
8.96 (1.44)
8.69 (1.25)
9.37 (1.41)
9.92 (2.21)
Only public 21.56 (3.15)
24.93 (4.40)
19.66 (3.56)
27.37 (4.95)
31.22 (5.85)
53.92 (11.59)
24.33 (4.18)
30.39 (6.18)
28.30 (5.73)
21.07 (3.59)
Neither 58.77 (6.71)
77.26 (8.39)
90.19 (11.33)
86.14 (10.38)
83.80 (8.63)
76.36 (9.62)
90.12 (10.26)
79.77 (12.19)
92.99 (9.80)
121.37 (18.52)
Employed
Employed 21.71 (2.56)
22.95 (3.05)
21.21 (3.94)
24.66 (3.34)
20.26 (2.01)
23.27 (3.01)
18.86 (2.46)
16.68 (1.71)
17.50 (1.69)
13.71 (1.90)
Not employed 40.59 (5.12)
56.72 (7.97)
63.83 (9.53)
58.26 (7.76)
57.66 (6.79)
50.27 (6.02)
53.62 (5.98)
51.77 (9.04)
54.72 (6.09)
85.77 (12.51)
Education level
< 12 yrs 35.89 (8.54)
41.22 (8.37)
29.46 (5.57)
43.80 (6.84)
40.25 (10.25)
46.78 (12.39)
46.75 (7.89)
43.28 (9.17)
33.52 (6.11)
34.52 (5.73)
12 yrs 25.74 (3.31)
28.23 (4.58)
31.73 (4.40)
41.70 (5.89)
36.96 (5.68)
37.58 (5.35)
33.43 (4.64)
36.32 (5.14)
35.18 (5.28)
50.39 (12.50)
> 12 yrs 24.55 (3.14)
30.04 (4.04)
30.64 (5.31)
28.41 (4.04)
25.57 (2.48)
26.07 (3.47)
23.63 (2.77)
21.01 (3.06)
24.04 (2.38)
24.97 (3.26)
* Relative standard error is greater than 30 percent. Source: Agency for Healthcare Research and Quality, Household Component of the Medical Expenditure Panel Survey, 1996–2015.

45
Table 21. Percent total expense paid out-of-pocket; 1996–2015 Table continues on next page
Mean Annual
1996-2015 1996 1997 1998 1999 2000 2001 2002 2003 2004 2005
Overall 48.16 (0.38)
51.48 (1.08)
51.11 (1.02)
51.68 (1.21)
50.18 (1.21)
49.34 (1.31)
49.84 (0.91)
49.47 (0.95)
48.15 (0.94)
48.02 (0.88)
49.16 (0.94)
Sex
Male 47.24 (0.46)
50.64 (1.36)
52.66 (1.79)
50.34 (1.76)
49.65 (1.73)
49.76 (1.36)
49.32 (1.24)
48.63 (1.32)
47.14 (1.35)
48.20 (1.23)
45.88 (1.21)
Female 48.87 (0.42)
52.14 (1.48)
49.93 (1.06)
52.71 (1.43)
50.59 (1.33)
49.03 (1.79)
50.21 (1.21)
50.14 (1.13)
48.98 (1.17)
47.87 (1.07)
51.67 (1.16)
Race/ethnicity
Hispanic 43.58 (0.71)
45.54 (2.81)
43.45 (2.51)
47.71 (3.46)
48.75 (2.85)
51.72 (3.31)
47.49 (2.09)
46.60 (2.46)
42.59 (2.78)
45.27 (2.89)
52.17 (3.01)
Non-Hispanic White 50.28 (0.41)
52.31 (1.17)
52.40 (1.16)
52.99 (1.38)
51.67 (1.31)
50.56 (1.36)
51.80 (1.00)
51.06 (1.07)
50.19 (1.11)
49.08 (0.98)
50.60 (1.06)
Non-Hispanic Black 36.12 (0.69)
46.61 (3.62)
45.68 (3.79)
44.93 (3.20)
36.55 (3.39)
40.26 (4.10)
33.95 (2.06)
34.30 (2.33)
32.22 (2.19)
42.29 (2.70)
37.51 (2.29)
Non-Hispanic Other 41.04 (0.96)
51.08 (5.69)
44.34 (3.40)
37.79 (4.61)
40.87 (5.38)
30.58 (4.29)
37.72 (3.43)
44.40 (3.11)
41.57 (2.94)
42.54 (2.90)
41.51 (3.05)
Age category
< 21 41.21 (0.49)
47.28 (2.00)
46.52 (1.70)
42.10 (2.07)
44.68 (2.06)
43.27 (2.74)
45.32 (1.78)
45.55 (1.83)
39.37 (1.56)
42.96 (1.64)
41.01 (1.61)
21-64 45.18 (0.39)
47.88 (1.20)
49.03 (1.49)
49.96 (1.29)
46.88 (1.31)
46.37 (1.38)
46.66 (1.09)
45.62 (1.12)
46.71 (1.13)
45.75 (1.16)
45.87 (1.13)
> 64 70.51 (0.73)
75.11 (2.28)
70.29 (2.27)
79.10 (2.35)
76.15 (2.41)
76.71 (2.27)
74.53 (1.93)
74.56 (1.97)
73.65 (2.38)
68.21 (2.61)
75.92 (1.77)
Poverty level
Poor (<100% FPL) 39.79 (1.05)
45.40 (4.55)
40.85 (4.06)
50.80 (5.29)
45.28 (3.82)
44.10 (4.09)
50.31 (4.49)
45.79 (5.72)
44.77 (4.21)
39.29 (3.13)
45.04 (4.18)
Low (100-199% FPL) 50.61 (0.70)
57.95 (2.43)
56.40 (2.42)
61.33 (3.56)
55.35 (2.89)
51.81 (4.64)
50.92 (2.22)
54.68 (2.17)
49.77 (2.73)
50.73 (2.39)
55.79 (2.73)
Mid (200-399% FPL) 48.41 (0.51)
50.77 (1.64)
50.69 (1.57)
53.58 (2.18)
50.24 (1.94)
51.14 (2.13)
49.16 (1.65)
48.89 (1.52)
49.35 (1.69)
46.35 (1.58)
48.28 (1.74)
High (400%+ FPL) 48.51 (0.47)
51.44 (1.41)
51.60 (1.60)
49.03 (1.34)
49.80 (1.66)
48.32 (1.81)
49.96 (1.33)
49.26 (1.28)
47.61 (1.24)
49.29 (1.28)
48.78 (1.17)
Dental insurance
Some private 40.19 (0.31)
41.61 (1.07)
41.95 (0.95)
41.47 (1.02)
40.95 (1.18)
40.55 (1.26)
40.79 (0.91)
41.41 (1.07)
40.38 (0.97)
40.20 (0.98)
40.97 (0.99)
Only public 23.34 (0.90)
27.78 (4.67)
23.81 (4.76)
22.70 (3.53)
21.27 (3.52)
20.33 (3.64)
29.13 (3.34)
17.35 (2.08)
19.73 (2.75)
24.11 (3.16)
25.46 (3.13)
Neither 88.76 (0.42)
93.04 (1.51)
90.45 (1.64)
94.02 (0.99)
94.51 (0.86)
91.06 (1.29)
90.92 (1.04)
90.28 (1.10)
90.60 (1.28)
89.75 (1.54)
91.68 (0.83)
Employed
Employed 44.42 (0.37)
47.46 (1.15)
48.21 (1.24)
47.55 (1.26)
46.41 (1.24)
45.42 (1.43)
46.72 (1.04)
46.17 (1.07)
44.35 (1.03)
45.40 (1.00)
44.70 (0.94)
Not employed 59.27 (0.66)
65.06 (2.24)
62.12 (1.61)
67.30 (2.12)
65.35 (2.08)
64.45 (2.01)
60.47 (1.67)
60.87 (1.78)
60.57 (1.79)
56.88 (1.86)
61.77 (1.86)
Education level
< 12 yrs 47.28 (0.90)
53.69 (3.53)
52.69 (3.40)
57.44 (4.56)
53.29 (4.39)
56.32 (5.32)
53.25 (2.91)
48.59 (2.82)
50.88 (2.77)
48.43 (2.52)
48.03 (3.20)
12 yrs 48.88 (0.54)
51.71 (1.79)
50.19 (1.51)
53.35 (2.05)
49.72 (1.78)
47.13 (2.32)
49.22 (1.66)
50.69 (1.50)
46.97 (1.69)
48.24 (1.52)
47.98 (1.71)
> 12 yrs 48.02 (0.42)
51.10 (1.29)
51.32 (1.33)
50.45 (1.50)
49.96 (1.51)
49.19 (1.57)
49.64 (1.17)
49.12 (1.20)
48.32 (1.17)
47.94 (1.12)
49.83 (1.11)

46
Table 21. Percent total expense paid out-of-pocket; 1996–2015, continued
2006 2007 2008 2009 2010 2011 2012 2013 2014 2015
Overall 49.23 (1.04)
49.10 (0.90)
49.65 (1.11)
48.87 (1.09)
47.47 (1.16)
45.99 (1.18)
48.50 (1.30)
45.12 (1.05)
44.59 (0.85)
44.15 (1.10)
Sex
Male 48.50 (1.36)
47.84 (1.27)
49.48 (1.64)
48.63 (1.69)
44.70 (1.35)
45.88 (1.62)
47.85 (1.65)
43.24 (1.45)
41.95 (1.19)
44.40 (1.40)
Female 49.80 (1.28)
49.99 (1.16)
49.79 (1.26)
49.05 (1.24)
49.63 (1.54)
46.08 (1.58)
48.99 (1.59)
46.66 (1.33)
46.63 (1.22)
43.95 (1.38)
Race/ethnicity
Hispanic 48.69 (4.28)
49.61 (2.38)
44.30 (3.35)
42.12 (2.28)
42.30 (2.32)
41.47 (2.27)
40.74 (2.01)
39.03 (1.98)
38.55 (2.04)
38.66 (1.86)
Non-Hispanic White 51.15 (1.16)
51.56 (1.02)
51.42 (1.27)
51.10 (1.22)
49.42 (1.38)
47.55 (1.40)
51.54 (1.60)
47.24 (1.22)
47.93 (0.99)
48.01 (1.32)
Non-Hispanic Black 36.86 (1.92)
33.02 (3.02)
40.11 (3.09)
37.11 (2.54)
34.16 (2.56)
37.67 (3.24)
34.67 (1.94)
33.61 (1.95)
27.26 (1.54)
33.01 (2.29)
Non-Hispanic Other 40.12 (3.35)
38.74 (2.98)
46.02 (3.50)
43.73 (2.45)
44.80 (3.09)
45.86 (4.46)
41.34 (2.77)
43.35 (3.11)
38.53 (2.59)
31.44 (2.94)
Age category
< 21 43.10 (1.87)
40.12 (1.63)
40.86 (2.11)
39.41 (1.68)
41.11 (2.98)
38.23 (1.78)
40.50 (1.79)
37.85 (1.88)
39.24 (1.77)
35.98 (1.96)
21-64 46.18 (1.13)
47.49 (0.99)
46.15 (1.23)
47.56 (1.34)
43.96 (1.18)
42.87 (1.18)
44.42 (1.39)
41.14 (1.32)
40.19 (1.22)
39.87 (1.25)
> 64 73.29 (1.96)
70.28 (2.69)
76.73 (1.60)
70.08 (2.27)
69.24 (2.22)
68.39 (2.61)
70.72 (2.47)
66.98 (2.25)
62.07 (2.15)
64.19 (2.16)
Poverty level
Poor (<100% FPL) 45.89 (3.93)
46.77 (3.97)
32.94 (3.44)
38.44 (2.86)
39.87 (3.43)
36.07 (3.14)
38.21 (3.88)
34.16 (4.58)
31.38 (2.32)
30.27 (4.47)
Low (100-199% FPL) 48.89 (2.39)
49.40 (2.86)
51.36 (2.18)
49.22 (2.59)
49.18 (2.39)
45.11 (2.56)
50.15 (2.74)
46.21 (2.61)
51.98 (2.88)
44.58 (3.09)
Mid (200-399% FPL) 48.13 (1.49)
46.41 (1.63)
49.56 (1.81)
46.47 (1.56)
47.86 (2.08)
49.51 (1.97)
49.13 (2.39)
46.20 (2.10)
47.86 (2.08)
44.16 (2.13)
High (400%+ FPL) 50.26 (1.45)
50.59 (1.13)
51.07 (1.44)
51.27 (1.57)
47.82 (1.80)
45.39 (1.71)
49.29 (1.65)
45.69 (1.36)
43.15 (1.28)
45.97 (1.31)
Dental insurance
Some private 42.22 (1.02)
41.65 (0.93)
41.67 (1.12)
41.22 (1.01)
40.83 (1.45)
37.57 (1.05)
39.45 (1.09)
37.56 (1.16)
37.93 (1.01)
37.24 (1.00)
Only public 23.50 (3.46)
27.83 (4.05)
22.06 (3.83)
23.34 (3.95)
20.65 (2.91)
19.23 (2.17)
28.65 (3.69)
23.83 (2.67)
23.21 (2.38)
22.96 (3.02)
Neither 89.99 (1.16)
87.37 (1.40)
86.92 (1.51)
87.30 (1.52)
86.62 (1.33)
88.48 (1.58)
86.73 (1.53)
87.15 (1.76)
85.58 (1.54)
83.26 (2.45)
Employed
Employed 46.26 (1.14)
45.30 (0.94)
44.81 (1.23)
45.65 (1.11)
43.55 (1.32)
41.86 (1.27)
44.52 (1.28)
41.28 (1.15)
40.24 (0.94)
39.60 (1.09)
Not employed 59.83 (1.70)
60.36 (1.97)
62.89 (2.15)
57.94 (2.03)
58.40 (1.92)
57.16 (2.06)
58.63 (2.26)
55.08 (2.07)
55.06 (2.03)
54.54 (2.26)
Education level
< 12 yrs 47.18 (2.62)
45.33 (2.69)
51.61 (3.24)
39.77 (2.80)
37.68 (2.69)
40.75 (3.23)
42.60 (2.71)
44.52 (3.44)
43.93 (3.49)
36.42 (3.11)
12 yrs 49.95 (1.92)
48.83 (1.66)
50.19 (1.81)
50.12 (2.25)
50.27 (1.69)
48.28 (1.94)
49.13 (2.11)
49.58 (2.04)
46.42 (2.38)
42.81 (2.22)
> 12 yrs 49.15 (1.19)
49.64 (1.09)
49.35 (1.35)
49.23 (1.25)
47.58 (1.46)
45.73 (1.45)
48.74 (1.55)
44.15 (1.19)
44.22 (0.95)
45.22 (1.13)
Source: Agency for Healthcare Research and Quality, Household Component of the Medical Expenditure Panel Survey, 1996–2015.
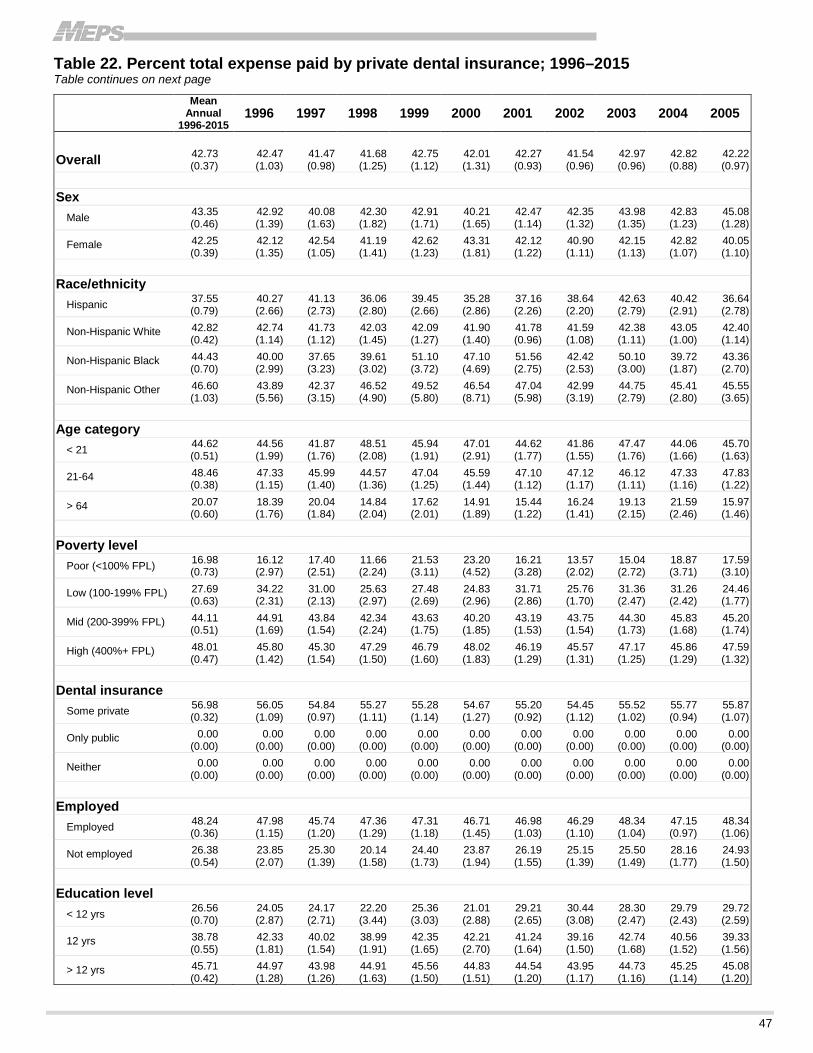
47
Table 22. Percent total expense paid by private dental insurance; 1996–2015 Table continues on next page
Mean Annual
1996-2015 1996 1997 1998 1999 2000 2001 2002 2003 2004 2005
Overall 42.73 (0.37)
42.47 (1.03)
41.47 (0.98)
41.68 (1.25)
42.75 (1.12)
42.01 (1.31)
42.27 (0.93)
41.54 (0.96)
42.97 (0.96)
42.82 (0.88)
42.22 (0.97)
Sex
Male 43.35 (0.46)
42.92 (1.39)
40.08 (1.63)
42.30 (1.82)
42.91 (1.71)
40.21 (1.65)
42.47 (1.14)
42.35 (1.32)
43.98 (1.35)
42.83 (1.23)
45.08 (1.28)
Female 42.25 (0.39)
42.12 (1.35)
42.54 (1.05)
41.19 (1.41)
42.62 (1.23)
43.31 (1.81)
42.12 (1.22)
40.90 (1.11)
42.15 (1.13)
42.82 (1.07)
40.05 (1.10)
Race/ethnicity
Hispanic 37.55 (0.79)
40.27 (2.66)
41.13 (2.73)
36.06 (2.80)
39.45 (2.66)
35.28 (2.86)
37.16 (2.26)
38.64 (2.20)
42.63 (2.79)
40.42 (2.91)
36.64 (2.78)
Non-Hispanic White 42.82 (0.42)
42.74 (1.14)
41.73 (1.12)
42.03 (1.45)
42.09 (1.27)
41.90 (1.40)
41.78 (0.96)
41.59 (1.08)
42.38 (1.11)
43.05 (1.00)
42.40 (1.14)
Non-Hispanic Black 44.43 (0.70)
40.00 (2.99)
37.65 (3.23)
39.61 (3.02)
51.10 (3.72)
47.10 (4.69)
51.56 (2.75)
42.42 (2.53)
50.10 (3.00)
39.72 (1.87)
43.36 (2.70)
Non-Hispanic Other 46.60 (1.03)
43.89 (5.56)
42.37 (3.15)
46.52 (4.90)
49.52 (5.80)
46.54 (8.71)
47.04 (5.98)
42.99 (3.19)
44.75 (2.79)
45.41 (2.80)
45.55 (3.65)
Age category
< 21 44.62 (0.51)
44.56 (1.99)
41.87 (1.76)
48.51 (2.08)
45.94 (1.91)
47.01 (2.91)
44.62 (1.77)
41.86 (1.55)
47.47 (1.76)
44.06 (1.66)
45.70 (1.63)
21-64 48.46 (0.38)
47.33 (1.15)
45.99 (1.40)
44.57 (1.36)
47.04 (1.25)
45.59 (1.44)
47.10 (1.12)
47.12 (1.17)
46.12 (1.11)
47.33 (1.16)
47.83 (1.22)
> 64 20.07 (0.60)
18.39 (1.76)
20.04 (1.84)
14.84 (2.04)
17.62 (2.01)
14.91 (1.89)
15.44 (1.22)
16.24 (1.41)
19.13 (2.15)
21.59 (2.46)
15.97 (1.46)
Poverty level
Poor (<100% FPL) 16.98 (0.73)
16.12 (2.97)
17.40 (2.51)
11.66 (2.24)
21.53 (3.11)
23.20 (4.52)
16.21 (3.28)
13.57 (2.02)
15.04 (2.72)
18.87 (3.71)
17.59 (3.10)
Low (100-199% FPL) 27.69 (0.63)
34.22 (2.31)
31.00 (2.13)
25.63 (2.97)
27.48 (2.69)
24.83 (2.96)
31.71 (2.86)
25.76 (1.70)
31.36 (2.47)
31.26 (2.42)
24.46 (1.77)
Mid (200-399% FPL) 44.11 (0.51)
44.91 (1.69)
43.84 (1.54)
42.34 (2.24)
43.63 (1.75)
40.20 (1.85)
43.19 (1.53)
43.75 (1.54)
44.30 (1.73)
45.83 (1.68)
45.20 (1.74)
High (400%+ FPL) 48.01 (0.47)
45.80 (1.42)
45.30 (1.54)
47.29 (1.50)
46.79 (1.60)
48.02 (1.83)
46.19 (1.29)
45.57 (1.31)
47.17 (1.25)
45.86 (1.29)
47.59 (1.32)
Dental insurance
Some private 56.98 (0.32)
56.05 (1.09)
54.84 (0.97)
55.27 (1.11)
55.28 (1.14)
54.67 (1.27)
55.20 (0.92)
54.45 (1.12)
55.52 (1.02)
55.77 (0.94)
55.87 (1.07)
Only public 0.00 (0.00)
0.00 (0.00)
0.00 (0.00)
0.00 (0.00)
0.00 (0.00)
0.00 (0.00)
0.00 (0.00)
0.00 (0.00)
0.00 (0.00)
0.00 (0.00)
0.00 (0.00)
Neither 0.00 (0.00)
0.00 (0.00)
0.00 (0.00)
0.00 (0.00)
0.00 (0.00)
0.00 (0.00)
0.00 (0.00)
0.00 (0.00)
0.00 (0.00)
0.00 (0.00)
0.00 (0.00)
Employed
Employed 48.24 (0.36)
47.98 (1.15)
45.74 (1.20)
47.36 (1.29)
47.31 (1.18)
46.71 (1.45)
46.98 (1.03)
46.29 (1.10)
48.34 (1.04)
47.15 (0.97)
48.34 (1.06)
Not employed 26.38 (0.54)
23.85 (2.07)
25.30 (1.39)
20.14 (1.58)
24.40 (1.73)
23.87 (1.94)
26.19 (1.55)
25.15 (1.39)
25.50 (1.49)
28.16 (1.77)
24.93 (1.50)
Education level
< 12 yrs 26.56 (0.70)
24.05 (2.87)
24.17 (2.71)
22.20 (3.44)
25.36 (3.03)
21.01 (2.88)
29.21 (2.65)
30.44 (3.08)
28.30 (2.47)
29.79 (2.43)
29.72 (2.59)
12 yrs 38.78 (0.55)
42.33 (1.81)
40.02 (1.54)
38.99 (1.91)
42.35 (1.65)
42.21 (2.70)
41.24 (1.64)
39.16 (1.50)
42.74 (1.68)
40.56 (1.52)
39.33 (1.56)
> 12 yrs 45.71 (0.42)
44.97 (1.28)
43.98 (1.26)
44.91 (1.63)
45.56 (1.50)
44.83 (1.51)
44.54 (1.20)
43.95 (1.17)
44.73 (1.16)
45.25 (1.14)
45.08 (1.20)

48
Table 22. Percent total expense paid by private dental insurance; 1996–2015, continued
2006 2007 2008 2009 2010 2011 2012 2013 2014 2015
Overall 42.57 (1.01)
42.39 (0.86)
41.45 (1.04)
41.48 (1.01)
42.63 (1.10)
44.23 (1.11)
41.85 (1.30)
45.58 (0.97)
44.85 (0.81)
43.00 (1.03)
Sex
Male 43.45 (1.26)
43.15 (1.18)
42.26 (1.52)
41.24 (1.54)
43.96 (1.32)
44.60 (1.49)
42.77 (1.56)
47.06 (1.47)
47.64 (1.15)
41.32 (1.47)
Female 41.90 (1.28)
41.84 (1.09)
40.82 (1.21)
41.66 (1.18)
41.60 (1.43)
43.93 (1.58)
41.15 (1.58)
44.37 (1.22)
42.68 (1.19)
44.31 (1.23)
Race/ethnicity
Hispanic 35.64 (3.45)
34.90 (2.40)
40.35 (3.65)
35.13 (2.48)
31.64 (2.18)
36.44 (2.61)
37.97 (2.14)
40.50 (2.15)
38.06 (2.51)
37.26 (2.20)
Non-Hispanic White 42.32 (1.15)
41.85 (1.00)
41.55 (1.17)
41.70 (1.15)
44.18 (1.31)
45.74 (1.34)
41.24 (1.59)
46.03 (1.21)
45.20 (0.99)
42.79 (1.30)
Non-Hispanic Black 44.51 (2.28)
51.04 (2.71)
42.85 (2.87)
43.76 (2.42)
39.01 (2.36)
40.91 (2.79)
44.46 (2.11)
45.24 (2.70)
48.58 (2.12)
42.49 (2.39)
Non-Hispanic Other 50.45 (3.88)
47.72 (3.15)
40.39 (3.51)
44.07 (2.92)
43.94 (2.83)
44.96 (3.97)
50.05 (2.60)
47.82 (3.02)
47.13 (2.68)
51.77 (3.80)
Age category
< 21 44.90 (1.75)
44.72 (1.64)
45.58 (1.99)
42.98 (1.81)
39.74 (2.23)
43.84 (1.86)
45.12 (1.91)
44.51 (1.60)
44.83 (1.66)
45.48 (2.00)
21-64 47.91 (1.11)
47.43 (0.98)
47.68 (1.18)
47.39 (1.25)
50.52 (1.25)
52.13 (1.20)
47.89 (1.37)
53.57 (1.29)
52.55 (1.16)
49.87 (1.29)
> 64 17.61 (1.61)
20.20 (2.19)
13.07 (1.13)
17.66 (1.62)
22.12 (1.96)
20.95 (2.12)
21.84 (2.22)
23.66 (2.06)
27.10 (2.09)
24.25 (1.81)
Poverty level
Poor (<100% FPL) 15.95 (2.47)
15.87 (2.85)
23.01 (4.46)
21.85 (2.66)
12.23 (1.86)
17.33 (3.09)
15.37 (2.39)
17.18 (4.68)
15.25 (2.73)
16.41 (4.11)
Low (100-199% FPL) 27.48 (2.08)
28.34 (2.34)
28.96 (2.47)
26.55 (1.81)
27.23 (2.16)
27.99 (2.17)
24.31 (2.19)
31.27 (2.76)
24.89 (2.71)
24.46 (2.09)
Mid (200-399% FPL) 45.98 (1.49)
45.51 (1.59)
43.17 (1.79)
44.62 (1.73)
44.34 (1.96)
42.22 (1.80)
43.76 (2.39)
46.26 (1.97)
43.72 (2.05)
43.79 (2.05)
High (400%+ FPL) 46.31 (1.49)
46.11 (1.18)
45.53 (1.46)
45.14 (1.54)
48.86 (1.73)
52.44 (1.72)
48.37 (1.63)
52.11 (1.40)
53.63 (1.24)
50.26 (1.31)
Dental insurance
Some private 55.31 (1.01)
55.85 (0.91)
56.06 (1.13)
55.95 (1.02)
57.15 (1.44)
60.55 (1.03)
58.75 (1.08)
60.80 (1.16)
59.97 (1.03)
60.27 (1.00)
Only public 0.00 (0.00)
0.00 (0.00)
0.00 (0.00)
0.00 (0.00)
0.00 (0.00)
0.00 (0.00)
0.00 (0.00)
0.00 (0.00)
0.00 (0.00)
0.00 (0.00)
Neither 0.00 (0.00)
0.00 (0.00)
0.00 (0.00)
0.00 (0.00)
0.00 (0.00)
0.00 (0.00)
0.00 (0.00)
0.00 (0.00)
0.00 (0.00)
0.00 (0.00)
Employed
Employed 47.08 (1.15)
47.51 (0.97)
48.15 (1.18)
46.61 (1.13)
48.61 (1.26)
50.27 (1.17)
47.74 (1.33)
51.25 (1.14)
51.44 (0.95)
50.32 (1.04)
Not employed 26.55 (1.36)
27.18 (1.66)
23.21 (2.12)
27.02 (1.59)
25.97 (1.55)
27.93 (2.05)
26.92 (1.70)
30.86 (2.07)
28.93 (1.97)
26.20 (2.00)
Education level
< 12 yrs 26.94 (2.06)
29.38 (2.60)
27.00 (2.37)
28.09 (2.79)
31.22 (3.13)
23.73 (3.78)
24.82 (2.44)
21.29 (2.21)
27.65 (3.04)
21.95 (2.22)
12 yrs 39.77 (1.80)
41.21 (1.60)
37.47 (1.45)
35.13 (1.86)
35.52 (1.68)
38.65 (2.00)
34.53 (1.94)
34.69 (1.79)
35.40 (2.01)
36.33 (2.01)
> 12 yrs 45.38 (1.23)
44.00 (1.04)
44.24 (1.34)
44.77 (1.30)
45.61 (1.38)
47.33 (1.35)
44.98 (1.56)
49.72 (1.16)
48.43 (0.96)
46.72 (1.14)
Source: Agency for Healthcare Research and Quality, Household Component of the Medical Expenditure Panel Survey, 1996–2015.

49
Table 23. Percent total expense paid by public coverage; 1996–2015 Table continues on next page
Mean Annual
1996-2015 1996 1997 1998 1999 2000 2001 2002 2003 2004 2005
Overall 4.82 (0.16)
2.84 (0.35)
3.03 (0.31)
3.05 (0.34)
3.07 (0.40)
4.03 (0.86)
2.61 (0.24)
3.82 (0.42)
3.84 (0.39)
4.21 (0.42)
4.53 (0.47)
Sex
Male 4.66 (0.19)
2.79 (0.50)
2.63 (0.36)
3.08 (0.45)
3.23 (0.55)
4.60 (1.55)
2.58 (0.31)
3.36 (0.43)
4.07 (0.51)
3.39 (0.38)
4.22 (0.55)
Female 4.94 (0.18)
2.87 (0.38)
3.34 (0.42)
3.03 (0.40)
2.95 (0.48)
3.62 (0.76)
2.63 (0.29)
4.19 (0.52)
3.64 (0.42)
4.87 (0.60)
4.76 (0.58)
Race/ethnicity
Hispanic 12.64 (0.68)
8.48 (1.59)
9.04 (1.50)
11.95 (2.00)
6.20 (1.00)
7.30 (1.21)
7.91 (1.17)
6.64 (0.99)
5.10 (0.68)
9.01 (1.64)
6.26 (0.82)
Non-Hispanic White 3.14 (0.15)
2.03 (0.36)
1.98 (0.31)
1.59 (0.25)
2.32 (0.40)
3.04 (0.89)
1.69 (0.20)
2.92 (0.40)
3.05 (0.43)
3.11 (0.43)
3.64 (0.55)
Non-Hispanic Black 12.52 (0.60)
7.67 (1.77)
10.43 (2.01)
10.45 (1.65)
8.80 (2.33)
7.11 (1.51)
9.09 (1.70)
11.24 (1.69)
10.78 (1.48)
11.36 (1.88)
9.50 (1.63)
Non-Hispanic Other 6.99 (0.66)
3.42 (1.54)
4.06 (1.77)
10.91 (4.89)
5.44 (2.36)
18.42* (10.49)
3.58 (1.57)
6.68 (1.69)
6.60 (1.83)
6.63 (1.33)
7.44 (1.50)
Age category
< 21 10.84 (0.40)
5.00 (0.72)
7.19 (0.89)
6.95 (0.88)
6.10 (0.96)
7.19 (1.55)
5.95 (0.61)
8.08 (1.02)
8.63 (0.99)
8.03 (0.76)
9.52 (1.13)
21-64 2.68 (0.15)
2.19 (0.40)
1.47 (0.18)
1.79 (0.30)
2.01 (0.39)
2.93 (1.35)
1.28 (0.17)
2.35 (0.36)
2.17 (0.29)
2.58 (0.46)
2.59 (0.44)
> 64 1.39 (0.15)
0.77 (0.29)
1.41 (0.78)
0.43 (0.15)
0.93 (0.34)
0.44 (0.13)
0.50 (0.17)
1.58 (0.54)
0.92 (0.24)
2.75 (0.85)
2.13 (0.94)
Poverty level
Poor (<100% FPL) 35.61 (1.10)
32.30 (4.51)
35.57 (4.28)
32.36 (4.73)
27.60 (4.39)
22.19 (4.43)
25.12 (3.06)
31.11 (4.11)
33.43 (4.42)
36.69 (4.39)
31.92 (4.06)
Low (100-199% FPL) 14.31 (0.56)
4.96 (1.26)
4.20 (0.63)
9.38 (1.82)
11.54 (2.32)
17.57 (6.00)
7.94 (0.91)
13.61 (1.75)
13.34 (1.72)
12.41 (1.33)
12.17 (2.07)
Mid (200-399% FPL) 2.96 (0.18)
0.72 (0.30)
0.44 (0.12)
0.81 (0.20)
1.53 (0.55)
3.32 (1.40)
1.39 (0.28)
2.15 (0.39)
1.72 (0.27)
2.57 (0.54)
2.65 (0.63)
High (400%+ FPL) 0.33 (0.03)
0.14 (0.06)
0.16 (0.08)
0.08 (0.02)
0.14 (0.05)
0.21 (0.08)
0.21 (0.06)
0.56 (0.27)
0.24 (0.07)
0.18 (0.07)
0.36 (0.11)
Dental insurance
Some private 0.51 (0.05)
0.23 (0.10)
0.30 (0.09)
0.33 (0.09)
0.30 (0.09)
1.42 (0.85)
0.31 (0.06)
0.37 (0.09)
0.36 (0.08)
0.41 (0.08)
0.30 (0.07)
Only public 69.53 (0.94)
67.25 (4.77)
70.34 (4.63)
73.41 (3.72)
71.35 (4.22)
71.45 (3.66)
54.33 (5.87)
73.41 (2.72)
70.53 (3.35)
69.36 (3.49)
67.99 (3.29)
Neither 0.00 (0.00)
0.00 (0.00)
0.00 (0.00)
0.00 (0.00)
0.00 (0.00)
0.00 (0.00)
0.00 (0.00)
0.00 (0.00)
0.00 (0.00)
0.00 (0.00)
0.00 (0.00)
Employed
Employed 3.98 (0.15)
1.65 (0.27)
2.13 (0.29)
2.21 (0.28)
2.68 (0.42)
3.80 (0.95)
2.25 (0.22)
2.91 (0.35)
2.99 (0.36)
3.15 (0.36)
3.19 (0.35)
Not employed 7.29 (0.33)
6.85 (1.10)
6.46 (0.91)
6.24 (1.08)
4.64 (0.78)
4.94 (1.10)
3.85 (0.52)
6.96 (0.98)
6.57 (0.76)
7.80 (1.08)
8.31 (1.25)
Education level
< 12 yrs 19.58 (0.87)
16.85 (2.64)
14.22 (2.03)
15.54 (3.18)
15.44 (2.83)
17.78 (6.88)
10.94 (1.34)
14.49 (1.90)
15.45 (1.94)
14.24 (1.83)
16.93 (2.47)
12 yrs 7.22 (0.31)
3.32 (0.53)
4.87 (0.82)
4.58 (0.74)
3.56 (0.70)
4.79 (0.97)
3.31 (0.42)
4.84 (0.61)
5.61 (1.07)
6.28 (0.96)
7.47 (1.23)
> 12 yrs 2.49 (0.11)
0.76 (0.23)
1.04 (0.16)
1.00 (0.18)
0.96 (0.29)
1.88 (0.70)
1.15 (0.18)
1.99 (0.40)
1.80 (0.24)
2.17 (0.32)
1.64 (0.20)

50
Table 23. Percent total expense paid by public coverage; 1996–2015, continued 2006 2007 2008 2009 2010 2011 2012 2013 2014 2015
Overall 4.48 (0.42)
4.25 (0.39)
4.61 (0.46)
5.04 (0.48)
5.79 (0.55)
5.51 (0.44)
5.53 (0.55)
5.64 (0.43)
6.62 (0.44)
8.38 (0.58)
Sex Male 4.28
(0.64) 3.89
(0.48) 4.34
(0.54) 4.89
(0.60) 6.57
(0.86) 4.85
(0.52) 4.84
(0.49) 5.66
(0.59) 6.32
(0.53) 8.29
(0.76)
Female 4.63 (0.49)
4.51 (0.55)
4.82 (0.60)
5.16 (0.59)
5.19 (0.62)
6.04 (0.53)
6.05 (0.86)
5.61 (0.50)
6.85 (0.55)
8.45 (0.68)
Race/ethnicity Hispanic 10.47
(1.47) 10.41 (1.13)
10.17 (2.28)
12.66 (1.80)
19.03 (2.27)
15.20 (1.81)
14.32 (1.60)
14.63 (1.29)
18.55 (1.84)
19.00 (1.75)
Non-Hispanic White 3.13 (0.45)
2.66 (0.31)
3.52 (0.48)
3.52 (0.50)
2.93 (0.47)
3.02 (0.39)
3.78 (0.65)
3.62 (0.46)
3.55 (0.40)
5.37 (0.55)
Non-Hispanic Black 13.31 (2.03)
8.84 (1.40)
8.58 (1.18)
11.20 (1.66)
19.30 (2.68)
15.89 (2.31)
13.41 (1.33)
13.45 (1.69)
17.43 (1.78)
18.65 (1.91)
Non-Hispanic Other 5.12 (1.03)
9.83 (4.11)
5.90 (1.98)
6.93 (1.61)
7.31 (1.38)
4.61 (0.95)
4.36 (0.95)
6.28 (1.06)
8.53 (1.40)
9.42 (2.52)
Age category < 21 9.25
(0.95) 11.27 (1.29)
10.91 (1.33)
12.48 (1.35)
15.57 (1.88)
13.66 (1.42)
11.82 (1.27)
15.68 (1.44)
14.47 (1.24)
16.47 (1.64)
21-64 2.66 (0.52)
1.88 (0.26)
2.47 (0.52)
2.26 (0.33)
2.09 (0.33)
2.41 (0.35)
3.55 (0.89)
2.33 (0.36)
3.98 (0.42)
6.82 (0.74)
> 64 1.64 (0.45)
0.75 (0.24)
1.09 (0.42)
2.05 (0.60)
1.52 (0.64)
1.30 (0.47)
0.96 (0.25)
1.23 (0.28)
1.92 (0.64)
1.74 (0.40)
Poverty level Poor (<100% FPL) 33.89
(4.21) 32.44 (3.72)
32.63 (4.20)
30.42 (3.06)
40.33 (3.94)
38.96 (2.93)
34.40 (3.73)
40.54 (4.13)
45.48 (3.73)
46.17 (4.39)
Low (100-199% FPL) 16.52 (2.29)
12.48 (1.52)
13.27 (1.72)
16.74 (2.05)
16.83 (2.11)
15.09 (1.89)
15.61 (2.33)
14.58 (1.45)
16.64 (1.85)
23.61 (2.38)
Mid (200-399% FPL) 2.35 (0.43)
3.83 (1.05)
3.31 (0.70)
3.86 (0.96)
3.06 (0.62)
3.50 (0.60)
3.50 (1.03)
3.37 (0.61)
4.31 (0.58)
6.43 (0.98)
High (400%+ FPL) 0.28 (0.08)
0.18 (0.06)
0.21 (0.07)
0.34 (0.10)
0.58 (0.34)
0.32 (0.16)
0.32 (0.10)
0.36 (0.09)
0.42 (0.09)
0.84 (0.17)
Dental insurance Some private 0.26
(0.05) 0.38
(0.08) 0.42
(0.08) 0.47
(0.10) 0.44
(0.08) 0.39
(0.08) 0.57
(0.13) 0.53
(0.09) 0.85
(0.19) 1.15
(0.17)
Only public 71.35 (3.45)
66.12 (3.99)
73.16 (3.91)
70.27 (4.00)
72.30 (3.13)
68.20 (2.98)
65.40 (3.77)
68.28 (2.93)
69.63 (2.59)
72.71 (3.06)
Neither 0.00 (0.00)
0.00 (0.00)
0.00 (0.00)
0.00 (0.00)
0.00 (0.00)
0.00 (0.00)
0.00 (0.00)
0.00 (0.00)
0.00 (0.00)
0.00 (0.00)
Employed Employed 3.54
(0.42) 3.85
(0.44) 3.93
(0.51) 4.18
(0.53) 4.87
(0.57) 4.45
(0.37) 4.85
(0.60) 5.00
(0.50) 5.57
(0.43) 7.94
(0.63)
Not employed 7.82 (1.08)
5.43 (0.79)
6.40 (0.90)
7.46 (0.92)
8.35 (1.20)
8.36 (1.09)
7.20 (1.19)
7.29 (0.85)
9.15 (0.88)
9.40 (1.02)
Education level < 12 yrs 19.91
(2.37) 17.36 (2.15)
16.19 (2.37)
23.57 (3.21)
24.24 (3.02)
27.11 (2.66)
23.58 (2.55)
25.56 (2.97)
23.08 (2.85)
7.94 (0.63)
12 yrs 6.39 (0.77)
6.01 (1.13)
7.84 (1.23)
8.80 (1.30)
8.70 (1.25)
7.44 (0.77)
10.74 (1.75)
10.03 (1.05)
12.45 (1.36)
9.40 (1.02)
> 12 yrs 2.07 (0.41)
2.30 (0.32)
2.30 (0.40)
2.16 (0.28)
3.34 (0.51)
3.35 (0.42)
2.96 (0.45)
3.26 (0.38)
3.91 (0.35)
7.94 (0.63)
* Relative standard error is greater than 30 percent.Source: Agency for Healthcare Research and Quality, Household Component of the Medical Expenditure Panel Survey, 1996–2015.
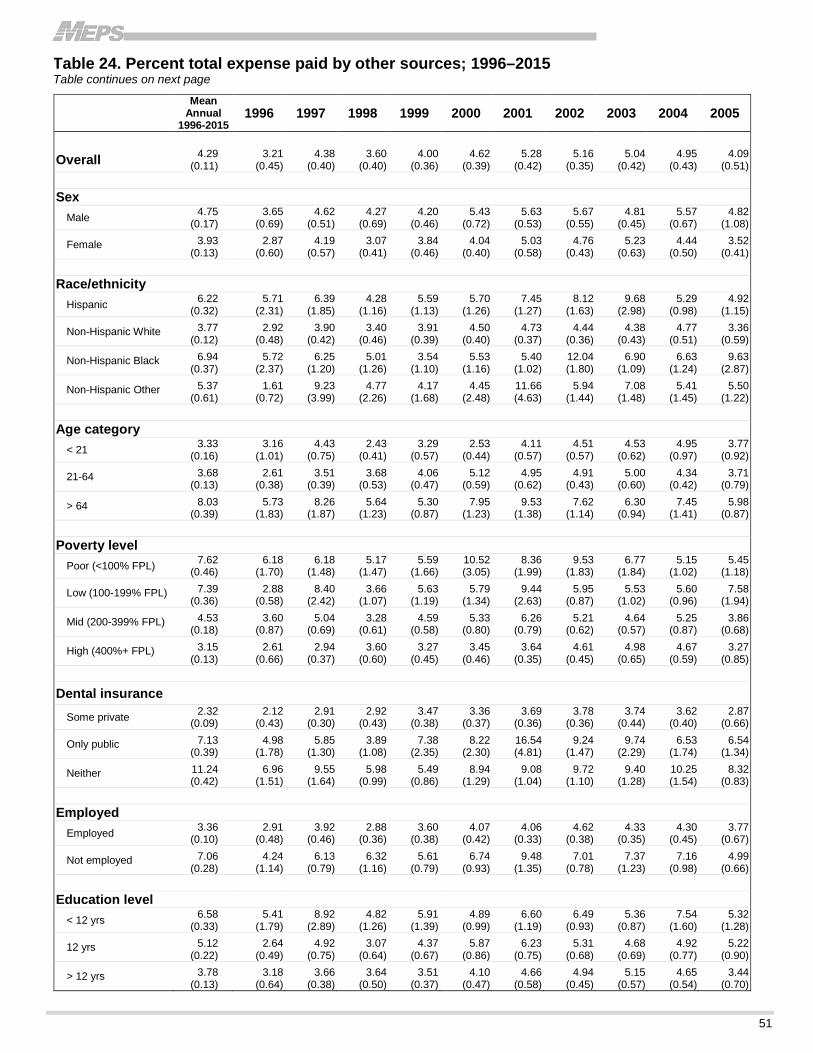
51
Table 24. Percent total expense paid by other sources; 1996–2015 Table continues on next page
Mean Annual
1996-2015 1996 1997 1998 1999 2000 2001 2002 2003 2004 2005
Overall 4.29 (0.11)
3.21 (0.45)
4.38 (0.40)
3.60 (0.40)
4.00 (0.36)
4.62 (0.39)
5.28 (0.42)
5.16 (0.35)
5.04 (0.42)
4.95 (0.43)
4.09 (0.51)
Sex
Male 4.75 (0.17)
3.65 (0.69)
4.62 (0.51)
4.27 (0.69)
4.20 (0.46)
5.43 (0.72)
5.63 (0.53)
5.67 (0.55)
4.81 (0.45)
5.57 (0.67)
4.82 (1.08)
Female 3.93 (0.13)
2.87 (0.60)
4.19 (0.57)
3.07 (0.41)
3.84 (0.46)
4.04 (0.40)
5.03 (0.58)
4.76 (0.43)
5.23 (0.63)
4.44 (0.50)
3.52 (0.41)
Race/ethnicity
Hispanic 6.22 (0.32)
5.71 (2.31)
6.39 (1.85)
4.28 (1.16)
5.59 (1.13)
5.70 (1.26)
7.45 (1.27)
8.12 (1.63)
9.68 (2.98)
5.29 (0.98)
4.92 (1.15)
Non-Hispanic White 3.77 (0.12)
2.92 (0.48)
3.90 (0.42)
3.40 (0.46)
3.91 (0.39)
4.50 (0.40)
4.73 (0.37)
4.44 (0.36)
4.38 (0.43)
4.77 (0.51)
3.36 (0.59)
Non-Hispanic Black 6.94 (0.37)
5.72 (2.37)
6.25 (1.20)
5.01 (1.26)
3.54 (1.10)
5.53 (1.16)
5.40 (1.02)
12.04 (1.80)
6.90 (1.09)
6.63 (1.24)
9.63 (2.87)
Non-Hispanic Other 5.37 (0.61)
1.61 (0.72)
9.23 (3.99)
4.77 (2.26)
4.17 (1.68)
4.45 (2.48)
11.66 (4.63)
5.94 (1.44)
7.08 (1.48)
5.41 (1.45)
5.50 (1.22)
Age category
< 21 3.33 (0.16)
3.16 (1.01)
4.43 (0.75)
2.43 (0.41)
3.29 (0.57)
2.53 (0.44)
4.11 (0.57)
4.51 (0.57)
4.53 (0.62)
4.95 (0.97)
3.77 (0.92)
21-64 3.68 (0.13)
2.61 (0.38)
3.51 (0.39)
3.68 (0.53)
4.06 (0.47)
5.12 (0.59)
4.95 (0.62)
4.91 (0.43)
5.00 (0.60)
4.34 (0.42)
3.71 (0.79)
> 64 8.03 (0.39)
5.73 (1.83)
8.26 (1.87)
5.64 (1.23)
5.30 (0.87)
7.95 (1.23)
9.53 (1.38)
7.62 (1.14)
6.30 (0.94)
7.45 (1.41)
5.98 (0.87)
Poverty level
Poor (<100% FPL) 7.62 (0.46)
6.18 (1.70)
6.18 (1.48)
5.17 (1.47)
5.59 (1.66)
10.52 (3.05)
8.36 (1.99)
9.53 (1.83)
6.77 (1.84)
5.15 (1.02)
5.45 (1.18)
Low (100-199% FPL) 7.39 (0.36)
2.88 (0.58)
8.40 (2.42)
3.66 (1.07)
5.63 (1.19)
5.79 (1.34)
9.44 (2.63)
5.95 (0.87)
5.53 (1.02)
5.60 (0.96)
7.58 (1.94)
Mid (200-399% FPL) 4.53 (0.18)
3.60 (0.87)
5.04 (0.69)
3.28 (0.61)
4.59 (0.58)
5.33 (0.80)
6.26 (0.79)
5.21 (0.62)
4.64 (0.57)
5.25 (0.87)
3.86 (0.68)
High (400%+ FPL) 3.15 (0.13)
2.61 (0.66)
2.94 (0.37)
3.60 (0.60)
3.27 (0.45)
3.45 (0.46)
3.64 (0.35)
4.61 (0.45)
4.98 (0.65)
4.67 (0.59)
3.27 (0.85)
Dental insurance
Some private 2.32 (0.09)
2.12 (0.43)
2.91 (0.30)
2.92 (0.43)
3.47 (0.38)
3.36 (0.37)
3.69 (0.36)
3.78 (0.36)
3.74 (0.44)
3.62 (0.40)
2.87 (0.66)
Only public 7.13 (0.39)
4.98 (1.78)
5.85 (1.30)
3.89 (1.08)
7.38 (2.35)
8.22 (2.30)
16.54 (4.81)
9.24 (1.47)
9.74 (2.29)
6.53 (1.74)
6.54 (1.34)
Neither 11.24 (0.42)
6.96 (1.51)
9.55 (1.64)
5.98 (0.99)
5.49 (0.86)
8.94 (1.29)
9.08 (1.04)
9.72 (1.10)
9.40 (1.28)
10.25 (1.54)
8.32 (0.83)
Employed
Employed 3.36 (0.10)
2.91 (0.48)
3.92 (0.46)
2.88 (0.36)
3.60 (0.38)
4.07 (0.42)
4.06 (0.33)
4.62 (0.38)
4.33 (0.35)
4.30 (0.45)
3.77 (0.67)
Not employed 7.06 (0.28)
4.24 (1.14)
6.13 (0.79)
6.32 (1.16)
5.61 (0.79)
6.74 (0.93)
9.48 (1.35)
7.01 (0.78)
7.37 (1.23)
7.16 (0.98)
4.99 (0.66)
Education level
< 12 yrs 6.58 (0.33)
5.41 (1.79)
8.92 (2.89)
4.82 (1.26)
5.91 (1.39)
4.89 (0.99)
6.60 (1.19)
6.49 (0.93)
5.36 (0.87)
7.54 (1.60)
5.32 (1.28)
12 yrs 5.12 (0.22)
2.64 (0.49)
4.92 (0.75)
3.07 (0.64)
4.37 (0.67)
5.87 (0.86)
6.23 (0.75)
5.31 (0.68)
4.68 (0.69)
4.92 (0.77)
5.22 (0.90)
> 12 yrs 3.78 (0.13)
3.18 (0.64)
3.66 (0.38)
3.64 (0.50)
3.51 (0.37)
4.10 (0.47)
4.66 (0.58)
4.94 (0.45)
5.15 (0.57)
4.65 (0.54)
3.44 (0.70)

52
Table 24. Percent total expense paid by other sources; 1996–2015, continued
2006 2007 2008 2009 2010 2011 2012 2013 2014 2015
Overall 3.71 (0.33)
4.27 (0.40)
4.29 (0.51)
4.61 (0.45)
4.10 (0.31)
4.27 (0.40)
4.13 (0.36)
3.66 (0.37)
3.95 (0.31)
4.47 (0.53)
Sex
Male 3.78 (0.44)
5.11 (0.64)
3.93 (0.62)
5.24 (0.71)
4.78 (0.49)
4.67 (0.61)
4.54 (0.62)
4.03 (0.63)
4.09 (0.43)
5.98 (1.03)
Female 3.66 (0.46)
3.66 (0.49)
4.57 (0.72)
4.13 (0.49)
3.58 (0.38)
3.94 (0.51)
3.81 (0.40)
3.36 (0.40)
3.84 (0.40)
3.29 (0.35)
Race/ethnicity
Hispanic 5.19 (1.11)
5.08 (1.00)
5.18 (0.91)
10.09 (2.25)
7.02 (1.25)
6.90 (1.09)
6.97 (1.05)
5.84 (0.89)
4.83 (0.85)
5.08 (0.85)
Non-Hispanic White 3.40 (0.39)
3.94 (0.45)
3.51 (0.46)
3.68 (0.51)
3.47 (0.34)
3.69 (0.50)
3.43 (0.39)
3.11 (0.46)
3.32 (0.35)
3.82 (0.57)
Non-Hispanic Black 5.31 (1.20)
7.10 (1.94)
8.46 (1.67)
7.93 (1.63)
7.53 (1.45)
5.53 (0.79)
7.46 (1.24)
7.70 (1.49)
6.73 (1.29)
5.84 (1.22)
Non-Hispanic Other 4.31 (1.15)
3.72 (1.03)
7.69 (4.52)
5.27 (1.45)
3.94 (1.00)
4.57 (1.49)
4.26 (1.09)
2.55 (0.55)
5.81 (1.73)
7.37 (2.99)
Age category
< 21 2.74 (0.44)
3.89 (0.82)
2.66 (0.47)
5.13 (0.94)
3.58 (0.56)
4.26 (0.82)
2.55 (0.41)
1.95 (0.31)
1.46 (0.21)
2.07 (0.50)
21-64 3.25 (0.46)
3.20 (0.44)
3.70 (0.76)
2.79 (0.34)
3.43 (0.41)
2.59 (0.34)
4.13 (0.58)
2.96 (0.50)
3.28 (0.38)
3.44 (0.68)
> 64 7.45 (1.02)
8.77 (1.46)
9.10 (1.23)
10.21 (1.55)
7.12 (0.91)
9.37 (1.63)
6.48 (0.93)
8.13 (1.32)
8.91 (1.06)
9.82 (1.29)
Poverty level
Poor (<100% FPL) 4.26 (0.74)
4.92 (1.03)
11.42 (3.48)
9.29 (1.95)
7.57 (1.39)
7.63 (1.63)
12.02 (2.71)
8.13 (1.80)
7.89 (1.77)
7.15 (2.36)
Low (100-199% FPL) 7.11 (1.25)
9.78 (1.64)
6.41 (1.19)
7.49 (1.14)
6.76 (0.97)
11.81 (2.21)
9.93 (1.30)
7.93 (1.69)
6.49 (1.05)
7.35 (1.10)
Mid (200-399% FPL) 3.55 (0.67)
4.26 (0.79)
3.95 (0.65)
5.05 (0.78)
4.74 (0.64)
4.77 (0.77)
3.61 (0.46)
4.17 (0.89)
4.12 (0.69)
5.62 (1.07)
High (400%+ FPL) 3.15 (0.43)
3.13 (0.50)
3.19 (0.75)
3.25 (0.60)
2.75 (0.39)
1.85 (0.31)
2.03 (0.26)
1.85 (0.24)
2.80 (0.35)
2.92 (0.58)
Dental insurance
Some private 2.21 (0.35)
2.13 (0.41)
1.85 (0.50)
2.35 (0.39)
1.58 (0.24)
1.48 (0.29)
1.24 (0.21)
1.11 (0.17)
1.25 (0.19)
1.35 (0.30)
Only public 5.15 (0.73)
6.04 (1.11)
4.79 (0.90)
6.39 (1.13)
7.05 (1.30)
12.57 (2.42)
5.95 (1.08)
7.89 (1.59)
7.15 (1.33)
4.33 (0.73)
Neither 10.01 (1.16)
12.63 (1.40)
13.08 (1.51)
12.70 (1.52)
13.38 (1.33)
11.52 (1.58)
13.27 (1.53)
12.85 (1.76)
14.42 (1.54)
16.74 (2.45)
Employed
Employed 3.13 (0.35)
3.34 (0.44)
3.11 (0.56)
3.55 (0.47)
2.96 (0.30)
3.42 (0.45)
2.90 (0.38)
2.47 (0.26)
2.75 (0.27)
2.14 (0.31)
Not employed 5.80 (0.72)
7.03 (0.98)
7.50 (1.10)
7.57 (0.95)
7.27 (0.85)
6.54 (0.81)
7.25 (0.85)
6.77 (1.14)
6.86 (0.83)
9.85 (1.40)
Education level
< 12 yrs 5.98 (1.37)
7.93 (1.53)
5.20 (1.14)
8.57 (1.37)
6.86 (1.57)
8.41 (2.10)
9.00 (1.55)
8.63 (1.70)
5.33 (1.03)
5.54 (0.97)
12 yrs 3.89 (0.51)
3.95 (0.65)
4.50 (0.62)
5.95 (0.82)
5.51 (0.80)
5.64 (0.79)
5.60 (0.77)
5.70 (0.81)
5.73 (0.87)
7.37 (1.76)
> 12 yrs 3.40 (0.42)
4.05 (0.53)
4.10 (0.69)
3.84 (0.53)
3.48 (0.34)
3.59 (0.48)
3.32 (0.38)
2.86 (0.42)
3.44 (0.35)
3.53 (0.47)
Source: Agency for Healthcare Research and Quality, Household Component of the Medical Expenditure Panel Survey, 1996–2015.
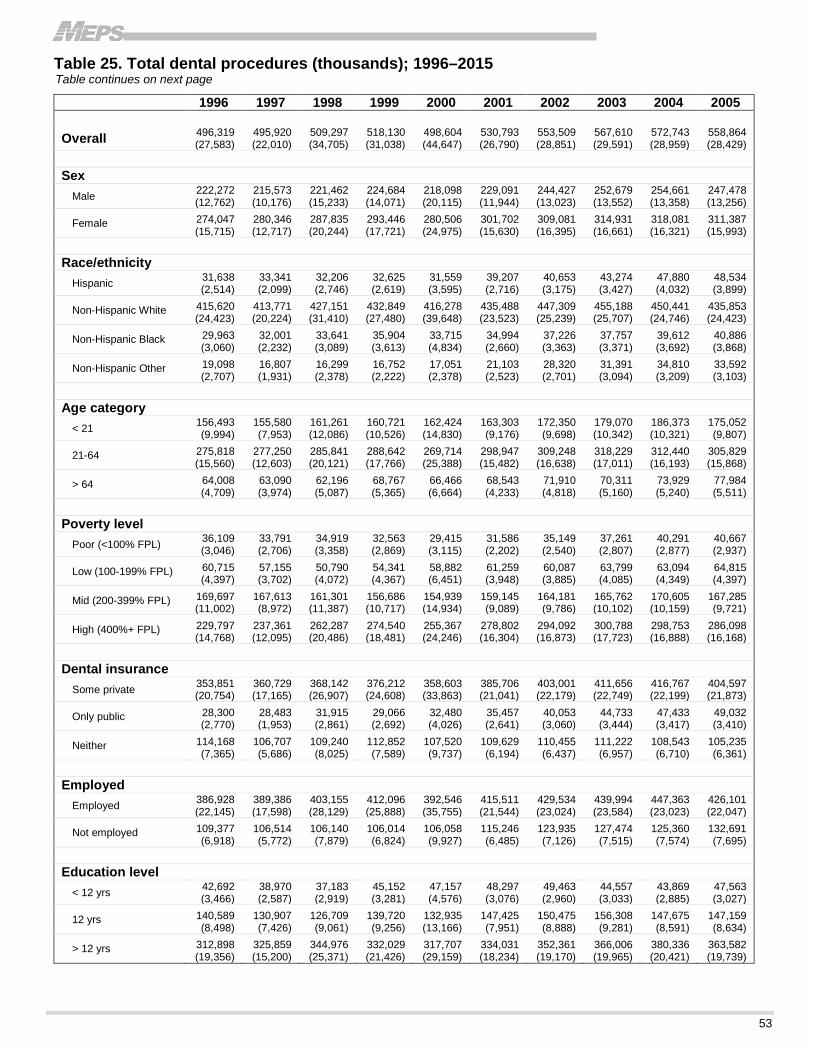
53
Table 25. Total dental procedures (thousands); 1996–2015 Table continues on next page
1996 1997 1998 1999 2000 2001 2002 2003 2004 2005
Overall 496,319 (27,583)
495,920 (22,010)
509,297 (34,705)
518,130 (31,038)
498,604 (44,647)
530,793 (26,790)
553,509 (28,851)
567,610 (29,591)
572,743 (28,959)
558,864 (28,429)
Sex
Male 222,272 (12,762)
215,573 (10,176)
221,462 (15,233)
224,684 (14,071)
218,098 (20,115)
229,091 (11,944)
244,427 (13,023)
252,679 (13,552)
254,661 (13,358)
247,478 (13,256)
Female 274,047 (15,715)
280,346 (12,717)
287,835 (20,244)
293,446 (17,721)
280,506 (24,975)
301,702 (15,630)
309,081 (16,395)
314,931 (16,661)
318,081 (16,321)
311,387 (15,993)
Race/ethnicity
Hispanic 31,638 (2,514)
33,341 (2,099)
32,206 (2,746)
32,625 (2,619)
31,559 (3,595)
39,207 (2,716)
40,653 (3,175)
43,274 (3,427)
47,880 (4,032)
48,534 (3,899)
Non-Hispanic White 415,620 (24,423)
413,771 (20,224)
427,151 (31,410)
432,849 (27,480)
416,278 (39,648)
435,488 (23,523)
447,309 (25,239)
455,188 (25,707)
450,441 (24,746)
435,853 (24,423)
Non-Hispanic Black 29,963 (3,060)
32,001 (2,232)
33,641 (3,089)
35,904 (3,613)
33,715 (4,834)
34,994 (2,660)
37,226 (3,363)
37,757 (3,371)
39,612 (3,692)
40,886 (3,868)
Non-Hispanic Other 19,098 (2,707)
16,807 (1,931)
16,299 (2,378)
16,752 (2,222)
17,051 (2,378)
21,103 (2,523)
28,320 (2,701)
31,391 (3,094)
34,810 (3,209)
33,592 (3,103)
Age category
< 21 156,493 (9,994)
155,580 (7,953)
161,261 (12,086)
160,721 (10,526)
162,424 (14,830)
163,303 (9,176)
172,350 (9,698)
179,070 (10,342)
186,373 (10,321)
175,052 (9,807)
21-64 275,818 (15,560)
277,250 (12,603)
285,841 (20,121)
288,642 (17,766)
269,714 (25,388)
298,947 (15,482)
309,248 (16,638)
318,229 (17,011)
312,440 (16,193)
305,829 (15,868)
> 64 64,008 (4,709)
63,090 (3,974)
62,196 (5,087)
68,767 (5,365)
66,466 (6,664)
68,543 (4,233)
71,910 (4,818)
70,311 (5,160)
73,929 (5,240)
77,984 (5,511)
Poverty level
Poor (<100% FPL) 36,109 (3,046)
33,791 (2,706)
34,919 (3,358)
32,563 (2,869)
29,415 (3,115)
31,586 (2,202)
35,149 (2,540)
37,261 (2,807)
40,291 (2,877)
40,667 (2,937)
Low (100-199% FPL) 60,715 (4,397)
57,155 (3,702)
50,790 (4,072)
54,341 (4,367)
58,882 (6,451)
61,259 (3,948)
60,087 (3,885)
63,799 (4,085)
63,094 (4,349)
64,815 (4,397)
Mid (200-399% FPL) 169,697 (11,002)
167,613 (8,972)
161,301 (11,387)
156,686 (10,717)
154,939 (14,934)
159,145 (9,089)
164,181 (9,786)
165,762 (10,102)
170,605 (10,159)
167,285 (9,721)
High (400%+ FPL) 229,797 (14,768)
237,361 (12,095)
262,287 (20,486)
274,540 (18,481)
255,367 (24,246)
278,802 (16,304)
294,092 (16,873)
300,788 (17,723)
298,753 (16,888)
286,098 (16,168)
Dental insurance
Some private 353,851 (20,754)
360,729 (17,165)
368,142 (26,907)
376,212 (24,608)
358,603 (33,863)
385,706 (21,041)
403,001 (22,179)
411,656 (22,749)
416,767 (22,199)
404,597 (21,873)
Only public 28,300 (2,770)
28,483 (1,953)
31,915 (2,861)
29,066 (2,692)
32,480 (4,026)
35,457 (2,641)
40,053 (3,060)
44,733 (3,444)
47,433 (3,417)
49,032 (3,410)
Neither 114,168 (7,365)
106,707 (5,686)
109,240 (8,025)
112,852 (7,589)
107,520 (9,737)
109,629 (6,194)
110,455 (6,437)
111,222 (6,957)
108,543 (6,710)
105,235 (6,361)
Employed
Employed 386,928 (22,145)
389,386 (17,598)
403,155 (28,129)
412,096 (25,888)
392,546 (35,755)
415,511 (21,544)
429,534 (23,024)
439,994 (23,584)
447,363 (23,023)
426,101 (22,047)
Not employed 109,377 (6,918)
106,514 (5,772)
106,140 (7,879)
106,014 (6,824)
106,058 (9,927)
115,246 (6,485)
123,935 (7,126)
127,474 (7,515)
125,360 (7,574)
132,691 (7,695)
Education level
< 12 yrs 42,692 (3,466)
38,970 (2,587)
37,183 (2,919)
45,152 (3,281)
47,157 (4,576)
48,297 (3,076)
49,463 (2,960)
44,557 (3,033)
43,869 (2,885)
47,563 (3,027)
12 yrs 140,589 (8,498)
130,907 (7,426)
126,709 (9,061)
139,720 (9,256)
132,935 (13,166)
147,425 (7,951)
150,475 (8,888)
156,308 (9,281)
147,675 (8,591)
147,159 (8,634)
> 12 yrs 312,898 (19,356)
325,859 (15,200)
344,976 (25,371)
332,029 (21,426)
317,707 (29,159)
334,031 (18,234)
352,361 (19,170)
366,006 (19,965)
380,336 (20,421)
363,582 (19,739)

54
Table 25. Total dental procedures (thousands); 1996–2015, continued
2006 2007 2008 2009 2010 2011 2012 2013 2014 2015
Overall 562,957 (29,502)
562,038 (19,959)
550,411 (16,301)
548,697 (16,245)
528,206 (16,904)
526,693 (16,373)
529,035 (16,965)
580,379 (17,663)
583,516 (18,873)
588,965 (18,887)
Sex
Male 251,398 (13,513)
244,916 (9,321)
243,057 (7,831)
244,284 (7,860)
236,360 (8,415)
234,274 (7,603)
237,047 (8,122)
260,865 (9,446)
261,453 (9,314)
265,856 (9,652)
Female 311,559 (16,583)
317,122 (11,620)
307,354 (9,873)
304,414 (9,460)
291,846 (10,008)
292,419 (9,852)
291,988 (9,955)
319,513 (9,901)
322,063 (11,096)
323,109 (10,542)
Race/ethnicity
Hispanic 45,674 (3,161)
52,158 (3,240)
53,102 (3,600)
52,077 (3,230)
53,798 (3,270)
61,355 (4,109)
57,306 (3,729)
65,177 (3,848)
66,392 (4,180)
75,134 (4,455)
Non-Hispanic White 439,538 (25,245)
434,193 (17,371)
424,622 (15,526)
421,090 (14,980)
397,863 (15,603)
392,885 (15,598)
394,311 (16,100)
425,970 (16,553)
423,494 (17,156)
419,485 (16,622)
Non-Hispanic Black 42,507 (3,775)
42,901 (3,283)
39,160 (2,935)
40,945 (2,901)
41,687 (2,964)
38,776 (2,411)
39,587 (2,174)
44,733 (2,929)
44,729 (2,888)
43,193 (2,419)
Non-Hispanic Other 35,239 (3,462)
32,786 (2,758)
33,528 (3,225)
34,585 (3,007)
34,858 (3,109)
33,677 (3,158)
37,830 (3,029)
44,499 (3,240)
48,902 (4,190)
51,153 (4,195)
Age category
< 21 178,710 (10,286)
173,050 (7,633)
163,823 (7,199)
172,563 (7,710)
169,508 (8,264)
166,597 (8,553)
170,147 (8,257)
190,598 (8,362)
187,082 (8,649)
181,256 (8,664)
21-64 307,825 (16,319)
308,072 (11,457)
306,368 (9,879)
296,379 (9,075)
281,678 (9,492)
273,770 (8,398)
268,914 (8,784)
288,622 (9,299)
288,780 (9,965)
298,837 (10,732)
> 64 76,422 (5,274)
80,915 (4,346)
80,221 (4,594)
79,756 (4,049)
77,020 (3,990)
86,326 (4,853)
89,974 (4,927)
101,159 (5,636)
107,654 (5,877)
108,872 (5,767)
Poverty level
Poor (<100% FPL) 37,796 (2,592)
37,548 (2,137)
39,143 (2,516)
43,335 (2,663)
46,405 (2,398)
45,533 (2,278)
47,300 (2,893)
47,328 (2,360)
51,499 (2,923)
46,164 (2,686)
Low (100-199% FPL) 62,881 (4,411)
64,753 (3,474)
67,194 (3,608)
66,313 (3,376)
69,242 (3,329)
69,919 (3,283)
66,006 (3,518)
80,888 (4,516)
71,619 (4,596)
78,283 (4,248)
Mid (200-399% FPL) 165,634 (9,798)
159,116 (7,393)
162,927 (6,994)
159,725 (6,893)
144,200 (6,191)
153,590 (6,371)
152,282 (7,362)
158,306 (7,583)
153,290 (7,592)
155,349 (7,344)
High (400%+ FPL) 296,646 (17,653)
300,621 (13,029)
281,147 (11,812)
279,325 (11,657)
268,359 (12,565)
257,651 (11,640)
263,447 (11,629)
293,857 (12,116)
307,107 (13,033)
309,169 (12,781)
Dental insurance
Some private 409,417 (22,624)
397,635 (15,592)
391,522 (13,467)
392,644 (13,394)
370,223 (14,837)
364,843 (13,872)
366,344 (14,743)
403,532 (14,736)
410,683 (16,092)
408,962 (16,269)
Only public 50,384 (3,411)
50,546 (2,953)
49,173 (3,010)
55,393 (3,131)
61,022 (3,437)
59,999 (3,016)
60,879 (3,423)
72,398 (3,807)
76,507 (4,003)
81,313 (3,540)
Neither 103,156 (6,500)
113,857 (5,449)
109,716 (4,893)
100,660 (4,882)
96,960 (4,081)
101,852 (5,030)
101,812 (5,541)
104,448 (4,936)
96,326 (4,680)
98,690 (4,618)
Employed
Employed 437,367 (23,472)
432,506 (16,101)
420,938 (13,242)
412,252 (12,817)
401,043 (14,226)
395,539 (14,190)
389,245 (13,853)
429,187 (13,887)
433,451 (15,198)
439,815 (15,698)
Not employed 125,581 (7,513)
129,503 (5,688)
129,344 (5,927)
136,435 (5,746)
127,116 (5,314)
131,052 (5,721)
139,659 (5,745)
151,138 (6,626)
150,065 (6,091)
148,754 (6,052)
Education level
< 12 yrs 42,799 (2,709)
43,969 (2,372)
39,511 (2,285)
39,026 (2,009)
35,812 (2,432)
31,739 (2,028)
31,677 (1,874)
36,720 (2,096)
35,098 (2,161)
32,942 (1,716)
12 yrs 140,699 (8,463)
134,604 (6,407)
138,061 (6,521)
128,007 (5,233)
106,799 (4,184)
108,238 (4,480)
102,459 (4,970)
100,760 (4,690)
100,722 (4,695)
119,012 (5,197)
> 12 yrs 377,982 (21,066)
381,136 (14,867)
371,122 (12,891)
379,529 (13,131)
384,142 (14,052)
386,359 (14,120)
393,921 (14,270)
441,778 (15,548)
446,888 (16,332)
436,118 (15,779)
Source: Agency for Healthcare Research and Quality, Household Component of the Medical Expenditure Panel Survey, 1996–2015.
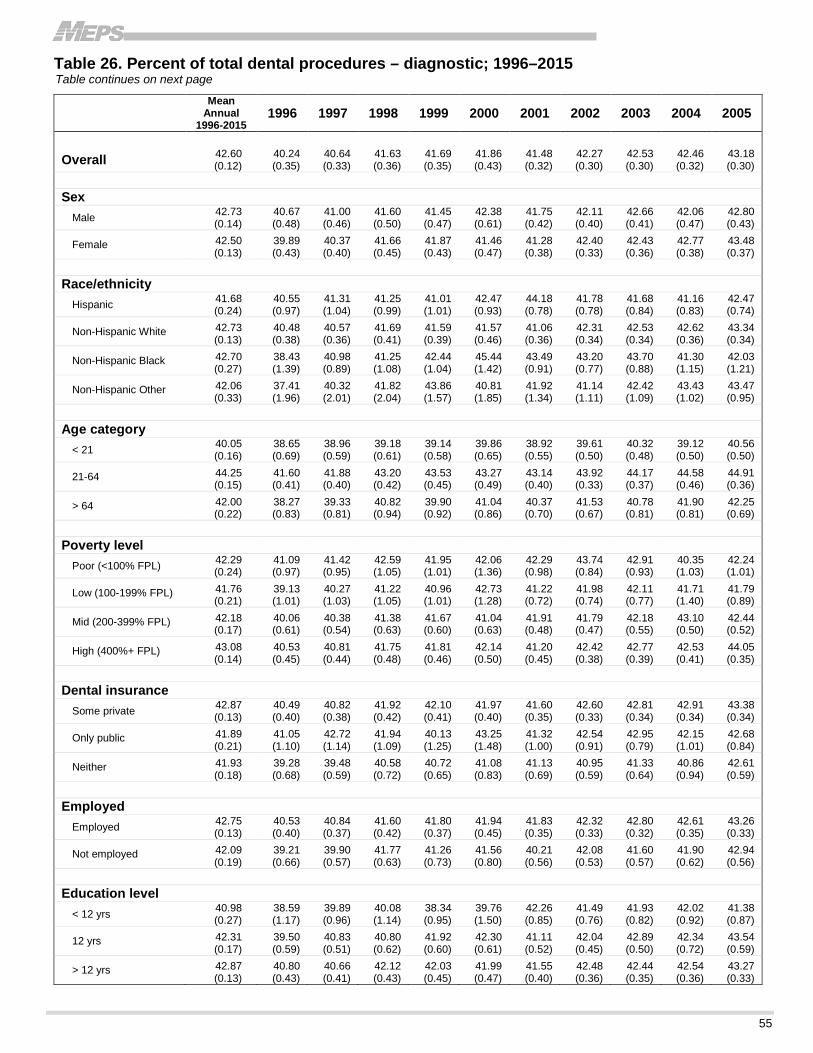
55
Table 26. Percent of total dental procedures – diagnostic; 1996–2015 Table continues on next page
Mean Annual
1996-2015 1996 1997 1998 1999 2000 2001 2002 2003 2004 2005
Overall 42.60 (0.12)
40.24 (0.35)
40.64 (0.33)
41.63 (0.36)
41.69 (0.35)
41.86 (0.43)
41.48 (0.32)
42.27 (0.30)
42.53 (0.30)
42.46 (0.32)
43.18 (0.30)
Sex
Male 42.73 (0.14)
40.67 (0.48)
41.00 (0.46)
41.60 (0.50)
41.45 (0.47)
42.38 (0.61)
41.75 (0.42)
42.11 (0.40)
42.66 (0.41)
42.06 (0.47)
42.80 (0.43)
Female 42.50 (0.13)
39.89 (0.43)
40.37 (0.40)
41.66 (0.45)
41.87 (0.43)
41.46 (0.47)
41.28 (0.38)
42.40 (0.33)
42.43 (0.36)
42.77 (0.38)
43.48 (0.37)
Race/ethnicity
Hispanic 41.68 (0.24)
40.55 (0.97)
41.31 (1.04)
41.25 (0.99)
41.01 (1.01)
42.47 (0.93)
44.18 (0.78)
41.78 (0.78)
41.68 (0.84)
41.16 (0.83)
42.47 (0.74)
Non-Hispanic White 42.73 (0.13)
40.48 (0.38)
40.57 (0.36)
41.69 (0.41)
41.59 (0.39)
41.57 (0.46)
41.06 (0.36)
42.31 (0.34)
42.53 (0.34)
42.62 (0.36)
43.34 (0.34)
Non-Hispanic Black 42.70 (0.27)
38.43 (1.39)
40.98 (0.89)
41.25 (1.08)
42.44 (1.04)
45.44 (1.42)
43.49 (0.91)
43.20 (0.77)
43.70 (0.88)
41.30 (1.15)
42.03 (1.21)
Non-Hispanic Other 42.06 (0.33)
37.41 (1.96)
40.32 (2.01)
41.82 (2.04)
43.86 (1.57)
40.81 (1.85)
41.92 (1.34)
41.14 (1.11)
42.42 (1.09)
43.43 (1.02)
43.47 (0.95)
Age category
< 21 40.05 (0.16)
38.65 (0.69)
38.96 (0.59)
39.18 (0.61)
39.14 (0.58)
39.86 (0.65)
38.92 (0.55)
39.61 (0.50)
40.32 (0.48)
39.12 (0.50)
40.56 (0.50)
21-64 44.25 (0.15)
41.60 (0.41)
41.88 (0.40)
43.20 (0.42)
43.53 (0.45)
43.27 (0.49)
43.14 (0.40)
43.92 (0.33)
44.17 (0.37)
44.58 (0.46)
44.91 (0.36)
> 64 42.00 (0.22)
38.27 (0.83)
39.33 (0.81)
40.82 (0.94)
39.90 (0.92)
41.04 (0.86)
40.37 (0.70)
41.53 (0.67)
40.78 (0.81)
41.90 (0.81)
42.25 (0.69)
Poverty level
Poor (<100% FPL) 42.29 (0.24)
41.09 (0.97)
41.42 (0.95)
42.59 (1.05)
41.95 (1.01)
42.06 (1.36)
42.29 (0.98)
43.74 (0.84)
42.91 (0.93)
40.35 (1.03)
42.24 (1.01)
Low (100-199% FPL) 41.76 (0.21)
39.13 (1.01)
40.27 (1.03)
41.22 (1.05)
40.96 (1.01)
42.73 (1.28)
41.22 (0.72)
41.98 (0.74)
42.11 (0.77)
41.71 (1.40)
41.79 (0.89)
Mid (200-399% FPL) 42.18 (0.17)
40.06 (0.61)
40.38 (0.54)
41.38 (0.63)
41.67 (0.60)
41.04 (0.63)
41.91 (0.48)
41.79 (0.47)
42.18 (0.55)
43.10 (0.50)
42.44 (0.52)
High (400%+ FPL) 43.08 (0.14)
40.53 (0.45)
40.81 (0.44)
41.75 (0.48)
41.81 (0.46)
42.14 (0.50)
41.20 (0.45)
42.42 (0.38)
42.77 (0.39)
42.53 (0.41)
44.05 (0.35)
Dental insurance
Some private 42.87 (0.13)
40.49 (0.40)
40.82 (0.38)
41.92 (0.42)
42.10 (0.41)
41.97 (0.40)
41.60 (0.35)
42.60 (0.33)
42.81 (0.34)
42.91 (0.34)
43.38 (0.34)
Only public 41.89 (0.21)
41.05 (1.10)
42.72 (1.14)
41.94 (1.09)
40.13 (1.25)
43.25 (1.48)
41.32 (1.00)
42.54 (0.91)
42.95 (0.79)
42.15 (1.01)
42.68 (0.84)
Neither 41.93 (0.18)
39.28 (0.68)
39.48 (0.59)
40.58 (0.72)
40.72 (0.65)
41.08 (0.83)
41.13 (0.69)
40.95 (0.59)
41.33 (0.64)
40.86 (0.94)
42.61 (0.59)
Employed
Employed 42.75 (0.13)
40.53 (0.40)
40.84 (0.37)
41.60 (0.42)
41.80 (0.37)
41.94 (0.45)
41.83 (0.35)
42.32 (0.33)
42.80 (0.32)
42.61 (0.35)
43.26 (0.33)
Not employed 42.09 (0.19)
39.21 (0.66)
39.90 (0.57)
41.77 (0.63)
41.26 (0.73)
41.56 (0.80)
40.21 (0.56)
42.08 (0.53)
41.60 (0.57)
41.90 (0.62)
42.94 (0.56)
Education level
< 12 yrs 40.98 (0.27)
38.59 (1.17)
39.89 (0.96)
40.08 (1.14)
38.34 (0.95)
39.76 (1.50)
42.26 (0.85)
41.49 (0.76)
41.93 (0.82)
42.02 (0.92)
41.38 (0.87)
12 yrs 42.31 (0.17)
39.50 (0.59)
40.83 (0.51)
40.80 (0.62)
41.92 (0.60)
42.30 (0.61)
41.11 (0.52)
42.04 (0.45)
42.89 (0.50)
42.34 (0.72)
43.54 (0.59)
> 12 yrs 42.87 (0.13)
40.80 (0.43)
40.66 (0.41)
42.12 (0.43)
42.03 (0.45)
41.99 (0.47)
41.55 (0.40)
42.48 (0.36)
42.44 (0.35)
42.54 (0.36)
43.27 (0.33)

56
Table 26. Percent of total dental procedures – diagnostic; 1996–2015, continued
2006 2007 2008 2009 2010 2011 2012 2013 2014 2015
Overall 43.17 (0.29)
43.59 (0.29)
43.89 (0.31)
43.33 (0.33)
43.30 (0.33)
43.71 (0.31)
43.59 (0.30)
42.68 (0.31)
42.75 (0.34)
43.34 (0.32)
Sex
Male 43.26 (0.41)
44.02 (0.39)
44.67 (0.40)
43.51 (0.42)
43.27 (0.40)
43.59 (0.42)
43.65 (0.39)
42.79 (0.40)
43.04 (0.42)
43.54 (0.40)
Female 43.10 (0.36)
43.27 (0.36)
43.27 (0.39)
43.18 (0.40)
43.32 (0.41)
43.81 (0.37)
43.54 (0.34)
42.58 (0.41)
42.51 (0.43)
43.18 (0.38)
Race/ethnicity
Hispanic 43.74 (0.92)
42.37 (0.77)
42.24 (0.72)
41.28 (0.74)
41.70 (0.75)
41.42 (0.65)
41.64 (0.81)
40.16 (0.62)
41.05 (0.65)
41.18 (0.70)
Non-Hispanic White 43.21 (0.33)
43.92 (0.34)
44.33 (0.37)
43.54 (0.37)
43.52 (0.38)
44.23 (0.38)
44.06 (0.36)
43.31 (0.39)
43.00 (0.40)
43.98 (0.40)
Non-Hispanic Black 42.83 (0.75)
43.16 (0.79)
42.69 (0.85)
42.94 (0.80)
43.53 (0.68)
42.94 (0.83)
43.47 (0.73)
42.52 (0.60)
44.02 (0.73)
42.44 (0.68)
Non-Hispanic Other 42.32 (1.26)
41.83 (1.15)
42.27 (1.12)
44.27 (0.77)
42.94 (1.22)
42.76 (1.06)
41.73 (0.84)
40.46 (0.94)
41.70 (0.82)
42.04 (0.86)
Age category
< 21 40.29 (0.52)
40.87 (0.50)
41.17 (0.49)
41.15 (0.54)
40.83 (0.57)
41.08 (0.53)
41.22 (0.50)
39.68 (0.50)
39.75 (0.54)
40.39 (0.49)
21-64 45.05 (0.34)
45.30 (0.35)
45.42 (0.39)
44.89 (0.37)
45.08 (0.39)
45.25 (0.42)
44.96 (0.41)
44.49 (0.42)
44.89 (0.43)
45.09 (0.43)
> 64 42.34 (0.59)
42.92 (0.69)
43.62 (0.81)
42.24 (0.85)
42.22 (0.64)
43.91 (0.70)
43.98 (0.80)
43.14 (0.69)
42.21 (0.71)
43.46 (0.68)
Poverty level
Poor (<100% FPL) 41.81 (0.88)
43.92 (0.99)
42.28 (0.92)
42.48 (0.80)
43.67 (0.66)
43.48 (0.83)
43.00 (0.84)
41.29 (0.76)
41.86 (0.77)
41.19 (0.85)
Low (100-199% FPL) 43.42 (0.69)
41.84 (0.77)
43.19 (0.62)
41.48 (0.81)
42.57 (0.74)
42.35 (0.63)
42.81 (0.74)
40.69 (0.70)
40.94 (0.71)
42.31 (0.57)
Mid (200-399% FPL) 42.44 (0.53)
43.61 (0.54)
43.03 (0.55)
42.62 (0.50)
43.17 (0.53)
42.94 (0.54)
42.52 (0.52)
42.45 (0.54)
41.72 (0.71)
43.42 (0.61)
High (400%+ FPL) 43.69 (0.35)
43.93 (0.40)
44.78 (0.43)
44.30 (0.42)
43.49 (0.49)
44.58 (0.42)
44.51 (0.44)
43.57 (0.43)
43.83 (0.42)
43.88 (0.40)
Dental insurance
Some private 43.22 (0.34)
43.58 (0.34)
44.07 (0.36)
43.73 (0.36)
43.50 (0.38)
43.91 (0.35)
44.32 (0.36)
42.97 (0.38)
43.13 (0.38)
43.91 (0.35)
Only public 41.58 (0.69)
42.47 (0.81)
42.64 (0.70)
42.38 (0.75)
42.34 (0.70)
42.39 (0.67)
41.02 (0.80)
41.21 (0.60)
41.10 (0.67)
41.01 (0.65)
Neither 43.73 (0.57)
44.13 (0.60)
43.81 (0.64)
42.29 (0.74)
43.15 (0.67)
43.77 (0.64)
42.49 (0.72)
42.57 (0.64)
42.42 (0.89)
42.92 (0.71)
Employed
Employed 43.28 (0.33)
43.61 (0.32)
44.00 (0.34)
43.57 (0.38)
43.75 (0.35)
43.81 (0.34)
43.77 (0.33)
42.86 (0.35)
43.08 (0.34)
43.50 (0.36)
Not employed 42.76 (0.51)
43.54 (0.55)
43.55 (0.62)
42.61 (0.62)
41.89 (0.53)
43.40 (0.56)
43.10 (0.59)
42.16 (0.53)
41.78 (0.69)
42.94 (0.62)
Education level
< 12 yrs 41.51 (0.89)
43.04 (0.91)
42.60 (1.03)
42.36 (1.03)
41.87 (1.00)
40.78 (0.88)
40.94 (0.94)
40.39 (0.79)
40.57 (1.05)
39.31 (1.05)
12 yrs 43.34 (0.51)
42.45 (0.64)
42.91 (0.64)
43.34 (0.60)
42.94 (0.59)
43.55 (0.61)
43.49 (0.62)
42.28 (0.56)
41.39 (0.77)
43.76 (0.63)
> 12 yrs 43.28 (0.34)
44.03 (0.35)
44.37 (0.35)
43.41 (0.35)
43.53 (0.40)
44.00 (0.37)
43.82 (0.33)
42.98 (0.37)
43.25 (0.33)
43.55 (0.36)
Source: Agency for Healthcare Research and Quality, Household Component of the Medical Expenditure Panel Survey, 1996–2015.
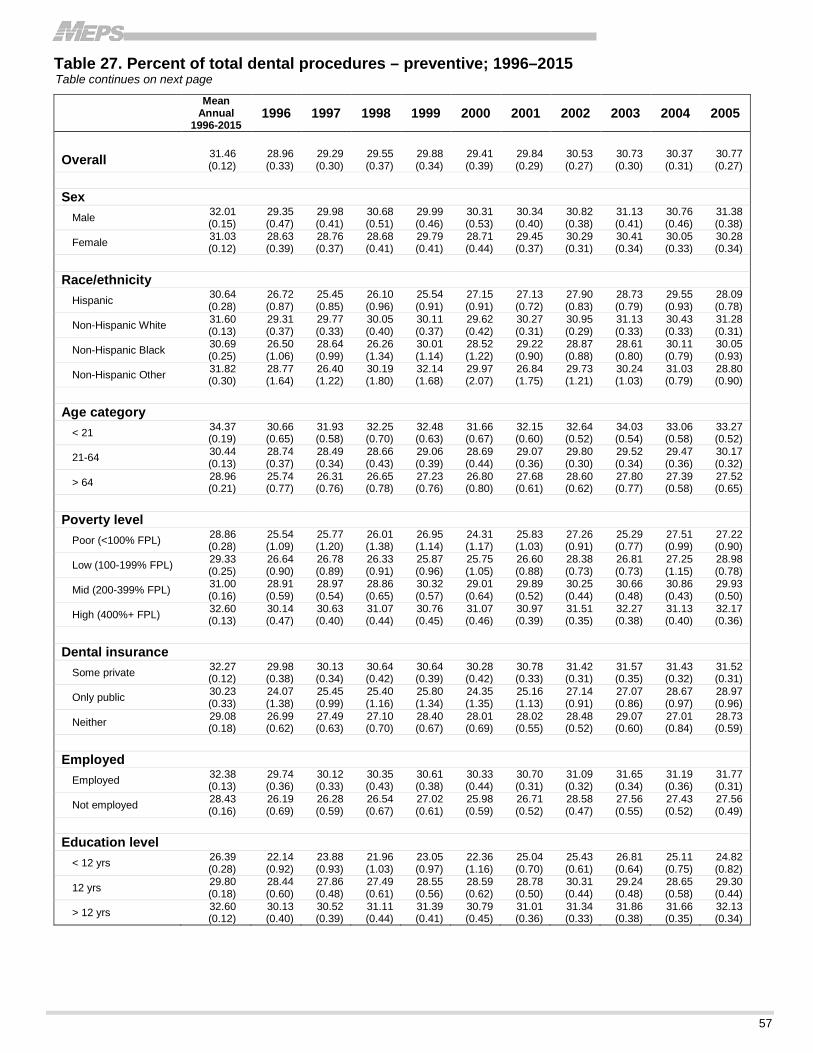
57
Table 27. Percent of total dental procedures – preventive; 1996–2015 Table continues on next page
Mean Annual
1996-2015 1996 1997 1998 1999 2000 2001 2002 2003 2004 2005
Overall 31.46 (0.12)
28.96 (0.33)
29.29 (0.30)
29.55 (0.37)
29.88 (0.34)
29.41 (0.39)
29.84 (0.29)
30.53 (0.27)
30.73 (0.30)
30.37 (0.31)
30.77 (0.27)
Sex
Male 32.01 (0.15)
29.35 (0.47)
29.98 (0.41)
30.68 (0.51)
29.99 (0.46)
30.31 (0.53)
30.34 (0.40)
30.82 (0.38)
31.13 (0.41)
30.76 (0.46)
31.38 (0.38)
Female 31.03 (0.12)
28.63 (0.39)
28.76 (0.37)
28.68 (0.41)
29.79 (0.41)
28.71 (0.44)
29.45 (0.37)
30.29 (0.31)
30.41 (0.34)
30.05 (0.33)
30.28 (0.34)
Race/ethnicity
Hispanic 30.64 (0.28)
26.72 (0.87)
25.45 (0.85)
26.10 (0.96)
25.54 (0.91)
27.15 (0.91)
27.13 (0.72)
27.90 (0.83)
28.73 (0.79)
29.55 (0.93)
28.09 (0.78)
Non-Hispanic White 31.60 (0.13)
29.31 (0.37)
29.77 (0.33)
30.05 (0.40)
30.11 (0.37)
29.62 (0.42)
30.27 (0.31)
30.95 (0.29)
31.13 (0.33)
30.43 (0.33)
31.28 (0.31)
Non-Hispanic Black 30.69 (0.25)
26.50 (1.06)
28.64 (0.99)
26.26 (1.34)
30.01 (1.14)
28.52 (1.22)
29.22 (0.90)
28.87 (0.88)
28.61 (0.80)
30.11 (0.79)
30.05 (0.93)
Non-Hispanic Other 31.82 (0.30)
28.77 (1.64)
26.40 (1.22)
30.19 (1.80)
32.14 (1.68)
29.97 (2.07)
26.84 (1.75)
29.73 (1.21)
30.24 (1.03)
31.03 (0.79)
28.80 (0.90)
Age category
< 21 34.37 (0.19)
30.66 (0.65)
31.93 (0.58)
32.25 (0.70)
32.48 (0.63)
31.66 (0.67)
32.15 (0.60)
32.64 (0.52)
34.03 (0.54)
33.06 (0.58)
33.27 (0.52)
21-64 30.44 (0.13)
28.74 (0.37)
28.49 (0.34)
28.66 (0.43)
29.06 (0.39)
28.69 (0.44)
29.07 (0.36)
29.80 (0.30)
29.52 (0.34)
29.47 (0.36)
30.17 (0.32)
> 64 28.96 (0.21)
25.74 (0.77)
26.31 (0.76)
26.65 (0.78)
27.23 (0.76)
26.80 (0.80)
27.68 (0.61)
28.60 (0.62)
27.80 (0.77)
27.39 (0.58)
27.52 (0.65)
Poverty level
Poor (<100% FPL) 28.86 (0.28)
25.54 (1.09)
25.77 (1.20)
26.01 (1.38)
26.95 (1.14)
24.31 (1.17)
25.83 (1.03)
27.26 (0.91)
25.29 (0.77)
27.51 (0.99)
27.22 (0.90)
Low (100-199% FPL) 29.33 (0.25)
26.64 (0.90)
26.78 (0.89)
26.33 (0.91)
25.87 (0.96)
25.75 (1.05)
26.60 (0.88)
28.38 (0.73)
26.81 (0.73)
27.25 (1.15)
28.98 (0.78)
Mid (200-399% FPL) 31.00 (0.16)
28.91 (0.59)
28.97 (0.54)
28.86 (0.65)
30.32 (0.57)
29.01 (0.64)
29.89 (0.52)
30.25 (0.44)
30.66 (0.48)
30.86 (0.43)
29.93 (0.50)
High (400%+ FPL) 32.60 (0.13)
30.14 (0.47)
30.63 (0.40)
31.07 (0.44)
30.76 (0.45)
31.07 (0.46)
30.97 (0.39)
31.51 (0.35)
32.27 (0.38)
31.13 (0.40)
32.17 (0.36)
Dental insurance
Some private 32.27 (0.12)
29.98 (0.38)
30.13 (0.34)
30.64 (0.42)
30.64 (0.39)
30.28 (0.42)
30.78 (0.33)
31.42 (0.31)
31.57 (0.35)
31.43 (0.32)
31.52 (0.31)
Only public 30.23 (0.33)
24.07 (1.38)
25.45 (0.99)
25.40 (1.16)
25.80 (1.34)
24.35 (1.35)
25.16 (1.13)
27.14 (0.91)
27.07 (0.86)
28.67 (0.97)
28.97 (0.96)
Neither 29.08 (0.18)
26.99 (0.62)
27.49 (0.63)
27.10 (0.70)
28.40 (0.67)
28.01 (0.69)
28.02 (0.55)
28.48 (0.52)
29.07 (0.60)
27.01 (0.84)
28.73 (0.59)
Employed
Employed 32.38 (0.13)
29.74 (0.36)
30.12 (0.33)
30.35 (0.43)
30.61 (0.38)
30.33 (0.44)
30.70 (0.31)
31.09 (0.32)
31.65 (0.34)
31.19 (0.36)
31.77 (0.31)
Not employed 28.43 (0.16)
26.19 (0.69)
26.28 (0.59)
26.54 (0.67)
27.02 (0.61)
25.98 (0.59)
26.71 (0.52)
28.58 (0.47)
27.56 (0.55)
27.43 (0.52)
27.56 (0.49)
Education level
< 12 yrs 26.39 (0.28)
22.14 (0.92)
23.88 (0.93)
21.96 (1.03)
23.05 (0.97)
22.36 (1.16)
25.04 (0.70)
25.43 (0.61)
26.81 (0.64)
25.11 (0.75)
24.82 (0.82)
12 yrs 29.80 (0.18)
28.44 (0.60)
27.86 (0.48)
27.49 (0.61)
28.55 (0.56)
28.59 (0.62)
28.78 (0.50)
30.31 (0.44)
29.24 (0.48)
28.65 (0.58)
29.30 (0.44)
> 12 yrs 32.60 (0.12)
30.13 (0.40)
30.52 (0.39)
31.11 (0.44)
31.39 (0.41)
30.79 (0.45)
31.01 (0.36)
31.34 (0.33)
31.86 (0.38)
31.66 (0.35)
32.13 (0.34)
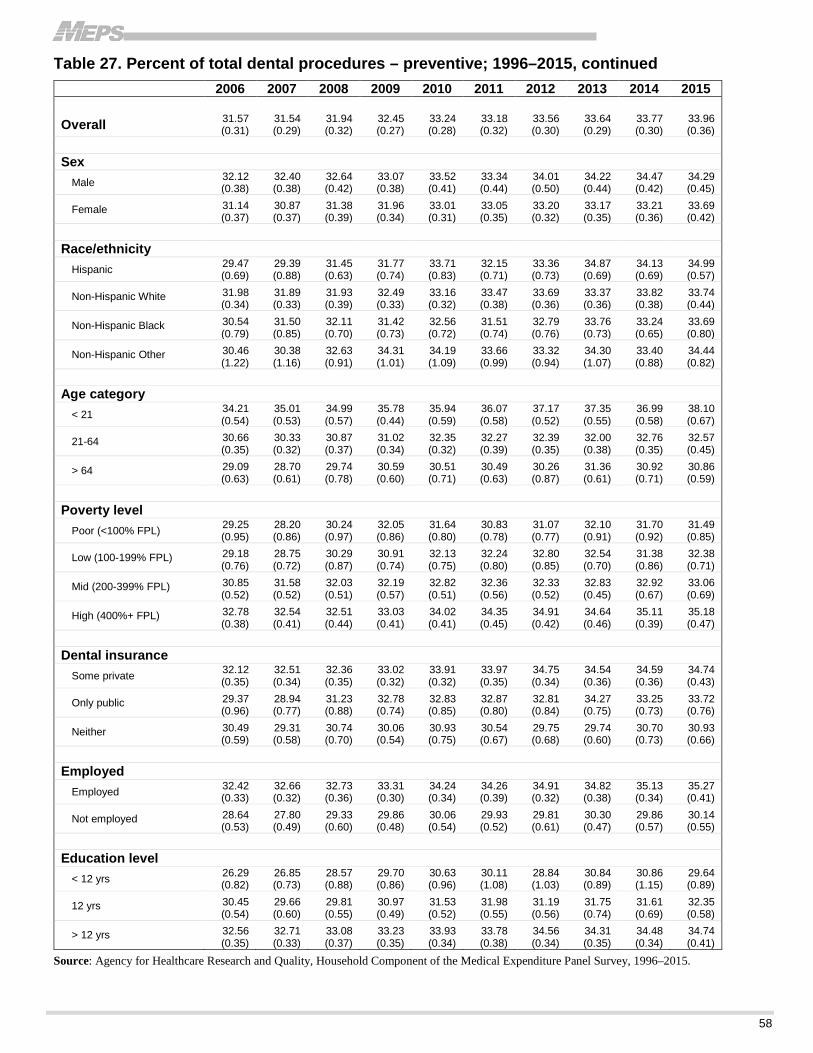
58
Table 27. Percent of total dental procedures – preventive; 1996–2015, continued
2006 2007 2008 2009 2010 2011 2012 2013 2014 2015
Overall 31.57 (0.31)
31.54 (0.29)
31.94 (0.32)
32.45 (0.27)
33.24 (0.28)
33.18 (0.32)
33.56 (0.30)
33.64 (0.29)
33.77 (0.30)
33.96 (0.36)
Sex
Male 32.12 (0.38)
32.40 (0.38)
32.64 (0.42)
33.07 (0.38)
33.52 (0.41)
33.34 (0.44)
34.01 (0.50)
34.22 (0.44)
34.47 (0.42)
34.29 (0.45)
Female 31.14 (0.37)
30.87 (0.37)
31.38 (0.39)
31.96 (0.34)
33.01 (0.31)
33.05 (0.35)
33.20 (0.32)
33.17 (0.35)
33.21 (0.36)
33.69 (0.42)
Race/ethnicity
Hispanic 29.47 (0.69)
29.39 (0.88)
31.45 (0.63)
31.77 (0.74)
33.71 (0.83)
32.15 (0.71)
33.36 (0.73)
34.87 (0.69)
34.13 (0.69)
34.99 (0.57)
Non-Hispanic White 31.98 (0.34)
31.89 (0.33)
31.93 (0.39)
32.49 (0.33)
33.16 (0.32)
33.47 (0.38)
33.69 (0.36)
33.37 (0.36)
33.82 (0.38)
33.74 (0.44)
Non-Hispanic Black 30.54 (0.79)
31.50 (0.85)
32.11 (0.70)
31.42 (0.73)
32.56 (0.72)
31.51 (0.74)
32.79 (0.76)
33.76 (0.73)
33.24 (0.65)
33.69 (0.80)
Non-Hispanic Other 30.46 (1.22)
30.38 (1.16)
32.63 (0.91)
34.31 (1.01)
34.19 (1.09)
33.66 (0.99)
33.32 (0.94)
34.30 (1.07)
33.40 (0.88)
34.44 (0.82)
Age category
< 21 34.21 (0.54)
35.01 (0.53)
34.99 (0.57)
35.78 (0.44)
35.94 (0.59)
36.07 (0.58)
37.17 (0.52)
37.35 (0.55)
36.99 (0.58)
38.10 (0.67)
21-64 30.66 (0.35)
30.33 (0.32)
30.87 (0.37)
31.02 (0.34)
32.35 (0.32)
32.27 (0.39)
32.39 (0.35)
32.00 (0.38)
32.76 (0.35)
32.57 (0.45)
> 64 29.09 (0.63)
28.70 (0.61)
29.74 (0.78)
30.59 (0.60)
30.51 (0.71)
30.49 (0.63)
30.26 (0.87)
31.36 (0.61)
30.92 (0.71)
30.86 (0.59)
Poverty level
Poor (<100% FPL) 29.25 (0.95)
28.20 (0.86)
30.24 (0.97)
32.05 (0.86)
31.64 (0.80)
30.83 (0.78)
31.07 (0.77)
32.10 (0.91)
31.70 (0.92)
31.49 (0.85)
Low (100-199% FPL) 29.18 (0.76)
28.75 (0.72)
30.29 (0.87)
30.91 (0.74)
32.13 (0.75)
32.24 (0.80)
32.80 (0.85)
32.54 (0.70)
31.38 (0.86)
32.38 (0.71)
Mid (200-399% FPL) 30.85 (0.52)
31.58 (0.52)
32.03 (0.51)
32.19 (0.57)
32.82 (0.51)
32.36 (0.56)
32.33 (0.52)
32.83 (0.45)
32.92 (0.67)
33.06 (0.69)
High (400%+ FPL) 32.78 (0.38)
32.54 (0.41)
32.51 (0.44)
33.03 (0.41)
34.02 (0.41)
34.35 (0.45)
34.91 (0.42)
34.64 (0.46)
35.11 (0.39)
35.18 (0.47)
Dental insurance
Some private 32.12 (0.35)
32.51 (0.34)
32.36 (0.35)
33.02 (0.32)
33.91 (0.32)
33.97 (0.35)
34.75 (0.34)
34.54 (0.36)
34.59 (0.36)
34.74 (0.43)
Only public 29.37 (0.96)
28.94 (0.77)
31.23 (0.88)
32.78 (0.74)
32.83 (0.85)
32.87 (0.80)
32.81 (0.84)
34.27 (0.75)
33.25 (0.73)
33.72 (0.76)
Neither 30.49 (0.59)
29.31 (0.58)
30.74 (0.70)
30.06 (0.54)
30.93 (0.75)
30.54 (0.67)
29.75 (0.68)
29.74 (0.60)
30.70 (0.73)
30.93 (0.66)
Employed
Employed 32.42 (0.33)
32.66 (0.32)
32.73 (0.36)
33.31 (0.30)
34.24 (0.34)
34.26 (0.39)
34.91 (0.32)
34.82 (0.38)
35.13 (0.34)
35.27 (0.41)
Not employed 28.64 (0.53)
27.80 (0.49)
29.33 (0.60)
29.86 (0.48)
30.06 (0.54)
29.93 (0.52)
29.81 (0.61)
30.30 (0.47)
29.86 (0.57)
30.14 (0.55)
Education level
< 12 yrs 26.29 (0.82)
26.85 (0.73)
28.57 (0.88)
29.70 (0.86)
30.63 (0.96)
30.11 (1.08)
28.84 (1.03)
30.84 (0.89)
30.86 (1.15)
29.64 (0.89)
12 yrs 30.45 (0.54)
29.66 (0.60)
29.81 (0.55)
30.97 (0.49)
31.53 (0.52)
31.98 (0.55)
31.19 (0.56)
31.75 (0.74)
31.61 (0.69)
32.35 (0.58)
> 12 yrs 32.56 (0.35)
32.71 (0.33)
33.08 (0.37)
33.23 (0.35)
33.93 (0.34)
33.78 (0.38)
34.56 (0.34)
34.31 (0.35)
34.48 (0.34)
34.74 (0.41)
Source: Agency for Healthcare Research and Quality, Household Component of the Medical Expenditure Panel Survey, 1996–2015.
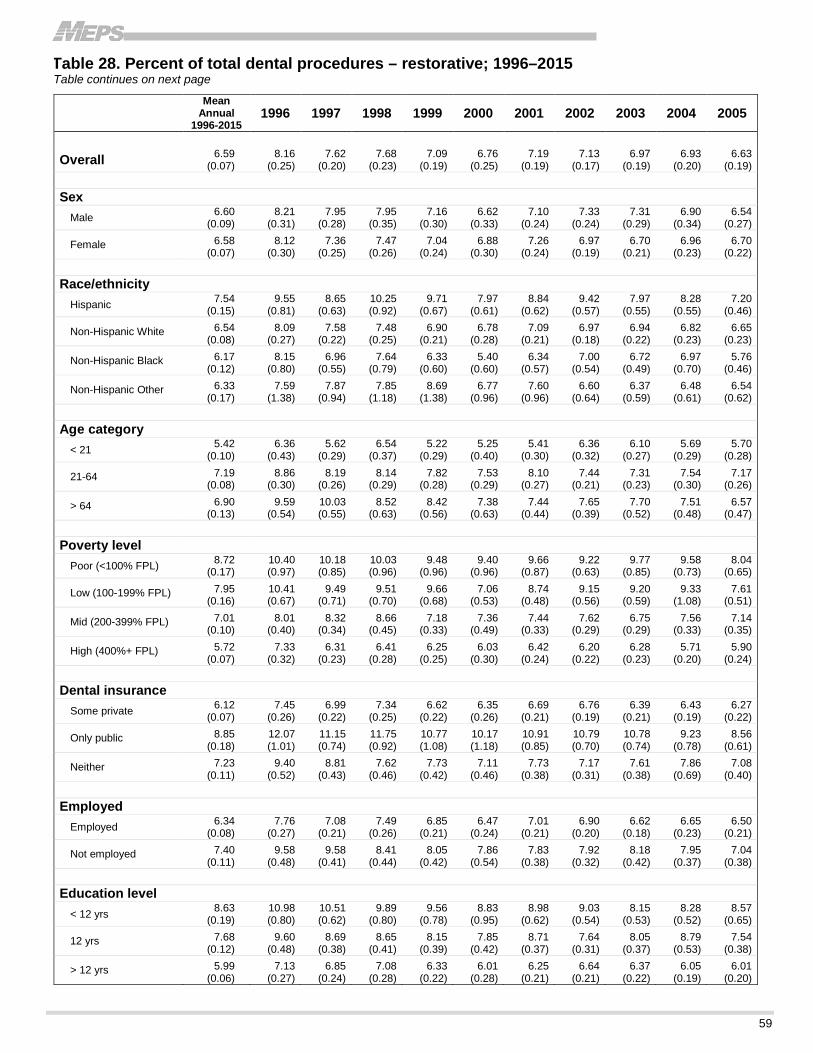
59
Table 28. Percent of total dental procedures – restorative; 1996–2015 Table continues on next page
Mean Annual
1996-2015 1996 1997 1998 1999 2000 2001 2002 2003 2004 2005
Overall 6.59 (0.07)
8.16 (0.25)
7.62 (0.20)
7.68 (0.23)
7.09 (0.19)
6.76 (0.25)
7.19 (0.19)
7.13 (0.17)
6.97 (0.19)
6.93 (0.20)
6.63 (0.19)
Sex Male 6.60
(0.09) 8.21
(0.31) 7.95
(0.28) 7.95
(0.35) 7.16
(0.30) 6.62
(0.33) 7.10
(0.24) 7.33
(0.24) 7.31
(0.29) 6.90
(0.34) 6.54
(0.27)
Female 6.58 (0.07)
8.12 (0.30)
7.36 (0.25)
7.47 (0.26)
7.04 (0.24)
6.88 (0.30)
7.26 (0.24)
6.97 (0.19)
6.70 (0.21)
6.96 (0.23)
6.70 (0.22)
Race/ethnicity Hispanic 7.54
(0.15) 9.55
(0.81) 8.65
(0.63) 10.25 (0.92)
9.71 (0.67)
7.97 (0.61)
8.84 (0.62)
9.42 (0.57)
7.97 (0.55)
8.28 (0.55)
7.20 (0.46)
Non-Hispanic White 6.54 (0.08)
8.09 (0.27)
7.58 (0.22)
7.48 (0.25)
6.90 (0.21)
6.78 (0.28)
7.09 (0.21)
6.97 (0.18)
6.94 (0.22)
6.82 (0.23)
6.65 (0.23)
Non-Hispanic Black 6.17 (0.12)
8.15 (0.80)
6.96 (0.55)
7.64 (0.79)
6.33 (0.60)
5.40 (0.60)
6.34 (0.57)
7.00 (0.54)
6.72 (0.49)
6.97 (0.70)
5.76 (0.46)
Non-Hispanic Other 6.33 (0.17)
7.59 (1.38)
7.87 (0.94)
7.85 (1.18)
8.69 (1.38)
6.77 (0.96)
7.60 (0.96)
6.60 (0.64)
6.37 (0.59)
6.48 (0.61)
6.54 (0.62)
Age category < 21 5.42
(0.10) 6.36
(0.43) 5.62
(0.29) 6.54
(0.37) 5.22
(0.29) 5.25
(0.40) 5.41
(0.30) 6.36
(0.32) 6.10
(0.27) 5.69
(0.29) 5.70
(0.28)
21-64 7.19 (0.08)
8.86 (0.30)
8.19 (0.26)
8.14 (0.29)
7.82 (0.28)
7.53 (0.29)
8.10 (0.27)
7.44 (0.21)
7.31 (0.23)
7.54 (0.30)
7.17 (0.26)
> 64 6.90 (0.13)
9.59 (0.54)
10.03 (0.55)
8.52 (0.63)
8.42 (0.56)
7.38 (0.63)
7.44 (0.44)
7.65 (0.39)
7.70 (0.52)
7.51 (0.48)
6.57 (0.47)
Poverty level Poor (<100% FPL) 8.72
(0.17) 10.40 (0.97)
10.18 (0.85)
10.03 (0.96)
9.48 (0.96)
9.40 (0.96)
9.66 (0.87)
9.22 (0.63)
9.77 (0.85)
9.58 (0.73)
8.04 (0.65)
Low (100-199% FPL) 7.95 (0.16)
10.41 (0.67)
9.49 (0.71)
9.51 (0.70)
9.66 (0.68)
7.06 (0.53)
8.74 (0.48)
9.15 (0.56)
9.20 (0.59)
9.33 (1.08)
7.61 (0.51)
Mid (200-399% FPL) 7.01 (0.10)
8.01 (0.40)
8.32 (0.34)
8.66 (0.45)
7.18 (0.33)
7.36 (0.49)
7.44 (0.33)
7.62 (0.29)
6.75 (0.29)
7.56 (0.33)
7.14 (0.35)
High (400%+ FPL) 5.72 (0.07)
7.33 (0.32)
6.31 (0.23)
6.41 (0.28)
6.25 (0.25)
6.03 (0.30)
6.42 (0.24)
6.20 (0.22)
6.28 (0.23)
5.71 (0.20)
5.90 (0.24)
Dental insurance Some private 6.12
(0.07) 7.45
(0.26) 6.99
(0.22) 7.34
(0.25) 6.62
(0.22) 6.35
(0.26) 6.69
(0.21) 6.76
(0.19) 6.39
(0.21) 6.43
(0.19) 6.27
(0.22)
Only public 8.85 (0.18)
12.07 (1.01)
11.15 (0.74)
11.75 (0.92)
10.77 (1.08)
10.17 (1.18)
10.91 (0.85)
10.79 (0.70)
10.78 (0.74)
9.23 (0.78)
8.56 (0.61)
Neither 7.23 (0.11)
9.40 (0.52)
8.81 (0.43)
7.62 (0.46)
7.73 (0.42)
7.11 (0.46)
7.73 (0.38)
7.17 (0.31)
7.61 (0.38)
7.86 (0.69)
7.08 (0.40)
Employed Employed 6.34
(0.08) 7.76
(0.27) 7.08
(0.21) 7.49
(0.26) 6.85
(0.21) 6.47
(0.24) 7.01
(0.21) 6.90
(0.20) 6.62
(0.18) 6.65
(0.23) 6.50
(0.21)
Not employed 7.40 (0.11)
9.58 (0.48)
9.58 (0.41)
8.41 (0.44)
8.05 (0.42)
7.86 (0.54)
7.83 (0.38)
7.92 (0.32)
8.18 (0.42)
7.95 (0.37)
7.04 (0.38)
Education level < 12 yrs 8.63
(0.19) 10.98 (0.80)
10.51 (0.62)
9.89 (0.80)
9.56 (0.78)
8.83 (0.95)
8.98 (0.62)
9.03 (0.54)
8.15 (0.53)
8.28 (0.52)
8.57 (0.65)
12 yrs 7.68 (0.12)
9.60 (0.48)
8.69 (0.38)
8.65 (0.41)
8.15 (0.39)
7.85 (0.42)
8.71 (0.37)
7.64 (0.31)
8.05 (0.37)
8.79 (0.53)
7.54 (0.38)
> 12 yrs 5.99 (0.06)
7.13 (0.27)
6.85 (0.24)
7.08 (0.28)
6.33 (0.22)
6.01 (0.28)
6.25 (0.21)
6.64 (0.21)
6.37 (0.22)
6.05 (0.19)
6.01 (0.20)
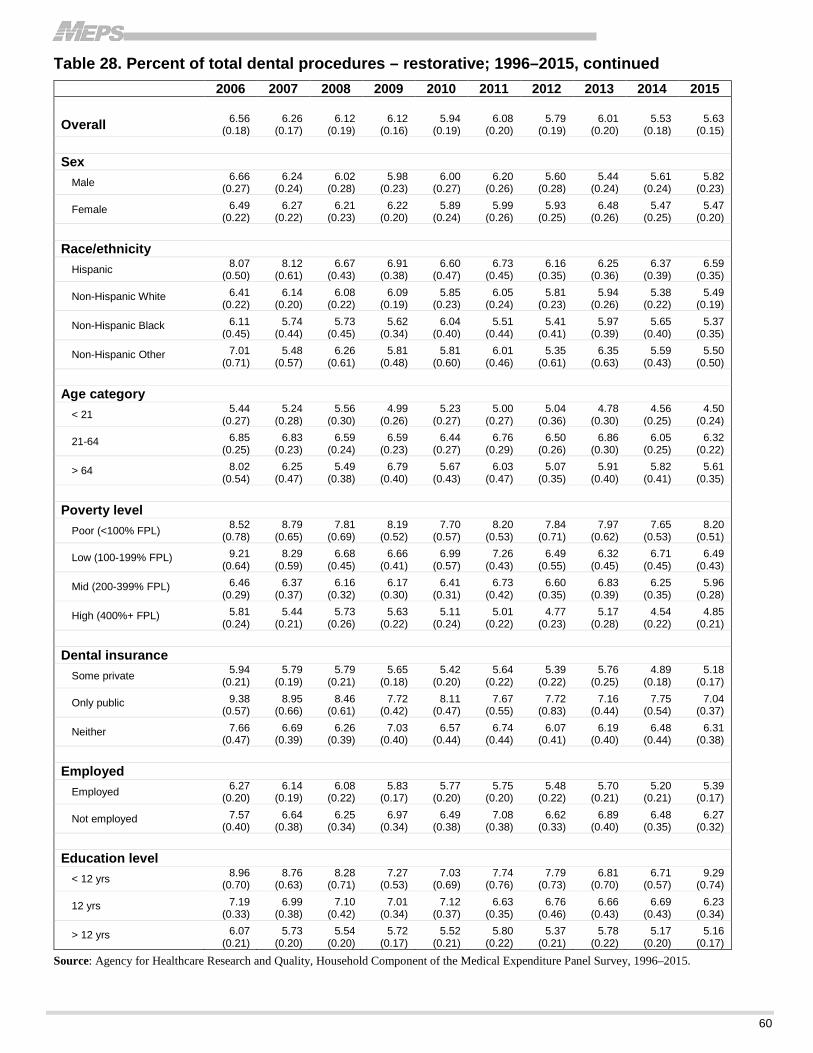
60
Table 28. Percent of total dental procedures – restorative; 1996–2015, continued
2006 2007 2008 2009 2010 2011 2012 2013 2014 2015
Overall 6.56 (0.18)
6.26 (0.17)
6.12 (0.19)
6.12 (0.16)
5.94 (0.19)
6.08 (0.20)
5.79 (0.19)
6.01 (0.20)
5.53 (0.18)
5.63 (0.15)
Sex
Male 6.66 (0.27)
6.24 (0.24)
6.02 (0.28)
5.98 (0.23)
6.00 (0.27)
6.20 (0.26)
5.60 (0.28)
5.44 (0.24)
5.61 (0.24)
5.82 (0.23)
Female 6.49 (0.22)
6.27 (0.22)
6.21 (0.23)
6.22 (0.20)
5.89 (0.24)
5.99 (0.26)
5.93 (0.25)
6.48 (0.26)
5.47 (0.25)
5.47 (0.20)
Race/ethnicity
Hispanic 8.07 (0.50)
8.12 (0.61)
6.67 (0.43)
6.91 (0.38)
6.60 (0.47)
6.73 (0.45)
6.16 (0.35)
6.25 (0.36)
6.37 (0.39)
6.59 (0.35)
Non-Hispanic White 6.41 (0.22)
6.14 (0.20)
6.08 (0.22)
6.09 (0.19)
5.85 (0.23)
6.05 (0.24)
5.81 (0.23)
5.94 (0.26)
5.38 (0.22)
5.49 (0.19)
Non-Hispanic Black 6.11 (0.45)
5.74 (0.44)
5.73 (0.45)
5.62 (0.34)
6.04 (0.40)
5.51 (0.44)
5.41 (0.41)
5.97 (0.39)
5.65 (0.40)
5.37 (0.35)
Non-Hispanic Other 7.01 (0.71)
5.48 (0.57)
6.26 (0.61)
5.81 (0.48)
5.81 (0.60)
6.01 (0.46)
5.35 (0.61)
6.35 (0.63)
5.59 (0.43)
5.50 (0.50)
Age category
< 21 5.44 (0.27)
5.24 (0.28)
5.56 (0.30)
4.99 (0.26)
5.23 (0.27)
5.00 (0.27)
5.04 (0.36)
4.78 (0.30)
4.56 (0.25)
4.50 (0.24)
21-64 6.85 (0.25)
6.83 (0.23)
6.59 (0.24)
6.59 (0.23)
6.44 (0.27)
6.76 (0.29)
6.50 (0.26)
6.86 (0.30)
6.05 (0.25)
6.32 (0.22)
> 64 8.02 (0.54)
6.25 (0.47)
5.49 (0.38)
6.79 (0.40)
5.67 (0.43)
6.03 (0.47)
5.07 (0.35)
5.91 (0.40)
5.82 (0.41)
5.61 (0.35)
Poverty level
Poor (<100% FPL) 8.52 (0.78)
8.79 (0.65)
7.81 (0.69)
8.19 (0.52)
7.70 (0.57)
8.20 (0.53)
7.84 (0.71)
7.97 (0.62)
7.65 (0.53)
8.20 (0.51)
Low (100-199% FPL) 9.21 (0.64)
8.29 (0.59)
6.68 (0.45)
6.66 (0.41)
6.99 (0.57)
7.26 (0.43)
6.49 (0.55)
6.32 (0.45)
6.71 (0.45)
6.49 (0.43)
Mid (200-399% FPL) 6.46 (0.29)
6.37 (0.37)
6.16 (0.32)
6.17 (0.30)
6.41 (0.31)
6.73 (0.42)
6.60 (0.35)
6.83 (0.39)
6.25 (0.35)
5.96 (0.28)
High (400%+ FPL) 5.81 (0.24)
5.44 (0.21)
5.73 (0.26)
5.63 (0.22)
5.11 (0.24)
5.01 (0.22)
4.77 (0.23)
5.17 (0.28)
4.54 (0.22)
4.85 (0.21)
Dental insurance
Some private 5.94 (0.21)
5.79 (0.19)
5.79 (0.21)
5.65 (0.18)
5.42 (0.20)
5.64 (0.22)
5.39 (0.22)
5.76 (0.25)
4.89 (0.18)
5.18 (0.17)
Only public 9.38 (0.57)
8.95 (0.66)
8.46 (0.61)
7.72 (0.42)
8.11 (0.47)
7.67 (0.55)
7.72 (0.83)
7.16 (0.44)
7.75 (0.54)
7.04 (0.37)
Neither 7.66 (0.47)
6.69 (0.39)
6.26 (0.39)
7.03 (0.40)
6.57 (0.44)
6.74 (0.44)
6.07 (0.41)
6.19 (0.40)
6.48 (0.44)
6.31 (0.38)
Employed
Employed 6.27 (0.20)
6.14 (0.19)
6.08 (0.22)
5.83 (0.17)
5.77 (0.20)
5.75 (0.20)
5.48 (0.22)
5.70 (0.21)
5.20 (0.21)
5.39 (0.17)
Not employed 7.57 (0.40)
6.64 (0.38)
6.25 (0.34)
6.97 (0.34)
6.49 (0.38)
7.08 (0.38)
6.62 (0.33)
6.89 (0.40)
6.48 (0.35)
6.27 (0.32)
Education level
< 12 yrs 8.96 (0.70)
8.76 (0.63)
8.28 (0.71)
7.27 (0.53)
7.03 (0.69)
7.74 (0.76)
7.79 (0.73)
6.81 (0.70)
6.71 (0.57)
9.29 (0.74)
12 yrs 7.19 (0.33)
6.99 (0.38)
7.10 (0.42)
7.01 (0.34)
7.12 (0.37)
6.63 (0.35)
6.76 (0.46)
6.66 (0.43)
6.69 (0.43)
6.23 (0.34)
> 12 yrs 6.07 (0.21)
5.73 (0.20)
5.54 (0.20)
5.72 (0.17)
5.52 (0.21)
5.80 (0.22)
5.37 (0.21)
5.78 (0.22)
5.17 (0.20)
5.16 (0.17)
Source: Agency for Healthcare Research and Quality, Household Component of the Medical Expenditure Panel Survey, 1996–2015.
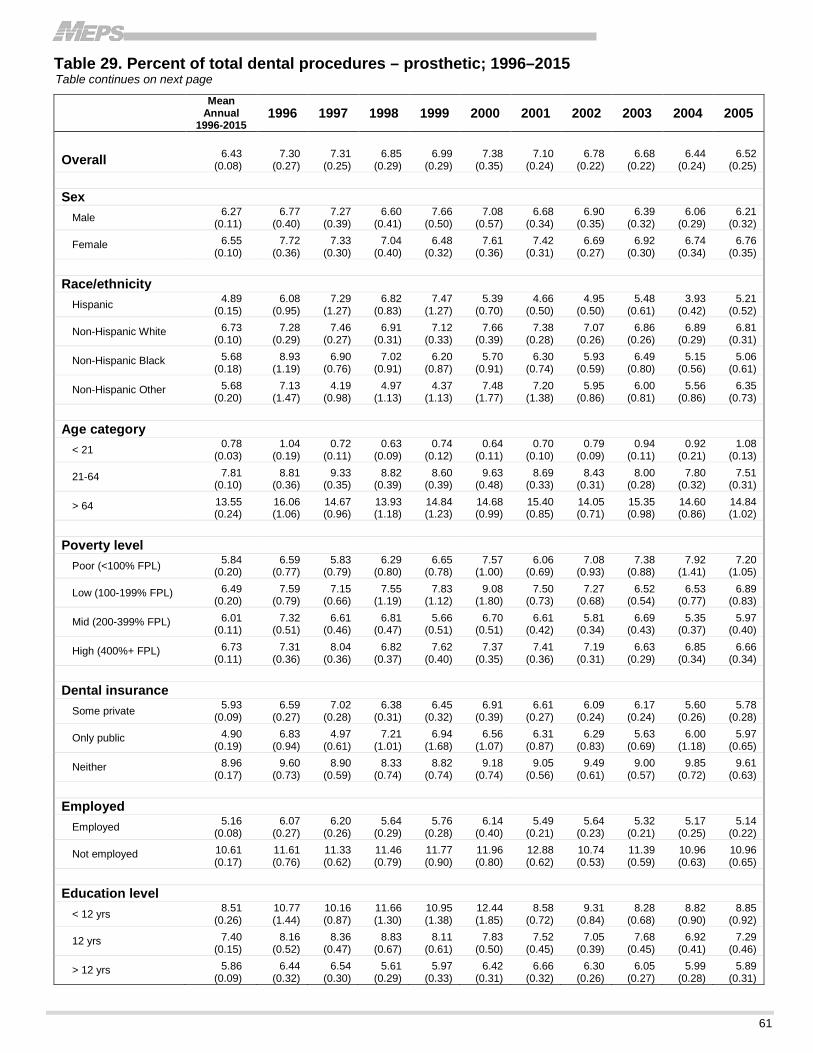
61
Table 29. Percent of total dental procedures – prosthetic; 1996–2015 Table continues on next page
Mean Annual
1996-2015 1996 1997 1998 1999 2000 2001 2002 2003 2004 2005
Overall 6.43 (0.08)
7.30 (0.27)
7.31 (0.25)
6.85 (0.29)
6.99 (0.29)
7.38 (0.35)
7.10 (0.24)
6.78 (0.22)
6.68 (0.22)
6.44 (0.24)
6.52 (0.25)
Sex
Male 6.27 (0.11)
6.77 (0.40)
7.27 (0.39)
6.60 (0.41)
7.66 (0.50)
7.08 (0.57)
6.68 (0.34)
6.90 (0.35)
6.39 (0.32)
6.06 (0.29)
6.21 (0.32)
Female 6.55 (0.10)
7.72 (0.36)
7.33 (0.30)
7.04 (0.40)
6.48 (0.32)
7.61 (0.36)
7.42 (0.31)
6.69 (0.27)
6.92 (0.30)
6.74 (0.34)
6.76 (0.35)
Race/ethnicity
Hispanic 4.89 (0.15)
6.08 (0.95)
7.29 (1.27)
6.82 (0.83)
7.47 (1.27)
5.39 (0.70)
4.66 (0.50)
4.95 (0.50)
5.48 (0.61)
3.93 (0.42)
5.21 (0.52)
Non-Hispanic White 6.73 (0.10)
7.28 (0.29)
7.46 (0.27)
6.91 (0.31)
7.12 (0.33)
7.66 (0.39)
7.38 (0.28)
7.07 (0.26)
6.86 (0.26)
6.89 (0.29)
6.81 (0.31)
Non-Hispanic Black 5.68 (0.18)
8.93 (1.19)
6.90 (0.76)
7.02 (0.91)
6.20 (0.87)
5.70 (0.91)
6.30 (0.74)
5.93 (0.59)
6.49 (0.80)
5.15 (0.56)
5.06 (0.61)
Non-Hispanic Other 5.68 (0.20)
7.13 (1.47)
4.19 (0.98)
4.97 (1.13)
4.37 (1.13)
7.48 (1.77)
7.20 (1.38)
5.95 (0.86)
6.00 (0.81)
5.56 (0.86)
6.35 (0.73)
Age category
< 21 0.78 (0.03)
1.04 (0.19)
0.72 (0.11)
0.63 (0.09)
0.74 (0.12)
0.64 (0.11)
0.70 (0.10)
0.79 (0.09)
0.94 (0.11)
0.92 (0.21)
1.08 (0.13)
21-64 7.81 (0.10)
8.81 (0.36)
9.33 (0.35)
8.82 (0.39)
8.60 (0.39)
9.63 (0.48)
8.69 (0.33)
8.43 (0.31)
8.00 (0.28)
7.80 (0.32)
7.51 (0.31)
> 64 13.55 (0.24)
16.06 (1.06)
14.67 (0.96)
13.93 (1.18)
14.84 (1.23)
14.68 (0.99)
15.40 (0.85)
14.05 (0.71)
15.35 (0.98)
14.60 (0.86)
14.84 (1.02)
Poverty level
Poor (<100% FPL) 5.84 (0.20)
6.59 (0.77)
5.83 (0.79)
6.29 (0.80)
6.65 (0.78)
7.57 (1.00)
6.06 (0.69)
7.08 (0.93)
7.38 (0.88)
7.92 (1.41)
7.20 (1.05)
Low (100-199% FPL) 6.49 (0.20)
7.59 (0.79)
7.15 (0.66)
7.55 (1.19)
7.83 (1.12)
9.08 (1.80)
7.50 (0.73)
7.27 (0.68)
6.52 (0.54)
6.53 (0.77)
6.89 (0.83)
Mid (200-399% FPL) 6.01 (0.11)
7.32 (0.51)
6.61 (0.46)
6.81 (0.47)
5.66 (0.51)
6.70 (0.51)
6.61 (0.42)
5.81 (0.34)
6.69 (0.43)
5.35 (0.37)
5.97 (0.40)
High (400%+ FPL) 6.73 (0.11)
7.31 (0.36)
8.04 (0.36)
6.82 (0.37)
7.62 (0.40)
7.37 (0.35)
7.41 (0.36)
7.19 (0.31)
6.63 (0.29)
6.85 (0.34)
6.66 (0.34)
Dental insurance
Some private 5.93 (0.09)
6.59 (0.27)
7.02 (0.28)
6.38 (0.31)
6.45 (0.32)
6.91 (0.39)
6.61 (0.27)
6.09 (0.24)
6.17 (0.24)
5.60 (0.26)
5.78 (0.28)
Only public 4.90 (0.19)
6.83 (0.94)
4.97 (0.61)
7.21 (1.01)
6.94 (1.68)
6.56 (1.07)
6.31 (0.87)
6.29 (0.83)
5.63 (0.69)
6.00 (1.18)
5.97 (0.65)
Neither 8.96 (0.17)
9.60 (0.73)
8.90 (0.59)
8.33 (0.74)
8.82 (0.74)
9.18 (0.74)
9.05 (0.56)
9.49 (0.61)
9.00 (0.57)
9.85 (0.72)
9.61 (0.63)
Employed
Employed 5.16 (0.08)
6.07 (0.27)
6.20 (0.26)
5.64 (0.29)
5.76 (0.28)
6.14 (0.40)
5.49 (0.21)
5.64 (0.23)
5.32 (0.21)
5.17 (0.25)
5.14 (0.22)
Not employed 10.61 (0.17)
11.61 (0.76)
11.33 (0.62)
11.46 (0.79)
11.77 (0.90)
11.96 (0.80)
12.88 (0.62)
10.74 (0.53)
11.39 (0.59)
10.96 (0.63)
10.96 (0.65)
Education level
< 12 yrs 8.51 (0.26)
10.77 (1.44)
10.16 (0.87)
11.66 (1.30)
10.95 (1.38)
12.44 (1.85)
8.58 (0.72)
9.31 (0.84)
8.28 (0.68)
8.82 (0.90)
8.85 (0.92)
12 yrs 7.40 (0.15)
8.16 (0.52)
8.36 (0.47)
8.83 (0.67)
8.11 (0.61)
7.83 (0.50)
7.52 (0.45)
7.05 (0.39)
7.68 (0.45)
6.92 (0.41)
7.29 (0.46)
> 12 yrs 5.86 (0.09)
6.44 (0.32)
6.54 (0.30)
5.61 (0.29)
5.97 (0.33)
6.42 (0.31)
6.66 (0.32)
6.30 (0.26)
6.05 (0.27)
5.99 (0.28)
5.89 (0.31)
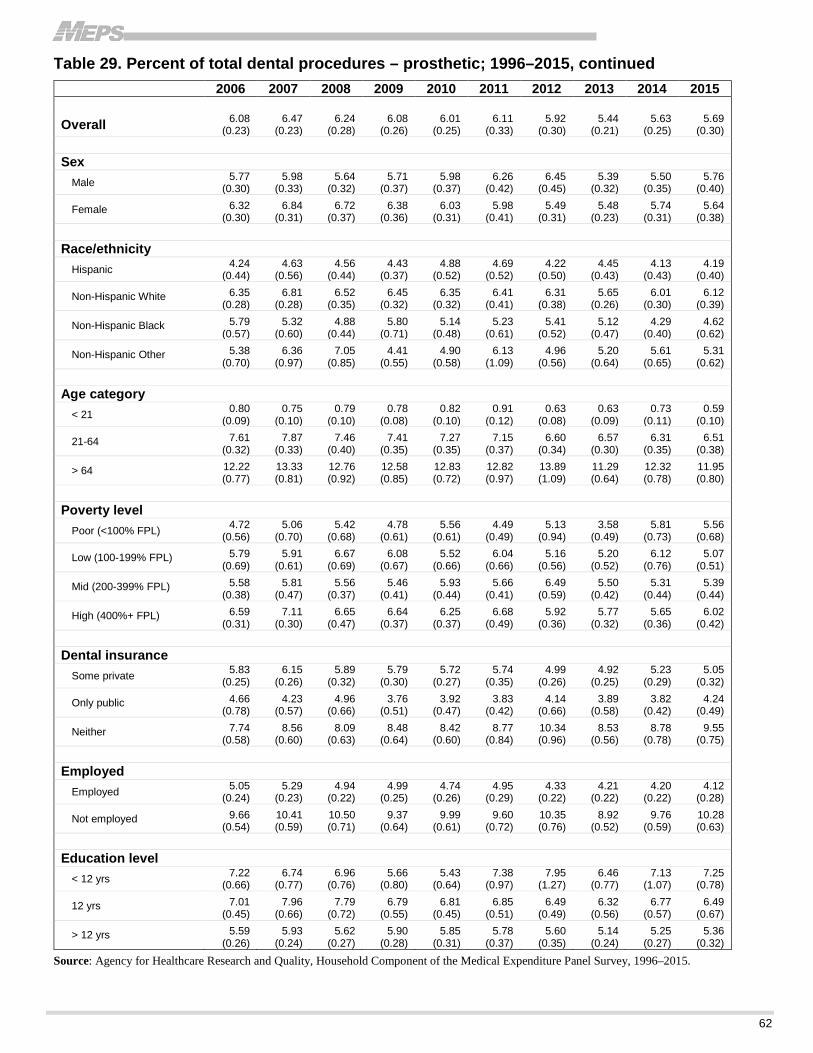
62
Table 29. Percent of total dental procedures – prosthetic; 1996–2015, continued 2006 2007 2008 2009 2010 2011 2012 2013 2014 2015
Overall 6.08 (0.23)
6.47 (0.23)
6.24 (0.28)
6.08 (0.26)
6.01 (0.25)
6.11 (0.33)
5.92 (0.30)
5.44 (0.21)
5.63 (0.25)
5.69 (0.30)
Sex Male 5.77
(0.30) 5.98
(0.33) 5.64
(0.32) 5.71
(0.37) 5.98
(0.37) 6.26
(0.42) 6.45
(0.45) 5.39
(0.32) 5.50
(0.35) 5.76
(0.40)
Female 6.32 (0.30)
6.84 (0.31)
6.72 (0.37)
6.38 (0.36)
6.03 (0.31)
5.98 (0.41)
5.49 (0.31)
5.48 (0.23)
5.74 (0.31)
5.64 (0.38)
Race/ethnicity Hispanic 4.24
(0.44) 4.63
(0.56) 4.56
(0.44) 4.43
(0.37) 4.88
(0.52) 4.69
(0.52) 4.22
(0.50) 4.45
(0.43) 4.13
(0.43) 4.19
(0.40)
Non-Hispanic White 6.35 (0.28)
6.81 (0.28)
6.52 (0.35)
6.45 (0.32)
6.35 (0.32)
6.41 (0.41)
6.31 (0.38)
5.65 (0.26)
6.01 (0.30)
6.12 (0.39)
Non-Hispanic Black 5.79 (0.57)
5.32 (0.60)
4.88 (0.44)
5.80 (0.71)
5.14 (0.48)
5.23 (0.61)
5.41 (0.52)
5.12 (0.47)
4.29 (0.40)
4.62 (0.62)
Non-Hispanic Other 5.38 (0.70)
6.36 (0.97)
7.05 (0.85)
4.41 (0.55)
4.90 (0.58)
6.13 (1.09)
4.96 (0.56)
5.20 (0.64)
5.61 (0.65)
5.31 (0.62)
Age category < 21 0.80
(0.09) 0.75
(0.10) 0.79
(0.10) 0.78
(0.08) 0.82
(0.10) 0.91
(0.12) 0.63
(0.08) 0.63
(0.09) 0.73
(0.11) 0.59
(0.10)
21-64 7.61 (0.32)
7.87 (0.33)
7.46 (0.40)
7.41 (0.35)
7.27 (0.35)
7.15 (0.37)
6.60 (0.34)
6.57 (0.30)
6.31 (0.35)
6.51 (0.38)
> 64 12.22 (0.77)
13.33 (0.81)
12.76 (0.92)
12.58 (0.85)
12.83 (0.72)
12.82 (0.97)
13.89 (1.09)
11.29 (0.64)
12.32 (0.78)
11.95 (0.80)
Poverty level Poor (<100% FPL) 4.72
(0.56) 5.06
(0.70) 5.42
(0.68) 4.78
(0.61) 5.56
(0.61) 4.49
(0.49) 5.13
(0.94) 3.58
(0.49) 5.81
(0.73) 5.56
(0.68)
Low (100-199% FPL) 5.79 (0.69)
5.91 (0.61)
6.67 (0.69)
6.08 (0.67)
5.52 (0.66)
6.04 (0.66)
5.16 (0.56)
5.20 (0.52)
6.12 (0.76)
5.07 (0.51)
Mid (200-399% FPL) 5.58 (0.38)
5.81 (0.47)
5.56 (0.37)
5.46 (0.41)
5.93 (0.44)
5.66 (0.41)
6.49 (0.59)
5.50 (0.42)
5.31 (0.44)
5.39 (0.44)
High (400%+ FPL) 6.59 (0.31)
7.11 (0.30)
6.65 (0.47)
6.64 (0.37)
6.25 (0.37)
6.68 (0.49)
5.92 (0.36)
5.77 (0.32)
5.65 (0.36)
6.02 (0.42)
Dental insurance Some private 5.83
(0.25) 6.15
(0.26) 5.89
(0.32) 5.79
(0.30) 5.72
(0.27) 5.74
(0.35) 4.99
(0.26) 4.92
(0.25) 5.23
(0.29) 5.05
(0.32)
Only public 4.66 (0.78)
4.23 (0.57)
4.96 (0.66)
3.76 (0.51)
3.92 (0.47)
3.83 (0.42)
4.14 (0.66)
3.89 (0.58)
3.82 (0.42)
4.24 (0.49)
Neither 7.74 (0.58)
8.56 (0.60)
8.09 (0.63)
8.48 (0.64)
8.42 (0.60)
8.77 (0.84)
10.34 (0.96)
8.53 (0.56)
8.78 (0.78)
9.55 (0.75)
Employed Employed 5.05
(0.24) 5.29
(0.23) 4.94
(0.22) 4.99
(0.25) 4.74
(0.26) 4.95
(0.29) 4.33
(0.22) 4.21
(0.22) 4.20
(0.22) 4.12
(0.28)
Not employed 9.66 (0.54)
10.41 (0.59)
10.50 (0.71)
9.37 (0.64)
9.99 (0.61)
9.60 (0.72)
10.35 (0.76)
8.92 (0.52)
9.76 (0.59)
10.28 (0.63)
Education level < 12 yrs 7.22
(0.66) 6.74
(0.77) 6.96
(0.76) 5.66
(0.80) 5.43
(0.64) 7.38
(0.97) 7.95
(1.27) 6.46
(0.77) 7.13
(1.07) 7.25
(0.78)
12 yrs 7.01 (0.45)
7.96 (0.66)
7.79 (0.72)
6.79 (0.55)
6.81 (0.45)
6.85 (0.51)
6.49 (0.49)
6.32 (0.56)
6.77 (0.57)
6.49 (0.67)
> 12 yrs 5.59 (0.26)
5.93 (0.24)
5.62 (0.27)
5.90 (0.28)
5.85 (0.31)
5.78 (0.37)
5.60 (0.35)
5.14 (0.24)
5.25 (0.27)
5.36 (0.32)
Source: Agency for Healthcare Research and Quality, Household Component of the Medical Expenditure Panel Survey, 1996–2015.

63
Table 30. Percent of total dental procedures – oral surgical; 1996–2015 Table continues on next page
Mean Annual
1996-2015 1996 1997 1998 1999 2000 2001 2002 2003 2004 2005
Overall 3.32 (0.05)
4.10 (0.16)
3.72 (0.15)
3.62 (0.15)
3.42 (0.16)
3.46 (0.16)
3.59 (0.15)
3.48 (0.12)
3.46 (0.14)
3.30 (0.13)
3.57 (0.17)
Sex
Male 3.46 (0.06)
4.28 (0.26)
4.10 (0.25)
3.49 (0.20)
3.61 (0.21)
3.58 (0.19)
3.98 (0.20)
3.84 (0.19)
3.61 (0.18)
3.61 (0.21)
3.66 (0.28)
Female 3.21 (0.05)
3.95 (0.19)
3.43 (0.16)
3.73 (0.20)
3.27 (0.22)
3.37 (0.22)
3.29 (0.19)
3.20 (0.14)
3.33 (0.19)
3.05 (0.15)
3.50 (0.19)
Race/ethnicity
Hispanic 4.18 (0.09)
5.45 (0.51)
6.24 (0.63)
5.41 (0.51)
4.47 (0.43)
4.75 (0.39)
5.32 (0.40)
5.18 (0.42)
5.10 (0.41)
4.26 (0.34)
4.61 (0.42)
Non-Hispanic White 3.01 (0.05)
3.73 (0.18)
3.23 (0.15)
3.15 (0.16)
3.14 (0.17)
3.15 (0.18)
3.18 (0.16)
3.11 (0.13)
3.05 (0.15)
2.99 (0.15)
3.13 (0.16)
Non-Hispanic Black 5.61 (0.17)
7.51 (0.77)
7.23 (0.70)
8.21 (0.74)
5.99 (0.67)
5.41 (0.67)
6.74 (0.65)
5.76 (0.46)
6.46 (0.58)
5.27 (0.54)
6.71 (1.31)
Non-Hispanic Other 3.38 (0.13)
4.46 (0.79)
4.19 (0.62)
3.10 (0.75)
3.07 (0.64)
4.86 (0.79)
3.46 (0.57)
3.94 (0.42)
3.46 (0.49)
3.66 (0.45)
3.99 (0.47)
Age category
< 21 2.26 (0.04)
2.98 (0.23)
2.29 (0.15)
2.24 (0.19)
2.44 (0.18)
2.35 (0.18)
2.50 (0.17)
2.58 (0.16)
2.45 (0.16)
2.22 (0.14)
2.55 (0.20)
21-64 3.79 (0.06)
4.58 (0.22)
4.43 (0.21)
4.05 (0.22)
3.79 (0.20)
3.92 (0.27)
3.99 (0.21)
3.93 (0.17)
3.90 (0.21)
3.80 (0.19)
3.91 (0.26)
> 64 3.89 (0.10)
4.79 (0.47)
4.16 (0.44)
5.25 (0.52)
4.14 (0.49)
4.32 (0.41)
4.43 (0.36)
3.73 (0.33)
4.01 (0.35)
3.90 (0.36)
4.55 (0.38)
Poverty level
Poor (<100% FPL) 6.32 (0.15)
7.82 (0.71)
6.99 (0.73)
7.09 (0.63)
6.75 (0.77)
6.62 (0.81)
7.22 (0.60)
6.80 (0.58)
6.73 (0.52)
6.36 (0.47)
6.51 (0.68)
Low (100-199% FPL) 5.46 (0.13)
6.49 (0.56)
6.38 (0.47)
7.36 (0.67)
6.06 (0.66)
5.68 (0.73)
5.63 (0.46)
5.91 (0.45)
6.43 (0.61)
6.19 (0.60)
6.52 (0.91)
Mid (200-399% FPL) 3.52 (0.07)
3.90 (0.27)
3.75 (0.24)
3.73 (0.27)
3.63 (0.26)
3.84 (0.29)
3.89 (0.27)
3.75 (0.21)
3.69 (0.23)
3.31 (0.20)
3.67 (0.25)
High (400%+ FPL) 2.28 (0.04)
3.03 (0.20)
2.60 (0.16)
2.37 (0.19)
2.38 (0.19)
2.36 (0.15)
2.56 (0.16)
2.44 (0.13)
2.29 (0.14)
2.27 (0.16)
2.43 (0.17)
Dental insurance
Some private 2.66 (0.04)
3.37 (0.17)
2.95 (0.14)
2.76 (0.15)
2.76 (0.17)
2.73 (0.16)
3.01 (0.16)
2.80 (0.12)
2.87 (0.15)
2.68 (0.13)
3.02 (0.20)
Only public 5.85 (0.15)
9.35 (0.88)
7.38 (0.61)
7.76 (0.76)
8.76 (1.11)
7.66 (1.22)
6.92 (0.68)
6.66 (0.48)
6.85 (0.53)
5.96 (0.42)
5.53 (0.57)
Neither 4.56 (0.10)
5.06 (0.36)
5.37 (0.41)
5.31 (0.42)
4.22 (0.32)
4.65 (0.36)
4.56 (0.30)
4.81 (0.30)
4.26 (0.29)
4.48 (0.42)
4.76 (0.32)
Employed
Employed 2.95 (0.04)
3.75 (0.17)
3.46 (0.16)
3.06 (0.15)
3.06 (0.15)
3.05 (0.16)
3.26 (0.15)
3.19 (0.12)
3.12 (0.15)
2.97 (0.14)
3.12 (0.19)
Not employed 4.54 (0.09)
5.32 (0.40)
4.69 (0.29)
5.76 (0.41)
4.80 (0.42)
5.01 (0.50)
4.77 (0.33)
4.52 (0.31)
4.62 (0.30)
4.47 (0.35)
5.02 (0.33)
Education level
< 12 yrs 7.71 (0.18)
9.61 (0.70)
8.67 (0.63)
10.36 (0.92)
8.33 (0.80)
8.36 (0.86)
8.04 (0.51)
8.18 (0.57)
8.37 (0.57)
8.18 (0.52)
8.21 (0.69)
12 yrs 4.47 (0.08)
5.29 (0.33)
4.54 (0.26)
4.74 (0.33)
4.49 (0.27)
4.07 (0.25)
4.61 (0.31)
4.25 (0.23)
4.19 (0.23)
4.25 (0.38)
4.51 (0.44)
> 12 yrs 2.43 (0.04)
2.79 (0.16)
2.80 (0.17)
2.49 (0.16)
2.25 (0.15)
2.46 (0.18)
2.48 (0.15)
2.50 (0.12)
2.54 (0.15)
2.33 (0.12)
2.58 (0.15)

64
Table 30. Percent of total dental procedures – oral surgical; 1996–2015, continued
2006 2007 2008 2009 2010 2011 2012 2013 2014 2015
Overall 3.11 (0.14)
3.10 (0.12)
3.16 (0.13)
3.10 (0.14)
3.01 (0.13)
2.91 (0.12)
3.05 (0.14)
3.23 (0.14)
3.03 (0.14)
3.19 (0.13)
Sex
Male 3.20 (0.20)
3.32 (0.19)
3.22 (0.18)
3.13 (0.20)
3.07 (0.17)
3.11 (0.17)
3.01 (0.17)
3.15 (0.20)
3.11 (0.18)
3.38 (0.20)
Female 3.04 (0.16)
2.93 (0.14)
3.11 (0.17)
3.07 (0.18)
2.97 (0.17)
2.75 (0.15)
3.09 (0.18)
3.30 (0.19)
2.96 (0.17)
3.03 (0.15)
Race/ethnicity
Hispanic 4.21 (0.29)
4.09 (0.39)
3.98 (0.35)
3.81 (0.26)
3.76 (0.32)
3.61 (0.29)
3.26 (0.23)
3.43 (0.28)
3.01 (0.24)
3.49 (0.25)
Non-Hispanic White 2.76 (0.16)
2.84 (0.14)
2.89 (0.16)
2.85 (0.17)
2.72 (0.16)
2.62 (0.14)
2.82 (0.16)
3.04 (0.18)
2.85 (0.17)
2.95 (0.16)
Non-Hispanic Black 6.07 (0.41)
4.48 (0.39)
5.21 (0.38)
5.34 (0.50)
5.01 (0.40)
4.64 (0.35)
4.67 (0.44)
4.77 (0.29)
4.07 (0.34)
4.51 (0.35)
Non-Hispanic Other 2.52 (0.38)
3.17 (0.44)
2.86 (0.38)
2.38 (0.33)
2.83 (0.32)
2.94 (0.43)
3.50 (0.41)
3.22 (0.33)
3.63 (0.48)
3.59 (0.49)
Age category
< 21 2.16 (0.14)
2.25 (0.15)
2.07 (0.18)
2.11 (0.14)
2.01 (0.17)
2.17 (0.18)
2.05 (0.15)
2.10 (0.16)
1.78 (0.15)
2.05 (0.15)
21-64 3.54 (0.21)
3.43 (0.18)
3.53 (0.17)
3.50 (0.19)
3.45 (0.18)
3.30 (0.16)
3.62 (0.23)
3.84 (0.22)
3.49 (0.19)
3.91 (0.23)
> 64 3.63 (0.32)
3.70 (0.33)
3.96 (0.41)
3.72 (0.42)
3.63 (0.39)
3.08 (0.28)
3.27 (0.29)
3.62 (0.35)
3.94 (0.34)
3.10 (0.26)
Poverty level
Poor (<100% FPL) 6.69 (0.57)
5.84 (0.54)
6.05 (0.54)
4.78 (0.44)
5.72 (0.44)
5.60 (0.50)
5.74 (0.45)
6.02 (0.49)
5.80 (0.53)
6.62 (0.60)
Low (100-199% FPL) 4.83 (0.37)
5.39 (0.40)
5.13 (0.44)
5.05 (0.53)
4.88 (0.42)
3.77 (0.33)
4.88 (0.39)
4.59 (0.39)
4.58 (0.42)
4.92 (0.45)
Mid (200-399% FPL) 3.31 (0.21)
3.20 (0.21)
3.18 (0.22)
3.40 (0.26)
3.33 (0.23)
3.26 (0.24)
3.33 (0.29)
3.35 (0.25)
3.37 (0.29)
3.50 (0.27)
High (400%+ FPL) 2.19 (0.17)
2.22 (0.14)
2.27 (0.17)
2.19 (0.15)
1.89 (0.15)
1.98 (0.14)
1.95 (0.17)
2.34 (0.19)
2.03 (0.15)
2.08 (0.14)
Dental insurance
Some private 2.50 (0.14)
2.50 (0.13)
2.60 (0.15)
2.47 (0.14)
2.41 (0.13)
2.27 (0.13)
2.30 (0.14)
2.51 (0.16)
2.40 (0.15)
2.43 (0.14)
Only public 5.91 (0.45)
5.54 (0.47)
5.25 (0.50)
4.90 (0.43)
4.57 (0.36)
4.98 (0.36)
5.25 (0.50)
4.72 (0.44)
4.73 (0.36)
5.52 (0.36)
Neither 4.17 (0.33)
4.14 (0.26)
4.23 (0.34)
4.53 (0.32)
4.35 (0.37)
3.95 (0.32)
4.47 (0.32)
4.99 (0.42)
4.33 (0.35)
4.43 (0.33)
Employed
Employed 2.81 (0.15)
2.78 (0.13)
2.88 (0.13)
2.62 (0.13)
2.59 (0.13)
2.58 (0.13)
2.74 (0.16)
2.83 (0.15)
2.50 (0.14)
2.77 (0.13)
Not employed 4.18 (0.25)
4.19 (0.27)
4.06 (0.31)
4.55 (0.31)
4.35 (0.31)
3.89 (0.27)
3.93 (0.24)
4.38 (0.31)
4.54 (0.30)
4.40 (0.30)
Education level
< 12 yrs 7.48 (0.49)
6.07 (0.46)
6.41 (0.63)
6.90 (0.50)
7.34 (0.67)
6.32 (0.66)
6.64 (0.58)
6.45 (0.62)
5.72 (0.60)
7.18 (0.64)
12 yrs 4.23 (0.31)
4.22 (0.27)
4.11 (0.31)
4.15 (0.32)
4.23 (0.30)
4.25 (0.29)
5.01 (0.41)
5.19 (0.36)
4.65 (0.37)
4.82 (0.32)
> 12 yrs 2.20 (0.15)
2.36 (0.12)
2.46 (0.14)
2.34 (0.14)
2.27 (0.14)
2.25 (0.13)
2.26 (0.13)
2.51 (0.14)
2.44 (0.13)
2.44 (0.14)
Source: Agency for Healthcare Research and Quality, Household Component of the Medical Expenditure Panel Survey, 1996–2015.
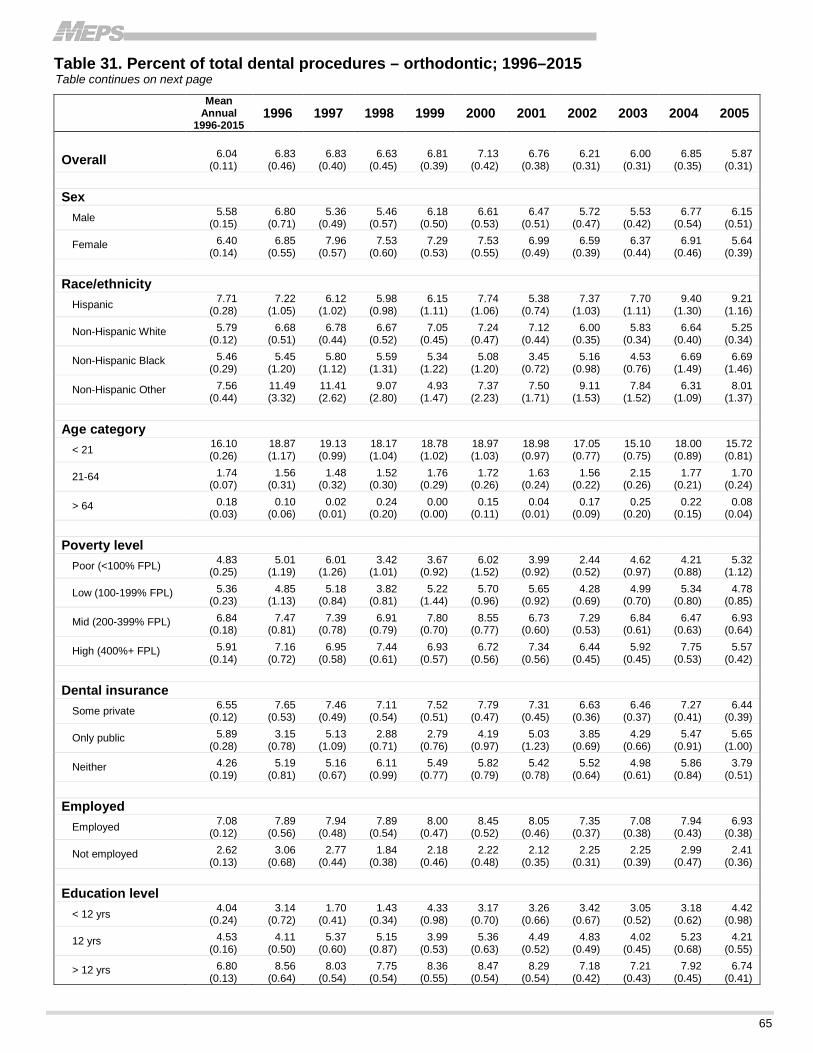
65
Table 31. Percent of total dental procedures – orthodontic; 1996–2015 Table continues on next page
Mean Annual
1996-2015 1996 1997 1998 1999 2000 2001 2002 2003 2004 2005
Overall 6.04 (0.11)
6.83 (0.46)
6.83 (0.40)
6.63 (0.45)
6.81 (0.39)
7.13 (0.42)
6.76 (0.38)
6.21 (0.31)
6.00 (0.31)
6.85 (0.35)
5.87 (0.31)
Sex
Male 5.58 (0.15)
6.80 (0.71)
5.36 (0.49)
5.46 (0.57)
6.18 (0.50)
6.61 (0.53)
6.47 (0.51)
5.72 (0.47)
5.53 (0.42)
6.77 (0.54)
6.15 (0.51)
Female 6.40 (0.14)
6.85 (0.55)
7.96 (0.57)
7.53 (0.60)
7.29 (0.53)
7.53 (0.55)
6.99 (0.49)
6.59 (0.39)
6.37 (0.44)
6.91 (0.46)
5.64 (0.39)
Race/ethnicity
Hispanic 7.71 (0.28)
7.22 (1.05)
6.12 (1.02)
5.98 (0.98)
6.15 (1.11)
7.74 (1.06)
5.38 (0.74)
7.37 (1.03)
7.70 (1.11)
9.40 (1.30)
9.21 (1.16)
Non-Hispanic White 5.79 (0.12)
6.68 (0.51)
6.78 (0.44)
6.67 (0.52)
7.05 (0.45)
7.24 (0.47)
7.12 (0.44)
6.00 (0.35)
5.83 (0.34)
6.64 (0.40)
5.25 (0.34)
Non-Hispanic Black 5.46 (0.29)
5.45 (1.20)
5.80 (1.12)
5.59 (1.31)
5.34 (1.22)
5.08 (1.20)
3.45 (0.72)
5.16 (0.98)
4.53 (0.76)
6.69 (1.49)
6.69 (1.46)
Non-Hispanic Other 7.56 (0.44)
11.49 (3.32)
11.41 (2.62)
9.07 (2.80)
4.93 (1.47)
7.37 (2.23)
7.50 (1.71)
9.11 (1.53)
7.84 (1.52)
6.31 (1.09)
8.01 (1.37)
Age category
< 21 16.10 (0.26)
18.87 (1.17)
19.13 (0.99)
18.17 (1.04)
18.78 (1.02)
18.97 (1.03)
18.98 (0.97)
17.05 (0.77)
15.10 (0.75)
18.00 (0.89)
15.72 (0.81)
21-64 1.74 (0.07)
1.56 (0.31)
1.48 (0.32)
1.52 (0.30)
1.76 (0.29)
1.72 (0.26)
1.63 (0.24)
1.56 (0.22)
2.15 (0.26)
1.77 (0.21)
1.70 (0.24)
> 64 0.18 (0.03)
0.10 (0.06)
0.02 (0.01)
0.24 (0.20)
0.00 (0.00)
0.15 (0.11)
0.04 (0.01)
0.17 (0.09)
0.25 (0.20)
0.22 (0.15)
0.08 (0.04)
Poverty level
Poor (<100% FPL) 4.83 (0.25)
5.01 (1.19)
6.01 (1.26)
3.42 (1.01)
3.67 (0.92)
6.02 (1.52)
3.99 (0.92)
2.44 (0.52)
4.62 (0.97)
4.21 (0.88)
5.32 (1.12)
Low (100-199% FPL) 5.36 (0.23)
4.85 (1.13)
5.18 (0.84)
3.82 (0.81)
5.22 (1.44)
5.70 (0.96)
5.65 (0.92)
4.28 (0.69)
4.99 (0.70)
5.34 (0.80)
4.78 (0.85)
Mid (200-399% FPL) 6.84 (0.18)
7.47 (0.81)
7.39 (0.78)
6.91 (0.79)
7.80 (0.70)
8.55 (0.77)
6.73 (0.60)
7.29 (0.53)
6.84 (0.61)
6.47 (0.63)
6.93 (0.64)
High (400%+ FPL) 5.91 (0.14)
7.16 (0.72)
6.95 (0.58)
7.44 (0.61)
6.93 (0.57)
6.72 (0.56)
7.34 (0.56)
6.44 (0.45)
5.92 (0.45)
7.75 (0.53)
5.57 (0.42)
Dental insurance
Some private 6.55 (0.12)
7.65 (0.53)
7.46 (0.49)
7.11 (0.54)
7.52 (0.51)
7.79 (0.47)
7.31 (0.45)
6.63 (0.36)
6.46 (0.37)
7.27 (0.41)
6.44 (0.39)
Only public 5.89 (0.28)
3.15 (0.78)
5.13 (1.09)
2.88 (0.71)
2.79 (0.76)
4.19 (0.97)
5.03 (1.23)
3.85 (0.69)
4.29 (0.66)
5.47 (0.91)
5.65 (1.00)
Neither 4.26 (0.19)
5.19 (0.81)
5.16 (0.67)
6.11 (0.99)
5.49 (0.77)
5.82 (0.79)
5.42 (0.78)
5.52 (0.64)
4.98 (0.61)
5.86 (0.84)
3.79 (0.51)
Employed
Employed 7.08 (0.12)
7.89 (0.56)
7.94 (0.48)
7.89 (0.54)
8.00 (0.47)
8.45 (0.52)
8.05 (0.46)
7.35 (0.37)
7.08 (0.38)
7.94 (0.43)
6.93 (0.38)
Not employed 2.62 (0.13)
3.06 (0.68)
2.77 (0.44)
1.84 (0.38)
2.18 (0.46)
2.22 (0.48)
2.12 (0.35)
2.25 (0.31)
2.25 (0.39)
2.99 (0.47)
2.41 (0.36)
Education level
< 12 yrs 4.04 (0.24)
3.14 (0.72)
1.70 (0.41)
1.43 (0.34)
4.33 (0.98)
3.17 (0.70)
3.26 (0.66)
3.42 (0.67)
3.05 (0.52)
3.18 (0.62)
4.42 (0.98)
12 yrs 4.53 (0.16)
4.11 (0.50)
5.37 (0.60)
5.15 (0.87)
3.99 (0.53)
5.36 (0.63)
4.49 (0.52)
4.83 (0.49)
4.02 (0.45)
5.23 (0.68)
4.21 (0.55)
> 12 yrs 6.80 (0.13)
8.56 (0.64)
8.03 (0.54)
7.75 (0.54)
8.36 (0.55)
8.47 (0.54)
8.29 (0.54)
7.18 (0.42)
7.21 (0.43)
7.92 (0.45)
6.74 (0.41)
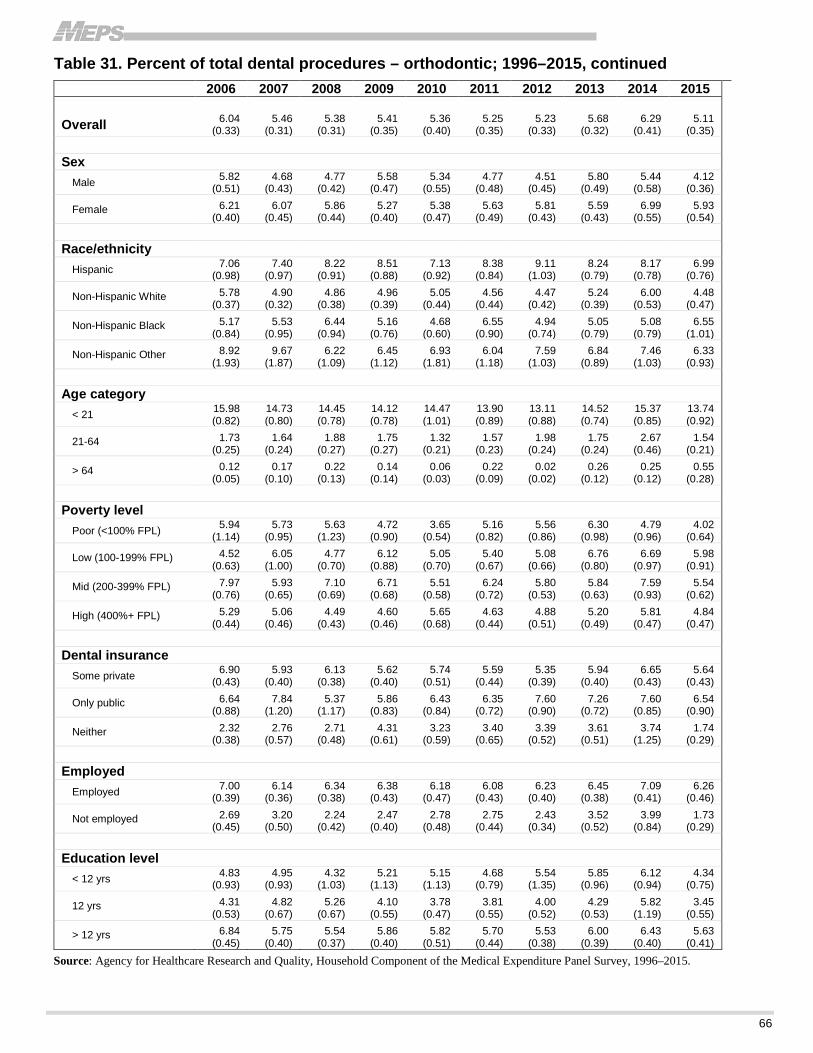
66
Table 31. Percent of total dental procedures – orthodontic; 1996–2015, continued
2006 2007 2008 2009 2010 2011 2012 2013 2014 2015
Overall 6.04 (0.33)
5.46 (0.31)
5.38 (0.31)
5.41 (0.35)
5.36 (0.40)
5.25 (0.35)
5.23 (0.33)
5.68 (0.32)
6.29 (0.41)
5.11 (0.35)
Sex
Male 5.82 (0.51)
4.68 (0.43)
4.77 (0.42)
5.58 (0.47)
5.34 (0.55)
4.77 (0.48)
4.51 (0.45)
5.80 (0.49)
5.44 (0.58)
4.12 (0.36)
Female 6.21 (0.40)
6.07 (0.45)
5.86 (0.44)
5.27 (0.40)
5.38 (0.47)
5.63 (0.49)
5.81 (0.43)
5.59 (0.43)
6.99 (0.55)
5.93 (0.54)
Race/ethnicity
Hispanic 7.06 (0.98)
7.40 (0.97)
8.22 (0.91)
8.51 (0.88)
7.13 (0.92)
8.38 (0.84)
9.11 (1.03)
8.24 (0.79)
8.17 (0.78)
6.99 (0.76)
Non-Hispanic White 5.78 (0.37)
4.90 (0.32)
4.86 (0.38)
4.96 (0.39)
5.05 (0.44)
4.56 (0.44)
4.47 (0.42)
5.24 (0.39)
6.00 (0.53)
4.48 (0.47)
Non-Hispanic Black 5.17 (0.84)
5.53 (0.95)
6.44 (0.94)
5.16 (0.76)
4.68 (0.60)
6.55 (0.90)
4.94 (0.74)
5.05 (0.79)
5.08 (0.79)
6.55 (1.01)
Non-Hispanic Other 8.92 (1.93)
9.67 (1.87)
6.22 (1.09)
6.45 (1.12)
6.93 (1.81)
6.04 (1.18)
7.59 (1.03)
6.84 (0.89)
7.46 (1.03)
6.33 (0.93)
Age category
< 21 15.98 (0.82)
14.73 (0.80)
14.45 (0.78)
14.12 (0.78)
14.47 (1.01)
13.90 (0.89)
13.11 (0.88)
14.52 (0.74)
15.37 (0.85)
13.74 (0.92)
21-64 1.73 (0.25)
1.64 (0.24)
1.88 (0.27)
1.75 (0.27)
1.32 (0.21)
1.57 (0.23)
1.98 (0.24)
1.75 (0.24)
2.67 (0.46)
1.54 (0.21)
> 64 0.12 (0.05)
0.17 (0.10)
0.22 (0.13)
0.14 (0.14)
0.06 (0.03)
0.22 (0.09)
0.02 (0.02)
0.26 (0.12)
0.25 (0.12)
0.55 (0.28)
Poverty level
Poor (<100% FPL) 5.94 (1.14)
5.73 (0.95)
5.63 (1.23)
4.72 (0.90)
3.65 (0.54)
5.16 (0.82)
5.56 (0.86)
6.30 (0.98)
4.79 (0.96)
4.02 (0.64)
Low (100-199% FPL) 4.52 (0.63)
6.05 (1.00)
4.77 (0.70)
6.12 (0.88)
5.05 (0.70)
5.40 (0.67)
5.08 (0.66)
6.76 (0.80)
6.69 (0.97)
5.98 (0.91)
Mid (200-399% FPL) 7.97 (0.76)
5.93 (0.65)
7.10 (0.69)
6.71 (0.68)
5.51 (0.58)
6.24 (0.72)
5.80 (0.53)
5.84 (0.63)
7.59 (0.93)
5.54 (0.62)
High (400%+ FPL) 5.29 (0.44)
5.06 (0.46)
4.49 (0.43)
4.60 (0.46)
5.65 (0.68)
4.63 (0.44)
4.88 (0.51)
5.20 (0.49)
5.81 (0.47)
4.84 (0.47)
Dental insurance
Some private 6.90 (0.43)
5.93 (0.40)
6.13 (0.38)
5.62 (0.40)
5.74 (0.51)
5.59 (0.44)
5.35 (0.39)
5.94 (0.40)
6.65 (0.43)
5.64 (0.43)
Only public 6.64 (0.88)
7.84 (1.20)
5.37 (1.17)
5.86 (0.83)
6.43 (0.84)
6.35 (0.72)
7.60 (0.90)
7.26 (0.72)
7.60 (0.85)
6.54 (0.90)
Neither 2.32 (0.38)
2.76 (0.57)
2.71 (0.48)
4.31 (0.61)
3.23 (0.59)
3.40 (0.65)
3.39 (0.52)
3.61 (0.51)
3.74 (1.25)
1.74 (0.29)
Employed
Employed 7.00 (0.39)
6.14 (0.36)
6.34 (0.38)
6.38 (0.43)
6.18 (0.47)
6.08 (0.43)
6.23 (0.40)
6.45 (0.38)
7.09 (0.41)
6.26 (0.46)
Not employed 2.69 (0.45)
3.20 (0.50)
2.24 (0.42)
2.47 (0.40)
2.78 (0.48)
2.75 (0.44)
2.43 (0.34)
3.52 (0.52)
3.99 (0.84)
1.73 (0.29)
Education level
< 12 yrs 4.83 (0.93)
4.95 (0.93)
4.32 (1.03)
5.21 (1.13)
5.15 (1.13)
4.68 (0.79)
5.54 (1.35)
5.85 (0.96)
6.12 (0.94)
4.34 (0.75)
12 yrs 4.31 (0.53)
4.82 (0.67)
5.26 (0.67)
4.10 (0.55)
3.78 (0.47)
3.81 (0.55)
4.00 (0.52)
4.29 (0.53)
5.82 (1.19)
3.45 (0.55)
> 12 yrs 6.84 (0.45)
5.75 (0.40)
5.54 (0.37)
5.86 (0.40)
5.82 (0.51)
5.70 (0.44)
5.53 (0.38)
6.00 (0.39)
6.43 (0.40)
5.63 (0.41)
Source: Agency for Healthcare Research and Quality, Household Component of the Medical Expenditure Panel Survey, 1996–2015.

67
Table 32. Percent of total dental procedures – other; 1996–2015 Table continues on next page
Mean Annual
1996-2015 1996 1997 1998 1999 2000 2001 2002 2003 2004 2005
Overall 3.56 (0.05)
4.42 (0.20)
4.59 (0.17)
4.02 (0.21)
4.12 (0.20)
4.00 (0.20)
4.04 (0.16)
3.60 (0.13)
3.63 (0.19)
3.65 (0.16)
3.47 (0.15)
Sex Male 3.35
(0.06) 3.91
(0.27) 4.34
(0.27) 4.21
(0.34) 3.95
(0.26) 3.43
(0.21) 3.68
(0.20) 3.27
(0.18) 3.38
(0.24) 3.83
(0.23) 3.26
(0.22)
Female 3.73 (0.07)
4.83 (0.26)
4.78 (0.23)
3.88 (0.22)
4.26 (0.28)
4.44 (0.28)
4.32 (0.21)
3.86 (0.19)
3.83 (0.27)
3.51 (0.19)
3.64 (0.18)
Race/ethnicity Hispanic 3.35
(0.12) 4.43
(0.53) 4.94
(0.51) 4.18
(0.55) 5.65
(0.78) 4.52
(0.51) 4.49
(0.52) 3.40
(0.38) 3.36
(0.43) 3.43
(0.46) 3.21
(0.43)
Non-Hispanic White 3.60 (0.06)
4.43 (0.22)
4.60 (0.18)
4.05 (0.23)
4.09 (0.22)
3.98 (0.23)
3.90 (0.17)
3.59 (0.15)
3.66 (0.23)
3.61 (0.18)
3.53 (0.18)
Non-Hispanic Black 3.69 (0.12)
5.03 (0.73)
3.51 (0.46)
4.03 (0.58)
3.69 (0.54)
4.44 (0.57)
4.46 (0.55)
4.08 (0.45)
3.49 (0.39)
4.50 (0.72)
3.70 (0.56)
Non-Hispanic Other 3.17 (0.14)
3.16 (0.73)
5.62 (1.40)
2.99 (0.97)
2.94 (0.74)
2.75 (0.77)
5.48 (1.36)
3.53 (0.55)
3.66 (0.56)
3.54 (0.47)
2.84 (0.35)
Age category < 21 1.03
(0.03) 1.44
(0.20) 1.36
(0.18) 0.99
(0.13) 1.19
(0.20) 1.27
(0.19) 1.33
(0.14) 0.96
(0.09) 1.06
(0.11) 0.99
(0.12) 1.14
(0.12)
21-64 4.78 (0.08)
5.86 (0.28)
6.20 (0.25)
5.62 (0.32)
5.44 (0.28)
5.25 (0.31)
5.39 (0.25)
4.92 (0.20)
4.97 (0.29)
5.04 (0.25)
4.62 (0.23)
> 64 4.53 (0.12)
5.45 (0.47)
5.47 (0.48)
4.59 (0.57)
5.46 (0.61)
5.63 (0.49)
4.64 (0.40)
4.26 (0.36)
4.11 (0.59)
4.48 (0.39)
4.19 (0.40)
Poverty level Poor (<100% FPL) 3.14
(0.11) 3.55
(0.52) 3.80
(0.54) 4.56
(0.73) 4.54
(0.71) 4.02
(0.76) 4.95
(0.64) 3.45
(0.41) 3.30
(0.45) 4.06
(0.56) 3.47
(0.44)
Low (100-199% FPL) 3.65 (0.12)
4.88 (0.69)
4.76 (0.64)
4.22 (0.56)
4.40 (0.60)
4.00 (0.55)
4.65 (0.64)
3.03 (0.29)
3.95 (0.44)
3.66 (0.62)
3.44 (0.40)
Mid (200-399% FPL) 3.43 (0.07)
4.33 (0.30)
4.59 (0.29)
3.65 (0.33)
3.73 (0.31)
3.49 (0.31)
3.54 (0.26)
3.50 (0.24)
3.20 (0.26)
3.36 (0.27)
3.92 (0.31)
High (400%+ FPL) 3.68 (0.07)
4.49 (0.29)
4.66 (0.25)
4.14 (0.30)
4.25 (0.27)
4.31 (0.27)
4.10 (0.22)
3.80 (0.20)
3.84 (0.31)
3.76 (0.21)
3.22 (0.18)
Dental insurance Some private 3.59
(0.06) 4.47
(0.24) 4.63
(0.21) 3.83
(0.24) 3.92
(0.22) 3.97
(0.21) 4.00
(0.18) 3.70
(0.16) 3.72
(0.22) 3.67
(0.18) 3.59
(0.18)
Only public 2.39 (0.11)
3.48 (0.74)
3.20 (0.44)
3.06 (0.52)
4.81 (0.83)
3.82 (0.98)
4.35 (0.87)
2.72 (0.31)
2.44 (0.30)
2.52 (0.40)
2.64 (0.38)
Neither 3.99 (0.10)
4.48 (0.39)
4.81 (0.39)
4.96 (0.49)
4.62 (0.44)
4.15 (0.46)
4.09 (0.29)
3.58 (0.26)
3.75 (0.43)
4.08 (0.45)
3.42 (0.29)
Employed Employed 3.33
(0.05) 4.25
(0.21) 4.35
(0.19) 3.97
(0.24) 3.92
(0.21) 3.62
(0.20) 3.64
(0.16) 3.52
(0.14) 3.41
(0.21) 3.47
(0.17) 3.29
(0.16)
Not employed 4.32 (0.10)
5.02 (0.43)
5.45 (0.37)
4.23 (0.40)
4.92 (0.45)
5.42 (0.49)
5.49 (0.41)
3.91 (0.31)
4.39 (0.38)
4.29 (0.33)
4.07 (0.32)
Education level < 12 yrs 3.74
(0.14) 4.77
(0.64) 5.19
(0.54) 4.64
(0.62) 5.45
(0.60) 5.08
(0.76) 3.85
(0.46) 3.14
(0.27) 3.42
(0.50) 4.40
(0.44) 3.74
(0.45)
12 yrs 3.82 (0.09)
4.90 (0.36)
4.36 (0.28)
4.34 (0.38)
4.79 (0.39)
4.00 (0.34)
4.78 (0.33)
3.88 (0.24)
3.93 (0.48)
3.82 (0.32)
3.60 (0.28)
> 12 yrs 3.45 (0.06)
4.15 (0.25)
4.61 (0.22)
3.85 (0.25)
3.67 (0.24)
3.85 (0.24)
3.75 (0.20)
3.56 (0.16)
3.53 (0.20)
3.50 (0.19)
3.39 (0.18)
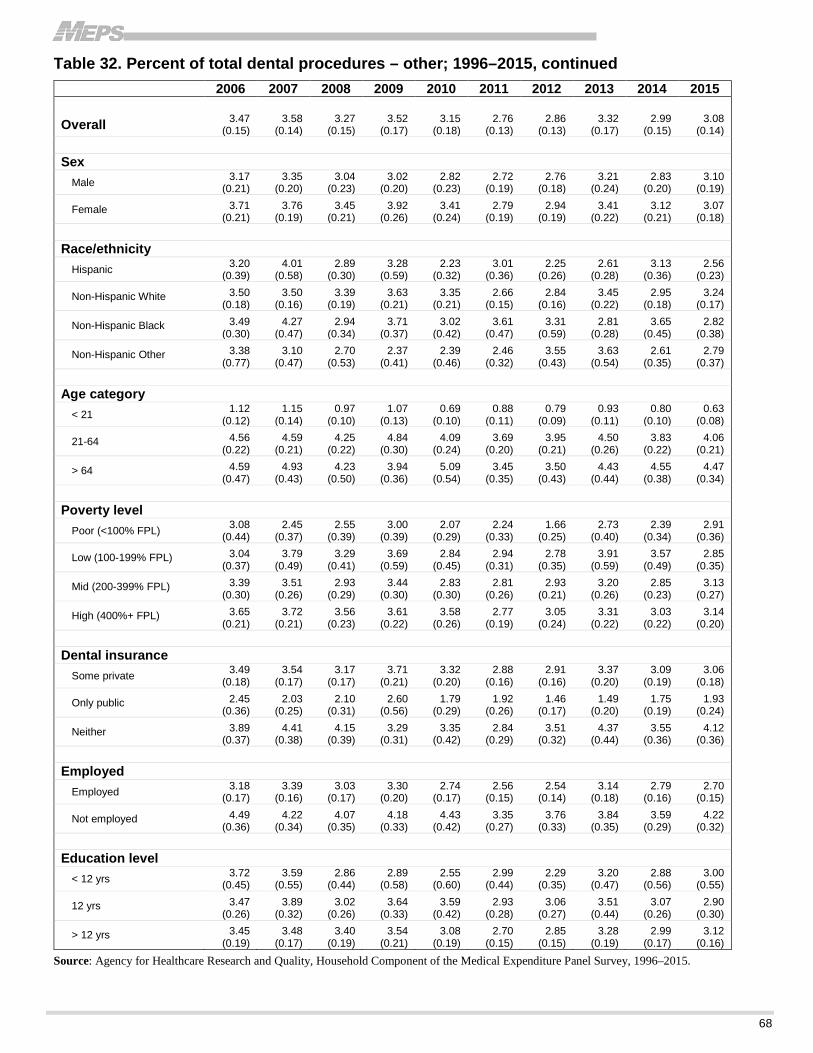
68
Table 32. Percent of total dental procedures – other; 1996–2015, continued 2006 2007 2008 2009 2010 2011 2012 2013 2014 2015
Overall 3.47 (0.15)
3.58 (0.14)
3.27 (0.15)
3.52 (0.17)
3.15 (0.18)
2.76 (0.13)
2.86 (0.13)
3.32 (0.17)
2.99 (0.15)
3.08 (0.14)
Sex Male 3.17
(0.21) 3.35
(0.20) 3.04
(0.23) 3.02
(0.20) 2.82
(0.23) 2.72
(0.19) 2.76
(0.18) 3.21
(0.24) 2.83
(0.20) 3.10
(0.19)
Female 3.71 (0.21)
3.76 (0.19)
3.45 (0.21)
3.92 (0.26)
3.41 (0.24)
2.79 (0.19)
2.94 (0.19)
3.41 (0.22)
3.12 (0.21)
3.07 (0.18)
Race/ethnicity Hispanic 3.20
(0.39) 4.01
(0.58) 2.89
(0.30) 3.28
(0.59) 2.23
(0.32) 3.01
(0.36) 2.25
(0.26) 2.61
(0.28) 3.13
(0.36) 2.56
(0.23)
Non-Hispanic White 3.50 (0.18)
3.50 (0.16)
3.39 (0.19)
3.63 (0.21)
3.35 (0.21)
2.66 (0.15)
2.84 (0.16)
3.45 (0.22)
2.95 (0.18)
3.24 (0.17)
Non-Hispanic Black 3.49 (0.30)
4.27 (0.47)
2.94 (0.34)
3.71 (0.37)
3.02 (0.42)
3.61 (0.47)
3.31 (0.59)
2.81 (0.28)
3.65 (0.45)
2.82 (0.38)
Non-Hispanic Other 3.38 (0.77)
3.10 (0.47)
2.70 (0.53)
2.37 (0.41)
2.39 (0.46)
2.46 (0.32)
3.55 (0.43)
3.63 (0.54)
2.61 (0.35)
2.79 (0.37)
Age category < 21 1.12
(0.12) 1.15
(0.14) 0.97
(0.10) 1.07
(0.13) 0.69
(0.10) 0.88
(0.11) 0.79
(0.09) 0.93
(0.11) 0.80
(0.10) 0.63
(0.08)
21-64 4.56 (0.22)
4.59 (0.21)
4.25 (0.22)
4.84 (0.30)
4.09 (0.24)
3.69 (0.20)
3.95 (0.21)
4.50 (0.26)
3.83 (0.22)
4.06 (0.21)
> 64 4.59 (0.47)
4.93 (0.43)
4.23 (0.50)
3.94 (0.36)
5.09 (0.54)
3.45 (0.35)
3.50 (0.43)
4.43 (0.44)
4.55 (0.38)
4.47 (0.34)
Poverty level Poor (<100% FPL) 3.08
(0.44) 2.45
(0.37) 2.55
(0.39) 3.00
(0.39) 2.07
(0.29) 2.24
(0.33) 1.66
(0.25) 2.73
(0.40) 2.39
(0.34) 2.91
(0.36)
Low (100-199% FPL) 3.04 (0.37)
3.79 (0.49)
3.29 (0.41)
3.69 (0.59)
2.84 (0.45)
2.94 (0.31)
2.78 (0.35)
3.91 (0.59)
3.57 (0.49)
2.85 (0.35)
Mid (200-399% FPL) 3.39 (0.30)
3.51 (0.26)
2.93 (0.29)
3.44 (0.30)
2.83 (0.30)
2.81 (0.26)
2.93 (0.21)
3.20 (0.26)
2.85 (0.23)
3.13 (0.27)
High (400%+ FPL) 3.65 (0.21)
3.72 (0.21)
3.56 (0.23)
3.61 (0.22)
3.58 (0.26)
2.77 (0.19)
3.05 (0.24)
3.31 (0.22)
3.03 (0.22)
3.14 (0.20)
Dental insurance Some private 3.49
(0.18) 3.54
(0.17) 3.17
(0.17) 3.71
(0.21) 3.32
(0.20) 2.88
(0.16) 2.91
(0.16) 3.37
(0.20) 3.09
(0.19) 3.06
(0.18)
Only public 2.45 (0.36)
2.03 (0.25)
2.10 (0.31)
2.60 (0.56)
1.79 (0.29)
1.92 (0.26)
1.46 (0.17)
1.49 (0.20)
1.75 (0.19)
1.93 (0.24)
Neither 3.89 (0.37)
4.41 (0.38)
4.15 (0.39)
3.29 (0.31)
3.35 (0.42)
2.84 (0.29)
3.51 (0.32)
4.37 (0.44)
3.55 (0.36)
4.12 (0.36)
Employed Employed 3.18
(0.17) 3.39
(0.16) 3.03
(0.17) 3.30
(0.20) 2.74
(0.17) 2.56
(0.15) 2.54
(0.14) 3.14
(0.18) 2.79
(0.16) 2.70
(0.15)
Not employed 4.49 (0.36)
4.22 (0.34)
4.07 (0.35)
4.18 (0.33)
4.43 (0.42)
3.35 (0.27)
3.76 (0.33)
3.84 (0.35)
3.59 (0.29)
4.22 (0.32)
Education level < 12 yrs 3.72
(0.45) 3.59
(0.55) 2.86
(0.44) 2.89
(0.58) 2.55
(0.60) 2.99
(0.44) 2.29
(0.35) 3.20
(0.47) 2.88
(0.56) 3.00
(0.55)
12 yrs 3.47 (0.26)
3.89 (0.32)
3.02 (0.26)
3.64 (0.33)
3.59 (0.42)
2.93 (0.28)
3.06 (0.27)
3.51 (0.44)
3.07 (0.26)
2.90 (0.30)
> 12 yrs 3.45 (0.19)
3.48 (0.17)
3.40 (0.19)
3.54 (0.21)
3.08 (0.19)
2.70 (0.15)
2.85 (0.15)
3.28 (0.19)
2.99 (0.17)
3.12 (0.16)
Source: Agency for Healthcare Research and Quality, Household Component of the Medical Expenditure Panel Survey, 1996–2015.
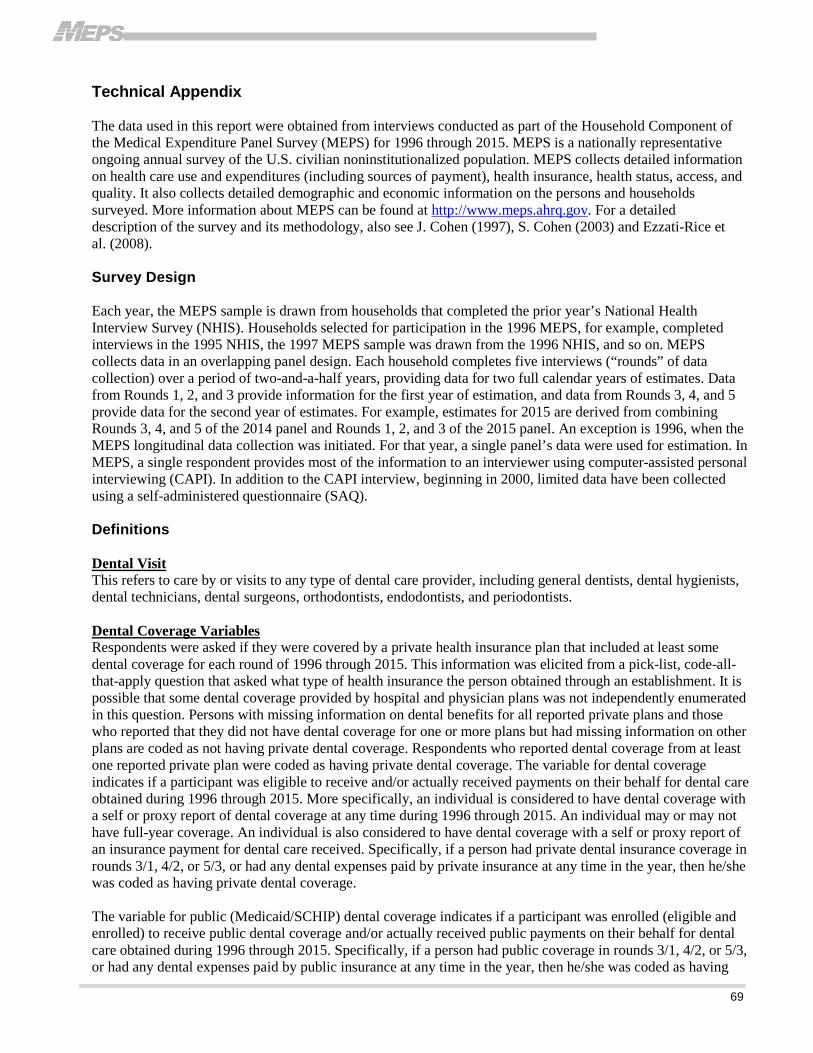
69
Technical Appendix
The data used in this report were obtained from interviews conducted as part of the Household Component of the Medical Expenditure Panel Survey (MEPS) for 1996 through 2015. MEPS is a nationally representative ongoing annual survey of the U.S. civilian noninstitutionalized population. MEPS collects detailed information on health care use and expenditures (including sources of payment), health insurance, health status, access, and quality. It also collects detailed demographic and economic information on the persons and households surveyed. More information about MEPS can be found at http://www.meps.ahrq.gov. For a detailed description of the survey and its methodology, also see J. Cohen (1997), S. Cohen (2003) and Ezzati-Rice et al. (2008).
Survey Design
Each year, the MEPS sample is drawn from households that completed the prior year’s National Health Interview Survey (NHIS). Households selected for participation in the 1996 MEPS, for example, completed interviews in the 1995 NHIS, the 1997 MEPS sample was drawn from the 1996 NHIS, and so on. MEPS collects data in an overlapping panel design. Each household completes five interviews (“rounds” of data collection) over a period of two-and-a-half years, providing data for two full calendar years of estimates. Data from Rounds 1, 2, and 3 provide information for the first year of estimation, and data from Rounds 3, 4, and 5 provide data for the second year of estimates. For example, estimates for 2015 are derived from combining Rounds 3, 4, and 5 of the 2014 panel and Rounds 1, 2, and 3 of the 2015 panel. An exception is 1996, when the MEPS longitudinal data collection was initiated. For that year, a single panel’s data were used for estimation. In MEPS, a single respondent provides most of the information to an interviewer using computer-assisted personal interviewing (CAPI). In addition to the CAPI interview, beginning in 2000, limited data have been collected using a self-administered questionnaire (SAQ).
Definitions
Dental Visit This refers to care by or visits to any type of dental care provider, including general dentists, dental hygienists, dental technicians, dental surgeons, orthodontists, endodontists, and periodontists.
Dental Coverage Variables Respondents were asked if they were covered by a private health insurance plan that included at least some dental coverage for each round of 1996 through 2015. This information was elicited from a pick-list, code-all-that-apply question that asked what type of health insurance the person obtained through an establishment. It is possible that some dental coverage provided by hospital and physician plans was not independently enumerated in this question. Persons with missing information on dental benefits for all reported private plans and those who reported that they did not have dental coverage for one or more plans but had missing information on other plans are coded as not having private dental coverage. Respondents who reported dental coverage from at least one reported private plan were coded as having private dental coverage. The variable for dental coverage indicates if a participant was eligible to receive and/or actually received payments on their behalf for dental care obtained during 1996 through 2015. More specifically, an individual is considered to have dental coverage with a self or proxy report of dental coverage at any time during 1996 through 2015. An individual may or may not have full-year coverage. An individual is also considered to have dental coverage with a self or proxy report of an insurance payment for dental care received. Specifically, if a person had private dental insurance coverage in rounds 3/1, 4/2, or 5/3, or had any dental expenses paid by private insurance at any time in the year, then he/she was coded as having private dental coverage.
The variable for public (Medicaid/SCHIP) dental coverage indicates if a participant was enrolled (eligible and enrolled) to receive public dental coverage and/or actually received public payments on their behalf for dental care obtained during 1996 through 2015. Specifically, if a person had public coverage in rounds 3/1, 4/2, or 5/3, or had any dental expenses paid by public insurance at any time in the year, then he/she was coded as having
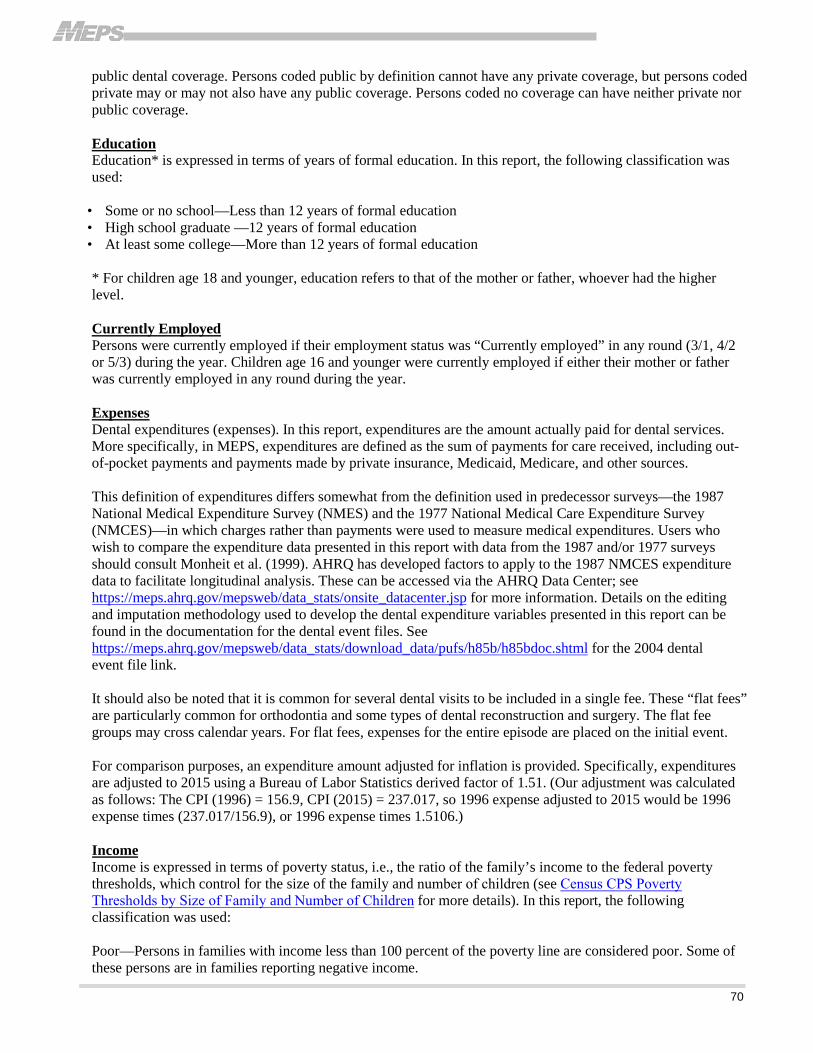
70
public dental coverage. Persons coded public by definition cannot have any private coverage, but persons coded private may or may not also have any public coverage. Persons coded no coverage can have neither private nor public coverage.
Education Education* is expressed in terms of years of formal education. In this report, the following classification was used:
• Some or no school—Less than 12 years of formal education• High school graduate —12 years of formal education• At least some college—More than 12 years of formal education
* For children age 18 and younger, education refers to that of the mother or father, whoever had the higherlevel.
Currently Employed Persons were currently employed if their employment status was “Currently employed” in any round (3/1, 4/2 or 5/3) during the year. Children age 16 and younger were currently employed if either their mother or father was currently employed in any round during the year.
Expenses Dental expenditures (expenses). In this report, expenditures are the amount actually paid for dental services. More specifically, in MEPS, expenditures are defined as the sum of payments for care received, including out-of-pocket payments and payments made by private insurance, Medicaid, Medicare, and other sources.
This definition of expenditures differs somewhat from the definition used in predecessor surveys—the 1987 National Medical Expenditure Survey (NMES) and the 1977 National Medical Care Expenditure Survey (NMCES)—in which charges rather than payments were used to measure medical expenditures. Users who wish to compare the expenditure data presented in this report with data from the 1987 and/or 1977 surveys should consult Monheit et al. (1999). AHRQ has developed factors to apply to the 1987 NMCES expenditure data to facilitate longitudinal analysis. These can be accessed via the AHRQ Data Center; see https://meps.ahrq.gov/mepsweb/data_stats/onsite_datacenter.jsp for more information. Details on the editing and imputation methodology used to develop the dental expenditure variables presented in this report can be found in the documentation for the dental event files. See https://meps.ahrq.gov/mepsweb/data_stats/download_data/pufs/h85b/h85bdoc.shtml for the 2004 dental event file link.
It should also be noted that it is common for several dental visits to be included in a single fee. These “flat fees” are particularly common for orthodontia and some types of dental reconstruction and surgery. The flat fee groups may cross calendar years. For flat fees, expenses for the entire episode are placed on the initial event.
For comparison purposes, an expenditure amount adjusted for inflation is provided. Specifically, expenditures are adjusted to 2015 using a Bureau of Labor Statistics derived factor of 1.51. (Our adjustment was calculated as follows: The CPI (1996) = 156.9, CPI (2015) = 237.017, so 1996 expense adjusted to 2015 would be 1996 expense times (237.017/156.9), or 1996 expense times 1.5106.)
Income Income is expressed in terms of poverty status, i.e., the ratio of the family’s income to the federal poverty thresholds, which control for the size of the family and number of children (see Census CPS Poverty Thresholds by Size of Family and Number of Children for more details). In this report, the following classification was used:
Poor—Persons in families with income less than 100 percent of the poverty line are considered poor. Some of these persons are in families reporting negative income.

71
Low income—Persons in families with income equal to or above 100 percent and less than 200 percent of the poverty line are considered low income.
Middle income—Persons in families with income equal to or above 200 percent and less than 400 percent of the poverty line are considered middle income.
High income—Persons in families with income equal to or above 400 percent of the poverty line are considered high income.
Procedures Procedures refer to at least one procedure type per visit. Multiple procedures of the same type at the same visit are not included. Other service types not identified by respondents are not included. Diagnostic: Examinations and x-rays Preventive: Cleanings, fluoride, sealants and recall visits Restorative: Fillings and inlays Prosthetic: Crowns, bridges, dentures, repairs and implants Oral surgical: Extracts, oral surgery, abscesses Orthodontic: Orthodontic services only Other: Other dental service not included above. (Includes endodontics, periodontics, whitening, TMD/TMJ, and other.)
Population Characteristics In general, population characteristics were measured as of December 31 of the year of study, or the last date that the sample person was part of the civilian noninstitutionalized (community) population living in the United States prior to December 31 of that year.
Comparisons by race/ethnicity in this report are based on the following four race/ethnicity groups: black non-Hispanic, white non-Hispanic, Hispanic, and other. Other includes non-Hispanics who reported being of a single race other than white or black (i.e., American Indian/Alaska Native, Asian, or Native Hawaiian/ Pacific Islander) as well as non-Hispanics who reported to be of multiple races (possibly including black).
Caution should be used when drawing conclusions based on comparisons of race/ethnicity groups for different years because the true racial composition of each of the identified race/ethnicity groups cannot be guaranteed to be the same across these years. For example, beginning in 2002 respondents could report multiple races, which could change how categories are calculated.
Rounding Because of rounding and some missing data, some of the subpopulation estimates presented in the tables will not sum exactly to the overall population total.

![2019 AR3 BC - Arkansas · MEDICAL AND DENTAL EXPENSES: [Do not include expense(s) paid by others]. (See instructions) 1. Medical and dental expenses: .....1](https://img.pdfslide.us/doc/110x75/5f98395a2548ae0ea53511d8/2019-ar3-bc-arkansas-medical-and-dental-expenses-do-not-include-expenses-paid.jpg)