Embed Size (px)
Citation preview

Research Collection
Doctoral Thesis
Genetic determinism of Xanthomonas arboricola pv. pruniresistance and agronomic traits in apricot, and applications inmarker-assisted selection
Author(s): Socquet-Juglard, Didier
Publication Date: 2012
Permanent Link: https://doi.org/10.3929/ethz-a-007620646
Rights / License: In Copyright - Non-Commercial Use Permitted
This page was generated automatically upon download from the ETH Zurich Research Collection. For moreinformation please consult the Terms of use.
ETH Library

DISS. ETH Nr. 20814
Genetic determinism of Xanthomonas arboricola pv. pruni resistance and
agronomic traits in apricot, and applications in marker-assisted selection
A dissertation submitted to
ETH ZURICH
For the degree of
Doctor of Sciences
Presented by
Didier SOCQUET-JUGLARD
M.Sc Agrar, Berlin, Germany
Born August 22nd, 1984
Citizen of France
Accepted on the recommendation of
Prof. Dr. Cesare Gessler, examiner
Prof. Dr. Bruce McDonald, co-examiner
Dr. Andrea Patocchi, co-examiner
2012


Abstract
ii
Abstract Apricot (Prunus armeniaca L.) breeding mainly relies on classical techniques, which are time-
consuming and expensive. Many important agronomical traits are polygenic and remain poorly
understood in this crop. The aim of this thesis was to study the genetic control of key traits in apricot,
with a great emphasis on the genetics of the host resistance to Xanthomonas arboricola pv. pruni.
Indeed, X. arboricola pv. pruni is a devastating bacterial disease recently identified in Switzerland.
Because a polygenic resistance to the disease was expected, different inoculation techniques were
tested and compared for their potential to allow a quantitative assessment of the disease symptoms and
for the reproducibility of the results. Dipping the plants into the inoculum appeared to be the best
technique to score quantitative traits such as disease incidence or disease severity. This technique was
tested on several apricot cultivars for resistance or susceptibility to the pathogen. Results obtained
were similar to what was previously observed in the field, although disease severity was higher in all
cases under greenhouse conditions.
In a second phase, 101 progeny plants obtained from a cross between the apricot cultivars
“Harostar” and “Rouge de Mauves” were used to construct the genetic linkage maps of both parents.
Replicates from each genotype were inoculated over two consecutive years following the protocol
previously set, and plants were evaluated at 42 days post inoculation for disease incidence and
resistance index. Quantitative trait loci (QTLs) involved in resistance against the pathogen were
mapped with both year datasets combined. One major QTL was identified on LG5 of “Rouge de
Mauves”, explaining up to 53% of the phenotypic variation, with one microsatellite marker near the
peak of the QTL and two flanking markers identified. With the availability of both parental linkage
maps, we further mapped QTLs for traits measured in field over one or two years of observation. Most
important and stable QTLs over both years were identified for tree shape on LG1 and LG5 of “Rouge
de Mauves”, for fruit form on LG3 of “Harostar”, and for ground color on LG3 and LG7 of
“Harostar”. Time to initial reproductive bud break was measured only over one year, and two QTLs
were detected on LG1 and LG4 of “Harostar”. Confirmation of the QTLs identified in this thesis in
different genetic backgrounds will permit to ensure their potential for marker-assisted selection.
For a broader understanding of the plant defense mechanisms in Prunus plants infected by X.
arboricola pv. pruni, we used whole transcriptome sequencing (RNA-seq) to analyze differential gene
expression at 2 and 12 hours post inoculation of inoculated peach leaf samples by comparison to their
respective controls. Although only one putative gene was identified in the confidence interval of the
QTL previously mapped on LG5, differentially expressed genes involved in basal defense, disease
resistance, but also in photosynthesis, cell wall reorganization or in signaling pathways were
identified. This work is a first study of plant defense responses in a Prunus crop using RNA-seq.

Abstract
iii
Résumé La sélection de l’abricotier (Prunus armeniaca L.) s’appuie principalement sur des techniques
classiques, qui demandent beaucoup de temps et qui sont onéreuses. De nombreux caractères
agronomiques sont polygéniques et très peu ont été étudiés chez l’abricotier. L’objectif de cette thèse
était donc d’étudier le contrôle génétique de caractères clés chez l’abricotier, avec un accent sur la
résistance de la plante hôte au pathogène Xanthomonas arboricola pv. pruni. Cette bactérie provoque
une maladie dévastatrice et a été récemment identifiée en Suisse. Une résistance polygénique à la
bactérie étant présumée, différentes techniques d’inoculation ont été testées ; leur potentiel à induire
des symptômes pouvant être évalués de manière quantitative a été comparé en tenant compte de la
reproductibilité des résultats. Plonger les plantes directement dans la solution d’inoculum est la
technique qui est apparue comme étant la plus appropriée pour évaluer des caractères quantitatifs tels
que l’incidence ou la sévérité de la maladie. Cette technique a été testée sur différentes variétés
d’abricotier pour tester leur résistance ou leur sensibilité à la maladie. Les résultats obtenus ont été
semblables à ce qui avait été précédemment rapporté en verger, malgré le fait que la sévérité de la
maladie était dans tous les cas beaucoup plus importante sous serre.
Dans un second temps, 101 hybrides obtenus d’un croisement entre les variétés d’abricotier
« Harostar » et « Rouge de Mauves » ont été utilisés pour construire la carte de liaison génétique de
chacun des deux parents. Des clones de chaque génotype ont été inoculés lors de deux années
consécutives en suivant le protocole d’inoculation précédemment établi, et les plantes ont été évaluées
42 jours après l’inoculation pour l’incidence de la maladie et pour l’indice de résistance. Des locus de
caractères quantitatifs (QTLs) contribuant à la résistance à la maladie ont été cartographiés en utilisant
les données des deux années combinées. Un QTL majeur a été identifié sur le groupe de liaison 5
(GL5) de « Rouge de Mauves », expliquant jusqu’à 53% de la variance phénotypique, et un marqueur
microsatellite proche du pic du QTL ainsi que deux marqueurs flanquant le QTL ont été détectés. Les
cartes de liaison génétique de chaque parent étant disponibles, des QTLs impliqués dans des caractères
mesurés en verger ont été mesurés sur une ou deux années. Les principaux QTLs cartographiés
montrant une stabilité avec les années ont contribué à la forme de l’arbre (sur GL1 et GL5 de « Rouge
de Mauves »), à la forme du fruit (sur GL3 de « Harostar »), et à la couleur du fruit (sur GL3 et GL7
de « Harostar »). Le temps d’initiation du débourrement des bourgeons inflorescenciels a été évalué
seulement sur une année, et deux QTLs ont été détectés sur GL1 et GL4 de « Harostar ». La
confirmation des QTLs identifiés dans cette thèse dans un patrimoine génétique différent permettra de
s’assurer de leur potentiel d’utilisation dans un programme de sélection assistée par marqueurs.
Afin d’obtenir une meilleure compréhension des mécanismes de défense de la plante infectée
par X. arboricola pv. pruni, nous avons utilisé une technique de séquençage du transcriptome (ARN-

Abstract
iv
seq) pour analyser l’expression différentielle des gènes dans des échantillons de feuilles de pêcher
inoculées par comparaison à leurs contrôles respectifs, à 2h et 12h après inoculation. Même si un seul
gène putatif a été identifié dans l’intervalle de confiance du QTL cartographié précédemment sur GL5,
de nombreux autres gènes différentiellement exprimés ont été identifiés, les plus intéressants étant
impliqués dans des mécanismes de défense basale, dans la résistance aux pathogènes, dans la
photosynthèse, dans la réorganisation de la paroi cellulaire ou dans les voies de signalisation de la
résistance. Ce travail est la première étude des mécanismes de défense d’une plante appartenant au
genre Prunus en utilisant la technique de l’ARN-seq.

v
vi
Table of contents
Abstract ................................................................................................................ ii
Résumé................................................................................................................. iii
Table of contents ................................................................................................. vi
Chapter 1: General Introduction ....................................................................... 1
Scope of the thesis ................................................................................................................ 2
1.1. The apricot culture ....................................................................................................... 2
1.1.1. Taxonomy and nomenclature ........................................................................................... 2
1.1.2. The apricot history ............................................................................................................ 3
1.1.3. Botany............................................................................................................................... 4
1.1.4. Economic importance ....................................................................................................... 5
1.1.4.1. Worldwide ................................................................................................................ 6
1.1.4.2. In Switzerland........................................................................................................... 6
1.1.5. Genetic resources and breeding ........................................................................................ 7
1.1.5.1. Available genetic resources ...................................................................................... 7
1.1.5.2. Breeding advances and targets in apricot ................................................................. 8
1.1.5.3. Major pests and diseases ........................................................................................ 10
1.2. Xanthomonas arboricola pv. pruni ............................................................................. 11
1.2.1. Host range, symptoms and damages ............................................................................... 12
1.2.2. Localization .................................................................................................................... 13
1.2.3. Disease cycle .................................................................................................................. 13
1.2.4. Identification methods .................................................................................................... 14
1.2.5. Control ............................................................................................................................ 15
1.2.5.1. Prophylactic measures ............................................................................................ 15
1.2.5.2. Chemical and biological control ............................................................................. 15
1.2.5.3. Forecasting models ................................................................................................. 16
1.2.5.4. Breeding ................................................................................................................. 16
1.3. Molecular tools available for breeding in Prunus ................................................... 16
1.3.1. Approaches for QTL identification ................................................................................ 17
1.3.2. Tools for molecular studies in Prunus ............................................................................ 18
1.3.2.1. Reference linkage maps available in Prunus .......................................................... 18
1.3.2.2. Linkage maps in apricot ......................................................................................... 18

Table of contents
vii
1.3.2.3. Genome synteny among Prunus species ................................................................. 19
1.3.3. Other tools available for breeding .................................................................................. 19
1.3.3.1. ESTs and candidate gene analysis .......................................................................... 19
1.3.3.2. High-throughput transcriptome analysis ................................................................ 20
1.4. Outline of the thesis .................................................................................................... 21
1.5. References.................................................................................................................... 22
Chapter 2: Evaluation of Xanthomonas arboricola pv. pruni inoculation techniques to screen for bacterial spot resistance in peach and apricot ...... 36
2.1. Abstract ....................................................................................................................... 38
2.2. Introduction ................................................................................................................ 39
2.3. Material and Methods ................................................................................................ 40
2.3.1. Plant material .................................................................................................................. 40
2.3.2. Inoculation ...................................................................................................................... 40
2.3.3. Phenotyping and statistical tests ..................................................................................... 41
2.4. Results .......................................................................................................................... 42
2.4.1. Test of inoculation techniques on peach plants .............................................................. 42
2.4.2. Screening apricot cultivars for resistance against X. arboricola pv. pruni ..................... 43
2.5. Discussion .................................................................................................................... 46
2.5.1. Establishment of an efficient inoculation technique to screen for resistance against X. arboricola pv. pruni ................................................................................................................. 46
2.5.2. Assessment of reference apricot cultivars for resistance against X. arboricola pv. pruni .................................................................................................................................................. 46
2.6. References.................................................................................................................... 48
Chapter 3: Identification of a major QTL for Xanthomonas arboricola pv. pruni resistance in apricot ................................................................................ 50
3.1. Abstract ....................................................................................................................... 52
3.2. Introduction ................................................................................................................ 53
3.3. Material and methods ................................................................................................ 54
3.3.1. Plant material .................................................................................................................. 54
3.3.2. Bacterial strains .............................................................................................................. 55
3.3.3. Inoculation ...................................................................................................................... 55
3.3.4. Evaluation of disease resistance ..................................................................................... 55
3.3.5. DNA isolation ................................................................................................................. 56
3.3.6. SSR and AFLP analysis .................................................................................................. 56
3.3.7. Linkage mapping and QTL analysis ............................................................................... 59

Table of contents
viii
3.3.8. Statistical analysis .......................................................................................................... 59
3.3.9. Candidate gene search .................................................................................................... 60
3.4. Results .......................................................................................................................... 60
3.4.1. Phenotyping X. arboricola pv. pruni resistance ............................................................. 60
3.4.2. Construction of linkage maps ......................................................................................... 62
3.4.3. QTL analysis .................................................................................................................. 63
3.4.4. Candidate genes search ................................................................................................... 66
3.5. Discussion .................................................................................................................... 68
3.5.1. Phenotypic screenings .................................................................................................... 68
3.5.2. Linkage analysis and map construction .......................................................................... 68
3.5.3. QTL analysis .................................................................................................................. 69
3.5.4. Perspectives for marker-assisted selection (MAS) ......................................................... 70
3.6. References.................................................................................................................... 72
Chapter 4: Mapping architectural, phenological and fruit quality QTLs in apricot ................................................................................................................. 80
4.1. Abstract ....................................................................................................................... 82
4.2. Introduction ................................................................................................................ 83
4.3. Material and Methods ................................................................................................ 85
4.3.1. Plant material .................................................................................................................. 85
4.3.2. Phenotyping .................................................................................................................... 85
4.3.2.1. Tree architecture ..................................................................................................... 85
4.3.2.2. Phenology ............................................................................................................... 85
4.3.2.3. Fruit traits ............................................................................................................... 86
4.3.3. Linkage mapping and QTL analysis ............................................................................... 86
4.3.4. Statistical analysis .......................................................................................................... 86
4.4. Results .......................................................................................................................... 87
4.4.1. Architectural traits .......................................................................................................... 87
4.4.2. Phenology ....................................................................................................................... 88
4.4.3. Fruit quality traits ........................................................................................................... 89
4.5. Discussion .................................................................................................................... 93
4.6. References.................................................................................................................... 98

Table of contents
ix
Chapter 5: Comparative RNA-Seq analysis of early infected peach (Prunus persica) leaves with the quarantine phytopathogen Xanthomonas arboricola pv. pruni ............................................................................................................ 104
5.1. Abstract ..................................................................................................................... 106
5.2. Introduction .............................................................................................................. 107
5.3. Materials and Methods ............................................................................................ 108
5.3.1. Biological material and inoculation procedure ............................................................. 108
5.3.2. RNA extraction and sequencing ................................................................................... 109
5.3.3. Reads mapping and annotations ................................................................................... 109
5.4. Results and discussion .............................................................................................. 110
5.4.1. Analysis of RNA-Seq datasets ..................................................................................... 110
5.4.2. Response to X. arboricola pv. pruni inoculation at 2h and 12h post inoculation ........ 112
5.4.3. Identification of differentially expressed potential novel genes ................................... 112
5.4.4. Gene ontology analysis ................................................................................................. 112
5.4.5. Transcriptional changes of defense-related genes using Prunus persica annotations .. 120
5.4.5.1. Genes involved in basal defense........................................................................... 120
5.4.5.2. Genes involved in cell wall reorganization .......................................................... 121
5.4.5.3. Differential expression of photosynthesis genes .................................................. 121
5.4.5.4. Genes involved in hormone signaling pathways .................................................. 122
5.4.5.5. An important down-regulation of cytochrome-like genes .................................... 122
5.4.5.6. Putative resistance genes ...................................................................................... 123
5.4.5.7. Defense-related genes ........................................................................................... 123
5.4.6. Defense mechanisms in Prunus in response to X. arboricola pv. pruni ...................... 124
5.5. Conclusions ............................................................................................................... 125
5.6. References.................................................................................................................. 126
Chapter 6: General Conclusions and Outlook ............................................. 132
References......................................................................................................................... 138
Appendix .......................................................................................................... 140
Acknowledgements .......................................................................................... 160
Curriculum Vitae ............................................................................................ 164

Chapter 1
General Introduction


General Introduction
2
Scope of the thesis Apricot is one of the most economically important fruit crops belonging to the Prunus genus with a
worldwide production of 3.8 million tons in 2009. The fruits are generally very appreciated due to
their ease of consumption and multipurpose use. Although production is generally increasing
worldwide, apricot production and consumption is still mainly restricted to the Mediterranean basin.
Classical breeding programs are being applied to develop varieties with high quality fruits that fits the
requirements for the final use of the product (e.g. fresh, dried or canned), with a higher resistance of
the trees to diseases, and a better adaptability to different regions of production. However, many traits
that further need to be improved are very often polygenic, and when dealing with such polygenic
traits, classical breeding is not fast enough to respond to the demands of producers and consumers.
Recently isolated in Switzerland, Xanthomonas arboricola pv. pruni (bacterial spot) is a bacterial
disease with a potential for considerable yield losses in Prunus crops such as peach and apricot. It
causes shot holes on leaves and fruit, leading to severe defoliations and unmarketable fruits.
Resistance to this pathogen is most likely polygenic, thus a quantitative trait locus analysis is the most
appropriate way to identify molecular markers linked to the resistance. The scope of this thesis is to
obtain a better understanding of the genetics of resistance of apricot against X. arboricola pv. pruni,
and to address breeders molecular tools for selection of genotypes with improved resistance to
bacterial spot. This thesis further gives a first insight in the transcriptomic responses of peach upon
early infection with X. arboricola pv. pruni with the identification of genes involved in plant defense
response. Because so far only very few molecular studies are available in apricot, the identification of
molecular markers to select for agronomical traits, e.g. tree architecture, early or late flowering and
fruit quality traits, could be very valuable.
1.1. The apricot culture
1.1.1. Taxonomy and nomenclature
Apricot (Prunus armeniaca Linnaeus, syn. Armeniaca vulgaris, syn. Amygdalus armeniaca (L.)
Dumortier) is a species belonging to the Prunus L. genus, classified in the subgenus Prunophora Focke
in the Rosaceae family. The Prunus genus includes about 430 species spread mainly in the northern
temperate regions, from which many are economically important fruit crops such as peach (P. persica
(L.) Batsch), plum (P. domestica L.), sweet cherry (P. avium L.) and sour cherry (P. cerasus). Some
species belonging to the Prunus genus are evergreen and are used as ornamentals (P. laurocerasus).
Depending on authors, 3 to 12 apricot species are recognized. Most cultivated apricots belong
to the species P. armeniaca L. and six other species are commonly recognized as the most closely
related species to P. armeniaca: Prunus mume (Japanese apricot); P. dasycarpa (black or purple

General Introduction
3
apricot); P. brigantina (Apricot from Briançon, Southern French Alps); P. sibirica (Siberian apricot);
P. holosericea Batal. (Tibetan apricot) and P. mandshurica (from Manchuria and Korea) (Bortiri et al.
2001). Additionally, new interspecific hybrids have been obtained in the last decades by artificial
cross-pollination. Plumcot is a putative hybrid between diploid plums and apricots, whereas pluot and
aprium are complex hybrids considered to result from interspecific crosses of plums and apricots with
subsequent backcrossing to plum (pluots) or to apricot (apriums) (Ahmad et al. 2004).
1.1.2. The apricot history
According to the Russian botanist Vavilov (1992), the cultivated apricot has three possible origins.
The first one, known as the “Chinese Center”, includes the mountain regions of the Northeastern,
Central and Western China; this group is considered as the oldest and probably underexplored
(Zhebentyayeva et al. 2012). The second one is the “Central Asian Center”, it is located in the
mountains of Tien-Shan, Kyrgyzstan, Afghanistan, Tajikistan, Kashmir, northwest India and west
China; this group is one of the oldest and the most diverse. Most apricots belonging to this group show
high chilling requirements (Hormaza et al. 2007). The third center is the “Near-Eastern Center” and
includes Turkey, Armenia, and parts of Iran and Iraq. Vavilov (1992) considered this third center as a
secondary center of origin of cultivated apricot.
Apricot pits were found during archeological excavations in layers dating back to over 6,000
years ago near the Garni Temple and in the Antique Armenian town Shengavit, both near Yerevan
(Morikian 1982). De Candolle (1886) accredited the oldest written mention of apricot to a 4,000 years
old Chinese letter. It is believed that this crop has been imported with peach seeds thousands of years
ago along the Silk Road, a 6,500 km route which extended from the Ancient Persia (Iran) to East
China. Although Alexander the Great (356 – 323 BC) is believed to have brought apricot pits from
Armenia to Greece (Bourne 1979), his contemporary authors writing about agriculture do not mention
the use of this crop (Faust et al. 1998). It is more likely that General Lucullus (118 – 56 BC) directly
brought apricot stones from Armenia to Rome to cultivate apricot in the garden of his villa, and he
gave apricot the name of “Malus armeniaca”, the Armenian apple. Apricots started to be cultivated
about 100 B.C. in Italy according to Pliny the Elder and were common in Roman food 200 A.C.
according to Apicius recipes (Apicius 1974). The Arabs introduced apricot in Spain in the seventh
century and in Southern France prior to 1000. In Northern France, the Duke of Lorena introduced
varieties of apricot with higher chilling requirements and better adapted to the climate (Faust et al.
1998), however the fruits were believed to provoke strong fevers so apricot cultivation really started to
develop in France only in the eighteenth century (Leclerc 1925). Apricot was introduced in the 17th
Century in England and in Virginia (Ogawa and Southwick 1995); and in California in the 18th century
by the Spaniards (Faust et al. 1998). The first mention of apricot culture in Switzerland is by Schiner
(1812); Gabriel Luizet introduced a few years later in canton Valais the variety that he had created in

General Introduction
4
1838 in France, near Lyon; this Luizet variety quickly became a reference and was quasi the only
variety cultivated in Valais until the late 1990s (Christen et al. 2010).
1.1.3. Botany
Apricot is most of the time diploid (2n = 16), although tetraploid mutants have been reported (Bailey
and Hough 1975). Both peach and apricot genome sizes were estimated by flow cytometry by
Arumuganathan and Earle in 1991 at around 265 and 294 Mbp, respectively, but the recent sequencing
of the peach genome indicated a size of 227 Mbp (Arús et al. 2012). In any case, this size stays much
smaller than other fruit species such as prune (880 Mbp) or apple (750 Mbp) (Arumuganathan and
Earle 1991), and is only about twice bigger as the one of Arabidopsis thaliana L. Heynh (115 Mbp,
Arabidopsis Genome Initiative, 2000). Commercial cultivars are propagated by grafting which permits
to keep a good level of homogeneity and to protect cultivars against soil borne pathogens. Apricots
grafted on other P. armeniaca L. grow generally well, and can be grafted on other Prunus rootstocks
such as peach or plum, but with a higher risk of incompatibility (Vachun, 1995).
Apricot trees are rather small, from 4 to 12 meters in height with a trunk diameter up to 40 cm;
they produce white to pinkish flowers characterized by five sepals and five petals, and a single pistil.
In the same way than for all other Prunus species, apricots develop only one ovary in which two
ovules are formed with one of them degenerating just after anthesis; and most of the time only one
seed is produced (Rodrigo and Herrero 2002). To induce flowering, apricot trees require a certain
amount of chilling, defined as the number of units (hours) below 7.2°C (CU, Weinberger 1950).
Depending on apricot varieties, the chilling requirements for flowering range from 300 to 1,200 CU
(Campoy et al. 2012). The heat requirement following chilling is very short, causing apricot trees to
bloom early in most locations. Thus, apricot is prone to frost injury due to the early bloom habit and,
as a consequence, the production area is limited by the danger of spring frost (Mehlenbacher et al.
1990; Layne et al. 1996; Hormaza et al. 2007).
Fruits are known as drupes, in which one single stone, constituted by a hardened lignified
endocarp and a seed, is surrounded by a fleshy mesocarp and the exocarp (the fruit skin). Depending
on cultivars, apricot fruits require 3 to 6 months for development, and their flesh can range from sweet
to sour (Jackson and Coombe 1966). The apricot fruit weight ranges from 30 to 120 grams; it is
characterized by total amounts of sugars ranging from 8,700 to 14,200 mg/100g fresh fruit and by
good levels of acidity, with total acids of 1,400 to 3,700 mg/100g fresh fruit (Valentini et al. 2006).
The high contents in fibers (Table 1.1), in vitamin A and in potassium (Table 1.2) place the
apricot as one of the most promising foods due to the high concentration in important microelements
playing positive roles on human health (Özboy-Özbaş et al. 2010).

General Introduction
5
Table 1.1. Contents of raw and dry fruits per 100 gram edible portion
Fruit content raw fruits dry fruits
Water (%) 86.35 30.89 Carbohydrates (%) 11.12 62.64 Total sugars (%) 9.24 53.44 Crude fibers (%) 2 7.3 Protein (%) 1.4 3.39 Ash (%) 0.75 2.57 Fat (%) 0.4 0.51 Energy (Kcal) 48 241
source: USDA Nutrient Database, 2012
Table 1.2. Vitamin and microelements of fresh and dry apricot fruits per 100 gram edible
portion
Fruit content raw fruits dry fruits
Vitamin A (IU) 1926 IU 3604 IU Tiamin, B1 (mg) 0.03 0.015 Riboflavin, B2 (mg) 0.04 0.074 Niacin (mg) 0.6 2.59 Vitamin C (mg) 10 1 Calcium (mg) 13 55 Phosphorus (mg) 23 71 Iron (mg) 0.39 2.66 Sodium (mg) 1 10 Potassium (mg) 259 1162 Magnesium (mg) 10 32
source: USDA Nutrient Database, 2012
1.1.4. Economic importance
Apricot production is characterized by a very high demand; as a consequence apricot is one of the few
temperate tree fruits not affected by production surplus (Bassi 1997). Both fresh and processed fruits
often get premium prices (Hormaza et al. 2007). This popularity is due to the attractiveness of the
fruits, which are characterized by their flavor, their ease of eating and their multipurpose use (Bassi
1997; Layne et al. 1996). Fruits can be used fresh, dried, or can be canned; they can be transformed
into jams, juices, wines, liquors or puree for baby food; in China, salting or smoking are ancestral
techniques to preserve apricots. The cosmetic industry uses the oil obtained from the kernels to
produce soaps; the traditional Chinese medicine uses the apricot kernels to treat asthma and cough
(Chen et al. 1997) and in Japan P. mume fruits are believed to have antibacterial and fungicidal

General Introduction
6
properties (Fujita et al. 2002). Apricot kernels of some varieties are edible and are used in the food
industry for their strong taste and bitter properties; but kernels of other varieties contain amygdalin
which can break down to cyanide in the human body and cause serious toxicity (Carper 1988; Suchard
et al. 1998). Additionally, trees can be used as ornamental plants (Faust et al. 1998; Bassi and
Audergon 2006; Ham 2009). Among cultures, apricots are differently perceived in use and
consumption, e.g. in the USA, most of the apricot fruit production is not sold fresh, but mostly
proposed as dried or canned (Rieger 2006) and the consumption per capita is very low with approx.
400 g per year; whereas in France and Switzerland, depending on years between 0.8 and 1.9 kg are
consumed per capita per year (Christen et al. 2006; Maureau-Rio 2006).
1.1.4.1. Worldwide
In 2009, apricot worldwide production area was about 500,000 ha and the production was 3.8 million
tons (FAOSTAT 2010). Turkey is the biggest producer and accounted for 14% of the world
production in 2010 with almost 500,000 t. Yields average more than 6 t/ha, ranging from 2 to over 15
t/ha in some European countries. Apricots are produced commercially in 68 countries listed by
FAOSTAT (2010), and 56 of them have annual productions exceeding 1,000 t. In the last two decades,
world production has increased of 85%, mainly because both fruit tonnage and orchard area have been
largely expanding in African and Asian countries, whereas European and South American countries
have increased apricot production on fewer hectares of orchard. Fruit production and orchard area are
both declining in North American and Oceanic regions (Ledbetter 2008).
Widely distributed, apricot is typically a temperate zone fruit, growing best in mountainous
regions with a hot, dry summer and uniform, cold winter (Layne et al. 1996). Nevertheless some low-
chilling varieties exist and can be grown in subtropical areas (Durgaç and Kaska 1997). The
Mediterranean region accounts for 95% of the total fresh apricot market and these fruits are imported
and consumed mainly by the European community (Audergon 1995; Mahanoglu et al. 1995; OABS
2005).
1.1.4.2. In Switzerland
Apricot is the third fruit crop in Switzerland after apple and pear in terms of quantities harvested for
sale (Christen et al. 2006). About 690 ha of apricots were cultivated in Switzerland in 2010
(FAOSTAT 2010), most of it (650 ha) being located in the Valais region. Six to 9,000 tons of apricots
are produced per year, and the variety Luizet accounts for most of the production, representing 42% of
the total apricot cultivated area in 2006 (Pannatier 2006). Due to its poor conservation and its high
flavor content, Luizet production in Switzerland is mainly destined to fresh market and distilleries
(Christen et al. 2008). Fifteen years ago, Luizet was quasi the only variety cultivated in Switzerland;
since then, economical and breeding programs have been encouraging the reduction of the Luizet

General Introduction
7
production and the introduction of new apricot varieties to spread the production over the whole
summer season (Christen et al. 2010). Orangered (an early-ripening variety) with 18% of the
cultivated area and Goldrich (a late-ripening variety) with 11% are the two most successful introduced
varieties in Valais. More than half (57%) of the apricots consumed in Switzerland are imported, and a
great majority (71%) of the imported apricots come from France (Pannatier 2006).
1.1.5. Genetic resources and breeding
1.1.5.1. Available genetic resources
Kostina (1936, 1946, 1964) developed a classification to permit characterization of apricot germplasm
according to qualitative traits such as fruit size, type of skin (glabrous or pubescent), flesh color (white
and/or cream, or yellow and/or orange), fruit adherence to stone (freestone or clingstone), and seed
taste (sweet or bitter). Based on these discrete fruit characteristics, Kostina further characterized
apricot germplasm and recognized four major eco-geographical groups of apricot: the Central Asian
with six subgroups; the Irano-Caucasian with 2 subgroups; the European with three subgroups, and the
Dzhungar-Zailij with two subgroups (Table 1.3).
The Dzhungar-Zailij group, located north of Almaty and in the Tien-Shan mountains
(Turkestan), is believed to be the oldest and most primitive group whereas the European group (also
including cultivars from North and South America, South Africa, Australia and New Zealand) is the
most recent with less diversity. The Central Asian group is the richest in diversity of vegetative,
phenological and fruit characters. The trees are more vigorous and long-lived than the Irano-Caucasian
group, and require a higher accumulation of warm temperatures in spring for bud break (Mehlenbacher
et al. 1990).
Selection of apricots with superior qualities and their clonal propagation probably started
around 600 AD in China (Faust et al. 1998) and possibly at a similar period in other regions (Ledbetter
2008). The earliest reported controlled pollinations between apricots were made in the Soviet Union
by Michurin early in the 20th century (Janick and Moore 1975). Names of apricot cultivars appeared
for the first time in European written records during the 1600s although apricot had been introduced to
these areas a few centuries before from seed propagated orchards (Ledbetter 2008).

General Introduction
8
Table 1.3. Eco-geographical groups and regional subgroups of apricot as described by Kostina
(1969)
1.1.5.2. Breeding advances and targets in apricot
The number of breeding programs for apricot is much lower than for other fruit species, leading to a
low number of new cultivars released per year. Level of genetic heterozygosity, or genetic diversity, is
a factor which has to be taken into account in breeding programs, especially in the case of self-
compatible species such as apricot. Apricot possesses a moderate level of heterozygosity (Hurtado et
al. 2002); it is more heterozygous than peach, but less than cherry, plum or almond (Byrne and
Littlelon 1989). Breeding programs have been so far mainly relying on cultivars belonging to the
European group, but an important unexploited genetic variability from the cultivars belonging to the
other groups could represent a great value for breeders (Layne et al. 1996). Commercial production
areas of a particular cultivar are very limited (Mehlenbacher et al. 1990) and each cultivar is usually
limited to a particular region with certain ecological conditions due to the narrow adaptability range of
the species in comparison to other fruit trees. Therefore, many breeders are interested in broadening
adaptations for specific regions (Layne et al. 1996; Hormaza et al. 2007; Ledbetter 2008). So far,
apricot breeding has mainly relied on classical techniques. Only very little information concerning the
genetics underlying the traits of importance and their associated molecular marker(s) is available. The
integrated European project ISAFRUIT (2006 – 2010) for an increased fruit consumption in Europe
created an impulse for molecular breeding in apricot with the identification of Quantitative Trait Loci
(QTLs) involved in fruit quality (Ruiz et al. 2010), and outcomes allowing a fastening of the breeding
process may be expected within the framework of the more recent projects RosBREED
(www.rosbreed.org, Bassil et al. 2011) and FruitBreedomics (www.fruitbreedomics.com, Laurens et
al. 2011).
Eco-geographical group Regional sub-group Central Asian Fergana
Horezm
Kopet-Dag
Samarkand
Sharessyabz
Verhnezeravshan
Irano-Caucasian Dagestan
Irano-Transcaucasian
European Eastern European
Western European
Ukrainian
Dzhungar-Zailij Dzhungar Zailij

General Introduction
9
Climatic adaptation has been one of the major goals in improving apricot varieties. In regions
like Switzerland, where late spring frosts frequently occur, selection programs have focused on
breeding for late blooming varieties, apricot being characterized by an early bloom period which limits
its cultivation to some specific areas where it is safe to grow stone fruits. Indeed, freezing
temperatures of only a few hours in the late spring can cause considerable damage on flowers and thus
reduce significantly the yields (Ledbetter 2008). In other regions, breeding for earlier or later ripening
varieties with a high productivity to extend the marketing periods has been performed. Important yield
losses are observed in stone fruits cultivated in an inappropriate climate where the number of chilling
units required to break dormancy is too high or too low for the cultivar, either by the induction of a too
early flowering in the first case with the risk of frost damages on flowers, or by abnormal flower
production in the second case if the cultivar is not sufficiently submitted to cold temperatures (Coville
1920). Quantitative Trait Loci for chilling requirements were identified in the apricot F1 population
“Perfection” x “A.1740” (Olukolu et al. 2009). The identification of these QTLs located in similar
regions where QTLs in peach were identified for bud flush led the authors to hypothesize that the two
physiological processes release of vegetative bud and bud flush are controlled by similar genes. In a
study by Campoy et al. (2011), flowering time was investigated in the BC1 apricot progeny “Z506-07”
x “Currot” and was described as a quantitative trait; accordingly a QTL was identified on linkage
group 5 of “Z506-07” over 3 years of study. More recently, QTLs for flowering date were identified in
the three species—apricot, peach, and sweet cherry—on LG2, LG3, LG4, and LG7, with a major and
stable QTL on LG4 in apricot (Dirlewanger et al. 2012).
Apricot is an interfertile species, and most of the European apricot cultivars have traditionally
been considered self-compatible, whereas the Asian and Irano-Caucasian apricots have been classified
as self-incompatible (Kostina 1969). Self-incompatibility prevents inbreeding and promotes out-
crossing; production is however limited by the availability of bees for pollination. Thus the selection
for self-compatibility can be relevant for producers to ensure pollination during bad weather
conditions. Self-incompatibility is due to one single highly polymorphic locus called the S-locus
(Burgos et al. 1997) found on linkage group 6 (Vilanova et al. 2003).
Many breeding programs are working on fruit quality traits for fresh markets requiring large
size apricots (more than 60 g), with an attractive appearance, an improved aroma and flavor, freestone,
a firm flesh, a good resistance to fruit cracking and with a uniform ripening (Hormaza 2007). A
medium size and a yellow orange color are required for canning apricots (Audergon 1995). For drying
purposes, fruits with high levels of soluble solid contents (SSC) are needed, together with a firm flesh
at maturity, large fruit sizes and a good drying quality (Witherspoon 1999; Graetz 2006). Aroma and
flavor are complex traits; aromatic profiles of different apricots have been performed by comparing
apricots grown with the same cultural management/environment and extracted under similar

General Introduction
10
conditions (Guichard 1995). Apricot aroma of several apricot varieties has been characterized by a
headspace-solid phase microextraction combined with gas chromatography-mass spectrometry and
gas-chromatography-olfactometry (Guillot et al. 2006). Ten volatile compounds were identified as
representative compounds of the apricot aroma and were recommended for characterizing apricot
varieties on aromatic criteria. Apricot varieties have been also characterized according to their
phenolic content (Ruiz et al. 2005a). Ground color of apricots has been analyzed, as well as the
carotenoid content. Both were highly correlated in a study from Ruiz et al. (2005b), which permits to
select for cultivars with a high nutritional value and an attractive color. However, although improving
both the attraction of apricot fruits and the amount of sugar and volatile contents, only one preliminary
study of their genetic control has been performed so far by Ruiz et al. (2010) with the identification of
QTLs involved in ground color, SSC, fruit weight, stone weight, titratable acidity and firmness.
An underused product from apricot is actually the seed (Christen et al. 2009). Apricot seeds,
depending on the cultivars, can be sweet or bitter, and bitterness is determined by the amygdalin
content which is toxic for human consumption because of the release of hydrogen cyanide upon seed
crushing. Bitterness was thought to be controlled by a single recessive gene (Kostina 1969) leading to
an important difference between sweet and bitter apricot cultivars with few intermediates (Gómez et
al. 1998). However, a more recent study showed that a set of five non-linked genes would control seed
taste with two different pathways (three in the biosynthesis of cyanoglucosides or their transport, and
two in the breakdown of cyanoglucosides, Negri et al. 2008). In the F1 apricot progeny “Lito” x
“BO81604311”, three QTLs controlling bitter taste have been identified on LG1, LG4 and LG6 on
both parental maps (Cervellati et al. 2012).
In Switzerland, focus is given on obtaining late blooming and late ripening apricot varieties as
well as on increasing fruit quality traits like shelf-life, fruit size and color, but also on tree architecture
and disease resistance (Christen et al. 2006; Christen et al. 2010).
1.1.5.3. Major pests and diseases
Disease resistance to major pathogens is one of the most important goals for breeders. Many efforts
have been done in the last decade to understand the resistance mechanisms against plum pox virus
(PPV), also known as sharka. Two strains are virulent for apricot, PPV-D (Dideron) and PPV-M
(Marcus). Many quantitative trait locus (QTL) analysis have been performed using different crosses,
and in most of them a QTL was found on the top of Linkage Group 1 (Hurtado et al. 2002; Lambert et
al. 2004; Vilanova et al. 2007; Sicard et al. 2008; Soriano et al. 2008; Dondini et al. 2010; Vera Ruiz
et al. 2011).
Apricot production is also endangered by brown rot, caused by Monilinia laxa, M. fructicola
and/or M. fructigena. Monilinia spp. are probably the major fungal diseases for apricot by causing

General Introduction
11
damages to flowers and shoots (blights), and to fruits (rots). The development of the disease is linked
to climatic conditions, rainy conditions during flowering being the most critical phase for mycelial
growth. Several fungicide applications per year, mainly during bloom and in the last phase of ripening
of the fruits, may be required to avoid important yield losses. Several breeding programs currently
focus on host resistance; tolerant cultivars have been found in apricot, and results tend to show that
resistance is a quantitative trait (Conte et al. 2004). According to Nicotra et al. (2006), “branch
resistance” and “fruit resistance” to Monilia are controlled by different independent genes.
Coryneum beijerinckii (Stigmina carpophila) which causes shot holes is another fungal
pathogen which is prevalent in Eastern Europa and for which resistant cultivars have been identified
(Balan et al. 1995). Powdery mildew (caused by Sphaerotheca pannosa (Wallr.) Lev in the early
season or by Podosphaera tridactyla DeBary later in the season) is more widely spread worldwide
(Corazza and Simeone 1991).
Chorotic Leaf Roll, caused by a phytoplasma, is very common in Europe and causes the
obstruction of the sap vessels (Ham 2009). Although it is a serious threat for apricot production, the
genetics of this disease have not been studied yet and no host resistance has been reported so far.
Last but not least, bacterial leaf spot, caused by Xanthomonas arboricola pv. pruni is one of
the major bacterial diseases in apricot, causing necrotic spots on leaves and fruits leading to severe
defoliations and unmarketable fruits.
1.2. Xanthomonas arboricola pv. pruni
The Xanthomonas arboricola species includes seven different pathovars which are all plant-
pathogenic bacteria, including X. arboricola pv. populi on poplar, X. arboricola pv. poinsetticola on
poinsettia, X. arboricola pv. fragariae on strawberry, X. arboricola pv. celebensis on banana, X.
arboricola pv. juglandis on walnut, X. arboricola pv. corylina on hazelnut and X. arboricola pv. pruni
on stone fruits (Palleroni et al. 1993; Vauterin et al. 1995; Janse et al. 2001). The three last pathovars
juglandis, corylina and pruni are the most important threats to fruit production and are the most
closely related (Scortichini and Rossi; 2003; Young et al. 2008).
Bacterial spot of stone fruits is a disease caused by X. arboricola pv. pruni, which was first
described on Japanese plum in orchards in Michigan (the USA) by Smith in 1903 and named
Xanthomonas pruni. The bacterium was then named X. campestris pv. pruni by Dye in 1978, and
finally after a DNA-DNA hybridization study, classified as X. arboricola pv. pruni by Vauterin et al.
(1995).

General Introduction
12
Like Xanthomonas campestris pathovars and other Xanthomonas species, some X. arboricola
pv. pruni strains produce xanthan gum, a polysaccharide which is used as food additive and thickening
agent (also known as E415) for sauces, frozen food, but also for toothpaste, cosmetic creams, paper,
paint, textile, and by the oil industry (Rosalam and England 2006). The economic importance of this
biopolymer is increasing, with a worldwide commercial production of xanthan of approximately
86,000 tons/year (Seisun 2006). Several strains of X. arboricola pv. pruni are of special interest
because of their significant xanthan yields (Moreira 2002; Borges et al. 2009) and could be
successfully used by the industry (Antunes et al. 2003).
1.2.1. Host range, symptoms and damages
Xanthomonas arboricola pv. pruni is a gamma, gram-negative bacterium which has been reported on
peach, apricot, nectarines, almond, and recently on the ornamental plant Prunus laurocerasus (Young
1977; Ritchie 1995; Marchi et al. 2011; Tjou-Tam-Sin et al. 2011). Although the pathogen has been
identified on a wide range of Prunus species, X. arboricola pv. pruni is characterized by a very low
genetic diversity in comparison to other arboricola pathovars (Hajri et al. 2012). It has been
hypothesized that this low diversity may be due to a worldwide cultivation of the same cultivars of
peach and plum, but also to the low genetic diversity of the host (Boudon et al. 2005; Hajri et al.
2012). Typical symptoms caused by the disease are necrotic lesions on both fruits (Fig. 1.1A) and
leaves (Fig. 1.1.B and Fig. 1.1.C); on the leaves necrosis may merge with the time before falling off
the leaf, giving the leaf an aspect of “shot holes” (Garcin et al. 2005). Under favorable conditions to
the growth of the bacteria, cankers and defoliations of trees (Fig. 1.1.B) occur which may lead to the
death of the trees.
Figure 1 Apricot fruits showing X. arboricola pv. pruni symptoms on A, the fruits; B, the tree and C,
a leaf. Photos A by Mauro Genini (Office Cantonal d’Arboriculture, Valais) and B by Santiago
Schärer (Agroscope Changins-Wädenswil)
Dunegan (1932) estimated yield losses in Georgia (USA) of 25 to 75% depending on the
years, and Stephens evaluated a possible economic loss of 10% of the value of the whole Australian
stone fruit production. In Italy, in Japanese plum orchards, yield losses can exceed 10,000€/ha in
A B C

General Introduction
13
epidemic years (Stefani 2010). Because of the threat that causes X. arboricola pv. pruni to Prunus
production, the bacteria is considered as a quarantine pathogen for the European Plant Protection
Organization (Anonymous 2006) and is listed by the EU Council Directive 2000/29/EC in the annex
II, section 2, as a harmful organism (Anonymous 2000).
1.2.2. Localization
The presence of the bacteria has been reported on the five continents; from its original description in
1903, it has been spread worldwide most likely with trade of contaminated plants. The pathogen is
nowadays widespread in China, South Africa and Uruguay, and has been locally reported in North
America, Brazil, Mexico, East Europe, Australia, Japan and South Korea (Anonymous 2006). In
Europe, X. arboricola pv. pruni was first identified by Petri (1934) in northern Italy, where the
pathogen is now considered as endemic (Battilani 1999). The pathogen has then continued to spread,
and it has been recently identified in Spain, France, Bulgaria, Romania, and Ukraine (Anonymous
2006). Concerning Switzerland, the first doubts of the presence of contaminated trees occurred in 2002
and the bacterium was identified for the first time in 2005 on Japanese plum and apricot trees (Pothier
et al. 2010). Since then, infected trees have been regularly identified with important outbreaks in 2007
and 2008, just a few trees eradicated in 2009 and 2010, and no identification in 2011 probably due to
exceptional climatic conditions with very few precipitations (M. Genini, pers. comm.).
1.2.3. Disease cycle
Several sources of inoculum have been identified. Depending on the region or the Prunus species,
twig cankers have been first described as the most probable overwintering site of the bacterium for
plum in South Africa and North America (Dunegan 1932; Du Plessis 1987). However cankers are
rarely observed on peach, so overwintering in dormant buds and leaf scars might be more likely for
peach (Shepard and Zehr 1994). Zaccardelli et al. (1998) successfully re-isolated bacteria cells from
leaves that had decayed for 7 months, showing that a primary infection caused by fallen leaves cannot
be excluded. The bacterium can be also epiphytic on twigs and buds, without causing any symptom for
several weeks (Shepard and Zehr 1994; Zaccardelli et al. 1995), thus budding and pruning may have
played an important role in the propagation of the pathogen. Under favorable conditions, X. arboricola
pv. pruni has been also shown to be able to survive and multiply on non-host plants like tomato
(Timmer et al. 1987). The pathogen uses stomata or wounds to invade leaves (Aarrouf et al. 2008) and
spreads then systemically into the host through the vascular tissues, i.e. xylem and phloem (Du Plessis
1983; 1987; Aarrouf et al. 2008).
A high humidity for three days or more, coupled with temperatures over 28°C are the optimum
conditions for the bacterium to provoke symptoms (Zehr and Shepard 1996). Bacterial cells spread in

General Introduction
14
the orchard with wind and rain splashes (Fig. 1.2). This secondary infection will provoke most of the
injuries and severe defoliations under favorable conditions.
Figure 2 Xanthomonas arboricola pv. pruni cycle reprinted from Jones and Sutton (1996)
1.2.4. Identification methods
The identification of a quarantine pathogen in a very short time is of importance for phytosanitary
officers and growers to rapidly react in case of the detection of an outbreak by taking measures to
prevent the spread of the disease. The first methods available for the detection of X. arboricola pv.
pruni were the identification on semi-selective media (Civerolo et al. 1982), or via detached-leaf
bioassays (Randhawa and Civerolo 1985). The current EPPO standard protocol for the diagnosis of
bacterial spot of stone fruits (Anonymous 2006) is still based on isolation of the pathogen using
general agar media, followed by identification of pure cultures by biochemical tests, protein and fatty
acids methyl ester (FAME) profiling, repetitive extragenic palindromic PCR (REP-PCR), serological
and pathogenicity tests. However, several days are needed with these methods before obtaining results
and they do not permit any identification at the pathovar or at the strain level. A great emphasis has
been placed on developing molecular tools for rapid and sensitive diagnostics of this quarantine
pathogen in the recent years, notably in the framework of COST 873 for bacterial diseases of stone
fruits and nuts. The development of several pathogen-specific PCR assays in this frame now enables
direct detection in symptomatic or asymptomatic plant samples; this represents a significant
improvement for the identification of putative Xanthomonas arboricola pv. pruni isolates. The first
rapid diagnostics were based on classical PCRs relying on primers targeting the hrp gene, which is

General Introduction
15
required for plant pathogenic bacteria to induce symptoms if the plant is susceptible, or a
hypersensitivity reaction if the plant is resistant or a non-host (Leite et al. 1994; Park et al. 2010).
Pagani (2004) and Pothier et al. (2011a) developed a duplex-PCR protocol, and Palacio-Bielsa et al.
(2011) a qPCR protocol, both protocols being based on XapY17 primers targeting an ABC transporter
ATP-binding system which is highly conserved in X. arboricola pv. pruni. Although all PCR
techniques based on this transporter also give amplicons with other Xanthomonas species, they can
still be used since no other Xanthomonas species or pathovar than X. arboricola pv. pruni has been
reported as pathogenic for Prunus crops (Palacio-Bielsa et al. 2012). Latest techniques rely on
multiplex PCR protocol based on pXap41, an ubiquitous plasmid in X. arboricola pv. pruni strains
(Pothier et al. 2011b), or on matrix-assisted laser desorption ionization-time of flight mass
spectrometry (MALDI-TOF MS) which allows as well pathovar discrimination (Pothier et al. 2011c).
Finally, the recent complete sequencing of X. arboricola pv. pruni CFBP 5530 (Pothier et al. 2011d)
provides new possibilities to improve specificity and sensitivity of identification of the pathogen, e.g.
with the development of a loop-mediated isothermal amplification PCR (LAMP) technique which
allows rapid on-field assessment with a sensitivity comparable to qPCRs assays (Bühlmann et al. in
press).
1.2.5. Control
Strategies to control the spread of the disease and to limit its damages include prophylactic measures,
use of chemical agents and can be combined to disease forecasting models.
1.2.5.1. Prophylactic measures
Because X. arboricola pv. pruni is regulated as a quarantine pathogen, removal of infected trees and as
much as possible of the decaying infected branches or leaves is required. The use of disinfected tools
for pruning and grafting as well as certified healthy rootstocks and buds is highly recommended. The
use of overhead sprinklers for irrigation must be avoided, and it is advised to avoid too low
fertilizations in potassium and too high ones in nitrogen because they may induce a high infiltration of
water in plant tissues, leading to a better circulation of the bacteria in these tissues (Garcin et al. 2005).
1.2.5.2. Chemical and biological control
Copper applications could be the most efficient method to limit the spread of the bacteria, however
copper efficacy is only partial, and it is especially phytotoxic for stone fruit species by provoking leaf
necrosis and defoliations (Ritchie 1995). The use of antibiotics such as tetracycline at the beginning of
the growing season can be performed in the USA but is not allowed in Europe. Attempts to control the
pathogen biologically have been performed with the use of bacteriophages. Although results reported
showed a reduction of the disease incidence, the use of phages to control the bacteria is not
recommended because of the high risk of developing phage resistance (Civerolo 1976; Vidaver 1976;

General Introduction
16
Randhawa and Civerolo 1985). In preliminary studies, applications of the bacterial antagonist
Pseudomonas fluorescens, led to a reduction of the disease severity, leading to promising
opportunities to control the disease (Biondi et al. 2009).
1.2.5.3. Forecasting models
Due to the high correlation between climatic factors (especially heavy rains and high temperatures)
and disease development, forecasting models for assessing the right timing of spray applications could
help the stone fruit producers to control the spread of the disease. One forecasting model has been
recently developed by Garcin et al. (2011); it takes in account the inoculum level of the previous year,
the date of the first open flower, and the daily temperature and humidity. However this model still
needs to be tested in the coming years to improve its precision.
1.2.5.4. Breeding
A large variability in disease resistance or susceptibility has been described in peach, nectarines,
plums and apricots from orchard observations (Keil and Fogel 1974; Bazzi et al. 1990; Garcin et al.
2005; Garcin and Bresson 2011). However, up to now no complete resistance has been reported in
these four crops. Concerning apricot varieties, “Goldbar”, “Hargrand” and “Goldrich” were described
as the most susceptible to the disease, with a disease incidence of 25 to 65% depending on the years
(Garcin and Bresson 2011), and “Bergarouge” and “Orangered” were the most resistant apricot
varieties in their study with a disease incidence of 2 to 8%. Although many peach and apricot varieties
are now characterized in function of their degree of resistance or susceptibility to the pathogen, the
genetics underlying the host resistance has not been studied so far. The different levels of resistance
observed to X. arboricola pv. pruni indicate that the resistance might be quantitative, as suggested by
Layne (1966) and Werner et al. (1986). This type of resistance is considered as more sustainable than a
monogenic resistance due to the difficulty of the pathogens to overcome a polygenic resistance.
1.3. Molecular tools available for breeding in Prunus
Until recently, the improvement of Prunus species has almost exclusively relied on traditional
breeding techniques. These techniques are expensive, because time-consuming and space requiring,
especially for woody species due to the need of a large population of seedlings from which only the
most promising genotypes are selected. The juvenile period of peach or apricot varieties may last three
to five years before the onset of fruits so that 20 years or more are common before the successful
introduction of a gene of interest (Monet et al. 1998). In this context, the molecular tools recently
made available for breeders have become of great interest because they permit to reduce costs by
fastening the selection process of woody fruit plants. Further, many traits (e.g. fruit quality, resistance
to diseases, high yield) are polygenic, especially in apricot for which it is generally accepted that most

General Introduction
17
disease resistance or agronomic traits are controlled in a quantitative manner (Zheventyayeva et al.
2012). Classical breeding is generally not adapted for the detection and selection of such quantitative
traits, thus a quantitative trait locus (QTL) analysis may be more appropriate for the detection of those
traits of interest.
1.3.1. Approaches for QTL identification
The identification of QTLs is in most cases based on a technique called linkage mapping (or family
mapping) for which a segregating population is issued from two parents which usually considerably
differ for one or several trait(s) of interest. Molecular markers revealing a polymorphism between the
parents and segregating in the population are screened to construct a genetic linkage map based on the
recombination frequency obtained between every marker. Two markers are linked if the recombination
frequency is lower than 0.5, and this recombination frequency is then translated into a genetic distance
unit (centimorgans, cM). On the other side, phenotypic data are scored in the population and generally
on the parents. When a significant association is identified between the marker and the studied trait
and after subsequent validation in different backgrounds or environments, the marker can be further
used in a Marker-Assisted selection (MAS) program to introduce the trait of interest in commercial
cultivars.
A different approach called association mapping (also known as population mapping or
linkage disequilibrium) can be considered as complementary to the traditional linkage mapping
previously described (Myles et al. 2009). Association mapping is based on an important population of
unrelated individuals for which phenotypic and genotypic data are also collected and correlations
among genotypes and phenotypes are searched. One major advantage of this technique is that markers
linked to traits of interest can be directly integrated in a Marker-Assisted Selection program. However,
linkage disequilibrium has been poorly used in Prunus so far, probably due to the high density of
markers required for this type of analysis. Linkage disequilibrium has only been applied to study the
genetic variation in peach (Aranzana et al. 2010), the magnitude of linkage disequilibrium in cherry
(Arunyawat et al. 2012) and marker-trait associations of ten traits involved in phenology and fruit
quality of peach (Cao et al. 2012).
More recently developed, pedigree-based analysis (PBA, van de Weg et al. 2004) is a
technique that relies on the information of the pedigree in several breeding populations and
generations derived from a set of common ancestors. This information is given by bi-allelic (SNPs) or
multi-allelic (SSRs) markers, for which the alleles can be followed along the generations and their
correlation with traits of interest is assessed with specific softwares such as FlexQTL that can also
detect QTLs. Although no publication has been reported yet, the concept of PBA was used in the FP5
project “High-quality Disease Resistant Apples for a Sustainable Agriculture” (HiDRAS)

General Introduction
18
(Gianfranceschi and Soglio 2004). Later the same approach has been applied in Prunus to identify
QTLs involved in sweet cherry for fruit size, within the sweet cherry pedigree set available at the
Michigan State University (www.rosaceae.org). More recently PBA has been used to identify QTLs
associated with fruit traits in peach and apples within the FP7 project of FruitBreedomics (Laurens et
al. 2011).
1.3.2. Tools for molecular studies in Prunus
1.3.2.1. Reference linkage maps available in Prunus
In Prunus, genomic studies started with the development of markers, especially DNA markers in the
view of constructing genetic linkage maps, typically with F1, F2 or BC1 populations. The first linkage
maps available were for peach and were constructed with the help of the three types of markers,
namely morphological, isozyme and DNA (Random Amplification of Polymorphic DNA, RAPD and
Restriction Fragment Length Polymorphism, RFLP) markers (Chaparro et al. 1994; Rajapakse et al.
1995). However the low levels of polymorphism of RAPD and RFLP markers in peach as well as the
dependence on environmental conditions and developmental stages of isozymes and morphological
markers led to the use of more efficient DNA-based markers, principally Amplified Fragment-Length
Polymorphism (AFLPs) and Simple Sequence Repeats (SSRs or microsatellites). With the time,
microsatellite markers have become the markers of choice due to their codominance, their ease of use,
their high polymorphism their abundance and their excellent reproducibility (Arús et al. 2005). The
first saturated linkage map, considered as the Prunus reference map, has been constructed from a cross
with “Texas” (almond) x “Earlygold” (peach) (T x E) by Joobeur et al. (1998) and has been further
enriched with microsatellite markers by bin mapping (Howad et al. 2005). Currently, the 826 markers
spanning 519 cM located on the map available online http://www.rosaceae.org/species/prunus permit
to compare marker positions in maps of other Prunus species or to add markers to saturate very
specific regions. In apricot, the maps issued from the cross “Lito” x “BO81604311” were the only
ones constructed with microsatellites and as such could be considered as reference for apricot
(Dondini et al. 2007). A set of 96 markers were used as anchor to the Prunus reference map T x E.
1.3.2.2. Linkage maps in apricot
In apricot, most of the linkage maps have been constructed in the view of mapping resistance QTLs
against Plum Pox Virus. Resistance to PPV is segregating in five of these maps, “Goldrich” x
“Valenciano” (Hurtado et al. 2002), “Lito” x “Lito” (Vilanova et al. 2003), “Polonais” x “Stark Early
Orange” (Lambert et al. 2007), “LE3246” x “Vestar” (Lalli et al. 2008), “Lito” x “BO81604311”
(Dondini et al. 2007; 2010). One map has been developed from the cross “Perfection” x “A.1740” in
order to study chilling requirements inheritance (Olukolu et al. 2009), and only one map so far has
been constructed to analyze QTLs involved in fruit quality traits (“Goldrich” x “Moniqui”, Ruiz et al.

General Introduction
19
2010). The average length of the maps, spanning between 450 and 650 cM, corresponds to the average
reported for the reference map T x E, with a maximal marker density reported of 0.77 cM in the case
of the “A.1740” map.
1.3.2.3. Genome synteny among Prunus species
In the last decade, several comparative genome studies have been performed in the Rosaceae family
with the help of the alignment of genetic maps via co-dominant markers, usually microsatellites. With
the availability of the saturated reference map T x E, the collinearity of species within the Prunus
genus to this map has been demonstrated with a set of anchor markers, e.g. for almond (Lambert et al.
2004), apricot (Dondini et al. 2007; Illa et al. 2009), sweet cherry (Olmstead et al. 2008), as well as
plum, P. davidiana and P. ferganenesis (Arús et al. 2006). This high collinearity among genomes
permits to transfer easily markers and genetic information between the different Prunus species.
Although the genus Prunus, Fragaria and Malus are distantly-related inside the Rosaceae
family, chromosomal synteny has been identified, between the T x E map (Prunus) and F. vesca ‘815’
x F. nubicola ‘601’ (Fragaria) (Vilanova et al. 2008), but also between the three genus Prunus,
Fragaria and Malus (Illa et al. 2011). Both authors reconstructed a putative ancestral Rosaceae
genome with nine chromosomes.
1.3.3. Other tools available for breeding
A first step after the construction of the peach reference map T x E towards whole genome sequencing
has been the generation of the peach physical map. This map is characterized by 2,138 contigs
containing 15,655 bacterial artificial chromosomes (BAC) clones (Zhebentyayeva et al. 2008) and has
a size of ca. 303 Mbp; it is also available online http://www.rosaceae.org/node/34.
1.3.3.1. ESTs and candidate gene analysis
Expressed Sequence Tags (ESTs) are fractional sequences of expressed genes randomly picked from a
cDNA library. Because they reveal genes expressed in a tissue and their relative level of expression,
ESTs have become a tool of choice for gene discovery and mapping in many different organisms. In
Prunus, the development of ESTs started in peach in 2002 (Yamamoto et al. 2002), followed later by
apricot (Decroocq et al. 2003; Grimplet et al. 2005) and almond (Jiang and Ma 2003). Up to date in
Prunus, more than 100,000 ESTs have been released, including 25,000 unigenes. In apricot, 13,000
ESTs representing the transcriptome of the mesocarp tissue have been sequenced and annotated
(Grimplet et al. 2005).

General Introduction
20
1.3.3.2. High-throughput transcriptome analysis
The complete peach genome sequence has been recently released by the International Peach Genome
Initiative (IPGI) and is available at http://www.rosaceae.org/peach/genome. The availability of the
whole genome sequence opens a wide range of new possibilities in genome research, including
transcriptome analysis, gene discovery, polymorphism studies and epigenetic studies thanks to fast
developing technologies for transcriptome analysis and their decreasing prices.
1.3.3.2.1. Microarrays
Developed in the mid-90s, microarray technology permits to obtain high throughput detections of gene
levels (Schena et al. 1995), but has only been recently applied to Prunus with the development of the
µPEACH1.0 microarray, which contains 4,806 oligonucleotide probes in order to study fruit ripening
(Trainotti et al. 2006). The same microarray was used to study seed-pericarp cross-talk and
development in peach (Bonghi et al. 2011), and fruit development and ripening in apricot (Manganaris
et al. 2011). An average of 43% of the spotted probes hybridized with apricot cDNA and 70% of the
genes in peach and apricot had the same expression pattern during fruit development. These results
confirmed the important genomic similarities between both species. A second microarray called
ChillPeach containing 4,468 unigenes has been developed by Ogundiwin et al. (2008) to study
differential expression of genes after chilling injury in peach fruits. This microarray has been further
used to identify genes involved in hypoxia response in two different Prunus genotypes (Rubio-Cabetas
et al. 2010). The microarray technology has also been used in almond to study genes involved in shoot
regeneration (Santos et al. 2009) and in cherry to identify incompatibility alleles (Pasquer et al. 2008).
However, with the availability of full genomes, the emergence of next-generation sequencing and
the decrease of sequencing prices, the microarray technology is now on the decline, and the very
recent decision (June 1st, 2012) of Roche to get out of the DNA microarray market could be another
real blow for the technology (Newman 2012).
1.3.3.2.2. Next Generation Sequencing
High-throughput mRNA sequencing (RNA-Seq) is probably one of the most complex next-generation
applications due to the multiple information obtained on expression levels, differential splicing, allele-
specific expression and RNA editing (Costa et al. 2010). Other advantages over the microarray are the
availability of the information on transcripts expressed at very low levels, the technology is not limited
to known transcripts, and it has a very low or non-existent background signal because DNA sequences
can be mapped to unique regions of the genome without any limitation of reads that can be mapped on
a specific region (Wang et al. 2009). Three different technologies are available for RNA-Seq, the first
one, Roche 454, arrived in 2004 followed in 2006 by the Illumina/Solexa, and more recently the
Applied Biosystems SOLiD. According to the Sequence Read Archive (SRA,
General Introduction
21
http://www.ncbi.nlm.nih.gov/sra) in which raw sequencing datasets are submitted when community
scientific projects are published, 100 Terabases of open-access reads were available in 2011, a large
part (84%) coming from the Illumina platform (Kodama et al. 2012) due to the very attractive costs of
the platform in comparison to the others.
Currently in Prunus, the use of RNA-Seq technologies has just started, for the gene expression
analysis of resistance to PPV in apricot (Martínez-Gómez et al. 2011); to identify genes involved in
graft incompatibility in Prunus (Pina et al. 2010) or genes involved in cuticle formation in sweet
cherry (Alkio et al. 2012). Other groups in Prunus are working on fruit quality and flowering time
(Martínez-Gómez et al. 2011), so that knowledge about Prunus transcriptome may considerably
increase in the coming years.
1.3.3.2.3. The IPSC peach 9 K SNP array v1
The use of several next-generation sequencing platforms permitted to identify 6,654 SNPs covering
the peach genome with an average of 1 SNP for 40,000 nucleotide bases (Ahmad et al. 2011), but also
to develop and characterize the peach SNP array v1 constituted by 9,000 polymorphic SNPs (Verde et
al. 2012), both tools being a great help in Prunus genetic studies and breeding activities.
1.4. Outline of the thesis
In chapter 1 of this thesis, one major statement was that although apricot is a relatively important crop
worldwide and would require some genetic improvements to satisfy both consumer and producer
demands, very little research concerning the genetic control of traits of importance has been performed
so far. The bacterial pathogen Xanthomonas arboricola pv. pruni was recently identified in
Switzerland which may threaten apricot production in Valais. Thus the objectives of this work were
first to develop an inoculation technique for X. arboricola pv. pruni in Prunus which would permit to
assess resistance or susceptibility quantitatively, and to test it on different apricot cultivars which are
representative of Swiss production (chapter 2). Chapter 3 aimed at developing a genetic linkage map
from a population of 101 individuals issued from the apricot cross “Harostar” x “Rouge de Mauves”,
and this map was used to identify a major Quantitative Trait Locus (QTL) for resistance against X.
arboricola pv. pruni. This map was further used to detect QTLs of interest including architectural,
phenological and fruit quality traits, and should help breeders to increase vigor, to delay the flowering
in order to reduce the spring frost damages and to increase fruit quality of apricot cultivars (chapter 4).
Chapter 5 gives a deeper insight of the peach transcriptome after X. arboricola pv. pruni inoculation
and identifies sets of genes which are differentially expressed two hours and twelve hours after
inoculation. Finally, the general conclusion (Chapter 6) discusses the importance of markers identified
in this study as linked to traits of interest and of the use of transcriptomics as a potential tool for
breeding.

General Introduction
22
1.5. References
Aarrouf J, Garcin A, Lizzi Y, El Maataoui M (2008) Immunolocalization and histocytopathological
effects of Xanthomonas arboricola pv. pruni on naturally infected leaf and fruit tissues of peach
(Prunus persica L Batsch). J Phytopathology 156: 338–345
Ahmad R, Potter D, Southwick SM (2004) Identification and characterization of plum and pluot
cultivars by microsatellite markers. J Hort Sci Biotech 79: 164–169
Ahmad R, Parfitt DE, Fass J, Ogundiwin E, Dhingra A, Gradziel TM, Lin D, Joshi NA, Martinez-
Garcia PJ, Crisosto CH (2011) Whole genome sequencing of peach (Prunus persica L.) for SNP
identification and selection. BMC Genomics 12:569
Alkio M, Jonas U, Sprink T, van Nocker A, Knoche M (2012) Identification of putative candidate
genes involved in cuticle formation in Prunus avium (sweet cherry) fruit. Ann Bot
doi:10.1093/aob/mcs087
André (1974) L'art culinaire par Apicius. André J (Ed) Les Belles Lettres, Paris (In Latin and French)
Anonymous (2000) Council Directive 2000/29/EC of 8 May 2000 on protective measures against the
introduction into the Community of organisms harmful to plants and plant products and their
spread within the Community. Official Journal L169: 10.7.2000
Anonymous (2006) EPPO standards PM 7/64. Diagnostics Xanthomonas arboricola pv. pruni. Bull.
EPPO 36:129-133
Antunes AEC, Moreira AS, Vendruscolo JL, Vendruscolo CT (2003) Screening of Xanthomonas
campestris pv pruni strains according to their production of xanthan and its viscosity and
chemical composition. Braz J. Food Technol 6: 317-22
The Arabidopsis Genome Initiative (2000) Analysis of the genome sequence of the flowering plant
Arabidopsis thaliana. Nature 408:796:815
Aranzana MJ, El-Kadri A, Howad W, Arús P (2010) Genetic variation, population structure and
linkage disequilibrium in peach commercial varieties. BMC Genet 11:69
Arumuganathan K, Earle E (1991) Nuclear DNA content of some important plant species. Plant Mol
Biol Report 9:208–218
Arunyawat U, Capdeville G, Decroocq V, Mariette S (2012) Linkage disequilibrium in French wild
cherry germplasm and worldwide sweet cherry germplasm. Tree Genet Genomes
doi:10.1007/s11295-011-0460-9
Arús P, Howad W, Mnejja M (2005) Marker development and marker-assisted selection in temperate
fruit trees. In: In the Wake of the Double Helix: From the Green Revolution to the Gene
Revolution. Tuberosa R, Phillips RI, Gale M (eds) Bologna, Italy pp 309-325

General Introduction
23
Arús P, Yamamoto T, Dirlewanger E, Abbott AG (2006) Synteny in the Rosaceae. In Plant Breeding
Reviews Edited by: Janick J. London, John Wiley and Sons Inc pp 175-211
Arús P, Verde I, Sosinski B, Zhebentyayeva T, Abbott AG (2012) The peach genome. Tree Genet
Genomes DOI: 10.1007/s11295-012-0493-8
Audergon JM (1995) Variety and breeding. Acta Hort 384:35–45
Bailey CH, Hough LF (1975) Apricots. In: Janick J, Moore JN Eds. Advances in Fruit Breeding.
Purdue University Press. Indiana. pp 367-386
Balan V, Stoian E, Stancu T, Ivascu A, Oprea M, Mircea I, Valeriu S (1995) Breeding for disease
resistance in apricot problems and prospects. Acta Hort 384:103-109
Bassi D (1997) Apricot culture: Present and Future. XI International Symposium on Apricot Culture.
Veria, Greece, 25–30 May 1997, 17
Bassi D, Audergon JM (2006) Apricot breeding: update and perspectives. Acta Hort 701: 279–294
Bassil NV, Peace CP, Main D, Gilmore B, Mockler T, Wilhelm L, Chagne D, Gardiner SE, Crowhurst
R, Verde I, Sosinski B, Morgante M, Scalabrin S, Arús P, Velasco R, Troggio M, Cestaro A,
Ficklin S, Fazio G, Norelli J, Rees J, Lawley C, Hansen M, Iezzoni A (2011) RosBREED deploys
Genome-wide Scans in Peach, Apple, and Cherry. HortScience 46: S100
Bazzi C, Stefani E, Minardi P, Mazzucchi U (1990) Suscettibilità comparativa del susino a
Xanthomonas campestris pv. pruni. L’Informatore Agrario 46: 71-74
Battilani P, Rossi V, Saccardi A (1999) Development of Xanthomonas arboricola pv. pruni epidemics
on peaches. J Plant Pathol 81:161-171
Biondi E, Dallai D, Brunelli A, Bazzi C, Stefani E (2009) Use of a bacterial antagonist for the
biological control of bacterial leaf/fruit spot of stone fruits. IOBC Bulletin 43: 277-281
Bonghi C, Begheldo M, Ziliotto F, Rasori A, Trainotti L, Tosetti R, Tonutti P (2010) Transcriptome
analyses and postharvest physiology of peaches and nectarines. Acta Hort 877:69–73
Borges CD, Paula RCM, Feitosa JPA, Vendruscolo CT (2009) The influence of thermal treatment and
operational conditions on xanthan produced by X. arboricola pv. pruni strain 106. Carbohydrate
Polymers 75: 262-268
Bortiri PE, Oh S, Jiang J, Baggett S, Granger A, Weeks C, Potter D, Parfitt DE (2001) Phylogeny and
systematic of Prunus (Rosaceae) as determined by sequence analysis of ITS and the chloroplast
trnL-trnF spacer DNA. Systematic Bot 26:797–807
Boudon S, Manceau C, Notteghem JL (2005) Structure and origin of Xanthomonas arboricola pv.
pruni populations causing bacterial spot of stone fruit trees in Western Europe. Phytopathology
95:1081–1088
Bourne MC (1979) Fruit texture – an overview of trends and problems. Journal of texture studies 10:
83-94

General Introduction
24
Bühlmann A, Pothier JF, Tomlinson JA, Frey JE, Boonham N, Smits THM, Duffy B (2012) Genomics
informed design of Loop-Mediated Amplification (LAMP) for phytopathogenic Xanthomonas
arboricola pv. pruni subspecies level detection. In press
Burgos L, Egea J, Guerriero R, Viti R, Monteleone P, Audergon JM (1997) The self-compatibility trait
of the main apricot cultivars and new selections from breeding programmes. J Am Soc Hort Sci
72:147–154
Byrne DH, Littleton TG (1989) Characterization of isozyme variability in apricots. J Am Soc Hort Sci
114:674–678
Campoy JA, Ruiz D, Egea J, Rees DJG, Ceston JM, Martínez-Gómez P (2011) Inheritance of
flowering time in apricot (Prunus armeniaca L.) and analysis of linked Quantitative Trait Loci
(QTLs) using Simple Sequence Repeat (SSR) markers. Plant Mol Biol Rep 29:404-410
Campoy JA, Ruiz D, Allderman L, Cook N, Egea J (2012) The fulfillment of chilling requirements
and the adaptation of apricot (Prunus armeniaca L.) in warm winter climates: An approach in
Murcia (Spain) and the Western Cape (South Africa). Europ J Agronomy 37: 43-55
Cao K, Wang L, Zhu G, Fang W, Chen C, Luo J (2012) Genetic diversity, linkage disequilibrium, and
association mapping analysis of peach (Prunus persica) landraces in China. Tree Genet Genomes
DOI: 10.1007/s11295-012-0477-8
Carper J (1988) The Food Pharmacy. Bantam Books
Cervellati C, Paetz C, Dondini L, Tartarini S, Bassi D, Schneider B, Masia A (2012) A qNMR
approach for bitterness phenotyping and QTL identification in an F1 apricot progeny. J Biotech
159: 312-319
Chaparro JX, Werner DJ, O'Malley D, Sederoff RR (1994) Targeted mapping and linkage analysis of
morphological, isozyme, and RAPD markers in peach. Theor Appl Genet 87: 805-815
Chen Y, Gong Z, Ye M (1997) Sugar-free instant powder for asthma and cough due to lung-heat in
children. Patent Num CN1097320-A
Christen D, Ladner J, Monney P, Zürcher M, Rossier J (2006) Choix de variétés et de porte-greffe
dans la production d’abricots, de pêches et de nectarines. Commission professionnelle pour
l’examen des variétés de fruits, pp 7-28
Christen D, Yaicle A, Devènes G, Kellerhals M (2008) Programme de sélection d’abricots : nouvelles
variétés ACW prometteuses. Vitic Arboric Hortic 40: 277-281.
Christen D, Chajia H, Senay C (2009) Amandes d’abricots: un co-produit de la distillation à valoriser.
Vitic Arboric Hortic 41: 241-246
Christen D, Devènes G, Kellerhals M (2010) Recent Apricot Breeding Programme in Switzerland.
Acta Hort 862:123-128

General Introduction
25
Civerolo EL (1976) Phage sensitivity and virulence relationships in Xanthomonas pruni. Physiol Plant
Pathol 9:67-75
Civerolo EL, Sasser M, Helkie C, Burbage D (1982) Selective medium for Xanthomonas campestris
pv. pruni. Phytopathology 66:39–43
Conte L, Nicotra A, Corazza L (2004) New apricot selections resistant to Monilinia laxa (Aderh. et
Ruhl.). Acta Hort 663: 245–249
Corazza L, Simeone AM (1991) Particular aspects of brown rot and powdery mildew epiphytotics on
apricot. Acta Hort 293: 515-520
Costa V, Angelini C, De Feis I, Ciccodila A (2010) Uncovering the complexity of transcriptomes with
RNA-Seq. J Biomed Biotechnol 2010: 1–19
Coville FV (1920) The influence of cold in stimulating the growth of plants. J Agric Res 20: 151–192
De Candolle A (1886) Origin of cultivated plants. In: D. Appleton and Company (ed) New York,
USA, p 217
Decroocq V, Fave MG, Hagen L, Bordenave L, Decroocq S (2003) Development and transferability of
apricot and grape EST microsatellite markers across taxa. Theor Appl Genet 106: 912–922
Dondini L, Lain O, Geuna F, Banfi R, Gaiotti F, Tartarini S, Bassi D, Testolin R (2007) Development
of a new SSR-based linkage map in apricot and analysis of synteny with existing Prunus maps.
Tree Genet Genomes 3:239–249
Dondini L, Lain O, Vendramin V, Rizzo M, Vivoli D, Adami M, Guidarelli M, Gaiotti F, Palmisano
F, Bazzoni A, Boscia D, Geuna F, Tartarini S, Negri P, Castellano M, Savino V, Bassi D,
Testolin R (2010) Identification of QTL for resistance to plum pox virus strains M and D in Lito
and Harcot apricot cultivars. Mol Breed 27:289-299
Dunegan JC (1932) The bacterial spot of peach and other stone fruits. US Dept Agr Tech Bui 273: 53
Du Plessis HJ (1983) Chemical control of bacterial spot on plums: preliminary evaluation of
bactericides. Deciduous Fruit Grower 33: 413-418
Du Plessis HJ (1987) Canker development on plum shoots following systemic movement of
Xanthomonas campestris pv. pruni from inoculated leaves. Plant Dis 71: 1078-1080
Durgaç C, Kaska N (1997) Comparison of yield, quality and earliness of apricot varieties at Çukurova.
Acta Hort 441:93-99
FAOSTAT (2010) http://faostatclassic.fao.org
Faust M, Surányi D, Nyujtó F (1998) Origin and dissemination of apricot. Hort Rev 22: 225–266
Fujita K, Hasegawa M, Fujita M, Kobayashi I, Ozasa K, Watanabe Y (2002) Anti-Helicobacter pylori
effects of Bainiku-ekisu (concentrate of Japanese apricot juice) (in Japanese). Nippon Shokakibyo
Gakkai Zasshi 99:379-385

General Introduction
26
Garcin A, Rouzet J, Nottéghem JL (2005) Xanthomonas des arbres fruitiers à noyau. Editions CTIFL,
Paris, France
Garcin A, Vibert J, Leclerc A (2011) Xanthomonas sur pêcher : étude des conditions d’infection –
Développement de l’outil (1ière partie). CTIFL 268: 26-33
Garcin A, Bresson J (2011) Sensibilité des arbres à noyau au Xanthomonas – Bilan de huit ans
d’expérimentation. L’arboriculture Fruitière 653: 30-33
Gianfranceschi L, Soglio V (2004) The European Project HiDRAS: Innovative Multidisciplinary
Approaches to Breeding High Quality Disease Resistant Apples. Acta Hort 663: 327-330
Gómez E, Burgos L, Soriano C, Marin J (1998) Amygdalin content in the seeds of several apricot
cultivars. J Sci Food Agric 77: 184-186
Graetz DK (2006) Breeding apricot cultivars for drying in Australia. Acta Hort 717: 197-198
Grimplet J, Romieu C, Audergon JM, Marty I, Albagnac G, Lambert P, Bouchet JP, Terrier N (2005)
Transcriptomic study of apricot fruit (Prunus armeniaca L.) ripening among 13,006 expressed
sequence tags. Physiol Plant 125: 281–292
Guichard E (1995) Chiral y-lactones, key compounds to apricot flavor. Sensory evaluation,
quantification, and chirospecific analysis in different varieties. In: Rouseff RL, Leahy MM (eds)
Fruit flavors. Biogenesis, characterization and authentication. ACS Symp Series 596,
Washington DC, pp 258-267
Guillot S, Peytavi L, Bureau S, Boulanger R, Lepoutre J-P, Crouzet J (2006) Aroma characterization
of various apricot varieties using headspace-solid phase micro-extraction combined with gas
chromatography–mass spectrometry and gas chromatography–olfactometry. Food Chem 96: 147–
55
Hajri A, Pothier JF, Fischer-Le Saux M, Bonneau S, Poussier S, Boureau T, Duffy B, Manceau C
(2012) Type three effector gene distribution and sequence analysis provide new insights into the
pathogenicity of plant-pathogenic Xanthomonas arboricola. Appl Environ Microbiol 78:371-384
Ham H (2009) Apricot Breeding. In: Jain SM, Priyadarshan (eds) Breeding Plantation Tree Crops:
Temperate Species. Srpinger, Berlin, pp 83-103
Hormaza JI, Yamane H, and Rodrigo J (2007) Apricot. In: Kole C (ed) Genome Mapping and
Molecular Breeding in Plants, Fuits and Nuts. Springer, Berlin, pp 171–187
Howad W, Yamamoto T, Dirlewanger E, Testolin R, Cosson P, Cipriani G, Monforte AJ, Georgi L,
Abbott AG, Arús P (2005) Mapping with a few plants: Using selective mapping for microsatellite
saturation of the Prunus reference map. Genetics 171:1305-1309
Hurtado MA, Romero C, Vilanova S, Abbott AG, Llácer G, Badenes ML (2002) Genetic linkage maps
of two apricot cultivars (Prunus armeniaca L.), and mapping of PPV (sharka) resistance. Theor
Appl Genet 105:182-191
General Introduction
27
Illa E, Lambert P, Quilot B, Audergon JM, Dirlewanger E, Howad W, Dondini L, Tartarini S, Lain O,
Testolin R, Bassi D, and Arus P (2009) Linkage map saturation, construction, and comparison in
four populations of Prunus. J Hortic Sci Biotech 84:168-175
Illa E, Sargent D, Lopez Girona E, Bushakra J, Cestaro A, et al. (2011) Comparative analysis of
rosaceous genomes and the reconstruction of a putative ancestral genome for the family. BMC
Evol Biol 11: 9
Jackson DI, Coombe BG (1966) Gibberellin-like substances in the developing apricot fruit. Science
154: 277-278
Janick J, Moore J (1975) Advances in Fruit Breeding. In: Janick J, Moore J (eds) Purdue Univ Press,
West Lafayette, IN, USA, 623 p
Janse JD, et al. (2001) Bacterial leaf blight of strawberry (Fragaria (x) ananassa) caused by a
pathovar of Xanthomonas arboricola, not similar to Xanthomonas fragariae Kennedy & King.
Description of the causal organism as Xanthomonas arboricola pv. fragariae (pv. nov., comb.
nov.). Plant Pathol 50:653– 665
Jiang YQ, Ma RC (2003) Generation and analysis of expressed sequence tags from almond (Prunus
dulcis Mill.) pistils. Sex Plant Rep 16:197–207
Jones AL, Sutton TB (1996) Diseases of tree fruits in the east. Michigan State University Extension,
USA
Joobeur T, Viruel MA, de Vicente MC, Jauregui B, Ballester J, Dettori MT, Verde I, Truco MJ,
Messeguer R, Batlle I, Suanzes M, Quarta R, Dirlewanger E, Arús P (1998) Construction of a
saturated linkage map for Prunus using an almond × peach F2 progeny. Theor Appl Genet
97:1034-1041
Keil HL, Fogle HW (1974) Orchard susceptibility of some apricot, peach, and plum cultivars and
selections to Xanthomonas pruni. Fruit Varieties Journal 28: 16-19
Kodama Y, Shumway M, Leinonen R (2012) The sequence read archive: explosive growth of
sequencing data. Nucleic Acids Research 40: D54-D56
Kostina KF (1936) The Apricot. Bull Appl Bot Genet and Plant Breeding, Suppl. 83. Institute of Plant
Industry, Leningrad (in Russian)
Kostina KF (1946) The origin and evolution of cultivated apricot. Trud Nikit Bot Sad 24: 25–31 (in
Russian)
Kostina KF (1964) Application the phytogeographical method to apricot classification. Proceedings
(Trudi) of the Nikita Botanical Garden. Kolos, Moscow, v 24 (in Russian)
Kostina KF (1969) The use of varietal resources of apricots for breeding. Trud Nikit Bot Sad 40:45–63
(in Russian)

General Introduction
28
Lalli DA, Abbott AG, Zhebentyayeva T, Badenes M, Damsteegt V, Polák J, Krska B, Salava J (2008)
A genetic linkage map for an apricot (Prunus armeniaca L.) BC1 population mapping plum pox
virus resistance. Tree Genet Genomes 4:481-493
Lambert P, Hagen LS, Arús P, Audergon JM (2004) Genetic linkage maps of two apricot cultivars
(Prunus armeniaca L.) compared with the almond ‘Texas’ × peach ‘Earlygold’ reference map for
Prunus. Theor Appl Genet 108:1120-1130
Lambert P, Dicenta F, Rubio M, Audergon JM (2007) QTL analysis of resistance to sharka disease in
the apricot (Prunus armeniaca L.) ‘Polonais’ × ‘Stark Early Orange’ F1 progeny. Tree Genet
Genomes 3:299-309
Laurens F, Durel CE, Patocchi A, Peil A, Salvi S, Tartarini A, Velasco R, van de Weg E (2011)
Review on apple genetics and breeding programmes and presentation of a new European
initiative to increase fruit breeding efficiency. J fruit science 27:102-107
Layne REC (1966) Susceptibility of apricots to bacterial spot infection of foliage and fruit. Plant Dis
Rep 50: 112-115
Layne REC, Bailey CH, Hough LF (1996) Apricots. In: Janick J, Moore JN (eds) Fruit breeding, vol
II: tree and tropical fruits. John Wiley and Sons, New York, pp 79–111
Leclerc H (1925) Les fruits de France: historique, diététique et thérapeutique. Masson et cie, Paris,
France, pp 274
Ledbetter CA (2008) Apricots. In: Hancock JF (ed) Temperate Fruit Crop Breeding. Springer, New
York, pp 39–82
Leite RP, Minsavage GV, Bonas U, Stall RE (1994) Detection and identification of phytopathogenic
Xanthomonas strains by amplification of DNA sequences related to the hrp genes of
Xanthomonas campestris pv. vesicatoria. Appl Env Microbiol 60: 1068-1077
Mahanoglu G, Eti S, Paydas S (1995) Effects of artificial pollination on the fruit set level and fruit
quality in some early ripening apricot cultivars. Acta Hort 384: 397–400
Manganaris GA, Rasori A, Bassi D, Geuna F, Ramina A, Tonutti P, Bonghi C (2011) Comparative
transcript profiling of apricot (Prunus armeniaca L.) fruit development and on-tree ripening. Tree
Genet Genomes 7: 609-616
Marchi G, Cinelli T, Surico G (2011) Bacterial leaf spot caused by the quarantine pathogen
Xanthomonas arboricola pv. pruni on cherry laurel in central Italy. Plant Dis 95: 74
Martínez-Gómez P, Crisosto CH, Bonghi C, Rubio M (2011) New approaches to Prunus
transcriptome analysis. Genetica 139: 755-769
Mehlenbacher SA, Cociu V, Hough LF (1990) Apricots. In: Moore JN, Ballington RJ (eds) Genetic
Resources of Temperate Fruit and Nut Crops, pp 65-107. ISHS, Wageningen

General Introduction
29
Monet R, Guye A, Massonié G (1998) Breeding for resistance to green aphid Myzus persicae Sulzer in
the peach. Acta Hort 465: 171-175
Moreau-Rio MA (2006) Perception and consumption of apricots in France. Acta Hort 701: 31–37
Moreira AS (2002) Produção, caracterização e aplicação de biopolímero sintetizado por cepas de
Xanthomonas campestris pv pruni. PhD thesis, Programa de Doutorado em Biotecnologia,
Universidade Federal de Pelotas, Brazil
Morikian (1982) Apricots of Armenia: Origin and classification of varieties. Acta Hort 121:271-274
Myles S, Peiffer J, Brown PJ, Ersoz ES, Zhang Z, Costich DE, Buckler ES (2009) Association
mapping: critical considerations shift from genotyping to experimental design. The Plant Cell 21:
2194-2202
Negri P, Bassi D, Magnanini E, Rizzo M, Bartolozzi F (2008) Bitterness inheritance in apricot (P.
armeniaca L.) seeds. Tree Genet Genomes 4: 767-776
Newman J (2012) Tech and Biotech: Roche NimbleGen to cut staff, product line. Wisconsin State
Journal, http://host.madison.com
Nicotra A, Conte L, Moser L, Fantechi P, Barbagiovanni I, Corazza ML, Vitale S, Magnotta A (2006)
Breeding programme for Monilinia laxa (Aderh. et Ruhl.) resistance on apricot. Acta Hort 701:
307–311
OABS (2005) Key Deciduous Fruit Statistics (2004) Deciduous Fruit Producers Trust Pamphlet, South
Africa
Ogawa JM, Southwick SM (1995) Apricot. In: Ogawa JM, Zehr EI, Bird GW, Ritchie DF, Uriu K,
Uyemoto JK (Eds), Compendium of Stone Fruit Diseases. St. Paul, MN, APS Press
Ogundiwin EA, Marti C, Forment J, Pons C, Granell A, Gradziel TM, Peace C, Crisosto C (2008)
Development of ChillPeach genomic tools and identification of cold-responsive genes in peach
fruits. Plant Mol Biol 68:379–397
Olmstead JW, Sebolt AM, Cabrera A, Sooriyapathirana SS, Hammar S, Iriarte G, Wang D, Chen CY,
van der Knaap E, Iezzoni AF (2008) Construction of an intra-specific sweet cherry (Prunus avium
L.) genetic linkage map and synteny analysis with the Prunus reference map. Tree Genet
Genomes 4:897-910
Olukolu B, Trainin T, Fan S, Kole C, Bielenberg D, Reighard G, Abbott A, Holland D (2009) Genetic
linkage mapping for molecular dissection of chilling requirement and budbreak in apricot (Prunus
armeniaca L.). Genome 52:819–828
Özboy-Özbaş Ö, Seker IT, Gökbulut I (2010) Effects of resistant starch, apricot kernel flour, and fiber-
rich fruit powders on low-fat cookie quality. Food Sci Biotechnol 19:979-986

General Introduction
30
Pagani MC (2004) An ABC transporter protein and molecular diagnosis of Xanthomonas arboricola
pv. pruni causing bacterial spot of stone fruits. PhD Thesis, Department of Plant Pathology, North
Carolina State University, Raleigh, NC
Palacio-Bielsa A, Cubero J, Cambra MA, Collados R, Berruete IM, López MM (2011) Development
of an efficient real-time quantitative PCR protocol for detection of Xanthomonas arboricola pv.
pruni in Prunus species. Appl Environ Microbiol 77: 89–97
Palleroni NJ, Hildebrand DC, Schroth MN, Hendson M. (1993) Deoxyribonucleic acid relatedness of
21 strains of Xanthomonas species and pathovars. J Appl Bacteriol 75:441– 446
Pannatier E (2006) Campagne abricots 2006. IFELV, Conthey
Park SY, Lee YS, Koh YJ, Hur J-S, Jung JS (2010) Detection of Xanthomonas arboricola pv. pruni by
PCR using primers based on DNA sequences related to the hrp genes. J Microbiol 48: 554–558
Pasquer F, Frey B, Frey E (2008) Identification of cherry incompatibility alleles by microarray. Plant
Breed 127:413–417
Petri L (1934) Rassegna dei casi fitopatologici osservati nel 1933. Bollettino della Stazione di
Patologia Vegetale di Roma, NS 14: 1-78
Pina A, Staton M, Zhebentyayeva T, Mockaitis K, Errea P, Abbott A (2010) Studying the molecular
mechanisms of graft incompatibility in Prunus using 454 sequencing. 5th International Rosaceae
genomics conference. November 2010. Stellenbosch (South Africa), O39
Pothier JF, Pelludat C, Bünter M, Genini M, Vogelsanger J, Holliger E, Duffy B (2010) First report of
the quarantine pathogen Xanthomonas arboricola pv. pruni on apricot and plum in Switzerland.
Plant Pathol New Dis Rep 20: 15
Pothier JF, Pagani MC, Pelludat C, Ritchie DF, Duffy B (2011a) A duplex-PCR method for species-
and pathovar- level identification and detection of the quarantine plant pathogen Xanthomonas
arboricola pv. pruni. J Microbiol Met 86: 16-24
Pothier JF, Vorhölter FJ, Blom Jochen, Goesmann A, Pühler A, Smits THM, Duffy B (2011b) The
ubiquitous plasmid pXap41 in the invasive phytopathogen Xanthomonas arboricola pv. pruni:
complete sequence and comparative genomic analysis. FEMS Microbiol Lett 323: 52-60
Pothier JF, Pflüger V, Ziegler D, Tonolla M, Vogel G, Duffy B (2011c) MALDI-TOF mass
spectrometry: Applications for rapid bacterial identification and phylogenetic analysis.
Phytopathology 101: S145
Pothier JF, Smits THM, Blom J, Vothölter FJ, Goesmann A, Pühler A, Duffy B (2011d) Complete
genome sequence of the stone fruit pathogen Xanthomonas arboricola pv. pruni. Phytopathology
101: S144-S145

General Introduction
31
Rajapakse, S, Belthoff LE, He G, Estager AE, Scorza R, Verde I, Ballard RE, Baird WV, Callahan A,
Monet R, Abbott AG (1995) Genetic linkage mapping in peach using morphological, RFLP and
RAPD markers. Theor Appl Genet 90:503–510
Randhawa RS, Civerolo EL (1985) A detached-leaf bioassay for Xanthomonas campestris pv. pruni.
Phytopathology 75: 1060–1063
Rieger M (2006) Introduction to fruit crops. Haworth Press, New York
Ritchie DF (1995) Bacterial spot. In: Ogawa JM, Zehr EI, Bird GW, Ritchie DF, Uriu K, Uyemoto JK
(eds) Compendium of Stone Fruit Diseases. APS Press, St. Paul, MN
Rodrigo J, Herrero M (2002) The onset of fruiting in apricot (Prunus armeniaca L.). J Appl Bot
76:13–19
Rosalam S, England R (2006) Review of xanthan gum production from unmodified starches by
Xanthomonas comprestris sp. Enzyme Microb Technol 39:197–207
Rubio-Cabetas MJ, Amador ML, Pons C, Marti C, Granell A (2010) A microarray analysis revealed
and oxidative response genes underlying the differential response to hypoxia of two Prunus
genotypes. 5th International Rosaceae genomics conference. November 2010. Stellenbosch
(South Africa), O42
Ruiz D, Egea J, Gil MI, Tomas-Barberan FA (2005a) Characterization and quantitation of phenolic
compounds in new apricot (Prunus armeniaca L.) varieties. J Agric Food Chem 53: 9544-9552
Ruiz D, Egea J, Tomas-Barberan FA, Gil MI (2005b) Carotenoids from new apricot (Prunus
armeniaca L.) varieties and their relationship with flesh and skin color. J Agric Food Chem 53:
6368-74
Ruiz D, Lambert P, Audergon JM, Dondini L, Tartarini S, Adami M, Gennari F, Cervellati C, De
Franceschi P, Sansavini S, Bureau S, Gouble B, Reich M, Renard CMGC, Bassi D, Testolin R
(2010) Identification of QTLs for fruit quality traits in apricot. Acta Hort 862:587–592
Santos AM, Oliver MJ, Sanchez AM, Payton PR, Gomes JP, Miguel C, Oliveira MM (2009) An
integrated strategy to identify key genes in almond adventitious shoot regeneration. J Exp Bot
60:4159–4173
Schena M, Shalon D, Davis RW, Brown PO (1995) Quantitative monitoring of gene expression
patterns with a complementary DNA microarray. Science 270: 467–470
Schiner H (1812) Description du département du Simplon, ou de la ci-devant République du Valais.
In : Advocat A (ed) Sion, Switzerland, p 590
Scortichini M, Rossi MP (2003) Genetic diversity of Xanthomonas arboricola pv. fragariae strains
and comparison with some other X. arboricola pathovars using repetitive PCR genomic
fingerprinting. J Phytopathol 151: 113–119

General Introduction
32
Seisun D (2006) The market of hydrocolloids and other uses of seaweeds. Proceedings of the 3rd
International Conference on Aquaculture, Puerto Varas, Chile
Shepard DP, Zehr EI (1994) Epiphytic persistence of Xanthomonas campestris pv. pruni on Peach and
Plum. Plant Dis 78: 627-629
Sicard O, Marandel G, Soriano JM, Lalli DA, Lambert P, Salava J, Badenes ML, Abbott AG,
Decroocq V (2008) Flanking the major Plum pox virus resistance locus in apricot with co-
dominant markers (SSRs) derived from candidate resistance genes. Tree Genet Genomes 4:359-
365
Smith EF (1903) Observation on a hitherto unreported bacterial disease, the cause of which enters the
plant through ordinary stomata. Science 17: 456-457
Soriano JM, Vera-Ruiz EM, Vilanova S, Martínez-Calvo J, Llácer G, Badenes ML, Romero C (2008)
Identification and mapping of a locus conferring Plum pox virus resistance in two apricot-
improved linkage maps. Tree Genet Genomes 4:391-402
Stefani E (2010) Economic significance and control of bacterial spot/canker of stone fruits caused by
Xanthomonas arboricola pv. pruni. J Plant Pathol 92: 99-103
Suchard JR, Wallace KL, Gerkin RD (1998) Acute cyanide toxicity caused by apricot kernel
ingestion. Annals of emergency medicine 32:742-744
Timmer LW, Marois JJ, Achor D (1987) Growth and survival of xanthomonads under conditions
nonconducive to disease development. Phytopathology 77:1341–1345
Tjou-Tam-Sin NNA, van de Bilt JLJ, Bergsma-Vlami M (2011) First report of Xanthomonas
arboricola pv. pruni in ornamental Prunus laurocerasus in the Netherlands. Plant Dis 96: 759
Trainotti L, Bonghi C, Ziliotto F, Zanin D, Rasori A, Casadoro G, Ramina A, Tonutti P (2006) The
use of microarray µPEACH1.0 to investigate transcriptome changes during transition from
preclimacteric to climacteric phase in peach fruit. Plant Sci 170: 606-613
USDA National Nutrient Database for Standard Reference (2012)
http://ndb.nal.usda.gov/ndb/foods/show/2241
Vachun Z (1995) Roostock for apricot – the current situation and main problems. ActaHort 384: 459-
462
Valentini N, Mellano MG, Antonioni I, Botta R (2006) Chemical, physical and sensory analysis for
evaluating quality of apricot cultivars. Acta Hort 701:559-563
van de Weg WE, Voorrips RE, Finkers R, Kodde LP, Jansen J, Bink MCAM (2004) Pedigree
Genotyping: A New Pedigree-based Approach of QTL Identification and Allele Mining. Acta
Hort 663:45-50
Vauterin L, Hoste B, Kersters K, Swings J (1995) Reclassification of Xanthomonas. Int J Syst
Bacteriol 45: 472-489

General Introduction
33
Vavilov NI (1992) The origin and geography of cultivated plants (tr. L. Storr-Best). Cambridge
University Press, Cambridge, UK
Vera Ruiz EM, Soriano JM, Romero C, Zhebentyayeva T, Terol J, Zuriaga E, Llácer G, Abbott AG,
Badenes ML (2011) Narrowing down the apricot Plum pox virus resistance locus and
comparative analysis with the peach genome syntenic region. Mol Plant Pathol 12:535-547
Verde I, Bassil N, Scalabrin S, Gilmore B, Lawley CT, Gasic K, Micheletti D, Rosyara UR, Cattonaro
F, Vendramin E, Main D, Aramini V, Blas AL, Mockler TC, Bryant DW, Wilhelm L, Troggio M,
Sosinski B, Aranzana MJ, Arús P, Iezzoni A, Morgante M, Peace C (2012) Development and
evaluation of a 9K SNP array for Peach by Internationally Coordinated SNT detection and
validation in breeding germplasm. PlosOne 7: e35668
Vidaver AK (1976) Prospects for control of phytopathogenic bacteria by bacteriophages and
bacteriocins. Annu Rev Phytopathol 14: 451-465
Vilanova S, Romero C, Abbott AG, Llacer G, Badenes ML (2003) An apricot (Prunus armeniaca L.)
F2 progeny linkage map based on SSR and AFLP markers, mapping plum pox virus resistance
and self-incompatibility traits. Theor Appl Genet 107: 239–247
Vilanova S, Sargent D, Arus P, Amparo M (2008) Synteny conservation between two distantly-related
Rosaceae genomes: Prunus (the stone fruits) and Fragaria (the strawberry). BMC Plant
Biology 8:67
Wang Z, Gerstein M, Snyder M (2009) RNA-Seq: a revolutionary tool for transcriptomics. Nature
reviews 10: 57-63
Weinberger JH (1950) Chilling requirements of peach varieties. Proc Am Soc Hort Sci 56: 122-128
Werner DJ, Ritchie DF, Cain DW, Zehr EI (1986) Susceptibility of peaches and nectarines, plant
introductions, and other Prunus to bacterial spot. HortScience 21: 127-130
Witherspoon JM (1999) Apricot breeding in Australia. Acta Hort 488: 253-255
Yamamoto T, Mochida K, Imai T, Shi IZ, Ogiwara I, Hayashi T (2002) Microsatellite markers in
peach [Prunus persica (L.) Batsch] derived from an enriched genomic and cDNA libraries. Mol
Ecol Notes 2:298–302
Young JM (1977) Xanthomonas pruni in almond in New Zealand. N Z J of Agricultural Research 20:
105-107
Young JM, Park DC, Shearman HM, Fargier E (2008) A multilocus sequence analysis of the genus
Xanthomonas. Syst Appl Microbiol 31: 366–377
Zaccardelli M, Consiglio MF, Mazzucchi U (1995) Detection of Xanthomonas campestris pv. pruni in
symptomless peach trees in winter. Phytopathologia Mediterranea 34: 199-203
Zaccardelli M, Malaguti S, Bazzi C (1998) Biological and epidemiological aspects of Xanthomonas
arboricola pv. pruni on peach in Italy. J Plant Pathol 80:125-132

General Introduction
34
Zehr EI, Shepard DP (1996) Bacterial spot of peach as influenced by water congestion, leaf wetness
duration, and temperature. Plant Disease 80: 339-341
Zhebentyayeva TN, Swire-Clark G, Georgi LL, Garay L, Jung S, Forrest A, Blackmon B, Horn R,
Howad W, Arùs P, Main D, Sosinski B, Baird WV, Reighard GL, Abbott AG (2008) A
framework physical map for peach, a model Rosaceae species. Tree Genet Genomes 4:745-756
Zhebentyayeva T, Ledbetter C, Burgos L, Llácer G (2012) Apricot. In: Badenes ML, Byrne DH (eds)
Fruit Breeding, Handbook of Plant Breeding Vol 8, pp 415-457


Chapter 2
Evaluation of Xanthomonas arboricola pv. pruni inoculation techniques to screen for bacterial spot
resistance in peach and apricot Published in: Journal of Plant Pathology (2012) 94: S1.91-S1.96

Chapter 2
37
To improve consistency in this thesis, the following modifications have been applied to chapter 2 in
comparison to the published paper: subheadings have been added, and abbreviations have been
removed
Chapter 2
38
2.1. Abstract
Bacterial spot of apricot (Prunus armeniaca) and other stone fruit species such as peach (P. persica)
and plum (P. domestica) is caused by the quarantine bacterium Xanthomonas arboricola pv. pruni.
Screening for resistance to bacterial spot requires an inoculation method which is rapid, efficient and
which permits to differentiate levels of resistance to this disease. Four inoculation techniques were
compared under greenhouse conditions: (i) infiltration in the leaves using a needleless syringe; (ii)
injuries caused by a needle; (iii) injuries caused by scissors; and (iv), dipping shoots of the plant into
the inoculum. All inoculation techniques induced symptoms: infiltration was very efficient and
quickly caused severe necrosis and leaf drop; the use of a needle was also very efficient but the
symptoms were very weak, while the scissors technique was not as efficient as the first two
approaches and the symptoms were also very weak. Finally dipping peach shoots into the inoculum
was the least efficient in symptom induction, but this technique permitted to obtain more quantitative
data suitable for evaluating the level of resistance of a cultivar than all the other techniques (e.g.
number of spots per leaf, or damaged surface, calculated disease incidence and resistance index). For
this reason, the inoculation technique by immersion was applied to six apricot cultivars to be screened
for resistance against bacterial spot. Plants were assessed 15, 28, 38 and 64 days post inoculation for
spot number, leaf surface damaged, disease incidence and severity of symptoms. Cultivar Orangered
was the most resistant, showing low levels of damage to the leaves (10% +/- 3.54) and only a few
symptomatic leaves per plant (17.39 +/-0.56). Cultivar Goldbar was the most susceptible with 76.74
+/- 19.39% of symptomatic leaves and high levels of damage per leaf (85 +/- 11.34%). The four other
cultivars Bergarouge, Bergeron, Goldrich and Kioto showed intermediate levels of susceptibility to the
bacterium. Results of resistance testing were comparable to those observed under field conditions as
reported in the literature. This indicates that shoot immersion into the inoculum is an efficient and
reliable technique to screen for resistance against bacterial spot of stone fruits under greenhouse
conditions.
Keywords
Bacterial spot, Prunus, inoculation techniques, screening for resistance

Chapter 2
39
2.2. Introduction
Xanthomonas arboricola pv. pruni, the causal agent of bacterial spot of stone fruits, is a quarantine
pathogen for the European Union (EU) and the European Plant Protection Organisation (EPPO). It
mainly causes necrotic lesions on leaves and fruits of peach, plum, apricot and nectarine, but in more
severe cases, cankers, defoliations and death of the trees can be observed (du Plessis 1988). This
bacterium has been reported from all continents, and is still expanding its range (Anonymous 2006). In
Europe, bacterial spot has been identified first in northern Italy in 1934 (Petri 1934) where it is now
considered as endemic (Battilani 1999). The disease continues to spread in Europe and outbreaks have
occurred more recently in France, Bulgaria, Romania and Ukraine (Anonymous 2006). In Switzerland,
the disease was detected in 2005 on apricot trees (Pothier et al. 2010), and it is now considered as
locally established.
Due to the lack of efficient chemical or biological control methods, host resistance might be
the most promising solution to combat the disease. Different levels of tolerance against X. arboricola
pv. pruni have been detected in peach, nectarine, apricot and plum based on field observations
(Simeone 1985; Topp et al. 1989; Layne and Hunter 2003; Garcin et al. 2005; Garcin and Bresson
2011). The availability of an artificial inoculation technique allowing evaluations in a standardized
quantitative manner of the degree of susceptibility or resistance of different cultivars under greenhouse
conditions may foster the selection or identification of resistant cultivars. Few techniques for leaf
inoculation have been described, mostly on peach (Prunus persica) and to a less extent on plum (P.
domestica) and apricot (P. armeniaca). For practical aspects, detached leaf assays have often been
used for pathogenicity assays. For example, Boudon et al. (2005) immersed detached peach leaves in a
bacterial suspension and applied a moderate vacuum pressure whereas Randhawa and Civerolo (1985)
as well as Hammerschlag (1988) used a syringe without a needle to infiltrate the bacterial suspension
into peach leaves. These techniques permitted to observe necrotic lesions two weeks after inoculation
(Boudon et al. 2005) and to obtain differences between clones and cultivars three weeks after
inoculation (Hammerschlag 1988). On-tree experiments have been reported for peach and plum, i.e.
Miles and co-workers (1977) used a wind-rain machine to expose trees in the field to a concentration
of 2 × 10⁶ CFU per ml and Civerolo (1974) sprayed a selected circular area of peach leaves and
obtained lesions 2 days post inoculation with a concentration of 108 CFU per ml. A system using
pressure with a vacuum pump was used by Scortichini et al. (1996) on peach, apricot, Japanese plum
and sweet cherry. Depending on the plant species and cultivars tested, the time for obtaining
symptoms with this technique ranged from 20 to 25 days. Other systems using an artist’s airbrush
(Zehr and Shepard 1996) or a spray gun connected to a compressed air supply (du Plessis 1988)
permitted to obtain symptoms four weeks after inoculation on peach, plum, and apricot (du Plessis
1988) or three days post inoculation in peach at 30°C (Zehr and Shepard 1996). Du Plessis (1987)

Chapter 2
40
used a needle to puncture a droplet directly into the vascular system via the petiole, main vein or
secondary vein of plum shoots to study canker development. Finally, the immersion of an actively
growing shoot of plum trees in the inoculum has been successfully used in the open field to detect
differences in susceptibility between cultivars, and therefore to determine a selection index (Topp and
Sherman 1995).
The objectives of this study were to evaluate different inoculation techniques under
greenhouse condition, to identify the one that would allow a quantitative evaluation of the resistance
level of a genotype to X. arboricola pv. pruni, and to test the technique on a set of apricot cultivars for
which field resistance data were available.
2.3. Material and Methods
2.3.1. Plant material
Two-year-old saplings of the rootstock GF305 (hereafter referred as “peach plants”) were grown in
five liter pots containing a mixture of peat and loam and were pruned before short term storage at 4°C
in a cold chamber. Six different apricot cultivars were chosen for their range of resistance or
susceptibility, mainly based on field observations made by Garcin and Bresson (2005), with two to
eight replicates per cultivar. These plants were grafted on the plum rootstock Saint-Julien 655-2,
potted in two liter pots and kept in a cold chamber at 2°C for long term storage. Peach plants were
obtained from the Pépinières de Saxon (Switzerland), and apricot scions were from the Agroscope
Changins-Wädenswil nursery at Conthey (Switzerland). All peach plants were grown under
greenhouse conditions at 23°C, 60% relative humidity under natural conditions of light for one month,
and apricots for two weeks before being transferred to a quarantine greenhouse. No fertilization was
applied.
2.3.2. Inoculation
Four strains of X. arboricola pv. pruni were used, two of which were collected in Valais (Switzerland)
in 2005 (XA1.29) and in 2007 (XA1.51), respectively. The other two strains were the pathotype strain
NCPPB 416 isolated from P. salicina in New Zealand in 1953 and the sequenced strain CFBP 5530
(Pothier et al. 2011) isolated from P. persica in Italy in 1989. For long-term storage, the strains were
kept in 40% glycerol at -80°C. A loopful of a pure culture of each bacterial strain was separately
grown on peptone yeast extract glycerol agar (NYGA) (Turner et al. 1984) at 28°C for 36 h. Cultures
were then suspended in 1% sterile KCl and adjusted using a Genesys 10 UV spectrophotometer
(Spectronic Unicam, USA) to an optical density of 0.5 at 600 nm corresponding to 1 × 10⁸ CFU per
ml, as estimated by counting on YPGA plates. After adjusting the concentration of the different strains
separately, equal volumes of the bacterial suspensions were mixed just before inoculation.

Chapter 2
41
Four different inoculation techniques were tested on two peach plants per technique,
presenting five to ten actively growing shoots. The same techniques were repeated with sterile KCl
(resuspension buffer of X. arboricola pv. pruni strain mix) on different plants to serve as negative
control for comparison. The first technique consisted in dipping scissors into the inoculum before
cutting four to ten leaves per branch in the middle of the lamina. With the second technique, eight
wounds per leaf were made on four to eight leaves per branch with a needle, and a droplet of inoculum
of approximately 5 µl was placed on each wound. With the third technique the inoculum was
infiltrated with a 1 ml syringe without needle in eight sites of the abaxial side of four to eight leaves
per branch. Infiltration was stopped when a clear water-soaked spot appeared around the inoculation
point. Finally, the fourth inoculation technique consisted in the immersion of four to five actively
growing shoots with three to six leaves in the bacterial suspension and a gentle agitation for about five
seconds until the leaf surfaces were fully wetted on both sides. Following inoculations, conditions
were set at 85% relative humidity with temperatures of 23°C during daytime and 18°C during the
night. Neither extra light nor fertilization was applied.
2.3.3. Phenotyping and statistical tests
The following data were recorded from inoculated peach plants, according to the inoculation technique
used: (i) total number of leaves with symptoms for the scissors technique; (ii) number of necrotic spots
per leaf developing from the six to eight inoculation points for the needle and syringe techniques; and
(iii), number of symptomatic leaves per shoot for the dipping technique. All data were then expressed
as percentage. Assessments were made 1, 2 and 3 weeks post inoculation. For screening apricot
cultivars, four assessments were made 15, 28, 38 and 64 days post inoculation, taking into account
four different traits: (i) number of spots per leaf on four leaves per plant presenting most symptoms
(reference leaves); (ii) percentage of surface damaged by the disease on those four leaves; (iii) disease
incidence determined by counting the number of leaves per plant showing symptoms and by dividing
by the total number of leaves per branch; and (iv) resistance index calculated with the following
formula:
RI = [��� × 1� + �� × 2� + ��� × 3� + ��� × 4�]N
where n1 is the number of leaves presenting 0 to 25% damage, n2 26 to 50%, n3 51 to 75%, n4 76 to
100% and N is the total number of leaves per plant. Student’s t-tests were calculated for each
assessment using software JMP (SAS Institute, USA).
The area under disease progress curve (AUDPC) was calculated for disease incidence and
resistance index with Microsoft Excel (Microsoft Corporation, USA) using the following formula:
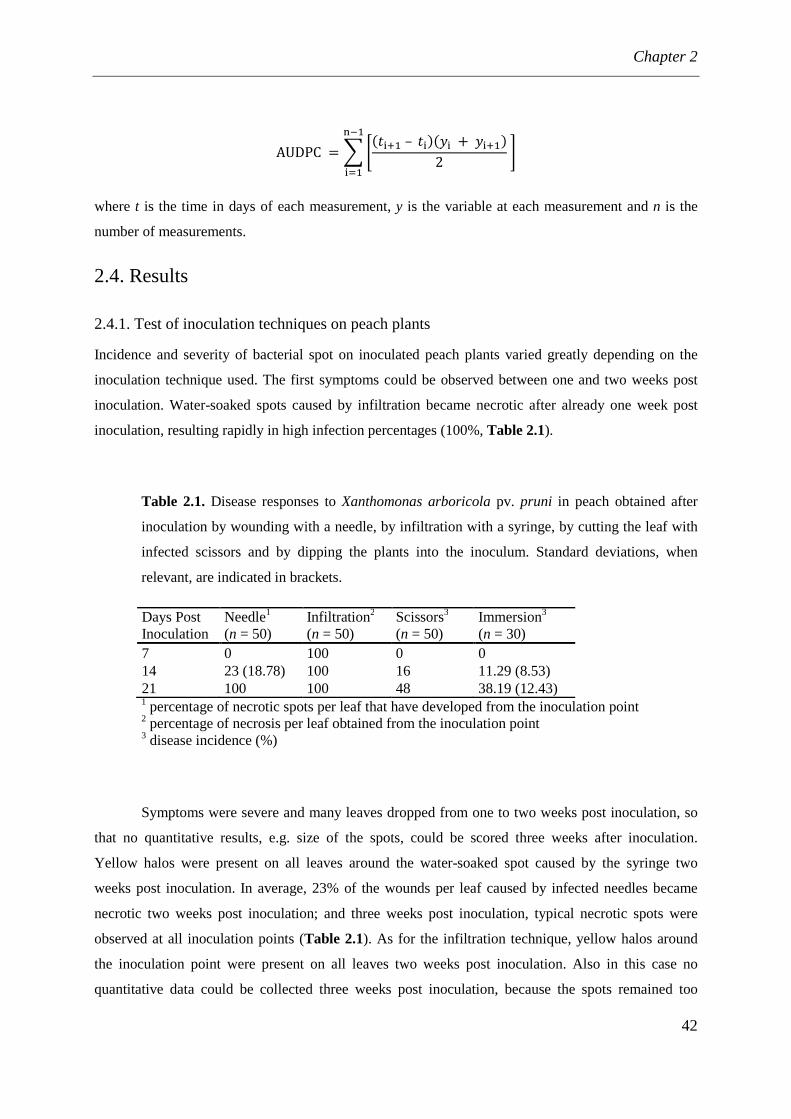
Chapter 2
42
AUDPC = � ������–���� � + ����2 !
"#�
�$�
where t is the time in days of each measurement, y is the variable at each measurement and n is the
number of measurements.
2.4. Results
2.4.1. Test of inoculation techniques on peach plants
Incidence and severity of bacterial spot on inoculated peach plants varied greatly depending on the
inoculation technique used. The first symptoms could be observed between one and two weeks post
inoculation. Water-soaked spots caused by infiltration became necrotic after already one week post
inoculation, resulting rapidly in high infection percentages (100%, Table 2.1).
Table 2.1. Disease responses to Xanthomonas arboricola pv. pruni in peach obtained after
inoculation by wounding with a needle, by infiltration with a syringe, by cutting the leaf with
infected scissors and by dipping the plants into the inoculum. Standard deviations, when
relevant, are indicated in brackets.
Days Post Inoculation
Needle1 (n = 50)
Infiltration2 (n = 50)
Scissors3 (n = 50)
Immersion3 (n = 30)
7 0 100 0 0 14 23 (18.78) 100 16 11.29 (8.53) 21 100 100 48 38.19 (12.43) 1 percentage of necrotic spots per leaf that have developed from the inoculation point 2 percentage of necrosis per leaf obtained from the inoculation point 3 disease incidence (%)
Symptoms were severe and many leaves dropped from one to two weeks post inoculation, so
that no quantitative results, e.g. size of the spots, could be scored three weeks after inoculation.
Yellow halos were present on all leaves around the water-soaked spot caused by the syringe two
weeks post inoculation. In average, 23% of the wounds per leaf caused by infected needles became
necrotic two weeks post inoculation; and three weeks post inoculation, typical necrotic spots were
observed at all inoculation points (Table 2.1). As for the infiltration technique, yellow halos around
the inoculation point were present on all leaves two weeks post inoculation. Also in this case no
quantitative data could be collected three weeks post inoculation, because the spots remained too

Chapter 2
43
small. The technique using scissors did not permit to distinguish more than four spots per leaf
developing closed to the wound area on the 50 leaves, even at three weeks post inoculation, because
the spots were so small that the damaged surface could not be quantified. Nevertheless, at three weeks
post inoculation disease incidence reached 48%. Finally, dipping the shoots into the inoculum
permitted to obtain much more quantitative information pertaining to: (i) number of symptomatic
leaves per branch; (ii) number of spots per leaf; and (iii), percentage of damaged leaf area caused by
the disease on the leaves. Dipped shoots presented in average about 11% and 38% of symptomatic
leaves two and three weeks post inoculation, respectively (Table 2.1). This method was consequently
chosen for a further test to assess the susceptibility to X. arboricola pv. pruni of different apricot
cultivars. Negative controls of all inoculation techniques did not develop X. arboricola pv. pruni
symptoms.
2.4.2. Screening apricot cultivars for resistance against X. arboricola pv. pruni
All apricot cultivars exhibited symptoms during the experiments, and a great variation of resistance
levels to bacterial spot was observed (Table 2.2). The first symptoms appeared one week post
inoculation on cultivar Goldbar, whereas all other varieties remained symptomless (data not shown).
“Goldbar” reached rapidly (28 days post inoculation) 70% of symptomatic leaves and up to 76% of
infected leaves at the end of the time-course experiment (64 days post inoculation). The disease
developed less rapidly in all other cultivars, and at the end of the experiment, cultivars Bergarouge,
Goldrich and Kioto had about 65% of their leaves showing symptoms, and cultivar Bergeron 50%.
Only cultivar Orangered had less than 20% symptomatic leaves during the whole experiment (Fig.
2.1A).
Regarding the four leaves per plant presenting the strongest reaction (reference leaves), only
cultivar Orangered had significantly less leaf surface damaged and cultivar Goldbar had significantly
more than the other varieties, but when the average spot number was taken into account, cultivar
Orangered was the only variety with significantly less spots than the other five (Table 2.2). Although
cultivars Kioto, Bergarouge and Bergeron had a relatively high disease incidence 64 days post
inoculation, the resistance index (Table 2.2 and Fig. 2.1B) shows that their leaves remained
moderately damaged, in opposite to cultivars Goldrich and Goldbar, for which a high disease
incidence was accompanied by heavier damages on the leaves. “Orangered” was the most resistant
cultivar in our experiment, taking both disease incidence and resistance index into consideration.

Table 2.2. Mean and standard deviation (std. dev.) of each trait measured from the apricot varieties 64 days post inoculation. Means sharing the same
letter were not significantly different using a t-test (p < 0.05).
Cultivar No. of replicates
Spot number1 Surface damaged (%)1 Disease incidence (%) Resistance index mean std. dev. mean std. dev. mean std. dev. mean std. dev.
Bergarouge 5 17.70b 10.15 31.50b 14.53 65.27b 15.43 0.86b 0.28 Bergeron 3 8.00ab 4.77 45.83b 25.04 49.56b 26.17 1.16b 0.67 Goldbar 8 31.63bc 18.38 85.00c 11.34 76.74bc 19.39 3.04c 1.31 Goldrich 2 12.00b 6.36 20.00ab 13.60 66.67b 20.40 2.50bc 1.06 Kioto 6 12.92b 9.03 37.08b 20.76 65.65b 21.84 1.13b 0.47 Orangered 2 3.50a 2.83 10.00a 3.54 17.39a 0.56 0.17a 0.01 1Calculated with data from the four most damaged leaves per plant
Fig. 2.1. Disease incidence (A) and resistance index (B) for six apricot cultivars 15, 28, 38 and 64 days post inoculation

Chapter 2
45
Regarding the AUDPC of the disease incidence, no significant difference could be observed between
cultivars Bergeron, Kioto, Goldrich and Bergarouge. Only cultivar Orangered was significantly more
resistant with an AUDPC of 2309 (+/-737, standard deviation) than the other cultivars, which ranged
from AUDPCs of 4583 (+/-2,186) for cultivar Bergeron to 7524 (+/-1,655) for cultivar Bergarouge, to
10526 (+/-2,746) for cultivar Goldbar, which was significantly more susceptible (Fig. 2.2). When
considering the AUDPC of the resistance index, however, cultivar Goldrich was significantly more
susceptible (AUDPC of 196 +/-31) than the three cultivars Bergarouge, Kioto and Bergeron, which
ranged from AUDPCs of 92 (+/-47) for cultivar Bergeron to 102 (+/-33) for cultivar Kioto (Fig. 2.2).
Cultivar Orangered was again significantly more resistant (AUDPC of 23, +/-7) and cultivar Goldbar
was significantly more susceptible (AUDPC of 299, +/-140).
Fig. 2.2. AUDPC of the disease incidence (DIaudpc, in grey) and AUDPC of the resistance index (RIaudpc, in white) for the six apricot cultivars. Means (+standard error) sharing a letter were not significantly different using a t-test (P < 0.05).
0
50
100
150
200
250
300
350
400
0
2000
4000
6000
8000
10000
12000
14000
RIa
ud
pc
DIa
ud
pc
b
c b
c
b
c
a
d
c
d
d
b
c c c
a

Chapter 2
46
2.5. Discussion
2.5.1. Establishment of an efficient inoculation technique to screen for resistance against X.
arboricola pv. pruni
It was possible to induce X. arboricola pv. pruni symptoms with all four inoculation techniques tested.
However, this study shows that quantitative expression of symptoms caused by the bacterium may
vary greatly in peach depending on the inoculation technique used. The high inoculum pressure
induced by infiltration resulted rapidly and consistently in a high level of damage, but the symptoms
were so severe that often the inoculated leaves fell. Wounds caused by scissors and needles resulted
into symptom development although the reactions were not sufficiently quantitative. In both the latter
cases, small necrotic spots were visible after three weeks but neither their exact number nor the surface
of the leaf damaged could be estimated. Inoculation by dipping the shoots into inoculum resulted in a
larger array of symptoms and therefore in more variables useful to measure or count. This proved to be
the method that offered the best reproducibility without approaching the values zero or 100%, which
would not differentiate various levels of susceptibility/resistance of the host. This last technique can be
considered as a more natural and less invasive method of inoculation than infiltration via a syringe
(Kvitko et al. 2009). For these reasons, we selected this method to assess the levels of resistance to X.
arboricola pv. pruni of several apricot cultivars and to compare them with field resistance evaluations.
2.5.2. Assessment of reference apricot cultivars for resistance against X. arboricola pv. pruni
Garcin and Bresson (2005, 2011) have assessed resistance to bacterial spot of different apricot
cultivars in naturally contaminated orchards and observed important differences in susceptibility that
were partly dependent on the yearly climates. The six cultivars that we used in this study were also
evaluated by Garcin and Bresson (2011) for disease incidence over five to seven years in the field.
Their study classified cultivars Goldbar and Goldrich as very susceptible, cultivars Bergeron and
Kioto as intermediate, and cultivars Bergarouge and Orangered as the least susceptibles, which is in
accordance with our findings.
Measurements on the four reference leaves for spot number and severity has proved not to be
precise enough for an appropriate comparison between the different varieties. “Goldrich” varied for
disease reaction depending on the publications, i.e. Garcin and Bresson (2011) classified it as
susceptible, whereas Simeone and Scortichini (2005) found it to be the most tolerant among 33
cultivars tested. In our study, cultivar Goldrich had a medium disease incidence, but the resistance
index showed that symptomatic leaves were more damaged than those of cultivars Kioto, Bergarouge
and Bergeron, so that in our experiment cultivar Goldrich was retained as rather susceptible. Finally,
cultivar Bergarouge had a high disease incidence score but most of the leaves were almost undamaged,
showing a potential of tolerance to the disease. In all cases, with scores between 17 and 70% of

Chapter 2
47
symptomatic leaves per cultivar, our artificial inoculations on young plants in a greenhouse led to a
much higher disease incidence than that reported (2 and 38%) from field trials by Garcin and Bresson
(2011). We anticipate that this could probably be due to the fact that working with small plants in
greenhouse permits to score also small lesions, which under field conditions may remain unnoticed or
masked by lesions due to other biotic or abiotic factors.
In this study, a dip inoculation technique was used to identify apricot cultivars showing a high
resistance level to X. arboricola pv. pruni. The results obtained largely overlap with field observations
reported in the literature (Zaccardelli 1998). Although this technique may require, depending on the
country, a quarantine greenhouse and other containment facilities, we came in three months time to
very similar conclusions to those based on field trials under natural conditions over a period of several
years. Our technique is consequently time-efficient and permits to consider the total amount of leaves
per plant as well as the progression of the disease on the same leaves without the risk of confusion
with other damages provoked by other pathogens or abiotic factors.
Acknowledgments
Financial support was provided by the Swiss State Secretariat for Education and Research (SBF
C08.0124 and SBF C07.0139). We thank Rolf Blapp, Jürgen Krauss and Verena Knorst for plant
grafting and greenhouse support.

Chapter 2
48
2.6. References
Anonymous (2006) EPPO standards PM 7/64. Diagnostics Xanthomonas arboricola pv. pruni. Bull.
EPPO 36:129-133
Battilani P, Rossi V, Saccardi A (1999) Development of Xanthomonas arboricola pv. pruni epidemics
on peaches. J Plant Pathol 81:161-171
Boudon S, Manceau C, Nottéghem JL (2005) Structure and origin of Xanthomonas arboricola pv.
pruni populations causing bacterial spot of stone fruit trees in western Europe. Phytopathology
95: 1081-1088
Civerolo EL (1974) Quantitative aspects of pathogenesis of Xanthomonas pruni in peach leaves.
Phytopathology 65:258-264
du Plessis HJ (1987) Canker development on plum shoots following systemic movement of
Xanthomonas campestris pv. pruni from inoculated leaves. Plant Disease 71:1078-1080
du Plessis HJ (1988) Differential virulence of Xanthomonas campestris pv. pruni to peach, plum, and
apricot cultivars. Phytopathology 78:1312-1315
Garcin A, Rouzet J, Nottéghem JL (2005) Xanthomonas des arbres fruitiers à noyau. Editions CTIFL,
Paris, France
Garcin A, Bresson J (2011) Sensibilité des arbres à noyau au Xanthomonas – Bilan de huit ans
d’expérimentation. L’arboriculture Fruitière 653: 30-33
Hammerschlag FA (1988) Selection of peach cells for insensitivity to culture filtrates of Xanthomonas
campestris pv. pruni and regeneration of resistant plants. Theor Appl Genet 76:865-869
Kvitko BH, Park DH, Velásquez AC, Wei CF, Russell AB, Martin GB, Schneider DJ, Collmer A
(2009) Deletions in the repertoire of Pseudomonas syringae pv. tomato DC3000 type III secretion
effector genes reveal functional overlap among effectors. PLoS Pathogens 5:e1000388
Layne REC, Hunter DM (2003) ‘AC Harostar’ Apricot. HortScience 38:140-141.
Miles WG, Daines RH, Rue JW (1977) Presymptomatic egress of Xanthomonas pruni from infected
peach leaves. Ecology and Epidemiology 67:895-897
Petri L (1934) Rassegna dei casi fitopatologici osservati nel 1933. Bollettino della Stazione di
Patologia Vegetale di Roma, NS 14:1-78
Pothier JF, Pelludat C, Bünter M, Genini M, Vogelsanger J, Holliger E, Duffy B (2010) First report of
the quarantine pathogen Xanthomonas arboricola pv. pruni on apricot and plum in Switzerland.
Plant Pathol New Dis Rep 20:15
Pothier JF, Smits THM, Blom J, Voröhlter F-J, Goesmann A, Pühler A, Duffy B (2011) Complete
genome sequence of the stone fruit pathogen Xanthomonas arboricola pv. pruni. Phytopathology
101: S144-S145

Chapter 2
49
Randhawa PS, Civerolo EL (1985) A detached-leaf bioassay for Xanthomonas campestris pv. pruni.
Phytopathology 75:1060-1063
Scortichini M, Janse JD, Rossi MP, Derks JHJ (1996) Characterization of Xanthomonas campestris
pv. pruni strains from different hosts by pathogenicity tests and analysis of whole-cell fatty acids
and whole-cell proteins. J Phytopathol 144:69-74
Simeone AM (1985) Study on peach and nectarine cultivars susceptibility to the main fungi and
bacteria. Acta Hort 173:541-551
Simeone AM, Scortichini M (2005) Suscettibilità di cultivar di albicocco nei confronti della batteriosi
da Xanthomonas arboricola pv. pruni nell’Agro romano (Prunus armeniaca L.; Lazio). Rivista
di Frutticoltura e di Ortofloricoltura 67:52-54
Topp BL, Heaton JB, Russell DM, Mayer R (1989) Field susceptibility of Japanese-type plums to
Xanthomonas campestris pv. pruni. Aust J Exp Agric 29:905-909
Topp BL, Sherman WB (1995) Plum bacterial spot resistance in leaves and stems measured by a
selection index. Acta Hort 403:47-50
Turner P, Barber C, Daniels MJ (1984) Behavior of the transposons Tn5 and Tn7 in Xanthomonas
campestris pv. campestris. Mol Gen Genet 195:101–107
Zaccardelli M, Malaguti S, Bazzi C (1998) Biological and epidemiological aspects of Xanthomonas
arboricola pv. pruni on peach in Italy. J Plant Pathol 80:125-132
Zehr EI, Shepard PD (1996) Bacterial spot of peach as influenced by water congestion, leaf wetness
duration, and temperature. Plant Dis 80:339-341

Chapter 3
Identification of a major QTL for Xanthomonas arboricola pv. pruni resistance in apricot
Published in: Tree Genetics and Genomes (2012)

Chapter 3
51
To improve consistency in this thesis, the following modifications have been applied to chapter 3 in
comparison to the published paper: the part in the discussion concerning the comparison of our genetic
linkage maps with the literature has been complemented and improved.

Chapter 3
52
3.1. Abstract
Xanthomonas arboricola pv. pruni causes bacterial spot of stone fruit resulting in severe yield losses
in apricot production systems. Present on all continents, the pathogen is regulated in Europe as a
quarantine organism. Host resistance is an important component of integrated pest management,
however little work has been done describing resistance against X. arboricola pv. pruni. In this study,
an apricot population derived from the cross “Harostar” × “Rouge de Mauves” was used to construct
two parental genetic maps and to perform a quantitative trait locus (QTL) analysis of resistance to X.
arboricola pv. pruni. A population of 101 F1 individuals was inoculated twice for two consecutive
years in a quarantine greenhouse with a mixture of bacterial strains, and disease incidence and
resistance index data were collected. A major QTL for disease incidence and resistance index
accounting respectively for 53% (LOD score of 15.43) and 46% (LOD score of 12.26) of the
phenotypic variation was identified at the same position on linkage group 5 of “Rouge de Mauves”.
Microsatellite marker UDAp-452 co-segregated with the resistance, and 2 flanking microsatellites,
namely BPPCT037 and BPPCT038A were identified. When dividing the population according to the
alleles of UDAp-452, the subgroup with unfavorable allele had a disease incidence of 32.6% whereas
the group with favorable allele had a disease incidence of 21%, leading to a reduction of 35.6% in
disease incidence. This study is a first step towards the marker assisted breeding of new apricot
varieties with an increased tolerance to X. arboricola pv. pruni.
Keywords
Bacterial spot – Prunus armeniaca – microsatellite – Amplified Fragment Length Polymorphism –
Marker assisted selection – Quantitative Trait Loci

Chapter 3
53
3.2. Introduction
Bacterial spot of stone fruit, caused by Xanthomonas arboricola pv. pruni, is one of the major diseases
of peach, apricot, plum and almond (du Plessis 1988; Pothier et al. 2011a). It produces necrotic lesions
on leaves, which may lead to severe defoliations of the trees. Fruit lesions appear as water soaked
spots becoming brown on the surface (Civerolo and Hatting 1993). Cankers on twigs can be observed,
especially on plum (Garcin et al. 2005). X. arboricola pv. pruni has been identified on all continents
since its first description in the USA by Smith (1903). In Europe, severe outbreaks occur in France,
Italy, Bulgaria, Romania and Ukraine (Anonymous 2006). In Switzerland, it was first detected on
apricot in 2005 in canton Valais (Pothier et al. 2010).
The bacteria overwinter in buds and cankers or in leaf scars (Zaccardelli et al. 1998; Battilani
et al. 1999). Spring temperatures higher than 20°C, heavy winds and a high humidity for at least three
days are the most favorable conditions for bacteria multiplication and for obtaining severe infections
(Battilani et al. 1999). Late infections can be also observed in the fall (Garcin et al. 2005). In neglected
peach orchards, X. arboricola pv. pruni can damage 25 to 75% of the fruits (Dunegan 1932; Pothier et
al. 2011b).
In Europe, phytosanitary measures to avoid spread of the pathogen and the application of
copper sprays are currently the two strategies used to control X. arboricola pv. pruni, but the efficacy
of copper sprays is hindered by environmental problems due to copper residues and by leaf damages it
causes (Ritchie 1995). In the USA, oxytetracycline is used to control the disease but has a limited
efficacy (Ritchie 1995).
Host resistance has been studied in peach, plum, and apricot (Keil and Fogle 1974; Werner et
al. 1986; Topp and Sherman 1990; Layne 1991; Layne and Hunter 2003; Garcin et al. 2005).
Resistance screenings among the cultivars have been conducted in the field and showed variation in
susceptibility to the disease. Symptoms were observed also on the more resistant varieties, therefore
indicating that complete resistance seems not to exist (Garcin et al. 2005). These results indicate that
the resistance might be controlled in a quantitative manner. Although breeding for quantitative
resistance would be more challenging than in the case of a qualitative resistance, quantitative
resistance still represents an interesting potential for the breeding of more resistant cultivars.
Prunus genetic maps have been constructed in recent years based on combinations of Random
Amplified Polymorphic DNA (RAPD), Amplified Fragment Length Polymorphism (AFLP),
Restriction Fragment Length Polymorphism (RFLP) and Simple Sequence Repeat (SSR) markers
(Hurtado et al. 2002; Vilanova et al. 2003; Dondini et al. 2007). The Prunus reference map has been
constructed from a cross between almond (“Texas”) and peach (“Earlygold”) (T × E) and is saturated
with RFLPs, SSRs, isoenzymes, and sequence-tagged sites (Joobeur et al. 1998; Dirlewanger et al.
Chapter 3
54
2004a; Howad et al. 2005). The high level of synteny reported in Prunus allows map comparison and
the transfer of markers among diploid (2n = 16) Prunus varieties (Dirlewanger et al. 2004a, b;
Lambert et al. 2004; Olmstead et al. 2008). The very recent availability of the peach physical map
(Zhebentyayeva et al. 2008) and of the whole genome sequence (International Peach Genome
Initiative: Peach Genome v1.0. 2010 http://www.rosaceae.org/peach/genome) permit to develop
markers for saturation of very specific regions and for the cloning of genes.
Quantitative Trait Loci for resistance against several pathogens and pests have been mapped in
Prunus. Resistance against sharka in peach, apricot and P. davidiana has been extensively investigated
and a major QTL has been found on linkage group (LG) 1 (Lambert et al. 2004; Decroocq et al. 2005;
Sicard et al. 2008; Soriano et al. 2008; Dondini et al. 2010; Vera Ruiz et al. 2011). Other resistance
QTLs from P. davidiana have been detected for powdery mildew in peach × P. davidiana crosses on
LG1, LG2, LG3, LG5, LG6 and LG8 (Dirlewanger et al. 1996; Foulongne et al. 2003), and for leaf
curl caused by Taphrina deformans in a peach × P. davidiana cross on six linkage groups (Viruel et al.
1998). Resistance genes against root-knot nematode were identified and validated with molecular
markers on LG7 in plum and almond and on LG2 in peach (Claverie et al. 2004; Dirlewanger et al.
2004b; Esmenjaud et al. 2009; van Ghelder et al. 2010). Additionally, resistance gene analogs were
identified and mapped in Prunus based on a peach BAC library and the genetically anchored peach
physical map. In this way 42 putative resistance regions were identified (Lalli et al. 2005).
To date, despite regular yield losses in peach and apricot productions due to X. arboricola pv.
pruni, host resistance against bacterial spot has not been intensively studied and no major gene or QTL
has been mapped. The objectives of this study were to identify quantitative trait loci controlling X.
arboricola pv. pruni resistance using AFLP- and SSR-based maps of the apricot population,
“Harostar” × “Rouge de Mauves”, and to identify SSR markers linked to the QTLs for further use in a
marker assisted selection program.
3.3. Material and methods
3.3.1. Plant material
A cross between the Canadian cultivar “Harostar” and the French cultivar “Rouge de Mauves”
provided 102 F1 plants and was used as a mapping population. “Harostar” is reported to have a good
resistance level against X. arboricola pv. pruni (Layne and Hunter 2003) whereas resistance level of
“Rouge de Mauves” was unknown. Plants were grown in an orchard in Conthey, Switzerland. Five
replicates per F1 and ten replicates from each parent were grafted on the plum “Saint-Julien 655-2”
rootstock, resulting in a total plant number of 525. All plants were kept in a cold chamber at 2°C for
short-term storage. Plants were then potted and grown under greenhouse conditions at 23°C, 60%

Chapter 3
55
humidity for one week before being transferred in a quarantine greenhouse. Inoculations were
performed over two years (2010 and 2011) on the same population; plants were kept in the quarantine
greenhouse over winter. In 2011, 94 plants across 50 genotypes that had died during the previous year
were replaced with newly grafted plants on the same “Saint-Julien 655-2” rootstock.
3.3.2. Bacterial strains
In the first year, four strains of X. arboricola pv. pruni were used in a mix. Two of them were
collected in Switzerland (Valais), one strain in 2005 (XA1.29) and the second in 2007 (XA1.51)
(Pothier et al. 2010). The two others were the pathotype strain NCPPB 416 and the genome sequenced
strain CFBP 5530 (Pothier et al. 2011a; 2011c). In the second year, a third Swiss strain, XA1.15
(Pothier et al. 2010), was added to the mix. The genetic diversity of X. arboricola pv. pruni being low
(Boudon et al. 2005), strains were chosen for their diversity in origins, and for their different years of
isolation on different hosts in the attempt to inoculate the plants with an inoculum with a high
diversity (Pothier et al. 2011a). For long-term storage, strains were kept in 40% glycerol at -80°C.
3.3.3. Inoculation
Inoculum was prepared as described by Socquet-Juglard et al. (2012, Chapter 2) and the inoculation
procedure was modified as following: prior to inoculation, plants were put in dark conditions, 23°C
and 90% humidity for 24 h for an optimal stomata opening (pre-conditioning); the whole plant
material was randomly divided into 3 blocks in the same quarantine greenhouse chamber and
inoculation took place during 3 days. To avoid possible block effects as observed in the 2010
inoculation, the pre-conditioning step was not performed in the 2011 inoculation and all plants were
inoculated on the same day. Actively growing shoots (10 to 20 cm long) were immersed in the
bacterial suspension, and gently agitated for about 5 s until leaf surfaces were fully wetted on both
sides (Topp and Sherman 1995). In autumn 2010, plants were cut back and in 2011, all leaves from
young new shoots were inoculated. Following inoculation, climate conditions were set to 23°C in the
day, 18°C in the night and 85% humidity.
3.3.4. Evaluation of disease resistance
Trees were assessed 42 days post inoculation (dpi). The number of inoculated leaves per plant
showing symptoms was counted and was expressed as disease incidence in percent (DI10 and DI11).
During the third assessment in 2010 and in 2011, the percentage of damage of each inoculated leaf
was assessed and used to calculate the tree resistance index (RI10 and RI11) (adapted from Le Lézec
et al. 1997) according to the following formula:

Chapter 3
56
RI = [��� × 1� + �� × 2� + ��� × 3� + ��� × 4� + ��% × 5�]/(
where n1 is the number of symptomless leaves, n2 is the number of leaves presenting 1 to 25% damage,
n3 26 to 50%, n4 51 to 75%, n5 76 to 100% damage, and N is the total number of inoculated leaves per
plant.
3.3.5. DNA isolation
Young leaves were collected in May from orchard plants, frozen in liquid nitrogen and stored at
-80°C. Leaf samples were lyophilized for 48h. Genomic DNA was extracted using the QIAGEN
DNeasy Plant Mini kit (Qiagen, Hilden, Germany). DNA quantity and quality was assessed with a
NanoDrop ND-1000 (NanoDrop Technologies, Wilmington, DE, USA) before being used for both
AFLP and SSR marker analysis.
3.3.6. SSR and AFLP analysis
One hundred and four SSR markers developed from apricot, peach, cherry and almond (Table 3.1),
were selected to regularly span the whole genome, according to the genetic map of Dondini et al.
(2007) and the Prunus reference map T × E (Joobeur et al. 1998; Howad et al. 2005). To cover the top
of LG7, an additional marker was developed from the Genome Database for Rosaceae (GDR) with the
following primer sequences: CH-PP-01: F5’ GTCACGTTCAAAGTCCTGC 3’ and R5’
CAGAATCAGCTCCTGGTA 3’. All markers were first screened for polymorphism within and
between the two parents by testing the two parents and five progeny plants. Two different methods for
PCR amplification were used. One set of markers was amplified with FAM or HEX dye-labeled
forward primers. In this case, PCR conditions were 94°C for 15 min, 35 cycles of 94°C for 45 s, 55°C
for 60 s, 72°C for 75 s; and a final extension step of 72°C for 5 min. For the second set, markers were
amplified using M13-fam, SP6-hex, T7-atto565 and E31-atto550 universal primers as described by
Schuelke (2000). In this case, 8 cycles of 94°C (30 s), 53°C (45 s), 72°C (45 s) and a final extension of
10 min followed the 35 cycles previously described for the markers of the first set. PCR amplifications
were performed in 10 µl reaction mixture containing 5 µl Qiagen Multiplex PCR Master Mix (Qiagen,
Hilden, Germany), 1 µl Q-solution, 10 nM of primer mix, 10 ng genomic DNA and 2 µl dH2O.
AFLP analysis was performed using protocol described by Vos et al. (1995) and modified by
Habera et al. (2004) for fluorescent labeling, using the 6-FAM dye. The combination of the restriction
enzymes EcoRI and MseI was used. Five EcoRI+2-MseI+2 primer combinations (Table 3.2) were
tested for reproducibility on 10 individuals; because they amplified more than 25 polymorphic

Chapter 3
57
fragments per combination, they were used to screen the rest of the progeny. All polymorphic bands in
the range 50-500 bp were scored visually for presence or absence. AFLP markers were named in
function of the length of the fragment obtained in addition to the name of the primer combination
used.
AFLP and SSR fragments were diluted in dH2O (1:100) and mixed with 8.8 µl of formamide
and 0.2 µl GeneScan 500 LIZ size standard (Applied Biosystems, Foster City, California, USA).
Samples were denaturated for 5 min at 95°C and immediately cooled at -20°C for 3 min. Amplified
PCR products were separated on an ABI 3130 sequencer (Applied Biosystems) and scored using the
software GeneMapper version 4.1 (Applied Biosystems).

Table 3.1. Characteristics and origin of microsatellite (SSR) markers series used for the construction of the “Harostar” (Ha) and “Rouge de Mauves”
(RM) linkage maps
Marker designation Species Tested Amplified Polymorphic Mapped Ha Mapped RM Common SSRs Reference AMPA P. armeniaca 15 15 11 6 6 4 Hagen et al. 2004 Aprigms P. armeniaca 4 3 3 0 3 0 Vilanova et al. 2006 BPPCT P. persica 11 9 7 5 5 3 Dirlewanger et al. 2002 CH-PP- P. persica 2 1 1 1 1 1 This study CPPCT P. persica 3 2 2 1 0 0 Aranzana et al. 2002 CPSCT P. salicina 1 1 0 0 0 0 Mnejja et al. 2004 MA P. persica 1 1 1 1 1 1 Yamamoto et al. 2002 Pac P. armeniaca 5 5 4 3 3 2 Decroocq et al. 2003 PaCITA P. armeniaca 12 12 11 9 7 6 Lopes et al. 2002 Pchgms P. persica 1 1 1 1 1 1 Sosinski et al. 2000 PS P. cerasus 1 1 0 0 0 0 Sosinski et al. 2000 UDAp P. armeniaca 44 42 38 34 24 21 Messina et al. 2004 UDP P. persica 4 2 2 2 2 2 Cipriani et al. 1999; Total 104 95 81 63 53 41 Testolin et al. 2000
Table 3.2. AFLP combinations tested and number of amplicons mapped in the apricot parents “Harostar” (Ha) and “Rouge de Mauves” (RM)
Primer combination
Primer designationa
Fragments detected
Polymorphic fragments in Ha
Polymorphic fragments in RM
Total polymorphic fragments
Total mapped fragments
EAG-MAC E13-M12-x 161 16 11 27 25 EAG-MAG E13-M13-x 162 18 14 32 30 EAC-MAC E12-M12-x 147 14 11 25 23 EAC-MAG E12-M13-x 157 13 17 30 24 EAG-MCT E13-M18-x 136 28 10 38 34 Total 763 89 63 152 136 Average 152.6 17.8 12.6 30.2 27.4 a -x designates the size of the polymorphic band

Chapter 3
59
3.3.7. Linkage mapping and QTL analysis
Linkage analysis was performed using JoinMap 4.0 software (van Ooijen 2006). The pseudo-test cross
strategy was chosen using JoinMap CP (cross pollinating function) to obtain two separate parental
maps. Linkage groups were established using a minimum log of odds (LOD) of 5.0 for parent
“Harostar” and 4.0 for parent “Rouge de Mauves”; and a maximum recombination fraction of 0.40.
Kosambi’s mapping function was used to calculate map distances. Markers with distorted segregation,
determined by the χ2 analysis, were first included in the analysis; if those markers created severe
conflicts with the segregation pattern of markers located in the same area, they were excluded.
Nomenclature and orientation of all linkage groups were based on the maps published by Dondini et
al. (2007) and on the Prunus reference map (T × E).
Kruskal-Wallis (KW) tests and interval mapping (IM) analysis, as well as multiple-QTL
analysis (MQM) were performed with MapQTL 5.0 (van Ooijen 2004). A permutation test (1,000
permutations) was performed to calculate the appropriate LOD score thresholds. A 5% genome-wide
error rate was chosen and all values above each trait threshold were considered significant.
3.3.8. Statistical analysis
In 2010 inoculation was performed on three consecutive days leading to three blocks of plants, thus
data produced in 2010 was checked for progeny x inoculation date effect. In 2011 inoculation occurred
on the same day, however new plants were added to replace the dead ones so data was verified for
progeny x plant age effect. In order to remove the inoculation date effects of the first year and the
plant age effect of the second year, but also to allow comparison between traits over two years and to
combine datasets from both years, a standardization procedure was performed for each plant in both
years datasets following the formula:
X*+, = �X − X.�//0
where in 2010 Xstd is the standardized value of the plant, Xm is the mean of the values collected for a
specific inoculation date to which plant X belongs to, and sd is the standard deviation of the value of
this subset; while in 2011 Xstd is the standardized value of the plant, Xm is the mean of the values of the
“old” or “new” plants to which X belongs to and sd is the standard deviation of the value of this
subset. Outliers were checked before combining datasets of both years using Jackknife distances for
each genotype and removed. The distributions of each variable were finally tested for normality.
Broad-sense heritability was estimated using the following formula:

Chapter 3
60
h = σ3 /[σ3 + �σ4 /��]
where σ2g is genetic variance; σ2
e is environmental variance and n is the mean number of replicates per
genotype (Foulongne et al. 2003; Calenge et al. 2004). Frequency distributions, segregation models,
one way ANOVA, Student’s t-tests were calculated for each assessment using software JMP®v.8.0
(SAS Institute Inc, Carey, NC, USA).
3.3.9. Candidate gene search
Based on the peach genome sequence predicted genes list available at
http://www.rosaceae.org/peach/genome, all genes located on scaffold 5 between markers BPPCT037
and BPPCT038A were selected and a search for genes involved in disease resistance was manually
performed by inspection of the genome annotations. A special interest was given to disease resistance
genes, but also to receptor-like kinases containing leucin-rich repeats (LRR) because they are known
to be involved in tomato resistance to X. campestris pv. vesicatoria (Mayrose et al. 2004) and in rice
resistance to X. oryzae pv. oryzae (Song et al. 1995; Xiang et al. 2006). Kinases could also play a role
in soybean resistance to X. axonopodis pv. glycines (Kim et al. 2011) and in cassava resistance to X.
axonopodis pv. manihotis (Perez-Quintero et al. 2012). Sequences of each gene were then analyzed
with BLASTX (http://blast.ncbi.nlm.nih.gov) in order to obtain updated annotations.
3.4. Results
3.4.1. Phenotyping X. arboricola pv. pruni resistance
In 2010, first symptoms appeared at one week post-inoculation and were recognizable as primarily
circular yellow spots; the first necrosis appeared one week later. Severe defoliations occurring in the
inoculated part of the shoots were observed for the most susceptible genotypes at 42 dpi. In 2011,
grayish zones spanning large parts of basal leaves were observed at one week post-inoculation; these
zones became necrotic and most heavily affected leaves dropped during the time of the experiment. At
42 days post inoculation, disease incidence varied from 11.8 to 85.3% in 2010 and from 3.6 to 82.7%
in 2011 (data not shown).
The ANOVA performed to test the effects of the date of inoculation the first year and the
effect of the age of the plant (grafted in 2010 or grafted in 2011) during the second year revealed
significant differences among those blocks for both disease incidence and resistance index, and
therefore data were standardized. When dividing the block of plants grafted in 2010 according to

Chapter 3
61
genotypes with one to several dead plants, or to genotypes without any dead plant, no significant
difference was obtained between these two sub-groups (Fig. 3.1).
Fig. 3.1. Student’s t-test and box plots for the effects of the age of the plant on disease
incidence in 2011. 1: mean disease incidence value of the genotypes for which no plant died in
2010 (plants grafted in 2010); 2: mean disease incidence value of the genotypes for which at
least one plant died in 2010 (plants grafted in 2010); 3: mean disease incidence value of the
plants of the same genotypes as in 2, but grafted in 2011. 1 and 2 were not significantly
different (P < 0.05) but both were significantly different from 3
Correlation coefficients between the two different standardized resistance traits were high (P <
0.001, Table 3.3) in each of the two years; a correlation for the same trait per genotype between the
two consecutive years could be also observed (P < 0.05, Table 3.3). When combining datasets of the
two years, both parents had in all cases higher values than the F1 average, showing transgressive
segregations in the progeny (Fig. 3.2).

Chapter 3
62
Table 3.3. Pearson correlation coefficients between all Xanthomonas arboricola pv. pruni
resistance traits in the “Harostar” × “Rouge de Mauves” progeny
DIstd DI10std DI11std RIstd RI10std
DIstd
DI10std 0.69****
DI11std 0.79**** 0.21*
RIstd 0.91**** 0.61**** 0.74****
RI10std 0.67**** 0.85**** 0.22* 0.75****
RI11std 0.73**** 0.15 0.89**** 0.80**** 0.23* DI: disease incidence; RI: resistance index; std: standardized data; years are indicated in names as 10 or 11, RIstd and DIstd are values obtained with both datasets combined * P < 0.05; **** P < 0.001
Fig. 3.2. Distribution in the 101 F1 progeny of a the disease incidence and b the resistance
index with standardized data of both years combined at 45 days post inoculation. Parental
values (Ha for “Harostar” and RM for “Rouge de Mauves”) are indicated by arrows
3.4.2. Construction of linkage maps
Five AFLP primer combinations and 104 SSR markers were tested for polymorphism to construct the
two parental linkage maps (Table 3.1 and Table 3.2). The five AFLP combinations gave a total of 763
fragments; 152 were polymorphic and 136 of them were mapped. Eighty-nine AFLP fragments were
polymorphic in “Harostar”, five of them remained ungrouped and three were excluded because they
created tensions in the maps; 63 were polymorphic in “Rouge de Mauves”, four of them remained
ungrouped and four were excluded (Table 3.2). Ninety-four (90.4%) SSR markers produced
amplicons; of those, 14 (14.9%) were monomorphic for both parents and three were not used because
they had an “hk x hk” segregation type. Two SSR markers (PaCITA11 in “Rouge de Mauves” and
AMPA123b for “Harostar”) were excluded because they created tensions in the maps. Forty-one SSR

Chapter 3
63
markers were shared between the maps of the two parents “Harostar” and “Rouge de Mauves”, 22
were mapped only in “Harostar” while 12 were mapped only in “Rouge de Mauves”. Five
microsatellite markers were multilocus, three of them, UDAp-428 (Ha_LG2), UDAp-433 (Ha_LG6)
and UDAp-424 (RM_LG7) mapping both loci on the same linkage group on a very close genetic
distance. UDAp-471 amplified one locus on LG8 in “Rouge de Mauves” and one locus on LG7 in
“Harostar”. UDAp-424 mapped only one locus in “Harostar” (LG7), and UDAp-433 mapped only one
locus in “Rouge de Mauves” (LG6). Finally, PaCITA10 was multilocus only in “Harostar” (LG3 and
4).
The number of marker loci per linkage group ranged from 11 to 20 in “Harostar” and from 3
to 21 for “Rouge de Mauves”. The average distances between two consecutive loci were 4.9 cM for
“Harostar” and 6.9 cM for “Rouge de Mauves”. The “Harostar” linkage map of 553.6 cM in total was
composed by the expected 8 linkage groups (Fig. A.1 in the Appendix). The two largest gaps (24 and
26 cM) that could not be filled with markers were located on linkage groups 1 and 7. Concerning the
genetic map of “Rouge de Mauves”, it was composed of 9 linkage groups and its total map length was
684 cM (Fig. A.2 in the Appendix). The additional group is due to the splitting of LG2 between
markers UDAPp-428 and UDAp-457. None of the 10 SSR markers tested to try to fill this gap were
polymorphic for this parent. Two gaps of 30 and 34 cM were observed on linkage groups 1 and 7.
3.4.3. QTL analysis
Broad-sense heritability values ranged from 0.96 for the disease incidence to 0.97 for the resistance
index obtained with combined datasets. The genome-wide LOD thresholds calculated by the
permutation tests ranged from 2.4 to 2.5 (data not shown) and therefore all QTLs with a LOD score
higher than 2.5 were considered as significant (P < 0.05). The MQM analysis did not lead to the
detection of other QTLs hence only results of Kruskal-Wallis and QTLs found by interval mapping are
presented.
The Kruskal-Wallis test identified three markers of “Rouge de Mauves” linked (P < 0.005) to
both resistance traits disease incidence and resistance index on linkage group 1 (LG1; BPPCT011),
LG5 (UDAp-452), and LG7 (Ma10a). Marker UDAp-446 on LG3 was only linked to resistance index.
Two QTLs were identified by interval mapping in the same region of linkage group 5 of “Rouge de
Mauves” for disease incidence (LOD score of 15.4 and 53.6% of phenotypic variation explained,
PVE) and for the resistance index (LOD 12.3, and 46.2% of the PVE) (Fig. 3.3 and Table 3.4). The
peak of the QTL for both traits is between the SSR markers BPPCT037 and BPPCT038A with the
marker UDAp-452 being basically at the peak position. The QTL peak had a maximum likelihood
position at 52.8 cM for the resistance index and at 54.3 cM for the disease incidence. These two QTLs
found with the pooled data were also detected by using separately the 2010 and 2011 datasets (data not

Chapter 3
64
shown). No other significant QTL (at LOD 2.5 or higher) was detected on any other linkage group of
“Rouge de Mauves”.
For “Harostar”, the Kruskal-Wallis identified only marker E12-M13-278 on LG8 as
significantly linked to both resistance traits, the other markers were either linked to disease incidence
(PaCITA7 on LG1, E13-M13-380 on LG2 and UDP98-412 on LG6) or to resistance index (UDAp-
446 on LG3 and UDAp-430 on LG5). No significant QTL was detected in “Harostar” by interval
mapping.
Fig. 3.3. Location of QTLs on LG5 involved in resistance against Xanthomonas arboricola
pv. pruni in “Rouge de Mauves” by combining datasets of both years. Dotted horizontal line
represents the genome-wide threshold (LOD of 2.5); solid curve shows the QTL for disease
incidence and dotted curve shows the QTL for resistance index. Confidence intervals of 2-

Chapter 3
65
LOD are represented with lines. Boxes represent a 1-LOD confidence interval. Box with solid
line represents the QTL for disease incidence, and dotted box the QTL for resistance index
Table 3.4. Summary of the QTLs for resistance against Xanthomonas arboricola pv. pruni
detected in the progeny “Harostar” × “Rouge de Mauves” by Kruskal-Wallis test and interval
mapping
Trait LGa Position Markerb KWc LODd PVEe Allele sizef Allele effectf
0 1 0 1
DIstd Ha1 74.17 PaCITA7 8.67**** - - 196 213
0.13 -0.23 DIstd RM1 135.3 BPPCT011 8.77**** - - 0 196
0.09 -0.29
DIstd Ha2 25.12 E13-M13-380 10.08**** - - - - -0.24 0.16
DIstd RM5 54.3 UDAp-452 52.34***** 15.43 53.6 174 184
0.21 -0.50 DIstd Ha6 48.99 UDP98-412 8.26**** - - 136 140
-0.22 0.10 DIstd RM7 24.64 Ma10a 7.62*** - - 124 126
0.11 -0.22
DIstd Ha8 12.96 E12-M13-278 10.13**** - - - - -0.36 0.08
RIstd RM1 135.3 BPPCT011 8.59*** - - 0 196
0.09 -0.28 RIstd Ha3 10.11 UDAp-446 10.15**** - - 135 168
-0.26 0.14 RIstd RM3 29.35 UDAp-446 7.52*** - - 135 154
-0.20 0.14 RIstd Ha5 53.42 UDAp-430 7.03*** - - 178 200
-0.17 0.11 RIstd RM5 52.8 UDAp-452 43.98***** 12.26 46.2 174 184
0.21 -0.49
RIstd RM7 24.64 Ma10a 9.98**** - - 124 126
0.15 -0.30 RIstd Ha8 12.96 E12-M13-278 7.02*** - - - - -0.30 0.04
DI and RI: QTLs detected for the disease incidence and resistance index using a combination of standardized datasets from both years
a Parental map (RM: “Rouge de Mauves”, Ha: “Harostar”) and linkage group on which marker was linked to resistance b Molecular marker closest to the peak of each QTL c Kruskal-Wallis score; P values are presented (*** P < 0.005; **** P < 0.001; ***** P < 0.0001) d LOD (logarithm of odds ratio) score determined by interval mapping e Phenotypic variance explained by the peak of the LOD score in % f Allele sizes and their respective mean phenotypic score of progeny carrying the 0 or 1 allele. Favorable allele is the lowest value and is shown in bold
To check for the allelic effects of the QTL obtained, we considered only the subset of the
disease incidence obtained for the old plants in 2011; in order to avoid age effect which would require
a standardization and would render more difficult the interpretation of the results, all data obtained
from the new plants added in 2011 were excluded. A significant difference was observed (P < 0.0001)
between the untransformed means of disease incidence (Fig. 3.4a) and resistance index (Fig. 3.4b) for
the two subpopulations obtained when dividing for the allelic effects of the SSR marker UDAp-452.
The disease incidence was 21% for the subgroup of genotypes possessing the favorable allele, whereas
for the subgroup with the negative allele the disease incidence was 32.6%, leading to a reduction of

Chapter 3
66
35.6% in disease incidence for the subgroup possessing the favorable allele. Concerning the resistance
index, mean values obtained for the subgroup with the favorable allele was 1.3 and the subgroup
possessing the negative allele had a mean value of 1.48, showing a reduction of 37.5% of
susceptibility for the subgroup possessing the favorable allele.
Fig. 3.4. A and B Allelic effects of the disease incidence (a) and resistance index (b) for
“Rouge de Mauves” at marker locus UDAp-452 with untransformed values obtained from the
old plants in 2011. Favorable alleles are represented by a 1, and unfavorable alleles by a 0.
Standard errors are represented. Means sharing a letter were not significantly different using a
t-test (P < 0.05)
3.4.4. Candidate genes search
A total of 448 genes were found between markers BPPCT037 and BPPCT038A, and six of these,
encoding for receptor-like protein kinases, LRR proteins or disease resistance proteins (Table 3.5),
could be involved in primary sources of resistance. Two genes similar to disease resistance protein
At1g58400 and another one to the F-box/LRR-repeat protein At5g63520 have large introns (more than
1,000 bp) and are therefore present twice in Table 3.5.
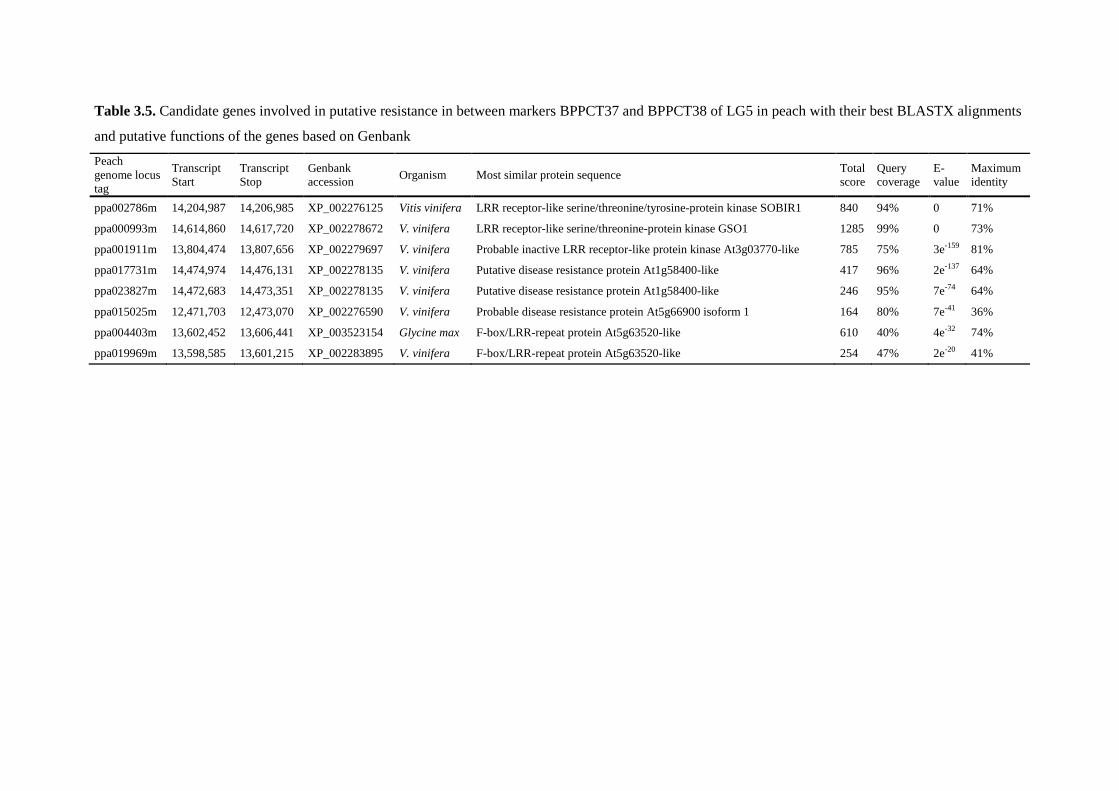
Table 3.5. Candidate genes involved in putative resistance in between markers BPPCT37 and BPPCT38 of LG5 in peach with their best BLASTX alignments
and putative functions of the genes based on Genbank
Peach genome locus tag
Transcript Start
Transcript Stop
Genbank accession
Organism Most similar protein sequence Total score
Query coverage
E- value
Maximum identity
ppa002786m 14,204,987 14,206,985 XP_002276125 Vitis vinifera LRR receptor-like serine/threonine/tyrosine-protein kinase SOBIR1 840 94% 0 71%
ppa000993m 14,614,860 14,617,720 XP_002278672 V. vinifera LRR receptor-like serine/threonine-protein kinase GSO1 1285 99% 0 73%
ppa001911m 13,804,474 13,807,656 XP_002279697 V. vinifera Probable inactive LRR receptor-like protein kinase At3g03770-like 785 75% 3e-159 81%
ppa017731m 14,474,974 14,476,131 XP_002278135 V. vinifera Putative disease resistance protein At1g58400-like 417 96% 2e-137 64%
ppa023827m 14,472,683 14,473,351 XP_002278135 V. vinifera Putative disease resistance protein At1g58400-like 246 95% 7e-74 64%
ppa015025m 12,471,703 12,473,070 XP_002276590 V. vinifera Probable disease resistance protein At5g66900 isoform 1 164 80% 7e-41 36%
ppa004403m 13,602,452 13,606,441 XP_003523154 Glycine max F-box/LRR-repeat protein At5g63520-like 610 40% 4e-32 74%
ppa019969m 13,598,585 13,601,215 XP_002283895 V. vinifera F-box/LRR-repeat protein At5g63520-like 254 47% 2e-20 41%

Chapter 3
68
3.5. Discussion
3.5.1. Phenotypic screenings
Resistance to bacterial leaf spot of “Harostar” has been described as “good” in field trials (Layne and
Hunter 2003), equaling the ones of “Veecot”, “Haroblush” and “Harogem” cultivars. Under controlled
conditions, in both years “Harostar” showed very few necroses per leaf although most of the leaves
were symptomatic. As a consequence, its disease incidence was higher than the average observed in
the progeny plants, equaling scores obtained for the second parent. No information about the
resistance level to bacterial spot of “Rouge de Mauves” was available at the beginning of the project.
The results of our inoculations showed that both parents were moderately susceptible under
greenhouse conditions. This small phenotypic difference obtained between the parents was not
expected, but a transgressive segregation was observed and skewed towards resistance, indicating that
alleles from both parents are contributing to an increase of resistance against the pathogen. Student’s t-
tests conducted with the genotypes for which one to several plants died in 2010 showed that the
increase in resistance observed on the older plants in 2011 in comparison to the new plants was due to
a plant age effect rather than from a genetically explained susceptibility, and that plants which died in
2010 died for other reasons than the susceptibility to the disease (Fig. 3.1). Standardization of the
datasets was consequently a necessary step to combine the set of older plants with the new ones.
Differences that have occurred between both experiments, such as the addition of a new X. arboricola
pv. pruni strain into the inoculum mix, or the differences in pre-conditioning did not significantly
changed the disease reactions of the plants (Table 3.3) and permitted to pool the datasets obtained
from both years, allowing a more precise QTL detection.
3.5.2. Linkage analysis and map construction
The use of multiplex and megaplex PCRs for SSR analysis as previously reported for apple, barley,
wheat, apricot and cherry (Patocchi et al. 2008, Hayden et al. 2008; Campoy et al. 2010) permitted to
efficiently screen many markers in a limited time and at a reduced price. In addition, the use of
fluorescent labeling and the combination of E primer and M primer with only two selective
nucleotides instead of three for the AFLP analysis has been particularly efficient and permitted to
obtain on average 30 polymorphic fragments per combination, whereas with the use of polyacrylamide
gels and primer combinations of three selective nucleotides for one primer and two for the second
primer, Vilanova et al. (2003) obtained about eight polymorphic bands per combination and Lalli et al.
(2008) obtained nine polymorphic bands.
The genetic linkage map of “Harostar” had the expected 8 linkage groups; whereas the linkage
map of “Rouge de Mauves” had one additional linkage group that could be assigned to LG2 (Fig. A.1

Chapter 3
69
and A.2 in the Appendix). Despite the ten microsatellite markers used to try to fill this gap and the
relatively high number of AFLPs mapped, we could not join the two fragments into a single
chromosome. Failures to obtain the eight linkage groups have been previously reported in Prunus
(Dirlewanger et al. 2006; Illa et al. 2009; Eduardo et al. 2011). An explanation could be a large
homozygous region on the LG2 of “Rouge de Mauves” either derived from selfing or from the use of
the same cultivar in the breeding process of this parent. However, both hypotheses cannot be tested
since the pedigree of “Rouge de Mauves” is unclear.
In comparison to the maps constructed by Dondini et al. (2007) with the cross “Lito” ×
“BO81604311”, a few minor inversions were found (i.e., on the map of “Harostar” on LG1 between
markers UDAp-453 and UDAp-467; and on LG7 between markers UDAp-422 and UDAp-424B). On
the map of “Rouge de Mauves”, two minor inversions were observed. The first inversion on LG2
between UDAp-498 and UDAP-405 had already been identified by Illa et al. (2009) during their work
of saturation of the map of Dondini et al. (2007) with additional markers. The second inversion was
found on LG3 between markers PaCITA10 and PaCITA4. All these inversions occurred between very
close markers (maximum 5 cM in our maps) and after double checking our data they could be due to a
single missing data and therefore mapping errors. Most markers reported by Dondini et al. (2007) as
multilocus were also multilocus in our study. Four markers mapped in new regions, three of them were
never reported as multilocus: PaCITA10 which mapped on LG3 and LG4, UDAp-433 which mapped
twice on LG6 and UDAp-471 which mapped on LG7 and LG8. The fourth SSR, UDAp-486, is
normally known to map on LG6, but it has been found in our case only on the bottom of LG4 of the
“Harostar” map. This could be another multilocus marker, as one peak was present in both parents but
did not segregate in our population. Total lengths of our maps (553 cM for “Harostar”; 684 cM for
“Rouge de Mauves”) are in the average of those reported in apricot by Dondini et al. 2007 (504 cM for
“Lito” and 620 cM for “BO81604311”).
3.5.3. QTL analysis
Although resistance traits were normally distributed and that several regions on both parents were
found to be linked with the resistance traits by Kruskal-Wallis, indicating a polygenic control of the
trait, only one significant QTL involved in disease resistance was found by both Kruskal-Wallis and
interval mapping tests in “Rouge de Mauves”. Mapped on LG5, this QTL accounted for 53% of the
phenotypic variation explained for the disease incidence and for 46% of the phenotypic variation
explained for the resistance index. The peak of the QTL is located very close to marker UDAp-452, in
a region downstream the minor QTL involved in sharka resistance (Lambert et al. 2007) and upstream
a major QTL involved in powdery mildew resistance (Foulongne et al. 2003; Lalli et al. 2005). Several
possibilities could explain why we did not find any significant QTL by interval mapping in
“Harostar”, such as a too small size of the population, which did not permit to have a statistical
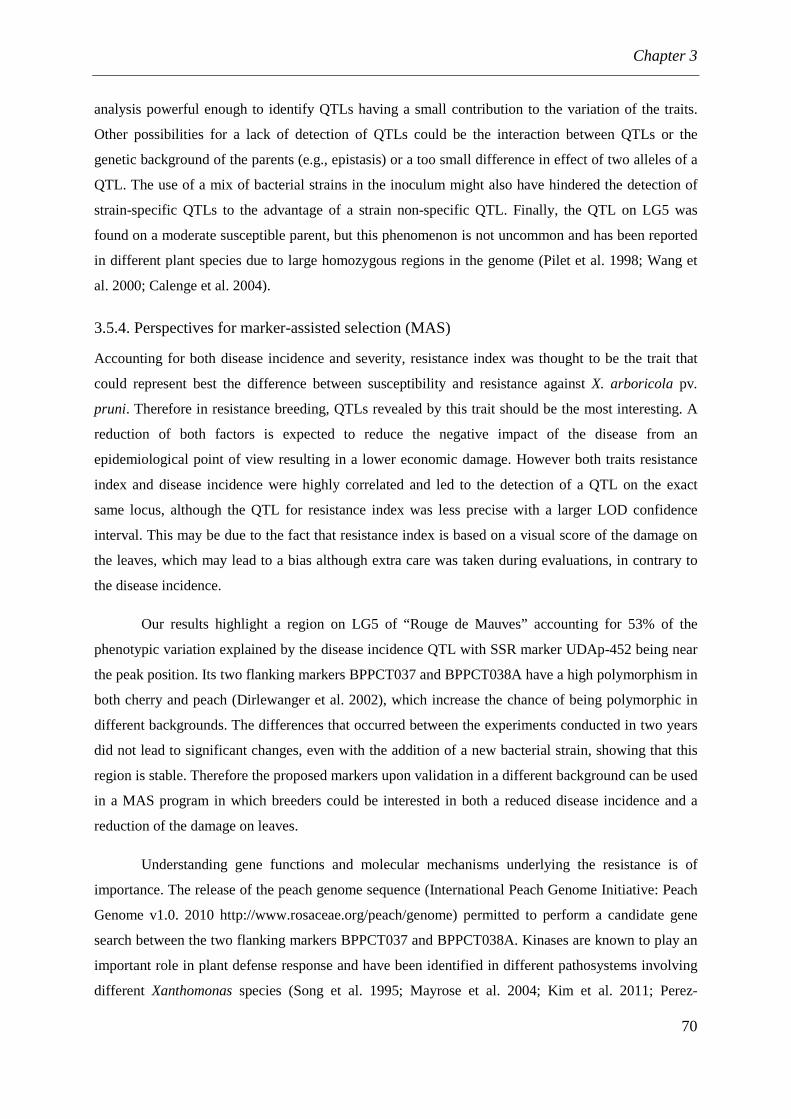
Chapter 3
70
analysis powerful enough to identify QTLs having a small contribution to the variation of the traits.
Other possibilities for a lack of detection of QTLs could be the interaction between QTLs or the
genetic background of the parents (e.g., epistasis) or a too small difference in effect of two alleles of a
QTL. The use of a mix of bacterial strains in the inoculum might also have hindered the detection of
strain-specific QTLs to the advantage of a strain non-specific QTL. Finally, the QTL on LG5 was
found on a moderate susceptible parent, but this phenomenon is not uncommon and has been reported
in different plant species due to large homozygous regions in the genome (Pilet et al. 1998; Wang et
al. 2000; Calenge et al. 2004).
3.5.4. Perspectives for marker-assisted selection (MAS)
Accounting for both disease incidence and severity, resistance index was thought to be the trait that
could represent best the difference between susceptibility and resistance against X. arboricola pv.
pruni. Therefore in resistance breeding, QTLs revealed by this trait should be the most interesting. A
reduction of both factors is expected to reduce the negative impact of the disease from an
epidemiological point of view resulting in a lower economic damage. However both traits resistance
index and disease incidence were highly correlated and led to the detection of a QTL on the exact
same locus, although the QTL for resistance index was less precise with a larger LOD confidence
interval. This may be due to the fact that resistance index is based on a visual score of the damage on
the leaves, which may lead to a bias although extra care was taken during evaluations, in contrary to
the disease incidence.
Our results highlight a region on LG5 of “Rouge de Mauves” accounting for 53% of the
phenotypic variation explained by the disease incidence QTL with SSR marker UDAp-452 being near
the peak position. Its two flanking markers BPPCT037 and BPPCT038A have a high polymorphism in
both cherry and peach (Dirlewanger et al. 2002), which increase the chance of being polymorphic in
different backgrounds. The differences that occurred between the experiments conducted in two years
did not lead to significant changes, even with the addition of a new bacterial strain, showing that this
region is stable. Therefore the proposed markers upon validation in a different background can be used
in a MAS program in which breeders could be interested in both a reduced disease incidence and a
reduction of the damage on leaves.
Understanding gene functions and molecular mechanisms underlying the resistance is of
importance. The release of the peach genome sequence (International Peach Genome Initiative: Peach
Genome v1.0. 2010 http://www.rosaceae.org/peach/genome) permitted to perform a candidate gene
search between the two flanking markers BPPCT037 and BPPCT038A. Kinases are known to play an
important role in plant defense response and have been identified in different pathosystems involving
different Xanthomonas species (Song et al. 1995; Mayrose et al. 2004; Kim et al. 2011; Perez-

Chapter 3
71
Quintero et al. 2012). Between the two flanking markers three putative genes encoding LRR receptor-
like serine/threonine kinases were found using the peach genome annotations; in addition two genes
encoding putative disease resistance proteins and one encoding a putative F-box/LRR-repeat protein
could be found in this region. Although peach and apricot genomes are highly syntenic and co-linear
(Dondini et al. 2007; Illa et al. 2009; Illa et al. 2011), these results have to be taken with care since
differences such as insertions, deletions or inversions between both genomes cannot be excluded.
Another approach to identify target genes involved in disease resistance could be the use of
transcriptomic tools available such as microarrays or RNA-seq (Martínez-Gómez et al. 2011) and to
consider pathogen virulence factors as related to plant interactions (Hajri et al. 2012).
Acknowledgements
This project was funded by the Swiss Secretariat for Education and Research (SBF COST C08.0124)
and was conducted within the European Science Foundation funded research network COST Action
873. We thank Dr. Jürg Frey for support in the laboratory, Rolf Blapp for the grafting of the material;
Dr. Fabio Rezzonico for his help with AFLPs; and Jürgen Krauss, Carmela Total, Perrine Ferrié and
Verena Knorst for technical support.

Chapter 3
72
3.6. References
Anonymous (2006) EPPO standards PM 7/64. Diagnostics Xanthomonas arboricola pv. pruni. Bull.
EPPO 36:129-133
Aranzana MJ, Garcia-Mas J, Carbó J (2002) Development and variability analysis of microsatellite
markers in peach. Plant Breed 121:87–92
Battilani P, Rossi V, Saccardi A (1999) Development of Xanthomonas arboricola pv. pruni epidemics
on peaches. J Plant Pathol 81:161-171
Boudon S, Manceau C, Notteghem JL (2005) Structure and origin of Xanthomonas arboricola pv.
pruni populations causing bacterial spot of stone fruit trees in Western Europe. Phytopathology
95:1081–1088
Calenge F, Faure A, Goerre M, Gebhardt C, van de Weg WE, Parisi L, Durel C-E (2004) Quantitative
Trait Loci (QTL) analysis reveals both broad-spectrum and isolate specific QTL for scab
resistance in an apple progeny challenged with eight isolates of Venturia inaequalis.
Phytopathology 94:370-379
Campoy J, Martínez-Gómez P, Ruiz D, Rees J, Celton J (2010) Developing microsatellite multiplex
and megaplex PCR systems for high-throughput characterization of breeding progenies and
linkage maps spanning the apricot (Prunus armeniaca L.) genome. Plant Mol Biol Rep 28:560-
568
Cipriani G, Lot G, Huang WG, Marrazzo M-T, Peterlunger E, Testolin R (1999) AC/GT and AG/CT
microsatellite repeats in peach [Prunus persica (L.) Batsch]: isolation, characterization and cross-
species amplification in Prunus. Theor Appl Genet 99:65-72
Civerolo EL, MJ Hatting (1993) Xanthomonas campestris pv. pruni: cause of Prunus bacterial spot.
In: Swings JG, Civerolo EJ (eds) Xanthomonas. Chapman and Hall, London, pp 60-64
Claverie M, Bosselut N, Lecouls AC, Voisin R, Poizat C, Dirlewanger E, Kleinhentz M, Lafargue B,
Laigret F, Esmenjaud D (2004) Location of independent root-knot nematode resistance genes in
plum and peach. Theor Appl Genet 108:765-773
Decroocq V, Fave MG, Hagen L, Bordenave L, Decroocq S (2003) Development and transferability of
apricot and grape EST microsatellite markers across taxa. Theor Appl Genet 106:912–922
Decroocq V, Foulongne M, Lambert P, Le Gall O, Mantin C, Pascal T, Schurdi-Levraud V, Kervella J
(2005) Analogues of virus resistance genes map to QTLs for resistance to sharka disease in
Prunus davidiana. Mol Genet Genomics 272:680-689
Dirlewanger E, Pascal T, Zuger C, Kervella J (1996) Analysis of molecular markers associated with
powdery mildew resistance genes in peach (Prunus persica (L.) Batsch) × Prunus davidiana
hybrids. Theor Appl Genet 93:909-919
Chapter 3
73
Dirlewanger E, Cosson P, Tavaud M, Aranzana MJ, Poizat C, Zanetto A, Arús P, Laigret F (2002)
Development of microsatellite markers in peach [Prunus persica (L) Batsch] and their use in
genetic diversity analysis in peach and sweet cherry (Prunus avium L). Theor Appl Genet
105:127–138
Dirlewanger E, Graziano E, Joobeur T, Garriga-Caldere F, Cosson P, Howad W, Arús P (2004a)
Comparative mapping and marker assisted selection in Rosaceae fruit crops. Proc Natl Acad Sci
USA 101:9891–9896
Dirlewanger E, Cosson P, Howad W, Capdeville G, Bosselut N, Claverie M, Voisin R, Poizat C,
Lafargue B, Baron O, Laigret F, Kleinhentz M, Arús P, Esmenjaud D (2004b) Microsatellite
genetic linkage maps of myrobalan plum and an almond-peach hybrid—location of root-knot
nematode resistance genes. Theor Appl Genet 109:827–838
Dirlewanger E, Cosson P, Boudehri K, Renaud C, Capdeville G, Tauzin Y, Laigret F, Moing A (2006)
Development of a second generation genetic linkage map for peach [Prunus persica (L.) Batsch]
and characterization of morphological traits affecting flower and fruit. Tree Genet Genomes 3:1–
13
Dondini L, Lain O, Geuna F, Banfi R, Gaiotti F, Tartarini S, Bassi D, Testolin R (2007) Development
of a new SSR-based linkage map in apricot and analysis of synteny with existing Prunus maps.
Tree Genet Genomes 3:239–249
Dondini L, Lain O, Vendramin V, Rizzo M, Vivoli D, Adami M, Guidarelli M, Gaiotti F, Palmisano
F, Bazzoni A, Boscia D, Geuna F, Tartarini S, Negri P, Castellano M, Savino V, Bassi D,
Testolin R (2010) Identification of QTL for resistance to plum pox virus strains M and D in Lito
and Harcot apricot cultivars. Mol Breed 27:289-299
du Plessis, HJ (1988) Differential virulence of Xanthomonas campestris pv. pruni to peach, plum, and
apricot cultivars. Phytopathology 78:1312-1315
Dunegan JC (1932) The bacterial spot disease of the peach and other stone fruits. US Dept Agr Tech
Bul 273, 53
Eduardo I, Pacheco I, Chietera G, Bassi D, Pozzi C, Rossini L, Vecchietti A (2011) QTL analysis of
fruit quality traits in two peach intraspecific populations and importance of maturity date
pleiotropic effect. Tree Genet Genomes 7:323-335
Esmenjaud D, Voisin R, van Ghelder C, Bosselut N, Lafargue B, Di Vito M, Dirlewanger E, Poessel
JL, Kleinhentz M (2009) Genetic dissection of resistance to root-knot nematodes Meloidogyne
spp. in plum, peach, almond, and apricot from various segregating interspecific Prunus progenies.
Tree Genet Genomes 5:279–289
Foulongne M, Pascal T, Pfeiffer F, Kervella J (2003) QTLs for powdery mildew resistance in peach ×
Prunus davidiana crosses: consistency across generations and environments. Mol Breed 12:33-50

Chapter 3
74
Garcin A, Rouzet J, Notteghem JL (2005) Xanthomonas des arbres fruitiers à noyau. CTIFL, Paris
Grant MR, Godiard L, Straube E, Ashfield T, Lewald J, Sattler A, Innes RW, Dangl JL (1995)
Structure of the Arabidopsis RPM1 gene enabling dual specificity disease resistance. Science
269:843–846
Habera L, Smith N, Donahoo R, Lamour K (2004) Use of a single primer to fluorescently label
selective amplified fragment length polymorphism reactions. BioTechniques 37:902-904
Hagen LS, Chaib J, Fady B, Decroocq V, Bouchet JP, Lambert P, Audergon JM (2004) Genomic and
cDNA microsatellites from apricot (Prunus armeniaca L.). Mol Ecol Notes 4:742-745
Hajri A, Pothier JF, Fischer-Le Saux M, Bonneau S, Poussier S, Boureau T, Duffy B, Manceau C
(2012) Type three effector gene distribution and sequence analysis provide new insights into the
pathogenicity of plant-pathogenic Xanthomonas arboricola. Appl Environ Microbiol 78:371-384
Hayden MJ, Nguyen TM, Waterman A, Chalmers KJ (2008) Multiplex-ready PCR: A new method for
multiplexed SSR and SNP genotyping. BMC Genomics 9
Howad W, Yamamoto T, Dirlewanger E, Testolin R, Cosson P, Cipriani G, Monforte AJ, Georgi L,
Abbott AG, Arús P (2005) Mapping with a few plants: Using selective mapping for microsatellite
saturation of the Prunus reference map. Genetics 171:1305-1309
Hurtado MA, Romero C, Vilanova S, Abbott AG, Llácer G, Badenes ML (2002) Genetic linkage maps
of two apricot cultivars (Prunus armeniaca L.), and mapping of PPV (sharka) resistance. Theor
Appl Genet 105:182-191
Illa E, Lambert P, Quilot B, Audergon JM, Dirlewanger E, Howad W, Dondini L, Tartarini S, Lain O,
Testolin R, Bassi D, Arús P (2009) Linkage map saturation, construction, and comparison in four
populations of Prunus. J Hortic Sci Biotech 84:168-175
Illa E, Sargeant DJ, Lopez E, Bushara J, Cestaro A, Pindo M, Cabrera A, Iezzoni A, Gardiner S,
Velasco R, Arús P, Chagne D, Troggio M (2011) Comparative analysis of rosaceous genomes
and the reconstruction of a putative ancestral genome for the family. BMC Evol Biol 11:9
Joobeur T, Viruel MA, de Vicente MC, Jauregui B, Ballester J, Dettori MT, Verde I, Truco MJ,
Messeguer R, Batlle, Suanzes M, Quarta R, Dirlewanger E, Arús P (1998) Construction of a
saturated linkage map for Prunus using an almond × peach F2 progeny. Theor Appl Genet
97:1034-1041
Keil HL, Fogle HW (1974) Orchard susceptibility of some apricot, peach, and plum cultivars and
selections to Xanthomonas pruni. Fruit Var J 28:16-19
Kim KH, Kang YJ, Kim DH, Yoon MY, Moon JK, Kim MY, Van K, Lee SH (2011) RNA-seq
analysis of a soybean near-isogenic line carrying bacterial leaf pustule-resistant and -susceptible
alleles. DNA Res 18:483-497

Chapter 3
75
Lalli DA, Decroocq V, Blenda AV, Schurdi-Levraud V, Garay L, Le Gall O, Damsteegt V, Reighard
GL, Abbott AG (2005) Identification and mapping of resistance gene analogs (RGAs) in Prunus:
a resistance map for Prunus. Theor Appl Genet 111:1504-1513
Lalli DA, Abbott AG, Zhebentyayeva T, Badenes M, Damsteegt V, Polák J, Krska B, Salava J (2008)
A genetic linkage map for an apricot (Prunus armeniaca L.) BC1 population mapping plum pox
virus resistance. Tree Genet Genomes 4:481-493
Lambert P, Hagen LS, Arús P, Audergon JM (2004) Genetic linkage maps of two apricot cultivars
(Prunus armeniaca L.) compared with the almond ‘Texas’ × peach ‘Earlygold’ reference map for
Prunus. Theor Appl Genet 108:1120-1130
Lambert P, Dicenta F, Rubio M, Audergon JM (2007) QTL analysis of resistance to sharka disease in
the apricot (Prunus armeniaca L.) ‘Polonais’ × ‘Stark Early Orange’ F1 progeny. Tree Genet
Genomes 3:299-309
Layne RE C (1991) ‘Harval’ Apricot. HortScience 26:424-425
Layne REC, Hunter DM (2003) AC ‘Harostar’ Apricot. HortScience 38:140-141
Le Lézec M, Lecomte P, Laurens F, Michelesi JC (1997) Sensibilité variétale au feu bactérien (1ière
partie). L’arboriculture fruitière 503:57-62
Lopes MS, Sefc KM, Laimer M, da Câmara Machodo A (2002) Identification of microsatellite loci in
apricot. Mol Ecol Notes 2:24 – 26
Martínez-Gómez P, Crisosto CH, Bonghi C, Rubio M (2011) New approaches to Prunus
transcriptome analysis. Genetica 139:755-769
Mayrose M, Bonshtien A, Sessa G (2004) LeMPK3 is a mitogen-activated protein kinase with dual
specificity induced during tomato defense and wounding responses. J Biol Chem 279:14819–
14827
Messina R, Lain O, Marrazzo MT, Cipriani G, Testolin R (2004) New set of microsatellite loci
isolated in apricot. Mol Ecol Notes 4:432–434
Mnejja M, Garcia-Mas J, Howad W, Badenes ML, Arús P (2004) Simple sequence repeat (SSR)
markers of Japanese plum (Prunus salicina Lindl.) are highly polymorphic and transferable to
peach and almond. Mol Ecol Notes 4:163–166
Olmstead JW, Sebolt AM, Cabrera A, Sooriyapathirana SS, Hammar S, Iriarte G, Wang D, Chen CY,
van der Knaap E, Iezzoni AF (2008) Construction of an intra-specific sweet cherry (Prunus avium
L.) genetic linkage map and synteny analysis with the Prunus reference map. Tree Genet
Genomes 4:897-910
Patocchi A, Fernández-Fernández F, Evans K, Gobbin D, Rezzonico F, Boudichevskaia A, Dunemann
F, Stankiewicz-Kosyl M, Mathis-Jeanneteau F, Durel CE, Gianfranceschi L, Costa F, Toller C,
Cova V, Mott D, Komjanc M, Barbaro E, Kodde L, Rikkerink E, Gessler C, van de Weg WE

Chapter 3
76
(2008) Development and test of 21 multiplex PCRs composed of SSRs spanning most of the
apple genome. Tree Genet Genomes 5:211-223
Perez-Quintero AL, Quintero A, Urrego O, Vanegas P, Lopez C (2012) Bioinformatic identification of
cassava miRNAs differentially expressed in response to infection by Xanthomonas axonopodis
pv. manihotis. BMC Plant Biology 12:29
Pilet ML, Delourme R, Foisset N, Renard M, (1998) Identification of loci contributing to quantitative
field resistance to blackleg disease, causal agent Leptosphaeria maculans (Desm) Ces. et de Not.,
in winter rapeseed (Brassica napus L). Theor Appl Genet 96:23–30
Pothier JF, Pelludat C, Bünter M, Genini M, Vogelsanger J, Holliger E, Duffy B (2010) First report of
the quarantine pathogen Xanthomonas arboricola pv. pruni on apricot and plum in Switzerland.
Plant Pathol 59:404
Pothier JF, Vorhölter F-J, Blom J, Goesmann A, Pühler A, Smits THM, Duffy B (2011a) The
ubiquitous plasmid pXap41 in the invasive phytopathogen Xanthomonas arboricola pv. pruni:
complete sequence and comparative genomic analysis. FEMS Microbiol Lett 323:52-60
Pothier JF, Pagani MC, Pelludat C, Ritchie DF, Duffy B (2011b) A duplex-PCR method for species-
and pathovar-level detection and identification of the quarantine plant pathogen Xanthomonas
arboricola pv. pruni. J Microbiol Methods 86:16-24
Pothier JF, Smits THM, Blom J, Vorhölter F-J, Goesmann A, Pühler A, Duffy B (2011c) Complete
genome sequence of the stone fruit pathogen Xanthomonas arboricola pv. pruni. Phytopathology
101:S144-S14
Ritchie DF (1995) Bacterial spot. In: Ogawa JM, Zehr EI, Bird GW, Ritchie DF, Uriu K, Uyemoto JK
(eds) Compendium of Stone Fruit Diseases. APS Press, St. Paul, MN
Schuelke M (2000) An economic method for the fluorescent labeling of PCR fragments. Nat
Biotechnol 18:233-234
Sicard O, Marandel G, Soriano JM, Lalli DA, Lambert P, Salava J, Badenes ML, Abbott AG,
Decroocq V (2008) Flanking the major Plum pox virus resistance locus in apricot with co-
dominant markers (SSRs) derived from candidate resistance genes. Tree Genet Genomes 4:359-
365
Smith EF (1903) Observation on a hitherto unreported bacterial disease, the cause of which enters the
plant through ordinary stomata. Science 17: 456-457
Socquet-Juglard D, Patocchi A, Pothier JF, Christen D, Duffy B (2012) Evaluation of Xanthomonas
arboricola pv. pruni inoculation techniques to screen for bacterial spot resistance in apricot. J
Plant Pathol, 94:S1.91-S1.96

Chapter 3
77
Song WY, Wang GL, Chen LL, Kim HS, Pi LY, Holsten T, Gardner J, Wang B, Zhai WX, Zhu LH,
Fauquet C, Ronald P (1995) A receptor kinase-like protein encoded by the rice disease resistance
gene, Xa21. Science 270:1804–1806
Soriano JM, Vera-Ruiz EM, Vilanova S, Martínez-Calvo J, Llácer G, Badenes ML, Romero C (2008)
Identification and mapping of a locus conferring Plum pox virus resistance in two apricot-
improved linkage maps. Tree Genet Genomes 4:391-402
Sosinski B, Gannavarapu M, Hager LD, Beck LE, King GJ, Ryder CD, Rajapakse S, Baird WV,
Ballard RE, Abbott AG (2000) Characterization of microsatellite markers in peach (Prunus
persica L. Batsch). Theor Appl Genet 101:421-428
Testolin R, Marrazzo MT, Cipriani G, Quarta R, Verde I, Dettori MT, Pancaldi M, Sansavini S (2000)
Microsatellite DNA in peach (Prunus persica L. Batsch) and its use in fingerprinting and testing
the genetic origin of cultivars. Genome 43:512-520
Topp BL, Sherman WB (1990) Sources of bacterial spot resistance in Japanese-type plum cultivars.
Fruit Var J 44:32–35
Topp BL, Sherman WB (1995) Spot resistance in leaves and stems measured by a selection index.
Acta Hort 403:47-50
van Ghelder C, Lafargue B, Dirlewanger E, Ouassa A, Voisin R, Polidori J, Kleinhentz M, Esmenjaud
D (2010) Characterization of the RMja gene for resistance to root-knot nematodes in almond:
spectrum, location, and interest for Prunus breeding. Tree Genet Genomes 6:503–511
van Ooijen JW (2004) MapQTL® 5.0, software for the mapping of quantitative trait loci in
experimental populations. Kyazma BV, Wageningen, The Netherlands
van Ooijen JW (2006) JoinMap® 4.0, Software for the calculation of genetic linkage maps in
experimental populations. Kyazma BV, Wageningen, The Netherlands
Vera Ruiz EM, Soriano JM, Romero C, Zhebentyayeva T, Terol J, Zuriaga E, Llácer G, Abbott AG
and Badenes ML (2011) Narrowing down the apricot Plum pox virus resistance locus and
comparative analysis with the peach genome syntenic region. Mol Plant Pathol 12:535-547
Vilanova S, Romero C, Abbott AG, Llácer G, Badenes ML (2003) An apricot (Prunus armeniaca L.)
F2 progeny linkage map based on SSR and AFLP markers, mapping plum pox virus resistance
and self-incompatibility traits. Theor Appl Genet 107:239-347
Vilanova S, Soriano JM, Lalli DA, Romero C, Abbott AG, Llácer G, Badenes ML (2006)
Development of SSR markers located in the G1 linkage group of apricot (Prunus armeniaca L.)
using a bacterial artificial chromosome library. Mol Ecol Notes 6:789-791
Viruel MA, Madur D, Dirlewanger E, Pascal T, Kervella J (1998) Mapping quantitative trait loci
controlling peach leaf curl resistance. Acta Hort 365:79-87

Chapter 3
78
Vos P, Hogers R, Bleeker M, Reijians M, Lee T, Hornes M, Frijters A, Pot J, Peleman J, Kuiper M,
Zaneau M (1995) AFLP: a new technique for DNA fingerprinting. Nucl Acids Res 23:4407-4414
Wang JF, Olivier J, Thoquet P, Mangin B, Sauviac L, Grimsley NH (2000) Resistance of tomato line
Hawaii 7996 to Ralstonia solanacearum Pss4 in Taiwan is controlled mainly by a major strain-
specific locus. Mol Plant Microbe Interact 13:6–13
Werner DJ, Ritchie DF, Cain DW, Zehr EI (1986) Susceptibility of peaches and nectarines, plant
introductions, and other Prunus species to bacterial spot. HortScience 21:127-130
Xiang Y, Cao Y, Xu C, Li X, Wang S (2006) Xa3, conferring resistance for rice bacterial blight and
encoding a receptor kinase-like protein, is the same as Xa26. Theor Appl Genet 113:1347–1355
Yamamoto T, Mochida K, Imai T, Shi Z, Ogiwara I, Hayashi T (2002) Microsatellite markers in peach
[Prunus persica (L.) Batsch] derived from an enriched genomic and cDNA libraries. Mol Ecol
Notes 2:298–301
Zaccardelli M, Malaguti S, Bazzi C (1998) Biological and epidemiological aspects of Xanthomonas
arboricola pv. pruni on peach in Italy. J Plant Pathol 80:125-132
Zhebentyayeva TN, Swire-Clark G, Georgi LL, Garay L, Jung S, Forrest S, Blenda AV, Blackmon B,
Mook J, Horn R, Howad W, Arús P, Main D, Tomkins JP, Sosinski B, Baird WV, Reighard GL,
Abbott AG (2008) A framework physical map for peach, a model Rosaceae species. Tree Genet
Genomes 4:745-756


Chapter 4
Mapping architectural, phenological and fruit quality QTLs in apricot
Published in: Molecular Plant Biology Reporter (2012)


Chapter 4
82
4.1. Abstract
The F1 population “Harostar” × “Rouge de Mauves” was used to perform a quantitative trait loci
(QTL) mapping for tree architecture traits (i.e., tree diameter, total branch number, tree shape); time to
initial reproductive bud break; and fruit quality traits (i.e., ground color, fruit form, soluble solid
content) using data collected from 2010 to 2012. For architectural traits, interval mapping detected
QTLs only in “Rouge de Mauves” on linkage group 1 for trunk diameter in 2010, on LG6 for total
branch number in 2010, and on LG1 and LG5 for tree shape for both years 2010 and 2011 combined.
QTLs were detected only in “Harostar” for time to initial reproductive bud break on LG1 and LG4 in
2011. For fruit quality traits, data were collected in 2011 and 2012. QTLs were identified on LG1 in
2011 and on LG4 in 2012 for soluble solid content, on LG3 for ground color in both years, on LG7
only in 2011, and on LG3 for fruit form in both years. The QTLs that we identified were compared to
those previously identified in other Prunus spp.
Keywords
Quantitative trait locus – Prunus armeniaca – tree architecture – time to reproductive bud break –
fruit quality, molecular breeding
Chapter 4
83
4.2. Introduction
Apricot (Prunus armeniaca L.) is, along with peach and plum, a major economically important Prunus
crop, with 3.8 million tons produced worldwide in 2009 (FAOSTAT 2010). Although apricot is
characterized by a non-surplus production, critical limitations exist along the supply chain, including
climate adaptation, irregular seasonal production, lack of resistant cultivars against pests and diseases,
and a rapid post-harvest ripening. Attention to a wide range of agronomic traits in apricot breeding
programs is required to satisfy and keep up with grower and consumer demands (Hormaza et al.
2007). Current breeding efforts and advances regarding disease resistance; adaptation to environment
(late frost susceptibility, extension of ripening time); tree architecture; and fruit-related traits
(productivity, quality, resistance to handling) are reviewed in Zhebentyayeva et al. (2012).
Tree growth, shape, and architecture have a direct influence on the training and pruning
methods, on thinning and harvesting management, and, consequently, on yield and fruit quality
(Laurens et al. 2000; Miller and Sorza 2010). A biomechanical model performed by Alméras et al.
(2004) revealed that not only the initial geometry, especially slenderness and inclination, but also the
distribution of the fruit load along the shoot are involved in the apricot branch form. However,
although some apricot cultivars are well characterized according to shoot slenderness and shoot
bending (Costes et al. 2006), the genetic determinism of tree shape has been barely studied yet (Bassi
and Audergon 2006). In peach production systems, several important growth traits have been found to
be under a single gene control (e.g., branch angle or pillar growth form; Scorza and Sherman 1996;
Sajer et al. 2012). The underlying genetics of complex tree architectural traits have been more
extensively characterized in apple, for which the quantitative trait loci (QTLs) for geometric and
topological traits were mapped (Liebhard et al. 2003; Kenis and Keulemans 2007; Segura et al. 2007).
Flowering time is another trait of importance in apricot production systems since spring frost
can significantly damage inflorescence buds and flowers, and consequently lead to an important yield
reduction, particularly in continental producing regions. In apricot, chilling temperatures have a direct
impact on the date of flowering, with late flowering varieties requiring more chilling units than early
flowering varieties (Couvillon and Erez 1985; Andrés and Durán 1999; Ruiz et al. 2007; Campoy et al.
2012). Studies on flowering time (expressed in Julian days) in apricot and peach have revealed that
this trait is quantitative. In the apricot cross “Z506-07”דCurrot”, a QTL for flowering time was
identified over 3 years of observation on LG5 by Campoy et al. (2011). In a backcross between peach
and Prunus davidiana, Quilot et al. (2004) mapped over 2 years two QTLs for blooming date on LG1
and LG2, and two other QTLs were mapped over only one year on LG5 and LG6. In peach, Verde et
al. (2002) consistently found a QTL for flowering time on LG4 over 5 years, and Fan et al. (2010)
mapped two major QTLs for blooming date on LG1 and LG7, which colocalized with major QTLs for

Chapter 4
84
chilling requirement. More recently, QTLs for flowering date were identified in the three species—
apricot, peach, and sweet cherry—on LG2, LG3, LG4, and LG7, with a major and stable QTL on LG4
in apricot (Dirlewanger et al. 2012). Candidate genes involved in chilling requirements for dormancy
release have been studied in peach (Leida et al. 2010, 2012a, b), while the gene ppLFL, which is a
LEAFY/FLORICAULA homolog, has been hypothesized to play a central role in peach flower
induction (An et al. 2012).
Fruit quality is defined by organoleptic characteristics with aroma, sugar and acidity levels,
and volatile compound contents; by physical characteristics with fruit size and color, firmness, texture,
and resistance to handling; and by nutritional properties related to the health values of some
components (Souty et al. 1990; Parolari et al. 1992). All these traits can be highly influenced by
climatic conditions, agricultural practices, and storage treatments, but are also dependent on the
genotype (Leccese et al. 2012). These traits are very often quantitative, and many genes can be
involved in the genetic determinism of fruit quality traits. QTLs involved in fruit quality, including
fruit weight, pH, titratable acidity, soluble solid contents (SSC), external color, and flesh color, were
found in peach (Dirlewanger et al. 1999; Etienne et al. 2002; Eduardo et al. 2011) and in the
interspecific cross between peach and P. davidiana (Quilot et al. 2004), recently reviewed by Infante
et al. (2011). Many candidate genes for fruit quality have been assigned to linkage groups in peach and
have been associated to QTLs (Etienne et al. 2002; Illa et al. 2011). In apricot, only Ruiz et al. (2010)
reported preliminary results on the identification of QTLs for fruit weight, ground color, stone weight,
sugars, acidity, and firmness in the two F1 populations, “Goldrich” × “Moniqui” and “Lito” ×
“BO81604311”.
After the development of an inoculation technique for Xanthomonas arboricola pv. pruni and
testing the technique on different apricot cultivars, we investigated the resistance against X. arboricola
pv. pruni in an apricot F1 progeny comprising 101 individuals that were derived from the cross of
“Harostar” × “Rouge de Mauves” (Socquet-Juglard et al. 2012a, b, Chapter 2 and 3). Both linkage
maps were constructed with a total of 81 microsatellite (SSR) markers and 136 amplified fragment
length polymorphism (AFLP) markers. The “Harostar” linkage map is composed of the expected eight
linkage groups and covers 553.6 cM; the linkage map of “Rouge de Mauves” is composed of nine
linkage groups with two fragments belonging to LG2 and covers in total 684 cM. In this study, a QTL
mapping in the same F1 population was performed for architectural habits, time to initial reproductive
bud break (IRB), and fruit quality traits. We report QTLs for traits observed in field conditions over
two consecutive years for architectural traits and fruit quality traits, and over one year for time to IRB.

Chapter 4
85
4.3. Material and Methods
4.3.1. Plant material
The apricot cultivars “Harostar” and “Rouge de Mauves” present differences in time to IRB,
“Harostar” being a late flowering cultivar and “Rouge de Mauves” a very late flowering cultivar
(Christen et al. 2006). Both cultivars widely contrast for their architecture, “Harostar” displaying a
fastigiate growth habit (Layne and Hunter 2003) whereas “Rouge de Mauves” displays a drooping
habit. “Harostar” produces fruits with a deep orange ground color, with crimson blush, and with high
sugar and acidity levels (Lichou et al. 2003), whereas “Rouge de Mauves” produces fruits with a pale
orange ground color, with few red punctuations, and with high sugar and acidity levels (D. Christen,
unpublished). In early 2009, 102 seedlings were grown in a nursery and planted in spring on their own
roots (4×1.70 m) in a field in Conthey, Valais, Switzerland. In order to study the tree architecture,
trees were not pruned. Orchards were traditionally conducted following the guidelines of the Swiss
integrated production and regularly irrigated by sprinklers. One tree died in 2009 and two died in
2010, resulting in a total of 101 and 99 individuals for assessments in 2010 and 2011, respectively.
4.3.2. Phenotyping
4.3.2.1. Tree architecture
All trees were observed during two consecutive years in February 2010 and 2011. The trait “shape”
was assessed according to the technical protocol for distinctness, uniformity, and stability tests of the
Community Plant Variety Office (CPVO 2012). The scale is comprised of six classes (1, fastigiate; 2,
upright; 3, upright to spreading; 4, spreading; 5, drooping and 6, weeping). Total branch number was
determined by counting long shoots and brindles of more than 10 cm; spurs were not taken into
account. The total branch number and trunk diameter at 50 cm from the soil permitted to calculate the
branch and diameter increments between 2010 and 2011. Trunk length was measured from the ground.
4.3.2.2. Phenology
Time to IRB was evaluated in 2011 every 2–3 days and expressed in Julian days from January 1st
according to the BBCH scale developed for stone fruits by Meier et al. (1994). This trait was
considered to correspond to a mark of 51 on the BBCH scale, when flower buds start to swell. Trees
without flowers were excluded from the analysis. Maturity date was also expressed in Julian days from
January 1st and corresponds to the date when half of the fruits of a tree were considered ripe and were
harvested.

Chapter 4
86
4.3.2.3. Fruit traits
In 2011 and 2012, fruit batches were picked several times every 2–3 days, when fruits were considered
as suitable for consumption and if enough fruits were available with the same maturity stage to
constitute one full batch. Each tree was harvested separately and the fruits grouped into eight fruits per
batch, with one to ten batches per tree. Skin color was measured with a Minolta chromameter CR-400
(Konica Minolta, Osaka, Japan). From the values obtained for a* (−a*, greenness; +a*, redness) and
b* (−b*, blueness; +b*, yellowness), the hue angle h° was determined according to McGuire (1992).
With the filtered juice obtained from the batch, the SSC was measured using an ATAGO digital
refractometer PR-1 (Atago, Tokyo, Japan). The SSC value was expressed in °Brix. Fruit form was
estimated as the ratio between fruit height and width. Firmness was measured with a Durofel device
with a 0.10-cm2 probe (Durofel, COPA-Technologie S.A./CTIFL). A titrimeter (Metrohm Titrino
719S, Herisau, Switzerland) was used to measure the titratable acidity. Five milliliters of filtered juice
were titrated with NaOH (0.1 mol/l) and the results were expressed in milliequivalent per liter. Fruits
and stones were weighed with a Mettler PE 360 Delta range balance (Mettler, Giessen, Germany),
while flesh mass was calculated by subtracting the fruit weight from the stone weight.
4.3.3. Linkage mapping and QTL analysis
All QTL analyses were carried out with MapQTL® v.5.0 (van Ooijen 2004). The permutation test
function (1,000 permutations) was used to calculate the logarithm of odds (LOD) score thresholds.
Genome-wide thresholds were determined between 2.1 and 2.5 depending on the traits; however, since
no QTL with a LOD score comprised in this interval was found, all QTLs with a LOD score above 2.5
were considered as significant. Kruskal–Wallis test (KW) and interval mapping (IM) were used for
QTL analysis. For the Kruskal–Wallis test, only regions with several markers having a minimum
significance linkage of P < 0.001 with the trait of interest were considered. Interactions between
different QTLs of the same trait were tested with the multiple QTL mapping (MQM) function when
the LOD scores of QTLs found by interval mapping exceeded the significant thresholds. The mapping
of the gene for time to IRB was performed with JoinMap 4.0 software (van Ooijen 2006), and the
locus found was excluded while performing the QTL analysis of all traits.
4.3.4. Statistical analysis
Data were checked for their distribution, and the results collected for fruits were subjected to an
analysis of variance (ANOVA) to test the genotype effect on fruit quality traits. ANOVA, statistical
analyses for Spearman correlations, and the associated P values were performed using the software
JMP® v.8.0 (SAS Institute Inc., Carey, NC, USA).

Chapter 4
87
4.4. Results
For the eight traits trunk length, maturity date, titratable acidity; stone, fruit and flesh weight, and
firmness, no QTL was identified by interval mapping in any parent. Variation of the data, correlations
obtained within architectural and fruit quality traits as well as the results of Kruskal-Wallis tests for
these traits are presented in the supplementary files (Table A.1, Table A.2, Table A.3, Table A.4 in
the Appendix).
4.4.1. Architectural traits
The F1 population greatly varied for the different architectural traits measured, with trunk diameters
ranging from 0.5 to 2.5 cm the first year and from 2.1 to 5.9 cm the second year (Table 4.1). Total
branch number also widely varied from 5 to 57 branches in year 2010 and from 9 to 101 branches in
year 2011. No weeping shape (class 6) was observed in the F1 population during both years of
observation, so the population varied from fastigiate (class 1) to drooping (class 5) shapes. Tree
diameter and total branch number were normally distributed, whereas skewed segregations toward the
fastigiate tree shapes were obtained in both years (Table 4.1).
Between-year correlations for trunk diameter, total branch number, and tree shape were
significant and ranged from 0.47 for trunk diameter to 0.60 for tree shape (Table A.2 in the
Appendix). In both years 2010 and 2011, trunk diameter was significantly linked to all other
architectural traits. A correlation depending on the years was found between tree shape and total
branch number, for which both traits were significantly linked in 2010, but not in 2011. Because tree
shape measured in 2010 and 2011 were highly correlated (Table A.2 in the Appendix), the data of
both years were pooled for further QTL analysis.
The Kruskal–Wallis analysis detected for all architectural traits, except trunk length, a
significant linkage (P < 0.001) to markers located on LG1 for “Rouge de Mauves” in both years
(Table 4.2). Both Kruskal–Wallis and interval mapping tests detected a significant QTL for this
parent, with a LOD score of 3.1 (14.5 % of the phenotypic variation explained, PVE) on LG1 for the
trunk diameter in 2010, but no association was found in year 2011 (Table 4.2; Fig. 4.1). Two QTLs
for tree shape were mapped: one on LG1 (LOD = 3.3, PVE = 16.7 %) and one on LG5 (LOD = 4.3,
PVE = 22.7 %). Finally, one QTL on LG6 was found for total branch number in 2010 (LOD = 2.9,
PVE = 14.6 %), but in 2011, only markers in this region were significantly linked by the Kruskal–
Wallis test.

Chapter 4
88
Table 4.1. Mean, minimum, maximum and type of distribution of traits observed in the F1 population
subdivided by year of observation
F1 Harostar Rouge de Mauves
Trait year na Mean Min Max Mean Min Max Mean Min Max Distribution
Architecture
Trunk diameter b 2010 101 1.7 0.5 2.5 normal 2011 99 4.2 2.1 5.9 normal
Trunk diameter difference b - 99 2.5 0.5 3.8 normal Total branch number 2010 101 20.8 5 57 normal
2011 99 40.3 9 101 normal Total branch difference - 99 20.4 5 80 normal
Tree shapec 2010 101 2.6 1 5 skewed towards fastigiate shape
2011 99 2.5 1 5 skewed towards fastigiate shape
Phenology
Time to IRBd 2011 96 64.5 55 78 bimodal
Fruit quality
SSCe 2011 47 15.1 10.2 19.5 normal 2012 70 13.6 6.2 19.1 15.7 15.3 16.3 10.6 9.6 11.4 normal
Ground colorf 2011 47 70.9 62.3 79.4 normal 2012 70 68.8 61.7 77.3 67.1 62.3 73.4 78.9 63.1 87.9 normal
Fruit formg 2011 47 1.09 0.98 1.26 normal 2012 70 1.14 0.96 1.38 1.15 1.03 1.25 1.05 0.92 1.16 normal
a Number of genotypes observed for each trait b In cm c no genotype in class 6 (weeping) was observed d In Julian days from January 1st e In °Brix f Hue angle as determined by h° = arc tan(b*/a*). 0° = red/purple, 90° = yellow, 180° = bluish/green, 270° = blue according to McGuire (1992) g Ratio height/width
Concerning “Harostar”, the Kruskal–Wallis test identified SSR marker UDAp-428A on LG2
as most significantly linked to trunk diameter in 2011. The Kruskal–Wallis test additionally identified
SSR marker UDAp-487 on LG1 as linked to tree shape. Interval mapping did not confirm any QTL
found by Kruskal–Wallis in “Harostar”.
4.4.2. Phenology
The F1 population varied greatly for time to IRB, with a difference of 23 days between the first and
last tree which produced flower buds and ranged from February 24th to March 19th. A bimodal
distribution was observed for this trait (Table 4.1, Fig. 4.2). This distribution allowed us to divide the
population into two classes (fast and slow time to IRB) and to map the time to IRB as a qualitative

Chapter 4
89
trait. The group “fast IRB” is composed of plants having a time to IRB shorter than 65 days, while the
“slow IRB” group is composed of plants with a time to IRB greater than 69 days. Five progeny plants
identified with the frequency distribution in between the two groups were excluded from the single
gene mapping since it was not clear to which group the genotypes had to be assigned. This trait was
mapped on LG1 of “Harostar” at about 3.5 cM above the SSR marker PaCITA7 (Ha1IRB, Fig. 4.1).
In “Rouge de Mauves”, the Kruskal–Wallis test identified one linkage group, LG7, with SSR
UDAp-407 most significantly linked to time to IRB. In “Harostar”, when considering time to IRB as a
quantitative trait, both Kruskal–Wallis and interval mapping tests identified two QTLs: one on LG1
(marker UDAp-414) close to the locus identified by single gene mapping accounting for 30.3 % of the
PVE (LOD = 6.5) and the second one on LG4 accounting for 14.1 % of the PVE (LOD = 3.1, Table
4.2, Fig. 4.1). The MQM analysis performed did not permit identifying any multiple linked QTL.
4.4.3. Fruit quality traits
Forty-seven trees in 2011 and 70 in 2012 produced a sufficient number of fruits to perform statistical
analysis for fruit quality traits. All traits related to fruit quality were normally distributed (Table 4.1),
and ANOVA revealed highly significant genotype effects for all those traits (P < 0.0001, Table A.5 in
the Appendix). An important variability in SSC was observed, which ranged from 10.2 to 19.5°Brix
in 2011 and from 6.2 to 19.1 in 2012 (Table 4.1). Hue angle, which was the value used for ground
color, also greatly varied in orange tones from 62.3° to 79.4° in 2011 and from 61.7° to 77.3° in 2012.
Fruit form expressed as the ratio between height and width ranged from round fruits (0.98) to a more
cylindrical form (1.26) in 2011 and from 0.96 to 1.38 in 2012. High correlations among years for
ground color, fruit form, stone weight, and titratable acidity were found, ranging from 0.51 for
titratable acidity to 0.70 for ground color, whereas SSC, firmness, and fruit and flesh weights were not
correlated among years (Table A.3 in the Appendix). For “Rouge de Mauves”, the Kruskal–Wallis
test identified in 2011 marker UDAp-496 on LG3 as linked to SSC; two markers, E13-M18-252 and
E13-M12-103, as linked to ground color on LG3 and LG7, respectively; and two AFLP markers, E12-
M12-342 and E13-M13-349, as linked to fruit form on LG1 and LG5, respectively. No QTL was
found at a genome-wide significance by interval mapping for “Rouge de Mauves” in 2011. In 2012,
both Kruskal–Wallis and interval mapping tests identified one QTL for SSC on LG4 accounting for
16.8 % of the PVE (LOD = 2.7) and one QTL for ground color on LG3 accounting for 18.9 % of the
PVE (LOD = 2.8; Table 4.2, Fig. 4.1).

Table 4.2. Significant QTLs for tree architecture, phenology and fruit quality traits detected by Kruskal-Wallis test and interval mapping (IM). Kruskal-Wallis
test indicate only the marker the most highly significantly linked to the trait
Harostar Rouge de Mauves
Traits LG positionb markerc KWd LODe explf Allele
sizeg
Allele effectg
LG positionb markerc KWd LODe expl.f Allele
sizeg
Allele effectg (IM) (PVE) (IM) (PVE)
0 1 0 1 0 1 0 1
Architecture
Trunk diameter 2010
LG1 23.5 PaCITA5 ***** 3.1 14.5 137 214
1.5 1.8
LG1 135.3 BPPCT011 ***
0 196
1.6 1.8
Trunk diameter 2011 LG2 13.4 UDAp-428A ****
123 121
3.9 4.4
LG1 99.3 E13-M12-201 ***
4 4.3 Total branch number 2010
LG1 77.2 E13-M12-107 ***
18 23
LG6 37.8 UDAp-492 ***** 2.9 14.6 192 214
16 24
Total branch number 2011
LG1 99.3 E13-M12-201 ****
35 45
LG6 48.1 E13-M13-414 ****
35 44
Tree shape, 2011/2012 LG1 100.1 UDAp-487 ***
130 179
1.6 1.94
LG1 14.1 E13-M13-193 ***** 3.3 16.7
1.8 2.7
LG1 150.9 E13-M18-220 ****
2.6 1.9
LG5 37.8 E13-M13-439 ***** 4.3 22.7
2.7 1.9
Phenology
Time to IRB 2011 LG1 60.8 UDAp-414 ***** 6.5 30.3 176 0
61 67.5
LG7 41.1 UDAp-407 ****
194 176
62.3 66.5
LG4 8.6 PaCITA25 ***** 3.1 14.1 217 216
62 66.5
Single gene mapping IRB LG1 72.3 IRB
5.0h
59 70.5
Fruit quality
SSC 2011 LG1 17.3 UDAp-415 ***** 3.1 26 164 0
15 16.7
LG3 54.9 UDAp-496 ***
0 190
14.2 15.9
SSC 2012 LG4 28.7 E13-M13-134 3.9 24.7
13 14.7
LG4 91.3 E13-M13-353 ***** 2.7 16.8
12.9 14
Ground color 2011 LG3 35.9 E13-M18-296 ***** 6.7 50.9
73 68.1
LG3 59 E13-M18-252 ****
68.6 72.2
LG7 1.5 E13-M12-144 ***** 3.1 26.8
69 72.9
LG7 10.5 E13-M12-103 ***
69.9 72.2
Ground color 2012 LG3 55 E12-M13-70 ***** 9.8 51.5
65 72.7
LG3 34.35 UDAp-446 ***** 2.8 18.9
66.8 70.9
LG7 3.9 E13-M18-249 *****
66 71.8
Fruit form 2011 LG3 26.2 E13-M18-68 ***** 4.4 35.7
1.1 1.13
LG1 32.2 E12-M12-342 ****
1.07 1.13
LG5 30.8 E13-M13-349 ****
1.06 1.12
Fruit form 2012 LG3 64.09 E13-M18-200 ***** 3.5 20.7 1.1 1.17

Chapter 4
91
� Kruskal–Wallis test indicates only the marker that most highly significantly linked to the trait LG linkage group
a Location (in cM) of the QTL peak determined by interval mapping (not of the marker closest to the peak) or, in case interval mapping did not find a significant QTL, the location of the marker linked to the trait by the Kruskal–Wallis test. The most significantly linked marker per trait is reported only if other markers in the same region were also significantly linked to the same trait b Marker information is available in Socquet-Juglard et al. (2012, Chapter 3) c P value obtained by Kruskal–Wallis test: ***P < 0.005, ****P < 0.001, ***** P < 0.0001 d LOD score determined by interval mapping e Phenotypic variance explained by the peak of the QTL (in percent) f Segregating allele scored and mean value obtained for the progeny possessing either the “0” or “1” allele. For AFLPs, allele “1” corresponds to the size of the amplified fragment g QTLs identified with both years’ datasets combined h Maximal LOD to which IRB was mapped at this position
Concerning “Harostar”, in 2011, the Kruskal–Wallis and interval mapping both identified the
same regions involved in SSC, ground color, and fruit form (Table 4.2, Fig. 4.1). One QTL on LG1
was associated with SSC and explained 26 % of the PVE (LOD = 3.1). Two QTLs were mapped for
ground color on LG3 and LG7, explaining 50.9 and 26.8 % of the PVE (with LOD scores of 6.7 and
3.1, respectively). Finally, one QTL was identified on LG3 for fruit form and explained 35.7 % of the
PVE (LOD = 4.4). In 2012, a QTL for SSC accounting for 24.7 % of the PVE (LOD = 3.9) was
mapped on LG4, one QTL for fruit form accounting for 20.7 % of the PVE (LOD = 3.5) was identified
on LG3, and one major QTL on LG3 was detected for ground color in a region close to the one found
in 2011 and accounted for 51.5 % of the PVE (LOD = 9.8). The QTL found for ground color on LG7
in 2011 was not detected by interval mapping in 2012, but markers in the exact same region were
significantly linked by the Kruskal–Wallis test to the trait. MQM mapping did not reveal any multiple
linked QTL.

Chapter 4
92
Fig. 4.1. Location of QTLs determined by interval mapping controlling architectural, phenologic and
fruit quality traits in the F1 population “Harostar” x “Rouge de Mauves”. Only linkage groups for
which QTLs were detected are represented. The names of the linkage groups (LG) correspond to the
parents “Harostar” (Ha) and “Rouge de Mauves” (RM), and these LG are numbered according to
current Prunus linkage mapping nomenclature. Genetic distances are shown on the left of the linkage
maps and names of the markers are indicated on the right. Microsatellite markers are indicated in bold.
Markers showing segregation distortion are indicated by asterisks: significant distortion at P < 0.05,
** P < 0.01, *** P < 0.005 and **** P < 0.001. QTLs are represented alongside the right of the
corresponding linkage groups. Striped boxes indicate architectural QTLs, black boxes indicate QTLs
for phenology and white boxes indicate QTLs for fruit quality. The LOD scores are indicated after
abbreviations of corresponding traits as trunk diameter (TD), total branch number (TB), tree shape
(Sh), time to IRB (IRB), soluble solid content (SSC), ground color (GC) and fruit form (FF).
Phenotypic variation explained is provided in brackets. 10, 11, and 12 indicate the years 2010, 2011,
and 2012, respectively. Time to IRB (IRB) locus is underlined and is indicated in Ha1IRB. Confidence
intervals of 2-LOD are represented with lines. Boxes represent a 1-LOD confidence interval. When the
LOD score was < 3 only the 1-LOD confidence interval was drawn

Chapter 4
93
Fig. 4.2. Frequency distribution of the time to IRB in 2011 in the “Harostar” x “Rouge de
Mauves” population
4.5. Discussion
Despite an important research in Prunus for architectural traits, fruit quality traits, and flowering time,
information about the genetic determinism of these traits in apricot is scarce. In peach, many
architectural traits (bushy, brachytic dwarf, pillar, compact shape, and weeping shape) are controlled
by single genes (Lammerts 1945; Mehlenbacher and Scorza 1986; Chaparro et al. 1994; Monet et al.
1996), and their effects are well characterized (Scorza 2002; Werner and Chaparro 2005); however, to
our knowledge, only the recessive gene br controlling pillar growth has been mapped on LG2 (Sajer et
al. 2012). The data obtained for tree shape permitted identifying in our population different genomic
regions linked to more fastigiate or more drooping architectural types. Because trees did not produce
any fruit in 2009 and 2010, tree shape was not influenced by the load of the fruits, resulting, as
expected, in high correlations obtained between 2010 and 2011 for this trait. This allowed the pooling
of the data before performing a QTL analysis in order to reduce the environmental effect and evaluator
bias.
Two QTLs were mapped in “Rouge de Mauves” for tree shape: one on LG1 and one on LG5.
The shape of the trees possessing the combination of the 2 alleles for drooping shape (allele “1” of
E13-M13-193 on LG1 and allele “0” of E13-M13-439 on LG5; Table 4.2) was significantly more
drooped (mean value of 3.2) than the shape of the trees possessing only one of the alleles for drooping
shape (mean value of 2.7). Inversely the shape of the trees possessing the combination of the 2 alleles
for fastigiate shape (allele “0” of E13-M13-193 and allele “1” of E13-M13-439) was also significantly
more fastigiate (mean value of 1.6) than the shape of trees possessing only one of the alleles for
fastigiate shape (mean values of 1.8 and 1.9). The two intermediate combinations gave intermediate
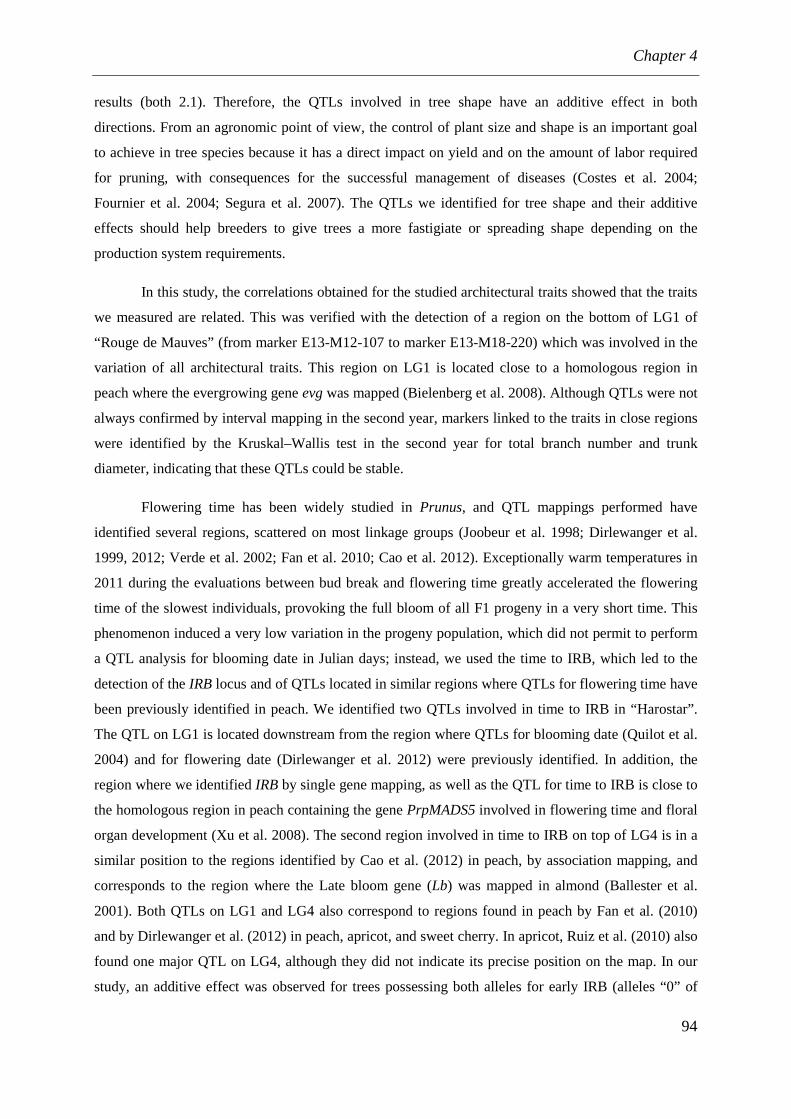
Chapter 4
94
results (both 2.1). Therefore, the QTLs involved in tree shape have an additive effect in both
directions. From an agronomic point of view, the control of plant size and shape is an important goal
to achieve in tree species because it has a direct impact on yield and on the amount of labor required
for pruning, with consequences for the successful management of diseases (Costes et al. 2004;
Fournier et al. 2004; Segura et al. 2007). The QTLs we identified for tree shape and their additive
effects should help breeders to give trees a more fastigiate or spreading shape depending on the
production system requirements.
In this study, the correlations obtained for the studied architectural traits showed that the traits
we measured are related. This was verified with the detection of a region on the bottom of LG1 of
“Rouge de Mauves” (from marker E13-M12-107 to marker E13-M18-220) which was involved in the
variation of all architectural traits. This region on LG1 is located close to a homologous region in
peach where the evergrowing gene evg was mapped (Bielenberg et al. 2008). Although QTLs were not
always confirmed by interval mapping in the second year, markers linked to the traits in close regions
were identified by the Kruskal–Wallis test in the second year for total branch number and trunk
diameter, indicating that these QTLs could be stable.
Flowering time has been widely studied in Prunus, and QTL mappings performed have
identified several regions, scattered on most linkage groups (Joobeur et al. 1998; Dirlewanger et al.
1999, 2012; Verde et al. 2002; Fan et al. 2010; Cao et al. 2012). Exceptionally warm temperatures in
2011 during the evaluations between bud break and flowering time greatly accelerated the flowering
time of the slowest individuals, provoking the full bloom of all F1 progeny in a very short time. This
phenomenon induced a very low variation in the progeny population, which did not permit to perform
a QTL analysis for blooming date in Julian days; instead, we used the time to IRB, which led to the
detection of the IRB locus and of QTLs located in similar regions where QTLs for flowering time have
been previously identified in peach. We identified two QTLs involved in time to IRB in “Harostar”.
The QTL on LG1 is located downstream from the region where QTLs for blooming date (Quilot et al.
2004) and for flowering date (Dirlewanger et al. 2012) were previously identified. In addition, the
region where we identified IRB by single gene mapping, as well as the QTL for time to IRB is close to
the homologous region in peach containing the gene PrpMADS5 involved in flowering time and floral
organ development (Xu et al. 2008). The second region involved in time to IRB on top of LG4 is in a
similar position to the regions identified by Cao et al. (2012) in peach, by association mapping, and
corresponds to the region where the Late bloom gene (Lb) was mapped in almond (Ballester et al.
2001). Both QTLs on LG1 and LG4 also correspond to regions found in peach by Fan et al. (2010)
and by Dirlewanger et al. (2012) in peach, apricot, and sweet cherry. In apricot, Ruiz et al. (2010) also
found one major QTL on LG4, although they did not indicate its precise position on the map. In our
study, an additive effect was observed for trees possessing both alleles for early IRB (alleles “0” of

Chapter 4
95
markers UDAp-414 and PaCITA25) or late IRB (alleles “1” of the same markers), with IRB averages
of 59 or 69 days, respectively. Trees with intermediate allele combination (early/late or late/early) had
a time to IRB of 63–65 days. The difference of pyramiding the two alleles inducing early or later IRB
compared to the presence of only one of these alleles is only approximately two days. This difference
looks rather small to be considered by breeders. The IRB locus, identified by single gene mapping, has
a very similar effect (59.2 vs. 70.5 days) to the combination of the two early or late alleles of the QTLs
for time to IRB (Table 4.2). The marker closest to the IRB locus is the SSR marker PaCITA7 at 3.5
cM. The alleles of this marker associated to early and late IRB have a size of 213 bp for early IRB and
196 bp for late IRB. Since this marker is an SSR and the effects are similar to those obtained by
pyramiding both QTLs, we advise using this marker for the selection of early or late IRB genotypes.
However, marker PaCITA7 cannot be used select for plants with delayed or fasten ripening dates since
no correlation was found between time to IRB and the maturity date in our study (data not shown), in
accordance with results previously observed in peach (Quilot et al. 2004; Layne and Bassi 2008; Cao
et al. 2012).
Marker-assisted selection for fruit quality traits represents a very cost-effective technique to
discard at a very early stage genotypes for which fruit qualities do not meet grower and consumer
expectations. When price is not taken into account, fruit size, shape, and skin color are key factors that
will determine the purchase choice made by consumers (Moreau-Rio and Roty 1998; Moreau-Rio
2006). In addition, consumers prefer apricot fruits with a high sugar content, over 12°Brix (Azodanlou
et al. 2003), and this characteristic by far prevails over other criteria such as “juicy”, “melting”, or
“acidulous” (Moreau-Rio 2006). The large variability of soluble solid contents (SSC) observed in our
F1 progeny (Table 4.1) allowed the identification of a QTL on LG1 in 2011 and on LG4 in 2012. In
peach, significant year effects were previously reported (Brooks et al. 1993; Dirlewanger et al. 1999;
Cantìn et al. 2009), and QTLs for SSC have been identified on LG2, LG3, LG4, and LG6
(Dirlewanger et al. 1999; Eduardo et al. 2011). Similarly, in our study, this trait did not correlate
among years, and we could consequently not confirm the QTLs. The lack of correlation could be due
to the differences in climate between years or to a different fruit load on the trees (as hypothesized by
Cantìn et al. 2009).
Although consumers prefer fairly round fruits (Moreau-Rio 2006), fruit shape has not
previously been an important criterion of study in apricot as it has been in peach breeding. A QTL for
fruit shape was mapped on LG3 in 2011 and was detected in 2012 in a close region. To our
knowledge, this would be the first report of the identification of a QTL for fruit shape in apricot.
Concerning the trait “ground color”, two QTLs were identified on LG3 and LG7 in 2011 and were
confirmed in 2012 by interval mapping for the first and by Kruskal–Wallis test for the second. When
scored as a qualitative trait, the Sc locus for red or green color has been mapped in peach on LG6

Chapter 4
96
(Yamamoto et al. 2001; Dirlewanger et al. 2004), and QTLs with a low repeatability over 2 years of
observation were mapped on LG3, LG6, and LG7 by Eduardo et al. (2011), whereas Dirlewanger et al.
(1999) did not find any QTL for skin color. In apricot, Ruiz et al. (2010) identified QTLs on LG2,
LG3, and LG6 for ground color. Our results are in agreement with Ruiz and Egea (2008) who
hypothesized that apricot skin color could have an important genetic determinism since year-by-year
differences were not observed during their 2 years of observations. With the dataset of 2011, when
combining both alleles for a more yellow/orange color (allele “0” of marker E13-M18-296 on LG3
and allele “1” of marker E13-M12-144 on LG7; Table 4.2) or for a more orange/red tone (allele “1” of
marker E13-M18-296 and allele “0” of marker E13-M12-144), no significant difference in hue angle
was observed (73.8 and 67.9, respectively), with values similar to the effect of an allele alone
(approximately 73° for yellow tones and 68° for red tones; Table 4.2). This shows that these QTLs
have no additive effects. Ruiz et al. (2005) showed that there was a linear correlation between hue
angle and the carotenoid content of the fruits measured by HPLC. Consequently, with the QTLs
identified for ground color, breeders could have an interesting tool for the selection of fruits with both
higher nutritional properties and a more orange color.
Additional traits were scored in our population. For architectural traits, trunk length was
measured and was correlated with other architectural traits for which QTLs were identified (Table A.2
in the Appendix). For fruit quality traits, stone mass, fruit mass, flesh mass, titratable acidity, and
firmness were measured in both years (Table A.1 in the Appendix). Although all these architectural
and fruit quality traits greatly varied in our progeny population during both years of observation, the
interval mapping performed did not permit to identify any QTL linked to one of these traits; however,
markers were found to be linked with these traits only by the Kruskal–Wallis test (Table A.4 in the
Appendix). The significant genotype effect for fruit quality traits indicates that there is a possibility to
breed for an increased fruit quality (Table A.5 in the Appendix). A too small population size,
especially for the fruit quality traits, could explain why we did not detect any QTL for these traits. In
addition, if both alleles of one parent have a similar contribution to a trait, no QTL can be detected.
In this study, several QTLs were identified over 1 year for phenology and over 2 years for
architectural and fruit quality traits. QTLs identified for the same or similar traits as the ones
previously described in peach were often detected in regions comparable to the ones identified in
peach by other authors; this reflects the high synteny within the Prunus species and between peach and
apricot, in particular.

Chapter 4
97
Acknowledgements
This project was funded by the Swiss Secretariat for Education and Research (SBF COST C08.0124)
and was conducted within the European Science Foundation funded research network COST Action
873. Patrick Magniant, Vincent Nussbaum, Rayan Mac Nulty and Xavier Pousse are gratefully
acknowledged for their help in the field and laboratory experiments.

Chapter 4
98
4.6. References
Alméras T, Costes E, Sales JC (2004) Identification of biomechanical factors involved in stem shape
variability between apricot tree varieties. Ann Bot 93: 455– 468
An L, Lei H, Shen X, Li T (2012) Identification and characterization of PpLFL, a homolog of
FLORICAULA/LEAFY in peach (Prunus persica). Plant Mol Biol Rep. doi:10.1007/s11105-012-
0459-x
Andrés MV, Durán JM (1999) Cold and heat requirements of the apricot (Prunus armeniaca L.) tree. J
Hortic Sci Biotechnol 74:757-761
Azodanlou R, Darbellay C, Luisier JL, Villettaz JC, Amadò R (2003) Development of a model for
quality assessment of tomatoes and apricots. Food Sci Technol 36:223–233
Ballester J, Socias I, Company R, Arús P, de Vicente MC (2001) Genetic mapping of a major gene
delaying blooming time in almond. Plant Breed 120:268–270
Bassi D, Audergon JM (2006) Apricot breeding: update and perspectives. Acta Hort 701:279–294
Bielenberg DG, Wang Y, Li ZG, Zhebentyayeva T, Fan SH, Reighard GL, Scorza R, Abbott AG
(2008) Sequencing and annotation of the evergrowing locus in peach [Prunus persica (L.)
Batsch] reveals a cluster of six MADS-box transcription factors as candidate genes for regulation
of terminal bud formation. Tree Genet Genomes 4:495–507
Brooks SJ, Moore JN, Murphy JB (1993) Quantitative and qualitative changes in sugar content of
peach genotypes (Prunus persica (L.) Batsch). J Am Soc Hort Sci 118:97–100 604
Campoy JA, Ruiz D, Egea J, Rees DJG, Ceston JM, Martínez-Gómez P (2011) Inheritance of
flowering time in apricot (Prunus armeniaca L.) and analysis of linked Quantitative Trait Loci
(QTLs) using Simple Sequence Repeat (SSR) markers. Plant Mol Biol Rep 29:404-410
Campoy JA, Ruiz D, Allderman L, Cook N, Egea J (2012) The fulfillment of chilling requirements
and the adaptation of apricot (Prunus armeniaca L.) in warm winter climates: an approach in
Murcia (Spain) and the Western Cape (South Africa). Eur J Agron 37:43–55
Cantìn CM, Gogorcena Y, Moreno MÀ (2009) Analysis of phenotypic variation of sugar profile in
different peach and nectarine (Prunus persica (L.) Batsch) breeding progenies. J Sci Food Agric
89:1909–1917
Cao K, Wang L, Zhu G, Fang W, Chen C, Luo J (2012) Genetic diversity, linkage disequilibrium, and
association mapping analyses of peach (Prunus persica) landraces in China. Tree Genet
Genomes, doi:10.1007/s11295-012-0477-8
Chaparro JX, Werner DJ, O’Malley D, Sederoff RR (1994) Targeted mapping and linkage analysis of
morphological isozyme, and RAPD markers in peach. Theor Appl Genet 87:805–815

Chapter 4
99
Christen D, Ladner J, Monney P, Zürcher M, Rossier J (2006) Choix de variétés et de porte-greffes
dans la production d’abricots, de pêches et de nectarines. Commission professionnelle pour
l’examen des variétés de fruits, pp 7-28
Costes E, Lauri PE, Laurens F, Moutier N, Belouin A, Delort F, Legave JM, Regnard JL (2004)
Morphological and architectural traits on fruit trees which could be relevant for genetic studies: a
review. Acta Hort 663:349-356
Costes E, Lauri PE, Regnard JL (2006) Analyzing fruit tree architecture: implications for tree
management and fruit production. In: Janick J (ed) Horticultural reviews, vol 32. John Wiley and
Sons, New York, pp 1-61
Couvillon GA, Erez A (1985) Influence of prolonged exposure to chilling temperatures on bud break
and heat requirement for bloom of several fruit species. J Am Soc Hort Sci 110:47-50
CPVO (2012) Protocol for distinctness, uniformity and stability tests.
http://www.cpvo.europa.eu/main/en
Dirlewanger E, Moing A, Rothan C, Svanella L, Pronier V, Guye A, Plomion C, Monet R (1999)
Mapping QTLs controlling fruit quality in peach Prunus persica L. Batsch. Theor Appl Genet
98:18-31
Dirlewanger E, Graziano E, Joobeur T, Garriga-Caldere F, Cosson P, Howad W, Arús P (2004)
Comparative mapping and marker assisted selection in Rosaceae fruit crops. Proc Natl Acad Sci
USA 101:9891–9896
Dirlewanger E, Quero-García J, Le Dantec L, Lambert P, Ruiz D, Dondini L, Illa E, Quilot-Turion B,
Audergon JM, Tartarini S, Letourmy P, Arús P (2012) Comparison of the genetic determinism of
two key phenological traits, flowering and maturity dates, in three Prunus species: peach, apricot
and sweet cherry. Heredity 00:1–13
Eduardo I, Pacheco I, Chietera G, Bassi D, Pozzi C, Vecchietti A, Rossini L (2011) QTL analysis of
fruit quality traits in two peach intraspecific populations and importance of maturity date
pleiotropic effect. Tree Genet Genomes 7:323-335
Etienne C, Rothan C, Moing A, Plomion C, Bodenes C, Svanella-Dumas L, Cosson P, Pronier V,
Monet R, Dirlewanger E (2002) Candidate genes and QTLs for sugar and organic acid content in
peach (Prunus persica L. Batsch). Theor Appl Genet 105:145-159
Fan S, Bielenberg DG, Zhebentyayeva TN, Reighard GL, Okie WR, Holland D, Abbott AG (2010)
Mapping quantitative trait loci associated with chilling requirement, heat requirement and bloom
date in peach (Prunus persica). New Phytol 185:917-930
FAOSTAT (2010) http://faostatclassic.fao.org

Chapter 4
100
Fournier D, Costes E, Salles JC, Segura V, Clauzel G, Audergon JM, Legave JM (2004) Analysis of
morphological and architectural traits of apricot cultivars grown in different environmental
conditions. Acta Hort 663:375-380
Hormaza JI, Yamane H, Rodrigo J (2007) Apricot. In: Kole C (ed) Genome Mapping and Molecular
Breeding in Plants. Springer, Berlin Heidelberg, pp 171–187
Illa E, Eduardo I, Audergon JM, Barale F, Dirlewanger E, Li X, Moing A, Lambert P, Dantec LL, Cao
Z, Poëssel JL, Pozzi C, Rossini L, Vecchietti A, Arús P, Howad W (2011) Saturating the Prunus
(stone fruits) genome with candidate genes for fruit quality. Mol Breed 28:667-682
Infante R, Martínez-Gómez P, Predieri S (2011) Breeding for fruit quality in Prunus. In: Jenks MA,
Bebeli PJ (eds) Breeding for Fruit Quality. Wiley & Blackwell, New York, pp 201–229
Joobeur T, Viruel MA, de Vicente MC, Jáuregui B, Ballester J, Dettori MT, Verde I, Truco MJ,
Messeguer R, Batlle I, Quarta R, Dirlewanger E, Arús P (1998) Construction of a saturated
linkage map in Prunus using an almond x peach F2 progeny. Theor Appl Genet 97:1034–1041
Kenis K, Keulemans J (2007) Study of tree architecture of apple (Malus × domestica Borkh.) by QTL
analysis of growth traits. Mol Breed 19:193–208
Lammerts, W. E. (1945) The breeding of ornamental edible peaches for mild climates. I. Inheritance
of tree and flower characteristics. Am J Bot 32, 53–61
Laurens F, Audergon J, Claverie J, Duval H, Germain E, Kervella J, Le Lezec M, Lauri PE,
Lespinasse JM (2000) Integration of architectural types in French programmes of ligneous fruit
species genetic improvement. Fruits 54:441-449
Layne REC, Hunter DM (2003) ‘AC Harostar’ Apricot. HortScience 38:104-141
Layne DR, Bassi D (2008) The Peach: Botany, Production and Uses. CABI Publishing, Cambridge
Leccese A, Bartolini S, Viti R (2012) Genotype, harvest season and cold storage influence on fruit
quality and antioxidant properties of apricot. International Journal of food properties 15:864-879
Leida C, Terol J, Martí G, Agustí M, Llácer G, Badenes ML, Ríos G (2010) Identification of genes
associated with bud dormancy release in Prunus persica by suppression subtractive hybridization.
Tree Physiol 30:655–666
Leida C, Romeu JF, Garcia-Brunton J, Ríos G, Badenes ML (2012a) Gene expression analysis of
chilling requirements for flower bud break in peach. Plant Breed 131:329-334
Leida C, Conesa A, Llácer G, Badenes ML, Ríos G (2012b) Histone modifications and expression of
DAM6 gene in peach are modulated during bud dormancy release in a cultivar-dependent manner.
New Phytol 193:67–80
Lichou J, Jay M, Vaysse P, Lespinasse N (2003) Reconnaître les variétés d’abricots. In: Ctifl (ed),
Paris, France, pp 1-92

Chapter 4
101
Liebhard R, Kellerhals M, Pfammatter W, Jertmini M and Gessler C (2003) Mapping quantitative
physiological traits in apple (Malus domestica Borkh.). Plant Mol Biol 52:511 –526
McGuire RG (1992) Reporting of objective color measurements. HortScience 27:1254–1255
Mehlenbacher SA, Scorza R (1986) Inheritance of growth habit in progenies of ‘Compact Redhaven’
trees. HortScience 21:124–126
Meier U, Graf H, Hack H, Hess M, Kennel W, Klose R, Mappes D, Seipp D, Strauss R, Streif J, van
den Boom T (1994) Phänologische Entwicklungsstadien des Kernobstes (Malus domestica Borkh.
und Pyrus communis L.), des Steinobstes (Prunus-Arten), der Johannisbeere (Ribes-Arten) und
der Erdbeere (Fragaria ananassa Duch.). Nachrichtenblatt des Deutschen Pflanzenschutzdienstes
46:141–153
Miller S, Sorza R (2010) Response of two novel peach tree growth habits to in-row tree spacing,
training system, and pruning: effect on growth and pruning. J Am Pomol Soc 64:199-217
Monet R, Guye A, Roy M, Dachary N (1996) Peach Mendelian genetics, a short review and new
results. Agronomy 16:321-329
Moreau-Rio MA, Roty C (1998) Le comportement des consommateurs d’abricots: analyse
comparative avec d’autres fruits d’été. CTIFL, Paris
Moreau-Rio MA (2006) Perception and consumption of apricots in France. Acta Hort 701:31–37
Parolari G, Virgili R, Bolzoni L (1992) Analysis of sensory and instrumental data on apricot purees
with pattern recognition techniques. Anal Chim Acta 259:257–265
Quilot B, Wu BH, Kervella J, Génard M, Foulongne M, Moreau K (2004) QTL analysis of quality
traits in an advanced backcross between Prunus persica cultivars and the wild relative species P.
davidiana. Theor Appl Genet 109:884-897
Ruiz D, Egea J, Tomas-Barberan FA, Gil MI (2005) Carotenoids from new apricot (Punus armeniaca
L.) varieties and their relationships with flesh and skin color. J Agr Food Chem 53:6368–6374
Ruiz D, Campoy JA, Egea J (2007) Chilling and heat requirements of apricot cultivars for flowering.
Environ Exp Bot 61:254-263
Ruiz D and Egea J (2008) Phenotypic diversity and relationships of fruit quality traits in apricot
(Prunus armeniaca L) germplasm. Euphytica 163:143–158
Ruiz D, Lambert P, Audergon JM, Dondini L, Tartarini S, Adami M, Gennari F, Cervellati C, De
Franceschi P, Sansavini S, Bureau S, Gouble B, Reich M, Renard CMGC, Bassi D, Testolin R
(2010) Identification of QTLs for fruit quality traits in apricot. Acta Hort 862:587–592
Sajer O, Scorza R, Dardick C, Zhebentyayeva T, Abbott AG, Horn R (2012) Development of
sequence-tagged site markers linked to the pillar growth type in peach (Prunus persica). Plant
Breed 131:186-192

Chapter 4
102
Scorza R, Sherman WB (1996) Peaches. In: Janick J, Moore JN (eds.) Fruit Breeding, Vol. 1: Tree and
Tropical Fruits. John Wiley and Sons, New York, pp 325-440
Scorza R (2002) Genetic interactions of pillar (columnar), compact, and dwarf peach tree genotypes. J
Amer Soc Hort Sci 127:254-261
Segura V, Denancé C, Durel CE, Costes E (2007) Wide range QTL analysis for complex architectural
traits in a 1-year-old apple progeny. Genome 50:159-171
Socquet-Juglard D, Duffy B, Pothier JF, Christen D, Gessler C, Patocchi A. (2012a) Identification of a
major QTL for Xanthomonas arboricola pv. pruni resistance in apricot. Submitted in Tree
Genetics and Genomes
Socquet-Juglard D, Patocchi A, Pothier JF, Christen D, Duffy B (2012b) Evaluation of Xanthomonas
arboricola pv. pruni inoculation techniques to screen for bacterial spot resistance in peach and
apricot. J Plant Pathol 94: S1.91-96
Souty M, Audergon JM, Chambroy Y (1990) Abricot: les critères de qualité. L’arboriculture fruitière
430:16–24
van Ooijen JW (2004) MapQTL®5, software for the mapping of quantitative trait loci in experimental
populations. Kyazma BV, Wageningen, Netherlands
van Ooijen JW (2006) JoinMap® 4.0, Software for the calculation of genetic linkage maps in
experimental populations. Kyazma BV, Wageningen, The Netherlands
Verde I, Quarta R, Cedrola C, Dettori MT (2002) QTL Analysis of Agronomic Traits in a BC1 Peach
Population. Acta Hort 592:291-297
Werner DJ, Chaparro JX (2005) Genetic interactions of pillar and weeping peach genotypes.
HortScience 40:18-20
Xu Y, Zhang L, Xie H, Zhang Y-Q, Oliveira MM, Ma R-C (2008) Expression analysis and genetic
mapping of three SEPALLATA-like genes from peach (Prunus persica (L.) Batsch). Tree Genet
Genomes 4:693–703
Yamamoto T, Shimada T, Imai T, Yaegaki H, Haji T, Matsuta N, Yamaguchi M, Hayashi T (2001)
Characterization of morphological traits based on a genetic linkage map in peach. Breed Sci
51:271–278
Zhebentyayeva T, Ledbetter C, Burgos L, Llácer G (2012) Apricot. In: Badenes ML, Byrne DH (eds)
Fruit Breeding, Handbook of Plant Breeding Vol 8, pp 415-457


Chapter 5
Comparative RNA-Seq analysis of early infected peach (Prunus persica) leaves with the quarantine phytopathogen Xanthomonas arboricola pv. pruni
Accepted in: PLoS ONE (2012)


Chapter 5
106
5.1. Abstract
Xanthomonas arboricola pv. pruni is a quarantine bacterial pathogen that threaten peach production
by causing necrotic spots on leaves and fruits, thus with the potential of severely reducing yields. The
current understanding of the host plant defense responses to the pathogen is very limited. Using whole
transcriptome sequencing, differential gene expression was analyzed at two time points, 2h and 12h
post inoculation (hpi), by comparing the inoculated samples to their respective controls. On the total of
19,781 known peach genes that were expressed in all time points and conditions, 34 and 263 were
differentially expressed at 2 and 12 hpi, respectively. Of those, 82% and 40% were up-regulated,
respectively; and 18% and 60% were down-regulated, respectively. The functional annotation based
on gene ontology (GO) analysis highlighted that genes involved in metabolic process and response to
stress were particularly represented at 2 hpi whereas at 12 hpi cellular and metabolic processes were
the categories with the highest number of genes differentially expressed. Of particular interest among
the differentially expressed genes identified were several pathogen-associated molecular pattern
(PAMP) receptors, disease resistance genes including several RPM1-like and pathogenesis related
thaumatin encoding genes. Other genes involved in photosynthesis, in cell wall reorganization, in
hormone signaling pathways or encoding cytochrome were also differentially expressed. In addition,
novel transcripts were identified, providing another basis for further characterization of plant defense-
related genes. Overall, this study gives a first insight of the peach defense mechanisms during the very
early stages of infection with a bacterial disease in the case of a compatible interaction.
Keywords
Bacterial spot, whole transcriptome sequencing, plant defense, Prunus persica

Chapter 5
107
5.2. Introduction Bacterial spot of stone fruits, caused by Xanthomonas arboricola pv. pruni, is a severe disease that
threaten the most economically important Prunus crops, including peach, apricot, nectarine and plum.
Identified for the first time by Smith in 1903 in the USA, the disease has spread worldwide and has
been now reported from all continents (Anonymous 2006). The pathogen uses wounds or stomata to
access the intercellular spaces where it degrades the cell wall components (Aarrouf et al. 2008). This
causes necrotic lesions on both leaves and fruits, leading to severe defoliations and yield losses. In
some cases the pathogen can be also responsible for cankers and death of the trees (Garcin et al. 2005).
The pathogenicity of X. arboricola pv. pruni relies on a large repertoire of 21 type III effectors (T3Es)
which can be delivered directly into the host cells via the type III secretion system (Hajri et al. 2012).
T3Es are known to promote bacterial growth in the host plant by suppressing plant defenses (Alfano
and Collmer 2004).
Despite extensive efforts to characterize Prunus species according to their level of resistance
to Xanthomonas arboricola pv. pruni (Keil and Fogel 1974; Bazzi et al. 1990; Garcin et al. 2005;
Garcin and Bresson 2011; Socquet-Juglard et al. 2012a, Chapter 2), not much is known about the
genetics underlying host defense responses and resistance. Recently, one major QTL for disease
incidence in apricot has been identified on linkage group 5 (Socquet-Juglard et al. 2012b, Chapter 3).
In peach, major QTLs for X. arboricola pv. pruni resistance have also been recently identified, one on
LG4 for leaf resistance, one on LG5 for both fruit and leaf resistance, and one on each LG1 and LG6
for fruit resistance (Yang 2012). In addition, the differential expression of pathogen-related genes in
peach identified by qRT-PCR upon bacterial infection, as well as after methyl jasmonate and ethephon
treatments, showed that jasmonic acid and ethylene pathways may play a role in disease resistance
(Sherif et al. 2011).
X. arboricola pv. pruni is especially virulent on peach [Prunus persica (L.) Batsch], which is
one of the most economically important species in the genus Prunus, in terms of tonnage and
production area (FAOSTAT 2010). Characterized by eight chromosomes (2n = 16) and a small
genome size (around 227 Mbp) in comparison to other plant species (Arumuganathan and Earle 1991),
peach is considered as a model species for the Rosaceae family (Rajapakse et al. 1995; Abbott et al.
2002). As a consequence, a great emphasis has been placed on developing efficient marker-assisted
selection strategies to fasten molecular breeding (Arús et al. 2005). Several inter- and intraspecific
genetic linkage maps have been constructed; one of those, ‘Texas’ (almond) × ‘Earlygold’ (peach) has
been saturated with markers and is considered as the reference map for Prunus (Joobeur et al. 1998;
Howad et al. 2005). From these maps, Quantitative Trait Loci (QTLs) involved in fruit quality,
adaptation, and disease resistance have been identified (reviewed in Byrne et al. 2012). Major recent
advances have been the release of the complete peach genome sequence by the IPGI (International

Chapter 5
108
Peach Genome Initiative, Sosinski et al. 2010, Arús et al. 2012) and the development of an Illumina
9,000 SNP array by the IPSC (International Peach SNP Consortium, Verde et al. 2012) which permit
to efficiently improve coverage and saturation of linkage maps (Eduardo et al. 2012, Yang 2012).
Microarrays have been extensively used in the past years to study the expression of transcripts
in many plants including Prunus species (Trainotti et al. 2006; Ogundiwin et al. 2008; Pasquer et al.
2008; Bonghi et al. 2010; Manganaris et al. 2011). It notably permitted to show in Arabidopsis
thaliana that the same set of genes induces resistance or susceptibility to diseases, and that the
difference of phenotype is due to the timing and magnitude of the expression of those genes (Tao et al.
2003). However, microarray technology presents drawbacks including a limitation to known
transcripts and background signals leading to low sensitivities for low expressed genes. These
limitations are overcome by recent advances of next-generation sequencing technologies (RNA-seq,
Wang et al. 2009). RNA-seq technology has become more feasible and economically affordable in the
recent years, especially in the case of the analysis of a limited number of samples. This technology is
very powerful for the analysis of transcriptomes due to the precise measure of the expression level of
each gene in a sample by mapping short cDNA sequences (reads) on a reference genome. Next-
generation technologies, especially after the development of the Illumina Genome Analyzer, have
been successfully used to investigate differential gene expression in several pathosystems, like
Xanthomonas axonopodis pv. glycines in soybean (Kim et al. 2011), Sclerotinia homoeocarpa in
creeping bentgrass (Orshinsky et al. 2012), or Pseudoperonospora cubensis in cucumber (Adhikari et
al. 2012).
In this study, deep RNA sequencing technology was used to sequence the transcriptome of the
leaves of a moderately susceptible peach cultivar (Socquet-Juglard et al. 2012a, Chapter 2) after X.
arboricola pv. pruni inoculation and after mock-inoculation at two different time points (2h and 12h
post inoculation, hpi). Reads obtained were mapped on the peach genome and their abundance was
calculated in order to identify by pair-wise comparison genes differentially expressed in early infected
leaves. We further identified and characterized novel transcripts with differential abundance levels,
which could also play a role in the defense mechanisms of peach against the pathogen.
5.3. Materials and Methods
5.3.1. Biological material and inoculation procedure
The strain of X. arboricola pv. pruni CFBP 5530 for which genome was recently sequenced (Pothier
et al. 2011) and the moderately susceptible peach rootstock ‘GF305’ (Socquet-Juglard et al. 2012a,
Chapter 2) were used in this study. Two-year-old peach trees (Pépinières de Saxon, Switzerland) in 5 l
pots containing a mixture of peat and loam were grown for one month before inoculation under

Chapter 5
109
quarantine greenhouse conditions. Plants were maintained at 23°C and 80% relative humidity for 24 h
before and during the inoculation process, with no additional light throughout the experiment.
Preparation of the inoculum was performed as described in Socquet-Juglard et al. (2012a,
Chapter 2). Twenty fully developed leaves per tree were randomly inoculated with a needless syringe
at eight different points on the abaxial side of the leaf until a water-soaked spot was clearly visible.
Controls were inoculated using the same procedure but with a sterile 0.8% KCl solution, the same
solution used to suspend the bacteria. Three trees (biological replicates) per time point and per type of
inoculum were used. Leaf area around inoculation corresponding to the water-soak spots were
collected at 2 and 12 hpi, flash frozen in liquid nitrogen and stored at -80°C until RNA extraction.
5.3.2. RNA extraction and sequencing
Total RNA was isolated from approximately 150 mg of leaf tissue using the protocol from Schenk et
al. (2008) with the following modification: grinded tissue was incubated for 10 min at 65°C instead of
90 s at 95°C in the BPEX extraction buffer. RNA samples were treated with RNAse-free DNAse I
(Fermentas, Switzerland) to remove contaminating DNA. To ensure that all genomic DNA was
digested, samples were checked with a multiplex PCR using the 4 SSR markers UDAp-416, UDAp-
487, AMPA105 and UDAp-424 using the protocol as described in Socquet-Juglard et al (2012a,
Chapter 2). Purity and concentration of the samples were estimated with a NanoDrop ND-1000
spectrophotometer (NanoDrop technologies Inc, USA) and the integrity of the RNA was evaluated on
an RNA 6000 Nano LabChip using Agilent 2100 Bioanalyzer (Agilent Technologies, Germany). The
three biological repetitions per treatment were then diluted at equal concentrations and equal amounts
were pooled to obtain a final quantity of 5 µg RNA per condition. Four indexed strand-specific cDNA
libraries were prepared and samples were sequenced on an Illumina HiSeq 2000 with a 51-bp single-
end read length (GATC Biotech, Konstanz, Germany).
5.3.3. Reads mapping and annotations
Reads were mapped to the P. persica genome v.1.0 obtained from the Genome Database for Rosaceae
(GDR, http://www.rosaceae.org/peach/genome) using TopHat v.2.0.3 (Trapnell et al. 2012) with
Bowtie v.0.12.8 (Langmead et al. 2009).
Transcript abundance and differential gene expression were calculated with the program
Cufflinks v.2.0.1 (Trapnell et al. 2010). Annotations of differentially expressed genes including Pfam
database (Bateman et al. 2002) were obtained from the reference annotation of the peach genome
available at the GDR website. Gene expression levels were normalized using fragments per kilobase
of exon per million mapped reads (FPKM) report values. Genes were considered as induced or
repressed, only when their log2 fold change was > 2 or < -2, respectively, and their P value was
< 0.001.

Chapter 5
110
For each differentially expressed peach transcript, latest Gene Ontology (GO) annotations
were obtained using Blast2GO v.2.3.5 (Conesa et al. 2005) with the default parameters, and GOslim
option was set to reduce the number of functional classes. GOslim annotations results were then used
as queries against the AgBase database (McCarthy et al. 2006) to perform their classification
according to the three main classes (molecular function, biological process and cellular component),
and to be further assigned to secondary categories.
5.4. Results and discussion
5.4.1. Analysis of RNA-Seq datasets
Sequencing of RNA samples yielded 49 to 54.7 million reads corresponding to over 2.5 billion
nucleotides of cDNA per sample (Table 5.1). Good quality scores of the reads were obtained, with
Q20 percentages (sequencing error rate lower than 1%) which were all over 97%, while N percentages
were all around 0.01% (Table 1). Between 73.8 and 76.9% of the reads could be mapped on the peach
genome whereas an insignificant number of reads (less than 0.03% of the reads) were mapped to the
X. arboricola pv. pruni CFBP 5530 genome. However, since reads from the mock-inoculated samples
also mapped on X. arboricola pv. pruni genome to the same extent, this observation could be due to
short identical sequences shared between the two genomes. This hypothesis is further supported by the
fact that reads obtained from X. arboricola pv. pruni from in vitro culture mapped to the P. persica
genome (our unpublished data). Thus we can consider that mapped reads were almost exclusively
constituted of peach reads. Total number of expressed genes was over 21,000 per sample (Table 5.1),
and a total number of 19,781 expressed genes were in common to all experiment time points and
conditions (data not shown). Fragments per kilobase of exon per million mapped reads (FPKM) values
of the four sequenced samples ranged from 0 for all samples to 23,273 for the 2 hpi inoculated sample
(Table 5.1). Subsets of 5 to 40 million reads were randomly selected from the total pool of reads of
each sample at each time point in order to check the effect of sampling depth on gene expression. The
simulation obtained revealed that the number of genes expressed started to reach a plateau at 30
million reads, showing that the depth used in our study was sufficient to cover the whole peach
transcriptome (Fig. A.3. in the Appendix).
To evaluate gene expression, ten housekeeping genes coding for actin, tubulin, catalase or
GAPDH motives (Table 5.2) were selected based on the study from Cocker and Davies (2003). Based
on pair-wise comparisons of the inoculated samples and their respective mock-inoculated samples at
the two time points, none of these reference genes was significantly differentially expressed, with log2
fold changes ranging from -1.05 for gene ppa005765 coding for tubulin at 12 hpi to 0.41 for another
tubulin encoding gene (ppa005785) at 12 hpi. These results indicated that the sequences obtained and
the transcript expression levels met the requirements for further transcriptome analysis.
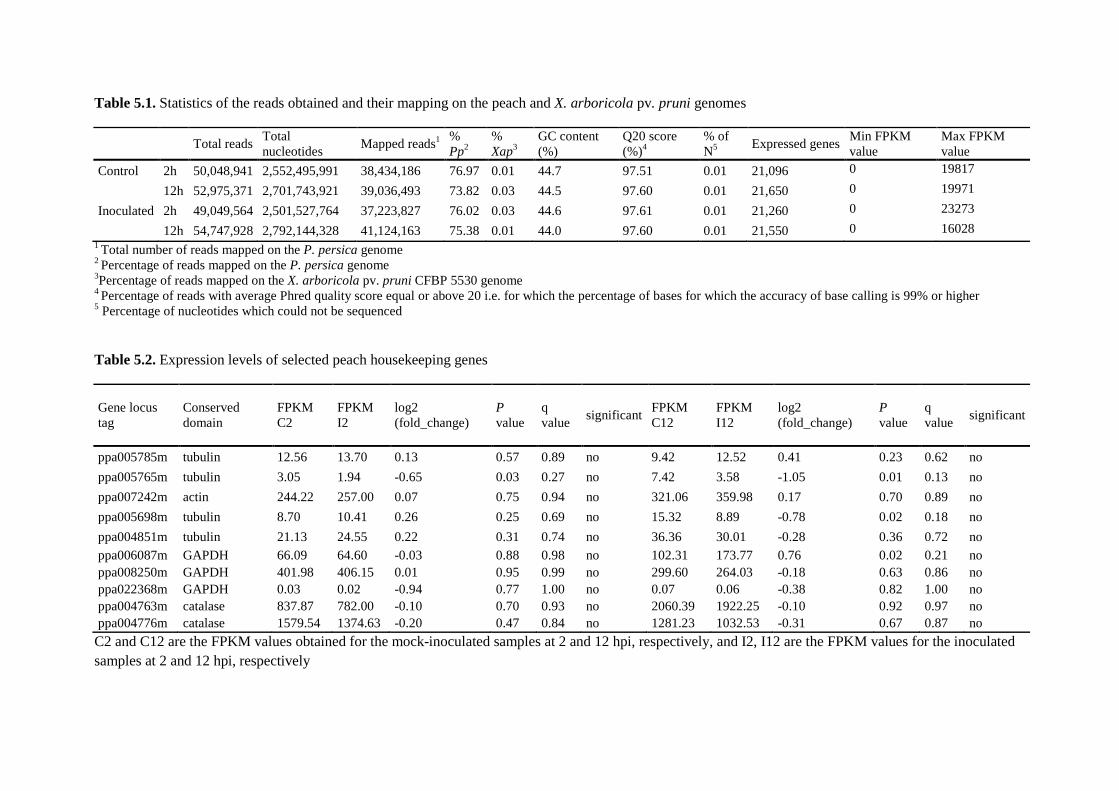
Table 5.1. Statistics of the reads obtained and their mapping on the peach and X. arboricola pv. pruni genomes
Total reads Total nucleotides
Mapped reads1 % Pp2
% Xap3
GC content (%)
Q20 score (%)4
% of N5
Expressed genes Min FPKM value
Max FPKM value
Control 2h 50,048,941 2,552,495,991 38,434,186 76.97 0.01 44.7 97.51 0.01 21,096 0 19817
12h 52,975,371 2,701,743,921 39,036,493 73.82 0.03 44.5 97.60 0.01 21,650 0 19971
Inoculated 2h 49,049,564 2,501,527,764 37,223,827 76.02 0.03 44.6 97.61 0.01 21,260 0 23273
12h 54,747,928 2,792,144,328 41,124,163 75.38 0.01 44.0 97.60 0.01 21,550 0 16028 1 Total number of reads mapped on the P. persica genome 2 Percentage of reads mapped on the P. persica genome 3Percentage of reads mapped on the X. arboricola pv. pruni CFBP 5530 genome 4 Percentage of reads with average Phred quality score equal or above 20 i.e. for which the percentage of bases for which the accuracy of base calling is 99% or higher 5 Percentage of nucleotides which could not be sequenced
Table 5.2. Expression levels of selected peach housekeeping genes
Gene locus tag
Conserved domain
FPKM C2
FPKM I2
log2 (fold_change)
P value
q value
significant FPKM C12
FPKM I12
log2 (fold_change)
P value
q value
significant
ppa005785m tubulin 12.56 13.70 0.13 0.57 0.89 no 9.42 12.52 0.41 0.23 0.62 no
ppa005765m tubulin 3.05 1.94 -0.65 0.03 0.27 no 7.42 3.58 -1.05 0.01 0.13 no
ppa007242m actin 244.22 257.00 0.07 0.75 0.94 no 321.06 359.98 0.17 0.70 0.89 no
ppa005698m tubulin 8.70 10.41 0.26 0.25 0.69 no 15.32 8.89 -0.78 0.02 0.18 no
ppa004851m tubulin 21.13 24.55 0.22 0.31 0.74 no 36.36 30.01 -0.28 0.36 0.72 no ppa006087m GAPDH 66.09 64.60 -0.03 0.88 0.98 no 102.31 173.77 0.76 0.02 0.21 no ppa008250m GAPDH 401.98 406.15 0.01 0.95 0.99 no 299.60 264.03 -0.18 0.63 0.86 no ppa022368m GAPDH 0.03 0.02 -0.94 0.77 1.00 no 0.07 0.06 -0.38 0.82 1.00 no ppa004763m catalase 837.87 782.00 -0.10 0.70 0.93 no 2060.39 1922.25 -0.10 0.92 0.97 no ppa004776m catalase 1579.54 1374.63 -0.20 0.47 0.84 no 1281.23 1032.53 -0.31 0.67 0.87 no
C2 and C12 are the FPKM values obtained for the mock-inoculated samples at 2 and 12 hpi, respectively, and I2, I12 are the FPKM values for the inoculated samples at 2 and 12 hpi, respectively

Chapter 5
112
5.4.2. Response to X. arboricola pv. pruni inoculation at 2h and 12h post inoculation
By performing a pair-wise comparison of the inoculated and the mock-inoculated samples at 2 hpi, 34
annotated genes were differentially expressed due to inoculation with the bacteria; 18% of them were
down-regulated and 82% were up-regulated (Table A.6 in the Appendix). The pair-wise comparison
of the inoculated and mock-inoculated samples at 12 hpi resulted in the identification of a total of 263
annotated genes differentially expressed, 60% and 40% being down-regulated and up-regulated,
respectively (Table A.7 in the Appendix). The high number of down-regulated genes at 12 hpi
compared to 2 hpi may reflect the release of type III effectors by the bacterial cells to suppress plant
defense pathways. Four annotated genes were in common between the two time points. One of them
was up-regulated in both cases while the expression of the three others changed between 2 and 12 hpi,
with two up-regulated genes at 2 hpi which were down-regulated at 12 hpi, and one gene the opposite
(Table A.8 in the Appendix).
5.4.3. Identification of differentially expressed potential novel genes
One advantage of the RNA-seq technology is that a part of the reads obtained may be mapped in
regions of the genome of the organism under study which have not yet been annotated, thus
identifying new coding regions. Here, a total of 28 and 199 novel transcripts with differential
abundance levels (referred hereafter as set of novel transcripts) were identified 2 and 12 hpi,
respectively, with seven being common to both time points (Table A.9, Table A.10, Table A.11 in
the Appendix). At 2 hpi, 32% of the novel transcripts were significantly more abundant in the
inoculated sample than in the control, while at 12 hpi 81% were significantly more abundant in the
control sample. Using Blast2GO software, 21% and 43% of these novel transcripts could be annotated
at 2 hpi and 12 hpi, respectively (Table A.9, Table A.10 in the Appendix).
5.4.4. Gene ontology analysis
For a better understanding of the range of genes involved in the response of peach to the inoculation of
X. arboricola pv. pruni, functional classes of differentially expressed genes were determined using
gene ontology (GO) analysis. Blast2GO software returned functions for 43% and 59% of the
differentially expressed genes and novel transcripts at 2 and 12 hpi, respectively (Table 5.3).
Generally for both time points, more genes were assigned to the biological process and molecular
function categories than in the cellular component category (Table 5.4, Table 5.5, Table 5.6). The
distribution of the GO functions revealed that metabolic process (12.1%) and response to stress
(12.1%) were the most represented secondary categories of the biological processes at 2 hpi which
may reflect that the defense mechanisms of the peach plants were activated by the pathogen already at
2 hpi (Fig. 5.1), while at 12 hpi the most represented biological processes identified were the
metabolic (14.5%) and cellular (9.6%) processes (Fig. 5.1). In the category of molecular functions, a
higher proportion of genes for which products were involved in binding, kinase activity, hydrolases

Chapter 5
113
and transferases was identified at both 2 and 12 hpi (Fig. 5.2). An important number of cellular
component GO terms was associated with the plastids, membranes, thylakoids and cell components at
both 2 and 12 hpi (Fig. 5.3).
Furthermore, GO analysis categorized up-regulated genes in 45 and 54 different functions at 2
and 12 hpi, respectively, and in 9 and 74 different functions at 2 and 12 hpi, respectively for the down-
regulated genes (Table 5.4, Table 5.5 and Table 5.6).
Table 5.3. BLASTP statistics of the differentially expressed genes at 2 and 12 hpi according to GO and Pfam databases, and similarities between peach and Arabidopsis thaliana transcripts
2 hpi 12 hpi Num. % Num. %
Known GOa 27 43.55 274 59.31 Unknown GOa 35 56.45 188 40.69 Known Pfamb 26 76.47
209 79.47
Unknown Pfamb 8 23.53
54 20.53 At1 sequenceb 33 97.06
250 95.06
No At2 sequenceb 1 2.94
13 4.94 aAnnotation results were obtained from Blast2GO software and includes the novel transcripts bAnnotation were obtained from the GDR annotations and does not include the novel transcripts 1 Number and percentage of genes in peach with a corresponding transcript in the Arabidopsis thaliana genome 2 Number and percentage of genes in peach without a corresponding transcript in the A. thaliana genome

Figure 5.1. Distribution of the differentially expressed genes within the GO secondary functions of biological processes at 2h (in black) and 12h (in grey) post inoculation

Chapter 5
115
Figure 5.2. Distribution of the differentially expressed genes within the GO secondary functions of molecular functions at 2h (in black) and 12h (in grey) post inoculation
Figure 5.3. Distribution of the differentially expressed genes within the GO secondary functions of cellular components at 2h (in black) and 12h (in grey) post inoculation
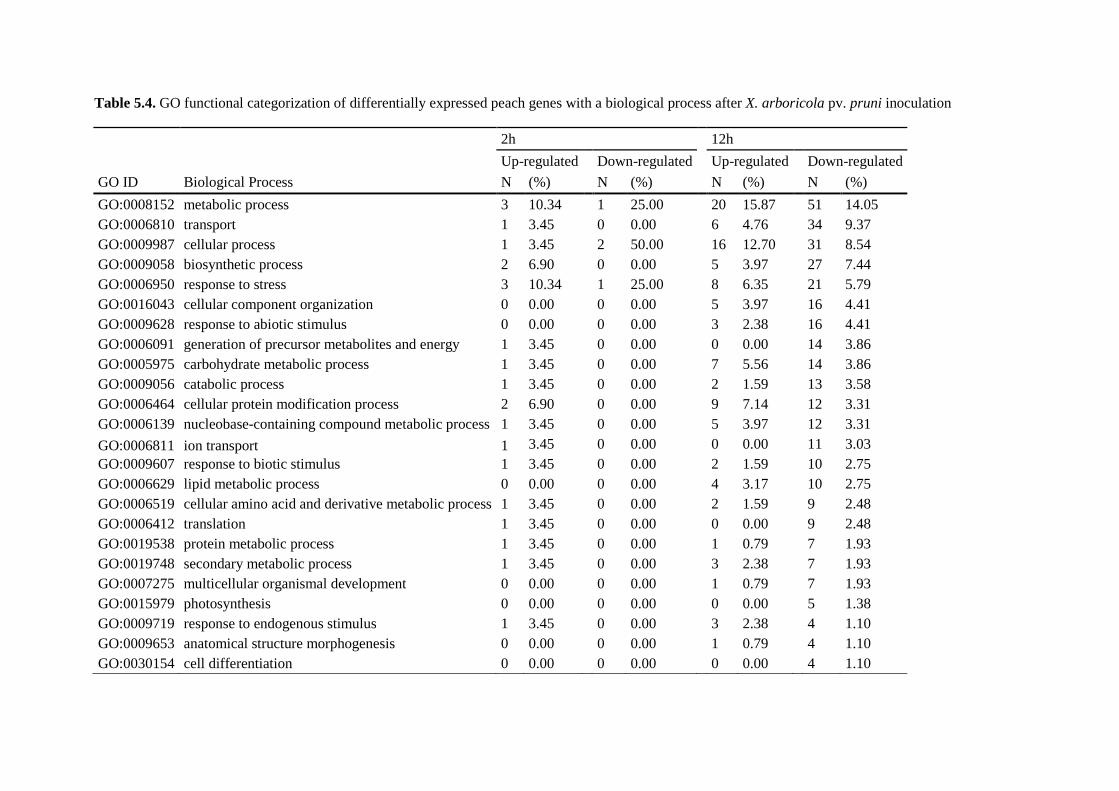
Table 5.4. GO functional categorization of differentially expressed peach genes with a biological process after X. arboricola pv. pruni inoculation
2h
12h
Up-regulated
Down-regulated
Up-regulated
Down-regulated
GO ID Biological Process N (%)
N (%)
N (%)
N (%)
GO:0008152 metabolic process 3 10.34
1 25.00
20 15.87
51 14.05 GO:0006810 transport 1 3.45
0 0.00
6 4.76
34 9.37
GO:0009987 cellular process 1 3.45
2 50.00
16 12.70
31 8.54 GO:0009058 biosynthetic process 2 6.90
0 0.00
5 3.97
27 7.44
GO:0006950 response to stress 3 10.34
1 25.00
8 6.35
21 5.79 GO:0016043 cellular component organization 0 0.00
0 0.00
5 3.97
16 4.41
GO:0009628 response to abiotic stimulus 0 0.00
0 0.00
3 2.38
16 4.41 GO:0006091 generation of precursor metabolites and energy 1 3.45
0 0.00
0 0.00
14 3.86
GO:0005975 carbohydrate metabolic process 1 3.45
0 0.00
7 5.56
14 3.86 GO:0009056 catabolic process 1 3.45
0 0.00
2 1.59
13 3.58
GO:0006464 cellular protein modification process 2 6.90
0 0.00
9 7.14
12 3.31 GO:0006139 nucleobase-containing compound metabolic process 1 3.45
0 0.00
5 3.97
12 3.31
GO:0006811 ion transport 1 3.45
0 0.00
0 0.00
11 3.03 GO:0009607 response to biotic stimulus 1 3.45
0 0.00
2 1.59
10 2.75
GO:0006629 lipid metabolic process 0 0.00
0 0.00
4 3.17
10 2.75 GO:0006519 cellular amino acid and derivative metabolic process 1 3.45
0 0.00
2 1.59
9 2.48
GO:0006412 translation 1 3.45
0 0.00
0 0.00
9 2.48 GO:0019538 protein metabolic process 1 3.45
0 0.00
1 0.79
7 1.93
GO:0019748 secondary metabolic process 1 3.45
0 0.00
3 2.38
7 1.93 GO:0007275 multicellular organismal development 0 0.00
0 0.00
1 0.79
7 1.93
GO:0015979 photosynthesis 0 0.00
0 0.00
0 0.00
5 1.38 GO:0009719 response to endogenous stimulus 1 3.45
0 0.00
3 2.38
4 1.10
GO:0009653 anatomical structure morphogenesis 0 0.00
0 0.00
1 0.79
4 1.10 GO:0030154 cell differentiation 0 0.00 0 0.00
0 0.00
4 1.10

Table 5.4. GO functional categorization of differentially expressed peach genes involved in biological process after X. arboricola pv. pruni inoculation (continued)
2h
12h
Up-regulated
Down-regulated
Up-regulated
Down-regulated
GO ID Biological Process N (%) N (%) N (%) N (%)
GO:0007165 signal transduction 1 3.45
0 0.00
4 3.17
3 0.83 GO:0009791 post-embryonic development 0 0.00
0 0.00
2 1.59
3 0.83
GO:0016049 cell growth 0 0.00
0 0.00
2 1.59
2 0.55 GO:0008150 Undefined biological process 1 3.45
0 0.00
6 4.76
1 0.28
GO:0009605 response to external stimulus 1 3.45
0 0.00
3 2.38
1 0.28 GO:0000003 reproduction 0 0.00
0 0.00
1 0.79
1 0.28
GO:0007049 cell cycle 0 0.00
0 0.00
0 0.00
1 0.28 GO:0007610 behavior 0 0.00
0 0.00
0 0.00
1 0.28
GO:0009908 flower development 0 0.00
0 0.00
0 0.00
1 0.28 GO:0040007 growth 0 0.00
0 0.00
0 0.00
1 0.28
GO:0007154 cell communication 1 3.45
0 0.00
1 0.79
0 0.00 GO:0008219 cell death 1 3.45
0 0.00
2 1.59
0 0.00
GO:0009991 response to extracellular stimulus 1 3.45
0 0.00
0 0.00
0 0.00
GO:0008037 cell recognition 0 0.00
0 0.00 1 0.79
0 0.00
GO:0006259 DNA metabolic process 0 0.00
0 0.00
1 0.79
0 0.00 Sum
29 100
4 100
126 100 363 100

Table 5.5. GO functional categorization of differentially expressed peach genes with a molecular function after X. arboricola pv. pruni inoculation
2h
12h
Up-regulated
Down-regulated
Up-regulated
Down-regulated
GO ID Molecular function N (%)
N (%)
N (%)
N (%)
GO:0005488 binding 6 20.00
0 0.00
18 14.63
78 25.66 GO:0003824 catalytic activity 2 6.67
2 33.33
14 11.38
57 18.75
GO:0016787 hydrolase activity 5 16.67
1 16.67
14 11.38
35 11.51 GO:0016740 transferase activity 3 10.00
0 0.00
16 13.01
21 6.91
GO:0005215 transporter activity 2 6.67
0 0.00
3 2.44
19 6.25
GO:0009055 electron carrier activity 0 0.00
0 0.00
0 0.00
18 5.92 GO:0000166 nucleotide binding 5 16.67
1 16.67
15 12.20
17 5.59
GO:0005515 protein binding 1 3.33
0 0.00
5 4.07
14 4.61 GO:0003723 RNA binding 2 6.67
0 0.00
4 3.25
12 3.95
GO:0005198 structural molecule activity 1 3.33
0 0.00
0 0.00
10 3.29 GO:0016301 kinase activity 2 6.67
1 16.67
17 13.82
5 1.64
GO:0030234 enzyme regulator activity 0 0.00
0 0.00
0 0.00
3 0.99 GO:0030246 carbohydrate binding 0 0.00
0 0.00
1 0.81
3 0.99
GO:0003677 DNA binding 0 0.00
1 16.67
5 4.07
2 0.66 GO:0003700 sequence-specific DNA binding transcription factor activity 0 0.00
0 0.00
2 1.63
2 0.66
GO:0008289 lipid binding 0 0.00
0 0.00
0 0.00
2 0.66 GO:0019825 oxygen binding 0 0.00
0 0.00
0 0.00
2 0.66
GO:0003676 nucleic acid binding 0 0.00
0 0.00
4 3.25
1 0.33 GO:0004518 nuclease activity 1 3.33
0 0.00
0 0.00
1 0.33
GO:0004872 receptor activity 0 0.00
0 0.00
2 1.63
1 0.33 GO:0008135 translation factor activity, nucleic acid binding 0 0.00
0 0.00
0 0.00
1 0.33
GO:0004871 signal transducer activity 0 0.00
0 0.00
3 2.44
0 0.00 Sum
30 100
6 100
123 100
304 100
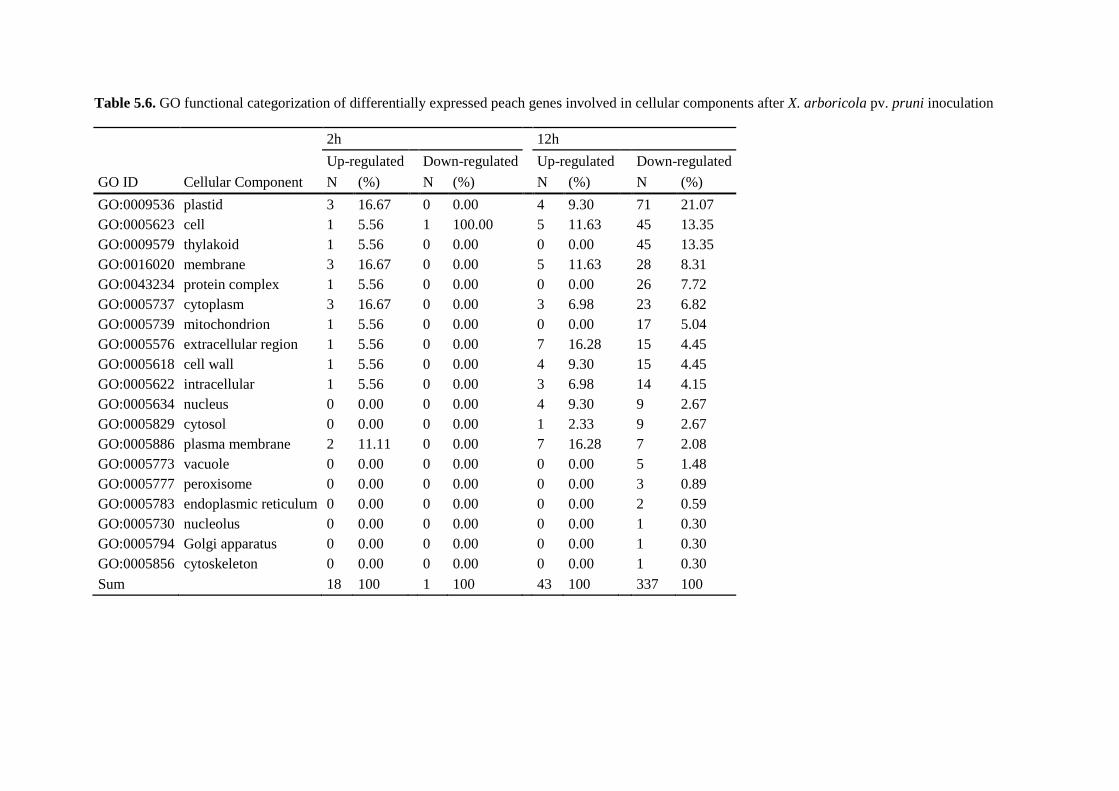
Table 5.6. GO functional categorization of differentially expressed peach genes involved in cellular components after X. arboricola pv. pruni inoculation
2h
12h
Up-regulated
Down-regulated
Up-regulated
Down-regulated
GO ID Cellular Component N (%)
N (%)
N (%) N (%)
GO:0009536 plastid 3 16.67
0 0.00
4 9.30
71 21.07 GO:0005623 cell 1 5.56
1 100.00
5 11.63
45 13.35
GO:0009579 thylakoid 1 5.56
0 0.00
0 0.00
45 13.35 GO:0016020 membrane 3 16.67
0 0.00
5 11.63
28 8.31
GO:0043234 protein complex 1 5.56
0 0.00
0 0.00
26 7.72 GO:0005737 cytoplasm 3 16.67
0 0.00
3 6.98
23 6.82
GO:0005739 mitochondrion 1 5.56
0 0.00
0 0.00
17 5.04 GO:0005576 extracellular region 1 5.56
0 0.00
7 16.28
15 4.45
GO:0005618 cell wall 1 5.56
0 0.00
4 9.30
15 4.45 GO:0005622 intracellular 1 5.56
0 0.00
3 6.98
14 4.15
GO:0005634 nucleus 0 0.00
0 0.00
4 9.30
9 2.67 GO:0005829 cytosol 0 0.00
0 0.00
1 2.33
9 2.67
GO:0005886 plasma membrane 2 11.11
0 0.00
7 16.28
7 2.08 GO:0005773 vacuole 0 0.00
0 0.00
0 0.00
5 1.48
GO:0005777 peroxisome 0 0.00
0 0.00
0 0.00
3 0.89 GO:0005783 endoplasmic reticulum 0 0.00
0 0.00
0 0.00
2 0.59
GO:0005730 nucleolus 0 0.00
0 0.00
0 0.00
1 0.30 GO:0005794 Golgi apparatus 0 0.00
0 0.00
0 0.00
1 0.30
GO:0005856 cytoskeleton 0 0.00
0 0.00
0 0.00
1 0.30 Sum
18 100 1 100 43 100
337 100

Chapter 5
120
5.4.5. Transcriptional changes of defense-related genes using Prunus persica annotations
After pair-wise comparisons of inoculated samples to their respective mock-inoculated samples at 2
and 12 hpi, annotations of differentially expressed genes were obtained from the peach genome
annotation. Almost all of them (97% at 2 hpi and 95% at 12 hpi) were identified with orthologs in A.
thaliana (Table 5.3). Most of the genes were annotated, with 76% at 2 hpi and 79% of the genes at 12
hpi being assigned to a Pfam category (Table 5.3; and Table A.6 and Table A.7 in the Appendix).
5.4.5.1. Genes involved in basal defense
Plants possess different sophisticated systems to defend themselves against pathogen attacks. In some
cases their cells express receptors with a broad range specificity and detect structures of the pathogen
called pathogen associated molecular patterns (PAMPs) leading to a PAMP-triggered immunity (Jones
and Dangl 2006). One of the best characterized PAMP-triggered immunity genes is FLAGELLIN
SENSING 2 (FLS2), a transmembrane receptor kinase for bacterial flagellin in A. thaliana which
contains a leucin-rich (LRR) repeat domain (Gómez-Gómez and Boller 2000). This gene belongs to a
family of receptor-like kinases including rice gene Xa21 (Xanthomonas resistance protein 21, Song et
al. 1995; Park et al. 2010). In the transcriptome of soybean inoculated with X. axonopodis pv. glycines,
a close homologue of FLS2 was shown to be up-regulated at 0 hours post inoculation in a resistant line
in comparison to the susceptible one but was not differentially expressed 6 and 12 hpi (Kim et al.
2011). In our study, ppa1027223m similar to FLS2 was up-regulated at 12 hpi in comparison to the
controls (Table A.7 in the Appendix); although the expression of this gene has not been reported yet
in Prunus, we can hypothesize that it may have a similar function as in A. thaliana. Two other genes
with similarities to genes coding for germin proteins were identified, one (ppa016616m) was
significantly up-regulated and the other (ppa011460m) down-regulated. Similar genes have been
previously identified for being involved in basal plant defense against several pathogens, by playing a
role in the synthesis of active oxygen (Manosalva et al. 2009) and were reported to be up-regulated in
Italian ryegrass (Lolium multiflorum Lam.) upon inoculation with X. translucens pv. graminis [49].
(Wichmann et al. 2011).
After the perception of PAMPs, genes involved in the signaling cascade (mitogen-activated
protein kinases, MAPK) are activated and followed by the activation of WRKY transcription factors
(Asai et al. 2002; Kim and Zhang 2004; He et al. 2006). Gene ppa006485m, similar to a gene
encoding a mitogen-activated protein kinase kinase kinase (MAPKKK15) was identified in our study
and was down-regulated while genes ppa015973m which could belong to the MYB-family and
ppa018075m to the WRKY-family were both up-regulated at 12 hpi in our study (Table A.7 in the
Appendix). Other homologs to genes encoding DNA binding proteins, transcriptional regulation or
transcription factors were differentially expressed, such as one encoding a transducin/WD40-repeat
containing protein (ppa026854m) and one belonging to the basic-helix loop helix DNA-binding family

Chapter 5
121
(ppa017640m) at 2 hpi. At 12 hpi, two differentially expressed genes (ppb012603m and ppa022385m)
similar to genes belonging to the basic-helix loop helix DNA-binding family and four (ppa012687m,
ppa012737m, ppa012242m, and ppa011359m) to genes belonging to zinc finger families were
identified.
5.4.5.2. Genes involved in cell wall reorganization
In this study, several putative genes involved in cell wall formation and degradation were identified.
Ppa003528m was one of the most highly down-regulated genes in our study at 12 hpi (log2 fold change
= -5.9, Table A.7 in the Appendix). Ppa003528m is similar to genes belonging to the invertase⁄pectin
methylesterase inhibitor family, from which some genes are known to be involved in cell wall
modification, but have also been reported as playing an important role in basal disease resistance, and
can be induced by X. campestris pv. vesicatoria in pepper (An et al. 2008). Invertase⁄pectin
methylesterase inhibitors have also been shown to be down-regulated in susceptible potato plants 0.5
hours after Potato virus Y inoculation (Kogovšek et al. 2010).
Seven differentially expressed genes similar to β-glucosidase encoding genes were identified
at 12 hpi, one of them (ppa006110m) being the most up-regulated (log2 fold change = 5.9) whereas all
others were down-regulated (Table A.7 in the Appendix). In plants, β-glucosidases are known to play
an important role in cell wall lignification (Escamilla-Trevino et al. 2006), but also for their activation
of phytohormones (Kristoffersen et al. 2000) and chemical defense compounds (Morant et al. 2006).
Other genes which could play a role in cell wall reorganization were identified and were up-regulated,
such as two xyloglucan endotransglycosylase/hydrolase (ppa019741m and ppa009608m), and one
xyloglucan:xyloglucosyl transferase (ppa009090m) which have a role in primary cell wall
restructuration (Bourquin et al. 2002); as well as one peroxidase (ppa027053m) which can be involved
in cell wall lignification and degradation of vascular tissues. Peroxidases are also known to play a role
in systemic resistance of tobacco to blue mold (Ye et al. 1990) and to wounding in northern red oak
(Allison and Schultz 2004). Another differentially expressed gene similar to a gene encoding a cell
wall hydrolase was found on scaffold 3 in the set of novel transcripts at 12 hpi and was down-
regulated (Table A.10 in the Appendix). The identification of differentially expressed genes that
could be involved in cell wall reorganization indicates that major changes may be performed at an
early stage, either by degrading or lignifying cell walls to avoid the spread of the disease into the
vascular tissues.
5.4.5.3. Differential expression of photosynthesis genes
Five genes putatively involved in light harvesting complexes (ppa009686m and ppa004865m), or
related to chlorophyll A/B binding protein (ppa010015m and ppa010034m) or to the photosystem I
(ppa013313m) were all down-regulated at 12 hpi. Additionally, 14 differentially expressed genes in
the set of novel transcripts were similar to genes involved in photosynthesis (photosystem I and II

Chapter 5
122
proteins, Table A.10 in the Appendix) and were all identified as significantly down-regulated at 12
hpi. These results are in accordance with previous observations, e.g. in the A. thaliana – P. syringae
pathosystem (Bonfig et al. 2006), but also in kumquat leaves challenged by X. citri subsp. citri (Khalaf
et al. 2011). It was hypothesized that the down-regulation of genes involved in photosynthesis could
induce a hypersensitive response following the inoculation (Khalaf et al. 2011). This could also be due
to a strategy of the plant to limit the availability of sugars for the pathogen, to fitness costs for the
plant which has to reallocate for defense (Bolton 2009), or to protect the photosynthetic apparatus
against oxidative damage (Niyogi 2000).
5.4.5.4. Genes involved in hormone signaling pathways
Hormones play an important role as signaling molecules in response to biotic stresses, especially
salicylic acid (SA), jasmonates (JA) and ethylene (ET) (reviewed in Bari and Jones 2009). Kim et al.
(2011) did not observe any significant differentially expressed SA-related gene in soybean after X.
axonopodis pv. glycines inoculation, but identified differentially expressed JA-signaling genes. Here,
no gene involved in SA-, JA- or ET-signaling pathways was differentially expressed. However,
ppa004865m which is similar to LAX2 could be involved in auxin transport, and ppa013981m similar
to genes belonging to the SAUR-like auxin-responsive protein family could play a role in auxin
signaling pathway (Woodward and Bartel 2005); both were down-regulated in our study (Table A.7 in
the Appendix). Blocking auxin responses in A. thaliana was shown to increase plant resistance to
Pseudomonas syringae pv. maculicola (Wang et al. 2007). Furthermore, the suppression of auxin
signaling pathway promotes the SA- and JA-signaling pathways, and inhibits the expansin expression
in rice after X. oryzae pv. oryzae inoculation (Ding et al. 2008). Three expansin-like genes were
identified as down-regulated 12 hpi. Expansins are known as regulators of cell wall extension during
cell growth. On the other side, one of the most down-regulated genes (ppa020764m, with a log2 fold
change of -6.0, Table A.7 in the Appendix) at 12 hpi could be involved in the gibberellin-signaling
pathway. Although they have been much less studied than the other defense-related signaling
molecules SA, JA and ET, gibberellins could also actively play a role in the plant defense response by
activating or repressing these signaling molecules (Bari and Jones 2009).
5.4.5.5. An important down-regulation of cytochrome-like genes
Among the differentially expressed genes, a very high number of down-regulated (ten down-regulated
on a total of 11 differentially expressed genes, Table A.7 in the Appendix) homologs to genes
encoding cytochrome P450s (CYP) were observed at 12 hpi. CYP play diverse roles such as
antioxidants, UV protectants, detoxification of pollutants, biosynthesis of hormones, but are also
known to be involved in basal plant defense against a wide variety of pathogens, including bacterial
pathogens (Hull et al. 2000; Werck-Reichhart and Feyereisen 2000; Schuler and Werck-Reichhart
2003). Another set of 13 cytochrome related genes were all down-regulated among the set of novel

Chapter 5
123
transcripts (Table A.10 in the Appendix). In our study, the down-regulation of CYP genes is
probably one of the most pronounced transcriptional change following the infection by X. arboricola
pv. pruni. This is an indication of a possible strategy for the pathogen to delay the stress signaling
pathways of the plant.
5.4.5.6. Putative resistance genes
PAMP-triggered immunity can be inactivated by bacterial type III effectors which are directly
delivered into the host cells via the type III secretion system. These effectors interfere with the host
cell function to induce disease (Greenberg and Vinatzer 2003). They can be recognized in the plant by
resistance (R) genes: this is a gene-for-gene resistance which leads to extracellular oxidative burst,
induction of salicylic acid signaling pathway, calcium and hydrogen influxes in the cell, and cell death
or hypersensitive response (Bolwell et al. 2001). Although only a few genes were differentially
expressed at 2 hpi, several putative R genes were identified; among them the two RPM1-like genes
containing NB-ARC domains (ppa019283m and ppa016517m) and known for conferring resistance to
P. syringae in A. thaliana (Grant et al. 1995) were up-regulated. Two others, one putative leucine-rich
repeat (LRR) kinase (ppa025198m) and one coding for a putative disease resistance protein containing
TIR-NBS-LRR motives (ppa024010m) were down-regulated. Among the 28 novel transcripts
identified at 2 hpi, one down-regulated gene coding for a putative receptor-like kinase was detected on
scaffold 2 (Table A.9 in the Appendix).
Twelve hours post inoculation, several putative R genes were differentially expressed, among
them four RPM1-like genes (ppa000961m, ppa021560m, ppa024705m, ppa026627m), two putative
genes coding for LRR protein kinases (ppa018586m and ppa017496m), one for cysteine proteinase
(ppa008267m) that could be involved in cell death, and seven belonged to disease resistance protein
families with LRR motives (ppa000999m, ppb021252m, ppa021712m), CC-NBS-LRR motives
(ppa017163m, ppa001498m) or TIR-NBS-LRR motives (ppa025848m, ppa026531m). All these genes
were up-regulated at 12 hpi, with log2 fold changes ranging from 2.0 to 3.3 (Table A.7 in the
Appendix).
5.4.5.7. Defense-related genes
Two pathogenesis related thaumatin genes (ppa010418m and ppa010410m) identified in our study
were down-regulated at 12 hpi. Similar genes were reported to be overexpressed during the interaction
of X. oryzae pv. oryzae with rice, and conferred a moderate level of resistance (Mahmood et al. 2009).
Other putative defense-related genes, such as one coding for a chitinase A (ppa026927m), five for
terpene synthases (ppa016292m, ppa020831m, ppa023341m, ppa024025m, and ppa024760m) and
five for glutathione S-transferases (ppa014555m, ppa018201m, ppa019045m, ppa023395m, and
ppb009348m) were differentially expressed at 12 hpi. Two additional up-regulated putative genes

Chapter 5
124
coding for a LRR receptor-like serine threonine-protein kinase and a receptor protein kinase-like were
identified among the set of novel transcripts on scaffold 6 (Table A.10 in the Appendix).
5.4.6. Defense mechanisms in Prunus in response to X. arboricola pv. pruni
Up to now not much was known about the mechanisms of resistance against X. arboricola pv. pruni in
Prunus species. In peach, major QTLs were associated with bacterial spot resistance on LG1, 4, 5, and
6 (Yang 2012); and in apricot, a QTL was previously mapped on linkage group 5 of ‘Rouge de
Mauves’ with data issued from evaluations of two consecutive years (Socquet-Juglard et al. 2012b,
Chapter 3). Apricot and peach genomes being highly syntenic (Dondini et al. 2007; Jung et al. 2009),
the scaffold 5 of peach corresponds to the linkage group 5 of apricot. Thus we searched for
differentially expressed genes located on this scaffold. Four and 17 differentially expressed genes on
scaffold 5 were identified at 2h and 12 hpi, respectively. However, only one (ppa011598m, Table
A.10 in the Appendix) was in the confidence interval of the mapped QTL (Socquet-Juglard et al.
2012b, Chapter 3) and was only identified in the dataset of differentially expressed genes at 12 hpi.
This gene is similar to WR3 in A. thaliana which is a wound responsive gene coding for nitrate
transmembrane transporter. Three and 16 differentially expressed genes in the set of novel transcripts
were also identified on scaffold 5 at 2 and 12 hpi, respectively (Table A.9 and Table A.10 in the
Appendix). However, none of those genes were in the confidence interval of the apricot QTL. This
very low number of differentially expressed genes identified on scaffold 5 of peach in the confidence
interval determined on linkage group 5 of apricot may reflect the fact that we focused on the
identification of genes involved in early infection response in the peach genome whereas the QTL
identified in apricot was based on disease severity data obtained 42 days post inoculation.
Sherif et al. (2011) studied the level of expression of seven pathogenesis-related (PR) genes at
1, 4, 8, 24 and 48 hpi in the peach cultivar ‘Venture’ resistant to X. campestris (syn. arboricola) pv.
pruni and in the susceptible cultivar ‘BabyGold 5’. In a second study from Sherif and colleagues
(2012), ethylene response factors (ERFs) differentially expressed after X. arboricola pv. pruni
inoculation were further identified in the same cultivars and at the same time points. To identify the
transcripts corresponding to these genes on the peach genome, an analysis was performed using these
accessions as BLASTN queries (GenBank, accessions nos. HQ825094 to HQ825098, and JF694923 to
JF694927). A total of 23 genes potentially corresponding to the ERF and PR genes were found. From
the 17 potential PR genes, 11 were not differentially expressed, five were not expressed at all and one
was up-regulated only at 2 hpi, with a log2 fold change of 1.2 (Table A.11 in the Appendix). From
the six potential ERF genes found, four were not differentially expressed, one was not expressed and
only one was up-regulated at 2 hpi. These differences obtained between the studies could be due to the
difference of inoculation technique used, explaining why diverse sets of genes may be involved in
both studies. Indeed, in Sherif and colleagues experiments, plants were dipped into the inoculum,

Chapter 5
125
whereas here the inoculum was directly injected into the leaves and measurements were done at
slightly different time points.
5.5. Conclusions RNA-seq technology is a very valuable tool to enhance our understanding of the genetics underlying
the resistance mechanisms in pathosystems. This study is the first to give a global view of the gene
expression of a Prunus crop under pathogen attack. We provide insights of the peach transcriptome
once bacterial cells of X. arboricola pv. pruni have passed physical barriers and are inside the leaf.
Because plants may recognize the bacterial effectors and induce a hypersensitive response within 24h
(Cameron et al. 1994; Schneider et al. 2002), we performed comparisons of inoculated samples with
their respective controls at the early stages of 2 and 12 hpi. Although the peach variety used in our
study is moderately susceptible, many genes with potential defense-related functions were
differentially expressed at 12 hpi. Fewer genes were differentially expressed at 2 hpi, however the GO
annotations and classifications showed that genes belonging to a wide range of functional categories
were already involved in the defense response to the pathogen at this early time point. Furthermore,
the RNA-seq technology not only permitted to identify differentially expressed genes involved in
basal or gene-for-gene defense mechanisms, but also revealed novel differentially expressed genes and
transcripts of unknown functions. Thus, this study provides an important basis for further
characterization of peach defense-related genes in response to X. arboricola pv. pruni infection. The
results obtained will be used to support further research on the pathogen transcriptome and
characterize the host-pathogen molecular interactions.
Acknowledgments This project was partially funded by the Swiss Secretariat for Education and Research (SBF COST C08.0124) and was conducted within the European Science Foundation funded research network COST Action 873. We thank Verena Knorst for technical support and Jan Buchmann for writing scripts

Chapter 5
126
5.6. References Aarrouf J, Garcin A, Lizzi Y, El Maâtaoui M (2008) Immunolocalization and histocytopathological
effects of Xanthomonas arboricola pv. pruni on naturally infected leaf and fruit tissues on peach
(Prunus persica L. Batsch). J Phytopathology 156:338-345
Abbott AG, Lecouls AC, Wang Y, Georgi L, Scorza R, Reighard G (2002) Peach: the model genome
for Rosaceae genomics. Acta Hort 592:199–209
Adhikari B, Savory E, Vaillancourt B, Childs KL, Hamilton JP, Day B, Robin Buell C (2012)
Expression profiling of Cucumis sativus in response to infection by Pseudoperonospora cubensis.
PLOS ONE 7: e34954
Alfano JR, Collmer A (2004) Type III secretion system effector proteins: double agents in bacterial
disease and plant defense. Annu Rev Phytopathol 42:385-414
Allison SD, Schultz JC (2004) Differential activity of peroxidase isozymes in response to wounding,
gypsy moth, and plant hormones in northern red oak (Quercus rubra L.). J Chem Ecol 30:1363-
1379
An SH, Sohn KH, Choi HW, Hwang IS, Lee SC, Hwang BK (2008) Pepper pectin methylesterase
inhibitor protein CaPMEI1 is required for antifungal activity, basal disease resistance and abiotic
stress tolerance. Planta 228: 61–78
Anonymous (2006) EPPO standards PM 7/64. Diagnostics Xanthomonas arboricola pv. pruni. Bull.
EPPO 36:129-133
Arumuganathan K, Earle E (1991) Nuclear DNA content of some important plant species. Plant Mol
Biol Report 9:208–218
Arús P, Yamamoto T, Dirlewanger E, Abbott AG (2005) Synteny in the Rosaceae. Plant Breed Rev
27:175–211
Arús P, Verde I, Sosinski B, Zhebentyayeva T, Abbott AG (2012) The peach genome. Tree Genet
Genomes DOI: 10.1007/s11295-012-0493-8
Asai T, Tena G, Plotnikova J, Willmann MR, Chiu WL, Gómez-Gómez L, Boller T, Ausubel FM,
Sheen J (2002) MAP kinase signalling cascade in Arabidopsis innate immunity. Nature 415:977-
983
Bari R, Jones JDG (2009) Role of plant hormones in plant defense responses. Plant Mol Biol 69:473-
488
Bateman A, Birney E, Cerruti L, Durbin R, Etwiller L, Eddy SR, Griffiths-Jones S, Howe KL,
Marshall M, Sonnhammer EL (2002) The Pfam protein families database. Nucleic Acids Res
30:276-280
Bazzi C, Stefani E, Minardi P, Mazzucchi U (1990) Suscettibilità comparativa del susino a
Xanthomonas campestris pv. pruni. L’Informatore Agrario 46: 71-74

Chapter 5
127
Bolton MD (2009) Primary Metabolism and Plant Defense—Fuel for the Fire. MPMI 22: 487–497
Bolwell GP, Bindschedler LV, Blee KA, Butt VS, Davies DR, Gardner SL, Gerrish C, Minibayeva F
(2001) The apoplastic oxidative burst in response to biotic stress in plants: a three-component
system. J Exp Bot 53:1367-1376
Bonfig KB, Schreiber U, Gabler A, Roitsch T, Berger S (2006) Infection with virulent and avirulent P.
syringae strains differentially affects photosynthesis and sink metabolism in Arabidopsis leaves.
Planta 225:1-12
Bonghi C, Begheldo M, Ziliotto F, Rasori A, Trainotti L, Tosetti R, Tonutti P (2010) Transcriptome
analyses and postharvest physiology of peaches and nectarines. Acta Hort 877:69–73
Bourquin V, Nishikubo N, Abe H, Brumer H, Denman S, Eklund M, Christiernin M, Teeri TT,
Sundberg B, Mellerowicz EJ (2002) Xyloglucan endotransglycosylases have a function during
the formation of secondary cell walls of vascular tissues. Plant Cell 14: 3073–3088
Byrne DH, Raseira MB, Bassi D, Piagnani MC, Gasic K, Reighard GL, Moreno MA, Pérez S (2012)
Peach. In: Badenes ML and Byrne DH (eds.), Fruit Breeding, Handbook of Plant Breeding 8:505-
569
Cameron RK, Dixon RA, Lamb CJ (1994) Biologically induced systemic acquired resistance in
Arabidopsis thaliana. Plant J 5:715-725
Cocker JS, Davies E (2003) Selection of candidate housekeeping controls in tomato plants using EST
data. BioTechniques 35:740-748
Conesa A, Götz S, García-Gómez JM, Terol J, Talón M, Robles M (2005) Blast2GO: a universal tool
for annotation, visualization and analysis in functional genomics research. Bioinformatics
21:3674–3676
Ding X, Cao Y, Huang L, Zhao J, Xu C, Li X, Wang S (2008) Activation of the indole-3-acetic acid-
amido synthetase GH3-8 suppresses expansin expression and promotes salicylate- and jasmonate-
independent basal immunity in rice. Plant Cell 20:228–240
Dondini L, Lain O, Geuna F, Banfi R, Gaiotti F, Tartarini S, Bassi D, Testolin R (2007) Development
of a new SSR-based linkage map in apricot and analysis of synteny with existing Prunus maps.
Tree Genet Genomes 3:239–249
Eduardo I, Chietera G, Pirona R, Pacheco I, Troggio M, Banchi E, Bassi D, Rossini L, Vecchietti A,
Pozzi C (2012) Genetic dissection of aroma volatile compounds from the essential oil of peach
fruit: QTL analysis and identification of candidate genes using dense SNP maps. Tree Genet
Genomes DOI 10.1007/s11295-012-0546-z
Escamilla-Trevino LL, Chen W, Card ML, Shih MC, Poulton JE (2006) Arabidopsis thaliana β-
Glucosidases BGLU45 and BGLU46 hydrolyse monolignol glucosides. Phytochemistry 67:1651-
1660

Chapter 5
128
FAOSTAT (2010) www.faostat.org
Garcin A, Rouzet J, Nottéghem JL (2005) Xanthomonas des arbres fruitiers à noyau. Editions CTIFL,
Paris, France
Garcin A, Bresson J (2011) Sensibilité des arbres à noyau au Xanthomonas – Bilan de huit ans
d’expérimentation. L’arboriculture Fruitière 653: 30-33
Gómez-Gómez L, Boller T (2000) FLS2: An LRR receptor-like kinase involved in the perception of
the bacterial elicitor flagellin in Arabidopsis. Mol Cell 5:1003–1011
Grant MR, Godiard L, Straube E, Ashfield T, Lewald J, Sattler A, Innes RW, Dangl JL (1995)
Structure of the Arabidopsis RPM1 gene enabling dual specificity disease resistance. Science
269:843–846
Greenberg JT, Vinatzer BA (2003) Identifying type III effectors of plant pathogens and analyzing their
interaction with plant cells. Curr Opin Microbiol 6:20–28
Hajri A, Pothier JF, Fischer-Le Saux M, Bonneau S, Poussier S, Boureau T, Duffy B, Manceau C
(2012) Type three effector gene distribution and sequence analysis provide new insights into the
pathogenicity of plant-pathogenic Xanthomonas arboricola. Appl Environ Microbiol 78:371-384
He P, Shan L, Lin NC, Martin GB, Kemmerling B, Nurnberger T, Sheen J (2006) Specific bacterial
suppressors of MAMP signaling upstream of MAPKKK in Arabidopsis innate immunity. Cell
125:563-575
Howad W, Yamamoto T, Dirlewanger E, Testolin R, Cosson P, Cipriani G, Monforte AJ, Georgi L,
Abbott AG, Arús P (2005) Mapping with a few plants: Using selective mapping for microsatellite
saturation of the Prunus reference map. Genetics 171:1305-1309
Hull AK, Vij R, Celenza JL (2000) Arabidopsis cytochrome P450s that catalyze the first step of
tryptophan-dependent indole-3-acetic acid biosynthesis. Proc Natl Acad Sci USA 97:2379-2384
Jones JDG, Dangl JL (2006) The plant immune system. Nature 444:323-329
Joobeur T, Viruel MA, de Vicente MC, Jauregui B, Ballester J, Dettori MT, Verde I, Truco MJ,
Messeguer R, Batlle, Suanzes M, Quarta R, Dirlewanger E, Arús P (1998) Construction of a
saturated linkage map for Prunus using an almond × peach F2 progeny. Theor Appl Genet
97:1034-1041
Jung S, Jiwan D, Cho I, Lee T, Abbott A, Sosinski B, Main D (2009) Synteny of Prunus and other
model plant species. BMC Genomics 10:76
Keil HL, Fogle HW (1974) Orchard susceptibility of some apricot, peach, and plum cultivars and
selections to Xanthomonas pruni. Fruit Var J 28: 16-19
Khalaf AA, Gmitter FG, Conesa A, Dopazo J, Moore GA (2011) Fortunella margarita transcriptional
reprogramming triggered by Xanthomonas citri subsp. citri . BMC Plant Biol 11:159

Chapter 5
129
Kim CY, Zhang S (2004) Activation of a mitogen-activated protein kinase cascade induces WRKY
family of transcription factors and defense genes in tobacco. Plant J 38:142-151
Kim KH, Kang YJ, Kim DH, Yoon MY, Moon JK, Kim MY, Van K, Lee SH (2011) RNA-Seq
analysis of a soybean near-isogenic line carrying bacterial leaf pustule-resistant and –susceptible
alleles. DNA Res 1-15
Kogovšek P, Pompe-Novak M, Baebler S, Rotter A, Gow L, Gruden K, Foster GD, Boonham N,
Ravnikar M (2010) Aggressive and mild Potato virus Y isolates trigger different specific
responses in susceptible potato plants. Plant Pathol 59:1121-1132
Kristoffersen P, Brzobohaty B, Hohfeld I, Bako L, Melkonian M, Palme K (2000) Developmental
regulation of the maize Zm-g60. 1 gene encoding a beta-glucosidase located to plastids. Planta
210:407–415
Langmead B, Trapnell C, Pop M, Salzberg SL (2009) Ultrafast and memory-efficient alignment of
short DNA sequences to the human genome. Genome Biol 10:R25
Mahmood T, Jan A, Komatsu S (2009) Proteomic analysis of bacterial blight defense signaling
pathway using transgenic rice overexpressing thaumatin-like protein. Biol Plantarum 53:285-293
Manganaris GA, Rasori A, Bassi D, Geuna F, Ramina A, Tonutti P, Bonghi C (2011) Comparative
transcript profiling of apricot (Prunus armeniaca L.) fruit development and on-tree ripening. Tree
Genet Genomes 7: 609-616
Manosalva PM, Davidson RM, Liu B, Zhu XY, Hulbert SH, Leung H, Leach JE (2009) A germin-like
protein gene family functions as a complex quantitative trait locus conferring broad-spectrum
disease resistance in rice. Plant Physiol 149:286–296
McCarthy FM, Wang N, Magee GB, Nanduri B, Lawrence ML, Camon EB, Barrell DG, Hill DP,
Dolan ME, Williams WP, Luthe DS, Bridges SM, Burgess SC (2006) AgBase: a functional
genomics resource for agriculture. BMC Genomics 7:229
Morant A, Jorgensen K, Jorgensen C, Paquette SM, Sánchez-Pérez R, Lindberg Moller B, Bak S
(2006) β-Glucosidases as detonators of plant chemical defense. Phytochemistry 69:1795-1813
Niyogi KK (2000) Safety valves for photosynthesis. Curr Opin Plant Biol 3:455-460
Ogundiwin EA, Marti C, Forment J, Pons C, Granell A, Gradziel TM, Peace C, Crisosto C (2008)
Development of ChillPeah genomic tools and identification of cold-responsive genes in peach
fruits. Plant Mol Biol 68:379–397
Orshinsky AM, Hu J, Opiyo SO, Reddyvari-Channarayappa V, Mitchell TK, Boehm Mj (2012) RNA-
seq analysis of the Sclerotinia homoeocarpa-creeping bentgrass pathosystem. Plos One 7:e41150
Park CJ, Han SW, Chen X, Ronald PC (2010) Elucidation of XA21-mediated innate immunity. Cell
Microbiol 12:1017–1025

Chapter 5
130
Pasquer F, Frey B, Frey E (2008) Identification of cherry incompatibility alleles by microarray. Plant
Breed 127:413–417
Pothier JF, Smits THM, Blom J, Vorhölter FJ, Goesmann A, Pühler A, Duffy B (2011) Complete
genome sequence of the stone fruit pathogen Xanthomonas arboricola pv. pruni. Phytopathology
101:S144-S145
Rajapakse S, Belthoff LE, He G, Estager AE, Scorza R, Verde I, Ballard RE, Baird WV, Callahan A,
Monet R, Abbott AG (1995) Genetic linkage mapping in peach using morphological, RFLP and
RAPD markers. Theor Appl Genet 90:503–510
Schenk A, Weingart H, Ullrich MS (2008) Extraction of high-quality bacterial RNA from infected leaf
tissue for bacterial in planta gene expression analysis by multiplexed fluorescent Northern
hybridization. Mol Plant Pathol 9:227–235
Schneider M, Schlaich NL, Fellenberg K, Beissbarth T, Hauser NC, Vingron M, Slusarenko AJ,
Hoheisel JD (2002) Monitoring the switch from housekeeping to pathogen defense metabolism in
Arabidopsis thaliana using cDNA arrays. J Biol Chem 277:10555–10561
Schuler MA, Werck-Reichhart D (2003) Functional genomics of P450s. Annu Rev Plant Biol 54:629-
667
Sherif S, Paliyath G, Jayasankar S (2011) Molecular characterization of peach PR genes and their
induction kinetics in response to bacterial infection and signaling molecules. Plant cell Reports 4:
697-711
Sherif S, El-Sharkawy I, Paliyath G, Jayasankar S (2012) Differential expression of peach ERF
transcriptional activators in response to signaling molecules and inoculation with Xanthomonas
campestris pv. pruni. J Plant Physiol, doi:10.1016/j.jplph.2012.02.003
Smith EF (1903) Observation on a hitherto unreported bacterial disease, the cause of which enters the
plant through ordinary stomata. Science 17:456-457
Socquet-Juglard D, Patocchi A, Pothier JF, Christen D, Duffy B (2012a) Evaluation of Xanthomonas
arboricola pv. pruni inoculation techniques to screen for bacterial spot resistance in apricot. J
Plant Pathol 94:S1.91-S1.96
Socquet-Juglard D, Duffy B, Pothier JF, Christen D, Gessler C, Patocchi A (2012b) Identification of a
major QTL for Xanthomonas arboricola pv. pruni resistance in apricot. Tree Genet Genomes,
DOI: 10.1007/s11295-012-0562-z
Song WY, Wang GL, Chen LL, Kim HS, Pi LY, Holsten T, Gardner J, Wang B, Zhai WX, Zhu LH,
Fauquet C, Ronald P (1995) A receptor kinase-like protein encoded by the rice disease resistance
gene, Xa21. Science 270:1804–1806

Chapter 5
131
Sosinski B, Verde I, Morgante M, Rokhsar D (2010) The international peach genome initiative. A first
draft of the peach genome sequence and its use for genetic diversity analysis in peach. 5th
International Rosaceae genomics conference. November 2010. Stellenbosch (South Africa), O46
Tao Y, Xie Z, Chen W, Glazebrook J, Chang HS, Han B, Zhu T, Zou G, Katagiri F (2003)
Quantitative nature of Arabidopsis responses during compatible and incompatible interactions
with the bacterial pathogen Pseudomonas syringae. Plant Cell 15:317–30
Trainotti L, Bonghi C, Ziliotto F, Zanin D, Rasori A, Casadoro G, Ramina A, Tonutti P (2006) The
use of microarray µPEACH1.0 to investigate transcriptome changes during transition from
preclimacteric to climacteric phase in peach fruit. Plant Sci 170:606-613
Trapnell C, Williams BA, Pertea G, Mortazavi AM, Kwan G, et al. (2010) Transcript assembly and
quantification by RNA-Seq reveals unannotated transcripts and isoform switching during cell
differentiation. Nature Biotech 28:511-515
Trapnell C, Roberts A, Goff L, Pertea G, Kim D, Kelley DR, Pimentel H, Salzberg SL, Rinn JL,
Pachter L (2012) Differential gene and transcript expression analysis of RNA-Seq experiments
with TopHat and Cufflinks. Nature Protocols 3:562-578
Verde I, Bassil N, Scalabrin S, Gilmore B, Lawley CT et al (2012) Development and evaluation of a 9
K SNP array for peach by internationally coordinated SNP detection and validation in breeding
germplasm. PLoS One 7(4):e35668
Wang D, Pajerowska-Mukhtar K, Culler AH, Dong X (2007) Salicylic acid inhibits pathogen growth
in plants through repression of the auxin signaling pathway. Curr Biol 17:1784–1790
Wang Z, Gerstein M, Snyder M (2009) RNA-Seq: a revolutionary tool for transcriptomics. Nat Rev
Genet 10:57-63
Werck-Reichhart D, Feyereisen R (2000) Cytochromes P450: a success story. Genome Biol 1:
Reviews
Wichmann F, Asp T, Widmer F, Kölliker R (2011) Transcriptional responses of Italian ryegrass
during interaction with Xanthomonas translucens pv. graminis reveal novel candidate genes for
bacterial wilt resistance. Theor Appl Genet 122:567-569
Woodward AW, Bartel B (2005) Auxin: regulation, action, and interaction. Ann Bot 95:707–735
Yang N (2012) Mapping quantitative trait loci associated with resistance to bacterial spot
(Xanthomonas arboricola pv. pruni) in peach. PhD Dissertation, Clemson University
Ye XS, Pan SQ, Kuc J (1990) Association of pathogenesis-related proteins and activities of
peroxidase, β-1.3-glucanase and chitinase with systemic induced resistance to blue mold of
tobacco but not to systemic tobacco mosaic virus. Physiol Mol Plant Pathol 36:523-531

Chapter 6
General Conclusions and Outlook


General Conclusions and Outlook
134
Apricot (Prunus armeniaca L.) is not only appreciated for the fruits, but also for the flowers, wood
and almonds depending on cultures and traditions (Faust et al. 2008). Although the number of apricot
cultivars available worldwide is relatively important, there is a constant need for developing new
cultivars to satisfy grower, consumer and industry requirements, especially because of the
environment specificity of each cultivar (Pennone et al. 2006). Current breeding programs focus on
improving disease resistance, fruit quality, tree characteristics, adaptability to the environment and
productivity (Bassi and Audergon 2006; Zhebentyayeva et al. 2012).
So far most breeding programs in apricot relied on traditional techniques, and in the same way
as for other Rosaceae species, application of genetic markers has not been routinely implemented due
to economical and other technical and logistical barriers (Iezzoni et al. 2010). Classical breeding for
introgression of polygenic traits such as fruit quality, tree architecture, and resistance or tolerance to
diseases is labor-intensive and expensive. In addition, breeding in fruit crops is especially time
consuming due to the three to four years required before the onset of fruits, and also because
expression of traits in juvenile trees may differ from adult trees (Dosba 2003). Consequently, 20 years
or more may be required before the successful introduction of a gene of interest into a new
commercial cultivar (Monet et al. 1998). Studies aiming at the identification of molecular markers
linked to traits of interest via a quantitative trait loci (QTL) analysis could accelerate new cultivar
development, and would permit to save costs by using the molecular markers associated to these QTLs
for an early selection of the seedlings by reducing the number of plants in the orchards. In
Switzerland, breeding efforts are focusing on late blooming and late ripening apricot varieties, on fruit
quality traits like shelf-life, fruit size and color, on tree architecture and on disease resistance (Christen
et al. 2006; Christen et al. 2008; Christen et al. 2010). The recent identification of the bacterial
pathogen Xanthomonas arboricola pv. pruni in Valais causes a potential threat to apricot production in
the region. As a matter of fact, the disease is known to be responsible for severe yield losses, up to
70% in the USA under favorable conditions for the development of the pathogen, i.e. warm and very
humid conditions (Dunegan 1932; Stefani 2010). Control strategies against the pathogen are limited to
applications of copper-based compounds since the use of antibiotics in not allowed in Switzerland;
however copper applications can be phytotoxic (Ritchie 1995). Therefore, breeding for host resistance
is probably one of the most sustainable strategies.
Most resistance tests described in the literature were either based on evaluations performed in
highly contaminated fields and thus were extremely climate-dependent (Garcin et al. 2005; Garcin and
Bresson 2011), or based on detached leaf tests and other techniques (Randhawa and Civerolo 1985; du
Plessis 1988; Hammerschlag 1988; Shepard and Zehr 1994) which are not adapted for quantitative

General Conclusions and Outlook
135
tests. The first aim of this thesis was consequently to develop an inoculation technique that would
permit to screen for quantitative resistance of the plants against the pathogen (Chapter 2). Of the
different techniques tested in Chapter 2, the dip inoculation was the most reliable and reproducible
technique, and further gave quantitative results that could be compared to what was previously
observed in the orchards (Garcin and Bresson 2011). This technique was consequently chosen to
inoculate an F1 population derived from the cross “Harostar” x “Rouge de Mauves”, in which two
phenotypic traits were assessed over two years: the disease incidence and the resistance index. In the
meantime, a bi-parental genetic linkage map based on microsatellite and AFLP markers was
constructed for this population in the view of a QTL mapping. With the data from the two consecutive
years of observation combined, a major QTL for disease incidence accounting for 53% of the
phenotypic variation was identified on LG5 of “Rouge de Mauves” with microsatellite marker UDAp-
452 being very close to the peak of the QTL; and a QTL in the exact same region for resistance index
accounted for 46% of the phenotypic variation (Chapter 3). Two flanking markers to these QTLs were
further identified, which allows the application of these markers in a marker-assisted selection
program; in our study the use of marker UDAp-452 allowed a reduction of 35% of the disease
incidence by selecting the favorable allele. Although this region has not been confirmed in a different
genetic background, a very recent study in peach also identified a major QTL in a close region
accounting for both fruit and leaf resistance to the pathogen (Yang 2012). Yang (2012) further
identified major and minor QTLs on all other linkage groups, notably in regions which seem to co-
localize with regions in apricot for which we found markers linked by Kruskal-Wallis to disease
incidence and resistance index. However, common markers between both maps are required for a
more appropriate comparison. Unexpectedly, in Chapter 3 we identified only one region by interval
mapping involved in resistance traits against X. arboricola pv. pruni with the data of both years
combined. This may be due to the use of a bi-parental population for which one inconvenient is that
small-effect QTLs are often considered as insignificant, especially in the case of a small population of
101 individuals; this could also be due to a too small difference between the effects of the two alleles
or to homozygous regions in the parental genomes.
To complement the tools for molecular breeding in apricot, the genetic linkage maps of both
parents “Harostar” and “Rouge de Mauves” constructed in Chapter 3 were further used for a QTL
mapping of traits observed in the orchard over one or two consecutive years, including tree
architecture, time to initial reproductive bud break, and fruit quality traits (Chapter 4). Of special
interest are QTLs identified for tree shape on LG1 and LG5, time to initial reproductive bud break on
LG1 and LG4, fruit form on LG3 and fruit color on LG3 and LG7 which may help breeders to give
trees a better adaptability to production system requirements and to climatic conditions, but also to
improve the attractiveness of the fruits. The high collinearity of peach and apricot genomes (Dondini
et al. 2007; Illa et al. 2011) as well as the co-location of QTLs for time to reproductive bud break and

General Conclusions and Outlook
136
previously reported QTLs for flowering time in both species (Dirlewanger et al. 2012) could
demonstrate that molecular markers applied in one species could be linked in other species to similar
traits. A fine mapping strategy including markers in common to both species would be required to
allow more precise comparisons, and also to identify with a better accuracy candidate genes
underlying the QTLs. The high synteny between peach and apricot genomes could also permit the
saturation of the two parental linkage maps constructed in this thesis with the help of the peach SNP
v1 array recently developed by the International Peach SNP Consortium: it contains over 8,100 SNPs
covering the whole peach genome with an average of 1 SNP every 26.7 kb (Verde et al. 2012). The
SNP v1 array may further allow the identification of polymorphic markers in the region between
markers UDAp-428B and UDAp-457 on LG2 of “Rouge de Mauves”, which would permit to link
both sub-groups. However, it must be stressed that less than 20% of the SNP markers were
informative in the two studies available so far, with large gaps remaining (Yang 2012) or with linkage
groups without any mapped markers (Eduardo et al. 2012), probably due to large homozygous regions
and the low variability in the peach genome. In addition, the saturation of the maps is also limited by
the number of individuals. As a consequence, the identification of polymorphic markers in our gap is
not guaranteed. In any case, with a sufficient number of individuals presenting recombinations
allowing the saturation of both parental maps, QTLs could be mapped with a better accuracy. As such,
the identification of candidate genes involved in resistance to X. arboricola pv. pruni and other
agronomic traits of importance in apricot could be performed. Further, the saturation of the map with
the SNP v1 array would also allow a very precise comparison of the QTLs mapped with the ones
identified by Yang (2012) for resistance to bacterial spot.
Plant breeding has for main target the release of superior cultivars by constantly searching, identifying
and pyramiding genes of interest. Molecular markers linked to these genes are of great importance
because they permit to select at a very early stage plants with a desired genetic combination. In the
past years, major outcomes have been obtained in Prunus to efficiently search for new markers at very
low costs. With the release of the peach genome sequence in 2010 (International Peach Genome
Initiative: Peach Genome v1.0. 2010 http://www.rosaceae.org/peach/genome) and the decrease of
prices for next-generation sequencing technologies, studies at a transcriptome level have been recently
made much more accessible; thus this thesis further gives a first overview of the peach transcriptome
at the very early stages of infection with X. arboricola pv. pruni in peach. To date, the next-generation
sequencing technology is one of the most powerful tools available to detect SNPs; it also allows the
identification of candidate genes associated to specific traits and to know precisely their level of
expression. Although the comparative RNA-seq analysis performed in Chapter 5 with peach plants
permitted to identify only one candidate gene underlying the QTL mapped in Chapter 3, we obtained a
better understanding of the very first defense reaction of the plant following X. arboricola pv. pruni
attack. Indeed, different sets of genes that were differentially expressed at 2 and 12 hours post

General Conclusions and Outlook
137
inoculation were identified by comparison of the inoculated samples to their respective controls.
Among the genes of interest, several differentially expressed defense-related genes and resistance
genes were identified (Chapter 5). In Arabidopsis thaliana, it has been shown that the same set of
genes induces resistance or susceptibility to diseases, and that the difference of phenotype is due to the
timing and magnitude of the expression of those genes (Tao et al. 2003). Although the expression of
the genes identified in this thesis would need to be further confirmed by qRT-PCR, molecular markers
developed directly from these genes (functional markers, or genic molecular markers) could be very
valuable for marker-assisted selection (Varshney et al. 2009). Overall, with an improved knowledge of
plant defense response to X. arboricola pv. pruni infection and the detection of QTLs involved in
resistance to the disease, this thesis is an important step towards a sustainable disease management
strategy.

General Conclusions and Outlook
138
References
Bassi D, Audergon JM (2006) Apricot breeding: update and perspectives. Acta Hort 701: 279–294
Christen D, Ladner J, Monney P, Zürcher M, Rossier J (2006) Choix de variétés et de porte-greffe
dans la production d’abricots, de pêches et de nectarines. Commission professionnelle pour
l’examen des variétés de fruits, pp 7-28
Christen D, Yaicle A, Devèves G, Kellerhals M (2008) Programme de sélection d’abricots : nouvelles
variétés ACW prometteuses. Vitic Arboric Hortic 40: 277-281.
Christen D, Devènes G, Kellerhals M (2010) Recent Apricot Breeding Programme in Switzerland.
Acta Hort 862: 123-128
Dirlewanger E, Quero-García J, Le Dantec L, Lambert P, Ruiz D, Dondini L, Illa E, Quilot-Turion B,
Audergon JM, Tartarini S, Letourmy P, Arús P (2012) Comparison of the genetic determinism of
two key phenological traits, flowering and maturity dates, in three Prunus species: peach, apricot
and sweet cherry. Heredity 00:1–13
Dondini L, Lain O, Geuna F, Banfi R, Gaiotti F, Tartarini S, Bassi D, Testolin R (2007) Development
of a new SSR-based linkage map in apricot and analysis of synteny with existing Prunus maps.
Tree Genet Genomes 3:239–249
Dosba F (2003) Progress and prospects in stone fruit breeding. Acta Hort 622:35-43
du Plessis HJ (1988) Differential virulence of Xanthomonas campestris pv. pruni to peach, plum, and
apricot cultivars. Phytopathology 78:1312-1315
Dunegan JC (1932) The bacterial spot of peach and other stone fruits. US Dept Agr Tech Bui 273: 53
Eduardo I, Chietera G, Pirona R, Pacheco I, Troggio M, Banchi E, Bassi D, Rossini L, Vecchietti A,
Pozzi C (2012) Genetic dissection of aroma volatile compounds from the essential oil of peach
fruit: QTL analysis and identification of candidate genes using dense SNP maps. Tree Genet
Genomes DOI 10.1007/s11295-012-0546-z
Faust M, Surányi D, Nyujtó F (1998) Origin and dissemination of apricot. Hort Rev 22: 225–266
Garcin A, Rouzet J, Nottéghem JL (2005) Xanthomonas des arbres fruitiers à noyau. Editions CTIFL,
Paris, France
Garcin A, Bresson J (2011) Sensibilité des arbres à noyau au Xanthomonas – Bilan de huit ans
d’expérimentation. L’arboriculture Fruitière 653: 30-33
Hammerschlag FA (1988) Selection of peach cells for insensitivity to culture filtrates of Xanthomonas
campestris pv. pruni and regeneration of resistant plants. Theor Applied Genet 76:865-869
Iezzoni A, Weebadde C, Luby J, Yue C, van de Weg E, Fazio G, Main D, Peace CP, Bassil NV,
McFerson J (2010) RosBREED: Enabling Marker-Assisted Breeding in Rosaceae. Acta Hort
859:389-394

General Conclusions and Outlook
139
Illa E, Sargent D, Lopez Girona E, Bushakra J, Cestaro A, Crowhurst R, Pindo M, Cabrera A, van der
Knaap E, Iezzoni A, Gardiner S, Velasco R, Arús P, Chagné D, Troggio M (2011) Comparative
analysis of rosaceous genomes and the reconstruction of a putative ancestral genome for the
family. BMC Evol Biol 11: 9
Monet R, Guye A, Massonié G (1998) Breeding for resistance to green aphid Myzus persicae Sulzer in
the peach. Acta Hort 465: 171-175
Randhawa RS, Civerolo EL (1985) A detached-leaf bioassay for Xanthomonas campestris pv. pruni.
Phytopathology 75: 1060–1063
Ritchie DF (1995) Bacterial spot. In: Ogawa JM, Zehr EI, Bird GW, Ritchie DF, Uriu K, Uyemoto JK
(eds) Compendium of Stone Fruit Diseases. APS Press, St. Paul, MN
Shepard DP, Zehr EI (1994) Epiphytic persistence of Xanthomonas campestris pv. pruni on Peach and
Plum. Plant Dis 78: 627-629
Stefani E (2010) Economic significance and control of bacterial spot/canker of stone fruits caused by
Xanthomonas arboricola pv. pruni. J Plant Pathol 92: 99-103
Tao Y, Xie Z, Chen W, Glazebrook J, Chang HS, Han B, Zhu T, Zou G, Katagiri F (2003)
Quantitative nature of Arabidopsis responses during compatible and incompatible interactions
with the bacterial pathogen Pseudomonas syringae. Plant Cell 15:317–30
Varshney RK, Nayak SN, May GD, Jackson SA (2009) Next-generation sequencing technologies and
their implications for crop genetics and breeding. Trends in Biotechnology 9:522-530
Verde I, Bassil N, Scalabrin S, Gilmore B, Lawley CT, Gasic K, Micheletti D, Rosyara UR, Cattonaro
F, Vendramin E, Main D, Aramini V, Blas AL, Mockler TC, Bryant DW, Wilhelm L, Troggio M,
Sosinski B, Aranzana MJ, Arús P, Iezzoni A, Morgante M, Peace C (2012) Development and
evaluation of a 9K SNP array for Peach by Internationally Coordinated SNT detection and
validation in breeding germplasm. PlosOne 7: e35668
Yang N (2012) Mapping quantitative trait loci associated with resistance to bacterial spot
(Xanthomonas arboricola pv. pruni) in peach. PhD Dissertation, Clemson University, USA
Zhebentyayeva T, Ledbetter C, Burgos L, Llácer G (2012) Apricot. In: Badenes ML, Byrne DH (eds)
Fruit Breeding, Handbook of Plant Breeding Vol 8, pp 415-457

Appendix

Appendix
141
Fig. A.1. Linkage map of “Harostar”. Microsatellite markers are indicated in bold. Markers showing
segregation distortion are indicated by * significant distortion at P < 0.05, ** P < 0.01, *** P < 0.005
and **** P < 0.001. Loci of multilocus markers are indicated with letters

Appendix
142
Fig. A.2. Linkage map of “Rouge de Mauves”. Microsatellite markers are indicated in bold. Markers
showing segregation distortion are indicated by * significant distortion at P < 0.05, ** P < 0.01, and
*** P < 0.005. Loci of multilocus markers are indicated with letters

Appendix
143
Fig. A.3. Number of genes expressed at different sampling depths. Genes with FPKM values obtained
by Cufflinks v.2.0.1 higher than zero were considered as expressed. Max is the total number of reads
obtained in each sample.

Table A.1. Mean, minimum, maximum and type of distribution of traits observed in the F1 population subdivided by year of observation. For these traits no
QTL was identified by interval mapping
F1 Harostar Rouge de Mauves Trait year na Mean Min Max Mean Min Max Mean Min Max Distribution
Architecture
Trunk length b 2010 101 186 45 280
normal
2011 99 327 187 430
normal
Trunk length difference b
99 141 53 214
normal
Phenology
Maturity date c 2011 47 201 173 210
bimodal
2012 70 199 185 216
normal
Fruit quality
Titratable acidity d 2011 47 15.1 8.6 24.1 normal
2012 70 28.7 19.7 40.1 28 27.3 28.8 32 30.4 33.5 normal
Fruit weight e 2011 47 37.9 14.6 66.8
normal
2012 70 48.7 25.6 84.2 41 39.5 42.5 63 61.8 64.4 normal
Flesh weight e 2011 47 35.6 13.6 63
normal
2012 70 45.8 24.1 79.5 39.0 37.7 40.5 59.6 58.6 61.0 normal
stone weight e 2011 47 2.31 1.0 5.6 normal
2012 70 2.9 1.55 6.25 1.9 1.8 2.0 3.2 2.9 3.4 skewed towards light weight
Firmness f 2011 47 51.4 31.3 75
normal
2012 70 46.7 29.3 61.1 65 62.0 68.0 49 46.0 64.0 normal
a Number of genotypes observed for each trait b In cm c In Julian days from January 1st d In mEq/l e in g f In Durofel Index (DI), 0 is very soft and 100 is very hard

Table A.2. Spearman correlation coefficients between architectural traits measured in the F1 population “Harostar” x “Rouge de Mauves”
Traits Trunk length Trunk diameter Total branches Shape
2010 2011
2010 2011
2010 2011
2010
Architecture Trunk length 11 0.56 Trunk diameter 10 0.65 0.26 Trunk diameter 11 0.57 0.53 0.47 Total branches 10 0.23 ns
0.28 0.34 Total branches 11 ns ns
0.37 0.35 0.53 Shape 10 0.23 0.20 0.32 0.29 0.37 0.39 Shape 11 ns ns 0.20 0.37 0.24 ns 0.60
Table A.3. Spearman correlation coefficients between fruit quality traits measured in the F1 population “Harostar” x “Rouge de Mauves”
Traits year SSC TA Ground color Fruit form Stone weight Fruit weight Flesh weight Firmness
2011 2012 2011 2012 2011 2012 2011 2012 2011 2012 2011 2012 2011 2012 2011
SSC 2012 ns Titratable acidity 2011 0.41 ns
2012 0.45 0.32 0.51 Ground color 2011 ns ns ns ns
2012 ns ns ns ns 0.70 Fruit form 2011 ns ns ns ns -0.49 ns
2012 ns ns ns ns ns ns 0.69 Stone weight 2011 ns ns ns ns ns ns ns ns
2012 ns ns -0.34 ns 0.45 ns 0.35 ns 0.60 Fruit weight 2011 ns ns -0.35 ns ns ns ns ns 0.77 ns
2012 ns ns ns ns ns ns 0.47 0.31 0.44 0.71 ns Flesh weight 2011 ns ns -0.35 ns ns 0.36 ns ns 0.75 0.41 0.99 ns
2012 ns ns ns ns ns ns 0.47 0.33 ns 0.67 ns 0.99 ns Firmness 2011 -0.42 ns 0.42 ns 0.36 ns ns ns ns ns ns ns ns ns
2012 ns ns 0.36 ns ns ns ns ns ns ns ns ns ns ns ns

Appendix
146
Table A.4. Significant markers for tree architecture, phenology and fruit quality traits detected only by
Kruskal-Wallis test
Traits
Harostar Rouge de Mauves
year LGa positionb markerc KWd LGa positionb markerc KWd
Architecture
Trunk length 2010 2 25.08 UDAp-456 ***
3 59.03 E13-M18-252 ****
Trunk length 2011 2 61.34 E13-M18-140 *****
Phenology
Maturity date 2011 4 32.46 E13-M13-134 ****
4 17.28 UDAp-404 ****
Fruit quality
Total fruits 2011 7 3.2 UDAp-424B ***
7 0 UDAp-424D ***
Firmness 2011
4 96.15 E13-M18-336 ****
Titratable acidity 2011 1 13.27 E13-M18-371 ****
8 18.57 E12-M13-282 ***
2011 2 13.35 UDAp-428 ***
2012 6 64.59 PaCITA12 ***
1 77.2 E13-M12-107 ****
Flesh weight 2011
4 67.86 AMPA103 ****
2012 7 4.25 PaCA58 ****
2012 8 12.97 E12-M13-278 ***
Stone weight 2011 8 18.38 E13-M13-455 ***
4 67.86 AMPA103 ***
2012 8 13.38 E13-M13-455 ****
1 32.19 E13-M18-342 ****
2012 1 74.17 PaCITA7 ***
2 33.16 UDAp-498 ***
Fruit weight 2011
4 67.86 AMPA103 ****
2012 7 6.99 E13-M12-343 ****
2012 8 12.96 E12-M13-278 ***
a Linkage group b Location in cM of the marker linked to the trait c Marker information is available in Socquet-Juglard et al. (2012, Chapter 3)
d P value obtained by Kruskal-Wallis test. Significance at P < 0.005, < 0.001, and < 0.0001 is indicated as ***, ****, *****, respectively
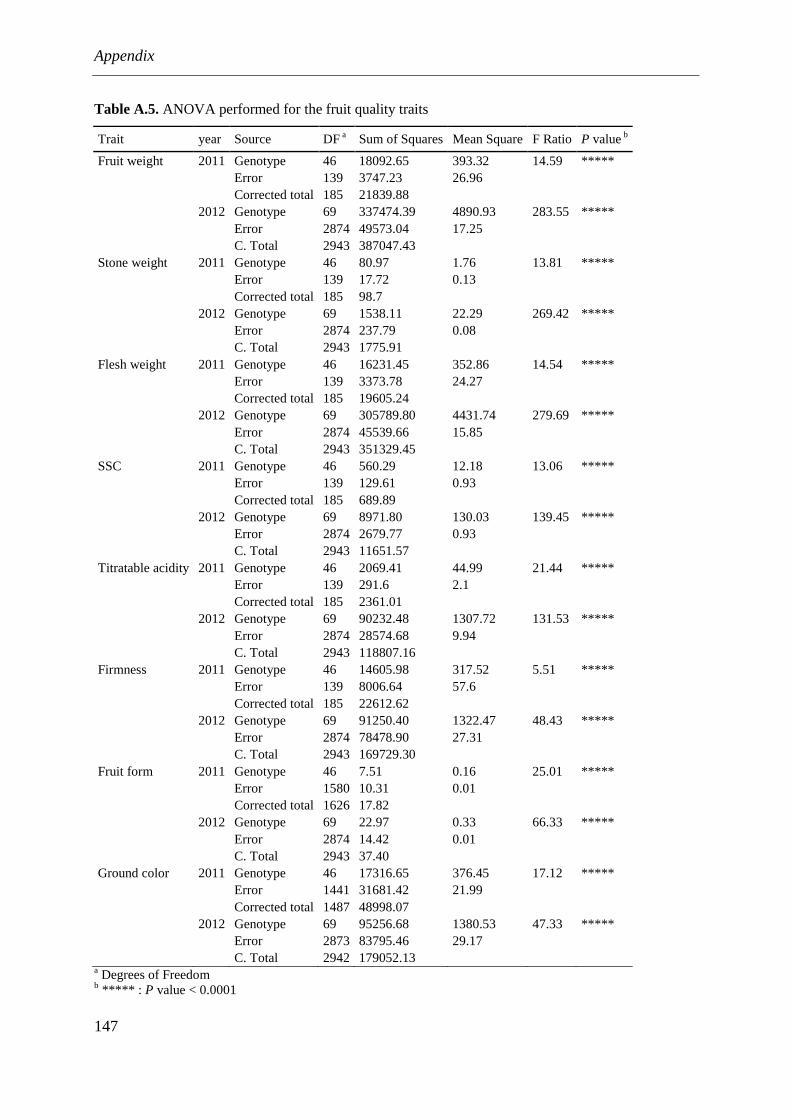
Appendix
147
Table A.5. ANOVA performed for the fruit quality traits
Trait year Source DF a Sum of Squares Mean Square F Ratio P value b
Fruit weight 2011 Genotype 46 18092.65 393.32 14.59 *****
Error 139 3747.23 26.96
Corrected total 185 21839.88
2012 Genotype 69 337474.39 4890.93 283.55 *****
Error 2874 49573.04 17.25
C. Total 2943 387047.43
Stone weight 2011 Genotype 46 80.97 1.76 13.81 *****
Error 139 17.72 0.13
Corrected total 185 98.7
2012 Genotype 69 1538.11 22.29 269.42 *****
Error 2874 237.79 0.08
C. Total 2943 1775.91
Flesh weight 2011 Genotype 46 16231.45 352.86 14.54 *****
Error 139 3373.78 24.27
Corrected total 185 19605.24
2012 Genotype 69 305789.80 4431.74 279.69 *****
Error 2874 45539.66 15.85
C. Total 2943 351329.45
SSC 2011 Genotype 46 560.29 12.18 13.06 *****
Error 139 129.61 0.93
Corrected total 185 689.89
2012 Genotype 69 8971.80 130.03 139.45 *****
Error 2874 2679.77 0.93
C. Total 2943 11651.57
Titratable acidity 2011 Genotype 46 2069.41 44.99 21.44 *****
Error 139 291.6 2.1
Corrected total 185 2361.01
2012 Genotype 69 90232.48 1307.72 131.53 *****
Error 2874 28574.68 9.94
C. Total 2943 118807.16
Firmness 2011 Genotype 46 14605.98 317.52 5.51 *****
Error 139 8006.64 57.6
Corrected total 185 22612.62
2012 Genotype 69 91250.40 1322.47 48.43 *****
Error 2874 78478.90 27.31
C. Total 2943 169729.30
Fruit form 2011 Genotype 46 7.51 0.16 25.01 *****
Error 1580 10.31 0.01
Corrected total 1626 17.82
2012 Genotype 69 22.97 0.33 66.33 *****
Error 2874 14.42 0.01
C. Total 2943 37.40
Ground color 2011 Genotype 46 17316.65 376.45 17.12 *****
Error 1441 31681.42 21.99
Corrected total 1487 48998.07
2012 Genotype 69 95256.68 1380.53 47.33 *****
Error 2873 83795.46 29.17
C. Total 2942 179052.13
a Degrees of Freedom b ***** : P value < 0.0001

Note: from Table A.6 to Table A.8, Pfam, Panther and KOG correspond to different databases of protein families, and At Tag corresponds to the locus tag of the closest Arabidopsis thaliana gene Table A.6. Differentially expressed peach genes at 2 hpi by pair-wise comparison of inoculated sample to the mock-inoculated sample
gene locus log2 (fold_change)
p_value pfam panther KOG At Tag gene annotation
ppa018078m scaffold_3:15908056-15910241 2.00 0.00011104
AT5G55490.1 GEX1 gamete expressed protein 1
ppa008191m scaffold_1:43326690-43328475 2.01 0 PF00190,PF07883
AT1G07750.1
RmlC-like cupins superfamily protein
ppa005520m scaffold_2:10688046-10690379 2.03 7.20E-09
PTHR11926 KOG1192 AT5G65550.1
UDP-Glycosyltransferase superfamily protein
ppa026843m scaffold_4:7730728-7732600 -2.04 7.93E-08 PF02365
AT3G12910.1
NAC (No Apical Meristem) domain transcriptional regulator superfamily protein
ppa024025m scaffold_4:6868563-6870716 2.05 7.34E-11 PF01397,PF03936
AT3G25820.1 TPS-CIN terpene synthase-like sequence-1,8-cineole
ppa026646m scaffold_6:26215585-26216104 2.06 8.31E-06 PF05641
AT1G06340.1
Plant Tudor-like protein
ppa003630m scaffold_2:10311839-10314437 2.08 2.68E-09 PF00004 PTHR23070 KOG0743 AT5G57480.1
P-loop containing nucleoside triphosphate hydrolases superfamily protein
ppa005210m scaffold_4:13933138-13935242 2.08 0 PF00332,PF07983
AT5G55180.1
O-Glycosyl hydrolases family 17 protein
ppa024010m scaffold_6:5601484-5606968 -2.10 2.79E-07 PF01582,PF00931,PF00560 PTHR23155 KOG4658 AT5G36930.1
Disease resistance protein (TIR-NBS-LRR class) family
ppa006471m scaffold_4:25896488-25897875 2.10 0.00036083 PF04564 PTHR22849
AT1G49780.1 PUB26 plant U-box 26
ppa007865m scaffold_8:13473672-13475324 2.12 7.06E-09 PF03171 PTHR10209 KOG0143 AT3G19000.1
2-oxoglutarate (2OG) and Fe(II)-dependent oxygenase superfamily protein
ppa019283m scaffold_5:2860133-2863032 2.13 1.85E-06 PF00931,PF00560 PTHR23155 KOG4658 AT3G07040.1 RPM1 NB-ARC domain-containing disease resistance protein
ppa017486m scaffold_9:961659-962939 -2.21 5.53E-06 PF03140
AT2G36430.1
Plant protein of unknown function (DUF247)
ppa011026m scaffold_1:27131290-27132679 2.27 0 PF00445 PTHR11240 KOG1642 AT2G02990.1 RNS1 ribonuclease 1
ppa025699m scaffold_6:4643308-4646271 2.27 0.00010466 PF05922,PF00082,PF02225 PTHR10795
AT3G46850.1
Subtilase family protein
ppa025363m scaffold_1:30238934-30239564 2.32 1.07E-05 PF00407,PF10604
AT1G70830.3 MLP28 MLP-like protein 28
ppa016517m scaffold_4:8554326-8556947 2.33 0.00045847 PF00931,PF00560 PTHR23155 KOG4658 AT3G07040.1 RPM1 NB-ARC domain-containing disease resistance protein
ppa016854m scaffold_3:2014891-2015275 -2.37 0.00095833
ppa003298m scaffold_2:2040663-2044301 2.38 0.00033805 PF07690,PF00854 PTHR11654 KOG1237 AT3G54450.1
Major facilitator superfamily protein
ppa023506m scaffold_6:11139729-11142503 2.56 9.90E-05
AT3G11590.1
ppa018164m scaffold_5:15819197-15819660 2.60 0.0002883
AT3G47510.1
ppa017640m scaffold_6:20169905-20172507 2.72 1.47E-14 PF00010 PTHR11514
AT4G37850.1
basic helix-loop-helix (bHLH) DNA-binding superfamily protein
ppa008019m scaffold_1:4759753-4762427 2.76 2.35E-05 PF00560 PTHR23155 KOG0617 AT2G19330.1 PIRL6 plant intracellular ras group-related LRR 6
ppa020955m scaffold_6:11252347-11253498 2.79 1.08E-06 PF00106 PTHR19410 KOG0725 AT2G47140.1
NAD(P)-binding Rossmann-fold superfamily protein
ppa024618m scaffold_2:25987556-25989852 2.82 0.00035102 PF00628,PF00856 PTHR22884
AT5G24330.1 ATXR6 ARABIDOPSIS TRITHORAX-RELATED PROTEIN 6
ppa021264m scaffold_2:10329645-10330038 2.82 8.38E-07
AT2G31940.1
ppa002624m scaffold_1:1984511-1987374 2.83 1.13E-10 PF11594 PTHR13871:SF2
AT3G01680.1
ppa016957m scaffold_5:2887784-2891309 2.87 5.11E-05
AT5G45610.1 SUV2 protein dimerizations
ppa007061m scaffold_1:40466841-40469246 2.95 2.97E-05 PF00892
AT4G08290.1
nodulin MtN21 /EamA-like transporter family protein
ppa024876m scaffold_5:10557288-10557924 -2.99 4.58E-09 PF04525
AT3G14260.1
Protein of unknown function (DUF567)
ppa025198m scaffold_6:25525959-25528589 -3.00 0.00080266 PF08263,PF00560 PTHR23258 KOG4579 AT1G79620.1
Leucine-rich repeat protein kinase family protein
ppa018309m scaffold_7:14410465-14411845 3.17 2.90E-12 PF03140
AT2G36430.1
Plant protein of unknown function (DUF247)
ppa026854m scaffold_2:16627379-16628006 3.56 5.50E-05 PF00097 PTHR16047
AT5G03450.1
Transducin/WD40 repeat-like superfamily protein
ppa000571m scaffold_3:15096489-15103179 3.76 9.39E-07
AT5G48310.2

Table A.7. Differentially expressed peach genes at 12 hpi by pair-wise comparison of inoculated sample to the mock-inoculated sample
gene locus log2 (fold_ change)
p_value pfam panther KOG At Tag gene annotation
ppa000961m scaffold_5:2844675-2847534 2.02 1.64E-08 PF00931,PF00560 PTHR23155 KOG4658 AT3G07040.1 RPM1 NB-ARC domain-containing disease resistance protein
ppa000999m scaffold_2:18032007-18036356 2.15 7.18E-06 PF00560 PTHR23258 KOG0472 AT2G34930.1
disease resistance family protein / LRR family protein
ppa001135m scaffold_5:18201752-18206006 -2.18 4.53E-05 PF00862,PF00534 PTHR12526 KOG0853 AT1G73370.1 SUS6 sucrose synthase 6
ppa001340m scaffold_4:1813674-1818989 -2.02 8.38E-08 PF01301,PF02140 PTHR23421 KOG0496 AT2G28470.1 BGAL8 beta-galactosidase 8
ppa001363m scaffold_8:11532089-11538622 -3.07 4.91E-09 PF01301,PF02140 PTHR23421 KOG0496 AT4G36360.1 BGAL3 beta-galactosidase 3
ppa001498m scaffold_7:15945259-15949214 3.31 1.19E-11 PF00931,PF00560,PF05659 PTHR23155 KOG4658 AT5G66900.1
Disease resistance protein (CC-NBS-LRR class) family
ppa001656m scaffold_8:21719593-21723317 -2.05 7.59E-05 PF00933,PF01915
AT1G02640.1 BXL2 beta-xylosidase 2
ppa001718m scaffold_1:9201980-9206434 2.91 8.29E-13 PF00933,PF01915
AT5G49360.1 BXL1 beta-xylosidase 1
ppa002572m scaffold_6:26559942-26562551 -2.66 3.17E-05 PF00012 PTHR19375 KOG0100 AT5G42020.1 BIP2 Heat shock protein 70 (Hsp 70) family protein
ppa002624m scaffold_1:1984511-1987374 -2.03 0.00055845 PF11594 PTHR13871:SF2
AT3G01680.1
ppa002804m scaffold_4:8569748-8572300 -2.64 0 PF03055 PTHR10543 KOG1285 AT3G14440.1 NCED3 nine-cis-epoxycarotenoid dioxygenase 3
ppa003180m scaffold_2:20505004-20506820 2.12 1.14E-08 PF06813,PF07690 PTHR21576
AT2G39210.1
Major facilitator superfamily protein
ppa003183m scaffold_4:19409996-19412974 -3.04 1.91E-05 PF00005,PF01061 PTHR19241 KOG0061 AT3G21090.1
ABC-2 type transporter family protein
ppa003296m scaffold_6:4899350-4901808 -3.27 4.01E-06 PF07732,PF00394,PF07731 PTHR11709 KOG1263 AT2G29130.1 LAC2 laccase 2
ppa003349m scaffold_2:23323510-23325731 3.76 4.58E-05 PF07732,PF00394,PF07731 PTHR11709 KOG1263 AT2G40370.1 LAC5 laccase 5
ppa003400m scaffold_8:21425388-21428829 -2.27 4.83E-05 PF04043,PF01095
AT4G02320.1
Plant invertase/pectin methylesterase inhibitor superfamily
ppa003422m scaffold_5:9981558-9984803 -2.09 4.70E-06 PF00732,PF05199 PTHR11552 KOG1238 AT1G12570.1
Glucose-methanol-choline (GMC) oxidoreductase family protein
ppa003528m scaffold_1:8026381-8028341 -5.92 3.82E-08 PF04043,PF01095
AT5G27870.1
Plant invertase/pectin methylesterase inhibitor superfamily
ppa003715m scaffold_6:1174626-1176515 5.82 9.58E-05 PF07732,PF00394,PF07731 PTHR11709 KOG1263 AT1G55570.1 sks12 SKU5 similar 12
ppa003831m scaffold_3:8324770-8328703 -2.25 3.91E-11 PF00232 PTHR10353 KOG0626 AT2G44450.1 BGLU15 beta glucosidase 15
ppa003832m scaffold_7:17995922-18000786 2.20 7.75E-06 PF00501 PTHR11968 KOG1176 AT1G20560.1 AAE1 acyl activating enzyme 1
ppa004002m scaffold_1:25307218-25311678 -3.12 1.74E-11 PF00295
AT1G60590.1
Pectin lyase-like superfamily protein
ppa004011m scaffold_1:34465238-34468221 -2.12 1.79E-11 PF08392,PF08541
AT2G26250.1 KCS10 3-ketoacyl-CoA synthase 10
ppa004166m scaffold_4:26687004-26690577 2.34 2.49E-12
PTHR11785 KOG1289 AT2G01170.1 BAT1 bidirectional amino acid transporter 1
ppa004236m scaffold_2:23027210-23030165 -2.31 0.00035352 PF03005
AT3G55990.1 ESK1 Plant protein of unknown function (DUF828)
ppa004336m scaffold_4:5076835-5078837 -3.15 1.55E-05 PF03765,PF00650 PTHR23324 KOG1471 AT1G30690.1
Sec14p-like phosphatidylinositol transfer family protein
ppa004635m scaffold_6:21292414-21295206 -3.11 7.28E-07 PF00067 PTHR19383 KOG0156 AT4G37370.1 CYP81D8 cytochrome P450, family 81, subfamily D, polypeptide 8
ppa004689m scaffold_6:25694688-25697043 -2.09 1.01E-07
PTHR11601 KOG1549 AT5G26600.1
Pyridoxal phosphate (PLP)-dependent transferases superfamily protein
ppa004817m scaffold_6:9773812-9778966 -4.01 2.22E-14 PF07993,PF03015 PTHR11011 KOG1221 AT4G33790.1 CER4 Jojoba acyl CoA reductase-related male sterility protein
ppa004832m scaffold_7:19041633-19043368 -2.87 0.00021192 PF00067 PTHR19383 KOG0156 AT5G07990.1 TT7 Cytochrome P450 superfamily protein
ppa004865m scaffold_8:16297288-16300825 -4.34 8.49E-05 PF01490 PTHR22950 KOG1303 AT2G21050.1 LAX2 like AUXIN RESISTANT 2
ppa005020m scaffold_6:4925453-4931204 -2.18 1.37E-05 PF00067 PTHR19383 KOG0157 AT2G29090.1 CYP707A2 cytochrome P450, family 707, subfamily A, polypeptide 2
ppa005040m scaffold_3:7320060-7322318 -2.36 5.40E-06
PTHR13683 KOG1339 AT1G79720.1
Eukaryotic aspartyl protease family protein
ppa005043m scaffold_1:41718602-41720233 2.30 3.48E-09
PTHR11926 KOG1192 AT1G22360.1 UGT85A2 UDP-glucosyl transferase 85A2
ppa005058m scaffold_8:4292732-4296036 2.00 2.22E-09 PF04863,PF04864 PTHR11751
AT1G34060.1
Pyridoxal phosphate (PLP)-dependent transferases superfamily protein
ppa005104m scaffold_7:13306761-13308445 -2.24 1.83E-09
PTHR13683 KOG1339 AT3G52500.1
Eukaryotic aspartyl protease family protein
ppa005248m scaffold_7:13737530-13739298 -3.31 5.28E-06
AT3G52610.1
ppa005351m scaffold_3:18563325-18565121 -3.02 0 PF01190
AT5G15780.1
Pollen Ole e 1 allergen and extensin family protein
ppa005420m scaffold_8:15559499-15564806 2.05 1.67E-06 PF00450 PTHR11802 KOG1282 AT3G12203.1 scpl17 serine carboxypeptidase-like 17
ppa005711m scaffold_3:12994614-12995959 2.29 1.56E-10 PF04564,PF00514,PF11789 PTHR22849
AT5G37490.1
ARM repeat superfamily protein
ppa005724m scaffold_1:24616228-24619139 2.43 2.83E-07 PF07002,PF00097 PTHR10857 KOG4172 AT3G01650.1 RGLG1 RING domain ligase1
ppa005789m scaffold_1:46502408-46503881 -2.97 1.88E-10
PTHR13683 KOG1339 AT1G09750.1
Eukaryotic aspartyl protease family protein
ppa005943m scaffold_3:21575627-21577118 2.52 0.00041385 PF02458
AT5G41040.1
HXXXD-type acyl-transferase family protein
ppa005966m scaffold_2:2426090-2428720 -2.42 3.94E-08
PTHR13683 KOG1339 AT3G54400.1
Eukaryotic aspartyl protease family protein
ppa006041m scaffold_2:20039399-20041459 -3.66 7.11E-09 PF00010
KOG4029 AT2G46810.1
basic helix-loop-helix (bHLH) DNA-binding superfamily protein
ppa006043m scaffold_6:24175251-24178089 -3.59 0 PF01699
KOG1397 AT2G38170.1 CAX1 cation exchanger 1

gene locus log2 (fold_ change)
p_value pfam panther KOG At Tag gene annotation
ppa006110m scaffold_7:13843373-13847159 5.96 0 PF00232 PTHR10353 KOG0626 AT2G44480.1 BGLU17 beta glucosidase 17
ppa006169m scaffold_9:1517680-1521370 -2.82 5.16E-05 PF00155 PTHR11751 KOG0259 AT5G53970.1
Tyrosine transaminase family protein
ppa006351m scaffold_7:17754475-17758740 -2.22 2.20E-08 PF04749
AT4G35920.1 MCA1 PLAC8 family protein
ppa006439m scaffold_6:24978320-24979748 -2.95 2.46E-08 PF04844
AT2G30400.1 OFP2 ovate family protein 2
ppa006485m scaffold_3:16472777-16474019 -2.74 5.23E-09 PF07714,PF00069 PTHR22986 KOG0198 AT5G55090.1 MAPKKK15 mitogen-activated protein kinase kinase kinase 15
ppa007004m scaffold_2:20558433-20560404 -2.37 1.55E-12 PF00378 PTHR11941 KOG1684 AT5G65940.1 CHY1 beta-hydroxyisobutyryl-CoA hydrolase 1
ppa007038m scaffold_1:36849780-36851421 -3.73 0.00084422 PF00320 PTHR22949:SF3 KOG1601 AT5G25830.1 GATA12 GATA transcription factor 12
ppa007061m scaffold_1:40466841-40469246 2.81 3.63E-09 PF00892
AT4G08290.1
nodulin MtN21 /EamA-like transporter family protein
ppa007096m scaffold_7:16446639-16449816 -2.42 1.76E-06 PF04193 PTHR14856:SF7 KOG2913 AT4G36850.1
PQ-loop repeat family protein / transmembrane family protein
ppa007138m scaffold_1:35950969-35952673 -2.14 0.00026157
PTHR13902:SF3
AT1G60060.1
Serine/threonine-protein kinase WNK (With No Lysine)-related
ppa007308m scaffold_6:4619411-4622200 2.35 2.38E-13
AT5G59050.1
ppa007395m scaffold_8:16182126-16184042 -4.23 0 PF06735,PF01190
AT2G21140.1 PRP2 proline-rich protein 2
ppa007452m scaffold_1:38335755-38339417 -2.08 2.31E-11 PF04862
AT5G11420.1
Protein of unknown function, DUF642
ppa007530m scaffold_2:9695840-9697136 -2.25 2.01E-06 PF08263,PF00560 PTHR23258
AT3G20820.1
Leucine-rich repeat (LRR) family protein
ppa007577m scaffold_4:11128295-11130419 4.60 3.92E-07 PF02365
AT3G15510.1 NAC2 NAC domain containing protein 2
ppa007728m scaffold_5:17888820-17891448 -2.79 7.99E-15 PF03951,PF00120 PTHR20852 KOG0683 AT5G37600.1 GSR 1 glutamine synthase clone R1
ppa007765m scaffold_6:3408568-3409806 -2.09 2.92E-09 PF08263,PF00560 PTHR23258
AT3G20820.1
Leucine-rich repeat (LRR) family protein
ppa007950m scaffold_1:897926-900908 -2.24 2.61E-06 PF01564 PTHR11558 KOG1562 AT5G19530.1 ACL5 S-adenosyl-L-methionine-dependent methyltransferases superfamily protein
ppa008126m scaffold_7:8608002-8609466 2.68 2.98E-13 PF00332
AT3G57270.1 BG1 beta-1,3-glucanase 1
ppa008267m scaffold_4:2843852-2845181 3.04 0 PF08246,PF00112 PTHR12411 KOG1543 AT3G49340.1
Cysteine proteinases superfamily protein
ppa008289m scaffold_3:20494736-20497858 -3.50 9.54E-05 PF00484 PTHR11002 KOG1578 AT3G01500.2 CA1 carbonic anhydrase 1
ppa008294m scaffold_6:25937090-25938833 -3.35 4.46E-13 PF01501 PTHR11183 KOG1950 AT1G56600.1 GolS2 galactinol synthase 2
ppa008436m scaffold_1:30853030-30855885 2.44 4.45E-11 PF00149 PTHR10161 KOG2679 AT1G14700.1 PAP3 purple acid phosphatase 3
ppa008482m scaffold_8:98302-100206 3.21 0.00061246 PF00294 PTHR10584 KOG2855 AT4G10260.1
pfkB-like carbohydrate kinase family protein
ppa008521m scaffold_1:8422464-8424310 2.08 7.12E-11 PF01501 PTHR11183 KOG1950 AT1G56600.1 GolS2 galactinol synthase 2
ppa008576m scaffold_6:26149072-26150261 3.88 1.22E-13 PF03059
AT1G09240.1 NAS3 nicotianamine synthase 3
ppa008874m scaffold_4:9870477-9871604 -2.08 3.30E-07 PF03181
AT5G25610.1 RD22 BURP domain-containing protein
ppa008891m scaffold_3:9916736-9917684 -2.56 6.55E-14 PF00290 PTHR10314 KOG4175 AT4G02610.1
Aldolase-type TIM barrel family protein
ppa008931m scaffold_3:17368954-17370630 -2.03 0.00036756 PF00134,PF02984 PTHR10177
AT4G03270.1 CYCD6;1 Cyclin D6;1
ppa008986m scaffold_1:8559589-8560948 -3.21 0
AT1G47980.1
ppa009090m scaffold_1:25611383-25612798 2.15 3.94E-10 PF00722,PF06955
AT1G10550.1 XTH33 xyloglucan:xyloglucosyl transferase 33
ppa009430m scaffold_4:2306566-2308181 -3.50 0 PF04720
AT4G32480.1
Protein of unknown function (DUF506)
ppa009528m scaffold_1:32328591-32331304 -2.94 2.22E-16 PF00657 PTHR22835:SF27
AT1G75900.1
GDSL-like Lipase/Acylhydrolase superfamily protein
ppa009608m scaffold_3:13672077-13673293 2.10 0.00054551 PF00722,PF06955
AT3G23730.1 XTH16 xyloglucan endotransglucosylase/hydrolase 16
ppa009686m scaffold_2:22866475-22868558 -2.14 6.81E-09 PF00504 PTHR21649
AT2G40100.1 LHCB4.3 light harvesting complex photosystem II
ppa009726m scaffold_7:20761066-20762758 -3.69 1.95E-12
AT2G46225.2 ABIL1 ABI-1-like 1
ppa009979m scaffold_1:43534560-43535371 -3.73 0.00084422 PF01151 PTHR11157 KOG3071 AT3G06470.1
GNS1/SUR4 membrane protein family
ppa010015m scaffold_3:13835893-13836745 -3.84 0 PF00504 PTHR21649
AT1G29930.1 CAB1 chlorophyll A/B binding protein 1
ppa010034m scaffold_3:13838813-13839770 -2.17 0.00022656 PF00504 PTHR21649
AT1G29930.1 CAB1 chlorophyll A/B binding protein 1
ppa010050m scaffold_7:13372732-13373581 -2.11 3.17E-09 PF04844
AT5G04820.1 OFP13 ovate family protein 13
ppa010181m scaffold_8:1630468-1632381 -2.72 3.61E-05 PF03083 PTHR10791 KOG1623 AT1G21460.1 SWEET1 Nodulin MtN3 family protein
ppa010287m scaffold_4:2120148-2121663 -2.85 0 PF12481,PF12504 PTHR11772
AT4G27450.1
Aluminium induced protein with YGL and LRDR motifs
ppa010314m scaffold_6:2108086-2109745 -2.23 1.33E-05 PF03330,PF01357
AT2G40610.1 EXPA8 expansin A8
ppa010382m scaffold_2:23574214-23576212 -2.26 5.58E-11 PF03330,PF01357
AT2G40610.1 EXPA8 expansin A8
ppa010410m scaffold_6:5464830-5465608 -2.22 3.58E-05 PF00314
AT2G28790.1
Pathogenesis-related thaumatin superfamily protein
ppa010418m scaffold_5:17698675-17699600 -2.13 0.00082686 PF00314
AT1G18250.2 ATLP-1 Pathogenesis-related thaumatin superfamily protein
ppa010517m scaffold_3:7800677-7803834 -3.18 3.25E-10 PF03005
AT2G30900.1 TBL43 TRICHOME BIREFRINGENCE-LIKE 43
ppa010654m scaffold_3:19591404-19592794 -4.70 4.44E-16 PF03330,PF01357
AT2G03090.1 EXPA15 expansin A15
ppa010935m scaffold_2:24801152-24802102 2.70 3.63E-06 PF00847
AT5G51990.1 CBF4 C-repeat-binding factor 4
ppa010958m scaffold_7:21509127-21510179 -4.10 0 PF02095,PF00234
AT2G10940.1
Bifunctional inhibitor/lipid-transfer protein/seed storage 2S albumin superfamily protein

gene locus log2 (fold_ change)
p_value pfam panther KOG At Tag gene annotation
ppa011014m scaffold_1:27134557-27136178 -2.07 1.29E-10 PF00445 PTHR11240 KOG1642 AT1G14220.1
Ribonuclease T2 family protein
ppa011103m scaffold_2:26131663-26132510 -3.11 1.83E-09 PF00011 PTHR11527 KOG0710 AT4G27670.1 HSP21 heat shock protein 21
ppa011144m scaffold_7:14269736-14270416 -3.12 5.50E-06 PF00190,PF07883
AT3G10080.1
RmlC-like cupins superfamily protein
ppa011163m scaffold_6:21108882-21110313 -2.07 2.16E-08
AT4G37450.1 AGP18 arabinogalactan protein 18
ppa011331m scaffold_6:27975580-27976668 -2.17 0.00022528 PF04852
AT5G28490.1 LSH1 Protein of unknown function (DUF640)
ppa011336m scaffold_7:18867745-18868393 2.67 3.93E-05 PF00847
AT1G19210.1
Integrase-type DNA-binding superfamily protein
ppa011359m scaffold_2:21998092-21999918 3.55 1.82E-06 PF00098 PTHR23002
AT1G75560.1
zinc knuckle (CCHC-type) family protein
ppa011460m scaffold_7:19116188-19116865 -3.17 0 PF00190,PF07883
AT5G20630.1 GER3 germin 3
ppa011560m scaffold_1:8591917-8592766 -2.43 0.00024062 PF04043
AT3G17130.1
Plant invertase/pectin methylesterase inhibitor superfamily protein
ppa011598m scaffold_5:14333186-14334192 2.27 5.58E-10
AT5G50200.1 WR3 nitrate transmembrane transporters
ppa011684m scaffold_1:10690789-10693379 2.04 1.78E-08 PF04535 PTHR11615
AT3G06390.1
Uncharacterised protein family (UPF0497)
ppa011939m scaffold_7:13191845-13193566 -2.10 0.00027219
ppa012101m scaffold_5:5182605-5183329 -3.11 0.00021412 PF04043
AT5G46940.1
Plant invertase/pectin methylesterase inhibitor superfamily protein
ppa012116m scaffold_3:15927130-15928357 2.38 7.56E-10
ppa012242m scaffold_6:5653882-5654686 2.37 9.85E-07 PF00096,PF12171 PTHR11389
AT2G28710.1
C2H2-type zinc finger family protein
ppa012383m scaffold_6:8985529-8986805 -2.50 2.11E-05 PF04949 PTHR21470
AT2G27740.1
Family of unknown function (DUF662)
ppa012403m scaffold_7:12476504-12477575 -2.04 1.46E-08
PTHR10992
AT3G03990.1
alpha/beta-Hydrolases superfamily protein
ppa012444m scaffold_7:18818700-18819472 -4.08 1.03E-05 PF04043
AT5G20740.1
Plant invertase/pectin methylesterase inhibitor superfamily protein
ppa012687m scaffold_3:5044413-5045413 -2.66 9.87E-06 PF00641 PTHR23111
AT3G15680.1
Ran BP2/NZF zinc finger-like superfamily protein
ppa012737m scaffold_1:38458542-38459174 -2.01 0.0005786 PF00641 PTHR23111
AT3G15680.1
Ran BP2/NZF zinc finger-like superfamily protein
ppa012828m scaffold_5:1477288-1479342 -2.25 4.25E-08 PF04535 PTHR11615
AT1G17200.1
Uncharacterised protein family (UPF0497)
ppa013082m scaffold_1:46841507-46843286 2.32 2.23E-08
ppa013113m scaffold_6:24688962-24689391 -3.23 9.03E-06 PF07107
AT5G01740.1
Nuclear transport factor 2 (NTF2) family protein
ppa013313m scaffold_4:4329558-4330296 -2.08 0.00012713 PF01241
AT1G30380.1 PSAK photosystem I subunit K
ppa013404m scaffold_5:8338369-8338957 -3.79 1.55E-15
ppa013513m scaffold_2:23553312-23553885 2.03 8.22E-05
ppa013525m scaffold_6:23509575-23510221 -4.42 6.11E-05 PF00234
AT3G53980.1
Bifunctional inhibitor/lipid-transfer protein/seed storage 2S albumin superfamily protein
ppa013688m scaffold_4:339681-340495 2.95 0
AT3G09950.1
ppa013711m scaffold_7:21042801-21044707 -3.11 0.00021412 PF03386
AT5G25940.1
early nodulin-related
ppa013714m scaffold_1:32576512-32577388 2.14 6.96E-06 PF02704
AT1G75750.2 GASA1 GAST1 protein homolog 1
ppa013833m scaffold_1:29538196-29538782 -2.50 1.62E-06 PF00234
AT3G18280.1
Bifunctional inhibitor/lipid-transfer protein/seed storage 2S albumin superfamily protein
ppa013960m scaffold_2:21738921-21740277 -2.63 3.36E-10 PF09713
AT3G55240.1
Plant protein 1589 of unknown function
ppa013981m scaffold_8:10694525-10695363 -2.39 0.00051735 PF02519
AT4G38840.1
SAUR-like auxin-responsive protein family
ppa014125m scaffold_8:15248511-15249099 2.38 0.00063642
ppa014160m scaffold_2:2472255-2472877 -2.38 2.60E-06
ppa014479m scaffold_8:1697823-1698732 2.24 3.29E-08
ppa014555m scaffold_4:8375735-8376625 -2.54 3.06E-05 PF02798,PF00043 PTHR11260 KOG0406 AT1G17180.1 GSTU25 glutathione S-transferase TAU 25
ppa014578m scaffold_2:17864416-17866095 3.27 0.00017322 PF05686 PTHR12203
AT3G61270.1
Arabidopsis thaliana protein of unknown function (DUF821)
ppa014687m scaffold_6:28579614-28580421 -2.79 0.00011123 PF00786 PTHR23177
AT5G16490.1 RIC4 ROP-interactive CRIB motif-containing protein 4
ppa014688m scaffold_3:7807673-7810528 -3.00 6.15E-09 PF03005
AT2G30900.1 TBL43 TRICHOME BIREFRINGENCE-LIKE 43
ppa014738m scaffold_1:41270658-41272821 2.06 1.51E-07 PF00560 PTHR23258 KOG0472 AT4G08850.1
Leucine-rich repeat receptor-like protein kinase family protein
ppa014951m scaffold_8:15571408-15572353 2.27 1.84E-05
AT1G58420.1
Uncharacterised conserved protein UCP031279
ppa014980m scaffold_3:13841152-13842103 -2.55 6.29E-06 PF00504 PTHR21649
AT4G10340.1 LHCB5 light harvesting complex of photosystem II 5
ppa015203m scaffold_1:19626256-19627435 2.26 5.53E-05 PF00069,PF07714 PTHR23258 KOG1187 AT1G21230.1 WAK5 wall associated kinase 5
ppa015357m scaffold_1:41711535-41713126 3.26 3.40E-09
PTHR11926 KOG1192 AT1G22360.1 UGT85A2 UDP-glucosyl transferase 85A2
ppa015472m scaffold_1:36049524-36051011 -2.53 0.00053982 PF02458
AT5G42830.1
HXXXD-type acyl-transferase family protein
ppa015544m scaffold_8:12017537-12019869 -3.19 1.92E-05 PF07732,PF00394,PF07731 PTHR11709 KOG1263 AT5G03260.1 LAC11 laccase 11
ppa015574m scaffold_5:6389092-6390295 -2.16 0.0004329
AT5G02890.1
HXXXD-type acyl-transferase family protein
ppa015631m scaffold_8:16816270-16817609 -2.28 0.00063195 PF08100,PF00891,PF08242 PTHR11746 KOG3178 AT4G35160.1
O-methyltransferase family protein
ppa015696m scaffold_4:4679200-4681526 2.78 2.31E-10 PF00069,PF07714 PTHR23258 KOG1187 AT1G21240.1 WAK3 wall associated kinase 3

gene locus log2 (fold_ change)
p_value pfam panther KOG At Tag gene annotation
ppa015890m scaffold_2:19794496-19797009 -3.24 5.01E-06 PF01565 PTHR11748 KOG4730 AT2G46760.1
D-arabinono-1,4-lactone oxidase family protein
ppa015973m scaffold_10:382386-383672 2.83 1.25E-05 PF00249 PTHR10641 KOG0048 AT2G47190.1 MYB2 myb domain protein 2
ppa016157m scaffold_1:38903571-38905191 -2.14 0.00051401 PF03140
AT4G31980.1
ppa016169m scaffold_2:13604096-13608614 2.31 2.82E-05 PF01094,PF00060 PTHR18966 KOG1052 AT3G07520.1 GLR1.4 glutamate receptor 1.4
ppa016292m scaffold_4:6884447-6887049 -2.64 1.29E-06 PF01397,PF03936
AT4G16740.1 TPS03 terpene synthase 03
ppa016583m scaffold_6:3669118-3673082 -2.40 2.12E-09 PF00232 PTHR10353 KOG0626 AT5G44640.1 BGLU13 beta glucosidase 13
ppa016616m scaffold_5:18137780-18138701 2.13 0.00033892 PF00190,PF07883
AT5G39190.1 GER2 germin-like protein 2
ppa016669m scaffold_8:21644133-21645554 -2.29 1.11E-08
AT4G13030.1
P-loop containing nucleoside triphosphate hydrolases superfamily protein
ppa016724m scaffold_8:15567565-15568105 2.01 3.89E-06
AT1G58420.1
Uncharacterised conserved protein UCP031279
ppa016850m scaffold_1:38873397-38875450 -3.24 3.31E-14 PF03181
AT5G25610.1 RD22 BURP domain-containing protein
ppa016912m scaffold_1:45894729-45896473 -2.42 0.00013302 PF00067 PTHR19383 KOG0156 AT4G31940.1 CYP82C4 cytochrome P450, family 82, subfamily C, polypeptide 4
ppa016964m scaffold_1:7359479-7359731 2.68 1.49E-08
ppa017015m scaffold_1:28873496-28874840 -2.45 2.69E-07
PTHR13683 KOG1339 AT3G25700.1
Eukaryotic aspartyl protease family protein
ppa017106m scaffold_7:14297377-14297611 -2.14 0.00014431
AT3G52770.1 ZPR3 protein binding
ppa017163m scaffold_1:3076400-3080255 2.12 0.00011958 PF00931,PF00560 PTHR23155:SF38 KOG4658 AT5G43470.1 RPP8 Disease resistance protein (CC-NBS-LRR class) family
ppa017234m scaffold_1:28788836-28789091 2.47 0.00024513
AT1G68765.1 IDA Putative membrane lipoprotein
ppa017473m scaffold_1:39283008-39284696 -3.62 0 PF00234
AT2G45180.1
Bifunctional inhibitor/lipid-transfer protein/seed storage 2S albumin superfamily protein
ppa017496m scaffold_3:3090505-3094856 2.53 1.36E-07 PF00560,PF00069,PF07714 PTHR23258 KOG1187 AT1G51800.1
Leucine-rich repeat protein kinase family protein
ppa017522m scaffold_8:10280411-10281827 -2.62 6.47E-05 PF03140
AT3G50150.1
Plant protein of unknown function (DUF247)
ppa017555m scaffold_6:24047475-24051141 -6.15 1.02E-08 PF04488,PF04572 PTHR12042 KOG1928 AT2G38150.1
alpha 1,4-glycosyltransferase family protein
ppa017714m scaffold_8:3058604-3059794 2.28 3.65E-05
AT1G20180.1
Protein of unknown function (DUF677)
ppa017769m scaffold_1:38909342-38910681 -3.09 5.34E-07 PF03181
AT5G25610.1 RD22 BURP domain-containing protein
ppa017795m scaffold_1:33685675-33687162 2.43 0.00078553 PF00067 PTHR19383 KOG0156 AT4G31940.1 CYP82C4 cytochrome P450, family 82, subfamily C, polypeptide 4
ppa017859m scaffold_2:20563095-20566050 -2.46 5.03E-05 PF00378 PTHR11941 KOG1684 AT2G30650.1
ATP-dependent caseinolytic (Clp) protease/crotonase family protein
ppa018075m scaffold_10:162784-165574 2.54 1.34E-07 PF03106
AT4G01720.1 WRKY47 WRKY family transcription factor
ppa018201m scaffold_4:8408182-8409381 3.50 0 PF02798,PF00043 PTHR11260 KOG0406 AT1G78380.1 GSTU19 glutathione S-transferase TAU 19
ppa018265m scaffold_5:11994152-11996309 2.00 0.00018983 PF00097 PTHR22764
AT5G53110.1
RING/U-box superfamily protein
ppa018490m scaffold_2:21743378-21744063 2.55 9.87E-06 PF09713
AT3G55240.1
Plant protein 1589 of unknown function
ppa018586m scaffold_6:25508218-25512811 2.39 1.53E-13 PF08263,PF00560,PF00069, PF07714
PTHR23258 KOG1187 AT1G79620.1
Leucine-rich repeat protein kinase family protein
ppa018693m scaffold_3:13418637-13421372 -6.17 3.83E-12 PF03005
AT2G30900.1 TBL43 TRICHOME BIREFRINGENCE-LIKE 43
ppa018710m scaffold_5:16882052-16882727 2.17 1.74E-05 PF00847
AT5G19790.1 RAP2.11 related to AP2 11
ppa018856m scaffold_4:20214506-20219050 -4.01 0.0003025 PF06974
AT3G49190.1
O-acyltransferase (WSD1-like) family protein
ppa019000m scaffold_6:19300905-19301997 2.72 0.00020569
PTHR11926 KOG1192 AT2G22590.1
UDP-Glycosyltransferase superfamily protein
ppa019045m scaffold_4:8379911-8380797 -2.82 2.17E-09 PF02798,PF00043 PTHR11260 KOG0406 AT1G78380.1 GSTU19 glutathione S-transferase TAU 19
ppa019065m scaffold_2:17879607-17882296 2.37 0.00045498 PF05686 PTHR12203 KOG2458 AT2G45830.1 DTA2 downstream target of AGL15 2
ppa019188m scaffold_1:28522294-28523587 3.18 0 PF06880
AT1G13520.1
Protein of unknown function (DUF1262)
ppa019215m scaffold_7:19030171-19031907 -2.55 0.00042463 PF00067 PTHR19383 KOG0156 AT5G07990.1 TT7 Cytochrome P450 superfamily protein
ppa019261m scaffold_4:14885223-14888187 2.01 1.61E-06 PF08263,PF00560 PTHR23258 KOG0472 AT2G25440.1 RLP20 receptor like protein 20
ppa019443m scaffold_5:9276544-9280067 -2.05 0.00038914 PF00067 PTHR19383 KOG0156 AT4G12300.1 CYP706A4 cytochrome P450, family 706, subfamily A, polypeptide 4
ppa019518m scaffold_3:8308639-8313153 -2.49 2.46E-10 PF00232 PTHR10353 KOG0626 AT2G44450.1 BGLU15 beta glucosidase 15
ppa019700m scaffold_3:9943668-9944610 -2.58 1.22E-09 PF00290 PTHR10314 KOG4175 AT4G02610.1
Aldolase-type TIM barrel family protein
ppa019741m scaffold_8:18251681-18252976 2.49 0.00012199 PF00722,PF06955
AT4G13090.1 XTH2 xyloglucan endotransglucosylase/hydrolase 2
ppa019849m scaffold_5:9284430-9286356 -2.22 1.99E-06 PF00067 PTHR19383 KOG0156 AT4G12300.1 CYP706A4 cytochrome P450, family 706, subfamily A, polypeptide 4
ppa019992m scaffold_1:38540867-38542243 -3.43 1.33E-13 PF03181
AT5G25610.1 RD22 BURP domain-containing protein
ppa020005m scaffold_2:12045437-12046063 2.08 0.0004672
AT1G67000.1
Protein kinase superfamily protein
ppa020356m scaffold_1:7253091-7255261 2.04 0.00043755 PF03330
AT4G30380.1
Barwin-related endoglucanase
ppa020579m scaffold_1:639232-641217 -3.29 3.74E-09 PF00732,PF05199 PTHR11552 KOG1238 AT1G73050.1
Glucose-methanol-choline (GMC) oxidoreductase family protein
ppa020689m scaffold_5:579155-580112 3.49 4.47E-07 PF03479
AT1G76500.1 SOB3 Predicted AT-hook DNA-binding family protein
ppa020764m scaffold_4:20172719-20173864 -6.07 1.67E-08 PF02704
AT1G74670.1
Gibberellin-regulated family protein
ppa020831m scaffold_3:17668220-17672543 2.17 2.71E-08 PF01397,PF03936
AT1G61120.1 TPS04 terpene synthase 04

gene locus log2 (fold_ change)
p_value pfam panther KOG At Tag gene annotation
ppa020839m scaffold_6:3692705-3696262 -2.70 2.22E-16 PF00232 PTHR10353 KOG0626 AT2G44450.1 BGLU15 beta glucosidase 15
ppa020936m scaffold_1:38844754-38847976 -2.78 2.01E-06 PF03181
AT5G25610.1 RD22 BURP domain-containing protein
ppa020957m scaffold_3:15188196-15191157 -4.64 6.39E-12 PF00067 PTHR19383 KOG0157 AT3G50660.1 DWF4 Cytochrome P450 superfamily protein
ppa021137m scaffold_6:3651003-3654553 -2.33 7.24E-14 PF00232 PTHR10353 KOG0626 AT2G44450.1 BGLU15 beta glucosidase 15
ppa021281m scaffold_4:2330106-2330729 -3.14 8.16E-11 PF01190
AT2G34700.1
Pollen Ole e 1 allergen and extensin family protein
ppa021326m scaffold_6:1844577-1846270 -3.02 0 PF00067 PTHR19383 KOG0156 AT2G22330.1 CYP79B3 cytochrome P450, family 79, subfamily B, polypeptide 3
ppa021457m scaffold_3:20925482-20927019 -3.91 0.00045159 PF00657
AT5G14450.1
GDSL-like Lipase/Acylhydrolase superfamily protein
ppa021513m scaffold_7:17646875-17654485 -2.12 8.23E-12 PF01074,PF09261,PF07748 PTHR11607 KOG1959 AT5G66150.1
Glycosyl hydrolase family 38 protein
ppa021560m scaffold_4:8547441-8550003 2.05 0.00011523 PF00931,PF00560 PTHR23155 KOG4658 AT3G07040.1 RPM1 NB-ARC domain-containing disease resistance protein
ppa021712m scaffold_2:12756525-12758489 2.96 9.24E-10 PF00560 PTHR23258 KOG0472 AT2G34930.1
disease resistance family protein / LRR family protein
ppa021776m scaffold_8:16778809-16780291 -2.07 2.75E-06 PF08100,PF00891 PTHR11746 KOG3178 AT4G35160.1
O-methyltransferase family protein
ppa021902m scaffold_8:15478634-15479437 -3.43 4.61E-07
AT4G33800.1
ppa022021m scaffold_6:19820735-19824274 3.04 0.00025643 PF06045
AT2G22620.1
Rhamnogalacturonate lyase family protein
ppa022085m scaffold_1:39822370-39824759 2.70 1.20E-07
PTHR11785 KOG1289 AT2G01170.1 BAT1 bidirectional amino acid transporter 1
ppa022337m scaffold_1:11553214-11555170 -2.71 0
PTHR13683 KOG1339 AT1G03220.1
Eukaryotic aspartyl protease family protein
ppa022385m scaffold_4:10176555-10178427 -3.73 0.00084422 PF00170,PF07716 PTHR13301
AT3G58120.1 BZIP61 Basic-leucine zipper (bZIP) transcription factor family protein
ppa022572m scaffold_4:4701198-4704171 2.24 5.34E-07 PF07974,PF00008,PF07645, PF00069,PF07714
PTHR23258 KOG1187 AT1G21270.1 WAK2 wall-associated kinase 2
ppa022616m scaffold_1:28530994-28532291 3.34 1.36E-07 PF06880
AT1G13530.1
Protein of unknown function (DUF1262)
ppa022817m scaffold_10:748715-752946 2.09 8.61E-05 PF01657,PF00069,PF07714 PTHR23258 KOG1187 AT1G70520.1 CRK2 cysteine-rich RLK (RECEPTOR-like protein kinase) 2
ppa022968m scaffold_1:42825811-42826499 2.38 0.00043781
ppa023071m scaffold_6:19268030-19269443 2.50 0.00019198
PTHR11926 KOG1192 AT2G22590.1
UDP-Glycosyltransferase superfamily protein
ppa023341m scaffold_4:6862527-6865233 -2.09 7.68E-08 PF01397,PF03936
AT4G16740.1 TPS03 terpene synthase 03
ppa023347m scaffold_4:3478692-3480414 -2.75 2.95E-06 PF00657 PTHR22835:SF27
AT1G29660.1
GDSL-like Lipase/Acylhydrolase superfamily protein
ppa023395m scaffold_4:8384703-8385578 -3.33 4.23E-13 PF02798,PF00043 PTHR11260 KOG0406 AT1G78380.1 GSTU19 glutathione S-transferase TAU 19
ppa023554m scaffold_1:655569-660477 -2.29 0.00042052 PF00023 PTHR18958
AT3G18670.1
Ankyrin repeat family protein
ppa023678m scaffold_1:41501239-41501909 -3.85 0.00055447
AT2G33510.1
ppa023851m scaffold_1:41725188-41726819 2.22 9.60E-06 PF00201 PTHR11926 KOG1192 AT1G22360.1 UGT85A2 UDP-glucosyl transferase 85A2
ppa023993m scaffold_4:17800796-17802832 2.07 1.10E-07 PF00139,PF00069,PF07714 PTHR23258 KOG1187 AT5G10530.1
Concanavalin A-like lectin protein kinase family protein
ppa024025m scaffold_4:6868563-6870716 -2.01 7.89E-05 PF01397,PF03936
AT3G25820.1 TPS-CIN terpene synthase-like sequence-1,8-cineole
ppa024360m scaffold_3:2725701-2730589 -2.24 4.10E-07 PF00067 PTHR19383 KOG0157 AT3G13730.1 CYP90D1 cytochrome P450, family 90, subfamily D, polypeptide 1
ppa024401m scaffold_3:9945814-9946549 -2.24 0.00088436
PTHR10314:SF4
AT3G54640.1 TSA1 tryptophan synthase alpha chain
ppa024647m scaffold_7:9697989-9699725 2.05 0.0001595 PF04862
AT2G41810.1
Protein of unknown function, DUF642
ppa024667m scaffold_8:2299452-2302239 -2.28 4.66E-08
PTHR19446
AT1G43760.1
DNAse I-like superfamily protein
ppa024705m scaffold_8:796006-798762 2.10 0.00011108 PF00931,PF00560 PTHR23155 KOG4658 AT3G07040.1 RPM1 NB-ARC domain-containing disease resistance protein
ppa024725m scaffold_4:3144543-3150593 -2.24 1.43E-05 PF07649,PF03552 PTHR13301:SF1
AT4G18780.1 IRX1 cellulose synthase family protein
ppa024728m scaffold_2:17886817-17889530 2.20 3.58E-06 PF05686 PTHR12203 KOG2458 AT3G61270.1
Arabidopsis thaliana protein of unknown function (DUF821)
ppa024760m scaffold_3:17676529-17681340 2.19 1.47E-11 PF01397,PF03936
AT1G61120.1 TPS04 terpene synthase 04
ppa024823m scaffold_6:4728852-4730951 -6.07 4.85E-05 PF00106 PTHR19410 KOG0725 AT1G07440.1
NAD(P)-binding Rossmann-fold superfamily protein
ppa025305m scaffold_6:21827887-21831934 2.31 0.00012192 PF03641
AT2G37210.1
lysine decarboxylase family protein
ppa025532m scaffold_1:39825872-39828176 2.44 1.51E-10
PTHR11785 KOG1289 AT2G01170.1 BAT1 bidirectional amino acid transporter 1
ppa025618m scaffold_8:16797629-16799460 -2.90 2.78E-10 PF08100,PF00891,PF08242 PTHR11746 KOG3178 AT4G35160.1
O-methyltransferase family protein
ppa025628m scaffold_2:9424658-9425180 -2.14 3.37E-07
AT1G07985.1
Expressed protein
ppa025848m scaffold_1:12540277-12543473 2.07 1.33E-08 PF01582,PF00931,PF00560 PTHR23155 KOG4658 AT5G17680.1
disease resistance protein (TIR-NBS-LRR class), putative
ppa026145m scaffold_4:23531463-23531718 -3.93 1.39E-07
ppa026291m scaffold_5:11161115-11162372 3.58 1.33E-12 PF04116
AT4G25700.1 BETA-OHASE 1 beta-hydroxylase 1
ppa026448m scaffold_6:3716903-3720462 -2.50 4.00E-15 PF00232 PTHR10353 KOG0626 AT2G44480.1 BGLU17 beta glucosidase 17
ppa026531m scaffold_8:2127513-2131679 2.40 0.0003786 PF01582,PF00931,PF00560, PF07725
PTHR23155 KOG4658 AT5G17680.1
disease resistance protein (TIR-NBS-LRR class), putative
ppa026562m scaffold_2:17890852-17893608 2.73 0.00075506 PF05686 PTHR12203 KOG2458 AT3G61270.1
Arabidopsis thaliana protein of unknown function (DUF821)
ppa026610m scaffold_8:21179543-21180766 -5.07 0.00077831
AT3G62730.1
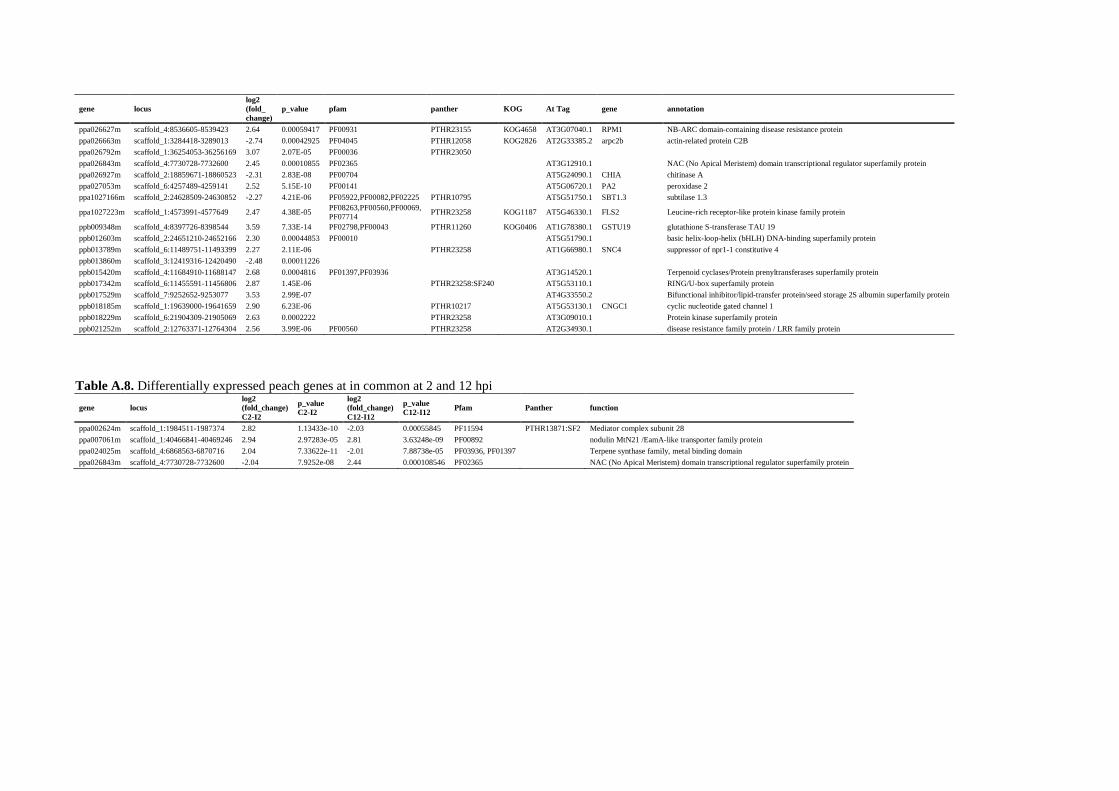
gene locus log2 (fold_ change)
p_value pfam panther KOG At Tag gene annotation
ppa026627m scaffold_4:8536605-8539423 2.64 0.00059417 PF00931 PTHR23155 KOG4658 AT3G07040.1 RPM1 NB-ARC domain-containing disease resistance protein
ppa026663m scaffold_1:3284418-3289013 -2.74 0.00042925 PF04045 PTHR12058 KOG2826 AT2G33385.2 arpc2b actin-related protein C2B
ppa026792m scaffold_1:36254053-36256169 3.07 2.07E-05 PF00036 PTHR23050
ppa026843m scaffold_4:7730728-7732600 2.45 0.00010855 PF02365
AT3G12910.1
NAC (No Apical Meristem) domain transcriptional regulator superfamily protein
ppa026927m scaffold_2:18859671-18860523 -2.31 2.83E-08 PF00704
AT5G24090.1 CHIA chitinase A
ppa027053m scaffold_6:4257489-4259141 2.52 5.15E-10 PF00141
AT5G06720.1 PA2 peroxidase 2
ppa1027166m scaffold_2:24628509-24630852 -2.27 4.21E-06 PF05922,PF00082,PF02225 PTHR10795
AT5G51750.1 SBT1.3 subtilase 1.3
ppa1027223m scaffold_1:4573991-4577649 2.47 4.38E-05 PF08263,PF00560,PF00069, PF07714
PTHR23258 KOG1187 AT5G46330.1 FLS2 Leucine-rich receptor-like protein kinase family protein
ppb009348m scaffold_4:8397726-8398544 3.59 7.33E-14 PF02798,PF00043 PTHR11260 KOG0406 AT1G78380.1 GSTU19 glutathione S-transferase TAU 19
ppb012603m scaffold_2:24651210-24652166 2.30 0.00044853 PF00010
AT5G51790.1
basic helix-loop-helix (bHLH) DNA-binding superfamily protein
ppb013789m scaffold_6:11489751-11493399 2.27 2.11E-06
PTHR23258
AT1G66980.1 SNC4 suppressor of npr1-1 constitutive 4
ppb013860m scaffold_3:12419316-12420490 -2.48 0.00011226
ppb015420m scaffold_4:11684910-11688147 2.68 0.0004816 PF01397,PF03936
AT3G14520.1
Terpenoid cyclases/Protein prenyltransferases superfamily protein
ppb017342m scaffold_6:11455591-11456806 2.87 1.45E-06
PTHR23258:SF240
AT5G53110.1
RING/U-box superfamily protein
ppb017529m scaffold_7:9252652-9253077 3.53 2.99E-07
AT4G33550.2
Bifunctional inhibitor/lipid-transfer protein/seed storage 2S albumin superfamily protein
ppb018185m scaffold_1:19639000-19641659 2.90 6.23E-06
PTHR10217
AT5G53130.1 CNGC1 cyclic nucleotide gated channel 1
ppb018229m scaffold_6:21904309-21905069 2.63 0.0002222
PTHR23258
AT3G09010.1
Protein kinase superfamily protein
ppb021252m scaffold_2:12763371-12764304 2.56 3.99E-06 PF00560 PTHR23258
AT2G34930.1
disease resistance family protein / LRR family protein
Table A.8. Differentially expressed peach genes at in common at 2 and 12 hpi
gene locus log2 (fold_change) C2-I2
p_value C2-I2
log2 (fold_change) C12-I12
p_value C12-I12
Pfam Panther function
ppa002624m scaffold_1:1984511-1987374 2.82 1.13433e-10 -2.03 0.00055845 PF11594 PTHR13871:SF2 Mediator complex subunit 28
ppa007061m scaffold_1:40466841-40469246 2.94 2.97283e-05 2.81 3.63248e-09 PF00892
nodulin MtN21 /EamA-like transporter family protein
ppa024025m scaffold_4:6868563-6870716 2.04 7.33622e-11 -2.01 7.88738e-05 PF03936, PF01397
Terpene synthase family, metal binding domain
ppa026843m scaffold_4:7730728-7732600 -2.04 7.9252e-08 2.44 0.000108546 PF02365
NAC (No Apical Meristem) domain transcriptional regulator superfamily protein

Appendix
155
Table A.9. Differentially expressed transcripts for which no annotation was available on the peach genome at 2 hpi by pair-wise comparison of inoculated sample to the mock-inoculated sample Transcript locus
log2(fold_change) C2-I2
p_value Annotation
scaffold_1:6138003-6138229 9.58 8.03E-09
scaffold_1:13800974-13801217 2.28 1.43E-07 ribosomal protein s12
scaffold_1:13835251-13836060 2.00 0.000304849
scaffold_1:26187472-26187552 2.02 4.13E-06
scaffold_1:30420542-30420618 1.79e+308 0.000729686
scaffold_1:36422873-36422958 4.00 0.000171959
scaffold_1:45766999-45773594 -4.82 3.40E-14
scaffold_2:3230285-3230897 -7.08 0
scaffold_2:9984333-9984563 -2.03 3.16E-12
scaffold_2:10984889-10985586 -2.07 0.000844443 probable receptor-like protein kinase at5g39020-like
scaffold_2:14040666-14041121 2.28 1.61E-10 atp synthase cf1 epsilon subunit
scaffold_2:16477519-16478437 3.38 1.39E-10
scaffold_2:22526609-22527090 2.03 0.000249218
scaffold_3:1013047-1013172 1.79e+308 9.64E-06 hypothetical chloroplast rf19
scaffold_3:10516500-10517387 -2.35 1.19E-06
scaffold_3:14217994-14219066 2.16 0
scaffold_3:14223088-14223807 2.34 0
scaffold_4:7930922-7931059 2.60 2.33E-05
scaffold_4:12764316-12764393 2.63 0.000234734
scaffold_5:5117441-5118085 4.84 1.95E-09
scaffold_5:6351906-6352378 -3.21 0.000294967
scaffold_5:11801387-11801714 2.69 0.000526052
scaffold_6:8341341-8341604 -2.94 0.000166476
scaffold_7:6864500-6864580 -1.79e+308 0.000782701
scaffold_7:10368303-10368825 4.80 8.21E-12
scaffold_7:19980649-19981191 -4.15 6.37E-07 mutt domain
scaffold_7:20929942-20930959 2.28 0
scaffold_8:6836956-6837139 2.34 6.36E-07 chk1 checkpoint-like protein
Table A.10. Differentially expressed transcripts for which no annotation was available on the peach genome at 12 hpi by pair-wise comparison of inoculated sample to the mock-inoculated sample Transcript locus
log2(fold_change) C12-I12
p_value Hit-Desc
scaffold_1:12783001-12783741 -2.67 0.000145222
scaffold_1:13800974-13801217 -2.65 3.46E-05 ribosomal protein s12
scaffold_1:15939161-15939309 -5.27 1.25E-06 nadh-plastoquinone oxidoreductase subunit 4
scaffold_1:16394485-16395290 -3.12 2.70E-11 cytochrome f
scaffold_1:17317879-17318032 -3.67 0.000301668
scaffold_1:18925805-18926091 2.71 0.000142558
scaffold_1:19359730-19360330 -4.22 1.11E-15 cytochrome b6
scaffold_1:22023618-22024239 2.32 0.000425246 pinus taeda anonymous locus 0_12933_01 genomic sequence
scaffold_1:25627642-25628156 -3.02 0 50s ribosomal protein l2-b
scaffold_1:26187472-26187552 -3.77 5.27E-07
scaffold_1:26833056-26833375 -4.15 7.02E-06 nadh-plastoquinone oxidoreductase subunit j
scaffold_1:26833436-26834461 -2.19 3.31E-05 photosystem i assembly protein ycf3
scaffold_1:28467761-28468382 -2.58 1.22E-08 atp synthase cf1 alpha subunit
scaffold_1:3176487-3176585 -3.06 1.65E-05
scaffold_1:34956175-34957467 5.11 0
scaffold_1:38688443-38688788 -2.18 4.20E-10
scaffold_1:38988769-38990467 -3.06 4.27E-06 retrotransposon ty1-copia subclass
scaffold_1:41579194-41579258 -1.79e+308 6.17E-05
scaffold_1:42720625-42721176 5.35 1.71E-14
scaffold_1:45133272-45133647 -3.81 3.67E-07 ribosomal protein s3
scaffold_1:45766999-45773594 -4.78 4.44E-16
scaffold_1:46840962-46841361 2.71 6.70E-09
scaffold_1:4803527-4803605 -3.33 0
scaffold_1:4823910-4824980 -3.39 4.72E-05
scaffold_1:5040227-5040302 -2.99 8.74E-06
scaffold_1:6394118-6394352 -2.40 0.000679115
scaffold_1:6587376-6588136 3.87 1.01E-07
scaffold_1:8525370-8526700 -2.21 0.000697483
scaffold_1:8939273-8940003 2.85 8.79E-09
scaffold_1:9817868-9818699 3.48 8.79E-12
scaffold_13:539392-539910 -3.5 3.33E-15 photosystem i p700 chlorophyll a apoprotein partial
scaffold_15:462232-462645 2.92 9.96E-07 pentatricopeptide repeat-containing protein
scaffold_18:54874-54973 -2.96 3.01E-06
scaffold_18:55025-55757 -3.36 8.50E-12 atp synthase beta subunit
scaffold_18:56016-56191 -3.38 3.63E-07 atp synthase cf1 epsilon subunit
scaffold_18:60945-61013 -2.13 4.95E-05
scaffold_2:10219080-10219229 -3.72 1.15E-08
scaffold_2:12156851-12157166 -2.45 6.70E-05 cytochrome oxidase subunit partial
scaffold_2:13363529-13364381 -4.22 9.71E-11 maturase k
scaffold_2:13364446-13367696 -2.81 0 photosystem ii protein d1
scaffold_2:13368010-13369934 -3.96 1.55E-15 ribosomal protein l2

Appendix
156
Transcript locus log2(fold_change) C12-I12
p_value Hit-Desc
scaffold_2:13375263-13376249 -3.50 0 photosystem ii protein z
scaffold_2:14038191-14038507 -3.11 5.21E-05
scaffold_2:14039858-14040478 -3.52 0 hypothetical chloroplast rf19
scaffold_2:14040666-14041121 -5.45 6.43E-12 atp synthase cf1 epsilon subunit
scaffold_2:14041365-14041576 -2.56 0.000163813 ribosomal protein s3
scaffold_2:14042630-14042761 -4.79 1.55E-07 cytochrome b6 f complex subunit iv
scaffold_2:14049059-14049236 -5.09 1.91E-10 petd
scaffold_2:16663462-16663932 -2.93 7.64E-14 cytochrome b6
scaffold_2:16664040-16665130 -3.70 2.22E-16 photosystem i p700 chlorophyll a apoprotein a1
scaffold_2:16666005-16666648 -2.07 0.00090588 nadh dehydrogenase subunit f
scaffold_2:16666715-16667164 -4.12 8.34E-06
scaffold_2:17081831-17082456 -2.74 6.27E-07 hypothetical protein OrniCp080 [Oryza nivara]
scaffold_2:191159-192085 -2.82 2.87E-05 zinc finger CCCH domain-containing protein 48
scaffold_2:22878451-22878719 -4.22 2.10E-09 cytochrome b6
scaffold_2:23123869-23123935 -4.31 9.35E-05
scaffold_2:23313339-23313648 -4.57 3.12E-05 hypothetical chloroplast rf1
scaffold_2:2649303-2650168 -3.92 4.22E-15 cytochrome c biogenesis fn
scaffold_2:4837108-4838282 -4.80 1.18E-05 hypothetical chloroplast rf1
scaffold_2:4838364-4840414 -3.52 0 photosystem i p700 chlorophyll a apoprotein a1
scaffold_2:6659910-6660608 -2.14 4.58E-06 ribosomal protein s12
scaffold_3:10062766-10063736 -3.01 2.66E-15 conserved protein
scaffold_3:1012401-1012908 -3.22 3.99E-10 photosystem i p700 apoprotein a1
scaffold_3:10430571-10430958 -3.69 0 ribosomal protein l2
scaffold_3:10431496-10431919 -6.25 2.77E-05 nadh-plastoquinone oxidoreductase subunit 1
scaffold_3:10432329-10432467 -3.74 1.32E-09 atpase subunit partial
scaffold_3:10432668-10432834 -2.56 5.48E-05
scaffold_3:10598936-10600145 2.70 1.22E-05
scaffold_3:10603364-10603533 -3.67 0
scaffold_3:12924854-12924920 -3.36 0
scaffold_3:14217994-14219066 2.21 9.07E-10
scaffold_3:14832107-14833217 2.13 1.13E-05 protein
scaffold_3:1529453-1529904 -2.84 8.09E-05
scaffold_3:1529980-1531374 -2.89 8.88E-15
scaffold_3:16776955-16777261 -4.64 2.35E-05 atp1
scaffold_3:17641181-17642124 2.12 4.22E-05
scaffold_3:18057863-18058391 -4.50 4.22E-05 protein rotundifolia like 18
scaffold_3:18696256-18696401 -2.25 0.000344654
scaffold_3:18696985-18697343 -5.06 6.22E-15 nadh-plastoquinone oxidoreductase subunit 5
scaffold_3:20046694-20047236 -4.92 9.09E-12
scaffold_3:3408038-3408301 3.39 0.000273929
scaffold_3:4087162-4087551 3.62 1.02E-05
scaffold_3:4541315-4541406 -5.30 2.68E-11
scaffold_3:5532043-5532639 2.65 6.55E-11
scaffold_3:5906302-5906472 -3.35 5.91E-05
scaffold_3:5906534-5907143 -2.84 8.79E-10 acrs-like protein
scaffold_3:8049686-8051273 -3.44 0 photosystem i p700 apoprotein a1
scaffold_3:8052147-8052493 -3.76 2.22E-16 cell wall-associated hydrolase
scaffold_4:11376226-11376386 3.76 0.000678654
scaffold_4:12152049-12152332 -3.15 0.000455766 valencene synthase-like
scaffold_4:12335119-12335701 -2.30 3.15E-06 (-)-germacrene d synthase
scaffold_4:12336180-12336604 -2.74 5.32E-05
scaffold_4:12337158-12337440 -2.61 3.03E-05 sesquiterpene synthase
scaffold_4:12477038-12477135 -3.77 2.17E-06
scaffold_4:13578681-13578924 -2.03 0.000983337
scaffold_4:13579128-13579626 -3.50 1.71E-08
scaffold_4:14157875-14158290 2.43 4.85E-05
scaffold_4:14383117-14383573 2.51 4.44E-06
scaffold_4:14468353-14469180 2.73 0.000193553 gag-pol polyprotein
scaffold_4:17437617-17437998 2.52 0.000283053
scaffold_4:18288669-18289045 2.54 0.000390357
scaffold_4:18687218-18687698 -3.09 0.000246591
scaffold_4:19153499-19154790 -3.91 0 protein
scaffold_4:21499434-21499645 -3.19 0.000772961 acetyl- carboxylase carboxyltransferase beta subunit
scaffold_4:22575202-22575826 -2.54 0.000661129
scaffold_4:22863465-22865111 -2.31 1.40E-08
scaffold_4:23526048-23526340 -3.96 1.35E-06 ribosomal protein s19
scaffold_4:23532080-23532235 -3.54 4.43E-07
scaffold_4:23899134-23899467 2.19 1.43E-09
scaffold_4:25770384-25770531 -4.07 1.09E-05
scaffold_4:27429835-27430058 -2.74 2.22E-16
scaffold_4:27563439-27563749 -3.07 3.39E-11
scaffold_4:27565848-27565974 -1.79e+308 0.000424613
scaffold_4:30285085-30285219 -3.90 2.29E-09
scaffold_4:30514023-30514293 -2.59 0.000150036
scaffold_4:30514365-30514527 -3.35 2.15E-06
scaffold_4:6025511-6025639 -3.54 1.21E-08 partial
scaffold_4:6988633-6989354 3.31 9.13E-07
scaffold_4:8197155-8198155 -2.64 1.68E-07
scaffold_5:10568193-10568470 -2.04 4.79E-05
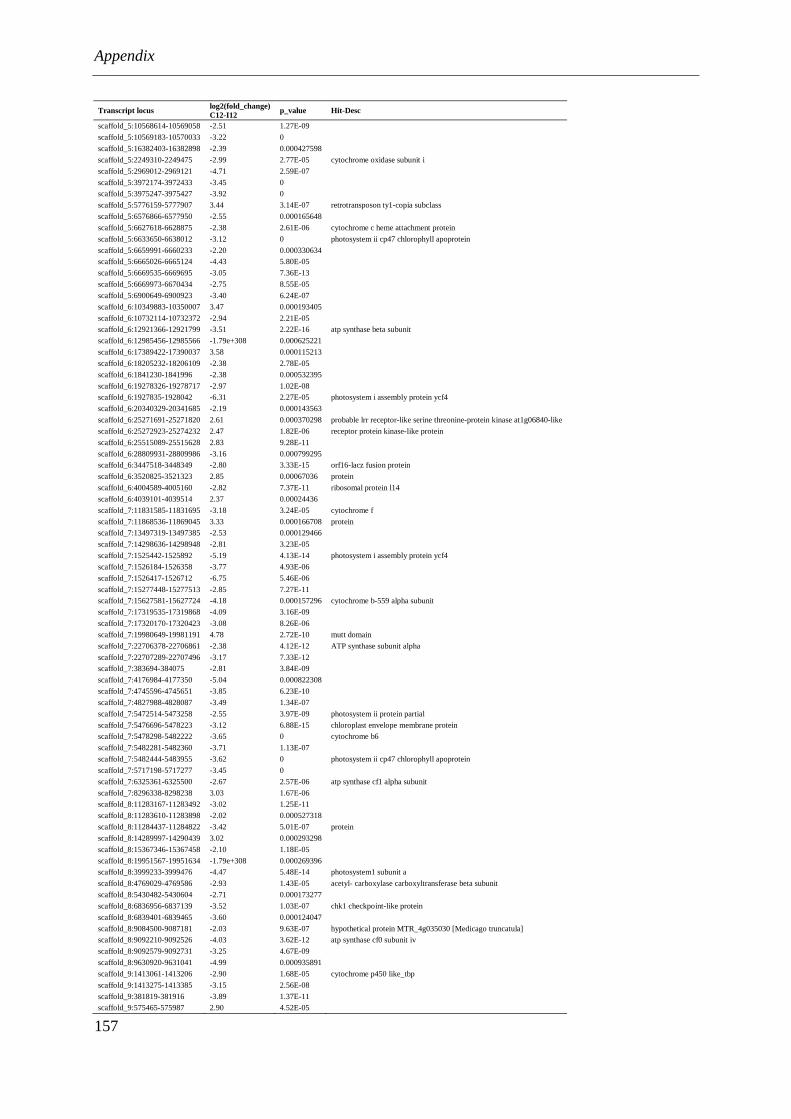
Appendix
157
Transcript locus log2(fold_change) C12-I12
p_value Hit-Desc
scaffold_5:10568614-10569058 -2.51 1.27E-09
scaffold_5:10569183-10570033 -3.22 0
scaffold_5:16382403-16382898 -2.39 0.000427598
scaffold_5:2249310-2249475 -2.99 2.77E-05 cytochrome oxidase subunit i
scaffold_5:2969012-2969121 -4.71 2.59E-07
scaffold_5:3972174-3972433 -3.45 0
scaffold_5:3975247-3975427 -3.92 0
scaffold_5:5776159-5777907 3.44 3.14E-07 retrotransposon ty1-copia subclass
scaffold_5:6576866-6577950 -2.55 0.000165648
scaffold_5:6627618-6628875 -2.38 2.61E-06 cytochrome c heme attachment protein
scaffold_5:6633650-6638012 -3.12 0 photosystem ii cp47 chlorophyll apoprotein
scaffold_5:6659991-6660233 -2.20 0.000330634
scaffold_5:6665026-6665124 -4.43 5.80E-05
scaffold_5:6669535-6669695 -3.05 7.36E-13
scaffold_5:6669973-6670434 -2.75 8.55E-05
scaffold_5:6900649-6900923 -3.40 6.24E-07
scaffold_6:10349883-10350007 3.47 0.000193405
scaffold_6:10732114-10732372 -2.94 2.21E-05
scaffold_6:12921366-12921799 -3.51 2.22E-16 atp synthase beta subunit
scaffold_6:12985456-12985566 -1.79e+308 0.000625221
scaffold_6:17389422-17390037 3.58 0.000115213
scaffold_6:18205232-18206109 -2.38 2.78E-05
scaffold_6:1841230-1841996 -2.38 0.000532395
scaffold_6:19278326-19278717 -2.97 1.02E-08
scaffold_6:1927835-1928042 -6.31 2.27E-05 photosystem i assembly protein ycf4
scaffold_6:20340329-20341685 -2.19 0.000143563
scaffold_6:25271691-25271820 2.61 0.000370298 probable lrr receptor-like serine threonine-protein kinase at1g06840-like
scaffold_6:25272923-25274232 2.47 1.82E-06 receptor protein kinase-like protein
scaffold_6:25515089-25515628 2.83 9.28E-11
scaffold_6:28809931-28809986 -3.16 0.000799295
scaffold_6:3447518-3448349 -2.80 3.33E-15 orf16-lacz fusion protein
scaffold_6:3520825-3521323 2.85 0.00067036 protein
scaffold_6:4004589-4005160 -2.82 7.37E-11 ribosomal protein l14
scaffold_6:4039101-4039514 2.37 0.00024436
scaffold_7:11831585-11831695 -3.18 3.24E-05 cytochrome f
scaffold_7:11868536-11869045 3.33 0.000166708 protein
scaffold_7:13497319-13497385 -2.53 0.000129466
scaffold_7:14298636-14298948 -2.81 3.23E-05
scaffold_7:1525442-1525892 -5.19 4.13E-14 photosystem i assembly protein ycf4
scaffold_7:1526184-1526358 -3.77 4.93E-06
scaffold_7:1526417-1526712 -6.75 5.46E-06
scaffold_7:15277448-15277513 -2.85 7.27E-11
scaffold_7:15627581-15627724 -4.18 0.000157296 cytochrome b-559 alpha subunit
scaffold_7:17319535-17319868 -4.09 3.16E-09
scaffold_7:17320170-17320423 -3.08 8.26E-06
scaffold_7:19980649-19981191 4.78 2.72E-10 mutt domain
scaffold_7:22706378-22706861 -2.38 4.12E-12 ATP synthase subunit alpha
scaffold_7:22707289-22707496 -3.17 7.33E-12
scaffold_7:383694-384075 -2.81 3.84E-09
scaffold_7:4176984-4177350 -5.04 0.000822308
scaffold_7:4745596-4745651 -3.85 6.23E-10
scaffold_7:4827988-4828087 -3.49 1.34E-07
scaffold_7:5472514-5473258 -2.55 3.97E-09 photosystem ii protein partial
scaffold_7:5476696-5478223 -3.12 6.88E-15 chloroplast envelope membrane protein
scaffold_7:5478298-5482222 -3.65 0 cytochrome b6
scaffold_7:5482281-5482360 -3.71 1.13E-07
scaffold_7:5482444-5483955 -3.62 0 photosystem ii cp47 chlorophyll apoprotein
scaffold_7:5717198-5717277 -3.45 0
scaffold_7:6325361-6325500 -2.67 2.57E-06 atp synthase cf1 alpha subunit
scaffold_7:8296338-8298238 3.03 1.67E-06
scaffold_8:11283167-11283492 -3.02 1.25E-11
scaffold_8:11283610-11283898 -2.02 0.000527318
scaffold_8:11284437-11284822 -3.42 5.01E-07 protein
scaffold_8:14289997-14290439 3.02 0.000293298
scaffold_8:15367346-15367458 -2.10 1.18E-05
scaffold_8:19951567-19951634 -1.79e+308 0.000269396
scaffold_8:3999233-3999476 -4.47 5.48E-14 photosystem1 subunit a
scaffold_8:4769029-4769586 -2.93 1.43E-05 acetyl- carboxylase carboxyltransferase beta subunit
scaffold_8:5430482-5430604 -2.71 0.000173277
scaffold_8:6836956-6837139 -3.52 1.03E-07 chk1 checkpoint-like protein
scaffold_8:6839401-6839465 -3.60 0.000124047
scaffold_8:9084500-9087181 -2.03 9.63E-07 hypothetical protein MTR_4g035030 [Medicago truncatula]
scaffold_8:9092210-9092526 -4.03 3.62E-12 atp synthase cf0 subunit iv
scaffold_8:9092579-9092731 -3.25 4.67E-09
scaffold_8:9630920-9631041 -4.99 0.000935891
scaffold_9:1413061-1413206 -2.90 1.68E-05 cytochrome p450 like_tbp
scaffold_9:1413275-1413385 -3.15 2.56E-08
scaffold_9:381819-381916 -3.89 1.37E-11
scaffold_9:575465-575987 2.90 4.52E-05

Appendix
158
Table A.11 Differentially expressed transcripts for which no annotation was available on the peach genome in common at 2 and 12 hpi by pair-wise comparison of inoculated sample to the mock-inoculated sample
Transcript locus log2(fold_change) C2-I2 p_value
log2(fold_change) C12-I12 p_value Annotation
scaffold_1:13800974-13801217 2.28 0.000000143 -2.65 0.0000346 ribosomal protein s12 scaffold_1:26187472-26187552 2.02 0.00000413 -3.77 0.000000527
scaffold_1:45766999-45773594 -4.82 3.4E-14 -4.78 4.44E-16
scaffold_2:14040666-14041121 2.28 1.61E-10 -5.45 6.43E-12 atp synthase cf1 epsilon subunit scaffold_3:14217994-14219066 2.16 0 2.21 9.07E-10
scaffold_7:19980649-19981191 -4.15 0.000000637 4.78 2.72E-10 mutt domain scaffold_8:6836956-6837139 2.34 0.000000636 -3.52 0.000000103 chk1 checkpoint-like protein
Table A.12. Putative PR and ERF genes identified by Sherif et al. (2011, 2012) and their expression level in our study
possible transcript
linkage group function note Reference
ppa025994m 1 thaumatin Not differentially expressed Sherif et al. 2011
ppa014446m 1 unknown Not differentially expressed Sherif et al. 2011
ppa019465m 1 thaumatin Not expressed Sherif et al. 2011
ppa008563m 1 transcription factor activity, regulation of transcription, DNA-dependent
Not differentially expressed Sherif et al. 2012
ppa018211m 2 cysteine-rich secretory protein Not differentially expressed Sherif et al. 2011
ppa026643m 2 thaumatin Not expressed Sherif et al. 2011
ppb019990m 2 Glucosyl/glucuronosyl transferases not expressed Sherif et al. 2012
ppa010471m 3 thaumatin Not differentially expressed Sherif et al. 2011
ppa010479m 3 thaumatin Not differentially expressed Sherif et al. 2011
ppa006366m 3 transcription factor activity, regulation of transcription, DNA-dependent
Not differentially expressed Sherif et al. 2012
ppa010031m 4 thaumatin Not differentially expressed Sherif et al. 2011
ppa016600m 4 cysteine-rich secretory protein Not expressed Sherif et al. 2011
ppa009707m 5 transcription factor activity, regulation of transcription, DNA-dependent
only downregulated at 2h of -1.4 (log2fold) change
Sherif et al. 2012
ppa011521m 6 cysteine-rich secretory protein Not expressed Sherif et al. 2011
ppa018008m 6 thaumatin Not differentially expressed Sherif et al. 2011
ppa005376m 6 transcription factor activity, regulation of transcription, DNA-dependent
Not differentially expressed Sherif et al. 2012
ppa010568m 7 thaumatin only up-regulated at 2h of 1.2 (log2 fold) change
Sherif et al. 2011
ppa027209m 7 cysteine-rich secretory protein Not expressed Sherif et al. 2011
ppa009119m 7 thaumatin Not differentially expressed Sherif et al. 2011
ppa009384m 7 thaumatin Not differentially expressed Sherif et al. 2011
ppa008035m 8 thaumatin Not differentially expressed Sherif et al. 2011
ppa009841m 8 thaumatin Not differentially expressed Sherif et al. 2011
ppa008730m 8 transcription factor activity, regulation of transcription, DNA-dependent
Not differentially expressed Sherif et al. 2012


Acknowledgements


Acknowledgements
162
First of all I wish to thank Dr. Andrea Patocchi for his supervision, constructive comments, time and
help during these last 3.5 years. I am as well very grateful to Prof. Cesare Gessler for his availability
and his efficiency to solve problems, and to Prof. Bruce McDonald for co-supervising my PhD.
Many thanks to Drs. Brion Duffy and Danilo Christen for their constructive ideas, their time and help
during my PhD.
I especially thank Maja Hilber-Bodmer, Bea Frey, Markus Oggenfuss and Drs. Jürg Frey and Cosima
Pelludat for their outstanding management in the lab and their kind help.
Very special thanks to Dr. Joël Pothier and Tim Kamber for their enormous help, support and
constructive discussions all along my PhD.
I wish to thank Verena Knorst, Perrine Ferrié and Patrick Magniant for their technical help in the
greenhouse; Vincent Nussbaum, Rayan Mac Nulty and Xavier Pousse for their help in the field and
lab; as well as Gérard Devènes for his excellent knowledge about apricots and his help in field
scorings; Dr. Fabio Rezzonico for his help with the AFLPs; Rolf Blapp for grafting the plants, Jürgen
Kraus for his help with potting the plants; Edi Holliger for administrative issues, René Total for
greenhouse matters and Theo Smits for discussions and computer matters.
Many many thanks to Melanie Jänsch, Dr. Kerstin Brankatschk, Andy Lehman, Maxie Hubert, Dr.
Fiona Walsh, Juliane Weger, Fabrizio Lucchini, Dr. Pierre-Marie Le Roux, Andy Bühlman, Dr.
Martijn Hoterman, Dr. Andrea Braun-Kiewnick, Pierre Schneeberger, Stefanie Wolf, Jan Candreia,
Nicola Schley, Nicola Sartori and all others previously cited who took part in great B10 events and
who all contributed to excellent working conditions in the lab and/or in B10 office.
Extra (double) thanks to the mountain bike team, Joël Pothier, Markus Oggenfuss and Martijn
Holterman for all these great tours around Wädenswil.
Un grand merci à tous mes amis et notamment à Julien de Bortoli et Adrien de Franceschi pour leurs
encouragements et leur soutien.
Last but not least: un grand merci à toute ma famille, mes parents, mes soeurs, grand parents, cousins,
oncles et tantes pour leur soutien sans faille et qui ont grandement participé à la réussite de mes
études.

164
Curriculum Vitae Didier Socquet-Juglard Nationality: French Born in Sallanches, France Date of birth: 22.08.1984 Education and diplomas 2009-2012 PhD student at the Swiss Federal Institute of Technology, Zurich (ETH-Z), in
collaboration with the Federal Research Station Agroscope Changins-Wädenswil (ACW), Switzerland Topic: Genetic determinism of Xanthomonas arboricola pv. pruni resistance and agronomic traits in apricot, and applications in marker-assisted selection Supervisors: Dr. A. Patocchi (ACW) and Prof. C. Gessler (ETHZ)
2007-2009 Master of Sciences in Integrated Natural Resource Management at the Humboldt
University, Berlin, Germany Topic of the Master thesis: Mapping of genes involved in development and resistance to Verticillium longisporum in Brassica alboglabra Supervisors: Dr. E. Diederichsen (FU Berlin) and Prof. C. Büttner (HU Berlin)
2005-2006 European Engineer Degree in Plant Production, specialization in Plant Biotechnology at
CAH Dronten, the Netherlands 2004-2005 Bachelor of Sciences in Plant Production, specialization in Plant Biotechnology at ESA
Angers, France 2002-2004 “BTS” , equivalent to a British HND in Plant Productions at ESA Angers, France 2002 “Baccalaureat S”, equivalent to A levels in Biology, Mathematics, Physics and
Chemistry at Lycée St Joseph, Sallanches, France Practical training 2007-2009 2 years working experience as a student assistant and 6 months placement at the Freie
Universität, Berlin in collaboration with the Humboldt University, Berlin 2005-2006 6 months placement in Tulln an der Donau, Austria
Topic: Assessment of microsatellites to select resistant wheat and triticale plants to Fusarium Head Blight and resistant wheat plants to Barley Yellow Dwarf Virus Supervisors: Prof. H. Buerstmayr (BOKU Vienna) and Dr. van Dijk (CAH Dronten)
2004-2005 12 weeks placement in the seed technology and the phytopathology departments of
Syngenta Seeds B.V., Enkhuizen, the Netherlands Topic: Development of a protocol to screen pepper plants for Myzus persicae resistance
and assessment of germination rates of Brassica oleracea seeds Supervisors: Dr. M. van Kilsdonk (Syngenta), Dr. R. Linders (Syngenta) and H. Rongeot (ESA Angers)
2003 6 weeks placement at Pothos Plant B.V. (Spathyphillum and orchid breeding company),
Monster, the Netherlands

Curriculum Vitae
165
Publications Socquet-Juglard D, Patocchi A, Pothier JF, Christen D, Duffy B (2012) Evaluation of Xanthomonas
arboricola pv. pruni inoculation techniques to screen for bacterial spot resistance in apricot. Journal of Plant Pathology 94:S1.91-S1.96
Socquet-Juglard D, Duffy B, Christen D, Gessler C, Patocchi A (2012) Identification of a major QTL for Xanthomonas arboricola pv. pruni resistance in apricot. Tree Genetics and Genome. DOI: 10.1007/s11295-012-0562-z
Socquet-Juglard D, Christen D, Devènes G, Gessler C, Duffy B, Patocchi A (2012) Mapping architectural, phenological and fruit quality QTLs in apricot. Plant Molecular Biology Reporter. DOI: 10.1007/s11105-012-0511-x
Socquet-Juglard D, Kamber T, Pothier JF, Gessler C, Duffy B, Patocchi A (2012) Comparative RNA-seq analysis of early-infected peach leaves by the invasive phytopathogen Xanthomonas arboricola pv. pruni. Accepted in PLoS ONE
Konietzki S, Socquet-Juglard D, Diederichsen E (2009) Mapping of genes controlling development and resistance to Verticillium longisporum in Brassica alboglabra. In: Feldmann F, Alford D V, Furk C (Eds): Crop Plant Resistance to Biotic and Abiotic Factors, 319.
Häffner E, Konietzki S, Socquet-Juglard D, Gerowitt B, Diederichsen E (2009) Genetics of Resistance Against the Vascular Pathogen Verticillium Longisporum in Brassica and Arabidopsis Thaliana. In: Feldmann F, Alford D V, Furk C (Eds): Crop Plant Resistance to Biotic and Abiotic Factors, 385-392.
Conference presentations and posters Socquet-Juglard D, Christen D, Gessler C, Duffy B, Patocchi A (2011) Mapping of a major QTL
against Xanthomonas arboricola pv. pruni in apricot. Poster presented at the 1st International ISHS Workshop on Bacterial Diseases of Stone Fruits and Nuts, Zurich, Switzerland.
Socquet-Juglard D, Christen D, Gessler C, Duffy B, Patocchi A (2011) Mapping QTL resistance in apricot against Xanthomonas arboricola pv. pruni. Poster presented at the 13th Eucarpia Symposium on Fruit Breeding and Genetics, Warsaw, Poland.
Socquet-Juglard D, Pothier J, Duffy B, Christen D, Gessler C, Patocchi A (2010) Advances in mapping QTLs against Xanthomonas arboricola pv. pruni in Apricot. Poster presented at the annual COST873 meeting, Jurmala, Latvia.
Socquet-Juglard D, Duffy B, Christen D, Gessler C, Patocchi A (2010) First advances in mapping Xanthomonas arboricola pv. pruni resistance QTLs in apricot. Oral presentation at COST873 action meeting, Barcelona, Spain.
Diederichsen E, Konietzki S, Socquet-Juglard D, Karlovsky P, Häffner E (2010) Characterization and genetics of different disease parameters caused by Verticillium longisporum in Brassica and Arabidopsis. Poster presented at the 10th International Verticillium Symposium, Corfu, Hellas.
Socquet-Juglard D, Pothier JF, Christen D, Duffy B, Gessler C, Patocchi A (2009) QTL mapping of Xanthomonas arboricola pv. pruni resistance in apricot. Poster presented at the COST873 Annual Meeting on Bacterial Diseases of Stone Fruits and Nuts, Naples, Italy.
Socquet-Juglard D, Pothier J, Duffy B, Christen D, Gessler C and Patocchi A (2009) QTL mapping for apricot resistance to the quarantine pathogen Xanthomonas arboricola pv. pruni. Poster presented at the annual COST873 meeting, Naples, Italy.
Socquet-Juglard D, Konietki S, Diederichsen E (2008) Mapping of genes involved in plant development and resistance to Verticillium longisporum in Brassica alboglabra. Poster presented at the 9th International Congress of Plant Pathology, Turin, Italy.

Curriculum Vitae
166
Short Term Scientific Missions 2011 2 weeks mission at the Functional Genomic Center, University of Verona, Italy
Topic: Comparative transcriptomics to identify genes involved in Xanthomonas arboricola pv. pruni resistance in apricot. Host: Pr. M. Delledonne