Embed Size (px)
Citation preview
Research Brief
Benchmarking Sales Manager Activity
Research underwriter
July 2015
Copyright © 2014-15 the Sales Management Association. All rights reserved.2
First published July 2015.
Sales Management Association 1440 Dutch Valley Place NE Suite 990 Atlanta, Georgia 30324 USA +1 (404) 963-7992 http://salesmanagement.org
Copyright © 2014-15 The Sales Management Association, Inc.
All rights reserved; no part of this publication may be reproduced, stored in a re-trieval system, or transmitted in any form or by any means, electronic, mechani-cal, photocopying, recording, or otherwise, without prior written permission of the publishers.
Research Brief: Benchmarking Sales Manager ActivityThis document has been prepared by The Sales Management Association for use by its members. The Sales Management Association has worked to ensure the accuracy of the information it provides to its members. This report relies upon data obtained from many sources, however, and The Sales Management Association is not engaged in rendering legal, accounting, or other professional services. Its reports should not be construed as professional advice on any particular set of facts or circumstances. Members requiring such services are advised to consult an appropriate professional. Neither the Sales Management Association nor its programs are responsible for any claims or losses that may arise from a) any errors or omissions in their reports, whether caused by The Sales Management Association or its sources, or b) reliance upon any recom-mendation made by the Sales Management Association.
Descriptions or viewpoints contained herein regarding organizations profiled in this material do not necessarily reflect the policies or viewpoints of those organi-zations.
About The Sales Management AssociationThe Sales Management Association is a global, cross-industry professional organization for sales operations, sales effectiveness, and sales leadership pro-fessions. We provide our members with tools, networking, research, training, and professional development.
Our research initiatives address topics relevant to practitioners across a broad spectrum of sales effectiveness issues. Our research is available to members on our site at www.salesmanagement.org.
In addition to research we publish best practice tools, archived webcasts, and expert content. Visit our website at http//salesmanagement.org to learn more.
Author Robert J. Kelly Chairman The Sales Management Association
Copyright © 2014-15 the Sales Management Association. All rights reserved. 3
Research Brief: Benchmarking Sales Manager Activity
Contents
1 Research Summary 51.1 Study Objectives 51.2 Summary of Key Findings 5
2 About the Research 72.1 Research Approach 72.2 Research Timing and Scope 72.3 Research Underwriters 7
3 Sales Managers’ Activity Benchmarks 83.1 The Company Managers Keep 83.2 Manager Time Spent by Functional Activity 93.3 How Much Time is Enough? 93.4 Differences in Manager Time Allocation in High-and Low-Performing Firms 10
4 The Impact of Salesperson Capability on Manager Time 134.1 Benchmarking Salesperson Capability 134.2 Salesperson Capability Differences in High- and Low-Performing Firms 134.3 Manager Time Allocation Differences in Managing High and Low Capability Sales Forces 14
5 Manager Autonomy and Time Allocation 165.1 Sales Managers’ Degree of Decision-Making Autonomy 165.2 Sales Manager Autonomy and Firm Performance 17
6 Directing and Supporting Sales Manager Time Allocation Decisions 186.1 Supporting Sales Managers 186.2 Manager Support Differences in High- and Low-Performing Firms 196.3 Directing Sales Managers’ Time Allocation Decisions 20
7 Respondent Demographics 227.1 Firm Size 227.2 Firm Performance 227.3 Sales Force Size, Structure, and Management Span of Control 247.4 Job Role 25

Copyright © 2014-15 the Sales Management Association. All rights reserved.4
Copyright © 2014-15 the Sales Management Association. All rights reserved. 5
1.1 Study Objectives:
Sales managers have an outsized impact on sales force productivity. That impact is shaped by decisions sales managers make in allocating their time across a broad set of accountabilities. This research examines how sales managers spend time and distribute managerial effort across their assigned responsibilities and direct reports.
Research issues addressed in this study include identifying sales managers’ core activities, quantifying manager time allocation by activity, uncovering gaps in actual and ideal time allocation, and prioritizing high-value activities for sales managers. Special focus is given to identifying differences in high-performing firms’ sales managers, compared with their peers in lower-performing firms.
1.2 Summary of Key Findings
Sales managers spend about half their time (51%) working directly with salespeople; of this amount 33% is spent working directly with or observing salespeople, and 16% in meetings with salespeople. Their remaining time is spent working alone, in internal meetings not involving salespeople, or working with customers.
By functional activity, sales managers spend 28% of their time on internally focused, non sales-related activities (15% is focused on administrative activities, and 13% on managing internal resources). An additional 17% of time is spent planning, and 17% on reviewing performance. Fifteen percent is spent coaching and developing salespeople, and 10% providing performance feedback to salespeople.
Research Summary1
Research Brief: Benchmarking Sales Manager Activity
Copyright © 2014-15 the Sales Management Association. All rights reserved.6
Few firms consider sales managers’ time utilization ideal across these activities. For example, just 26% believe their sales managers spend the ideal amount of time observing salespeople. More than more than 70% believed their sales managers spent too much time observing salespeople.
High-performing firms’ sales managers spent significantly less time than lower-performing firms’ in three activities: managing internal resources, planning, and administrative activities. Lower-performing firms’ sales managers spend, on average, 1.5 hours more each week on administrative activities, and about 30 minutes more time each week on planning activities and in managing internal resources. High-performing firms’ sales managers spent 1.4 hours more each week in one-on-one meetings with salespeople than their counterparts in low-performing firms; and, they spent about 50 minutes more each week working alone.
Sales managers must adapt to a number of factors that influence their time allocation decisions. Of these, the capability of the sales team managed represents a significant influence. High-performing firms therefore have significantly greater populations of A salespeople (36% of the total force compared to 28% for low- performing firms), and B salespeople (51% of the total force, compared to 45% for low-performing firms). In firms with the highest proportion of A contributors, sales managers spent significantly more time observing salespeople, and less time meeting with them; they also spent significantly less time on administrative activities or in working alone. These They also spent more time planning, reviewing salesperson performance, and managing internal resources. Most significantly, they spent much more time providing opportunity-specific advice to salespeople, and much less time in more generic coaching or developmental activities.
Our research found that sales managers in high-performing firms exercise more decision-making autonomy than their counterparts in lower-performing firms. High performing firms are also more apt to support sales managers with technology and training, but significantly less likely to be highly directive in suggesting how sales managers should spend their time, when compared to low-performing firms.
Research Summary
Copyright © 2014-15 the Sales Management Association. All rights reserved. 7
2 About the Research
2.1 Research Approach
This study aggregates participating firms’ responses to a web-based survey. The Sales Management Association developed the survey and recruited participants from our membership and broader audience of sales managers and sales operations professionals. In exchange for participating, we offer respondents advance copies of the detailed study report.
Before reporting results, we eliminate invalid or ineligible responses, and sometimes contact respondents to clarify their responses. Survey results are only reported in aggregate, and never in a way that would compromise the identity of any single respondent. All individual respondent data are treated with strict confidentiality.
2.2 Research Timing and Scope
This research represents summarized data from 87 participating firms, directly employing more than 20,000 sales managers and 114,000 sales professionals. Data was collected during the months of October, November, and December 2014. Respondent demographics and descriptive information is summarized in the Respondent Demographics report section below.
2.3 Research Underwriters
This study was made possible in part through the underwriting support of Richardson. Sales Management Association underwriters provide annual financial support to the Sales Management Association. Underwriters may suggest research topics, participate in ongoing research projects, and encourage participation or otherwise promote research initiatives.
Underwriters are not involved with research administration, data collection, analysis, interpretation, or report development,
Copyright © 2014-15 the Sales Management Association. All rights reserved.8
unless explicitly noted in the report. Also, unless noted, underwriters do not pay a research-specific fee or directly commission research initiatives.
3 Sales Managers’ Activity Benchmarks
3.1 The Company Managers Keep
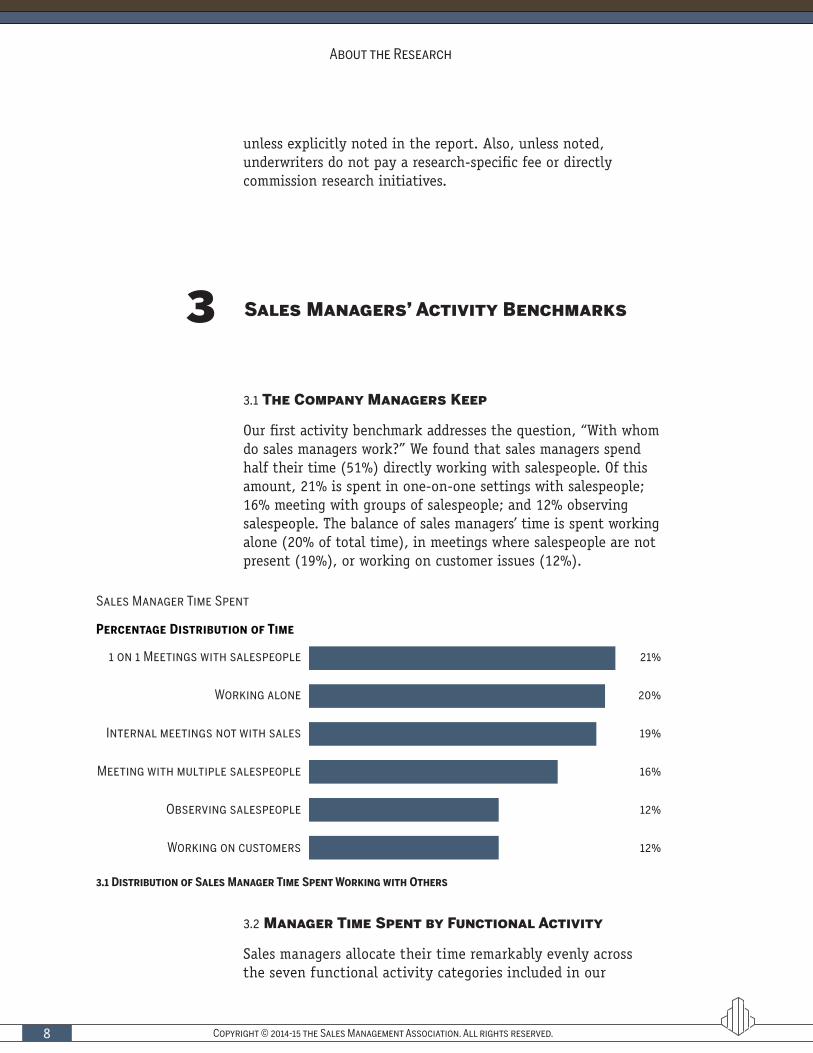
Our first activity benchmark addresses the question, “With whom do sales managers work?” We found that sales managers spend half their time (51%) directly working with salespeople. Of this amount, 21% is spent in one-on-one settings with salespeople; 16% meeting with groups of salespeople; and 12% observing salespeople. The balance of sales managers’ time is spent working alone (20% of total time), in meetings where salespeople are not present (19%), or working on customer issues (12%).
Sales Manager Time Spent
Percentage Distribution of Time
1 on 1 Meetings with salespeople
Working alone
Internal meetings not with sales
Meeting with multiple salespeople
Observing salespeople
Working on customers
21%
20%
19%
16%
12%
12%
3.1 Distribution of Sales Manager Time Spent Working with Others
3.2 Manager Time Spent by Functional Activity
Sales managers allocate their time remarkably evenly across the seven functional activity categories included in our
About the Research
Copyright © 2014-15 the Sales Management Association. All rights reserved. 9
Research Brief: Benchmarking Sales Manager Activity
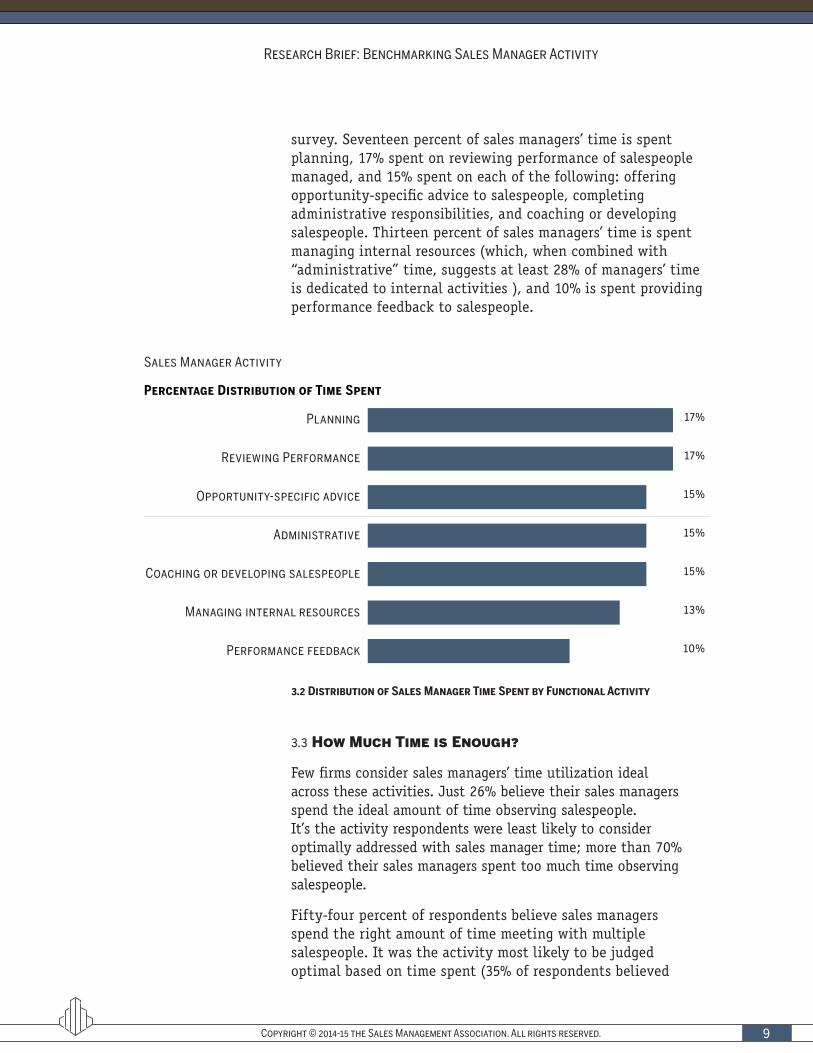
survey. Seventeen percent of sales managers’ time is spent planning, 17% spent on reviewing performance of salespeople managed, and 15% spent on each of the following: offering opportunity-specific advice to salespeople, completing administrative responsibilities, and coaching or developing salespeople. Thirteen percent of sales managers’ time is spent managing internal resources (which, when combined with “administrative” time, suggests at least 28% of managers’ time is dedicated to internal activities ), and 10% is spent providing performance feedback to salespeople.
Sales Manager Activity
Percentage Distribution of Time Spent
Planning
Reviewing Performance
Opportunity-specific advice
Administrative
Coaching or developing salespeople
Managing internal resources
Performance feedback
17%
17%
15%
15%
15%
13%
10%
3.3 How Much Time is Enough?
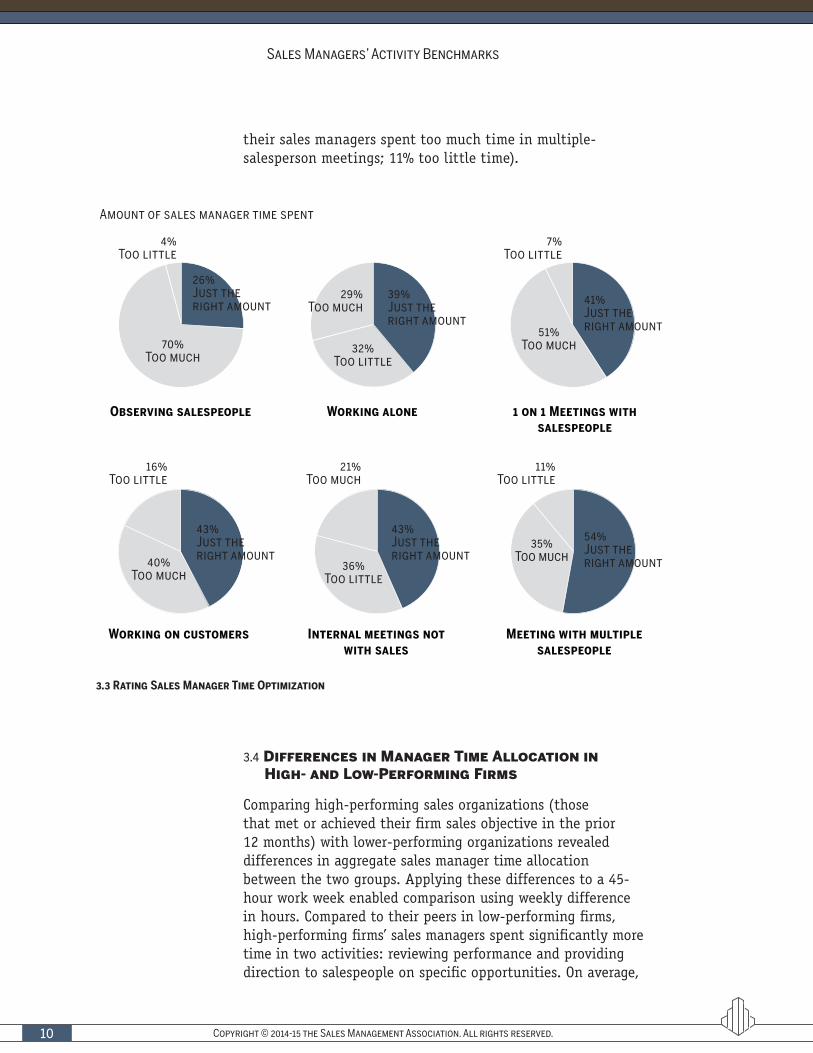
Few firms consider sales managers’ time utilization ideal across these activities. Just 26% believe their sales managers spend the ideal amount of time observing salespeople. It’s the activity respondents were least likely to consider optimally addressed with sales manager time; more than 70% believed their sales managers spent too much time observing salespeople.
Fifty-four percent of respondents believe sales managers spend the right amount of time meeting with multiple salespeople. It was the activity most likely to be judged optimal based on time spent (35% of respondents believed
3.2 Distribution of Sales Manager Time Spent by Functional Activity
Copyright © 2014-15 the Sales Management Association. All rights reserved.10
their sales managers spent too much time in multiple-salesperson meetings; 11% too little time).
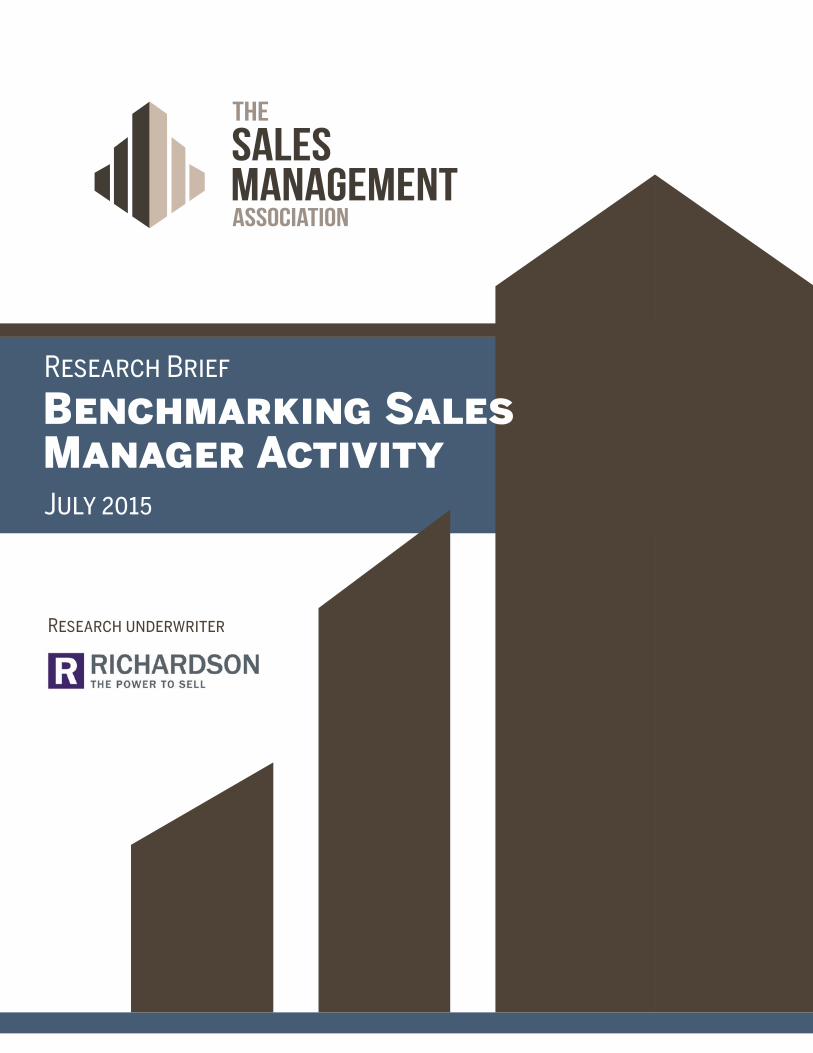
3.4 Differences in Manager Time Allocation in High- and Low-Performing Firms
Comparing high-performing sales organizations (those that met or achieved their firm sales objective in the prior 12 months) with lower-performing organizations revealed differences in aggregate sales manager time allocation between the two groups. Applying these differences to a 45-hour work week enabled comparison using weekly difference in hours. Compared to their peers in low-performing firms, high-performing firms’ sales managers spent significantly more time in two activities: reviewing performance and providing direction to salespeople on specific opportunities. On average,
Amount of sales manager time spent
Observing salespeople Working alone 1 on 1 Meetings with salespeople
26%Just the right amount
39%Just the right amount
41%Just the right amount
70%Too much
4%Too little
29%Too much
32%Too little
51%Too much
7%Too little
Working on customers Internal meetings not with sales
Meeting with multiple salespeople
43%Just the right amount
43%Just the right amount
54%Just the right amount40%
Too much
16%Too little
21%Too much
36%Too little
35%Too much
11%Too little
Amount of sales manager time spent
3.3 Rating Sales Manager Time Optimization
Sales Managers’ Activity Benchmarks
Copyright © 2014-15 the Sales Management Association. All rights reserved. 11
Research Brief: Benchmarking Sales Manager Activity
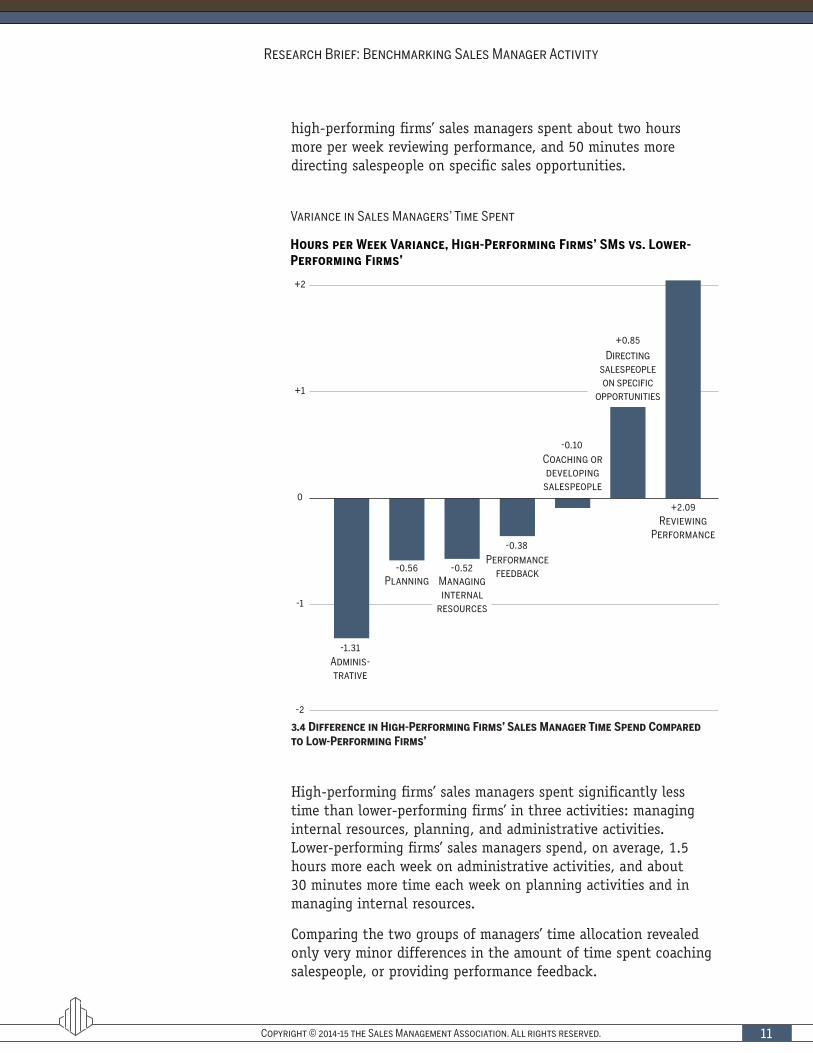
high-performing firms’ sales managers spent about two hours more per week reviewing performance, and 50 minutes more directing salespeople on specific sales opportunities.
Variance in Sales Managers’ Time Spent
Hours per Week Variance, High-Performing Firms’ SMs vs. Lower-Performing Firms’
-0.56
-0.38
-0.52
-1.31
+0.85
+2.09
-0.10
Performance feedback
Planning
+2
+1
0
-1
-2
Managing internal
resources
Adminis-trative
Directing salespeople on specific
opportunities
Coaching or developing
salespeople
Reviewing Performance
High-performing firms’ sales managers spent significantly less time than lower-performing firms’ in three activities: managing internal resources, planning, and administrative activities. Lower-performing firms’ sales managers spend, on average, 1.5 hours more each week on administrative activities, and about 30 minutes more time each week on planning activities and in managing internal resources.
Comparing the two groups of managers’ time allocation revealed only very minor differences in the amount of time spent coaching salespeople, or providing performance feedback.
3.4 Difference in High-Performing Firms’ Sales Manager Time Spend Compared to Low-Performing Firms’
Copyright © 2014-15 the Sales Management Association. All rights reserved.12
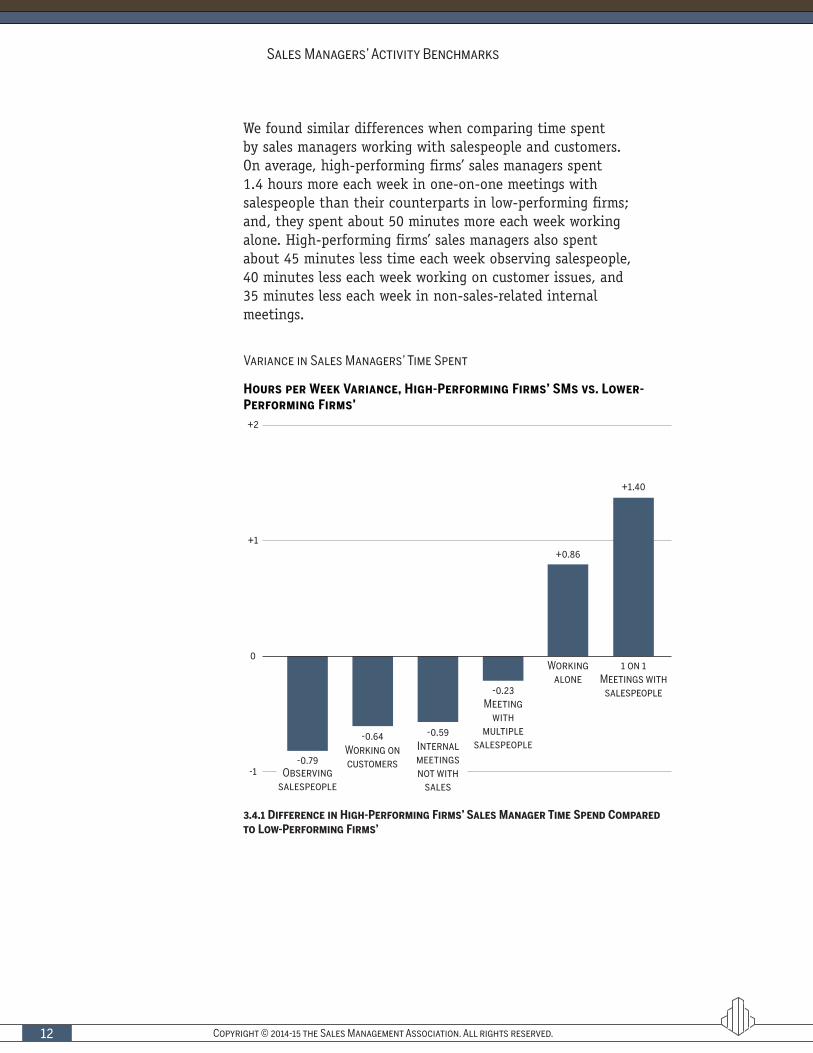
We found similar differences when comparing time spent by sales managers working with salespeople and customers. On average, high-performing firms’ sales managers spent 1.4 hours more each week in one-on-one meetings with salespeople than their counterparts in low-performing firms; and, they spent about 50 minutes more each week working alone. High-performing firms’ sales managers also spent about 45 minutes less time each week observing salespeople, 40 minutes less each week working on customer issues, and 35 minutes less each week in non-sales-related internal meetings.
Variance in Sales Managers’ Time Spent
Hours per Week Variance, High-Performing Firms’ SMs vs. Lower-Performing Firms’
-0.23
-0.79
-0.59
+1.40
+0.86
Observing salespeople
Meeting with
multiple salespeople
+2
+1
0
-1
Internal meetings not with
sales
-0.64Working on customers
1 on 1 Meetings with
salespeople
Working alone
3.4.1 Difference in High-Performing Firms’ Sales Manager Time Spend Compared to Low-Performing Firms’
Sales Managers’ Activity Benchmarks
Copyright © 2014-15 the Sales Management Association. All rights reserved. 13
Research Brief: Benchmarking Sales Manager Activity
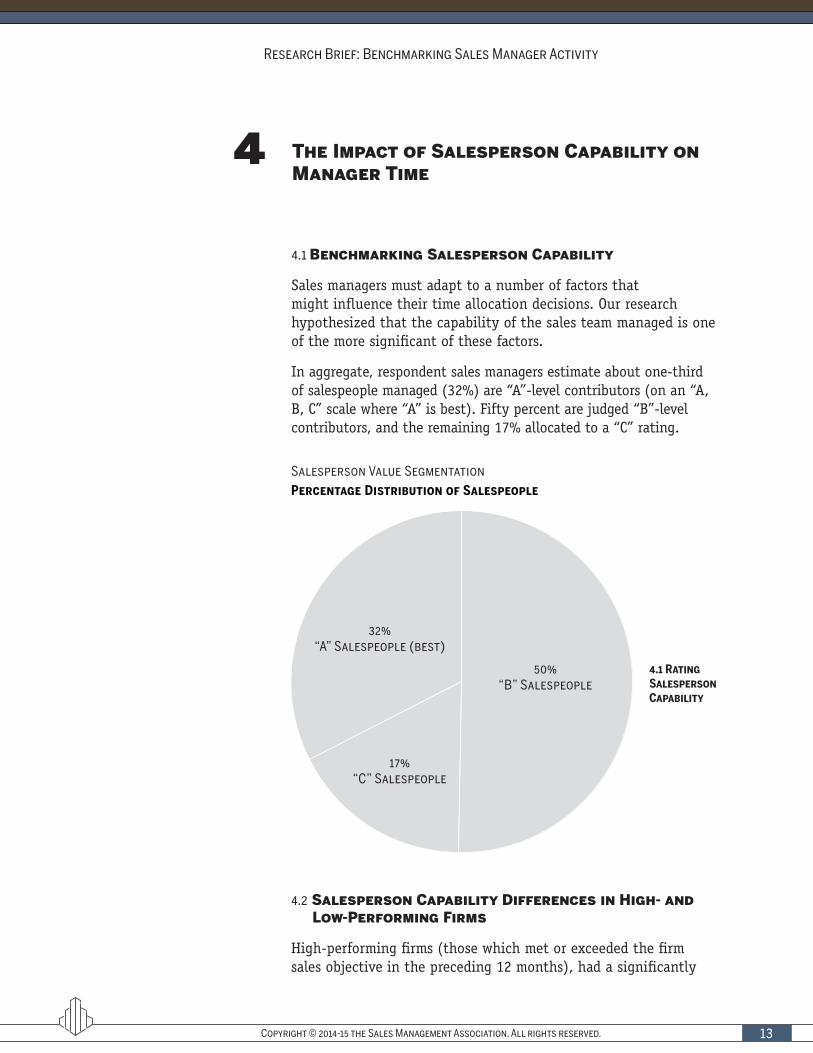
Salesperson Value Segmentation
Percentage Distribution of Salespeople
32%“A” Salespeople (best)
50%“B” Salespeople
17%“C” Salespeople
4.1 Benchmarking Salesperson Capability
Sales managers must adapt to a number of factors that might influence their time allocation decisions. Our research hypothesized that the capability of the sales team managed is one of the more significant of these factors.
In aggregate, respondent sales managers estimate about one-third of salespeople managed (32%) are “A”-level contributors (on an “A, B, C” scale where “A” is best). Fifty percent are judged “B”-level contributors, and the remaining 17% allocated to a “C” rating.
4 The Impact of Salesperson Capability on Manager Time
4.2 Salesperson Capability Differences in High- and Low-Performing Firms
High-performing firms (those which met or exceeded the firm sales objective in the preceding 12 months), had a significantly
4.1 Rating Salesperson Capability
Copyright © 2014-15 the Sales Management Association. All rights reserved.14
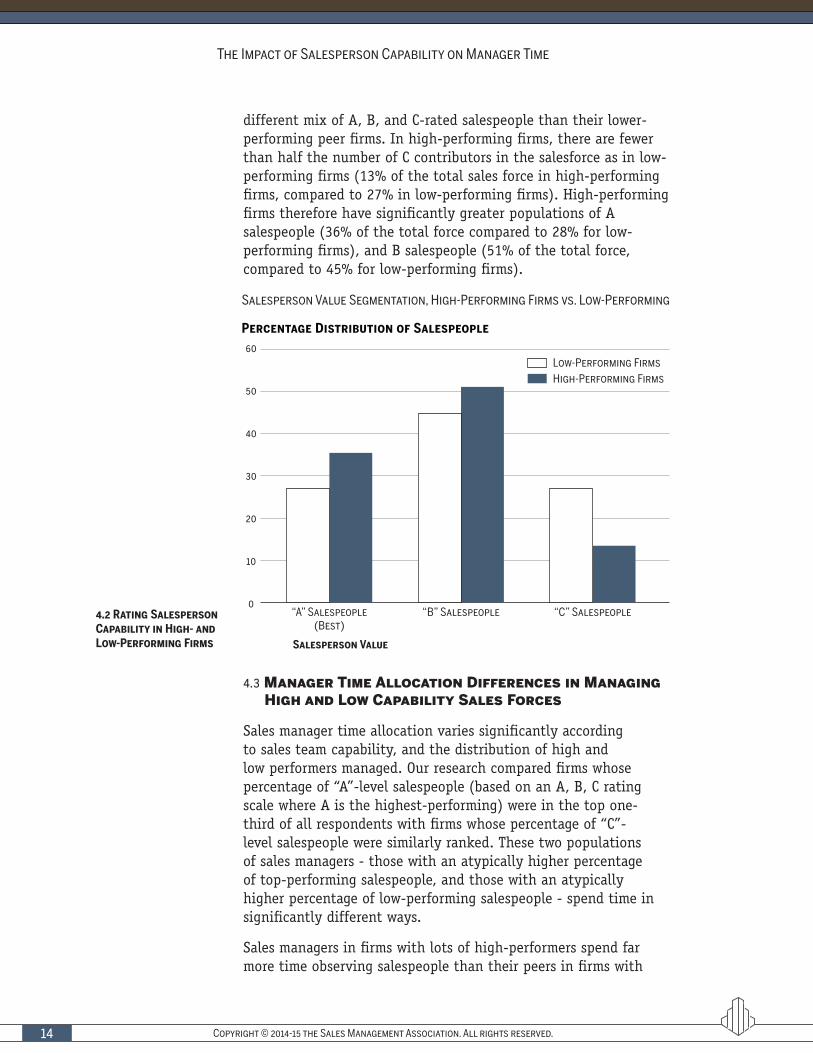
different mix of A, B, and C-rated salespeople than their lower-performing peer firms. In high-performing firms, there are fewer than half the number of C contributors in the salesforce as in low-performing firms (13% of the total sales force in high-performing firms, compared to 27% in low-performing firms). High-performing firms therefore have significantly greater populations of A salespeople (36% of the total force compared to 28% for low-performing firms), and B salespeople (51% of the total force, compared to 45% for low-performing firms).
Salesperson Value Segmentation, High-Performing Firms vs. Low-Performing
Percentage Distribution of Salespeople60
50
40
30
20
10
0
Low-Performing FirmsHigh-Performing Firms
“A” Salespeople (Best)
“B” Salespeople “C” Salespeople
Salesperson Value
4.3 Manager Time Allocation Differences in Managing High and Low Capability Sales Forces
Sales manager time allocation varies significantly according to sales team capability, and the distribution of high and low performers managed. Our research compared firms whose percentage of “A”-level salespeople (based on an A, B, C rating scale where A is the highest-performing) were in the top one-third of all respondents with firms whose percentage of “C”-level salespeople were similarly ranked. These two populations of sales managers - those with an atypically higher percentage of top-performing salespeople, and those with an atypically higher percentage of low-performing salespeople - spend time in significantly different ways.
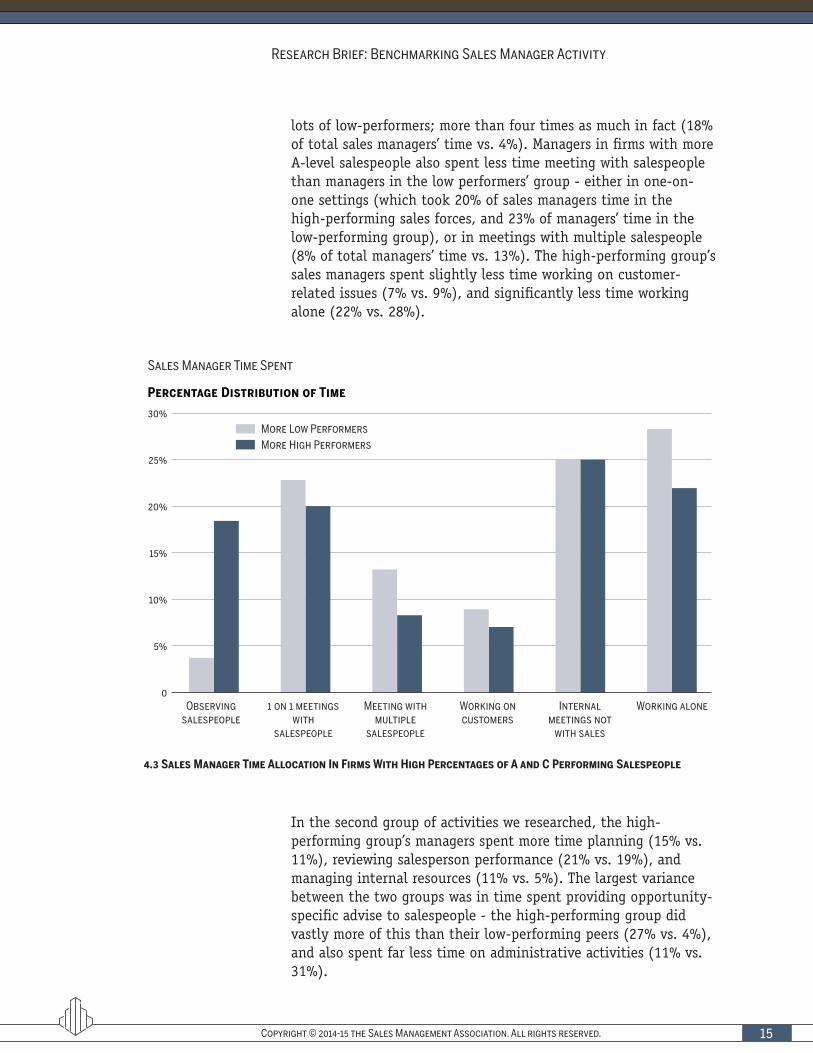
Sales managers in firms with lots of high-performers spend far more time observing salespeople than their peers in firms with
4.2 Rating Salesperson Capability in High- and Low-Performing Firms
The Impact of Salesperson Capability on Manager Time
Copyright © 2014-15 the Sales Management Association. All rights reserved. 15
Research Brief: Benchmarking Sales Manager Activity
lots of low-performers; more than four times as much in fact (18% of total sales managers’ time vs. 4%). Managers in firms with more A-level salespeople also spent less time meeting with salespeople than managers in the low performers’ group - either in one-on-one settings (which took 20% of sales managers time in the high-performing sales forces, and 23% of managers’ time in the low-performing group), or in meetings with multiple salespeople (8% of total managers’ time vs. 13%). The high-performing group’s sales managers spent slightly less time working on customer-related issues (7% vs. 9%), and significantly less time working alone (22% vs. 28%).
Sales Manager Time Spent
Percentage Distribution of Time
30%
25%
20%
15%
10%
5%
0
More Low PerformersMore High Performers
Observing salespeople
1 on 1 meetings with
salespeople
Meeting with multiple
salespeople
Working on customers
Internal meetings not
with sales
Working alone
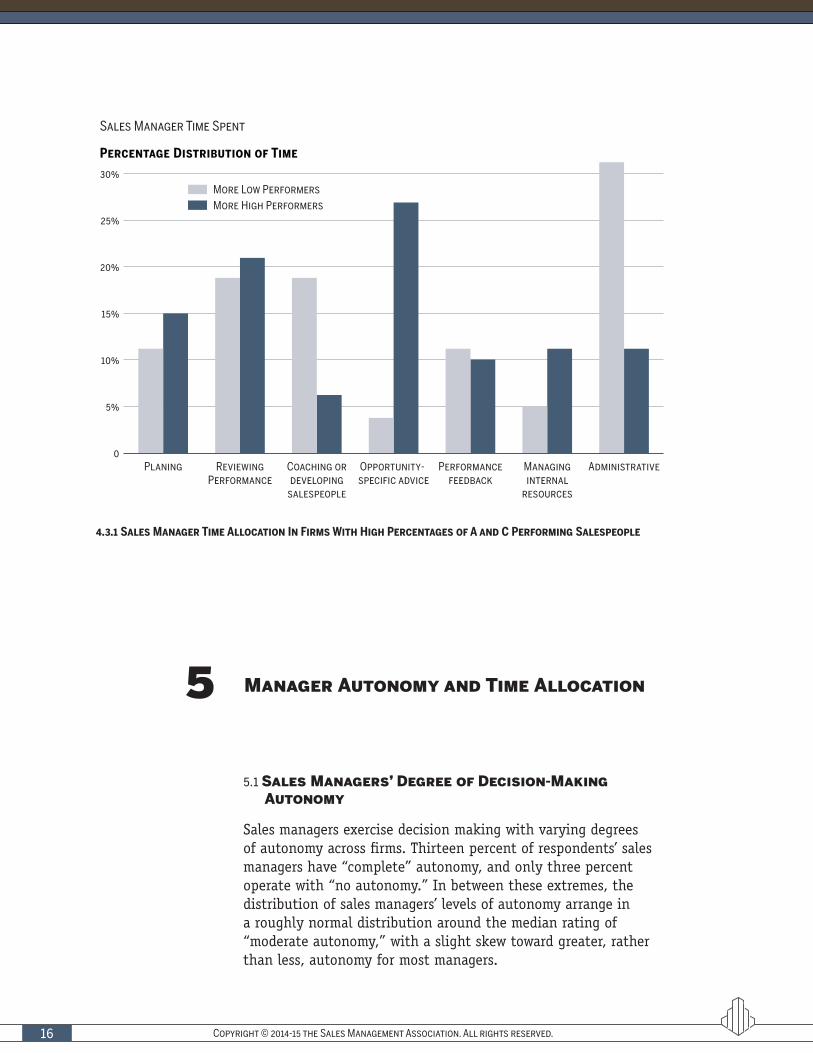
In the second group of activities we researched, the high-performing group’s managers spent more time planning (15% vs. 11%), reviewing salesperson performance (21% vs. 19%), and managing internal resources (11% vs. 5%). The largest variance between the two groups was in time spent providing opportunity-specific advise to salespeople - the high-performing group did vastly more of this than their low-performing peers (27% vs. 4%), and also spent far less time on administrative activities (11% vs. 31%).
4.3 Sales Manager Time Allocation In Firms With High Percentages of A and C Performing Salespeople
Copyright © 2014-15 the Sales Management Association. All rights reserved.16
Sales Manager Time Spent
Percentage Distribution of Time
30%
25%
20%
15%
10%
5%
0
More Low PerformersMore High Performers
Planing Reviewing Performance
Coaching or developing
salespeople
Opportunity-specific advice
Performance feedback
Managing internal
resources
Administrative
5 Manager Autonomy and Time Allocation
5.1 Sales Managers’ Degree of Decision-Making Autonomy
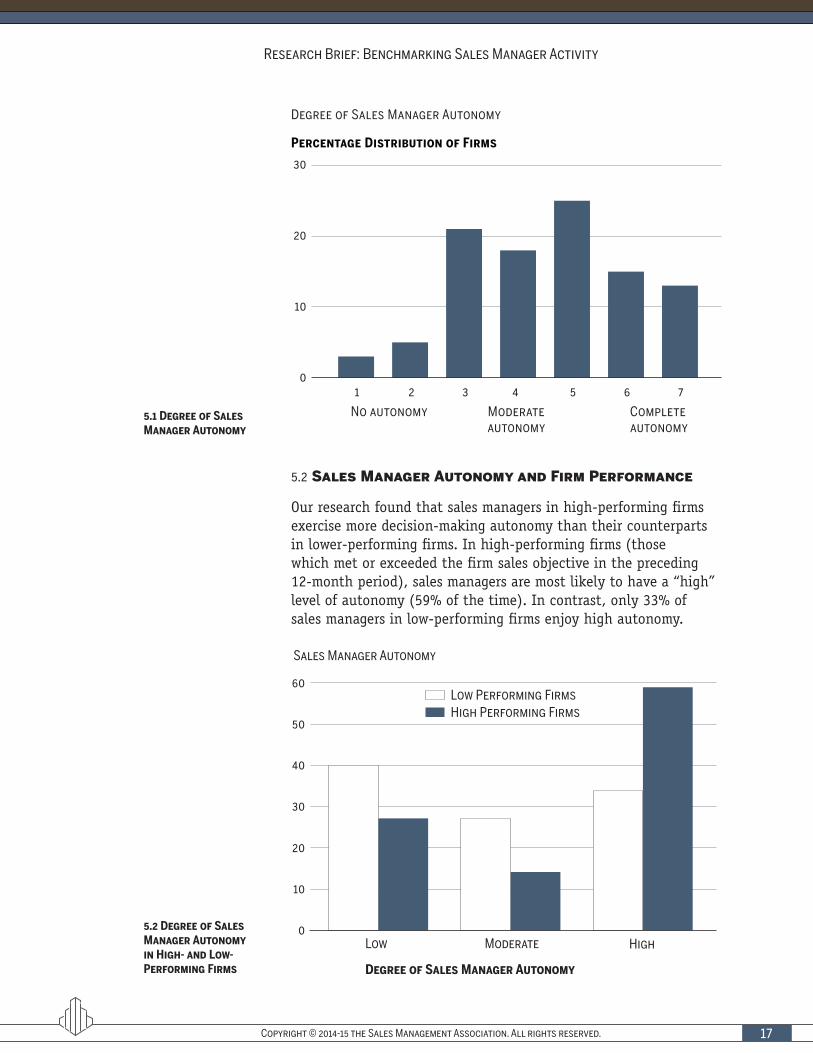
Sales managers exercise decision making with varying degrees of autonomy across firms. Thirteen percent of respondents’ sales managers have “complete” autonomy, and only three percent operate with “no autonomy.” In between these extremes, the distribution of sales managers’ levels of autonomy arrange in a roughly normal distribution around the median rating of “moderate autonomy,” with a slight skew toward greater, rather than less, autonomy for most managers.
4.3.1 Sales Manager Time Allocation In Firms With High Percentages of A and C Performing Salespeople
Copyright © 2014-15 the Sales Management Association. All rights reserved. 17
Research Brief: Benchmarking Sales Manager Activity
5.2 Sales Manager Autonomy and Firm Performance
Our research found that sales managers in high-performing firms exercise more decision-making autonomy than their counterparts in lower-performing firms. In high-performing firms (those which met or exceeded the firm sales objective in the preceding 12-month period), sales managers are most likely to have a “high” level of autonomy (59% of the time). In contrast, only 33% of sales managers in low-performing firms enjoy high autonomy.
Degree of Sales Manager Autonomy
1 2 4 3 5 6 7
Percentage Distribution of Firms
Completeautonomy
No autonomy
10
30
0
20
Moderateautonomy
Sales Manager Autonomy
Degree of Sales Manager Autonomy
Low Moderate High
Low Performing FirmsHigh Performing Firms
0
10
20
30
40
50
60
5.1 Degree of Sales Manager Autonomy
5.2 Degree of Sales Manager Autonomy in High- and Low-Performing Firms
Copyright © 2014-15 the Sales Management Association. All rights reserved.18
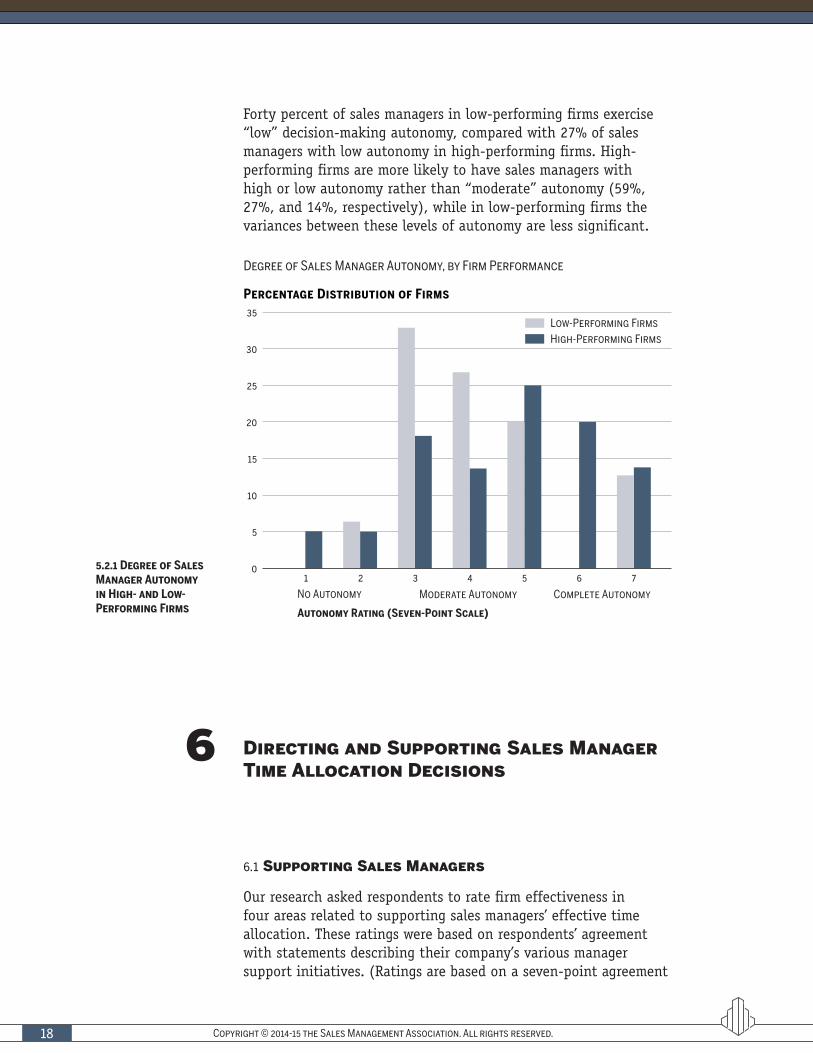
Forty percent of sales managers in low-performing firms exercise “low” decision-making autonomy, compared with 27% of sales managers with low autonomy in high-performing firms. High-performing firms are more likely to have sales managers with high or low autonomy rather than “moderate” autonomy (59%, 27%, and 14%, respectively), while in low-performing firms the variances between these levels of autonomy are less significant.
Degree of Sales Manager Autonomy, by Firm Performance
Percentage Distribution of Firms35
30
25
20
15
10
5
0
Low-Performing FirmsHigh-Performing Firms
3 62 5
No Autonomy Complete AutonomyModerate Autonomy
Autonomy Rating (Seven-Point Scale)
1 4 7
6 Directing and Supporting Sales Manager Time Allocation Decisions
6.1 Supporting Sales Managers
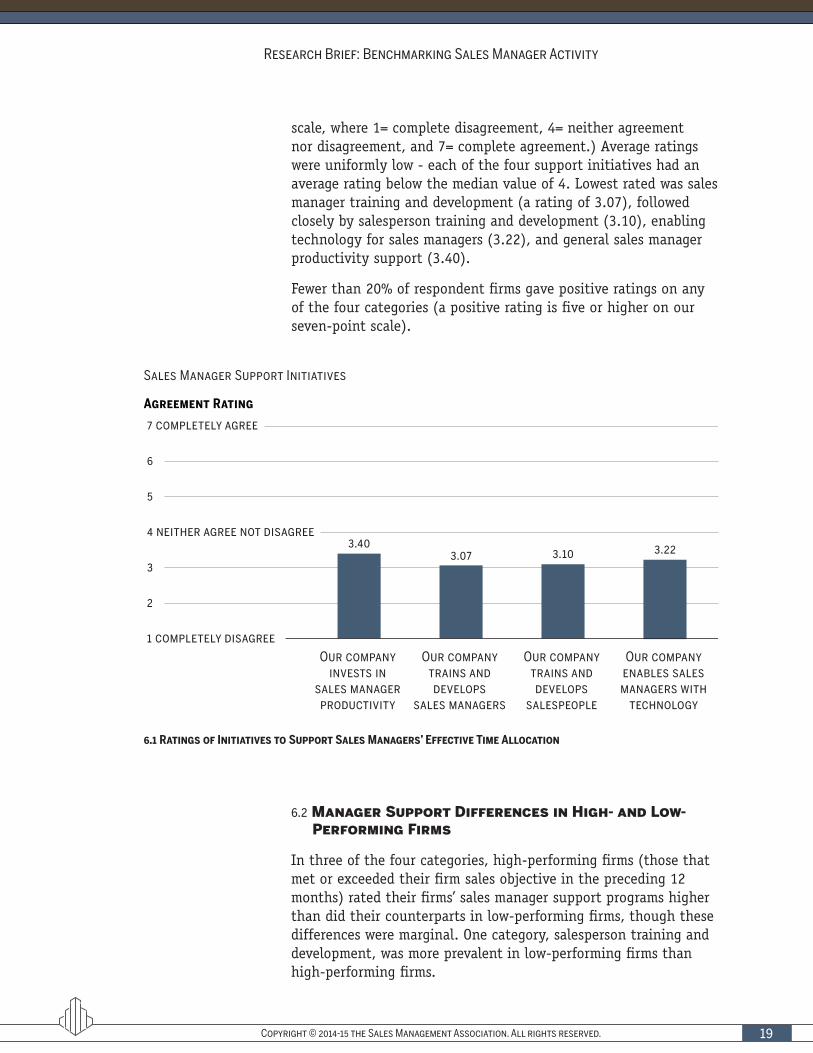
Our research asked respondents to rate firm effectiveness in four areas related to supporting sales managers’ effective time allocation. These ratings were based on respondents’ agreement with statements describing their company’s various manager support initiatives. (Ratings are based on a seven-point agreement
5.2.1 Degree of Sales Manager Autonomy in High- and Low-Performing Firms
Copyright © 2014-15 the Sales Management Association. All rights reserved. 19
Research Brief: Benchmarking Sales Manager Activity
scale, where 1= complete disagreement, 4= neither agreement nor disagreement, and 7= complete agreement.) Average ratings were uniformly low - each of the four support initiatives had an average rating below the median value of 4. Lowest rated was sales manager training and development (a rating of 3.07), followed closely by salesperson training and development (3.10), enabling technology for sales managers (3.22), and general sales manager productivity support (3.40).
Fewer than 20% of respondent firms gave positive ratings on any of the four categories (a positive rating is five or higher on our seven-point scale).
Sales Manager Support Initiatives
Agreement Rating
Our company invests in
sales manager productivity
3.403.07 3.10 3.22
Our company trains and develops
sales managers
Our company trains and develops
salespeople
Our company enables sales managers with
technology
2
4 neither agree not disagree
7 completely agree
5
6
1 completely disagree
3
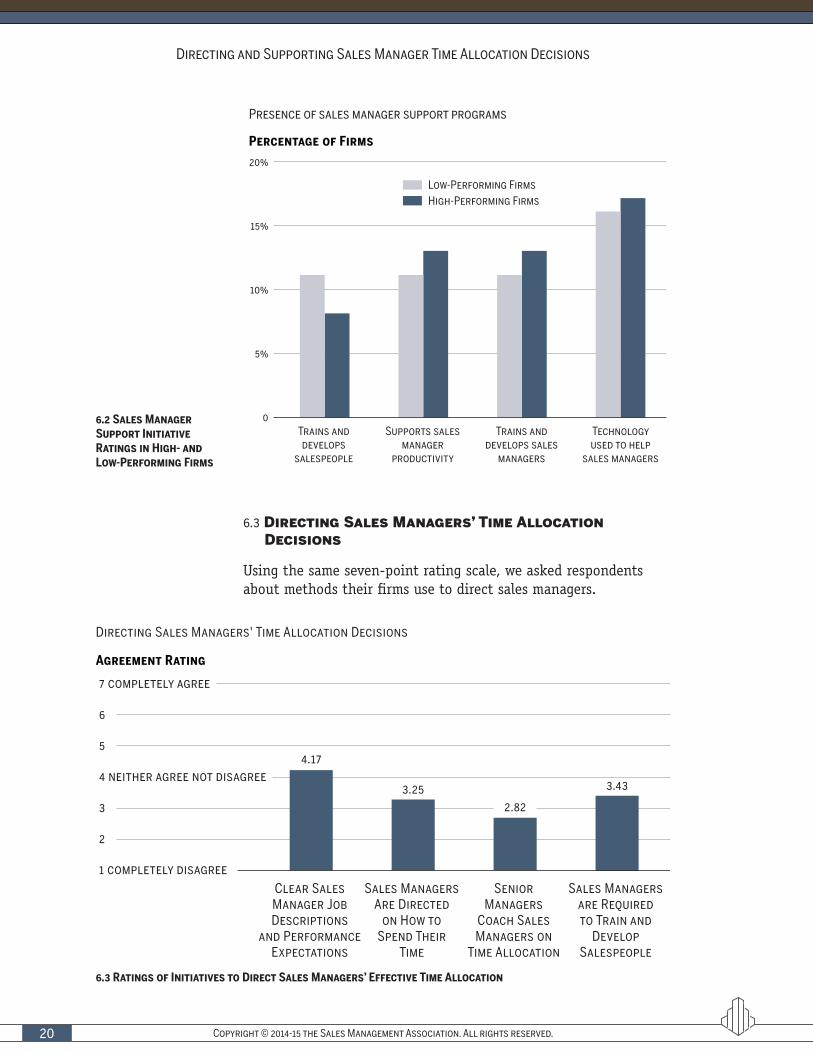
6.2 Manager Support Differences in High- and Low- Performing Firms
In three of the four categories, high-performing firms (those that met or exceeded their firm sales objective in the preceding 12 months) rated their firms’ sales manager support programs higher than did their counterparts in low-performing firms, though these differences were marginal. One category, salesperson training and development, was more prevalent in low-performing firms than high-performing firms.
6.1 Ratings of Initiatives to Support Sales Managers’ Effective Time Allocation
Copyright © 2014-15 the Sales Management Association. All rights reserved.20
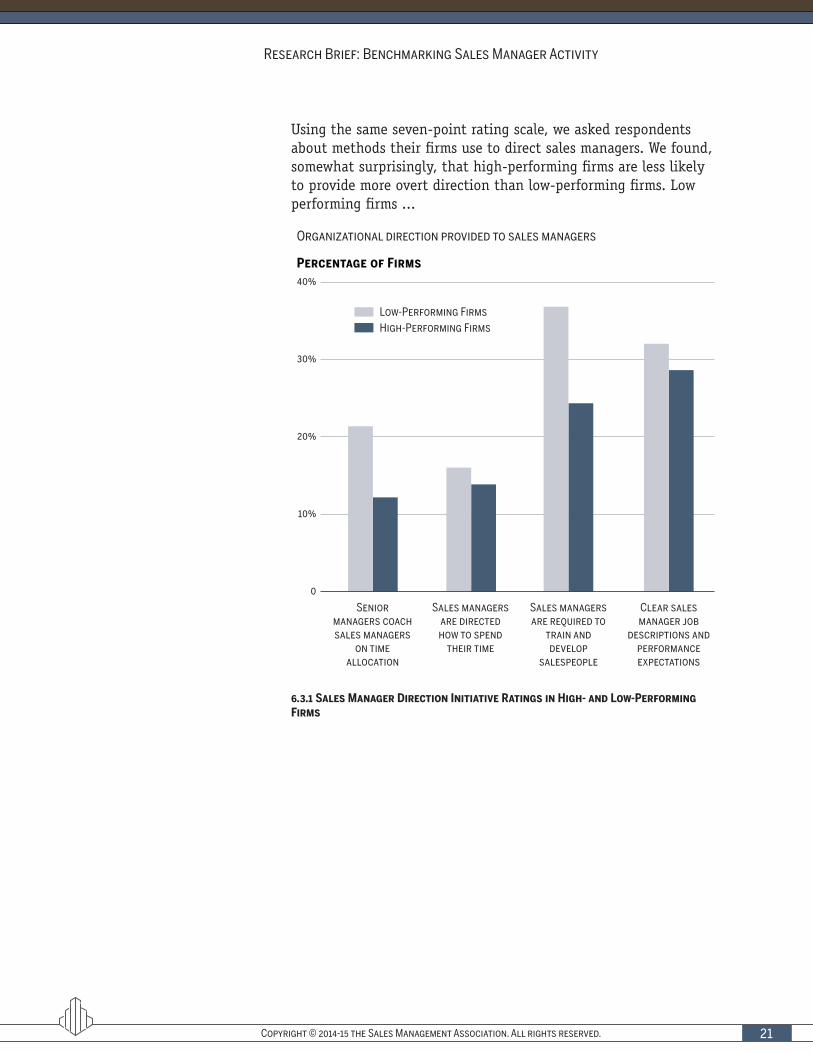
6.3 Directing Sales Managers’ Time Allocation Decisions
Using the same seven-point rating scale, we asked respondents about methods their firms use to direct sales managers.
Presence of sales manager support programs
Percentage of Firms
20%
15%
10%
5%
0
Low-Performing FirmsHigh-Performing Firms
Trains and develops
salespeople
Supports sales manager
productivity
Trains and develops sales
managers
Technology used to help
sales managers
Directing Sales Managers' Time Allocation Decisions
Agreement Rating
Clear Sales Manager Job Descriptions
and Performance Expectations
4.17
3.252.82
3.43
Sales Managers Are Directed
on How to Spend Their
Time
Senior Managers
Coach Sales Managers on
Time Allocation
Sales Managers are Required to Train and
Develop Salespeople
2
4 neither agree not disagree
7 completely agree
5
6
1 completely disagree
3
6.2 Sales Manager Support Initiative Ratings in High- and Low-Performing Firms
6.3 Ratings of Initiatives to Direct Sales Managers’ Effective Time Allocation
Directing and Supporting Sales Manager Time Allocation Decisions
Copyright © 2014-15 the Sales Management Association. All rights reserved. 21
Using the same seven-point rating scale, we asked respondents about methods their firms use to direct sales managers. We found, somewhat surprisingly, that high-performing firms are less likely to provide more overt direction than low-performing firms. Low performing firms ...
40%
30%
20%
10%
0
Low-Performing FirmsHigh-Performing Firms
Clear sales manager job
descriptions and performance expectations
Sales managers are directed how to spend
their time
Senior managers coach sales managers
on time allocation
Sales managers are required to
train and develop
salespeople
Organizational direction provided to sales managers
Percentage of Firms
6.3.1 Sales Manager Direction Initiative Ratings in High- and Low-Performing Firms
Research Brief: Benchmarking Sales Manager Activity
Copyright © 2014-15 the Sales Management Association. All rights reserved.22
Respondents’ Sales Objective Achievement
30
20
10
01 2 6 743 5
Percentage Distribution of Firms
Firm Performance
Far Below Goal Far Above GoalMet Goal
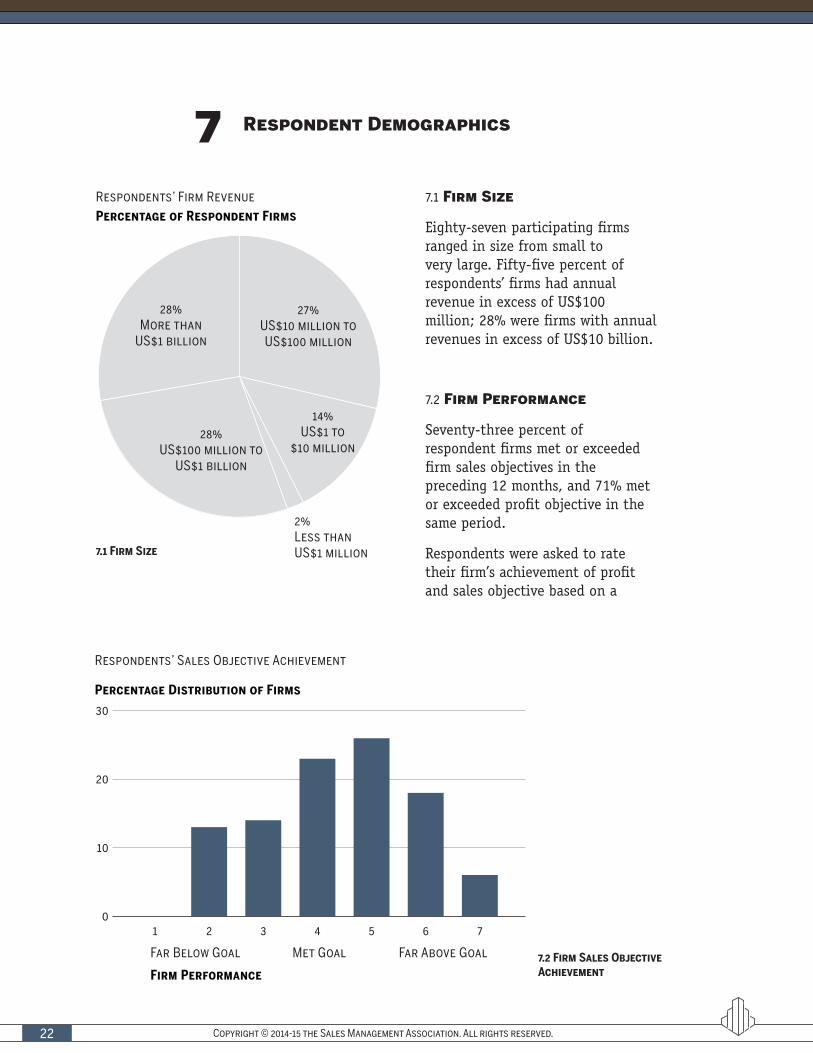
7.1 Firm Size
Eighty-seven participating firms ranged in size from small to very large. Fifty-five percent of respondents’ firms had annual revenue in excess of US$100 million; 28% were firms with annual revenues in excess of US$10 billion.
7.2 Firm Performance
Seventy-three percent of respondent firms met or exceeded firm sales objectives in the preceding 12 months, and 71% met or exceeded profit objective in the same period.
Respondents were asked to rate their firm’s achievement of profit and sales objective based on a
Respondents’ Firm Revenue
Percentage of Respondent Firms
27%US$10 million to US$100 million
28%US$100 million to
US$1 billion
28%More than
US$1 billion
14%US$1 to
$10 million
2%Less than US$1 million
Respondent Demographics7
7.1 Firm Size
7.2 Firm Sales Objective Achievement
Copyright © 2014-15 the Sales Management Association. All rights reserved. 23
Research Brief: Benchmarking Sales Manager Activity
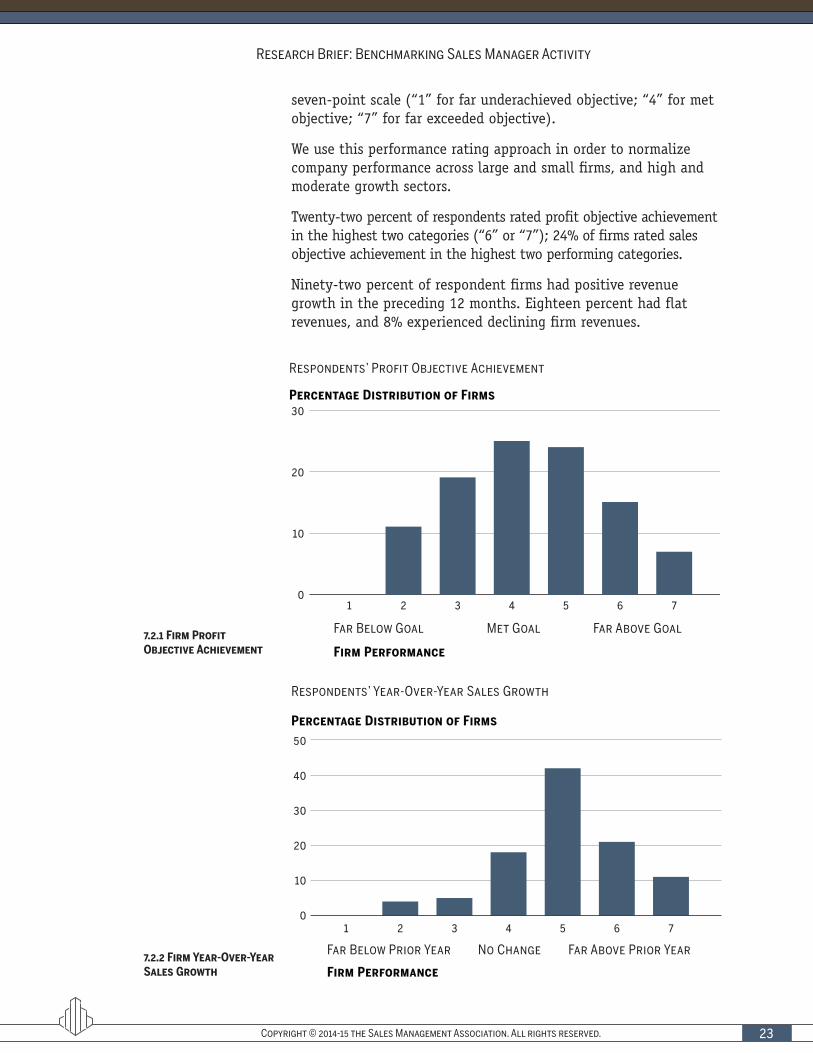
seven-point scale (“1” for far underachieved objective; “4” for met objective; “7” for far exceeded objective).
We use this performance rating approach in order to normalize company performance across large and small firms, and high and moderate growth sectors.
Twenty-two percent of respondents rated profit objective achievement in the highest two categories (“6” or “7”); 24% of firms rated sales objective achievement in the highest two performing categories.
Ninety-two percent of respondent firms had positive revenue growth in the preceding 12 months. Eighteen percent had flat revenues, and 8% experienced declining firm revenues.
Respondents’ Profit Objective Achievement
30
20
10
01 2 6 743 5
Percentage Distribution of Firms
Firm Performance
Far Below Goal Far Above GoalMet Goal
Respondents’ Year-Over-Year Sales Growth
50
40
20
30
10
01 2 6 743 5
Percentage Distribution of Firms
Firm Performance
Far Below Prior Year Far Above Prior YearNo Change
7.2.1 Firm Profit Objective Achievement
7.2.2 Firm Year-Over-Year Sales Growth
Copyright © 2014-15 the Sales Management Association. All rights reserved.24
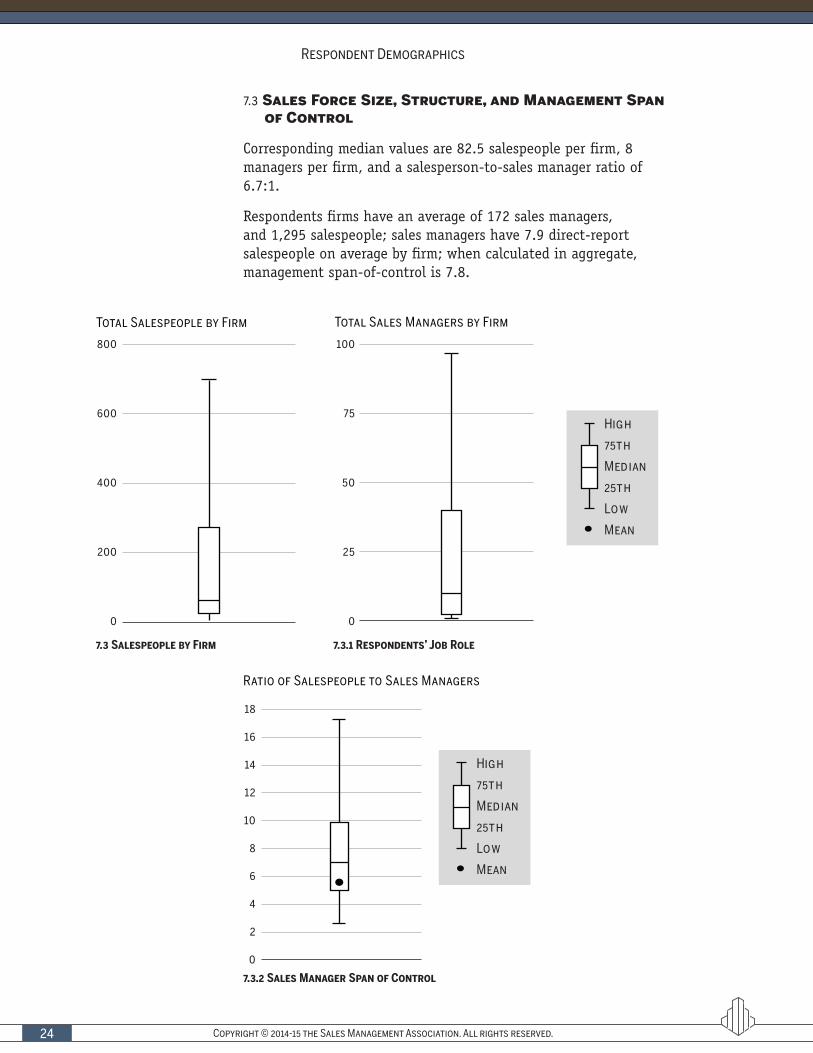
7.3 Sales Force Size, Structure, and Management Span of Control
Corresponding median values are 82.5 salespeople per firm, 8 managers per firm, and a salesperson-to-sales manager ratio of 6.7:1.
Respondents firms have an average of 172 sales managers, and 1,295 salespeople; sales managers have 7.9 direct-report salespeople on average by firm; when calculated in aggregate, management span-of-control is 7.8.
Ratio of Salespeople to Sales Managers
0
2
4
6
10
14
8
12
16
18
High
75th
25th
Median
Low
Mean
Total Sales Managers by Firm
50
25
0
75
100
High
75th
25th
Median
Low
Mean
Total Salespeople by Firm
0
200
600
400
800
7.3 Salespeople by Firm 7.3.1 Respondents’ Job Role
7.3.2 Sales Manager Span of Control
Respondent Demographics
Copyright © 2014-15 the Sales Management Association. All rights reserved. 25
Research Brief: Benchmarking Sales Manager Activity
Respondents’ Job RolePercentage of Respondents
51%Sales Manager
(SM)
26%Manages SMs
19%Sales Ops
5%Manager (non sales)
7.4 Sales Managers by Firm
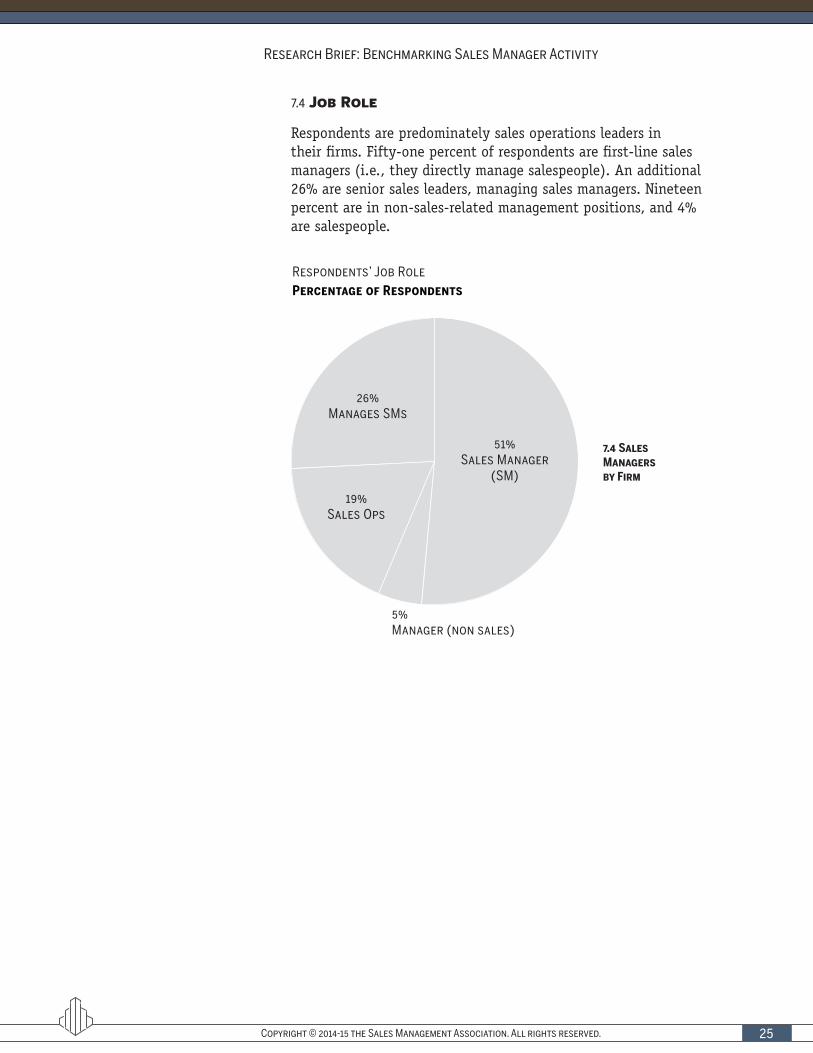
7.4 Job Role
Respondents are predominately sales operations leaders in their firms. Fifty-one percent of respondents are first-line sales managers (i.e., they directly manage salespeople). An additional 26% are senior sales leaders, managing sales managers. Nineteen percent are in non-sales-related management positions, and 4% are salespeople.