Embed Size (px)
Citation preview
Research-based Analysis of Youth in Action
Results from the surveys
with project participants and project leaders
in November 2010 and May 2011
Transnational Analysis
Helmut Fennes
with
Susanne Gadinger
Wolfgang Hagleitner
Research Project Direction:
Lynne Chisholm
Innsbruck, 2012
Research-based Analysis of Youth in Action
2 Helmut Fennes with Susanne Gadinger and Wolfgang Hagleitner
‘Youth in Action’ is a Programme of the European Union supporting European youth projects. The ‘Research-based Analysis and Monitoring of the Youth in Action Programme’ (RAY) is conducted by the RAY Network, which currently includes the Youth in Action National Agencies and their research partners in 15 countries. This study was implemented by the Institute of Educational Science at the University of Innsbruck and the Generation and Educational Science Institute in Austria in cooperation with the National Agencies and their research partners in Austria, Bulgaria, the Czech Republic, Estonia, Finland, Germany, Hungary, Liechtenstein, the Netherlands, Poland, the Slovak Republic and Sweden (the Flemish speaking community of Belgium, Luxembourg and Turkey joined the RAY network after the surveys for this study were conducted). National research reports can be requested from the respective National Agencies and their research partners (see Appendix D – Research project partners). The study was funded with contributions from the National Agencies in the respective 12 countries. This report reflects the views only of its authors, and the European Commission cannot be held responsible for any use which may be made of the information contained therein.
CC BY-NC-SA 3.0 by Lynne Chisholm, Helmut Fennes, Susanne Gadinger, Wolfgang Hagleitner This work is licensed under the Creative Commons Attribution-NonCommercial-ShareAlike 3.0 United States License. To view a copy of this licence, visit http://creativecommons.org/licenses/by-nc-sa/3.0/us/ or send a letter to Creative Commons, 444 Castro Street, Suite 900, Mountain View, California, 94041, USA. Version 20120905 ISBN 978-3-902863-02-7
Transnational Analysis 2011
Helmut Fennes with Susanne Gadinger and Wolfgang Hagleitner 3
Contents
Abbreviations ................................................................................................................................................ 5
List of tables .................................................................................................................................................. 7
List of figures .............................................................................................................................................. 12
1 Executive summary ................................................................................................................................. 13
2 Introduction ............................................................................................................................................. 17
2.1 The RAY Network .......................................................................................................................... 17
2.2 Research approach and activities .................................................................................................. 17
2.3 Analysis of surveys in 2010/11...................................................................................................... 18
3 Main conclusions ..................................................................................................................................... 19
3.1 Participation and active citizenship ............................................................................................... 19
3.2 Competence development ............................................................................................................. 20
3.3 Inclusion of young people with fewer opportunities ................................................................. 22
3.4 Learning organisations .................................................................................................................... 23
3.5 Profile of project leaders ................................................................................................................ 25
3.6 Youth in Action networks and trajectories .................................................................................. 26
3.7 Educational and professional pathways ....................................................................................... 27
3.8 Political participation ...................................................................................................................... 27
3.9 Differentiation of data analysis ...................................................................................................... 28
4 Methodology ............................................................................................................................................ 36
4.1 Implementation of the survey ....................................................................................................... 36
4.2 Samples ............................................................................................................................................. 39
4.3 Limitations of the survey ................................................................................................................ 42
4.4 Presentation of results .................................................................................................................... 44
5 Respondent profiles ................................................................................................................................ 45
5.1 Project participants .......................................................................................................................... 45
5.2 Project leaders and project team members .................................................................................. 53
5.3 Beneficiaries and project partners ................................................................................................. 58
6 Implementation of Youth in Action .................................................................................................... 60
6.1 Becoming involved in Youth in Action ....................................................................................... 60
6.2 Financing the project ...................................................................................................................... 61
6.3 Application, administration and reporting ................................................................................... 62
6.4 Youthpass ......................................................................................................................................... 63
6.5 Structured Dialogue ........................................................................................................................ 64
Research-based Analysis of Youth in Action
4 Helmut Fennes with Susanne Gadinger and Wolfgang Hagleitner
7 Project development and implementation .......................................................................................... 66
7.1 Previous applications ...................................................................................................................... 66
7.2 Preparation of the project .............................................................................................................. 66
7.3 Project languages ............................................................................................................................. 67
7.4 Satisfaction with Youth in Action ................................................................................................. 67
8 Effects of Youth in Action projects ..................................................................................................... 68
8.1 Competence development of participants ................................................................................... 68
8.2 Effects with respect to objectives and priorities of Youth in Action ...................................... 72
8.3 Other effects on participants ......................................................................................................... 77
8.4 Effects on project leaders/team members .................................................................................. 80
8.5 Effects on organisations and local environments ....................................................................... 84
9 Bibliography ............................................................................................................................................. 89
10 Appendix A – Documentation of the surveys and of the modification of the data sets ........... 90
11 Appendix B – Tables ............................................................................................................................ 97
11.1 Samples ........................................................................................................................................... 97
11.2 Profiles .......................................................................................................................................... 102
11.3 Implementation of Youth in Action......................................................................................... 145
11.4 Project development and implementation ............................................................................... 160
11.5 Effects of the projects ................................................................................................................ 163
11.6 Political participation .................................................................................................................. 215
12 Appendix C – Youth in Action ......................................................................................................... 217
12.1 Establishment of Youth in Action............................................................................................ 217
12.2 Programme objectives and priorities ........................................................................................ 217
12.3 Actions and sub-Actions ............................................................................................................ 218
12.4 Young people with fewer opportunities – types of obstacles ............................................. 219
12.5 Terminology ................................................................................................................................. 220
13 Appendix D – Research project partners ........................................................................................ 221
Transnational Analysis 2011
Helmut Fennes with Susanne Gadinger and Wolfgang Hagleitner 5
Abbreviations YiA Youth in Action Programme PL Project leaders/members of project teams PP Project participants RAY Research-based Analysis and Monitoring of Youth in Action. The RAY network consists
of the Youth in Action National Agencies and their research partners involved in the RAY project.
NA National Agency Type of project: YE Youth Exchanges (Action 1.1 and 3.1) YI Youth Initiatives (Action 1.2) YD Youth Democracy Projects (Action 1.3) EVS European Voluntary Service T&N Training and Networking (Action 4.3 and 3.1) TCP Training and Cooperation Plan SD Structured dialogue – meetings of young people and those responsible for youth policy
(Action 5.1) Residence country Country of residence at the beginning of the project (the country of the
partner organisation who the participant was part of) Funding country Country in which a project was funded through the respective National
Agency of YiA Venue country Country in which one or more core activities within a project – in particular
meetings of young people or of youth workers/leaders (in most cases from different countries of origin) – took place; also referred to as ‘hosting country’
RAY countries RAY network members participating in these surveys (= funding countries) Type of project (also ‘project type’) The analyses partly differentiate by ‘type of project’ according to the
categories above, combining Youth Exchanges from Action 1.1 and Action 3.1 and combining training and networking activities from Action 4.3 and Action 3.1; combining these similar types of sub-Actions (the main difference being the eligible countries) results in higher numbers of respondents in the respective categories and, thus, in more meaningful results.
Project category One question in both questionnaires differentiates by three project
categories: projects with young people (sub-)Action 1.1, 1.2, 1.3, 3.1 – Youth
Exchanges, 5.1) European Voluntary Service projects; projects with youth workers and/or youth leaders (sub-)Action
4.3, 3.1 – training and networking, TCP activities (taking place within the Training and Cooperation Plan).
This question was used as filter question in order to enable specific additional questions which are relevant for only one or two of these project categories
Research-based Analysis of Youth in Action
6 Helmut Fennes with Susanne Gadinger and Wolfgang Hagleitner
Sending This refers to PP or PL who came from a ‘sending’ partner, i.e. they went to
another country for their project Hosting This refers to PP or PL who came from a ‘hosting’ partner, i.e. they were
involved in a project taking place in their residence country Project leaders Youth workers, youth leaders, trainers or other actors who prepared and
implemented YiA projects for/with young people or youth workers/leaders, at least in an education/socio-pedagogic function, but frequently also with an organisational function; normally, in particular in the case of projects with participants from two or more different countries, these projects are prepared and implemented by project teams with two or more project leaders.
Country codes: AT Austria BG Bulgaria CZ the Czech Republic DE Germany EE Estonia FI Finland HU Hungary LI Lichtenstein NL the Netherlands PL Poland SE Sweden SK Slovakia YiA Programme countries: These are EU member states, EEA countries and EU candidate/accession countries YiA Partner countries: These are countries from South East Europe, countries from Eastern Europe and the Caucasus region and Mediterranean countries.
Transnational Analysis 2011
Helmut Fennes with Susanne Gadinger and Wolfgang Hagleitner 7
List of tables Table 1: Number of participants by country of residence (PP) ........................................................... 97 Table 2: Number of participants by project venue country (PP) ........................................................ 97 Table 3: Number of participants by funding country (PP) .................................................................. 98 Table 4: Number of participants by sending/hosting ........................................................................... 98 Table 5: Number of participants by type of project (PP) ..................................................................... 99 Table 6: Number of projects and participants (PP) .............................................................................. 99 Table 7: Number of project leaders by country of residence (PL) ..................................................... 99 Table 8: Number of project leaders by project venue country (PL) ................................................. 100 Table 9: Number of project leaders by funding country (PL) ........................................................... 100 Table 10: Number of project leaders by sending/hosting (PL) ........................................................ 100 Table 11: Number of project leaders by type of project (PL) ........................................................... 101 Table 12: Number of project leaders by (sub-) Action (PL) .............................................................. 101 Table 13: Number of participants by gender (PP) .............................................................................. 102 Table 14: Number of participants by gender and by project type (PP)............................................ 102 Table 15: Highest educational attainment – by age group (PP) ........................................................ 104 Table 16: Highest educational attainment – by project type (PP) ..................................................... 104 Table 17: Highest educational attainment – by country of residence (PP) ...................................... 105 Table 18: Highest educational attainment of the father/male legal guardian (PP) ......................... 106 Table 19: Highest educational attainment of the mother/female legal guardian (PP) ................... 106 Table 20: Highest educational attainment of the father/male legal guardian – by residence
country (PP) ..................................................................................................................................... 106 Table 21: Highest educational attainment of the mother/female legal guardian – by residence
country (PP) ..................................................................................................................................... 107 Table 22: Language mainly spoken in the participant’s family of origin (PP) ................................. 107 Table 23: Other languages spoken in the participant’s family of origin (PP) .................................. 107 Table 24: Language mainly spoken in the participant’s family of origin – by country of residence
(PP) .................................................................................................................................................... 107 Table 25: Other languages spoken in the participant’s family of origin – by country of residence
(PP) .................................................................................................................................................... 108 Table 26: First language/mother tongue of participants – by country of residence (PP) ............. 108 Table 27: Affiliation to a cultural, ethnic, religious or linguistic minority (PP) ............................... 109 Table 28: Affiliation to a cultural, ethnic, religious or linguistic minority – by country of residence
(PP) .................................................................................................................................................... 109 Table 29: Type of minority affiliation (PP)........................................................................................... 109 Table 30: Type of minority affiliation – by country of residence (PP) ............................................. 110 Table 31: Living environment of participants (PP) ............................................................................. 111 Table 32: Living environment of participants – by country of residence (PP) ............................... 111 Table 33: Occupation of participants at the time of the project (PP) .............................................. 111 Table 34: Education and training status at the time of the project (PP) .......................................... 112 Table 35: Occupation of participants at the time of the project – by age groups (PP) ................. 112 Table 36: Education and training status at the time of the project – by age groups (PP) ............. 112 Table 37: Previous travels abroad of participants (PP) ....................................................................... 113 Table 38: Previous travels abroad of participants – by country of residence (PP) ......................... 113 Table 39: Previous travels abroad of participants – by country of residence (PP) ......................... 113 Table 40: Reasons for previous travels abroad of participants (PP) ................................................. 113 Table 41: Reasons for previous travels abroad of participants – by country of residence (PP) ... 114 Table 42: Reasons for previous travels abroad of participants – by country of residence (PP) ... 115 Table 43: Previous participation in similar projects – by country of residence (PP)...................... 116 Table 44: Number of similar projects participants had taken part in (PP) ...................................... 116
Research-based Analysis of Youth in Action
8 Helmut Fennes with Susanne Gadinger and Wolfgang Hagleitner
Table 45: Number of similar projects participants had taken part in (PP) ...................................... 116 Table 46: Number of similar projects participants had taken part in (PP) ...................................... 117 Table 47: Type of similar projects participants had taken part in (PP) ............................................ 117 Table 48: Type of similar projects participants had taken part in – by country of residence (PP)
............................................................................................................................................................ 118 Table 49: ‘Compared to the way other people live in your country, do you think …’ (PP) ......... 119 Table 50: ‘Compared to the way other people live in your country, do you think …’ – by country
of residence (PP) ............................................................................................................................. 119 Table 51: ‘Compared to the way other people live in your country, do you think …’ – by project
type (PP) ........................................................................................................................................... 119 Table 52: Obstacles of participants in their access to education, work and employment, active
participation in society and politics, and mobility (PP) ............................................................. 120 Table 53: Obstacles of participants in their access to … – by project type (PP) ............................ 120 Table 54: Obstacles of participants in their access to … – by country of residence (PP) ............. 120 Table 55: Types of obstacles for participants (PP) .............................................................................. 121 Table 56: Obstacles of participants in their access to … by types of obstacles (PP) ..................... 121 Table 57: Obstacles of participants in their access to … by affiliation to a minority type (PP) ... 122 Table 58: Obstacles of participants in their access to education … by affiliation to a minority (PP)
............................................................................................................................................................ 122 Table 59: Obstacles of participants in their access to participation … by affiliation to a minority
(PP) .................................................................................................................................................... 122 Table 60: Obstacles of participants in their access to mobility … by affiliation to a minority (PP)
............................................................................................................................................................ 123 Table 61: Young people with fewer opportunities participating in the projects – by (sub-)Action
(PL) .................................................................................................................................................... 123 Table 62: Young people with fewer opportunities participating in the projects – types of obstacles
(PL) .................................................................................................................................................... 123 Table 63: Participants in T&N projects working with young people with fewer opportunities (PL)
............................................................................................................................................................ 124 Table 64: Types of obstacles for participants – by country of residence (PP) ................................ 125 Table 65: Types of obstacles for participants – by country of residence (PP) ................................ 126 Table 66: Young people with fewer opportunities participating in the projects – types of obstacles
by (sub-)Actions (PL) ..................................................................................................................... 127 Table 67: Number of project leaders by gender (PL) ......................................................................... 128 Table 68: Number of project leaders by gender and project type (PL) ............................................ 128 Table 69: Age of project leaders by project type (PL) ........................................................................ 128 Table 70: Highest educational attainment of project leaders – by project type (PL) ..................... 129 Table 71: Highest educational attainment of project leaders – by country of residence (PL) ...... 130 Table 72: Affiliation of project leaders with cultural, ethnic, religious or linguistic minorities – by
country of residence (PL) ............................................................................................................... 131 Table 73: Affiliation of project leaders with cultural, ethnic, religious or linguistic minorities (PL):
comparison with the respective affiliation of participants (PP) ............................................... 131 Table 74: Affiliation of project leaders with cultural, ethnic, religious or linguistic minorities (PL):
comparison with the respective affiliation of participants (PP) – by type of minority ......... 131 Table 75: Project leaders’ identity (national, European, regional) – by country of residence (PL)
............................................................................................................................................................ 132 Table 76: Project leaders’ professional status outside their organisations – by project type (PL) 132 Table 77: Project leaders’ professional status outside their organisations – by country of residence
(PL) .................................................................................................................................................... 133 Table 78: Education and training of project leaders at the time of the project – by project types
(PL) .................................................................................................................................................... 133
Transnational Analysis 2011
Helmut Fennes with Susanne Gadinger and Wolfgang Hagleitner 9
Table 79: Education and training of project leaders at the time of the project – by residence country (PL) ..................................................................................................................................... 134
Table 80: Project leaders’ previous involvement in EU youth programmes (PL) .......................... 134 Table 81: Project leaders’ previous involvement as project leaders in EU youth programmes (PL)
............................................................................................................................................................ 134 Table 82: Project leaders’ previous involvement as project leaders in EU youth programmes –
number of previous projects (PL) ................................................................................................. 134 Table 83: Project leaders’ previous involvement as project leaders in EU youth programmes –
number of previous projects – by project types (PL) ................................................................ 135 Table 84: Project leaders’ previous involvement as project leaders in EU youth programmes –
number of previous projects – by country of residence (PL) ................................................... 135 Table 85: Project leaders’ previous involvement as participants in EU youth programmes (PL) 136 Table 86: Project leaders’ previous involvement in EU youth programmes – by project type (PL)
............................................................................................................................................................ 137 Table 87: Project leaders’ previous involvement in EU youth programmes – by country of
residence (PL) .................................................................................................................................. 137 Table 88: Project leaders’ previous involvement as project leaders in EU youth programmes – by
project types (PL) ............................................................................................................................ 138 Table 89: Project leaders’ previous involvement as participants in EU youth programmes – by
project types (PL) ............................................................................................................................ 138 Table 90: Involvement in the project on a voluntary or employed basis – by project type (PL) . 139 Table 91: Involvement in the project on a voluntary or employed basis – by country of residence
(PL) .................................................................................................................................................... 139 Table 92: Occupation outside the project (PL) and voluntary/employed involvement in the
project (PL) ...................................................................................................................................... 139 Table 93: Project leader role/function in the project – by project type (PL) .................................. 140 Table 94: Project leader role/function in the project – by country of residence (PL) ................... 140 Table 95: Project leader involvement in the project (extent) – by project type (PL) ..................... 140 Table 96: Project leader involvement in the project (extent) – by country of residence (PL) ...... 140 Table 97: Type of organisation/group/body (PL) .............................................................................. 141 Table 98: Type of organisation/group/body – by project type (PL) ............................................... 141 Table 99: Type of organisation/group/body – by country of residence (PL) ................................ 142 Table 100: Focus of organisation/group/body (PL) .......................................................................... 142 Table 101: Focus of organisation/group/body – by project type (PL) ........................................... 143 Table 102: Focus of organisation/group/body – by country of residence (PL) ............................ 144 Table 103: Participants becoming involved in the project (PP) ........................................................ 145 Table 104: Project leaders becoming involved in Youth in Action (PL) ......................................... 145 Table 105: Participants becoming involved in the project – by type of project (PP) .................... 146 Table 106: Project leaders becoming involved in Youth in Action – by project type (PL) .......... 147 Table 107: Participants becoming involved in the project – by country of residence (PP) .......... 148 Table 108: Project leaders becoming involved in Youth in Action – by country of residence (PL)
............................................................................................................................................................ 149 Table 109: Paying participation fees (PP) ............................................................................................. 150 Table 110: Paying participation fees by country of residence (PP) ................................................... 150 Table 111: Knowledge about project funding by EU ......................................................................... 150 Table 112: Knowledge about project funding by EU – by country of residence ........................... 150 Table 113: Knowledge about project funding through Youth in Action (PP) ............................... 151 Table 114: Knowledge about project funding through Youth in Action by country of residence
(PP) .................................................................................................................................................... 151 Table 115: Application procedure and administrative project management (PL) .......................... 151
Research-based Analysis of Youth in Action
10 Helmut Fennes with Susanne Gadinger and Wolfgang Hagleitner
Table 116: Application procedure and administrative project management – by project types (PL) ............................................................................................................................................................ 152
Table 117: Application procedure and administrative project management – by funding country (PL) .................................................................................................................................................... 152
Table 118: Development and preparation of the project/1 (PL) ...................................................... 153 Table 119: Development and preparation of the project/2 (PL) ...................................................... 153 Table 120: Development and preparation of the project/2 – by project types (PL) ..................... 154 Table 121: Development and preparation of the project/2 – by funding country (PL) ............... 154 Table 122: Information of participants about Youthpass – by project type (PP) .......................... 155 Table 123: Participants having a Youthpass – by project type (PP) ................................................. 155 Table 124: Use of Youthpass in the projects – by (sub-)Action (PL) .............................................. 156 Table 125: Integration of Youthpass in the projects (PL) .................................................................. 156 Table 126: Integration of Youthpass in the projects – by (sub-)Actions (PL) ................................ 157 Table 127: Information about the ‘Structured Dialogue’ – by project type (PP) ........................... 158 Table 128: Experience with the ‘Structured Dialogue’ – by project type (PP) ................................ 158 Table 129: Information about the ‘Structured Dialogue’ – by age groups (PP) ............................. 158 Table 130: Experience with the ‘Structured Dialogue’ – by age groups (PP) ................................. 158 Table 131: Information about the ‘Structured Dialogue’ – by country of residence (PP) ............ 159 Table 132: Experience with the ‘Structured Dialogue’ – by country of residence (PP)................. 159 Table 133: Previous applications submitted for this project – by project type (PL) ...................... 160 Table 134: Previous applications submitted for this project – by funding country (PL) .............. 161 Table 135: Language(s) used in the project (PP) ................................................................................. 161 Table 136: Language(s) used in the project – only Youth Initiatives (PP)....................................... 161 Table 137: Language(s) used in the project – by sending/hosting (PP) ........................................... 162 Table 138: Satisfaction with the project (PP) ....................................................................................... 162 Table 139: Knowledge acquired by participants (PP) ......................................................................... 163 Table 140: Knowledge acquired by participants – by project types (PP) ......................................... 164 Table 141: Main Themes of the project (PL) ....................................................................................... 165 Table 142: Main Themes of the project – by project type (PL) ........................................................ 166 Table 143: Main Themes of the project (PL) compared with knowledge acquired by participants
(PP) .................................................................................................................................................... 167 Table 144: Skills development of participants (PP) ............................................................................. 168 Table 145: Skills development of participants (PP) ............................................................................. 169 Table 146: Skills development of participants as perceived by the project leaders (PL) ............... 170 Table 147: Skills development of participants by project type (PP) ................................................. 171 Table 148: Skills development of participants by project type as perceived by the project leaders
(PL) .................................................................................................................................................... 172 Table 149: Skills development of participants by sending/hosting (PP) ......................................... 173 Table 150: No significant effects observed by the project leaders – by project type (PL) ............ 173 Table 151: Skills development of participants (PP) compared with observations of project leaders
(PL) .................................................................................................................................................... 174 Table 152: Effects of the project participation on the image of the European Union (PP) ......... 176 Table 153: Effects of the project participation on the image of the European Union – by project
type (PP) ........................................................................................................................................... 176 Table 154: Effects on the image of the European Union – by country of residence (PP) ........... 177 Table 155: Effects on values and attitudes (PP) .................................................................................. 179 Table 156: Competence development of participants as perceived by the project leaders (PL) .. 180 Table 157: Competence development of participants as perceived by the project leaders – by
sending/hosting (PL) ..................................................................................................................... 181 Table 158: Competence development of project leaders (PL) .......................................................... 182 Table 159: Competence development of project leaders – by project type (PL) ........................... 183
Transnational Analysis 2011
Helmut Fennes with Susanne Gadinger and Wolfgang Hagleitner 11
Table 160: Competence development of project leaders – by sending/hosting (PL).................... 184 Table 161: Effects of the project with respect to YiA objectives and priorities (PP) .................... 185 Table 162: Effects of the project with respect to YiA objectives and priorities – by project types
(PP) .................................................................................................................................................... 186 Table 163: Effects of the project with respect to YiA objectives and priorities – by
sending/hosting (PP) ........................................................... Fehler! Textmarke nicht definiert. Table 164: Coherence of projects with the objectives and priorities of the YiA Programme (PL)
............................................................................................................................................................ 188 Table 165: Coherence of projects with the objectives and priorities of the YiA Programme (PL)
............................................................................................................................................................ 189 Table 166: Coherence of projects with the objectives and priorities of YiA – by project type (PL)
............................................................................................................................................................ 190 Table 167: Other effects on participants/1 (PP) ................................................................................. 192 Table 168: Other effects on participants/1 – by project type (PP) .................................................. 193 Table 169: Other effects on participants/1 – by sending/hosting (PP) .......................................... 193 Table 170: Other effects on participants/2 (PP) ................................................................................. 194 Table 171: Other effects on participants/2 – by project type (PP) .................................................. 194 Table 172: Other effects on participants/2 – by sending/hosting (PP) .......................................... 194 Table 173: Other effects on participants as perceived by the project leaders (PL) ........................ 195 Table 174: Other effects on participants as perceived by the project leaders – by project types
(PL) .................................................................................................................................................... 195 Table 175: Other effects on participants as perceived by the project leaders – by project types
(PL) .................................................................................................................................................... 196 Table 176: Other/further effects on participants (PP) compared with perceptions of project
leaders (PL) ...................................................................................................................................... 197 Table 177: Other effects on project leaders (PL) ................................................................................ 198 Table 178: Other effects on project leaders – by project type (PL) .................................................. 198 Table 179: Other effects on project leaders – by sending/hosting (PL) .......................................... 199 Table 180: Other effects on project leaders – by country of residence (PL) .................................. 200 Table 181: Effects on participants in T&N projects and TCP activities (PP; dependency question
– only T&N 4.3/3.1 and TCP). ..................................................................................................... 201 Table 182: Effects on personal development (PP) .............................................................................. 202 Table 183: Effects on personal development by project type (PP): ‘After participating in the
project, I have noted … (choose at most 3 answers)’ ............................................................... 203 Table 184: Effects of the project on the participant’s organisation/group/body (PP) ................. 204 Table 185: Effects of the project on the project leader’s organisation/group/body (PL) ............ 205 Table 186: Effects of the project on the project leader’s organisation/group/body – by project
type (PL) ........................................................................................................................................... 205 Table 187: Effects of the project on the project leader’s organisation/group/body – by country
of residence (PL) ............................................................................................................................. 206 Table 188: Effects of the project on the project leader’s organisation/group/body – by
sending/hosting (PL) ...................................................................................................................... 207 Table 189: Effects of the project on the organisation/group/body of the project leaders (PL) and
of the participants in T&N projects and TCP activities (PP) ................................................... 208 Table 190: No significant effects of the project on the project leader’s organisation/group/body
– by project type (PL) ..................................................................................................................... 208 Table 191: No significant effects of the project on the project leader’s organisation/group/body
– by sending/hosting (PL) ............................................................................................................. 209 Table 192: No significant effects of the project on the project leader’s organisation/group/body
– by country of residence (PL) ...................................................................................................... 209 Table 193: Effects of the project on the local environment (PL) ..................................................... 210
Research-based Analysis of Youth in Action
12 Helmut Fennes with Susanne Gadinger and Wolfgang Hagleitner
Table 194: Effects of the project on the local environment – by project types (PL)..................... 210 Table 195: Effects of the project on the local environment – by project venue country (PL)..... 211 Table 196: Effects of the project on the local environment – by sending/hosting (PL) .............. 212 Table 197: No significant effects of the project on the local environment (PL) ............................ 213 Table 198: No significant effects of the project on the local environment – by sending/hosting
(PL) .................................................................................................................................................... 213 Table 199: No significant effects of the project on the local environment – by project venue
country (PL) ..................................................................................................................................... 214 Table 200: Attitudes on political participation (PP) ............................................................................ 215 Table 201: Attitudes on political participation – by project type (PP) ............................................. 215 Table 202: Attitudes on political participation – by age group (PP) ................................................. 215 Table 203: Attitudes on political participation – by country of residence (PP) .............................. 216 Table explanations Tables include total frequencies and percentages by rows or columns. Modal values are highlighted in grey. Headings of tables indicated with ‘PP’ show results from the participant questionnaire;
headings of tables indicated with ‘PL’ show results from the project leader questionnaire.
List of figures Figure 1: Age of participants differentiated by project types (PP) .................................................... 103 Figure 2: Skills development of participants: correlation between self-assessment (PP) and
assessment by project leaders (PL) ............................................................................................... 175 Figure 3: Comparison between image of the EU (Eurobarometer 74) and improvement of the
image of the EU through YiA ....................................................................................................... 178 Figure 4: Coherence of projects with the objectives and priorities of the YiA Programme (PL) 191
Transnational Analysis 2011
Helmut Fennes with Susanne Gadinger and Wolfgang Hagleitner 13
1 Executive summary This study was implemented as part of the project ‘Research-based Analysis and Monitoring of the Youth in Action Programme’ (RAY) which aims to explore the effects of the Youth in Action Programme (YiA) of the European Union (see Appendix C – Youth in Action), in particular on young people, youth workers and youth leaders involved in the projects funded by it, but also on the organisations, groups and other bodies promoting it and on the local environments and communities where these projects take place. The RAY project aims to study these effects in general, not only with respect to the explicit intentions of the YiA Programme, therefore seeking to contribute to the generation of new knowledge about the processes and outcomes of non-formal education activities, in particular in the youth field, but at the same aiming to contribute to quality assurance and development in the implementation of the YiA Programme and to evidence-based and research-informed youth policy development. The RAY project, founded in 2008, involves National Agencies of the YiA Programme and their research partners in 15 countries (see Chapter 2). The research on the YiA Programme is based on a combination of quantitative and qualitative social research methods. As a first step, online surveys using multilingual questionnaires for young people participating in YiA projects and for youth workers/youth leaders have been developed and implemented since 2009. The initial Transnational Analysis of surveys conducted in 2009/10 was published in 2011 (see Fennes, Hagleitner & Helling, 2011). A study using qualitative research methods is being prepared and will be implemented from autumn 2012 in order to produce additional findings and provide a deeper analysis of the survey findings. The present study represents the second transnational analysis of surveys implemented within the framework of the RAY project. The surveys were conducted in November 2010 and May 2011 by National Agencies and their research partners in twelve countries: Austria, Bulgaria, the Czech Republic, Estonia, Finland, Germany, Hungary, Liechtenstein, the Netherlands, Poland, the Slovak Republic and Sweden, coordinated by the Institute of Educational Science at the University of Innsbruck in Austria. More than 14,000 project participants and 6,600 project leaders and members of project teams (referred to further on as ‘project leaders’) were invited to complete a questionnaire not only aimed at exploring the effects of the projects funded by the Youth in Action (YiA) Programme, but also at retrieving data on the development and implementation of the projects as well as the profile of the participants, project leaders and organisations involved. Around one third of the individuals invited to take part in the surveys completed the respective questionnaires (one for the participants and one for the project leaders). For this transnational analysis, only a proportion of these responses could be used in order to arrive at a coherent set of respondents (3,470 participants and 1,215 project leaders). The analysis of the data from the surveys in November 2010 and in May 2011 largely confirms the results of the surveys in 2009/10 (see Fennes et al., 2011) but also provides for some new conclusions and goes into more detail, in particular by differentiating the analysis according to various parameters such as types of projects/(sub-)Actions of Youth in Action or countries of residence of the participants and project leaders. The following main conclusions can be drawn: Participation and active citizenship The outcomes of the surveys suggest that the involvement in YiA projects contributes to the development of citizenship competences in a broad sense, in particular interpersonal, social, intercultural and foreign language competences of both participants and project leaders. This includes the development of respective skills, but also of attitudes, values and knowledge – for
Research-based Analysis of Youth in Action
14 Helmut Fennes with Susanne Gadinger and Wolfgang Hagleitner
example respect for other cultures and appreciation of cultural diversity; solidarity, tolerance and individual freedom; ‘feeling as a European’ and being interested in European topics; new knowledge about Europe, inclusion, youth and youth policies; awareness of European values and of inequality in society. The responses also indicate that involvement in the projects results in an increased participation in social and political life. The development of civic skills and competences for political participation in a more traditional way is less distinct, as is the acquisition of new knowledge on discrimination, people with a disability, gender equality and minorities. Competence development The findings also indicate that the participation in YiA projects contributes to the development of all key competences for lifelong learning. While the most distinct development is reported for interpersonal, social and intercultural competence as well as communication in a foreign language (as could be expected), a significant development is also reported for sense of entrepreneurship, civic competence, cultural awareness and expression and learning competence (learning to learn). Distinct developments can also be found for communication in the first language (mother tongue), mathematical competence and sense of initiative.1 All other competences are reported to be developed for a minority of participants. The self-assessment of participants is confirmed by the assessment by the project leaders of the participants’ competence development, showing a highly significant correlation between self-perception and external perception by the project leaders. Learning organisations A significant finding is that YiA projects also have an effect on the development of the organisations, groups and bodies involved, thus creating ‘learning organisations’. On the one hand, this is demonstrated by an overall competence development reported by the project leaders resulting from their involvement in the project – similar to the competence development observed for the project participants (see above). Beyond the development of the key competences for lifelong learning, youth workers and youth leaders also report that their youth work competences were developed, in particular with respect to non-formal education and international youth projects. This development of general and specific competences reflects ‘workplace learning’ or ‘work-related learning’ and contributes to professionalisation and organisational development – also if project leaders were involved as volunteers. On the other hand, project leaders and participating youth workers/leaders also report that their projects have had a significant effect on their organisations, groups and youth structures as such, in particular with respect to an internationalisation of the organisations and their activities, an increased promotion of participation and active citizenship in their organisations, and organisational development in general: this suggests that organisations, groups and structures involved in YiA projects are developing into ‘learning organisations’. Educational and professional pathways The results of the surveys also indicate that the involvement in YiA projects stimulated both participants and project leaders to consider or actually plan further educational activities and their 1 Some of the eight key competences defined in the European reference framework for key competences for lifelong learning were divided into sub-competences. In particular, ‘interpersonal, social, intercultural and civic competence’ was divided into three sub-competences: ‘interpersonal and social’, ‘intercultural’ and ‘civic’.
Transnational Analysis 2011
Helmut Fennes with Susanne Gadinger and Wolfgang Hagleitner 15
professional development. Furthermore, a large majority of participants and project leaders believe that their job opportunities have increased at least to some extent: together with the competence development outlined above, this reflects an effect on the professional development of the actors involved in the YiA Programme beyond the youth field and civil society, especially in view of their involvement in the work domain. This points to a significant effect complementing the social, cultural and political dimensions of the YiA Programme. Political participation Independent from their involvement in a YiA project, participants were asked about their opinions with respect to political participation. YiA participants value political participation very highly, with more than two thirds believing that it is definitely important to discuss political and social issues and to make use of their rights to have a say in political decisions affecting them directly. Around half of the participants believe that it is definitely important to be involved in European politics and to have the opportunity to come into direct contact with political actors – indicating a sense of European citizenship and an interest in interactive political participation.2 Inclusion of young people with fewer opportunities As for the profile of the young people participating in YiA projects, a divide can be observed. On the one hand, there is a group of participants who clearly belong to the anticipated target group of the YiA Programme: young people with fewer opportunities who are confronted with obstacles to their access to education, work, mobility and participation in society; the size of this group is hard to grasp because it is difficult to assess who is actually disadvantaged depending on the specific contexts. On the other hand, a considerable majority of participants are well educated, in education or training, employed or volunteering/doing an internship; they come from the majority population with respect to language and cultural/ethnic background; and many of them have already participated in similar projects. These characteristics point to a group that is not disadvantaged. Nevertheless, there is a clear interest and effort on the part of project promoters to include young people with fewer opportunities: a vast majority of the participants in training and networking projects are reported to be youth workers/leaders who work with young people with fewer opportunities. Profile of project leaders A large proportion of project leaders report a relatively high educational achievement and share a European identity. Many of them are involved in YiA projects on a voluntary basis, which indicates that they are highly motivated and thus they provide the project participants with role models for active citizenship. A large majority had previously been involved in YiA projects, and frequently in more than one. This can have positive effects with respect to the quality of the projects since they can build on an accumulated competence for project development and implementation. At the same time, this could limit the access of new organisations to the YiA Programme. A majority of project leaders report that they simultaneously had an organisational and an educational role in the projects, suggesting that there are insufficient resources available from project promoters for organising European youth projects resulting in a limitation on educational work at the expense of organisational tasks. Overall, the findings from the surveys indicate precarious employment situations of a considerable proportion of project leaders, thus confirming a high level of motivation for their activities. 2 It needs to be noted that the respondents are not representative of young people at large and that there was no control group to provide for a comparison with a representative sample.
Research-based Analysis of Youth in Action
16 Helmut Fennes with Susanne Gadinger and Wolfgang Hagleitner
Differentiated analyses by project types A differentiated analysis by project types/(sub-)Actions of YiA confirms that there are ‘all-rounders’ such as YE and T&N projects with a broad range of effects and effects which are mostly on average or above; that there are ‘specialists’ such as YD projects, SD projects and TCP activities with a few effects (considerably) above average, but otherwise relatively weak effects; and that there are project types (such as EVS and YI projects) which are somewhere in between – with partial effects (considerably) above average and partial effects (considerably) below average. The effects are mostly in line with the objectives and requirements for the different Actions, but with respect to some aspects the ‘all-rounders’ show equal or stronger effects than the ‘specialists’ for the respective aspects. Furthermore, there is no indication that the project duration has an effect on the responses on effects, e.g. that projects with a continuous engagement on a day-to-day basis (such as EVS or some YI projects) have a stronger/more effect than projects with short intensive phases (such as YE or T&N projects). A differentiated analysis by ‘hosting’/’sending’, in particular effects of projects depending on whether the project took place in the participant’s, project leader’s or organisation’s (‘hosting’) country of residence or in another country/abroad (‘sending’). This analysis illustrates that for both ‘sending’ and ‘hosting’ participants, project leaders, organisations/groups/bodies and local environments/communities there are positive effects resulting from their involvement in the project, and that the effects on the ‘hosting’ side are at least as strong as on the ‘sending’ side – possibly even stronger in many cases. A differentiated analysis by country (normally the country of residence) typically provides a very diverse and heterogeneous picture. Sometimes, patterns of differences between countries becoming EU member states in 2004 or later and countries which became EU member states before 2004 can be recognised, but to a large extent the different results are likely to be caused by different (socio-) demographic and geographic conditions, different political, economic, social and cultural conditions, differences in youth policies and youth structures, differences in youth cultures, and by differences in the access to the YiA Programme, in the promotion of YiA by the NAs, in the image attached to YiA and in the overall implementation of the YiA Programme by the respective National Agencies. Overall, it can be concluded that the funded projects contribute to the objectives of the YiA Programme and that the majority of participants and project leaders responding to the questionnaire are satisfied with the programme, although some of them are critical about the administrative requirements for receiving funding. Further research activities Another survey using slightly modified questionnaires was implemented in November 2011, now involving also Belgium (Flemish-speaking community), Luxembourg and Turkey, being accessible now in 14 languages (with French and Turkish additional to the 12 languages the survey employed thus far). In the meantime, France has also joined the RAY network and a separate survey for projects funded by the French National Agency was launched in May 2012. At the time of writing this report, a new survey specifically focussing on learning in YiA projects was developed, with an emphasis on studying which methods, settings and conditions foster learning in YiA projects. Complementary qualitative studies from autumn 2012 onwards will allow for more in-depth analysis of the processes and outcomes of projects funded by the YiA Programme.
Transnational Analysis 2011
Helmut Fennes with Susanne Gadinger and Wolfgang Hagleitner 17
2 Introduction What are the effects of the European Union (EU) Youth in Action (YiA) Programme on young people, youth workers and youth leaders involved in the projects funded by this programme? What do they learn and which competences do they develop through their participation in these projects? What are the effects on their attitudes, values and behaviour? What are the effects on youth groups, organisations, institutions, structures and communities involved in the programme? And how does the programme contribute to the achievement of the objectives and priorities of the YiA Programme, in particular to the promotion of active/democratic citizenship and participation in civil society, tolerance, solidarity and understanding between young people in different countries, the inclusion of young people with fewer opportunities and the development of quality and networking in youth work? These and other questions are addressed and studied through the Research-based Analysis of Youth in Action (RAY), implemented by the RAY Network – a network of YiA National Agencies and their research partners currently in 15 European countries. The aims and objectives of RAY are to: contribute to quality assurance and development in the implementation of the YiA
Programme; contribute to evidence-based and research-informed youth policy development; develop a better understanding about the processes and outcomes of non-formal
education activities, in particular in the youth field. 2.1 The RAY Network The RAY Network was founded on the initiative of the Austrian National Agency of the YiA Programme in order to develop joint transnational research activities related to YiA in line with the aims and objectives outlined above. A first network meeting took place in Austria in June 2008. Since then, Network meetings have taken place twice a year aimed at developing and coordinating the Network’s research activities and their implementation. Currently the RAY Network involves the National Agencies and their research partners from 15 countries: Austria, Belgium (Flemish community), Bulgaria, the Czech Republic, Estonia, Finland, France, Germany, Hungary, Liechtenstein, Luxembourg, the Netherlands3, Poland, Slovakia, Sweden and Turkey.
2.2 Research approach and activities In principle, the research on the programme and its activities envisages a combination of quantitative and qualitative social research methods and instruments: surveys with project participants, project leaders and key staff of beneficiary organisations as well as with applicant organisations that were rejected; case studies of selected projects; interviews and focus groups with different actors involved in the YiA Programme as well as with youth leaders and youth workers not participating in the programme. Based on concepts and research instruments developed by the Institute of Educational Science at the University of Innsbruck in Austria (the research partner of the Austrian National Agency of
3 The Netherlands took part in the RAY surveys until November 2011 but are not participating in the RAY activities in 2012.
Research-based Analysis of Youth in Action
18 Helmut Fennes with Susanne Gadinger and Wolfgang Hagleitner
the YiA Programme), two multilingual online questionnaires, currently in 14 languages, were developed – one for participants and one for project leaders of YiA-funded projects. Between October 2009 and November 2011, more than 50,000 participants and project leaders of YiA projects were invited to take part in RAY online surveys and more than 15,000 people completed the respective questionnaires. These ‘standard surveys’ will be continued by the RAY Network on a regular basis for the whole duration of the YiA Programme. Complementary ‘special surveys’ should focus on special issues related to the YiA Programme. For example, a special survey on non-formal learning in YiA projects – in particular on conditions, contexts, methodologies and methods fostering non-formal learning – has been developed in 2011/2012 and was implemented in May 2012. Furthermore, a joint approach and methodology for qualitative studies at national level, aimed at validating the results of the surveys and further developing the research approach and instruments, is being developed and will be implemented from autumn 2012 onwards.
2.3 Analysis of surveys in 2010/11 The present study is based on data from projects funded through twelve countries (Austria, Bulgaria, the Czech Republic, Estonia, Finland, Germany, Liechtenstein, the Netherlands, Poland, Slovakia and Sweden). The surveys, with project participants and with project leaders, were implemented in November 2010 and May 2011. Due to the multilingual nature of the questionnaires, the study is based on data from participants and project leaders from more than 50 countries participating in these projects. A more detailed description of the survey implementation can be found in Chapter 4 ‘Methodology’.
Transnational Analysis 2011
Helmut Fennes with Susanne Gadinger and Wolfgang Hagleitner 19
3 Main conclusions
3.1 Participation and active citizenship One of the main objectives of the YiA Programme is the promotion of active and democratic citizenship among young people, in particular their participation in public and political life and in civil society (see Appendix C – Youth in Action). This objective is closely linked to other objectives and priorities of the YiA Programme: the development of solidarity in order to foster social cohesion, in particular through the inclusion of young people with fewer opportunities; the promotion of respect for cultural diversity and of intercultural learning as well as standing up against racism and xenophobia; and the promotion of European citizenship, in particular by fostering young people’s awareness that they are citizens of Europe and that they engage themselves actively in European issues (see European Parliament and Council, 2006a). The results of the surveys show considerable effects of participation in YiA projects with respect to the development of competences related to citizenship: the large majority of participants indicate that they have developed respective skills, including foreign language, interpersonal, social, intercultural and entrepreneurship as well as civic skills; that they have learned something new about topics and themes related to citizenship; and that they have developed respective attitudes, values and behaviours. This is largely confirmed by the observations of the project leaders and members of project teams (referred to below as ‘project leaders’) – who also report that they themselves have developed citizenship competences. It needs to be noted that the development of ‘civic competence’ is reported by both participants and project leaders to be weaker than that of foreign language, interpersonal, social and intercultural competences. The analysis of skills development related to ‘civic competence’ indicates that in fact the more formal ‘political’ competence for formal/conventional participation (‘to discuss political topics seriously’) was less developed than the more ‘non-formal participation’ competence (‘to achieve something in the interest of the community’). Also a specific skill related to media literacy (‘to critically analyse media’) – which can also be considered to be an aspect of citizenship competence – shows relatively weak development (see Table 144, Table 145, Table 146, Table 151, Table 156). Perhaps these skills need to be fostered by other means and methods than applied in YiA projects. This issue will require further exploration in order to provide adequate recommendations for the implementation of the projects. Strong effects can also be observed with respect to attitudes and values related to active citizenship and participation. The majority of participants and project leaders indicate that their respect for other cultures and their appreciation of cultural diversity has grown (see Table 167, Table 173, Table 176); more than half of the participants indicate that through the involvement in the project, fundamental values related to active citizenship have become more important for them: solidarity, tolerance, respect for other cultures and individual freedom. On the other hand, for less than half of the participants human rights, respect for human life, democracy, peace and equality – also values relevant for active citizenship – have not become more important: this could be because these values were already ranking high for these participants, but also because they were not addressed so much in the projects (see Table 155). To be noted is the strong effect expressed with respect to ‘feeling as a European’ and being interested in European topics – a large majority of participants and project leaders indicate that this has become stronger for them (Table 167, Table 173, Table 176, Table 177).
Research-based Analysis of Youth in Action
20 Helmut Fennes with Susanne Gadinger and Wolfgang Hagleitner
Similar effects can be observed with respect to awareness, understanding and knowledge. Particularly strong effects are expressed with respect to knowledge about Europe, awareness of European values, awareness of inequality in society – in particular of people with fewer opportunities – but also increased knowledge about Europe, inclusion and youth policies. On the other hand, only a small proportion of participants acquired new knowledge on discrimination, people with a disability, gender equality and minorities – quite relevant topics related to active citizenship4 (see Table 139, Table 167). Due to the limitations of the research method applied, it is difficult to measure whether and to what extent the participants and project leaders actually changed their behaviour in line with these objectives: the period between the YiA project and the survey is too short to show sustainable effects on behaviour, and it is difficult to validate a causal relationship between the project participation and the perceived effects – this would require complementary research methods and further studies. Nevertheless, there are clear indications that the involvement in YiA projects has the intended effects at least to some degree: around 35% of the participants indicate that as a result of their involvement in the project they ‘participate in social and/or political life’ to a greater extent (which is backed by the perceptions of project leaders about the participants’ intentions); that they are more committed against discrimination, intolerance, xenophobia or racism; that they are committed to solidarity with people with fewer opportunities. Furthermore, 75% of the project leaders report that they are more strongly involved in social and/or political life as an effect of the project (see Table 161, Table 173, Table 177). Considerable effects are also reported with respect to the organisations involved5: an increased appreciation of cultural diversity, an increased promotion of participation of young people in the organisations, a more intensive involvement in European issues, and – to a smaller degree – an increased commitment to the inclusion of young people with fewer opportunities. A promotion of the participation of young people in the organisations is also reflected in the responses of participants who by and large report that they were able to contribute their ideas to the development and implementation of the project (84% ‘definitely’ or ‘to some extent’). Similar, but weaker effects than for the organisations, are reported for the local communities that were involved in the projects (see Table 184, Table 185, Table 189, Table 138, Table 193). Overall, this confirms that the funded projects are largely coherent with the objectives of the YiA Programme; this is also reported by the project leaders who observe – with respect to citizenship-related objectives – the strongest emphasis of projects on promoting respect for cultural diversity and intercultural learning and on combating racism and xenophobia. The promotion of active and European citizenship in explicit terms ranks lower, which points towards the need to better develop this aspect in the projects.
3.2 Competence development It is remarkable that the surveys with project participants as well as with project leaders indicate that the involvement in the project resulted in a development of all eight key competences for lifelong learning (see European Parliament and Council, 2006b), and that this competence development applies to both the participants and the project leaders. Interestingly, some skills and competences which are not at the core of the YiA objectives and priorities (see Appendix C – Youth in Action) – e.g. learning skills and competence (‘learning to learn’) – are more developed than skills and competences which are explicitly aimed at in YiA – e.g. civic skills and 4 It needs to be noted that these topics overlap and are all related to the issue of discrimination and/or minorities. In this respect the responses cannot be compared with broad topics such as ‘Europe’ or ‘art and culture’. 5 This question was addressed to project leaders as well as to participants in T&N/TCP activities.
Transnational Analysis 2011
Helmut Fennes with Susanne Gadinger and Wolfgang Hagleitner 21
competences. Even mathematical skills or communication in the first language are developed at least at an equal level as digital or media skills – which one might expect to be fostered much more through YiA projects. On average across all eight key competences and including media literacy (see European Parliament, 2008)6, the majority of project leaders perceive that participants have developed these competences as a result of project participation (see Table 156), thus representing an added value to the YiA Programme. The large majority of responses from both project leaders and from participants indicate that the following competences are developed in most projects: interpersonal and social competence; entrepreneurship; intercultural competence; communication in a foreign language; cultural awareness and expression; learning competence (learning to learn); and civic competence. Not so widely developed are communication in the first language/mother tongue, mathematical competence and initiative. This is confirmed by the self-perception of participants with respect to skills that represent selected indicators for the key competences as well as by the perception of the project leaders with respect to the development of these skills and the respective competences by the participants (see Table 144, Table 145, Table 151, Table 156), showing a very high/highly significant correlation between the participants’ self-assessment and the assessment by the project leaders (see Figure 2). Across all skills addressed in the questionnaire, the project leaders perceive a greater skills development of the participants than is reported by the participants themselves: on the one hand, this might be caused by wishful thinking – confirming that they had executed their project well – but on the other hand it might be that the project leaders underestimate the skills and competences of the participants. The biggest differences in this respect are on digital and media literacy skills – where the participants might even have better skills than the project leaders. The project leaders also report for themselves a development of key competences: the results show a similar pattern to the competence development of participants but with some variation, in particular with a perceived stronger development of intercultural competence and a perceived weaker development of learning competence (‘learning to learn’; see Table 158). It needs to be noted that project leaders’ responses to the competence development do not always correlate to their responses for related skills: project leaders seem to have an understanding of the key competences if they are asked about it in the official terminology which differs from the skills defined as indicators for these competences. The results outlined above provide a strong indication that participation in YiA projects contributes to the development of competences that are not only related to the objectives of the YiA Programme but which are also important for professional qualifications and careers. In this respect, participation in YiA projects can also contribute to the employability and professional career development of young people as well as of youth workers and youth leaders. It needs to be noted that these results do not allow an assessment of the degree to which the respective competences were developed and which competence level was achieved. Furthermore, the causal relationship between the participation in a YiA project and the perceived skills and competence development still needs to be confirmed. These two aspects would require further exploration. 6 Additional to the effects on the development of the eight key competences for lifelong learning, the effects on the development of media literacy were explored in the surveys.
Research-based Analysis of Youth in Action
22 Helmut Fennes with Susanne Gadinger and Wolfgang Hagleitner
3.3 Inclusion of young people with fewer opportunities One of the objectives and priorities of the YiA Programme is the promotion of social cohesion and, subsequently, the inclusion of young people with fewer opportunities in the programme. In view of this, the profile of participants has been analysed as part of this study. Overall, the survey results demonstrate that there is a divide in the profile of participants in YiA projects. A considerable majority of participants are well educated or are in education or training with the aim of finishing upper secondary education or a university degree. If they are not in education or training they are mostly employed or volunteering. A large majority are obviously part of the majority population with respect to language and cultural/ethnic background. They largely come from urban environments, they have frequently travelled abroad (80% for holidays, 50% with their class) and many participants (45%) have already participated in similar projects before (especially in EU-funded youth programmes). These characteristics point to a group that is in a favourable position and not disadvantaged (see Table 15, Table 18, Table 19, Table 26, Table 27, Table 31, Table 35, Table 34, Table 37, Table 39, Table 40, Table 43, Table 47). The finding that the majority of participants are well educated or in education and training is likely to be linked to the responses of project leaders, which confirm that three-quarters of the project leaders have completed education at post-secondary or tertiary level (see Table 70). This suggests that highly educated project leaders attract well-educated participants, participants from families with a relatively high educational level, and participants who aim at a higher level of education. Similar to the findings for formal education, in the context of non-formal education it also seems that the educational level is ‘inherited’ in a broad sense. A similar link can be found with respect to a ‘European identity’ which is shared by a large proportion of project leaders (see Table 75). On the other hand, there is a smaller group of participants who clearly belong to the anticipated target group of young people with fewer opportunities: they have a low educational level in relation to their age; they are unemployed; they are confronted with obstacles in accessing education, work, mobility or participation in society; they have difficulties paying a financial contribution/fee for their participation in the project; they have a minority/migrant background; and they believe that they are disadvantaged compared with their peers (see Table 15, Table 23, Table 27, Table 29, Table 35, Table 36, Table 49, Table 52). The latter group is difficult to assess in quantitative terms: approximately 30% of the participants indicate that they are confronted with obstacles in their access to work and employment, around 20% in their access to education; around 20% in their access to mobility and somewhat less (18%) in their access to participation in society; more than half of project leaders indicate that their projects involved young people with fewer opportunities (see Table 52, Table 61); a considerable proportion of participants (up to 28%) could potentially have a linguistic minority/migrant background (see Table 23); 10% in the age group 25 years or older are unemployed (see Table 35); around 20% of the participants who had to pay a fee for their participation in the project had difficulties paying this fee (40% of the participants did not have to pay a participation fee – thus this group might have well included disadvantaged young people; see Table 109). The difficulty in quantifying this group can be attributed to many reasons: it is difficult to assess who is disadvantaged; there are diverse parameters to be applied to measure it; it is partly based on subjective assessments; and it depends on the specific contexts, such as the country of residence.
Transnational Analysis 2011
Helmut Fennes with Susanne Gadinger and Wolfgang Hagleitner 23
This analysis needs to be considered with caution since it is possible that the group of respondents is not representative of the sample in that those who are well educated were more likely to have responded to the questionnaire; this aspect requires special attention in future surveys and studies. There are however some remarkable facets to this analysis: A migrant or a cultural/ethnic/linguistic minority background is not considered to be a
special obstacle for the mobility of young people. While it is often assumed that a migrant or minority background as such is a disadvantage, it does not seem to be the case with respect to mobility, for obvious reasons: migration implies mobility and often having to speak languages other than one’s first language/mother tongue – therefore, going to another country for a period of time (and possibly being confronted with a foreign language) is not really something new or threatening (see Table 56, Table 57, Table 60).
On the other hand, a migrant or a cultural/ethnic/linguistic minority background is reported to be a special obstacle for active participation in society and politics (see Table 59). In this respect, the YiA Programme can be considered to be an adequate instrument to foster the active participation of young people with a minority/migrant background.
Finally, there is an obvious interest among beneficiaries and youth workers/leaders in involving young people with fewer opportunities in YiA projects: a large majority of the participants in training and networking projects (two thirds) are reported to be youth workers/leaders who work with young people with fewer opportunities (see Table 63). This suggests that the respective Actions of the YiA Programme (see Appendix C – Youth in Action) are used according to their objectives and intentions.
3.4 Learning organisations One of the general objectives of the YiA Programme is to ‘contribute to developing the quality of support systems for youth activities and the capabilities of civil society organisations in the youth field’. In this respect, the results of the surveys show a significant effect on organisations, groups and structures involved in the YiA projects, in particular: an internationalisation of the activities and contacts/partnerships and thus of the organisations; youth participation and active citizenship in the practice of the organisations; and organisational development, in particular through the development of competences (attitudes, values, skills and knowledge) of youth workers and youth leaders involved in the projects, both as youth leaders and as participants in T&N/TCP activities.. These effects are confirmed by an average of 83% of the project leaders (54% ‘very true’, 29% ‘somewhat true’; 7% indicated that the project had no effect on the organisation) and by almost 70% of the participants in T&N/TCP activities; 38% ‘definitely, 31% ‘to some extent’; less than 10% indicate that the project had no effect on their work in the youth field) – the latter being lower presumably since the participants were involved in a more indirect way than project leaders. Nevertheless, the responses of both groups of multipliers in youth work – project leaders and project participants show similar patterns (see Table 181, Table 185, Table 189). The internationalisation of organisations is indicated by: (the intention to organise) more international projects; the establishment of new/further contacts in other countries and the involvement in new international partnerships/networks providing opportunities for cooperation in international youth projects; the intention to give attention to an international dimension in youth work at large; and – in line with this – a stronger involvement of the organisations in European issues in general.
Research-based Analysis of Youth in Action
24 Helmut Fennes with Susanne Gadinger and Wolfgang Hagleitner
Participation and active citizenship in the practice of the organisations is indicated by: an (intended) increased promotion of participation of young people in the organisations; an increased appreciation of cultural diversity; and – less pronounced – an increased commitment to the inclusion of young people with fewer opportunities, reflecting solidarity as a value; a better understanding of youth policy development (being less developed than the other aspects); and – as already mentioned above – a stronger involvement of the organisations in European issues. Organisational development is reported by the project leaders as an ‘increased project management competence of the organisation/group/body’ and strengthened networks with local structures (see Table 185). Organisational development is also reflected in the overall competence development indicated by project leaders and by youth workers/leaders participating in T&N projects as well as in TCP activities (see section 3.2). This includes the development of key competences in general (as defined in the European reference framework for key competences for lifelong learning), as well as specific competences such as: project management competence (for example, developing and implementing an international youth project, local networking, fundraising and quality development) and educational/youth work competences, in particular with respect to concepts and methodology for non-formal education (see Table 181). It is remarkable that a large majority (more than 80%) of youth workers participating in T&N or TCP activities report that they already applied knowledge and skills acquired during the project in their work/involvement in the youth field (see Table 181). This points towards a high level of effectiveness for their participation in T&N projects/TCP activities. In a broader sense, the local communities too can be considered to be ‘learning organisations’ as a result of projects in which they were – directly or indirectly – involved through their youth organisations/groups and the participating young people: more than 80% of the project leaders report that the local environment/community was actively involved in their project and that these projects were perceived as an enrichment to the local context. The reported effects are slightly weaker than for the organisations/groups, but despite this a majority of project leaders indicate that the communities became more aware of the concerns of young people, and that the intercultural and European dimensions of the project were appreciated. The considerably weakest effect was that on the commitment to the inclusion of young people with fewer opportunities (see Table 193). The latter can be attributed to three main reasons: the communities are already very committed to the inclusion of young people with fewer opportunities (the optimistic assumption); the importance of the inclusion of young people with fewer opportunities did not become visible for the communities through the projects (which suggests that the projects should address this issue more strongly in the communities concerned); or the communities – for whatever reasons – do not want to increase their commitment in this respect to address this issue (the pessimistic assumption). Nevertheless, the relatively strong indication of these effects reveals neither the actual change in quantitative terms with respect to the three areas outlined above (internationalisation, participation and active citizenship, and organisational development) nor the level achieved; for example, one organisation might have had its first international activity and now plans a second one, another organisation might already have had many international contacts and activities and now extends this a little – or not at all, being already over-stretched by the international activities it is running. Furthermore, it is possible that project leaders assessed the effects on their organisations (and communities) not only with respect to the project they were asked about, but (unconsciously) also included the effects of previous projects they or their organisations were involved in; as can
Transnational Analysis 2011
Helmut Fennes with Susanne Gadinger and Wolfgang Hagleitner 25
be seen from the project leaders’ profile, many of them had been project leaders in previous projects. It would require further studies to clarify these findings.
3.5 Profile of project leaders A large majority of project leaders report a high level of educational attainment: on average three-quarters of project leaders have completed education at post-secondary or tertiary level (see Table 70)7; this reflects a high degree of involvement in non-formal education of persons with a high level of formal education. These project leaders seem to attract participants – who are either well educated (formally), come from a (formally) well-educated family background or who want to achieve a high level of (formal) educational attainment – to participate in non-formal education activities. This seems to be contradictory but might also be logical: youth leaders with a high level of education are more likely to recognise the value and potential of non-formal education and to have the competences to design and integrate non-formal education/learning in their work; similarly, young people coming from a highly educated background are more likely to recognise the opportunities offered by non-formal education/learning activities – even if they are not referred to as such explicitly. Further research on this aspect is necessary to explain this phenomenon. Project leaders largely share a European identity, partly combined with a national identity (see Table 75). This can be considered as a precondition for supporting a project aimed at European citizenship, and probably also helps to attract young people to participate in such projects. The challenge for project leaders in this respect is how to attract young people who are suspicious or critical about a supra-national/European approach (or favour a purely nationalist approach). In this respect, the implementation structures need to develop measures that go beyond convincing those who are already convinced: project participants show a similar level of European identity – only slightly lower than project leaders (see Fennes et al., 2011, p. 77). Nevertheless, this high proportion of project leaders with a European identity contributes to further developing a European awareness and identity as well as an interest in European issues as indicated by the participants (see Table 161, Table 167). A large majority (70%) of project leaders report that they were involved in EU-funded youth programmes prior to the project they were being asked about, either as project leaders or as project participants or as both, and many had been involved in more than one project (see Table 80); this points to a rather large group of organisations being involved in YiA projects on a recurrent basis, assuming that the project leaders rarely move from one organisation to another and also considering that the majority of them were involved in the surveyed projects on a voluntary basis (see Table 90). This can have positive effects with respect to the quality of the projects, since they can build on previous experiences and on existing relationships and networks (a majority of projects involve partners who had cooperated before; see Table 118), but also results in a relatively small number of organisations that are new to the YiA Programme. This still has the potential to allow the projects organised by the same organisations to involve new participants without prior experience of EU-funded projects, but it should be ensured that new organisations have adequate access to the YiA Programme. This might require further analysis in order to implement adequate measures. Remarkable is the (previously mentioned) high proportion of project leaders who are involved in YiA projects on a voluntary basis (57%) and around half of the project leaders being employed full-time or part-time outside the organisation for which they are involved in the YiA project (see
7 It needs to be noted that there is a large difference between the countries of residence (see Table 71).
Research-based Analysis of Youth in Action
26 Helmut Fennes with Susanne Gadinger and Wolfgang Hagleitner
Table 76, Table 90). This points towards highly motivated project leaders who contribute to the participatory dimension of the projects. In this respect, project leaders are likely to serve as role models/active citizens for the participants. A critical finding is that a majority of project leaders report to have had both an organisational and an educational role in the projects (see Table 93). While organisational tasks cannot be totally avoided by educators, this result suggests that there are not sufficient human resources available resulting in limitations to educational work due to the organisational demands of the project. It is also possible that the available contact data of project leaders includes those with organisational roles rather than those with educational roles which may require further analysis and clarification. The analysis above needs to be considered with caution since the group of respondents might not be representative of the sample. It is possible that project leaders with a strong affinity to the YiA Programme as well as project leaders with a higher level of educational attainment were more likely to have responded to the questionnaire; this aspect equally requires further analysis.
3.6 Youth in Action networks and trajectories The analysis of the profiles of project participants, project leaders and organisations involved in the YiA Programme reveals the existence of individuals, organisations and networks who participate in YiA projects on a recurrent basis. A large majority of the project leaders and many project participants had been involved previously in EU-funded youth projects (or in similar projects), and many of them in more than one project; for example, the biographies of project leaders show multiple participation in EU-funded youth projects, both as participants and as project leaders (see Table 80). Furthermore, a large majority of projects involved partners who had cooperated previously in EU-funded youth projects, which points to self-contained networks of youth groups/organisations involved in YiA projects (see Table 118). In line with the latter, a considerable proportion of project leaders report that it is easy for them to meet the criteria and requirements for applying for funding, managing and reporting on their projects (see Table 115) – which could be a result of having previous experience with these tasks. This can be viewed positively: multiple participation indicates that the young people and the project leaders had positive experiences in their projects, which they want to repeat and extend; multiple participation of individuals, organisations and networks can contribute to building up competence in developing and implementing these projects, which should result in further quality development (see also Section 3.4). It is also understandable that project leaders and their organisations tend to cooperate with the same partners they already know – according to the motto ‘never change a winning team’ – which is less time-consuming than developing new partnerships, the latter being a burden when financial and human resources are scarce as is the case for most youth structures. However, this implies that the possibility for new groups and organisations to access the YiA Programme is limited. This is also reflected in the analysis of responses with respect to the starting point of YiA participation: most participants and project leaders become involved in YiA projects through a youth group, youth centre, youth organisation or the YiA National Agency – which is also a youth structure (see Table 103, Table 104). This implies that young people who are not involved in youth groups/centres/organisations are less likely to become involved in YiA projects. While this is partly evident since funding is primarily limited to youth structures, it also means that, for example, young people with fewer opportunities (a main target group of the YiA Programme), who are often not involved in youth structures, have restricted access to YiA projects.
Transnational Analysis 2011
Helmut Fennes with Susanne Gadinger and Wolfgang Hagleitner 27
There is a need for further study and analysis of whether and the extent to which the phenomena outlined above actually prevent new organisations and groups of young people from becoming involved in YiA projects, and if so, which are the barriers and obstacles to becoming involved in YiA projects and how they could be overcome. Further analysis is also needed as to the degree to which the respondents are representative of the total population of project leaders and participants in YiA projects, in particular whether respondents with previous involvement in EU-funded youth projects are over-represented.
3.7 Educational and professional pathways A large majority of the participants but also of the project leaders indicate that due to their involvement in a YiA project they gained a clearer idea about their further educational and professional pathways; that they are readier or intend to pursue further education or training; that they intend to develop their foreign language skills; and that they are readier or intend to work and live abroad. More than two-thirds of participants and of project leaders believe that their job opportunities have increased at least to some extent. Furthermore, a large majority of youth workers and youth leaders participating in training and networking activities express that they developed competences that are useful for their work with young people (see Table 170, Table 173, Table 177, Table 181). These results indicate that the involvement in YiA projects stimulates a process of reflecting on one’s educational and/or professional pathway and to consider or actually plan further educational activities and/or one’s professional development. While this does not demonstrate an increased employability of participants or project leaders, it indicates that they believe that their employability has increased through the project (thus having contributed to their self-confidence at least) and that they intend to take initiatives that can contribute to their employability. In view of the fact, that youth unemployment amounts to more than 20% in the European Union,8 this can be considered to be a significant effect complementing the social, cultural and political dimensions of the YiA Programme. This could also lead to further considerations to strengthen this aspect in the conceptualisation and implementation of the YiA Programme or its next generation.
3.8 Political participation In view of the ‘Structured Dialogue with Young People’, which was established as a new opportunity for meetings and discussions between young people and policy makers, the surveys in 2010/11 included a new question for participants: ‘Do you believe it is important for young people: to discuss political and social issues; to be involved in European politics; to have the opportunity to get in direct contact with political actors; to make use of their right to have a say in political decision making processes affecting them directly?’. This question was asked without any reference to potential effects from the participation in a YiA project. The responses revealed the following: The value of political participation ranks high among YiA participants: more than two thirds believe that it is ‘definitely’ important ‘to discuss political and social issues’ and ‘to make use of their right to have a say in political decision making processes affecting them directly’. Somewhat lower is the importance given to being involved in European politics – related to European
8 See http://epp.eurostat.ec.europa.eu/tgm/table.do?tab=table&init=1&language=de&pcode=teilm021&plugin=1 (accessed 2.7.2012)
Research-based Analysis of Youth in Action
28 Helmut Fennes with Susanne Gadinger and Wolfgang Hagleitner
Citizenship – and ‘to have the opportunity to get in direct contact with political actors’ – interactive political participation (around 50% ‘definitely’). But overall, a vast majority (around 85% to 95 %) of the respondents find these activities and opportunities to be important ‘to some extent’ or ‘definitely’. Less than 2% do ‘not at all’ agree with these statements: lack of interest or political apathy is not relevant among YiA participants (see Table 200).9 When differentiating the responses by project types/Actions, participants of Youth Democracy projects (Action 1.3) and of Structured Dialogue projects (Action 5.1) express the strongest agreement (sum of ‘to some extent’ and ‘definitely’ with these statements (see Table 201). This indicates that participants in projects funded within these Actions attract young people who consider (political) participation and active/democratic citizenship to be important – which is in line with the main objectives of these Actions. The differentiation of the responses by country of residence produces a rather diverse picture with Estonia, Sweden and Bulgaria giving (political) participation and active/democratic citizenship relatively high importance, and Hungary giving it significantly less importance (around 30 percentage points less). Responses from non-RAY countries are within the average (see Table 203). No specific pattern – e.g. between countries becoming EU member states before 2004 or later can be recognised: the reasons for the differences are obviously more complex and also depend on the specific political landscape of each of these countries which needs to be taken into consideration for a more refined interpretation. The differentiation of responses by age groups shows that the older participants are, the more importance they give to (political) participation and active/democratic citizenship Table 202).10 This is a signal of hope: young people do not give up on participation and citizenship when they grow up (as it is frequently claimed), but their belief in the importance of these issues increases.
3.9 Differentiation of data analysis The response data was also analysed differentiating by various characteristics of the respondents, in particular by respondents who were residents of ‘RAY countries’, thus countries which are part of
the RAY Network through which the surveyed YiA projects were funded, and respondents who were residents of ‘other countries’;
by the types of projects or (sub-)Actions in which the respondents were involved; by ‘hosting’ and ‘sending’, thus if the respondents had been involved in a project which
took place in their country of residence (‘hosting’) or if they had been involved in a project which took place in a country other than their country of residence (‘sending’);
by countries which were relevant for the respondents, normally their countries of residence, but sometimes also the funding countries – thus generally differentiating by the 12 RAY countries.11
A differentiated analysis according to these criteria is outlined later in this document. The following sub-sections provide a summary of the respective findings.
9 It needs to be noted that the group of respondents is not representative of young people of the respective age group (13 to 30 and older). Furthermore, there was no representative control group to allow for a comparison of responses – this would require further exploration. 10 The sample of the age group up to 14 years was too small as to provide for a meaningful comparison. 11 In some tables differentiating by countries, Luxembourg was not included because the number of respondents was simply too small for a meaningful comparison.
Transnational Analysis 2011
Helmut Fennes with Susanne Gadinger and Wolfgang Hagleitner 29
Differentiating between respondents from ‘RAY countries’ and from ‘other countries’ This differentiation is only partly meaningful: ‘other countries’ as residence countries include a broad spectrum of countries: EU member states which are not involved in the RAY Network; EEA countries; accession countries; and partner countries, in particular in South East Europe, in the Eastern Europe and Caucasus, and in the Mediterranean region. This combines a culturally, politically, economically and socially very heterogeneous group of countries; therefore results are difficult to interpret. For the next data analysis it is planned to also differentiate between the different regions within the group of ‘other countries’. Within the present analysis, only small differences could be found between responses for ‘RAY countries’ and from ‘other countries’, with some exceptions. There are similar profiles of participants, except that the educational level of participants from ‘other countries’ is significantly higher than that of participants from ‘RAY countries’ (see Table 17). Furthermore, the proportion of male participants from ‘other countries’ is slightly higher than that from ‘RAY countries’ (see Table 13). Participants from other countries are more likely also to have to pay a participation fee for the projects, suggesting that in these countries less funding is available for such projects. Nevertheless, for most questions to both participants and project leaders – including questions relating to the effects of the involvement in a YiA project, the difference of responses between participants from ‘RAY countries’ and from ‘other countries’ is very small, (generally not more than two percentage points). This is relevant insofar that one can assume that the responses from the RAY surveys are probably not so different from responses to surveys which would be performed with all countries involved in YiA. Differentiating by project types When differentiating by project type, one can observe a broad spectrum of participant and project leader profiles being involved in the different project types, e.g. for participants with respect to age, gender and educational attainment as well as with their perception of getting a ‘fair share’ (see Table 14, Table 16, Figure 1, Table 51, Table 53), and for project leaders with respect to gender, age, pervious experience with EU-youth programmes, type of engagement in the project (voluntary or employed), role/function (educational/organisational) as well as presence in the project (see Table 68, Table 69, Table 70, Table 83, Table 86, Table 88, Table 89, Table 90, Table 93, Table 95). The analysis of the profile of the organisations involved, the access to the YiA Programme as well as the analysis of responses to the question on the application for, administration of and reporting on the project also provides interesting insights into the reality of YiA: the different project types are quite distinct with respect to different groups of actors which are reached through a broad spectrum of channels, and with respect to different approaches taken to implement the programme in line with its objectives (see Table 98, Table 101, Table 105, Table 106, Table 116, Table 120). This diversity of groups of actors and organisations needs to be taken into consideration when addressing and involving them in the YiA Programme in a differentiated and ‘user-oriented’ or ‘target-group-oriented’ way. When differentiating the effects of YiA projects by project type, a diverse picture can be observed in that different project types (and therefore also Actions) foster the development of different skills and competences, of different attitudes and values, of different behaviours and of
Research-based Analysis of Youth in Action
30 Helmut Fennes with Susanne Gadinger and Wolfgang Hagleitner
knowledge acquisition with respect to different issues. Similarly, the effects on the organisations and local environments differ across project types. For example, YI projects contribute most strongly to knowledge acquisition on art and culture; YD projects most strongly to knowledge acquisition on media and communication; EVS most strongly to knowledge acquisition on Europe, inclusion and people living with a disability; SD projects most strongly to knowledge acquisition on youth and youth policy as well as on urban/rural development; T&N projects and TCP activities contribute strongly to knowledge acquisition on Europe and on youth and youth policies; YE projects contribute strongly to knowledge acquisition on Europe and on art and culture (see Table 140). With respect to the development of skills and competences, the following conclusions can be drawn12 (see Table 147, Table 148): YE projects foster on and above average the development of the full spectrum of key
competences, with a strong contribution to the development of foreign language and intercultural competence, and a relatively weak contribution to the development of civic competence and initiative;
YI projects contribute strongly to the development of skills which are necessary for developing and implementing a project – social competence, entrepreneurship, digital competence, media literacy, communication in the first language/mother tongue, mathematical competence and cultural awareness (the latter most likely being related to the content of the projects);
YD projects are relatively specialised and contribute strongly to the development of civic competence, but relatively little to the development of all other skills and competences;13
EVS projects indicate a divide, contributing strongly to the development of foreign language, intercultural, mathematical and learning competence as well as to initiative, but contributing very little to the development of other competences, including civic competence;
T&N projects provide an average contribution to the development of the full spectrum of key competences and skills, with strengths on developing learning competence and communication in the first language/mother tongue;
TCP activities (only self-assessment, because no TCP PL surveyed) is more specialised on learning competence (which is intended) and strong on first language and initiative/opportunities for personal and professional future, but low on most other skills, including civic; 14
SD projects are – similarly to YD projects – rather specialised and contribute strongly to the development of civic competence and communication in the first language, but relatively little to the development of all other skills and competences.
12 This analysis is based on participants’ self-assessment as well as on the perceptions of project leaders with respect to the development of 21 skills which are used as indicators for the eight key competences and media literacy. 13 It needs to be noted that the sample of participants in YD projects was relatively small, so the conclusions need to be viewed with caution. 14 It needs to be noted that the sample of participants in TCP activities was relatively small, so the conclusions need to be viewed with caution. Furthermore, this analysis was only based on TCP participants’ self-assessment since project leaders for TCP activities were not invited to participate in the survey.
Transnational Analysis 2011
Helmut Fennes with Susanne Gadinger and Wolfgang Hagleitner 31
When differentiating the effects with respect to the primary objectives and priorities of YiA by project type, the following conclusions can be drawn (see Table 162): T&N projects show the highest increases with respect to interest in European issues,
support for disadvantaged people and commitment to work against discrimination, intolerance, xenophobia or racism, and an average increase for participation in societal and/or political life;
EVS projects show a high increase for interest in European issues, but little increase for participation in societal and/or political life;
SD projects show a high increase for participation in societal and/or political life participation and support for disadvantaged people, and otherwise an average increase;
TCP activities show a high increase for interest in European issues, and otherwise an average increase;
YE projects show generally an average increase for the respective objectives and priorities, but a relatively small increase for participation in societal and/or political life;
surprisingly, YD projects show a relatively small increase for the support of disadvantaged people and for a commitment to work against discrimination, intolerance, xenophobia or racism – which are both strongly linked to democratic principles;
YI projects show a relatively small increase for interest in European issues, suggesting that it is more difficult to promote a European dimension in national/regional/local projects than in transnational/international projects.
An analysis differentiated by project type provides for interesting results with respect to a number of other aspects which are outlined in more detail later in this document: change of image of the European Union (higher improvement for YD projects; YE
projects and T&N/TCP activities with an above average improvement; lower than average improvement for YI, EVS and SD projects; see Table 153);
other effects related to YiA objectives and competence development (T&N/TCP and EVS projects show the relatively strongest other effects; the other effects of YE projects are generally at an average level, but stronger on an increased European identity and receptiveness for multi-culturality; YI, YD and SD projects show relatively small other effects; see Table 168)
effects of projects on readiness, intentions and plans with respect to educational and professional development (highest effects for EVS and T&N/TCP projects; average for YE projects; YI, SD and YD projects are below average; see Table 171);
effects on personal development (see Table 183); competence development of project leaders (strongest for YI project leaders, weakest for
YD project leaders; below average for SD projects except for social and civic competence; average for all other project types; see Table 159);
other effects on project leaders (extremely diverse between project types; YE projects with the strongest increase for European identity; T&N projects with strong effects on educational and professional development and mobility; YD projects with the strongest increase of interest in European topics, receptiveness of multi-culturality and participation in social and/or political life, but relatively weak increases on educational and professional development and mobility; YI projects with strongest effects on educational and professional development, but relatively weak effects on interest in European topics, European identity and mobility; other effects of EVS projects are around average, but weakest on participation in social and/or political life; other effects of SD projects are mostly average or below, and above average only for participation in social and/or political life; (see Table 178)
effects on the organisation/group/body of the project leader (see Table 186);
Research-based Analysis of Youth in Action
32 Helmut Fennes with Susanne Gadinger and Wolfgang Hagleitner
The following conclusions can be drawn for the effects of the different project types and (sub-) Actions: There are ‘all-rounders’ such as YE and T&N projects (the ‘classics’) with a broad range
of effects and effects which are mostly average or above; there are ‘specialists’ such as YD projects, SD projects and TCP activities with a few effects (considerably) above average, but otherwise relatively weak effects; and there are project types (EVS and YI projects which are somewhere in between – with effects partly (considerably) above average and effects (considerably) below average.
Mostly, the effects are in line with the objectives and requirements for the different (sub-)Actions, but it is remarkable that with respect to some aspects the ‘all-rounders’ show equal or stronger effects than the ‘specialists’ for the respective aspects (which should actually have the strongest effects for these).
No significant differences could be found when comparing the effects on participants in sub-Action 1.1 (Youth Exchanges) and sub-Action 3.1/Youth Exchanges. The same is the case when comparing Action 4.3 and Action 3.1/Training & Networking. This indicates that the effects on the participants are not dependent on the different regions represented in the project, but rather on the general nature of the project involving young people coming from different countries and cultures as such.
There is no indication that the project duration has an effect on the responses on effects, e.g. that projects with a continuous engagement on a day-to-day basis (such as EVS or some YI projects) have a stronger/more effect than projects with short intensive phases such as YE or T&N projects. The instruments applied thus far only indicate, if there was an effect (normally differentiated by 4-point Likert-scales) – but thus far the degree of development/change/learning (e.g. the extent to which the skills/competences were developed) could not be explored – this would require other methods and instruments than those applied in the current analysis, e.g. longitudinal studies with an assessment of competence levels before and after the project.
Differentiation by ‘hosting’ and ‘sending’ A differentiated analysis by ‘hosting’ and ‘sending’ was only performed with respect to the effect of the projects, assuming that it makes a difference for a participant or a project leader, if a project took place in the respective country of residence (before the time of project15) or in another country/abroad. One could assume that one learns more in an international youth project when going to another country than when staying in one’s own country in a project with young people from abroad. The analysis of the survey data in this respect provides for a more differentiated picture: e.g. when comparing the development of skills as perceived by the participants, a highly significant difference between ‘hosting’ and ‘sending’ participants can be observed, in that more learning takes place for ‘hosting’ participants than for ‘sending’ participants. This refers, in particular to skills related to communication in the first language/mother tongue, digital competence, social competence, civic competence, entrepreneurship and media literacy; on the other hand, some skills are better learned by ‘sending’ participants, in particular skills related to foreign language competence, intercultural competence and learning competence/learning to learn (see Table 149). This suggests that for a considerable number of projects ‘hosting’ participants are strongly involved in the preparation and implementation of the project and that this results in more ‘learning by doing’. 15 This clarification is made in view of EVS participants who might consider the project venue country as their ‘country of residence’ at the time of the project.
Transnational Analysis 2011
Helmut Fennes with Susanne Gadinger and Wolfgang Hagleitner 33
Similarly, also with respect to the competence development of project leaders, significantly more learning seems to take place on the ‘hosting’ side than on the ‘sending’ side. This refers, in particular, to communication in the first language (mother tongue), mathematical competence, digital competence, social competence, sense of initiative and entrepreneurship and media literacy. Only foreign language competence was ‘better learned’ by ‘sending’ project leaders (highly significant; see Table 160). This too suggests that the preparation and implementation of the project on the ‘hosting side’ is more demanding with respect to various competences than on the ‘sending’ side, and that also it is quite plausible that this results in more experiential learning. Significant differences between ‘sending’ and ‘hosting’ can also be observed when analysing the effects on participants with respect to the objectives and priorities of YiA (more ‘participation in societal and/or political life’ of ‘hosting’ participants; more interest in European issues and more commitment ‘to work against discrimination, intolerance, xenophobia or racism’ of ‘sending’ participants – see Table 163); the effects on participants with respect to their educational pathways (more intention ‘to
develop foreign language skills’ and ‘to go abroad to study, work, do a work placement … or live there’ of ‘sending’ participants– see Table 172);
other effects on project leaders (more self-confidence and personal orientation, more involvement in social and/or political life and greater belief in increased job chances of ‘hosting’ project leaders; greater preparedness to study, work or live abroad of ‘sending’ participants – see Table 179);
the effects on the project leader’s organisation/group/body (more project management competence development and more network development with local structures for ‘hosting’ organisations; more international projects as well as more contacts/partnerships for ‘sending’ organisations – see Table 188);
the effects on the project leader’s local environment/community (more enrichment through the project perceived by the ‘hosting’ community and more readiness to support similar project in the future perceived by the ‘hosting’ community; more commitment to the inclusion of young people with fewer opportunities by the ‘sending’ community – see Table 196).
Most of these differences between the effects on the ‘sending’ and on the ‘hosting’ side are plausible and contradict the assumption that more learning takes place when going abroad than when staying at home, but it seems that on the one hand learning primarily results from the confrontation or experience with ‘the foreign’ or ‘the different’ – wherever it takes place – and that on the other hand learning is strongly fostered by active participation in the process of preparing and implementing a project – thus by experiential learning. Since the ‘doing’ seems to be more intensive on the ‘hosting’ side – at least when it comes to preparing and implementing an international youth project, the effect on the learning on the ‘hosting’ side is significant. It can be concluded that for both ‘sending’ and ‘hosting’ participants, project leaders, organisations/groups/bodies and local environments/communities there are positive effects resulting from their involvement in the project, and that the effects on the ‘hosting’ side are at least as strong as on the ‘sending’ side – probably even stronger in many cases. Differentiating by countries A differentiated analysis was primarily prepared by country of residence; only in case of issues related to the application and funding of the project the analysis was completed by funding country.
Research-based Analysis of Youth in Action
34 Helmut Fennes with Susanne Gadinger and Wolfgang Hagleitner
This analysis provides a very diverse picture with respect to the profile of participants, in particular with respect to their and their parents’ educational attainment, the non-official languages spoken at home, their affiliations with minority groups, their travel experience, their previous experience with similar projects, the obstacles they are confronted with, their attitudes with respect to political participation, etc. (see Table 17, Table 20, Table 21, Table 24, Table 25, Table 26, Table 28, Table 30, Table 32, Table 39, Table 41, Table 43, Table 48, Table 50, Table 54, Table 64, Table 203). The analysis also provides a very diverse picture with respect to the profile of project leaders, in particular with respect to their educational attainment, their affiliation with minority groups, their previous involvement in EU-funded youth projects, their type of engagement in the project (voluntary or employed) and their role/function in the project (see Table 71, Table 72, Table 84, Table 87, Table 91, Table 94). Furthermore, there is diversity concerning the types of organisations involved in the projects, the situation regarding fees/contributions of participants for the projects, the access of project leaders to the YiA Programme and the perception of project leaders about the application and reporting procedures (see Table 99, Table 102, Table 108, Table 110, Table 117). Also when differentiating the effects on project leaders and their organisations by countries, a very diverse and heterogeneous picture appears with up to 30 percentage points difference between countries (see Table 180, Table 187). Sometimes, the differences between countries show patterns, such as differences between countries joining the EU before 2004 or later, e.g. with respect to the educational attainment of participants (‘2004+’ > ‘before 2004’)16, the travel experience of participants (‘2004+’ < ‘before 2004’), previous experience with similar/EU-funded projects (‘2004+’ < ‘before 2004’), the knowledge about or the experience with the Structured Dialogue (‘2004+’ > ‘before 2004’), the type of engagement of project leaders in the project (voluntary or employed; ‘2004+’ more voluntary project leaders than ‘before 2004’), project leaders’ perceptions about the application and reporting procedures (‘before 2004’ = more critical) – but on most occasions there are exceptions in that one or two countries do not fit into this pattern of ‘before 2004’/‘2004+’ EU member states (see Table 17, Table 38, Table 43, Table 48, Table 84, Table 87, Table 91, Table 117, Table 131). Another pattern can also be observed between socio-political-cultural country groups, e.g. with a coherence between Nordic countries and between German-speaking countries. For example, one can observe similar patterns for these country groups with respect to the function of project leaders (educational/organisational) which would point at similarities of youth structures within these country groups (see Table 94) – but the sample of countries is still too small to allow for a valid interpretation. For most comparisons between countries scarcely any well-founded explanation could be found for differences between countries of up to 20 percentage points or even more for responses to various questions: the respective differences could partly be explained by different (socio-) demographic conditions, e.g. with respect to ethnic, cultural, religious
or linguistic minorities; the distribution of the population between big cities and small villages; etc.;
by different geographic conditions (large or small countries, countries more in the centre or in the periphery of a region, etc.);
16 For practical reasons ‘2004+‘ is used for countries becoming EU member states in 2004 or later, and ‘before 2004‘ is used for countries which became EU member states before 2004.
Transnational Analysis 2011
Helmut Fennes with Susanne Gadinger and Wolfgang Hagleitner 35
by different political, economic, social and cultural conditions – e.g. countries with a more open or more restricted access to education; countries with more or less open/restrictive policies towards minorities or immigrants; countries with bigger or smaller socio-economic spread in the population; countries with more or less successful economies; countries with more or less opportunities for youth participation; countries with more or less opportunities for mobility; etc.;
by differences in youth policies and youth structures; by differences in youth cultures and the organisational cultures of youth organisations; and, of course, also by differences in the access to the YiA Programme, differences in the
promotion of the YiA by the NAs, e.g. the information channels used, differences in the image attached to YiA and differences in the overall implementation of the programme by the YiA NAs.
In this respect, a well-founded interpretation would require a deeper analysis at national level and referring to national data and statistics; an analysis referring to international/European studies with respect to the topics and
issues concerned; a transnational analysis involving experts from the countries involved.
This was not possible in the current analysis due to the limited resources required for further interpretation.
Research-based Analysis of Youth in Action
36 Helmut Fennes with Susanne Gadinger and Wolfgang Hagleitner
4 Methodology In principle, research-based analysis of YiA envisages a combination of quantitative and qualitative social research methods: standardised surveys with project participants, project leaders, and key staff of beneficiary
organisations as well as of applicant organisations that were rejected; case studies and longitudinal studies of selected projects; action research in selected projects; interviews with different actors involved in YiA projects as well as with youth leaders and
youth workers not participating in YiA; focus groups with participants, project leaders and staff of beneficiary organisations.
For the present study, only standardised surveys with project participants and project leaders were implemented. Based on concepts and research instruments developed by the Institute of Educational Science at the University of Innsbruck in Austria, two multilingual online questionnaires were developed – one for participants and one for project leaders/members of project teams of YiA-funded projects. The questionnaires mainly consisted of closed/multiple-choice questions and some supplementary open questions. Both questionnaires included a number of dependency questions, which only appeared for the respondents in the event a previous (filter) question was answered in a specific way. For example, some questions appeared only for participants or project leaders who responded that their project was funded within a specific (sub-) Action, because these questions were not relevant for other (sub-) Actions. Both questionnaires could be accessed in Bulgarian, Czech, Dutch, English, Estonian, Finnish, German, Hungarian, Polish, Russian, Slovak and Swedish.
4.1 Implementation of the survey The survey was implemented using an online survey platform (LimeService17) which offers the necessary functionalities, in particular multilingual questionnaires with an option for filter questions and dependency questions. The survey addressed participants and project leaders of projects funded by the YiA Programme through the National Agencies of the RAY Network countries: Austria, Bulgaria, the Czech Republic, Estonia, Finland, Germany, Hungary, Liechtenstein, the Netherlands, Poland, Slovakia and Sweden.18 The survey did not address projects that were funded centrally through the EACEA.19 Subsequently, the survey covered only projects supported by decentralised funding under the sub-Actions 1.1., 1.2, 1.3, 2.1, 3.1, 4.3 and 5.1 as well as activities implemented within the TCP of the National Agencies (only with project participants). Surveys took place in November 2010 and in May 2011. In principle, invitations were sent to participants and leaders/team members of projects that ended between three and nine months
17 https://www.limeservice.com/ 18 The German RAY network member participated only in the November 2010 survey; the Hungarian RAY network member participated only in the May 2011 survey. 19 Education, Audiovisual and Culture Executive Agency. See http://eacea.ec.europa.eu/index_en.php, accessed 4.6.2012.
Transnational Analysis 2011
Helmut Fennes with Susanne Gadinger and Wolfgang Hagleitner 37
before the invitation to take part in the survey.20 The minimum of three months between the project end and the survey was established in order to provide for responses after a phase of potentially strong emotions immediately after the project experience and after a period of potential reflection, thus to be able to study sustainable effects of the involvement in the project. For some RAY Network countries, projects ending more than nine months before the invitation were also included in the survey for the purpose of specific national studies. For the analysis in the present transnational study, only data of respondents of projects ending between three and twelve months before the invitation to the survey was used. Approximately 85% to 90% of all project leaders of all funded projects meeting these criteria were invited to participate in the survey. The contact data for this purpose was retrieved from YouthLink, a database used by the European Commission, the EACEA and the National Agencies for monitoring the application process and funding of the YiA Programme. For the survey with project participants, a random sample of at least 25% of the funded projects, meeting the criteria outlined above, was drawn by the National Agencies;21 all participants of the sampled projects (except those for whom no email address was available) were invited to take part in the survey.22 In general, a minimum number of 150 participants per sub-Action per year should be invited to RAY surveys in order to provide meaningful results at national level and to use those for a transnational comparison. In view of this, up to 90% of the participants of the funded projects in smaller countries (with a smaller number of funded projects) were invited to take part in the surveys; for bigger countries, participants of a smaller sample (25% and more) were invited. As for the European Voluntary Service (EVS), up to 90% of the participants were invited since their contact data is available in YouthLink. Project participants and project leaders were invited by e-mail to complete the questionnaire with respect to a specific YiA-funded project they were involved in. The following information was included in the email invitation: the project title, the project dates, the project venue country, the YiA project number (the latter only applies to project leaders) and a URL with an individual token (password). This hyperlink allowed the participants to access the online questionnaire directly. The e-mail invitations were customised according to the official language(s) of the country of residence of the respective addressee, or in English in cases where the language was not available through the survey tool. The addressees were given two weeks to complete the questionnaire. Two weeks after the initial invitation they received a reminder, which informed them that they had one more week to complete the questionnaire. Nevertheless, the questionnaire remained active (and the token/password remained valid) beyond that date until the survey was closed and the response data was exported. More than 14,000 project participants and more than 6,600 project leaders were invited to participate in these surveys23. More than 5,000 participants and more than 2,200 project leaders entered the online questionnaire, but only around 4,500 participants and 2,000 project leaders 20 The actual project date used was the end of the core activity (‘activity end’, if available, e.g. in the case of a youth exchange, a seminar, a training course, etc.) or the ‘project end’ as specified in the grant agreement (e.g. in case of youth initiatives or networking projects). In the case of EVS projects, the departure date of the volunteer was used. 21 The sampling process was predefined; the National Agencies of the funding countries were responsible for the actual drawing up of the sample. The conformity to the sample requirements was not monitored. Participant and project leader lists provided by the National Agencies of the funding countries were used for the invitation to the survey. 22 The contact data of the project participants was not fed into databases in a standardised and systematic way. This data was collected mainly through participant lists, which are generally required for YiA project reports; these lists are frequently handwritten; the required contact data needed to be entered manually by the National Agencies. 23 Actually, e-mails were sent to 16.138 participants and to 7.509 project leaders, but around 15% of the e-mails were returned (address not valid, mailbox over quota, etc.).
Research-based Analysis of Youth in Action
38 Helmut Fennes with Susanne Gadinger and Wolfgang Hagleitner
remained in the online questionnaire beyond around a quarter of the questions, resulting in a response rate of around 30 % (see Appendix A – Documentation of the surveys and of the modification of the data sets). In comparison with the surveys in 2009/10, a more rigid data-cleansing was performed (see Appendix A – Documentation of the surveys and of the modification of the data sets). In particular, for the analyses of the project leader survey, only respondents indicating that they were involved in a type of project that matched the one they were invited to refer to in their responses.24 For the analysis of participant responses, two data sets were produced for the transnational analysis: one excluding those respondents which did not identify the correct type of project they
were invited to respond to; this data set was used for a differentiation of results by project type in case the questions referred to effects of project participation (N=2,818);
one including respondents also if they did not identify the correct type of project they were invited to respond to; this data set was used for all other analyses (N=3,470); this was done in order to potentially increase the validity of results.
As a result, the following samples were used for this transnational analysis: 1,215 project leader responses (665 in 2009/10); 3,470, respectively 2,818 participant responses (1,400 in 2009/10).
This implies that the sample of project leaders was almost twice that of the previous surveys in 2009/10, and that that the sample of participants was at least twice that of the previous surveys. Overview of developments since the first series of surveys in 2009/10 Since the first series of surveys in 2009/2010 a number of developments took place: The surveys included projects funded through Youth in Action (YiA) National Agencies
in 12 countries25, thus providing for a larger group of respondents and a more representative sample of projects surveyed.
The questionnaires were available in 11 languages for the November 2010 survey and in 12 languages for the May 2011 survey (including Hungarian), thus allowing a broad group of respondents to complete the questionnaire in a language they had sufficient command of26.
The questionnaires were shortened and some questions were simplified, thus making them more user-friendly and providing for a more representative group of respondents, in particular in view of also including respondents with fewer opportunities.
A few questions related to the ‘Structured Dialogue’ between young people and persons responsible for youth policy were introduced in order to study attitudes, opinions and experiences of young people with respect to their participation in political processes.
These developments resulted in a much larger sample that could be invited to the surveys and, subsequently, in a higher
number of respondents – more than twice as many than in 2009/10; a higher response rate;
24 Since respondents might have been involved in projects similar to those they were invited to respond to, it needs to be ensured that s/he refers in her responses to a specific YiA-funded project, in particular if the analyses are differentiated by project type. This becomes also relevant, because some questions appear only, if the respondent clicks a question referring to the type of project s/he is being asked about. 25 In 2009/10 only 8 countries funding Youth in Action projects participated in the RAY surveys. 26 In 2009/10 the questionnaires were only available in 10 languages, but not all of them from the beginning of the surveys in October 2009.
Transnational Analysis 2011
Helmut Fennes with Susanne Gadinger and Wolfgang Hagleitner 39
a now reasonable number of responses of actors involved in small/new (sub-)Actions, in particular in sub-Action 1.3 (Youth Democracy projects) and in sub-Action 5.1 (‘Structured Dialogue’ – meetings of young people and those responsible for youth policy); this allows a more meaningful analysis by (sub-)Actions and types of projects, although it needs to be noted that the samples of project leaders/team members for the sub-Actions 1.3 and 5.1 are still relatively small27 (the respective samples of project participants were larger);
the responses of participants and project leaders of partners from other countries than those which funded the projects could be increased28, thus providing for a fuller analysis of funded projects; this is a major achievement of the multilateral and multilingual approach of RAY, going beyond a national-based approach which only allows to include participants and project leaders in one language, thus mostly those who were involved in a project taking place in their own country, and excluding project leaders and participants from other countries who do not have a sufficient command of the respective national language(s) and/or another common language such as English, French, German, etc.
All this provides for a more meaningful analysis of the data from the surveys in 2010/11.29
4.2 Samples A total of 3,470 participants (respectively 2,818 participants – see above) are included in the sample, of which 2,638 come from the 12 RAY countries and 832 (24%) from other countries. They were involved in altogether more than 823 projects30 (see Table 1, Table 2, Table 3, Table 4, Table 5, Table 6). The proportion of participants from the ‘hosting’ countries is considerably higher than of those from the ‘sending’ countries – presumably caused by the fact that all ‘hosting’ participants could answer the questionnaire in an official language of their country of residence, contrary to many ‘sending’ participants. Participants from RAY countries show fairly similar characteristics as those participants from other countries, with slight deviations, e.g. more female participants from RAY countries, or a higher educational attainment of participants from other countries. A total of 1,215 project leaders are included in the sample, of which 911 come from the 12 RAY countries and 304 (25%) from other countries (see Table 7, Table 8, Table 9, Table 10, Table 11, Table 12). They were involved in altogether more than 765 projects.31 In this case, the number of project leaders from ‘sending’ and ‘hosting’ countries is almost balanced (except for youth initiative projects, which by a majority are national activities) – probably because of better foreign language skills of project leaders who could answer the questionnaire also in English. The sample of project participants also included participants in activities organised by the National Agencies within the ‘Training and Cooperation Plan’ (TCP). Project leaders of TCP activities were not invited to take part in the surveys since they are generally employed by the
27 It is planned to continue these surveys until the end of the Youth in Action Programme. Therefore, the consolidated data from these surveys will allow a meaningful analysis with respect to all (sub-) Actions. 28 In the RAY surveys in 2009/2010, 67% of the responding project leaders came from applicant organisations; in the surveys 2010/2011, 53% of the respondents came from applicant organisations: this demonstrates a broader representation of the total population of actors involved in funded projects. 29 As of July 2011, the YiA National Agencies and their research partners from the Flemish community in Belgium, Luxembourg and Turkey joined the RAY network, increasing the number of RAY network countries to 15. The questionnaires are now also available in French and in Turkish – therefore in 14 languages. 30 For 100 TCP participants the project they were involved in could not be identified. 31 For 138 project leaders the project they were involved in could not be identified.
Research-based Analysis of Youth in Action
40 Helmut Fennes with Susanne Gadinger and Wolfgang Hagleitner
National Agencies and very often are involved frequently in these activities, therefore they might become irritated with multiple invitations within each survey. It needs to be mentioned, that the number of participants and project leaders from Liechtenstein is too small to provide for a meaningful comparison with other countries: the data set used for the transnational analysis 2010/11 which includes, e.g., only 2 project leaders and 6 participants who were residents of Liechtenstein at the time their project took place. A comparison might become possible after collecting the RAY data until the end of the YiA Programme. As for the sample of projects represented in the responses of project leaders, more than half of the projects are multilateral (involving four or more countries), with the highest proportion among T&N projects (96%) and YE projects (almost 70%) and the lowest percentages obviously among YI projects (85% involving only one country) and EVS projects (70% involving only two countries. As for the regions, the proportions are relatively balanced between ‘before 2004’ and ‘2004+’ EU member states, indicating that ‘2004+’ EU member states are well integrated into the YiA; accession countries as well countries from Eastern Europe and the Caucasus were represented in 18% and respectively 14% of the projects of responding project leaders. When comparing the activity types represented in the responses of the participants and of the projects leaders, a fairly similar distribution is shown, except for SD projects, where around 36% of project leaders were involved in National Youth Seminars and 64% in Transnational Youth Seminars, while 84% of the SD participants were involved in National Youth Seminars and 16% in Transnational Youth Seminars. As for the other (sub-) Actions, the following main distributions can be observed: around two thirds of the participants and project leaders of Action 1.1 projects were
involved in multilateral projects (involving four or more countries); around 30% of the participants and 20% of the project leaders were involved in bilateral projects, and the remainder in trilateral projects;
76% of the participants and 87% of the project leaders in YI projects were involved in National Youth Initiatives and the others in Transnational Youth Initiatives;
around one third of the participants and around one quarter of the project leaders of EVS projects were involved in Group EVS projects; 58% of the participants and 71% of the project leaders were involved in Individual EVS projects, and the others in projects combining Individual and Group EVS;
56% of the participants and 80% of the project leaders in Action 3.1 Youth Exchanges were involved in multilateral exchanges, all others mostly in bilateral and some in trilateral exchanges;
the majority of participants and project leaders involved in T&N projects (both in Action 3.1 and 4.3) were involved in Training Courses (more than two thirds of the participants in these project types); otherwise study visits in Action 3.1 are relatively prominent (16% of the participants, 10% of the project leaders), Partnership Building activities and Seminars in Action 4.3 (17%/13% of the participants; 19%/17% of the project leaders.
When comparing the samples of participants and of project leaders, a similar distribution across project types can be observed, but there are more European Voluntary (EVS) project leaders (19,0%) than EVS participants
(14,5%) – because for each individual EVS there are two project leaders – one ‘sending’ and one ‘hosting’;
there are relatively more participants (8,6%) than project leaders (3,2%) in Structured Dialogue projects;
Transnational Analysis 2011
Helmut Fennes with Susanne Gadinger and Wolfgang Hagleitner 41
and there are more participants (14,5%) than project leaders (11,2%) in Youth Initiative projects – evidently there are less team members in Youth Initiatives because they are rather self-organised groups, and because the majority were national Youth Initiatives (while e.g. in Youth Exchanges there is mostly one project leader per partner/country).
There is also a similar female – male ratio for the participant sample compared with the reports of project leaders on their projects. Furthermore, the activity type in Training & Networking/TCP activities correlates strongly between the participant and project leader samples – resulting in equally weighted samples in the two data sets which provide for analysing a potential correlation between the results of the analysis of the two samples, if applicable. Representativity of the samples The project participants (PP) sample represents 7.2% of the total population. Considering that the response rate was more than 30% and that at least 25% of projects should be invited this means that, on average, the sample represents approximately 8% of the total population – therefore, the sample is almost as large as intended. While some (small) countries have included much more than 25% of all projects (e.g. Estonia and Finland) in the contact data for invitations to the survey, others have included less, in particular Germany and Hungary (since they only participated in one of the two surveys), but also Austria, Bulgaria and the Netherlands. Overall there is a medium correlation of the sample by funding country and for future studies, it is intended to better meet the sampling standards. The project leaders (PL) sample represents 12.6% of the total population. Since the response rate is around 30%, the contact data of project leaders – in particular e-mail addresses – is possibly not fully entered into YouthLink from where most of the PL contact data was retrieved. PL are particularly underrepresented from Germany and Hungary (since they only participated in one of the two surveys), but also PL from the Netherlands (due to a relatively low response rate); overrepresented are PL from Estonia (where the NA produces the PL contact data lists from their own files and not from YouthLink) and PL from Austria, Bulgaria, the Czech Republic and Finland. Overall there is a medium correlation of the sample by funding country. Both samples are partially representative, whereas the PL sample is more representative than the PP sample, which presumably is partly due to the fact that the contact data was taken from YouthLink. Specificities with respect to the PL sample are: Project leaders of EVS and Training & Networking (T&N) projects are underrepresented
(probably because in these projects it is more common that the project leaders are involved in several projects within one year, thus they are invited more frequently – sometimes within one survey – and do not complete the questionnaire for each project they are invited to respond to). Project leaders from Youth Exchanges (YE), Youth Initiatives (YI) and Structured Dialogue (SD) are overrepresented – which may point to the fact that they are potentially more motivated to complete the questionnaire. Overall, there is a medium correlation by project types between the PL sample and the total population.
Research-based Analysis of Youth in Action
42 Helmut Fennes with Susanne Gadinger and Wolfgang Hagleitner
YI and EVS projects in which responding project leaders were involved are underrepresented (EVS projects for the same reason as outlined above); for YI projects it is probably due to sampling by the RAY partners32).
Specificities with respect to the PP sample are: EVS participants are overrepresented (because 80% to 90% of the participants were
invited since their contact data is easily accessible through YouthLink); YI and T&N participants are also slightly overrepresented; Youth Democracy (YD) project participants are strongly underrepresented and Structured Dialogue (SD) project participants are slightly underrepresented (probably due to sampling applied by the RAY partners). Overall, there is a low correlation by project types between the PP sample and the total population.
Female participants are significantly overrepresented in all project types (66%/34% instead of 50%/50% males and females respectively): it could be inferred that female participants are perhaps more motivated/interested in taking part in the surveys or feel more responsible in contributing to this study.
Older participants are overrepresented (participants age 18-25 to some degree; participants age 26-30 to a large degree), potentially suggesting older participants may complete the questionnaire due to higher levels of competence/education.
YI, YD and SD in which responding participants were involved in are underrepresented – probably due to sampling by the RAY partners; EVS projects are overrepresented (see reasons outlined above).
Reliability of responses The reliability of responses was assessed through a number of questions with respect to the project venue country, the country of residence, the project type/category and the activity type of T&N/TCP activities. The responses of participants showed a very high correlation with the actual data in this respect. The responses of project leaders showed a very high correlation (highly significant) with respect to the actual data on the project venue country and the country of residence, a high correlation (very significant) with respect to the actual data on the activity type in T&N projects, and a medium correlation with respect to the actual data on the project type/category. Furthermore most project leaders responded correctly to the question if their organisation was the applicant organisation. Overall, it can be assumed that the respondents answered the questions consciously, seriously and to the best of their knowledge.
4.3 Limitations of the survey Whilst the survey was improved with respect to common standards there are still possible reservations concerning the validity of the results: For the analysis of the representativeness of the sample the data for the total population was only available at ‘application level’, meaning project data from the funding application, since for many 32 National Agencies of the RAY network were requested only to invite up to 90% of projects to the RAY surveys in order to leave at least 10% of the projects for surveys organised by the European Commission. For (sub-) Actions with only a few projects per survey period this meant that RAY partners had to leave more than 10% for European Commission surveys.
Transnational Analysis 2011
Helmut Fennes with Susanne Gadinger and Wolfgang Hagleitner 43
projects surveyed the respective data at ‘report level’ was not yet available or entered for many projects – this might take several months to obtain after the end of the project. Nevertheless, it can be assumed that the differences between the ‘application level’ and the ‘report level’ are distributed fairly evenly across all countries and project types. While criteria for sampling projects and retrieving the contact data of respective participants had been established, it was not possible to monitor and ensure that these criteria were met. When comparing the sample with the total population it shows that some project types/(sub-)Actions are underrepresented and others are overrepresented, and that respondents from some countries are over-/underrepresented – probably due to deviations from sampling standards. This could be overcome by weighting the different groups of the sample accordingly – a quite complex procedure which could not be implemented because of limitations on resources but which is envisaged for the next round of surveys. Nevertheless, there is a medium correlation by country of residence, and a medium correlation by project types for project leaders. For some countries and project types, the samples are rather small or too small for a comparison by country or project type. As for project types, this concerns, in particular, Youth Democracy projects (36 project leaders, 56 participants) and Structured Dialogue projects (39 project leaders; see Table 5, Table 11). As for countries, this concerns primarily Liechtenstein (2 project leaders, 6 participants), but also some other countries with fairly small samples, in particular in the project leader data set (see Table 1, Table 7). The respective differentiations and comparisons therefore need to be considered with caution. Furthermore, the sample of respondents is partly not representative, e.g. with respect to gender and age (female participants are overrepresented, older participants are overrepresented) – probably due to differences in response behaviour. Possible differences of outcomes should be explored in the envisaged qualitative studies. Further limitations of the surveys in 2010/11 were as follows: For some projects, the contact data did not include all participants of a sampled project;
in particular, email addresses (necessary for inviting participants to take part in the survey) were missing or incomplete.
There are clearly different standards of the YiA National Agencies of entering project data into YouthLink, in particular in view of entering contact persons/project leaders of project partners; as a result, for some projects, team members from all partners were invited to participate in the survey, from others only the project leader of the beneficiary organisation was invited.
More than 30% of the responding project leaders indicate that they had primarily an organisational function in the project, which means that the basis for responding to some questions could have been limited.
Approximately 80% of the responding project leaders indicate that they were involved in the project most of the time, and another 10% indicate that they were involved more than half of the time, which leaves another 10% who might have had a limited basis for responding to the questionnaire.
Nevertheless, the quality of the data is much improved from 2009/10, on the one hand due to a much more standardised implementation, more available languages and larger sample size, on the other hand due to more funding countries taking part in the surveys.
Research-based Analysis of Youth in Action
44 Helmut Fennes with Susanne Gadinger and Wolfgang Hagleitner
Little is known about the opportunities for project participants to participate in the surveys. Eurostat data shows substantial differences between European countries with respect to (broadband) internet access and PCs, which were necessary to participate in this online survey. For example, the internet penetration is relatively high in some countries and low in others. It can be assumed that participants (and also project leaders) who could not be reached with this online survey come from economically disadvantaged backgrounds. In this case, participants coming from disadvantaged groups, in particular from countries with less developed IT and broadband internet infrastructures are under-represented in the present data. Furthermore, it is necessary to analyse how far young people with limited educational background and/or digital competence did not participate in the survey or answered only a limited number of questions. On the other hand, an online survey continues to be a method that allows coverage of a geographically widely dispersed target group with a reasonable amount of effort in terms of logistics and investment of personnel and infrastructure.
4.4 Presentation of results This report outlines the results of the online survey with a focus on the main outcomes. Percentages specified in the text are rounded to the next whole number. Appendix B – Tables includes more detailed results. Generally, the tables include total frequencies and percentages by rows or by columns. Modal values are highlighted in grey. The tables include information on the sample size (N) of project participants (PP; N=3,470) and project leaders (PL; N=1,215). These numbers differ for dependency questions as indicated in the relevant tables. Furthermore, the tables include the number of actual responses (n), which might exceed N for questions with multiple response options. Country-specific analyses are differentiated by the twelve countries of the RAY Network participating in these surveys, either as countries of residence of the participants/project leaders or as funding countries – depending on which criterion is considered to be more meaningful for a differentiation. All other countries – in general other residence countries – are normally summarised under ‘other countries’. Action-specific analyses combine some (sub-)Actions, since they are similar or comparable in terms of the structure of the projects they support; subsequently, it is assumed that their effects are comparable. In particular, the results of the following (sub-) Actions have been consolidated:
Action 1.1 (Youth Exchanges) and the Youth Exchanges in Action 3.1 that have the same funding criteria, except that Action 3.1 involves partners from countries other than EU member states, European Economic Area (EEA) countries and accession countries;
Action 4.3 (Training and Networking) and training and networking projects in Action 3.1 (analogous to combining Youth Exchanges in Action 1.1 and Action 3.1); for the purposes of analysis of data from the participant survey.
In fact, the analysis of the response data demonstrated that there are no significant differences concerning the effects on participants in (sub-) Action 1.1 (Youth Exchanges) and (sub-) Action 3.1/Youth Exchanges. The same is the case when comparing Action 4.3 and Action 3.1/Training & Networking. Therefore, the consolidation of these (sub-) Actions can be justified and provides for a better overview when comparing the outcomes with respect to different types of projects.
Transnational Analysis 2011
Helmut Fennes with Susanne Gadinger and Wolfgang Hagleitner 45
5 Respondent profiles
5.1 Project participants Gender Two thirds of the respondents are female which is in contrast to the total population of participants in which the female – male ratio is almost balanced. Therefore, female participants are overrepresented in the sample – across all project types. Since it is assumed that the sample of participants invited to the survey was mostly representative for the total population this suggests that female participants are more likely to complete the online questionnaires (see Table 14). Interestingly, only for YD projects the proportion of male participants is higher than the female proportion (taking the total population as a basis). Age Overall, female respondents are younger than male respondents, except for TCP activities. A reason could be that young women are ready for or interested in these kinds of projects – related to mobility and participation – at an earlier age than young males. On the other hand, women receive YiA training as youth leaders/workers – a main target group of TCP activities – at a higher age than male youth leaders/workers which suggest that female youth workers/leaders are disadvantaged in this respect (see Figure 1). Living environment The major proportion of respondents come from cities between 100,000 and 1 million inhabitants (30%) and almost 50% of the respondents from cities with more than 100,000 inhabitants (see Table 31). The picture is quite diverse when differentiating by origin countries: in Austria the largest proportion (38%) comes from villages with less than 3,000 inhabitants (reflecting a rural living environment); in Bulgaria and Sweden the largest proportion comes from a big city with over 1 million inhabitants (therefore primarily from the capitals); respondents from Hungary are rather balanced between different sizes of villages/towns/cities (see Table 32). This diversity could be caused by different demographic structures, but also by differences in access to broadband internet (necessary for completing the online questionnaire) – e.g. broadband internet access in Bulgaria is much less developed than in Austria.33 But it also might be attributed to different approaches and priorities of approaches to promote YiA in the different countries: this would require further exploration at national level. Educational attainment Most respondents report to have achieved the educational level they could have achieved according to their age, but the educational attainment of at least 12% of the respondents is lower – which suggests that they are young people with fewer opportunities (see Table 15). The highest educational attainment can be observed for participants of T&N and TCP activities, which is probably due to the fact that there is no age limit for these projects and that the 33 Eurostat (2009). Key figures on Europe. Retrieved from http://epp.eurostat.ec.europa.eu/cache/ITY_OFFPUB/KS-EI-10-001/EN/KS-EI-10-001-EN.PDF, accessed 20.6.2012.
Research-based Analysis of Youth in Action
46 Helmut Fennes with Susanne Gadinger and Wolfgang Hagleitner
participants are older than for other project types. The educational attainment for participants in YI, YD and SD projects is relatively high which suggests that participation and active citizenship is linked to educational attainment. Relatively high is also the educational attainment reported by EVS participants with more than 90% having completed at least upper secondary education, but a third also tertiary education (see Table 16). Participants from non-RAY countries report on average a higher educational attainment than those from RAY countries. It could be assumed that this is especially the case for participants from YiA partner countries where participation in mobility programmes such as YiA might be linked to educational attainment. Participants from ‘2004+’ EU member states report a higher educational attainment than from ‘before 2004’ EU member states, except for the Czech Republic and Slovakia, the latter showing an extremely high percentage of participants who have only completed primary education (see Table 17). These country-specific differences could be caused by different national realities but also with different approaches in promoting YiA and also would require analysis at national level. Respondents also report a relatively high parental educational level – more that 43% have parents with a university degree (with slightly more mothers than fathers possessing a university degree). On the other hand, around 10% come from families with a relatively low educational attainment (lower secondary school), and 15-20% report that their parents have completed technical school education (see Table 18, Table 19). A diverse picture appears when differentiating this by country: partly fathers are better educated than mothers, partly vice versa, with partially extreme differences between countries. There are also extreme differences between countries with respect to parents with a university degree, e.g. with Bulgaria on one end (56% of fathers and 69% of mothers possessing a university degree) and the Netherlands at the other end (13% of fathers, 11% of mothers). Interestingly, the relatively high percentage of ‘I do not know’ concerning the educational attainment of parents in Finland, suggest that the educational level of parents is not so important for the children and that education is not so much ‘inherited’ than in other countries (see Table 20, Table 21). These country-specific differences could depend on different realities concerning equal opportunities for men and women, different socio-economic structures, etc. which require confirmation through further analysis at national level. Occupation Almost 75% of respondents in the age group 18-25 and 30% in the age group older than 25 years were in education or training immediately prior to participating in their YiA project – at university or in another tertiary education or in further/continuing education – which reflects a large group of participants who are most likely aiming at a higher education level. 42% of the respondents of the age group 18 to 25 and 50% of the age group 25 years or older were in higher education (in non-RAY countries even more) – only round 10% of the respondents were NOT in education or training which reflects a large group aiming at a higher level of education, representing a group which might have fewer opportunities (see Table 33, Table 34, Table 35, Table 36). Almost 75% of the age group 18 to 25 were in education or training at the time of the project, 16% were volunteers and around 14% employed or self-employed (a maximum of two answers to this question were possible). For the age group older than 25 years there is a clear shift towards being in work: only around 30% of the respondents were in education or training and more than 60% were employed or self-employed (see Table 35).
Transnational Analysis 2011
Helmut Fennes with Susanne Gadinger and Wolfgang Hagleitner 47
6% of the participants were unemployed at the time of the project, compared to 10% in the age group 25 years or older. 13% of the age group 25 years or older also report that they were mainly volunteers at the time of the project which points to a group of persons in a precarious situation – presumably many of them youth workers and youth leaders participating in T&N projects and TCP activities (see Table 35). Minority affiliation Overall, around 11% of responding participants indicate that they belong to a cultural, ethnic, religious or linguistic minority. This represents a group which most likely also includes young people with fewer opportunities. While belonging to a cultural, ethnic, religious or linguistic minority can imply an obstacle for the access to education, employment, mobility and active participation in society and politics, this is not necessarily the case: it depends very much on the type of minority and the legal, socio-political and cultural situation in the respective country. For example, having a migrant background or a minority background in general is not considered to be a specific obstacle for the mobility of young people (see Table 57, Table 58, Table 59, Table 60). Of those who indicate that they belong to a minority the relatively largest group is that with a migration background (at least 37% of which 18% are first generation immigrants – born in another country) and at least 20% come from autochthonous/indigenous minorities (see Table 27, Table 29). The highest percentages appear among participants from Finland and Sweden (more than 20%), followed by Finland and Slovakia (around 15%); the lowest percentages appear in Poland, the Netherlands and Bulgaria (less than 7%). Country-specific differences can only be interpreted in view of the respective demographic, socio-cultural political, legal and political situations and need to be analysed accordingly. A differentiation of the type of minority by country is to be viewed with caution due to the very small samples by country (see Table 28, Table 30). A possible affiliation with a linguistic minority can also be recognised by comparing the country of residence with the first language/mother tongue (see Table 26). In the respective table one can recognise in some countries larger groups which reflect autochthonous/indigenous minorities or young people with a migrant background. More information about a possible migrant background can be obtained by analysing whether within the family of origin other languages than an official language of the country of residence are spoken: around 10% of the responding participants declare that they come from families where mainly another than the official language of the country is spoken at home (see Table 22); more than 30% come from families in which (including grandparents) also languages other than the official language of the country are spoken (Table 23). This points towards a considerable group of participants with a linguistic/ethnic/cultural minority or migrant background who could be disadvantaged depending on the context (see above). The differentiation by countries shows a very diverse picture (see Table 24, Table 25): some countries show a very small proportion of participants who come from families
speaking at home mainly other than the official language(s), although they have considerable linguistic/ethnic minorities – either indigenous/autochthonous or with a migrant background;
Research-based Analysis of Youth in Action
48 Helmut Fennes with Susanne Gadinger and Wolfgang Hagleitner
other countries show a considerable proportion of participants who come from families speaking at home mainly other than the official language(s), where this can be explained by linguistic/ethnic minorities(for example Estonia);
some countries show a small difference between participants who at home mainly speak other than the official language(s) and participants who also speak other than the official language(s) – and others where these differences are very large – e.g. for Bulgaria, Hungary and Sweden this difference is between 30% and 45%, with Sweden having the highest proportion (almost 50%) of participants from families who speak at home also languages other than the official language(s).
The differences between countries could be explained by socio-demographic differences, differences in policies related to minorities/immigrants and their languages, differences in immigration and integration policies, etc. – and of course differences in the access of linguistic/ethnic minorities to the YiA Programme which results in a rather complex set of possible reasons. In this respect, a more detailed analysis and interpretation is only possible at national level. An interesting aspect is the use of languages in national YI projects (Action 1.2): around 80% of the participants indicated that ‘there was one language which was used by all participants’; only 52% could fully participate in the project by using their first language; and almost 30% used also languages other than their first language: this points towards a strong involvement of young people from ethnic/linguistic minorities – who could be disadvantaged. Previous international mobility experience Some questions referred to previous international mobility experience by asking for the number of travels abroad and the main reasons for it. This indicator for international mobility is relative: clearly, a participant from Liechtenstein has been abroad more often than a participant from central Poland – simply for geographic reasons and in most cases also for economic reasons. Nevertheless, this indicator provides information for international mobility and could also be an indicator for participants being disadvantaged: 6% of all responding participants have never been abroad, 11 % only once, 17% only
twice, 25% three times – this points to participants with limited international mobility experience who could be disadvantaged (see Table 39);
participants from ‘before 2004’ EU member states show relatively higher (mean) international mobility (with Sweden taking the top score), but also some ‘2004+’ EU member states from Central Europe with good travel connections to neighbouring countries (see Table 38);
interesting conclusions can also be drawn from the standard deviation, indicating a broad scope between little and high international mobility, with an extremely high standard deviation for Sweden, but also for Slovakia and Finland (see Table 38);
while the most frequent reason for going abroad was holidays (more than 80%), it is interesting that almost 55% of the responding participants had gone abroad with their class at school, around 40% had already participated in a youth exchange, and around 10% each had studied abroad for a term, did a language course abroad, had done an internship abroad or had a job abroad (how far these groups of respondents overlap still needs to be analysed); this points to a considerable group with international mobility experience in formal and non-formal education contexts (see Table 40).
A differentiation of the reasons for stays abroad by country shows a diverse picture (see Table 41, Table 42): while stays abroad for holidays show a slight divide between ‘before 2004’ and ‘2004+’
Transnational Analysis 2011
Helmut Fennes with Susanne Gadinger and Wolfgang Hagleitner 49
EU member states (suggesting economic reasons and partly political reasons in the past), there are considerable differences between countries with respect to class exchanges, youth exchanges, and university studies abroad and languages courses abroad. These could explained through: different traditions with respect to these forms of international mobility, possibly also
resulting from/in different policies/funding priorities; different participant profiles for YiA projects in different countries, possibly also resulting
from different youth structures, different ways of promoting YiA or different images of YiA in different countries;
or a combination of these possible reasons. These potential explanations require a more in-depth analysis at national level. Another question concerning international mobility experience referred to previous participation in similar projects (which not necessarily included travelling abroad but largely an encounter with young people from other countries, which is an element of most types of YiA projects except for national YI projects). 45% of the responding participants had participated previously in a similar project (similar values for RAY and non-RAY countries), with the highest values for Bulgaria, the Netherlands and Sweden (50% to 60%), and the lowest values for the Czech Republic and Slovakia (around 40%); all other RAY countries are around average (see Table 43). Those who took part in similar projects did so on average between 3 and 4 times and almost half of them more than twice. Interestingly, in those countries with a high percentage for previous experience with similar projects, the average number of participation in similar projects is also relatively high (except for Austria with an average percentage for previous participation in similar projects, but a high average level of participation in similar projects) – this implies an exponentiation of multiple participation: many have already participated in a similar project, and those relatively often (see Table 44, Table 45, Table 46). Of those who previously took part in similar projects, more than 50% participated in EU Youth Programmes, representing a balance between ‘sending’ and ‘hosting’ projects. There are considerable difference between countries, in some countries participation in ‘sending’ projects being much higher than in ‘hosting’ projects, in others vice-versa, and in some countries participation in EU Youth Programmes is much more prominent than in others – for example respondents from Germany and Sweden participated much more often in similar projects not funded by the EU than participants from other countries (Table 47, Table 48). No real pattern can be recognised for the differences between countries. This points towards differences between traditions for similar projects in different countries, different (funding) opportunities for youth mobility, but also towards different approaches in implementing YiA, including different channels/structures which are used for promoting YiA. A deeper analysis would need to be undertaken at national level to explore this further. Young people with fewer opportunities The inclusion of young people with fewer opportunities is cited amongst the permanent priorities of the YiA Programme (see Appendix C – Youth in Action, section 12.2 Programme objectives and priorities). Access to the programme should be guaranteed for this target group. The YiA Programme Guide (European Commission, 2010, p. 5) defines this target group as follows:
Research-based Analysis of Youth in Action
50 Helmut Fennes with Susanne Gadinger and Wolfgang Hagleitner
“Young people with fewer opportunities are young people that are at a disadvantage compared to their peers because they face one or more of the situations and obstacles mentioned in the non-exhaustive list below. In certain contexts, these situations or obstacles prevent young people from having effective access to formal and non-formal education, trans-national mobility and participation, active citizenship, empowerment and inclusion in society at large.”
In the text above, at various points, reference was made to young people with fewer opportunities possibly being among the responding participants, in particular in the paragraphs on educational attainment, occupation, minority affiliation and previous international mobility experience, coming to conclusions such as: more than 10% of the respondents observably have the highest educational attainment
which is lower than they could have attained at their age, pointing at young people who might face obstacles because of insufficient educational achievement;
approximately 6% of the respondents are unemployed, and around 10% of those who are older than 25 years; additionally a fairly high percentage (15%) report that their main occupation is volunteering and only 63% of those older than 25 are in paid work; this points towards a considerable proportion of participants with obstacles in access to work.;
more than 10% of the respondents belong to a cultural, ethnic, religious or linguistic minority and more than 30% come from families where at home also other languages than an official language of the respective country are spoken, thus highlighting a considerable group that could face obstacles for ethnic/cultural/linguistic reasons;
6% of the respondents had never been abroad before the project, 11% only once and 17% only twice – participants who could also be disadvantaged.
A number of questions were more directly aimed at exploring if, how and to what extent young people with fewer opportunities participated in the surveyed projects. For example, one question explored, if the participants had to pay a participation fee for the project, and if yes, if it was easy for them or not to pay this fee: approximately 11% of the respondents had difficulties in paying a fee (less in RAY countries, possibly caused by socio-economic differences between programme countries and partner countries). While these responses also depend on the amounts charged, it can be assumed that these respondents also include young people facing obstacles attributed to economic reasons (see Table 109, Table 110). Another question asked participants if they thought that they received their fair share compared to the way other people live in their country: around 40% believe that they get their fair share; around 20% believe that they get more than their fair share; and around 16% of the respondents believe that they are getting somewhat less or much less than their fair share – participants who believe that they are (economically) disadvantaged. Of course these assessments reflect subjective notions and perceptions: it might well be that respondents believe that they are getting their fair share but in fact do not from an outside perspective and vice versa. When differentiating the response by project types, an interesting picture emerges: T&N, TCP, YD and SD projects rank highest for getting somewhat less or much less than their fair share, and YD participants showing the lowest percentage for getting more than their fair share. This might well be the case, but for YD and SD projects this could also be because of greater consciousness of and knowledge about the issue (leading to their participation in this project type or resulting from this participation). For T&N and TCP activities this could confirm precarious work situations of youth workers. On the other hand, EVS participants show the highest
Transnational Analysis 2011
Helmut Fennes with Susanne Gadinger and Wolfgang Hagleitner 51
percentage for getting more than their fair share, indicating that this (sub-)Action involves a relatively high proportion of participants who are well off. A comparison by country reveals a diverse picture (see Table 110): some countries show a relatively high percentage (52 to 65%) of participants perceiving
that they are getting a fair share and a relatively low percentage on perceptions for getting more or less than a fair share (Finland, the Netherlands, Sweden, Slovakia);
some countries show a relatively high percentage of participants perceiving that they are getting less than a fair share and a low percentage of participants perceiving that they are getting more than a fair share (Bulgaria, Estonia, Hungary);
some countries show a relatively low percentage of participants perceiving that they are getting less than a fair share and a high percentage of participants perceiving that they are getting more than a fair share (Austria, Germany, the Czech Republic and Poland).
This can partly be explained by socio-economic structures, partly by traditions concerning participation fees and partly by the implementation of YiA in the respective countries. One question asked participants if they experienced obstacles in their access to education, work, employment, mobility and participation in society and politics (see Table 52, Table 55): 20% of the respondents report that they are confronted with obstacles in their access to
education, work, employment, mobility and participation in society and politics; around 28% report obstacles in their access to work and employment; overall, the primary obstacles are economic (‘not having enough money’ – 56%), and – to
a smaller degree – geographical obstacles (19%), educational difficulties (18%) and social obstacles (13%).
A differentiation by project type indicates the following (see Table 53): respondents from YI projects are slightly above average for obstacles in their access to
work/employment and to mobility – the latter might be reflected in taking part in a YI project and not in YE project – but it might also be as a result, suggesting that YI projects are considered to be less valuable than YE projects;
respondents from T&N projects are considerably above average for obstacles in their access to work/employment – possibly resulting from precarious work situations in the youth field, which is not reflected in the responses from TCP participants who might come from more secure employment in the youth field;
respondents from SD projects are considerably above average for all categories, and participants from T&N and YD projects are above average for obstacles in their access to participation in society and politics, which could indicate that participants in these project types are more conscious of these obstacles – but it does not necessarily mean that they have more obstacles.
A comparison by country reveals again a diverse picture (see Table 54): partly these differences can be explained by different political, economic, social and cultural conditions – countries with open/restricted access to education; countries with more/less successful economies; countries with more/less opportunities for participation; and countries with more/less opportunities for mobility. On the other hand, this might well reflect differences in access to the YiA programme as well as in the promotion of the YiA by the NAs, in particular the channels used and the image attached to YiA. No real country-specific patterns by type of obstacle can be recognised: in all countries, at least two of the types of obstacles were mentioned by the respondents. This was above the average level, but in some countries this is the case for only a few types of obstacles, and in other
Research-based Analysis of Youth in Action
52 Helmut Fennes with Susanne Gadinger and Wolfgang Hagleitner
countries for many of them. The latter is the case for Finland and Estonia, followed by Sweden. The reasons for the differences could again be explained by a broad scope of political, economic, social and cultural conditions, e.g. some countries have only small cultural/ethnic minorities, others have greater ones; some countries have established a high level of support/integration with respect to cultural ethnic minorities, and others have not. On the other hand, the differences might also be caused by differences in the access to and promotion of the YiA projects. However, a more in-depth analysis is only possible at national level. Interesting results are the links between a declared affiliation to a cultural, ethnic, linguistic or religious minority and perceived obstacles to education, work, employment, mobility and participation in society and politics: Respondents indicating a migrant or a cultural/ethnic/linguistic minority background
report to experience fewer obstacles for their access to mobility than for their access to education, work, employment and participation – and they report only slightly more obstacles in their access to mobility than other participants. While it is often assumed that a migrant or minority background as such is a disadvantage, it does not seems to be the case with respect to mobility, for obvious reasons: migration implies mobility and often having to speak languages other than one’s first language/mother tongue – therefore, going to another country for a period of time (and possibly being confronted with a foreign language) is not really something new or threatening (see Table 56, Table 57, Table 60).
On the other hand, participants indicating a migrant or a cultural/ethnic/linguistic minority background report to experience more obstacles for active participation in society and politics than other participants (see Table 59).
In this respect, the YiA Programme can be considered to be an adequate instrument to foster the active participation of young people with a minority/migrant background. The outcomes concerning the involvement of young people with fewer opportunities in YiA projects drawn from participant responses were complemented by perceptions of project leaders: more than 50% of the project leaders (except from T&N projects who were not asked this question34) report that young people with fewer opportunities participated in their project – and almost half of them report that more than 25% of the participants were young people with fewer opportunities (see Table 61). The relatively highest percentage of project leaders of projects with young people with fewer opportunities comes from YI projects (65%) followed by SD and YE projects; the smallest percentage was reported for EVS (26%; see Table 61). Primary obstacles preventing participants from obtaining access to education, mobility, participation, active citizenship, empowerment and inclusion in society at large are reported to be economic and social obstacles across all project types (see Table 62). The responses of project leaders lead to the assumption that they have a different notion about young people with fewer opportunities from their own and from other participating countries. It seems that they have an adequate perception of the composition of the group from their country – but not so considerably from other countries. They possibly lack knowledge if and who from another country is disadvantaged – and there seem to be different concepts about ‘being disadvantaged’. In this respect, the responses of project leaders with respect to the involvement of young people with fewer opportunities in the whole group need to be examined with caution.
34 Participants of T&N/TCP activities were asked if they work with young people with fewer opportunities.
Transnational Analysis 2011
Helmut Fennes with Susanne Gadinger and Wolfgang Hagleitner 53
5.2 Project leaders and project team members Gender and age Similar to project participants, the majority of project leaders are female (61% of the respondents are female) (see Table 67; no data was available for the female – male ratio in the total population). Across all project types, female project leaders form the majority, with the largest proportion amongst SD project leaders (74%), indicating that female project leaders are especially engaged in projects fostering political participation (see Table 68). The proportion of female project leaders in EVS is also relatively high (72%), pointing towards a strong majority of female supervisors in the social sector. The ratio in T&N projects of males and females is almost evenly balanced (53% female project leaders). Again, the reason for a majority of female respondents could also be related to a greater readiness to complete the questionnaire. The average age of project leaders is 36 years with a standard deviation of 11.8 which indicates a wide range of project leaders with respect to age – and a relatively high age for youth workers/leaders (see Table 69). The lowest average (30 years) and the smallest standard deviation can be observed for YI project leaders, indicating the YI projects are – as intended – rather developed and implemented by young people. The highest average (around 40 years) can be observed for YD and SD project leaders, indicating that older youth workers/leaders take the lead when fostering democracy and political participation among young people. Educational attainment Project leaders have a high level of educational attainment: 78% report to have achieved higher education which indicates that youth workers – who are engaged in non-formal education with young people – have achieved a level of formal education. The highest percentages – more than 85% – are shown for Bulgaria, Poland and ‘other countries’ (not part of the RAY Network, including non-EU countries) and the smallest percentage for the Netherlands (42%; see Table 71). These differences can be attributed to different requirements for becoming a youth worker/leader in different countries, by different images of the youth field and subsequently of a difference in status/prestige for working in this field, but it could also be caused by difference in economies, labour markets, etc. A deeper analysis would need to be completed at national level to explore this further. With respect to the educational attainment of project leaders, there is not such a large difference between the project types: the lowest percentage for the achievement of higher education is shown for YI project leaders (70%), the highest for SD and T&N project leaders, the latter indicating again that there is a link between engagement in fostering non-formal education and having achieved a high level of formal education (see Table 70). Furthermore, around one third of the project leaders were in education and training at the time of the project, indicating a high interest of project leaders in (continuing) education and thus in achieving high educational attainment – with by far the highest proportion among YI initiative project leaders (46%), suggesting that especially young people in education are interested in this project type, and the lowest among EVS project leaders who seem to have the most stable and secure employment situations among the respondents (see Table 78).
Research-based Analysis of Youth in Action
54 Helmut Fennes with Susanne Gadinger and Wolfgang Hagleitner
Occupation and professional status within and outside the project Around 50% of the project leaders were employed full-time or part-time by another employer, or they were self-employed; around 10% were unemployed or not in paid work; less than 25% were employed only by the organisation for which they were involved in the project (see Table 76): this indicates a high degree of idealism and participation in society; this implies active citizenship of project leaders, being active for the community and for young people. This is confirmed by the fact that 57% of the project leaders were involved in their project on a voluntary/unpaid basis, and 43% were involved on a paid basis (26% full-time, 17% part-time) – but they were not necessarily employed on a permanent basis, but could well also have been employed only for the project (see Table 90). Overall this indicates a high proportion of voluntary project leaders, considering the commitment, time and work involved. Furthermore, around 40% of those, who were involved on a voluntary basis, did not have another income and around 45% of project leaders involved in their project on a part-time employment basis did not have another income: again, this points to a high degree of idealism among project leaders (see Table 92). The ‘most professionalised’ project type is EVS: relatively many project leaders employed by the organisation for which they were involved in the project; by far the smallest proportion of voluntary project leaders PL (28%); and the smallest proportion of project leaders being in education or training at the time of/immediately prior to the project – mostly due to the nature of EVS projects, where especially on the hosting side professional structures are prevailing. The ‘least professionalised’ are YI projects which have the largest proportion of voluntary project leaders (84%), relatively many project leaders employed by another organisation and the largest proportion of project leaders being in education or training. Both outcomes reflect the nature of these project types, and the latter being in line with the intentions for this project type, namely promoting the self-initiative of young people (see Table 76, Table 78, Table 90). The most precarious working situations seem to apply to T&N project leaders – more than 10% are unemployed; almost 15% are self-employed – presumably as youth trainers; and T&N projects have a relatively high proportion of part-time employed project leaders: this suggests that promoting organisations either tend to employ staff part-time for training, or that for this kind of project they employ temporary staff on a part-time basis (see Table 76, Table 90). A relatively small proportion of voluntary project leaders can be observed for structured dialogue projects: indicating that these projects require a high degree of professional preparation and organisation or that they receive more attention in the promoting organisations (see Table 90). When differentiating this issue by residence country, project leaders from ‘2004+’ EU member states tend to have (also) employment outside the organisations for which they were involved in the project than project leaders from ‘before 2004’ EU member states (exceptions are the Netherlands, Estonia and Bulgaria). This indicates a more professionalised approach to YiA projects in ‘before 2004’ EU member states (see Table 77). In line with this, there is a pattern that ‘2004+’ EU member states show a relatively greater proportion of voluntary project leaders than ‘before 2004’ EU member states (with the exception of the Netherlands where comparatively more project leaders are involved on a voluntary basis than project leaders from the Czech Republic). Furthermore, in a number of ‘2004+’ EU member states (the Czech Republic, Estonia, Poland, but also in the Netherlands), comparatively
Transnational Analysis 2011
Helmut Fennes with Susanne Gadinger and Wolfgang Hagleitner 55
more project leaders were involved in the project on a part-time employment basis than on a full-time employment basis (while on average, this relation is the reverse): this points to more precarious employment situations in the youth field in these countries (see Table 91). Minority affiliation 15% of the project leaders indicate that they belong to a cultural, ethnic, religious or linguistic minority in the country where they live – in fact this is a higher percentage than for the participants (see Table 73), but due to a relatively higher percentage for youth leaders belonging to autochthonous/indigenous and linguistic minorities (see Table 74). This is an indication that youth workers belonging to autochthonous/indigenous minorities (who also mostly belong to linguistic minorities) are more likely to become engaged in projects which are aimed at promoting inclusion and equal opportunities, and at combatting discrimination and intolerance. This could be supported by the fact that members of autochthonous/indigenous minorities have ordinarily the same rights as the majority population, contrary to immigrants or refugees who are without the state citizenship of the respective country. By far the comparatively highest proportion of project leaders with a minority affiliation is reported for Estonia (43%), followed by the Netherlands (almost 30%) and the Czech Republic (more than 20%) – quite a different pattern than for project participants. Differences by country depend on the respective demographic situations and need to be analysed accordingly; thus a differentiation by the type of minority is to be viewed with caution because the samples by country are relatively small (see Table 72). Citizenship identity More than 20% of the project leaders identify themselves primarily as being a ‘European’, thus expressing a supra-national identity or citizenship. Almost 50% identify themselves as being a ‘European citizen’ and at the same time a citizen of their present country of residence, thus indicating a multiple identity as European and at the same time state citizen. For less than 30% the primary reference as a citizen is a state. Altogether, this shows a rather high percentage (almost 70%) of YiA project leaders who feel – at least partially – a European identity, thus taking a model role for project participants with respect to European citizenship (see Table 75). The highest proportion of project leaders taking primarily a European identity (not necessarily a EU-identity) comes from ‘before 2004’ EU member states (with the exception of Sweden), while the proportion of project leaders from ‘2004+’ EU member states is below average (with the exception of Bulgaria). This picture is balanced out with ‘2004+’ EU member states having the higher proportions of a mixed European and state citizenship. Overall, Finland shows the highest proportion of project leaders with an – at least partially – European identity, while Hungary and Sweden rank lowest in this respect (see Table 75). A more in-depth analysis needs to be undertaken at national level in order to take into consideration country specific conditions. Previous experience with EU-funded youth projects Of the responding PL, 70% reported a prior experience with an EU Youth Programme – either as a project leader or as a participant. More than half had been involved in at least one previous EU-funded youth project as a project leader, and one third as a participant. Around 20% had a previous experience with previous EU-funded youth projects as a project leader and as a participant (see Table 80). This implies that participation in an EU-funded youth project is likely to result in later engagement as a project leader of such a project, signalling that the project
Research-based Analysis of Youth in Action
56 Helmut Fennes with Susanne Gadinger and Wolfgang Hagleitner
participation was impressive and had a sustainable effect. On the other hand, multiple involvement as a project leader in EU-funded youth projects implies that – given the limited funding resources available – the same project leaders (and subsequently often the same promoting organisations) are involved in these projects several times (not necessarily the same participants). This is positive since multiple involvements as a project leader might contribute to the development of the quality of the projects. However, at the same time, this might prevent new groups and organisations from becoming involved in the YiA Programme. It seems to be essential to reach a balance between multiple involvements of project leaders and promoting organisations and the outreach of the programme to new groups and organisations. While prior experience of youth exchange project leaders with EU-funded projects are within these average percentages, project leaders of other project types show some deviations: project leaders of youth democracy projects are below average which implies that this rather new (sub-) Action attracts relatively more ‘new’ project leaders and possibly also ‘new’ organisations and groups; for project leaders of youth initiatives had the least prior experience with EU-funded projects – which indicates that this (sub-) Action reaches out most to new groups of young people, very much in line with the intentions of this (sub-)Action; not surprising are the high percentages of project leaders with prior EU-Youth Programme experience in EVS and T&N projects – there is a limited number of EVS hosting organisations who then (fortunately) accept new volunteers on a regular basis, and running Training & Networking projects simply requires adequate experience with EU youth projects; remarkable is the high percentage of youth leaders with prior EU youth project experience in Structured Dialogue projects – this indicates that the Structured Dialogue is least accessible (or least attractive) for ‘new’ project leaders: this should be studied further with qualitative research methods (see Table 86). When differentiating this issue by country, no pattern can be recognised: many countries display average results, but Finland and Hungary show many ‘repeaters’ as project leaders, and Sweden and Poland show very few: this would require further analysis at national level to identify the reasons for this (see Table 87). Many project leaders report that they had prior project leader experience with at least two different project types. Most of the prior experiences as project leaders were with Youth Exchanges – Youth Exchanges are obviously the entry point into YiA (see Table 81). Another pattern is a prior experience with the same project type as that of the most recent project leader involvement. For project leaders of Youth Democracy projects, prior project leader experience with T&N projects is also quite frequent (see Table 88). Overall, two thirds of the project leaders with prior project leader experience were involved in four or more EU-funded projects as project leaders; only for 7% it was their second involvement as a project leader (see Table 82). This indicates a high rate of project leaders who are involved in this function relatively frequently in EU-funded youth projects. This pattern is strongest for EVS and T&N projects and weakest for YI and SD projects, the latter indicating that these project types involve more ‘new’ project leaders and probably also more ‘new’ organisations (see Table 83). When differentiating by country of residence, project leaders from ‘2004+’ EU member states tend to have less frequent prior project leader involvement in EU-funded youth projects than project leaders from ‘before 2004’ EU member states (with exceptions such as Slovakia with a relatively high frequency); this could be explained by a shorter tradition of EU youth programmes in ‘2004+’ EU member states, but the samples are too small to provide for meaningful results (see Table 84).
Transnational Analysis 2011
Helmut Fennes with Susanne Gadinger and Wolfgang Hagleitner 57
More than half of the project leaders (56%) had been participants in a Training & Networking project – this indicates that participants in Training & Network projects actually become involved as project leaders in YiA projects – a success indicator for this project type (see Table 85). At the same time, this prior training and learning experience should have contributed to the quality of later projects. In particular, project leaders from Austria and from the Netherlands are extremely likely to have been previous participants in Training & Networking projects – this indicates a high level of effectiveness of Training and Networking projects in these countries. Another pattern is that project leaders tend to have been participants in a project type which they now are involved in as a project leader – but this is not the case for project leaders of youth democracy and EVS projects: here either Youth Exchanges or Training & Networking activities were the primary starting points (see Table 89). Again, this indicates the sustainable effects of participation in the ‘classical’ project types – Youth Exchanges and Training & Networking projects. Role/function of project leaders in the project More than 30% of project leaders indicate that they primarily had an organisational role in the project (see Table 93) – this implies that responses could be less valid than from those project leaders who (also) had an educational function. This requires further analysis, including qualitative methods. More than half of the project leaders had both an educational and organisational function in the project: this double role most likely implies an extra burden for these project leaders and which again result in lower quality within the projects than if there were more team members and a division between organisational and educational tasks. On the other hand, the combination of these tasks could also provide for a more integrated approach to the project and actually be more efficient. This question should be analysed further employing qualitative methods. A differentiation by project types shows that the highest proportion of project leaders with primarily an educational function can be found in T&N projects (which is not surprising since these require more educational qualifications), but also in YD projects, which suggests that in these projects the educational aspects receive higher attention, i.e. fostering ‘democracy learning’ and citizenship education. On the other hand, the smallest proportion of project leaders with an educational function can be found in YI projects, which indicates that these projects are not regarded as educational. The highest proportion of project leaders with both an educational and organisational function can be found in YE projects, which indicates that in these projects a division between education and organisational tasks is most difficult to achieve – or conversely that their combination is considered to be more appropriate (see Table 93). A differentiation by country shows that the proportion of project leaders with primarily an organisational function is relatively low in Austria and Germany and relatively high in Finland and Sweden (see Table 94): this could be due to different traditions of organising youth work in general and European youth projects specifically in different regions (German-speaking, Scandinavian) or in different countries in general. A more in-depth analysis would need to be undertaken at national level to explain this further.
Research-based Analysis of Youth in Action
58 Helmut Fennes with Susanne Gadinger and Wolfgang Hagleitner
Project leader involvement in the project 80% of the project leaders were involved in the project activities throughout or the majority of the time, and another 10 % were involved in more than half of the project (see Table 95): this implies that 90% of the respondents had a reasonable opportunity to observe the participants and effects of the project – no matter if they had more of an educational or an organisational function in the project. It also implies an involvement of project leaders that should have had an effect on themselves too. When differentiating this issue by project types, project leaders of youth initiatives show the comparatively strongest direct involvement in project activities (almost 90% throughout/most of the time, plus almost 10% for more than half of the project), while EVS and structured dialogue projects are well below average (see Table 95). For EVS projects this is understandable since they often span several months of volunteer involvement, but for Structured Dialogue projects this question could be further examined. When differentiating this issue by country of residence no specific pattern can be observed. Exceptionally high values for project leader involvement in project activities ‘throughout/most of the time’ can be observed for Bulgaria and the Netherlands (see Table 96). A deeper analysis for any country-specific differences needs to be undertaken at national level.
5.3 Beneficiaries and project partners Type of beneficiaries and project partners (project promoters) 70% of the respondents report that the organisations/groups/bodies for which they were involved in the project are non-governmental organisations (NGOs); 20% of the respondents indicate that they were involved on behalf of local or regional public bodies, and 10% were involved with informal groups (see Table 97). YI projects leaders show a comparatively high percentage for being involved with informal groups and the smallest percentage for being involved for public bodies and NGOs – which is in line with the intention of YI projects. SD project leaders show the comparatively highest percentage for being involved on behalf of public bodies, which indicates an interest of public bodies in a dialogue between young people and policy makers/politicians – but the motivation for this interest still requires exploration. Typically, T&N project leaders show the highest percentage of involvement on behalf of NGOs – evidently NGOs have the greatest interest to invest in T&N – and subsequently in the development of international youth work and its quality (see Table 98). The Scandinavian RAY countries (Finland and Sweden) show the highest representative percentages for public bodies – this would suggest that these are more active and trusted as project organisers than in other countries – and lowest on informal groups – probably because of strong youth structures. Some ‘2004+’ EU member states (the Czech Republic, Poland and Slovakia, but not including Hungary and Bulgaria) have a relatively high proportion of informal groups among their project promoters – this points towards more open and informal youth structures, maybe a counter movement to rather rigidly and directive youth structures before 1989; an exception to this is Bulgaria with the relatively high proportion of non-governmental promoters. The Netherlands seem to have comparatively strong non-governmental youth structures and rank highest in this respect; vice-versa, they have the lowest proportion of public bodies among their project promoters (see Table 99). It can be assumed that these differences are influenced by country-specific socio-political conditions and traditions in the youth field.
Transnational Analysis 2011
Helmut Fennes with Susanne Gadinger and Wolfgang Hagleitner 59
Focus of the project promoter The project promoters for which the responding project leaders were involved in the projects are organisations with a broad spectrum of interests and activities. The largest proportion of project promoters – about one third – represents youth organisations/associations. Relatively large groups come from the field of non-formal youth education, youth exchanges and cultural activities (see Table 100). According to the respondents, YE projects are primarily organised by organised youth work structures as well as by youth exchange and non-formal education organisations; YI projects are primarily organised by organisations focussing on cultural activities, but also by open and organised youth work structures; YD projects are primarily organised by youth organisations; EVS projects are primarily organised by youth organisations, non-formal education organisations, open youth work and social services; T&N projects are primarily organised by youth and non-formal education organisations; SD projects are primarily organised by youth organisations but also by a broad spectrum of other project promoters (see Table 101). When differentiating this issue by countries, a very diverse picture appears: which seems to be influenced by country-specific socio-political conditions and traditions of youth work (see Table 102).
Research-based Analysis of Youth in Action
60 Helmut Fennes with Susanne Gadinger and Wolfgang Hagleitner
6 Implementation of Youth in Action
6.1 Becoming involved in Youth in Action Participants The main proportion of participants (47%) became involved in their YiA project through youth structures – youth organisations, -centres or –groups. Around one third of the participants became involved through friends and/or acquaintances.35 Also relevant entry points for participants are schools or universities (17%) and National Agencies (NAs) through their respective information channels and activities (8%; see Table 103).36 Almost all countries show a similar pattern: youth structures, friends/acquaintances, and to a lesser degree schools. For Austria and Germany printed and online media were the third most important entry point to YiA – more important than schools or universities (see Table 107). The reasons for this would need to be further analysed: is it a cultural phenomenon, where printed/online media are more used for this type of activity/opportunity, or is it because of a higher effort of the National Agencies in these countries to use printed/online media for promoting YiA? The access to most project types shows a similar pattern – primarily through youth structures and friends/acquaintances. But there are some deviations: the main proportion of young people found their way to youth democracy projects through school or university – an indication that the promotion of YiA through formal education institutions can be effective; EVS participants found their way to YiA not only through friends/acquaintances, but also through printed or online media; TCP participants’ route to participation in YiA was mostly through the National Agency or a regional branch/office. This demonstrates that YiA participants are reached through a broad spectrum of channels which need to be pursued to address a broad scope of young people (see Table 105). Project leaders The largest proportion of project leaders learned about the YiA Programme (or a previous EU youth programme) through a YiA NA or its regional branches (37%); almost as many (31%) got to know YiA/a previous EU youth programme through youth structures (youth organisations, youth centres or youth groups), 23% through friends/acquaintances37, 19% through colleagues at work (most likely including youth work colleagues). Schools or Universities appear to play a minor role as entry point for project leaders (8%; see Table 104). The project leaders of most project types learn about YiA/a previous EU youth programme through the YiA NA/their regional branches, with the exception of Youth Initiatives where friends and acquaintances play the most prominent role – thus indicating that these projects actually are initiatives initiated before a funding scheme came into the picture (see Table 106). This representation becomes more diversified when differentiating by country of residence (see Table 108): while in the majority of countries the National Agency/regional branches are the
35 Most likely also including their families which were not separately mentioned in this question – this item will be added for future surveys. 36 Multiple responses (a maximum of two) were possible. 37 Most likely also including their families – see above.
Transnational Analysis 2011
Helmut Fennes with Susanne Gadinger and Wolfgang Hagleitner 61
primary source of information, youth structures, friends or acquaintances or colleagues at work are the primary sources of information in the other countries. Conclusions for participants and project leaders becoming involved in YiA Project leaders learn about the YiA Programme primarily via information from the National Agency (or a regional branch) or via youth organisations/centres/groups (probably those they are involved in), including their colleagues at work, but also to some extent through friends and acquaintances – and only to a very limited extent through formal education institutions or media (including online). Subsequently, project participants primarily get involved in YiA through youth structures (groups, organisations, centres) – therefore most likely through youth workers/leaders or friends/acquaintances involved in such youth structures, maybe with prior experience in a YiA project. One could talk about a ‘Youth in Action virus’ which is placed in youth structures by the National Agency (including via media and the internet) and then spread via youth workers/leaders and former project leaders and project participants. Informal channels as well as non-formal education/youth related channels play the most important role in reaching young people for participating in YiA – a non-formal education and mobility programme – while formal education institutions play a minor role in this respect. The conclusion for NAs could be to (continue to) work via youth organisations, youth centres and youth structures – and to implement a high quality programme that is spread by word of mouth through former project leaders and participants.
6.2 Financing the project Visibility of YiA/EU-funding Most participants (95%) express they know that their project was funded by the European Union – interestingly a slightly higher proportion of participants in non-RAY countries are aware of this (see Table 111). Slightly less (90% of the participants) indicate that they know that the project was funded by the YiA Programme (see Table 112). These are fairly high percentages indicating that the funding source is well communicated within and by the project promoters. Considerable differences can be observed when differentiating this issue by country of residence, generally a larger proportion of participants from ‘2004+’ EU member states knowing about the source of the funding than participants from ‘before 2004’ EU member states, with exceptions for the Netherlands and Estonia (see Table 112, Table 114). The percentages range from Sweden (83% knowing about EU-funding, 72% knowing about YiA-funding) and Austria (87%/80%) to Hungary (98%/90%), Bulgaria (96%/97%) and Poland (99%/98%): These differences might be attributed to different approaches of NAs and/or beneficiaries concerning the information about project funding, possibly also influenced by the image of the European Union in the respective country, e.g. being more hesitant about informing regarding the funding source in case of a critical image of the EU in the respective country or organisation.
Research-based Analysis of Youth in Action
62 Helmut Fennes with Susanne Gadinger and Wolfgang Hagleitner
Participation fees Around 45% of the participants did not have to pay a participation fee/contribution to the project costs, indicating that sufficient other co-funding at national/local level was available on top of EU funding. In RAY countries a slightly higher percentage of participants (50%) did not have to pay a participation fee, indicating that in ‘other countries’ less co-funding was available – most likely in Partner Countries in Eastern Europe, South East Europe and the Mediterranean (see Table 109). Considerable differences can be observed between RAY countries, covering a wide range between Bulgaria (64% not having to pay a participation fee) and Sweden (59%) on one side of the spectrum and the Netherlands (27%) and Hungary (25%) on the other side (see Table 110). It is difficult to recognise a pattern based on economic situations.
6.3 Application, administration and reporting The project leaders of beneficiaries were also asked about application, administration and reporting requirements: overall, the responses show positive feedback (see Table 115): almost 90% were satisfied (sum of ‘somewhat true’ and ‘very true’) with the information
provided concerning the YiA application requirements; 80% of the respondents found the funding criteria and rules as well as the overall grant
system to be adequate. On the other hand, around 30% report that the application procedure and the reporting were difficult, thus representing a considerable proportion of project leaders who have difficulties with the administrative demands of the programme. This percentage has also to be understood in view of the fact that many project leaders (and their organisations) have had previous experience with an EU youth programme and thus could have become more familiar with these demands and procedures. At the same time, one could also perceive these responses as a ‘culture of complaining’ about these demands and procedures as was expressed in previous studies on this subject.38 When differentiating the responses by project type, beneficiaries receiving a grant for a YD project found their access to YiA funding to be most difficult – their assessment of the respective items is the lowest across all project types. Conversely, Youth Initiatives found their access to receiving a grant to be relatively easy; this indicates that this target group is confronted with higher barriers when trying to receive funding from other sources – therefore, the intentions of the respective (sub-)Action were reached to some degree. Beneficiaries receiving a grant for a T&N project seem to be the most professional or experienced in this field: they gave the most positive feedback with respect to information related to their applications, and they found that reporting and administration of the grant was relatively easy (see Table 116). When comparing the responses from the different funding countries, the most critical responses come from ‘before 2004’ EU member states, in particular Austria and Germany, where other funding sources seem to be relatively easily accessible. Somewhat positive feedback comes from ‘2004+’ EU member states (accession 2004 or later), in particular from Bulgaria and Hungary,
38 See Chisholm, L. & Fennes, H. (2007). Das Internationale wird Standard. Das EU-Aktionsprogramm JUGEND (2000-2006): Evaluierung der Umsetzung in Österreich. Bundesministerium für Gesundheit, Familie und Jugend. Retrieved from http://dl.dropbox.com/u/45733110/projects/EVALYOU/EVALYOU_AT_Endbericht_final_20070627.pdf, accessed 17.10.2011.
Transnational Analysis 2011
Helmut Fennes with Susanne Gadinger and Wolfgang Hagleitner 63
where YiA seems to be relatively more easily accessible than other funding sources (see Table 117).
6.4 Youthpass ‘Youthpass’ was introduced to the YiA Programme in 2007: “Youthpass is a tool for participants of projects funded by the Youth in Action Programme to describe what they have done and to show what they have learnt”39. Some questions to participants and project leaders inquired about the information about and the use of Youthpass in the projects. It needs to be noted that Youthpass was gradually introduced in the different (sub-)Actions of the YiA Programme, but that these questions were addressed to all participants and project leaders, no matter if Youthpass was supposed to be applied in the respective project. Youthpass is well known among the participants in those (sub-)Actions where Youthpass was introduced early in the programme (in 2008/2009) – and particularly in Actions where it is considered to be relevant: the highest degree of knowledge about Youthpass can be found in EVS (91%), TCP (87%) and T&N projects (73%); less knowledge exists in YE projects (which includes Action 3.1 projects where Youthpass was only introduced in 2010), and in YI projects (where Youthpass was only introduced in 2011 – and most projects analysed were funded in 2010). The knowledge about Youthpass is surprisingly high in SD projects, suggesting that Youthpass was addressed in these projects as a youth policy issue, while in YD projects Youthpass is not known so much. Overall, almost 60% of the participants report being informed about Youthpass (see Table 122). When asking participants if they have a Youthpass, a similar picture appears in terms of the relations according to project types, but with lower percentages (between 10 and 20 percentage points less); this could also be caused by the fact that participants were invited to the survey between 3 and 9 months after the project – and still did not receive their Youthpass. Nevertheless, more than 40% of the respondents have a Youthpass, and more than 10% of SD and YD projects have a Youthpass from other YiA projects (see Table 123). Project leaders were also asked if Youthpass was used in their projects and if they had received adequate information about the implementation of Youthpass. On average, almost 50% of the project leaders report that Youthpass was used in their project (see Table 124). Since Youthpass was introduced in different years for different (sub-)Actions, one needs to differentiate the responses by these. In this respect, it is remarkable that only 54% of the Action 1.1 project leaders report that Youthpass was used in the project (while Youthpass was introduced in this sub-Action in 2008) – so in fact Youthpass should have been used in most projects surveyed since they all ended before 31 January 2010. At the same time, for project leaders from other (sub-)Actions where Youthpass was introduced a year or two later (for Action 4.3/Training Courses and Seminars in 2009, for Action 3.1/Youth Exchanges and Training Courses in 2010) the respective percentages are almost as high. On the other hand, project leaders of (sub-)Actions for which Youthpass is not foreseen (Action 1.3 and Action 5.1) report that Youthpass was used. It still might be that Youthpass was used in all projects where it was foreseen, but the responses suggest that many project leaders are not familiar with Youthpass and/or are not aware that a Youthpass is issued by the beneficiary organisation. It is obviously difficult and takes time to introduce this (more formal) instrument in non-formal youth education.
39 Youthpass website of Jugend für Europa/SALTO Training and Co-operation Resource Centre. Recognition of non-formal learning in the youth field. Retrieved from http://www.youthpass.eu, accessed 6.6.2012.
Research-based Analysis of Youth in Action
64 Helmut Fennes with Susanne Gadinger and Wolfgang Hagleitner
On the other hand, those project leaders, who report that Youthpass was used in their project, also report largely that this was done quite successfully – that they received all the necessary information and that it was clear and understandable; that the participants were informed about Youthpass in detail; and that more than 75% of the participants received a Youthpass. Only the integration of Youthpass into the project and its methods might need to be improved: just 42% of the project leaders indicate that this was done to a high extent (see Table 125, Table 126).
6.5 Structured Dialogue The participant questionnaire for the surveys in 2010/2011 included new questions with respect to the knowledge about and experience with the ‘Structured Dialogue for Young People’ which was established as a new opportunity for meetings and discussions between young people and policy makers through sub-Action 5.1 of the YiA Programme. The responses lead to the following conclusions: 22% of the respondents indicate that they had heard about the Structured Dialogue and
10% respond that they had experienced activities within the Structured Dialogue. Considering that only 7% of the respondents had participated in the respective Action 5.1 this means that knowledge about the Structured Dialogue goes far beyond those who were involved in it (see Table 127, Table 128).40
There is a significant difference on the knowledge about the Structured Dialogue between the countries of residence of participants: between 5% (Austria) and 32% (Poland) of the respondents had heard about the Structured Dialogue; between 2% (Austria) and 15% (Poland) had experienced activities within the Structured Dialogue (see Table 131, Table 132).
Participants from ‘2004+’ EU member states are generally better informed about the Structured Dialogue than participants from ‘before 2004’ EU member (see Table 131.)41 This suggests that the Structured Dialogues plays a more important role in ‘2004+’ EU member states because there is a greater interest in this topic (and possibly on EU policies and programmes in general) at different levels of youth structures and because, subsequently, the information on the Structured Dialogue (and possibly on EU policies and programmes in general) is better communicated to youth organisations/groups/ centres and young people. Nevertheless, it is also possible that participants from ‘2004+’ EU member states are better informed about European policies and programmes: this would require further analysis, in particular on the educational background of the participants from the different countries.
With respect to the experience with the Structured Dialogue, a similar pattern appears: more participants from ‘2004+’ EU member states generally indicate an experience with the Structured Dialogue than participants from ‘before 2004’ EU member states (see Table 132).42
40 It needs to be noted that projects funded by the German National Agency (NA) were only surveyed in November 2010 and projects funded by the Hungarian NA were only surveyed in May 2011. This might have an impact on the differentiation by funding countries since the information about and the experience with the Structured Dialogue has increased between November 2010 and May 2011. 41 Exceptions are the Czech Republic and Estonia with values below the responses of some ‘before 2004’ EU member states, and Finland and the Netherlands with values above the responses of some ‘2004+’ EU member states. The sample of Liechtenstein is too small as to allow a meaningful comparison with other countries. 42 Exceptions are Bulgaria, the Czech Republic and Estonia with values below the responses of some ‘before 2004’ EU member states, and Sweden and the Netherlands with values above the responses of some ‘2004+’ EU member states. The sample of Liechtenstein is too small to allow for a meaningful comparison with other countries.
Transnational Analysis 2011
Helmut Fennes with Susanne Gadinger and Wolfgang Hagleitner 65
A similar pattern can be observed when differentiating the knowledge about and the experience with the Structured Dialogue by funding country. In this case, the results also depend on the project (and not only on the country of residence of the participants) and, subsequently, on the emphasis of the funding National Agency on this issue.43
When differentiating by age group44, it can be observed that older participants are better informed about the Structured Dialogue than younger participants: this is evident for knowledge about a specific issue. Nevertheless, it needs to be noted that in case of a comparison by age group with respect to experience with the Structured Dialogue the age group 15 to 17 is the strongest. This implies that primarily projects involving this group are addressing the Structured Dialogue in practice (see Table 129, Table 130).
When differentiating the responses on the knowledge about the Structured Dialogue by project type, the highest value is achieved for projects under Action 5.1 (on the Structured Dialogue); nevertheless, it is surprising that the proportion of those responding positively is only 45% – while it could be expected to be more towards 100%: obviously many participants participating in a project within the Structured Dialogue are not aware of this aspect. This points towards a broad understanding of the term ‘Structured Dialogue’. On the other hand, the Structured Dialogue is obviously well communicated in TCP activities and in Training and Networking projects. In contrast, knowledge about the Structured Dialogue is very limited in EVS projects (see Table 127).
A similar picture can be recognised when differentiating the experience with the Structured Dialogue by project type. Nevertheless, relatively low levels of response can be observed for Youth Initiatives and for EVS projects. In the case of EVS projects this can be explained by the more social than political nature of many EVS projects. In the case of Youth Initiatives this result is surprising and merits further analysis (see Table 128).
43 A difference with respect to the result by residence country appears in this case for Estonia. This suggests that the Estonian NA places a specific focus on this issue. 44 The sample of the age group up to 14 years was too small to allow for a meaningful comparison.
Research-based Analysis of Youth in Action
66 Helmut Fennes with Susanne Gadinger and Wolfgang Hagleitner
7 Project development and implementation
7.1 Previous applications 15% of the project leaders from beneficiary organisations report that their project had been subject to a second application in order to receive funding (see Table 133). This implies sustainable structures as well as motivated promoters who pursue their ideas persistently. The highest rate for ‘second applications’ can be observed for T&N projects (26%), suggesting the biggest competition as well as the highest demands for applications under the respective (sub-)Actions. The lowest rate for ‘second applications’ appears for SD projects (8%) – suggesting that for this relatively new project type there is the least competition – and for EVS (10%). As for the latter this could result from more structured pre-planning where applications are only submitted when it is already very likely that they will be approved (see Table 133). A comparatively high rate is shown for Hungary (42%); relatively low percentages appear for Austria, Germany, Finland and Sweden (between 10% and 12%). Clearly, the demand for funding respectively and the competition for grants are diverse across the RAY countries, but the differences might also be attributed to different approaches by NAs with respect to promotion of YiA, consultancy with applicants or rigour when assessing applications (see Table 134). These findings would benefit from a more in-depth analysis at national level.
7.2 Preparation of the project 70% of project leaders report that their organisation had cooperated previously with one or more project partners in projects funded by an EU youth programme (see Table 118). This implies functioning partnerships and networks between project organisers: this is positive, because it is one of the YiA objectives to foster European cooperation in the youth field, and it should contribute to development of the quality of projects – but equally it also could prevent new organisations from gaining access to the programme. More than 90% of project leaders report that the project was well prepared. While this response can be considered to be biased it also refers to the preparation by the teams of the beneficiary organisations as it was perceived by project leaders from partners in other countries – which leads to a more relative picture (see Table 118). Nevertheless, only 66% of project leaders report that they had a preparatory meeting: around 75% of project leaders in YE, YI and YD projects, but only around 55% of project leaders in T&N and SD project; for EVS projects preparatory meetings are maybe not necessarily crucial – in most cases there are only two partners and one participant which could explain that only 40% of EVS project leaders report preparatory meetings (see Table 118). On the other hand, 60% of the project leaders report that skype meetings were used for the preparation of their project – compensating increasingly for physical face-to-face meetings (see Table 118). Overall, the cooperation in the preparation and implementation of the projects is reported to have been very good and improving during the course of the project. In this respect, there are only minimal differences between the different countries and the different project types (except for EVS where the quality of cooperation was reported to have decreased – which could possibly be the result of a lack of preparation beforehand; see Table 120).
Transnational Analysis 2011
Helmut Fennes with Susanne Gadinger and Wolfgang Hagleitner 67
Nevertheless, it is recommended to strengthen the promotion/support of preparatory meetings, complemented by skype meetings, in order to ensure the quality of the projects: 83% of project leaders who had a preparatory meeting express that it was essential (at least ‘to a considerable extent’) for the preparation (see Table 119). Furthermore, around 20% of the project leaders report that the projects were not really developed in a balanced and mutually prepared way (see Table 119) – this highlights the need for improved preparation, including before an application is submitted, e.g. through preparatory visits and/or skype meetings – this might need to be promoted more strongly, possibly through the establishment of minimum standards for the preparation. This issue should be analysed more in-depth utilising qualitative research methods.
7.3 Project languages The projects appear to deal well with the (potential) language barriers in mostly international/multilingual groups of participants: around 30% of the participants (37% of ‘sending’ participants) expressed that the project team had helped them to understand when necessary, and only 6% of the participants (8% of the ‘sending’ participants) indicate that they ‘had difficulties to participate in the project for language reasons’; on the other hand, almost 70% used also other languages than their first language (76% in case of ‘sending’ participants, 63% in case of ‘hosting’ participants) – resulting in a large majority using a foreign language in practice (see Table 135, Table 136, Table 137).
7.4 Satisfaction with Youth in Action Indirectly, project participants show a high degree of satisfaction with the project they participated in: 86% would ‘definitely’ recommend to others to participate in a similar project and 61% had already done so; 83% found their participation ‘definitely’ to be a personally enriching experience; and the majority of participants felt well integrated in the project (64% ‘definitely’), plan to participate in a similar project in forthcoming years (58% ‘definitely’) or would recommend to other people to start such a project themselves (60% ‘definitely’). Across all items, the sum of positive responses (‘definitely’ plus ‘to some extent’) ranges from 85% to 97% (see Table 138) Somewhat less agreement was found in the statement ‘I was able to contribute with my views and ideas to the development and implementation of this project’ (41% ‘definitely’, 43% ‘to some extent’): this indicates that there is room for improvement in participation in the project by the project organisers and project teams. Conflict may arise between following the funding criteria – participation of young people in the development and implementation of the project – and required procedures. There is potentially a chance if young people have more of a say on the project, it may run the risk of not meeting the funding criteria.
Research-based Analysis of Youth in Action
68 Helmut Fennes with Susanne Gadinger and Wolfgang Hagleitner
8 Effects of Youth in Action projects
8.1 Competence development of participants Knowledge acquisition The participants were asked about which topics and themes they learned something new about – choosing a maximum of three topics from the list of topics used in the YiA applications. The themes directly related to the YiA objectives and priorities which show the highest percentages are (see Table 139, Table 140): ‘Europe’ (47% of the participants indicate that they learned something new about this
topic, with the highest percentages for TCP activities and EVS projects); inclusion (‘integrating disadvantaged or marginalised people into society’; 27%, with the
highest percentages for EVS, TCP and T&N projects); youth and youth policies (31%; highest percentages for SD, TCP and T&N projects).
A relatively high percentage can also be reported for ‘art and culture’ (37%), but it is not quite clear how ‘culture’ is interpreted – in a more narrow sense linked to arts or in a broader sense linked to cultures in general or ethnicity – this would need to be explored with qualitative research methods. The outcomes above indicate that EVS, TCP and T&N projects contribute most to knowledge acquisition related to YiA objectives and that SD projects are very effective with respect to the specific objective of this sub-Action. Relatively low values can be observed in the themes of issues related to discrimination and minorities which are directly linked to YiA objectives and priorities: ‘non-discrimination based on sexual orientation’ (3%), ‘Roma people’ (4%), ‘minorities’ (7%), ‘gender equality’ (7%), ‘people living with a disability’ (8%), ‘discrimination’ (11%). Also relatively low values are observed in the learning on interfaith understanding (10%) – relating to tolerance, respect of others with different beliefs – which can also be seen as being part of YiA objectives/priorities (see Table 139). Relatively minimal learning is also reported on ‘health’ (6%) which might not be perceived as an interesting or relevant topic for YiA projects – maybe this requires initiatives in other sectors of youth work or education. Nevertheless, this could also point towards a lack of consciousness of young people/youth workers of the importance of a healthy life-style. Of course, it is possible that the participants already had prior to the project a high level of knowledge about those topics and themes which they report not to have learned much about. Nevertheless, the differences in learning something new about YiA related topics are remarkable and the reasons should be further explored with qualitative research methods – maybe more support and steering is required with respect to these themes. The outcomes above are largely in line with what project leaders indicated to be main themes of their projects (see Table 141, Table 142) – thus one can assume that the main themes were successfully implemented and that the projects had the intended effects on the participants (see Table 143). Nevertheless, some differences can be observed45: 45 It needs to be noted that participants could tick up to three themes and the project leaders up to two themes; therefore in Table 143 percentages of responses were used for a comparison.
Transnational Analysis 2011
Helmut Fennes with Susanne Gadinger and Wolfgang Hagleitner 69
Themes about which participants learned considerably more than the project leaders saw as main themes are ‘youth and youth policy’ and ‘urban/rural development’ – participants probably learned about these themes more implicitly; this reflects unintended learning that took place. Themes about which participants learned less than the project leaders saw as main themes are discrimination, environment and European awareness. This indicates that with respect to these topics the projects were not as successful as intended by the organisers. Concluding, the following strengths of different project types compared to others can be noted with respect to knowledge acquisition: YE projects: ‘Europe’ (50%) and ‘art and culture’ (46%; YI: ‘art and culture’ (50%) YD: ‘media and communications’ (29% ) EVS: ‘Europe’ (54%); inclusion (39%) and ‘people living with a disability’ (25%) TCP: ‘Europe’ (55%), ‘youth and youth policies’ (51%) T&N: similar to TCP, but a bit lower SD: ‘youth and youth policies’ (65%), ‘urban/rural development’ (35%)
Again, most strengths of project types as indicated by the participant responses are in line with the project intentions, but not continuously. However, overall the strengths of project types as described above are largely in line with the specific objectives of the different Actions of the YiA Programme. Skills development In order to explore the effects of participating in YiA projects on the development of the eight key competences for lifelong learning (see European Commission, 2004; European Parliament and Council, 2006b), 21 skills were defined as respective indicators (see Table 144). At least two skills referred to different aspects of each key competence. As for ‘interpersonal, social, intercultural and civic competence’ – a key competence related closely to YiA objectives and priorities – five skills were defined as indicators. Additionally, two skills refer to ‘media literacy’ as defined in a resolution of the European Parliament (see European Parliament, 2008). Participants were asked about their assessment of the development of these skills as an effect from their participation in the project. Additionally, the project leaders were asked about their assessment of the development of these skills by the participants as an effect of the project. Finally, project leaders were also asked about their assessment of the participants’ development of the eight key competences for lifelong learning as defined in the European reference framework (see European Commission, 2004) plus ‘media literacy’ – see above – resulting from their project participation. Due to the broad scope of these, key competences were split into two or three items in order to retrieve more differentiated data (see Table 156). These different perspectives and approaches provided for a triangulation of the data in the analysis. In their self-assessment, participants report the most distinct development for skills related to foreign language competence; interpersonal/social competence; intercultural competence; sense of entrepreneurship; civic competence; cultural awareness and expression; learning competence (‘learning to learn’).
Research-based Analysis of Youth in Action
70 Helmut Fennes with Susanne Gadinger and Wolfgang Hagleitner
For these competences the development of the respective skills was indicated by between 70% and 90% of the respondents (sum of ‘definitely’ and ‘to some extent’). For some skills related to foreign language, interpersonal/social and intercultural competence more than half of the participants indicated ‘definitely’ a development (see Table 144, Table 145). However, a distinct development (but with smaller percentages for ‘definitely') is indicated for ‘communication in the first language (mother tongue)’, ‘mathematical competence’ and ‘sense of initiative’. Only 6% of the project leaders indicated that they did not observe any skills development on the part of the participants (see Table 150). Partly this is in line with the YiA objectives and priorities, but partly this outcome is surprising since competences are distinctly being developed which are not directly linked to YiA objectives and priorities, for example learning competence (learning to learn) or mathematical competence. A similar picture appears when analysing the assessment by the project leaders (see Table 146) – in fact, the responses of the participants and of the project leaders show a highly significant correlation (see Table 151, Figure 2). Across all skills, the assessment by the project leaders shows a more distinct skills development than the self-assessment of participants. The major differences in this respect are on digital and media literacy skills (where the participants might even have better skills than the project leaders). The different assessments could be caused by ‘wishful thinking’ of the project leaders who want their intentions and efforts to be confirmed, but it might also be that project leaders do not know the participants so well and underestimate their skills and competences. Furthermore, the survey was done some months after the project end, when the participants could have arrived at a more reflected assessment of the effects of the project, while the project leaders might not have been in such frequent contact with them. It needs to be noted that there is quite a difference between the responses to the two skills referring to civic competence: learning ‘how to achieve something in the interest of the community’ – relating to a more affective dimension of civic competence – shows significantly more distinct effects (39% ‘definitely’ and 44% ‘to some extent’) than ‘to discuss political topics seriously’ – relating more to a cognitive dimension of civic competence (22% ‘definitely’ and 32% ‘to some extent’). Similarly, the skill ‘to critically analyse media’ – also relating more to a cognitive dimension of civic competence – shows a relatively lower development (17% ‘definitely’ and 31% ‘to some extent’). This means that some skills relating to ‘civic competence’ – relating to core objectives of the YiA Programme – are less developed than skills relating to competences which are not at the core of YiA objectives and priorities (e.g. learning competence or cultural awareness). On the other hand, this suggests that YiA projects contribute to learning ‘non-formal’ participation skills rather than ‘formal’/political participation skills. A similar pattern can be observed for the project leaders’ assessment of the development of the participants’ key competences for lifelong learning as defined in the respective reference framework (see European Commission, 2004), but in some cases the responses to the development of a specific competence does not correlate with the responses to the related skills. In particular, such deviations can be found for digital and mathematical competence (where the competence development is assessed lower by project leaders than the related skills development) and for civic competence (where the competence development is assessed higher than the related skills development). This might be caused by a diverse understanding by project leaders concerning the key competences if they are asked about them in official terminology than when being asked about specifics related to them. It also might be that the project leaders’ assessment refers to aspects of the key competences which are not reflected in the related skills: this would need to be explored further through qualitative research methods.
Transnational Analysis 2011
Helmut Fennes with Susanne Gadinger and Wolfgang Hagleitner 71
When differentiating between ‘sending’ and ‘hosting’ participants, highly significant differences appear with respect to the development of skills and competences (see Table 149): the ‘hosting’ experience contributes more strongly (highly significant) to the development
of skills related to communication in the first language, sense of entrepreneurship, cultural awareness and expression, media literacy as well as to mathematical, digital, social and civic competence;
the ‘sending ’ experience contributes more strongly (highly significant) to the development of skills related to foreign language, intercultural and learning competence.
Remarkably there appears to be more skills and competence development for the hosting side – contrary to the popular assumption that going to another country provides for more (intensive) learning experiences. In fact, the skills developed by ‘sending’ participants are mostly – as expected – related to foreign language and intercultural competence – and interestingly also to learning competence. For the ‘hosting’ participants, the preparation and organisation of the project seems to be more demanding and imply more participation, entrepreneurship, project management, interaction and communication, this resulting in the development of the respective skills through experiential learning. When differentiating the responses by project types, the following conclusions can be drawn (see Table 147, Table 148): overall, the skills development competence development by project types is in line with
the objectives and requirements for the different Actions; partially the assessment by participants and project leaders are similar, but partially diverse
– this would need to be explored further with qualitative research methods; in particular, for EVS projects the self-assessment by participants is more critical than by
the project leaders – it might be that EVS participants reflect more about their learning since their experience is normally relatively lengthy;
YE projects contribute on or above average to the development of a broad spectrum of competences/skills, with high score in foreign language and intercultural competence development; the development of civic competence and sense of initiative is relatively lower;
YI projects show a distinct development of skills which are necessary for developing and implementing a project – social competence, sense of entrepreneurship, digital competence, media literacy, communication in the first language/mother tongue, mathematical competence – and cultural awareness, which is probably linked to the content of the projects;
YD projects are relatively specialised – they contribute strongly to the development of civic competence, but relatively little to all other skills (note: to be considered with caution because the sample of YI participants and project leaders was relatively small);
EVS projects provide a two-fold picture – contributing strongly to the development of foreign language competence, intercultural competence, sense of initiative, mathematical competence and learning competence (learning to learn), but relatively little to most other competences, including civic competence;
T&N projects contribute on average to a broad spectrum of competences/skills, with special strengths on learning competence and communication in the first language/communication skills;
Research-based Analysis of Youth in Action
72 Helmut Fennes with Susanne Gadinger and Wolfgang Hagleitner
TCP activities are more specialised in developing learning competence (which is a specific objective of most of these activities) and contributes strongly to the development of communication in the first language/mother tongue and sense of initiative (in particular identifying opportunities for one’s personal and professional future), but rather little to the development of most other skills, including skills related to civic competence (for TCP activities, only a self-assessment of participants was available, because TCP project leaders were not surveyed);
SD projects are – similar to YD projects – rather specialised, contributing strongly to civic competence and communication in the first language/mother tongue, but relatively little to most other skills (note: to be considered with caution because the sample of SD project leaders was relatively small).
In conclusion, it can be reported that among the different project types there are ‘all-rounders’ (YE and T&N projects) which contribute on average (or above) to
the development of most key competences; there are ‘specialists’ (YD and SD projects as well as TCP activities) which contribute
strongly to a the development of few competences which are in line with the specific objectives of the respective (sub-)Actions but relatively little to the development of all other competences;
there are some project types ‘in-between’ which contribute to the development of some competences above average and to others below average (EVS and YI projects);
there is no indication that the project duration has an effect on the responses on the development of key competences – but there is (yet) no data on the degree of competence development (meaning the difference of the competence levels before and after the project) – this would require further studies using other research instruments, assessing also the competence levels.
Values and attitudes Participants indicate that a number of values have become more important for them as a result of participating in the project (see Table 155), in particular values related to citizenship: for more than half of the participants ‘respect for other cultures’ (64%), ‘tolerance’ (59%), ‘solidarity’ (58%) as well as ‘equality and individual freedom’ – which are all values related to citizenship – have become more important, but also ‘self-fulfilment’ (57%) – which represents a value related to individualism. ‘Human rights’, ‘democracy’ and ‘peace’ (all related to citizenship) have also become more important for a considerable proportion of participants (40% to 45%), but it could also well be that these values were given high importance already prior to the project. ‘Rule of law’ and ‘religion’ show limited importance: the first is perhaps too abstract for or not fully understood by many participants (maybe also misunderstood as ‘rule of the police’), but it could also well be that this issue is not comprehensively addressed in YiA projects; the latter reflects that ‘religion’ (which might not be considered to be a value per se) is not a very popular theme in YiA projects (see also ‘main themes of the project’ – Table 143), but it is interesting that ‘religion’ is the item which has become less important for the largest proportion of participants (7%; see Table 155).
8.2 Effects with respect to objectives and priorities of Youth in Action
While research-based analysis of YiA aims to study all effects resulting from the projects – whether intended or not – it also specifically addresses intended effects at large reflected in the
Transnational Analysis 2011
Helmut Fennes with Susanne Gadinger and Wolfgang Hagleitner 73
objectives of the YiA Programme. Numerous effects with respect to competence development which are also reflected in the YiA objectives have already been outlined in the previous section. This section analyses responses to questions which were asked specifically in relation to the YiA objectives. Coherence of projects with objectives and priorities of YiA Overall, the projects funded through the YiA Programme are largely in line with the programme’s objectives and priorities. While each of the five general programme objectives originally was intended to be a guiding objective for one of the five Actions of the Programme, it shows that the five general objectives are reported to be pursued in all Actions, although with different emphasis. This is also the case for the permanent programme priorities, which were intended as transversal priorities across all Actions (see Table 164, Table 165, Figure 4). According to the project leaders, the vast majority of YiA projects were in line with the very general objective of most international youth exchanges, namely fostering mutual understanding between young people in different countries: almost 90% of the projects leaders report that their projects were at least to a considerable extent in line with this objective. Ranking very high in the compliance with the objectives and priorities were projects promoting young people’s respect for cultural diversity, to promote intercultural learning and to fight against racism and xenophobia, and projects aimed at developing solidarity and promoting tolerance among young people in order to foster social cohesion in the European Union (around 85% of the projects were reported to be in line with these objectives/priorities at least to a considerable extent). Approximately 75% of the project leaders report that their projects were promoting at least to a considerable extent young people’s active citizenship and their European citizenship. While this can be considered to be successful, it still suggests that approaches and methods might be developed to pursue these core objectives and priorities of the YiA Programme more effectively, being aware that this is a challenging task – not only within the YiA Programme, but in society at large. Similarly, further measures could be developed to include more young people with fewer opportunities into the YiA programme: around half of the project leaders report that their projects were in line with this permanent priority. While this is a very difficult task, this is one of the challenges of making YiA a programme that is really accessible for as many young people as possible – a youth mobility programme for all. Some of the YiA Programme objectives are in fact more focussed on specific Actions, in particular the objective to contribute to developing the quality of support systems for youth activities and the capabilities of civil society organisations in the youth field, and to promote European cooperation in the youth field. The large majority of projects funded under Action 4 or Action 5 are reported to have been in line with these objectives at least to some extent (see Table 166). Across all project types, YE, T&N and YD show the strongest coherence with YiA objectives and priorities (the latter being based on a relatively small sample). YI projects show a strong coherence with respect to the inclusion of young people with fewer opportunities, but a rather weak coherence with respect to other objectives and priorities. SD and EVS projects cover a
Research-based Analysis of Youth in Action
74 Helmut Fennes with Susanne Gadinger and Wolfgang Hagleitner
broad range between high and low coherence with the YiA objectives and priorities, but none of them show the highest coherence compared with all other project types. Effects on participants related to YiA objectives and priorities Effects on the competence development related to YiA objectives and priorities (see European Commission, 2010; European Parliament and Council, 2006a) have already been described in detail in the previous section. This section also addresses action-oriented effects – which are difficult to assess because the timespan between the project and the survey is rather brief as to have time to experience and reflect on an actual change of behaviour. Overall, the strongest effect can be observed with respect to an increased interest in European issues (52%) – an indicator for the priority on European citizenship. Less developed was the support for disadvantaged people (which increased for 39% of the participants) – reflecting the priority on inclusion of young people with fewer opportunities, participation in societal and/or political life (35%) – reflecting the priority on participation of young people – and commitment to work against discrimination, intolerance, xenophobia or racism (34%) – an indicator for the priority on cultural diversity. Less than 10% of the participants indicate a decrease with respect to these issues (see Table 161, Figure 4). Partly this is supported by observations and perceptions of project leaders (see Table 173) who report that participants ‘increasingly began to ask questions about European topics’ (73% ‘somewhat true’ or ‘very true’) and who assume that participants ‘intend to get more involved in social and political life’ (79% ‘somewhat true’ or ‘very true’). A more diversified picture appears when differentiating by project type – with differences between 18 and 24 percentage points between the responses from the different project types (see Table 162): the most distinct effects are shown for T&N projects which rank high on interest in
European issues (56% increase), support for disadvantaged people (45%) and commitment against discrimination, intolerance, xenophobia or racism (42%); the increase in participation in societal and/or political life (37%) reflects the average;
EVS shows a relatively high increase for interest in European issues (56%), but a relatively low increase for participation (25%); this is surprising since EVS participants often are placed in civil society organisations – this needs to be explored further through qualitative methods;
SD projects show a relatively high increase for participation of young people (49%) and support for disadvantaged people (44%);
TCP activities show a relatively high increase for interest in European issues (56%) and are within average for the other items;
YD projects show a relatively low increase for the commitment against discrimination, intolerance, xenophobia or racism (22%) and the support of people with fewer opportunities (26%); this is surprising since these are issues related to democracy which is at the core of this project type; these results require further exploration through qualitative methods;
YI projects show a relatively low increase for interest in European issues (38%) – which could be expected but also reflects the challenge for these projects to include a European dimension;
YE projects show an average increase for all items and slightly less for youth participation – the latter reflecting a challenge for YE project organisers.
Transnational Analysis 2011
Helmut Fennes with Susanne Gadinger and Wolfgang Hagleitner 75
Again, these effects reported by the participants are partly confirmed by the observations and perceptions of project leaders, in particular with respect to an increased interest in European issues and increased participation in public life (see Table 174). It is remarkable that participants in T&N report the largest effects across all items related to the permanent priorities. This could be linked to the fact that these projects have a clearly educational dimension and are designed and implemented accordingly. A differentiation between the effects on the ‘sending’ and on the ‘hosting’ side, indicates the following outcome (see Table 163): significantly more ‘sending’ participants report an increase for interest in European issues
than ‘hosting’ participants – which confirms the challenge to introduce a European dimension for those ‘staying at home’;
the increase of commitment against discrimination, intolerance, xenophobia or racism is significantly higher (very significant) for ‘sending’ participants than for ‘hosting’ participants; an explanation could be that it is more difficult to take a stand against discrimination in one’s own than in a foreign environment due to peer pressure, less anonymity and potentially on-going exposure and confrontation;
the increase of participation is reported to be highly significantly higher for ‘hosting’ participants than for ‘sending’ participants, presumably due to stronger involvement in the preparation and organisation of the project – thus reflecting participation.
Specific aspects of European citizenship A separate question addressed specifically effects related to selected aspects of European citizenship (see Table 167, Table 168): 80% of the responding participants indicate that the participation in the project has made
them ‘more receptive for Europe’s multiculturality’ (47% ‘definitely’, 33% ‘to some extent’), thus developing intercultural competence; in particular participants in YE, EVS and T&N projects have reported this (86% to 88%);
81% report that the project has raised their awareness of European values (human rights, democracy, peace, tolerance, gender equality etc.)’, which basically represent core values related to democratic citizenship; in particular participants in YE, EVS and T&N projects have reported this (83% to 86%)
66% report that they ‘feel more as a European’ (36% ‘definitely’, 30% ‘to some extent’) – thus assuming a supra-national identity linked to European citizenship; in particular participants in YE an T&N projects have reported this (71% to 72%);
68% indicate that the project has raised their awareness of disadvantaged people – which is linked to the priority on the inclusion of young people with fewer opportunities; in particular participants in EVS, T&N and SD projects have reported this (72% to 75%).
The participants’ responses on their increased receptiveness of multiculturality and European identity are confirmed by observations and perceptions of the project leaders (see Table 173). The percentages of ‘sending’ participants reporting an increased intercultural receptiveness, a raised awareness of European values or a stronger European identity is higher than the respective percentages ‘hosting’ participants (highly significant difference; see Table 169). This indicates that the European citizenship tends to be fostered more strongly by an experience in another country.
Research-based Analysis of Youth in Action
76 Helmut Fennes with Susanne Gadinger and Wolfgang Hagleitner
Image of the European Union Indirectly linked to the objectives and priorities on promoting European citizenship is the question on the effects of the project on the image of the European Union (see Table 152): for more than one quarter of the participants the image of the European Union has improved (28% of the participants in non-RAY countries, including from outside the European Union); for more than 70% the image has not changed, and for around 1% it has become worse. For YD projects the improvement of the image of the European Union is the highest (44%, see Table 153) which suggests that in these projects the positive aspects of the European Union are promoted more strongly, but it also needs to be considered that the sample for this project type is relatively small. For YE, T&N and TCP activities the improvement is above average, for YI, EVS and SD projects the improvement is around or below average – with SD projects having the lowest percentage (22%). The latter suggests that SD projects lead to a more critical view of the European Union than the other project types. The improvement of the image of the European Union is very diverse in different countries: between 38% in the Netherlands and 16% in Austria (but it needs to be considered that the samples for these countries are relatively small). Relatively high is the improvement also in Bulgaria (33%) and Sweden (31%), and above average in Poland and Hungary (see Table 154). No real pattern can be recognised and therefore a deeper analysis would need to be undertaken at national level, taking into consideration national policies and data on the image of the EU in the respective countries. While an improvement of the image of the European Union reported by a quarter of the participants could be considered minimal, it needs to be understood in perspective: on the one hand, this improvement results also from projects with a relatively short duration of intensive experiences (sometimes only a few weeks); on the other hand, there is no data about the image of the participants of the European Union prior to their project experience. As for the latter, in autumn 2010 (the period around which most of the projects surveyed ended) 38% of the Europeans report that they have a positive image of European Union, 40% a neutral image and 20% a negative image (see European Commission, 2011, p. 46). A comparison by country shows that the image of the European Union is generally better the later the country joined the European Union (see European Commission, 2011, p. 47). On the other hand, the improvement of the image of the European Union as an effect of YiA projects does not indicate such a correlation (see Figure 3). Further studies would be needed to explore to what degree the YiA participants were representative in this respect before the project and how the improvement is distributed over the three groups (positive, neutral, negative) shown in the Eurobarometer survey.
Transnational Analysis 2011
Helmut Fennes with Susanne Gadinger and Wolfgang Hagleitner 77
8.3 Other effects on participants The survey also revealed a number of effects which are not included (or at least not prominently) in the YiA objectives and priorities, e.g. effects related to international mobility and contacts, professional and educational pathways or personal development. Effects on international contacts and mobility The effects on international contacts and mobility reported by participants are considerable (see Table 167; Table 168) and might also contribute to participation and professional development: 81% of the participants indicate that they got to know people from other countries with
whom they are still in touch (60% ‘definitely’, 21% ‘to some extent’); the highest percentages can be observed for participants in YE, EVS and T&N projects (92% to 97%);
77% of the participants report that they now feel more confident to move around on their own in other countries (46% ‘definitely’, 31% ‘to some extent’) – which also reflects an increased intercultural competence as well as an increased potential for mobility; the highest percentages are shown for participants in YE and EVS projects (85% and 93% respectively);
60% of the participants express that they have established contacts with people in other countries which are useful for their involvement in social or political issues (28% ‘definitely’, 30% ‘to some extent’); the highest percentages appear for participants of T&N and TCP activities (77% and 82% respectively); interestingly, YI, YD, EVS and SD projects show percentages below average although they are aimed to imply or foster social or political participation;
59% of the participants indicate that they have established contacts with people in other countries which are useful for their professional development (30% ‘definitely’, 29% ‘to some extent’); also here, the highest percentages appear for participants of T&N and TCP activities (81% and 90% respectively), thus indicating that these projects contribute (as intended) to international networking for youth workers and youth leaders.
Overall, YE and T&N projects – the classic project types for international youth mobility – show percentages above (or on) average for all four items, while YI, YD and SD projects show percentages (considerably) below average. EVS projects show percentages above as well as below average. For all four items, the percentage of ‘sending’ participants responding positively (‘definitely’ or ‘to some extent’) is higher than the respective percentage of ‘hosting’ participants (highly significant differences; see Table 169). This shows that effects related to international contacts and mobility are more likely for those who have an experience in another country – an international mobility experience. Effects on project management competence A remarkable side effect of YiA projects is that the participants develop project management competence – which is related to the key competence ‘Sense of Initiative and Entrepreneurship’: 78% of the participants indicate that they have ‘learned better how to plan and organise a project’ (see Table 167). Observably, participants are – more or less – actively involved in the preparation and implementation of their projects and thus learn by doing. This suggests that the project organisers take – at least to some degree – a participatory approach in preparing and organising their projects. This is also supported by the responses to another question where 84% of the
Research-based Analysis of Youth in Action
78 Helmut Fennes with Susanne Gadinger and Wolfgang Hagleitner
participants indicate that they could contribute with their views and ideas to the development and implementation of the project (see Table 138). There are moderate differences in this respect between the different project types (see Table 168), the highest percentage shown for YI projects (88%) which specifically are intended to be organised by young people themselves, and the lowest percentages shown for YD projects (73%) and EVS projects (70%) – which is rather surprising since YD projects should especially take a participatory approach, and EVS projects normally imply working in a project; but on the other hand not necessarily taking a participatory approach in developing and implementing the EVS project itself. The proportion of ‘hosting’ participants reporting a development of project management competence is higher than the respective proportion of ‘sending’ participants (highly significant difference; see Table 169). This is most likely caused by a greater involvement of ‘hosting’ participants in the preparation and organisation of the project – which would also explain the relatively low percentage of EVS participants – who can only be ‘sending’ participants. Effects on educational and professional pathways The responses by the participants indicate that participation in the project resulted for a large majority in more clarity, self-confidence, intentions or plans with respect to their educational and professional development (see Table 170): 82% of the respondents plan to engage in further education and training (39% ‘definitely’,
43% ‘to some extent’); even more (84%) intend to develop their foreign language skills (39% ‘definitely’, 45% ‘to some extent’) – not necessarily through (traditional) continuing education and training courses, but also through informal and non-formal learning;
64% got a clearer idea about their further educational pathways (33% ‘definitely’, 31% ‘to some extent’);
75% intend to go abroad for work, studies, an internship or to live there – thus their educational and work mobility has increased (35% ‘definitely’, 39% ‘to some extent’);
69% believe that their job chances have increased (34% ‘definitely’, 35% ‘to some extent’) which does not necessarily mean that they have increased, but that at least the self-confidence of the participants did;
66% have a clearer idea about their professional career aspirations and goals (34% ‘definitely’, 32% ‘to some extent’).
The respective perceptions expressed by the project leaders largely confirm these results – in fact, the percentages of positive responses by the projects leaders are higher for all items (see Table 173). On the other hand, the questions to participants are more direct (‘I intend/am planning to …’), while the questions to the project leaders are somewhat weaker (‘are readier/better prepared to …’). For EVS projects the percentages are above average for all items (partly considerably); for T&N projects this the case for most items except for working or studying abroad where the percentage is below average, but maybe they intended this already before the project. For YD projects the percentages are (considerably) below average for all items. TCP activities are somewhere in between, showing percentages above average with respect to clearer ideas about professional development, perceived increased job chances and planning further education and training. A similar pattern appears for YI projects, but less distinct. SD projects tend to show the weakest effects in this respect, with percentages around or below average for all items, the latter in particular with respect to international mobility and language learning (see Table 171).
Transnational Analysis 2011
Helmut Fennes with Susanne Gadinger and Wolfgang Hagleitner 79
These results are largely confirmed by the perceptions of project leaders, but with some shifts: for EVS projects, the percentages of positive responses is higher for project leaders (again suggesting that EVS participants are more critical about the effects of the projects), while for T&N projects it is the reverse (suggesting that project leaders are more critical about the participants’ development – and/or that the participants might be overestimating their development). Not surprising is that ‘sending’ participants are more likely to plan developing foreign language skills or working/studying abroad than ‘hosting’ participants (highly significant difference; see Table 172). Nevertheless, these intentions seem to be sustainable since the survey took place three to nine months after the end of the project. Effects on personal development While ‘personal development’ is not mentioned explicitly as an objective in the formal decision on the YiA Programme, it is addressed implicitly in the general and specific objectives of the programme. This is reflected in the Programme Guide, which makes frequent explicit reference to ‘personal development’. In this respect, the survey also analysed effects on participants’ personal development. 92% of the respondents report that the participation in the project has contributed to their personal development (67% ‘definitely’, 25% ‘to some extent’; see Table 167). The highest percentage can be observed for EVS projects (97%) while the percentage for YD projects is relatively low (73%). The respective percentages for the other project types are approximately or above average (see Table 168). Furthermore, ‘sending’ participants are more likely to report personal development than ‘hosting’ participants (see Table 169). This is, in general, confirmed by the project leaders who observed that 91% of the participants ‘became more self-confident and gained personal orientation’ (62% ‘very true’, 29% ‘somewhat true’; see Table 173). Nevertheless, there is little difference between the project types – just three percentage points (see Table 174), which indicates that project leaders take a more optimistic view with respect to YD projects. Further analysis with qualitative methods would be beneficial in this respect. In more detail, the participants noted that they have become more self-confident (49%), that they can deal better with new situations (49%), that they learned more about themselves (42%), almost 50%), that they can now express their thoughts and feelings (30%), that they are more self-reliant (31%), that they can deal better with conflicts (22%) and that they can better empathise with others (21%). 9% indicate that they did not note any particular effect. On average, the participants ticked two to three of these items (a maximum of three answers was possible) – this highlights that the participants clearly perceived development related to a number of personality aspects. A differentiation by project types shows – a similar pattern for other effects (see Table 183): YE projects are about average for all items; as are YI projects, but with more variation on
either side; T&N are also mostly about average, with a lower percentage reported for becoming more
self-reliant – but these participants are on average older and thus adults with a more than likely higher level of self-reliance from the outset;
EVS projects show partly very high and partly rather low percentages – the EVS experience is different in that it provides for a more continuous long-term experience
Research-based Analysis of Youth in Action
80 Helmut Fennes with Susanne Gadinger and Wolfgang Hagleitner
where personal development might be more reflected upon and the self-assessment could be more critical;
YD, SD and TCP are more specialised, with some items above average but more below average; YD projects show relatively high percentages on conflict competence and self-reliance, SD projects on self-confidence and expressing thoughts and feelings, and TCP activities on learning about oneself (which is related to pedagogical competence).
Overall, it can be said that YiA projects considerably contribute to personal development of the participants – which confirms that a sometimes explicit and sometimes implicit objective of most youth exchanges and international youth projects is being achieved.
8.4 Effects on project leaders/team members Project leaders also report, that their involvement in the project had effects on them personally, in particular: on the development of key competences; with respect to European citizenship; on their ideas, plans and intentions for their professional and educational pathways; and on their involvement in the youth field. This reflects work-related learning or ‘workplace learning’, considering that designing, preparing and implementing a YiA project is ‘work’, even if it is done on a voluntary basis, and that spaces where this work takes place are ‘workplaces’ of youth workers and youth leaders. These effects – to a large extent personal and professional development of the youth workers and youth leaders involved in the projects in an educational and/or organisational function (see also section 0 and Table 93) – contribute to the development of youth structures, which in turn contributes to the objectives of the YiA Programme. This aspect of the effects of YiA projects should however be explored in more detail. Competence development of project leaders Project leaders were asked if their key competences developed as an effect of their involvement in the projects, using the formal terminology of the European reference framework for key competences for lifelong learning (see European Parliament and Council, 2006b) rather than indicators for knowledge, skills, attitudes and values as they were used for the participants survey. Since these terms are more abstract they might be interpreted slightly differently than defined in the European reference framework, but it can be assumed that the general concepts were grasped as defined. As for the project leaders’ assessment of the participants’ competences, some key competence domains combining sub-competences were split up accordingly into two or three items (see Table 158). The competence development reported by the project leaders shows a similar pattern as their assessment of the competence development of the participants (see section 8.1, Table 156, Table 158): large majorities of project leaders report that they have developed interpersonal and social competences (94%; 60% ‘very true’, 34% ‘somewhat true’), intercultural competence (92%; 63% ‘very true’, 29% ‘somewhat true’), sense of initiative (90%; 57% ‘very true’, 33% ‘somewhat true’), communication in a foreign language (84%; 56% ‘very true’, 28% ‘somewhat true’), civic competence (82%; 42% ‘very true’, 39% ‘somewhat true’), cultural awareness and expression (80%; 47% ‘very true’, 33% ‘somewhat true’) and sense of entrepreneurship (72%; 40% ‘very true’, 32% ‘somewhat true’). This shows a more distinct development observed by the project leaders for the participants than for themselves (more indications of ‘very true’). In particular, this is the case for learning competence (‘learning to learn’): a reason could be that ‘work-related learning’ in YiA projects is not so much reflected by project leaders since it is not an explicit YiA objective and thus not in
Transnational Analysis 2011
Helmut Fennes with Susanne Gadinger and Wolfgang Hagleitner 81
the focus of project leaders; therefore, it is suggested to include reflection of the learning of project leaders (individually and in teams) in the project process. For sense of entrepreneurship and mathematical competence, the self-assessment of project leaders shows a higher percentage than their respective assessment for participants: this indicates a specific development of these competences resulting from the project development and management, including the challenges resulting from financing, budgeting and reporting requirements. It should be further explored to what extent the project leaders’ assessment of the effects on participants is linked to the respective self-assessment, e.g. in how far this reflects a projection of project leaders on participants. Similar to the participants, more ‘hosting’ project leaders than ‘sending’ project leaders report a development for most key competences, in particular for communication in the first language (mother tongue), digital competence, sense of entrepreneurship and media literacy (highly significant differences for all), for mathematical competence and for interpersonal and social competences (very significant difference for both), and for sense of initiative (significant difference). Only for communication in a foreign language more ‘sending’ than ‘hosting’ project leaders report a development (highly significant difference) – which is comprehensible (see Table 160). Overall, this reflects the stronger involvement of ‘hosting’ project leaders in the development and implementation of the projects, thus resulting is a higher degree of ‘work-related learning’). A similar pattern (with some exceptions) for the participants’ assessment appears when differentiating by project types (see Table 159): YE projects show average percentages across most competences, except for foreign
language competence and intercultural competence which are above average; YI projects show the broadest scope of competence development, except on foreign
language competence and intercultural competence which is comprehensible since these projects do not necessarily imply an intercultural or foreign language experience); probably because in this case the project leaders are at the same time participants – YI projects are self-organised activities;
YD projects show relatively high percentages for foreign language competence, interpersonal, social, intercultural and civic competences, but relatively small percentages for all other competences; this indicates that YD projects are very focussed on the specific objective of this (sub-)Action, and that this is also very effective for project leaders’ development of social, intercultural and civic competences;
EVS projects show an average percentage across most competences, except for digital competence and mathematical competence which are above average (possibly EVS project leaders are involved more strongly in the organisational and administrative tasks of the project) and percentages below average for social and civic competences (EVS project leaders tend to be experienced with personnel management and work in civil society organisations);
Research-based Analysis of Youth in Action
82 Helmut Fennes with Susanne Gadinger and Wolfgang Hagleitner
T&N projects show average percentages across most competences, except for above average percentages for foreign language competence (seemingly working in a foreign language in a training activity is more demanding and intensive than in other projects) and for learning competence (clearly because project leaders in training activities are required to reflect more about learning as trainers/facilitators);
SD projects show a relatively high percentage for civic competence – being the focus of this sub-Action – but around or below average for all other competences, partly considerably below average (e.g. foreign language competence, intercultural competence or cultural awareness and expression are developed much less than in other actions); this should be further analysed since the structured dialogue could include more intensively an intercultural and cultural dimension.
Effects related to European citizenship Similar to participants, project leaders report that they experienced effects with respect to aspects related to European citizenship: 88% indicate that they have become more receptive to Europe’s multiculturality’ (51% ‘very true’, 37% ‘somewhat true’); 84% are now more interested in European topics (41% ‘very true’, 43% ‘somewhat true’); 77% now ‘feel more European’ than before the project (36% ‘very true’, 41% ‘somewhat true’), thus expressing an increased European identity; and 75% (34% ‘very true’, 41% ‘somewhat true’) say that they are now ‘more strongly involved in social and/or political life’, thus expressing an increased participation in society. Only for the project leaders’ participation in social and/or political life a significant difference between ‘sending’ and ‘hosting’ can be observed, with ‘hosting’ showing a higher percentage than ‘sending’. Otherwise no significant differences are shown, indicating that these aspects of European citizenship are developed independent from the ‘sending’/’hosting’ perspective. A comparison between project types provides a differentiated picture (see Table 178): YD and SD projects showing higher and YI projects showing lower percentages for an
increased interest in European topics; YE projects showing a higher and YI projects showing a lower percentage for ‘feeling
more European’; YE, YD and EVS projects showing higher and SD projects showing lower percentages
for an increased receptiveness for Europe’s multiculturality; YD projects showing a higher and EVS projects showing a lower percentage for a
stronger involvement in social and/or political life; T&N projects show percentages between the extremes and around average.
This indicates that all project types contribute more or less to European citizenship, although in different forms. When comparing the effects on project leaders with those on participants, the project leaders’ self-assessment with respect to ‘feeling European’ and receptiveness for multiculturality shows higher percentages than the self-assessment of the participants. This is remarkable, since it suggests that these aspects of a YiA priority are developed more widely for project leaders than for the primary target group – the participants. A differentiation by country of residence shows a partly diverse and heterogeneous picture for which no pattern can be recognised: ‘feeling more European’ shows percentages between 86% (somewhat/very true) for Bulgaria and 68% for the Czech Republic; more receptiveness for Europe’s multi-culturality shows percentages between 93% for the Czech Republic and 78% for
Transnational Analysis 2011
Helmut Fennes with Susanne Gadinger and Wolfgang Hagleitner 83
Estonia; increased interest in European topics shows percentages between 93% for Finland and 80% for Germany; a stronger involvement in social and/or political life shows percentages between 84% for Poland and 61% for Sweden. This would need to be analysed more in-depth in view of the national political, social and economic realities in the respective countries. Effects on educational and professional pathways Similar to the participants, but less distinct, the majority of project leaders also report that the project had an effect on their ideas and intentions concerning their educational and professional pathways (see Table 177): 75% are now ‘planning to engage in further education and training’ (41% ‘very true’, 33% ‘somewhat true’); 72% indicate that they are ‘more prepared to study, work or live in another country’ (34% ‘very true’, 38% ‘somewhat true’); 58% say that they now have a clearer idea about their educational path; 63% have a clearer idea about their professional career aspirations and goals (29% ‘very true’, 34% ‘somewhat true’); and 61% believe that their job chances increase (27% ‘very true’, 34% ‘somewhat true’), which indicates that (international) project experience is considered to be an asset for employability. Overall, these responses suggest that the involvement in YiA projects results in a reflection of the project leaders concerning their further educational and professional development, and, furthermore, in actually planning further education. With respect to these effects, the self-assessment of the project leaders is around 5 percentage points below the self-assessment of the participants, which can be explained by differences in age, educational and professional situations, project leaders on average being older, with higher educational attainment and more likely being in paid work. When comparing the responses by project type, a very diverse picture appears (with differences between at 20 and almost 40 percentage points between positive responses), confirming on one hand that there are differences between the project types with respect to the educational and professional backgrounds of project leaders, but also still suggesting different effects depending on the project types (see Table 178): the highest percentages of positive responses across almost all items can be observed for YI and T&N projects, indicating the strongest effect of these two project types on the educational and professional development of project leaders, thus (young) adults involved in youth work; only with respect to international mobility YI projects rank lowest due to the lack of international exposure in most of these projects. The lowest percentages across all other project types can be observed for YD projects, suggesting that either these projects do not stimulate reflection and planning on educational pathways or – more likely – that these project leaders are more established and secure with respect to their educational and professional careers and that, therefore, these projects are more professionalised. Overall, more ‘hosting’ project leaders indicate a positive effect on their educational and professional development (significant difference only for increased job chances), except for the preparedness for study/working/living abroad for which more ‘sending’ project leaders indicate a positive effect (very significant difference; see Table 179). A partly very diverse and heterogeneous picture appears when comparing the responses by country of residence (see Table 180). E.g., Slovakia ranks high for preparedness for international mobility (79%) while Germany ranks low (62%); furthermore, percentages for Bulgaria related to the other items rank relatively high and for Germany relatively low. Overall, no pattern can be observed. A more detailed analysis would need to consider national political, social and economic realities.
Research-based Analysis of Youth in Action
84 Helmut Fennes with Susanne Gadinger and Wolfgang Hagleitner
8.5 Effects on organisations and local environments Effects on organisations, groups and bodies involved in the projects On the one hand, effects on organisations, groups and bodies involved in YiA project become apparent through the competence development of the project leaders described above (see section 0) who apply the acquired knowledge, skills, attitudes and values in their work with young people for the organisations they are involved in. This is also the case for youth workers and youth leaders taking part in T&N projects or in TCP activities which aim at developing competences for international/European youth work among youth workers and youth leaders as well as at developing contacts, networks and projects involving youth organisations/groups/ bodies in different countries. In this respect, participants in T&N projects and TCP activities indicate that they have learned something which is useful for youth work in general or for developing and implementing (international) youth projects. At least 62% and up to 92% of the respondents indicate agreement (‘definitely’ or ‘to some extent’) with each of the items related to this issue (see Table 181): more than 80% have already applied what they learned during the project in their work with young people (when the survey took place, thus within 3 to 9 months after the end of the project), and more than 90% of the respondents indicate that they learned something they intend to use in their work with young people. The most distinct effect is related to the pedagogical competence of the participants, with around 88% of the respondents reporting that they now better understand the concept of non-formal education and learning and how to foster non-formal learning in youth work; Similarly, distinct effects can be observed with respect to the capacity to develop and implement international youth projects: more than 85% report that they have learned better how to develop and implement an
international youth project and that they are now more committed to the inclusion of an international dimension in their work with young people;
more than 80% indicate to have established contacts with youth workers in other countries who they intend to develop projects with, and more than 75% indicate that they got involved in partnerships or networks providing opportunities for future cooperation in the youth field;
around 80% indicate that they now are better equipped to assure the quality of a youth project;
more than 63% say that are now better able to acquire financial support for activities involving young people.
Less distinct are effects with respect to a better knowledge and understanding of youth policies: around 76% of the responding T&N participants indicate that they now know more about the content of youth policies, and 69% understand better how youth policies are developed. Less than 10% indicate that their participation in the YiA project had no effect on their work in the youth field Participants in T&N projects and TCP activities were also asked directly about the effects of their participation in the YiA project on their organisations, groups and bodies. In this respect, similar effects are reported as for the effects on the T&N/TCP participants themselves (see Table 184): more international contacts, partnerships and projects as well as increased project management
Transnational Analysis 2011
Helmut Fennes with Susanne Gadinger and Wolfgang Hagleitner 85
competence. Furthermore, they report effects on their organisations/groups/bodies, which could also be observed in general for participants in YiA projects: more intensive involvement in European issues; increased appreciation of cultural diversity; increased commitment to the inclusion of young people with fewer opportunities; increased promotion of participation of young people in the organisations, and a strengthened network with local structures. On average, around 70% report positive effects for these items (‘definitely’ and ‘to some extent’), with higher percentages for T&N participants than for TCP participants (see Table 184), pointing to a stronger focus of T&N projects on the development of the organisations of the participants and at stronger links between T&N participants and their organisations or groups. Overall, it can be said that T&N projects and TCP activities have considerable effects on the participants, in particular also in line with YiA objectives, and subsequently on the organisations, groups and bodies which these participants are involved in. On the other hand, also project leaders (of all project types) report that the YiA projects had an effect on their organisations, groups or bodies (see Table 185, Table 189), such as an increased appreciation of cultural diversity (88% positive responses – 64% ‘very true’, 25% ‘somewhat true), an increased promotion of the participation of young people in the organisations (88%; 58% ‘very true’, 30% ‘somewhat true), more intensive involvement in European issues (78%; 41% ‘very true’, 37% ‘somewhat true) and an increase commitment to the inclusion of young people with fewer opportunities (71%; 41% ‘very true’, 30% ‘somewhat true) – these items reflecting the four permanent priorities of the YiA Programme. Furthermore, project leaders also report for their organisations an increased project management competence (88%, 59% ‘very true’, 29% ‘somewhat true ), more contacts/partnerships with other countries (87%), more international projects (81%) and a strengthened network with local structures (82%) – all of which is contributing to the development of the capacity of youth organisations/groups/bodies in organising international youth projects. ‘Hosting’ project leaders are more likely to report an increased project management competence for their organisations and a strengthened network with local structures (very/highly significant difference) – the first because the hosting partner has is more involved in project management, the latter because local networking is useful or even necessary for the hosting partner (see Table 188). On the other hand, ‘sending’ project leaders are more likely to report more international contacts/partnerships/projects (highly significant difference); this could be because the hosting partners are already better developed with respect to contacts/partnerships and had more international projects previously – leading to the belief that they cannot become more international – or because the hosting partners are more exhausted after the project and are more hesitant about future international projects. YD and T&N projects show the most distinct effects on their organisations, groups and bodies, except for strengthened networks, where SD projects show the highest percentage – a structured dialogue is obviously more likely to imply local networking (see Table 186). YI projects show the lowest percentages for more international contacts/partnerships/projects and for a more intensive involvement in European issues – the latter pointing out a challenge for this project type; SD projects show the lowest percentages for an increased appreciation of cultural diversity, an increased commitment to inclusion and an increased project management competence – the first and second are surprising since these YiA priorities should actually be promoted in SD projects, the latter indicating that SD projects are organised by already experienced project organisers. YE projects show percentages around or above average, underlining the ‘all-rounder’-quality of this project type. No vast differences between project types were observed with respect
Research-based Analysis of Youth in Action
86 Helmut Fennes with Susanne Gadinger and Wolfgang Hagleitner
to an increased promotion of the participation of young people in the organisations and concerning a strengthened network with local structures. A comparison between countries shows a diverse and heterogeneous picture with differences of up to 30 percentage points between countries (see Table 187).For example, there is quite a range on ‘no effects’, between 1% for Bulgaria and 16% for Poland (see Table 192). These effects would need to be analysed in-depth at national level. Effects on the community/local environment Project leaders were asked about the effects of the project on the community and local environment, i.e. if the local environment /community was actively involved in the project; the project was perceived as enrichment by the local environment /community; the local environment /community became more aware of the concerns and interests of
young people; the intercultural dimension was appreciated by the local environment /community; the local environment /community became more committed to the inclusion of young
people with fewer opportunities; the European dimension was received with interest by the local environment
/community; the local environment /community showed interest in similar projects in the future; the local environment /community expressed readiness to support similar activities in
the future. Overall, the effects on the community where the project was carried out were reported to be surprisingly high with respect to the issues addressed in the questionnaire (see Table 193): on average, 75% of the project leaders expressed agreement (‘somewhat true’ or ‘very true’) with the respective effects, and less than 10% of the project leaders did not notice any effect on the local environment/community (see Table 197, Table 198, Table 199). A large majority of project leaders express that the local community was actively involved in the project, that the project was perceived as enrichment by the local community, that the local community showed interest in similar projects in the future – and that the local community expressed interest to support similar activities in the future. Project leaders from the country of the hosting community showed significantly higher agreement with these effects than project leaders coming from other countries – but this could also be interpreted as optimistic. With respect to YiA objectives and priorities, a large majority of project leaders expressed that the local community appreciated the intercultural and European dimension of the project and that the local community became more aware of the concerns and interests of young people. Relatively low agreement amongst project leaders was found with the statement that the local community/environment became more committed to the inclusion of young people with fewer opportunities. This could also be because the respective local communities are already very committed to the inclusion of young people with fewer opportunities, but this is questionable and needs to be analysed in further studies. A differentiation by project types (using the sum of ‘somewhat true’ and ‘very true’) shows the following results (see Table 194):
Transnational Analysis 2011
Helmut Fennes with Susanne Gadinger and Wolfgang Hagleitner 87
Structured Dialogue projects rank high for being perceived as enrichment by the local community/environment which is also perceived by project leaders to be interested in similar projects in the future. This indicates an interest of local communities in exactly what the Structured Dialogue projects are about, namely an involvement of young people in political life. With a critical view this could also be considered as wishful thinking: this might be valid with respect to what is expressed explicitly by representatives of local communities, but it might also be a symbolic commitment based on opportunistic reasons. EVS projects rank high with respect to the involvement of the community in the project and concerning the interest in the European dimension of the project. This confirms that EVS volunteers have a strong link to the communities where they are active, and that they are considered to bring a European dimension to the community. Youth Exchanges are specifically appreciated for bringing an intercultural dimension to the local project environment (which indicates that a core characteristic of Youth Exchanges becomes visible in the local community), but at the same time they rank low for involving the local community in the project – a challenge for short-term projects with multilingual/multicultural groups. Youth initiatives rank high with respect to creating an awareness of the concerns and interests of young people, with contributing to the commitment of local communities to the inclusion of young people with fewer opportunities, and with contributing to an interest of local communities to support similar projects in the future. At the same time, youth initiatives rank low on contributing to an appreciation of an intercultural dimension of the project – on the one hand this is understandable in view of the nature of national youth initiatives with a limited intercultural dimension, but on the other hand it also suggests that youth initiatives with an intercultural dimension (involving young people with a migrant background) are not appreciated: this would imply that multiculturality/interculturality is appreciated as long as it is only a temporary feature. Youth Initiatives also rank low on contributing to an interest in the European dimension, which suggests that it is very difficult to give a European dimension to projects with no direct contact with people from other European countries – as it is the case for Youth Exchanges which rank very high on this issue. Youth Democracy projects rank mostly around or above average, but show a very low effect on local communities becoming more committed to the inclusion of young people with fewer opportunities: this should be looked into more in-depth (and with a greater sample of project leaders of such projects), because solidarity with those members of a community who are disadvantaged is a core value of modern democracy. Therefore, Youth Democracy projects should not really have less effect with respect to this issue on the local communities than all other project types. Training and networking projects seem to have the least effect on the local environments/communities, which indicates that they are more focussed on their strategic purpose – developing the quality of support systems of YiA – and only in a more indirect way are aimed at the political objectives of the YiA Programme. A differentiation by the project venue countries shows considerable differences of effects on the local communities for the different countries – up to 20% (see Table 195). In some countries (e.g. Sweden) relatively large effects were observed by the project leaders for the majority of items; in contrast to other countries (e.g. the Czech Republic), where relatively low effects were observed for the majority of items. Partly this might be for reasons which are linked to country-
Research-based Analysis of Youth in Action
88 Helmut Fennes with Susanne Gadinger and Wolfgang Hagleitner
specific socio-political conditions or traditions of youth work, but partly it is likely to be linked to the way in which YiA projects are implemented in the different countries – in particular if and how the local environment was involved in a project: this issue could be addressed in training and networking/TCP activities or meetings between National Agencies staff for an exchange of good practice.
Transnational Analysis 2011
Helmut Fennes with Susanne Gadinger and Wolfgang Hagleitner 89
9 Bibliography European Commission. (2004). Key competences for Lifelong Learning. A European Reference
Framework. Working Group Report. European Commission.
European Commission. (2010). Youth in Action Programme Guide. Retrieved from http://ec.europa.eu/youth/youth-in-action-programme/doc/how_to_participate/programme_guide_10/guide_en.pdf
European Commission. (2011). Eurobarometer 74. Public Opinion in the European Union - Autumn 2010. Retrieved from http://ec.europa.eu/public_opinion/archives/eb/eb74/eb74_publ_en.pdf
European Parliament. (2008). European Parliament resolution of 16 December 2008 on media literacy in a digital world (2008/2129(INI)). Retrieved from http://www.europarl.europa.eu/sides/getDoc.do?pubRef=-//EP//TEXT+TA+P6-TA-2008-0598+0+DOC+XML+V0//EN
European Parliament and Council. (2006a). Decision No. 1719/2006/EC of the European Parliament and of the Council establishing the “Youth in Action” programme for the period 2007 to 2013. Retrieved from http://eurlex.europa.eu/LexUriServ/LexUriServ.do?uri=OJ:L:2006:327:0030:0044:EN:PDF
European Parliament and Council. (2006b). Recommendation of the European Parliament and of the Council of 18 December 2006 on key competences for lifelong learning (2006/962/EC). Retrieved from http://eur-lex.europa.eu/LexUriServ/LexUriServ.do?uri=OJ:L:2006:394:0010:0018:EN:PDF
Fennes, H., Hagleitner, W. and Helling, K. (2011). Research-based Analysis of Youth in Action. Results from the first series of surveys with project participants and project leaders between October 2009 and June 2010. Transnational analysis. Innsbruck. Retrieved from http://dl.dropbox.com/u/45733110/projects/YiA/RAY/RAY_Transnational_Analysis_2010_doublepage.pdf
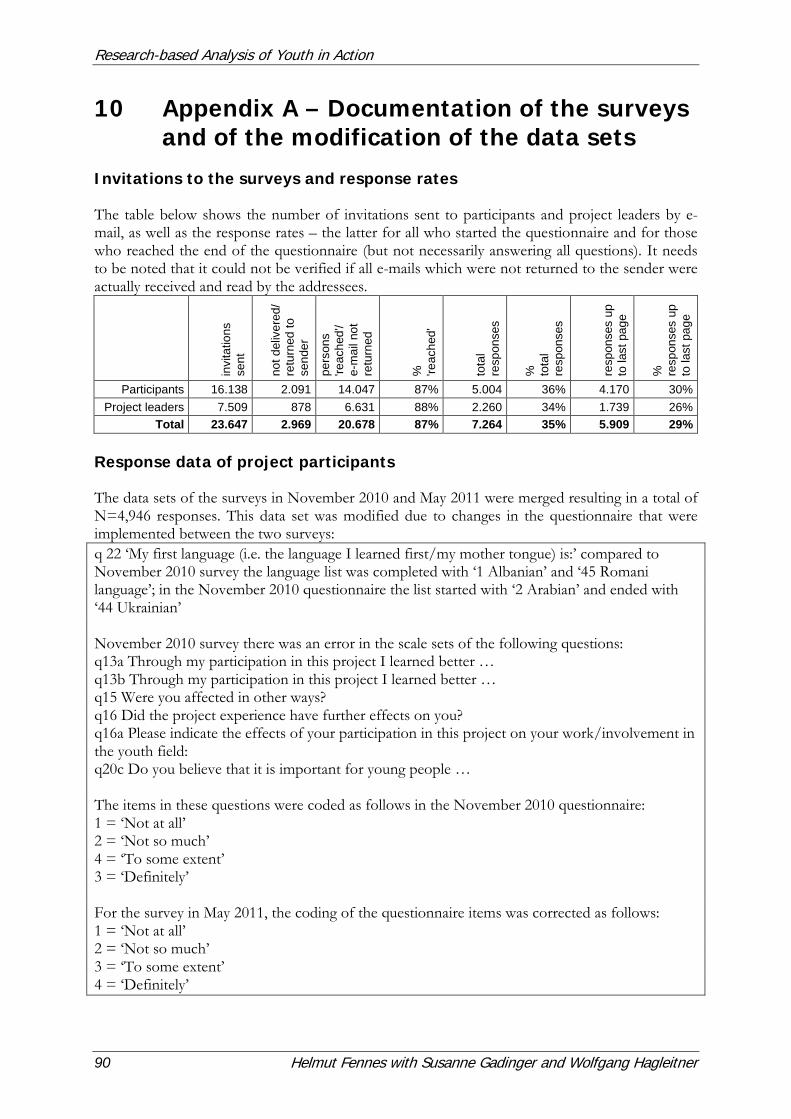
Research-based Analysis of Youth in Action
90 Helmut Fennes with Susanne Gadinger and Wolfgang Hagleitner
10 Appendix A – Documentation of the surveys and of the modification of the data sets
Invitations to the surveys and response rates The table below shows the number of invitations sent to participants and project leaders by e-mail, as well as the response rates – the latter for all who started the questionnaire and for those who reached the end of the questionnaire (but not necessarily answering all questions). It needs to be noted that it could not be verified if all e-mails which were not returned to the sender were actually received and read by the addressees.
invi
tatio
ns
sent
not d
eliv
ered
/ re
turn
ed to
se
nder
pers
ons
'reac
hed'
/ e-
mai
l not
re
turn
ed
%
'reac
hed'
tota
l re
spon
ses
%
tota
l re
spon
ses
resp
onse
s up
to
last
pag
e
%
resp
onse
s up
to
last
pag
e
Participants 16.138 2.091 14.047 87% 5.004 36% 4.170 30% Project leaders 7.509 878 6.631 88% 2.260 34% 1.739 26%
Total 23.647 2.969 20.678 87% 7.264 35% 5.909 29% Response data of project participants The data sets of the surveys in November 2010 and May 2011 were merged resulting in a total of N=4,946 responses. This data set was modified due to changes in the questionnaire that were implemented between the two surveys: q 22 ‘My first language (i.e. the language I learned first/my mother tongue) is:’ compared to November 2010 survey the language list was completed with ‘1 Albanian’ and ‘45 Romani language’; in the November 2010 questionnaire the list started with ‘2 Arabian’ and ended with ‘44 Ukrainian’ November 2010 survey there was an error in the scale sets of the following questions: q13a Through my participation in this project I learned better … q13b Through my participation in this project I learned better … q15 Were you affected in other ways? q16 Did the project experience have further effects on you? q16a Please indicate the effects of your participation in this project on your work/involvement in the youth field: q20c Do you believe that it is important for young people … The items in these questions were coded as follows in the November 2010 questionnaire: 1 = ‘Not at all’ 2 = ‘Not so much’ 4 = ‘To some extent’ 3 = ‘Definitely’ For the survey in May 2011, the coding of the questionnaire items was corrected as follows: 1 = ‘Not at all’ 2 = ‘Not so much’ 3 = ‘To some extent’ 4 = ‘Definitely’
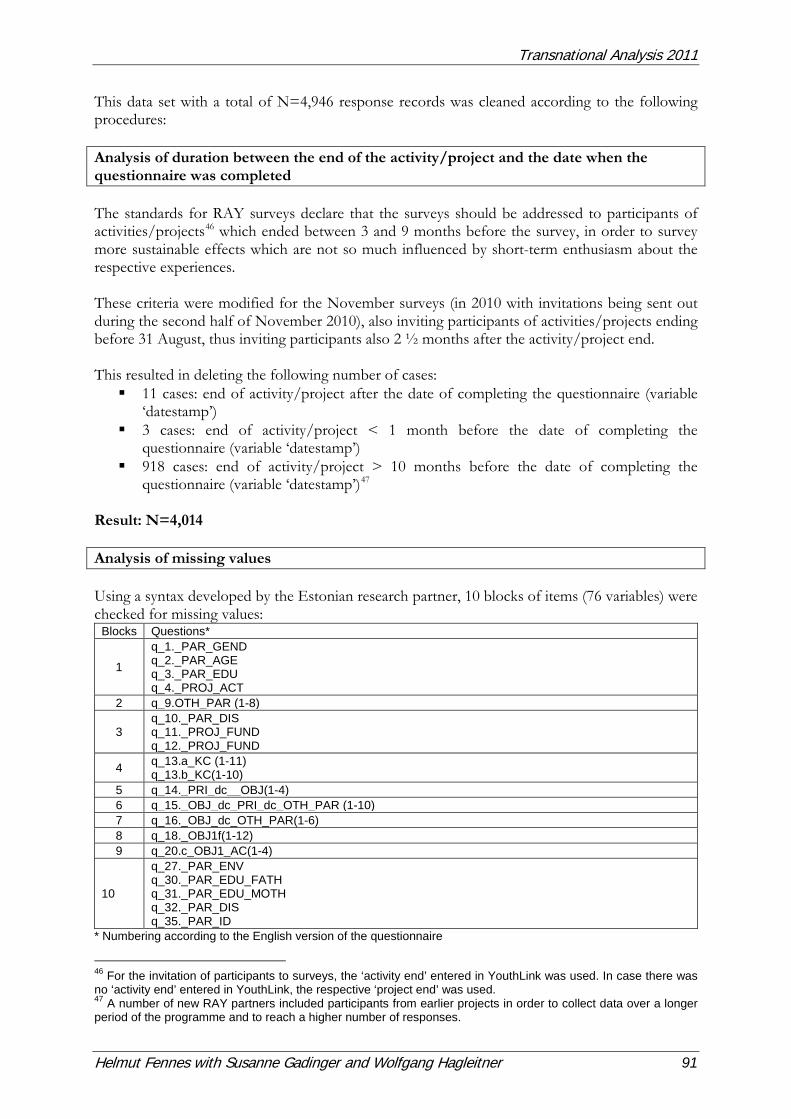
Transnational Analysis 2011
Helmut Fennes with Susanne Gadinger and Wolfgang Hagleitner 91
This data set with a total of N=4,946 response records was cleaned according to the following procedures: Analysis of duration between the end of the activity/project and the date when the questionnaire was completed The standards for RAY surveys declare that the surveys should be addressed to participants of activities/projects46 which ended between 3 and 9 months before the survey, in order to survey more sustainable effects which are not so much influenced by short-term enthusiasm about the respective experiences. These criteria were modified for the November surveys (in 2010 with invitations being sent out during the second half of November 2010), also inviting participants of activities/projects ending before 31 August, thus inviting participants also 2 ½ months after the activity/project end. This resulted in deleting the following number of cases: 11 cases: end of activity/project after the date of completing the questionnaire (variable
‘datestamp’) 3 cases: end of activity/project < 1 month before the date of completing the
questionnaire (variable ‘datestamp’) 918 cases: end of activity/project > 10 months before the date of completing the
questionnaire (variable ‘datestamp’)47 Result: N=4,014 Analysis of missing values Using a syntax developed by the Estonian research partner, 10 blocks of items (76 variables) were checked for missing values:
Blocks Questions*
1
q_1._PAR_GEND q_2._PAR_AGE q_3._PAR_EDU q_4._PROJ_ACT
2 q_9.OTH_PAR (1-8)
3 q_10._PAR_DIS q_11._PROJ_FUND q_12._PROJ_FUND
4 q_13.a_KC (1-11) q_13.b_KC(1-10)
5 q_14._PRI_dc__OBJ(1-4) 6 q_15._OBJ_dc_PRI_dc_OTH_PAR (1-10) 7 q_16._OBJ_dc_OTH_PAR(1-6) 8 q_18._OBJ1f(1-12) 9 q_20.c_OBJ1_AC(1-4)
10
q_27._PAR_ENV q_30._PAR_EDU_FATH q_31._PAR_EDU_MOTH q_32._PAR_DIS q_35._PAR_ID
* Numbering according to the English version of the questionnaire
46 For the invitation of participants to surveys, the ‘activity end’ entered in YouthLink was used. In case there was no ‘activity end’ entered in YouthLink, the respective ‘project end’ was used. 47 A number of new RAY partners included participants from earlier projects in order to collect data over a longer period of the programme and to reach a higher number of responses.
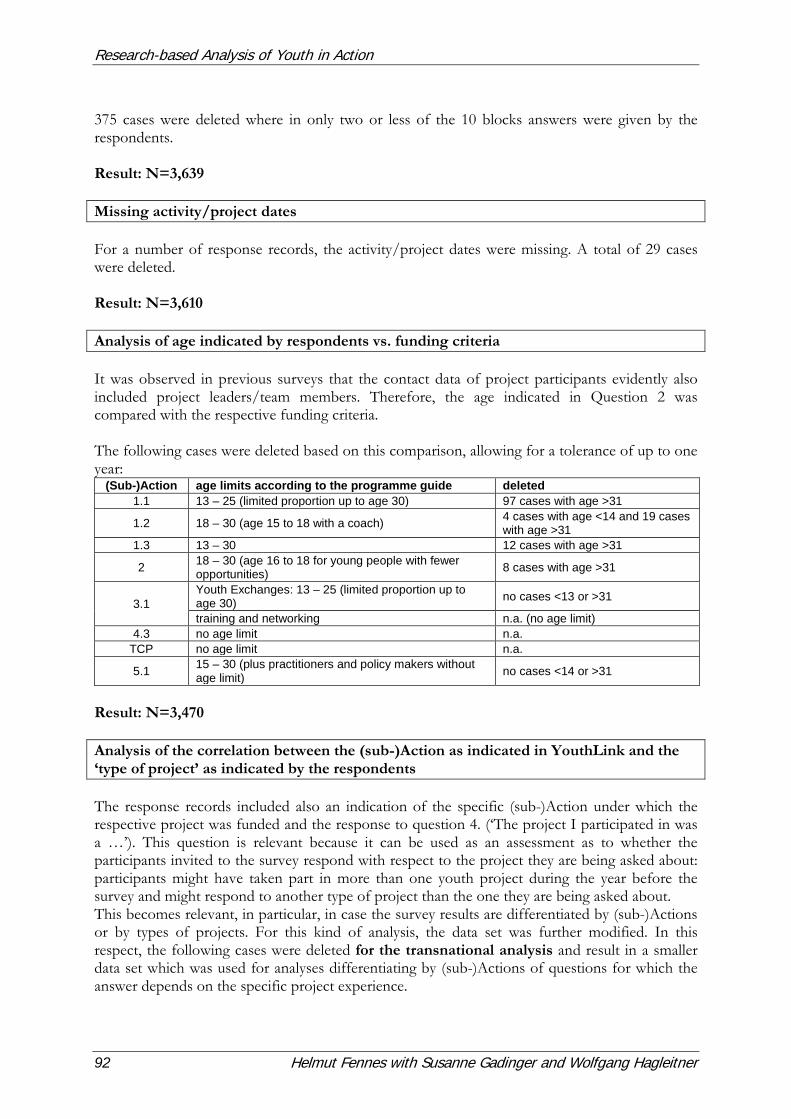
Research-based Analysis of Youth in Action
92 Helmut Fennes with Susanne Gadinger and Wolfgang Hagleitner
375 cases were deleted where in only two or less of the 10 blocks answers were given by the respondents. Result: N=3,639 Missing activity/project dates For a number of response records, the activity/project dates were missing. A total of 29 cases were deleted. Result: N=3,610 Analysis of age indicated by respondents vs. funding criteria It was observed in previous surveys that the contact data of project participants evidently also included project leaders/team members. Therefore, the age indicated in Question 2 was compared with the respective funding criteria. The following cases were deleted based on this comparison, allowing for a tolerance of up to one year:
(Sub-)Action age limits according to the programme guide deleted 1.1 13 – 25 (limited proportion up to age 30) 97 cases with age >31
1.2 18 – 30 (age 15 to 18 with a coach) 4 cases with age <14 and 19 cases with age >31
1.3 13 – 30 12 cases with age >31
2 18 – 30 (age 16 to 18 for young people with fewer opportunities) 8 cases with age >31
3.1 Youth Exchanges: 13 – 25 (limited proportion up to age 30) no cases <13 or >31
training and networking n.a. (no age limit) 4.3 no age limit n.a.
TCP no age limit n.a.
5.1 15 – 30 (plus practitioners and policy makers without age limit) no cases <14 or >31
Result: N=3,470 Analysis of the correlation between the (sub-)Action as indicated in YouthLink and the ‘type of project’ as indicated by the respondents The response records included also an indication of the specific (sub-)Action under which the respective project was funded and the response to question 4. (‘The project I participated in was a …’). This question is relevant because it can be used as an assessment as to whether the participants invited to the survey respond with respect to the project they are being asked about: participants might have taken part in more than one youth project during the year before the survey and might respond to another type of project than the one they are being asked about. This becomes relevant, in particular, in case the survey results are differentiated by (sub-)Actions or by types of projects. For this kind of analysis, the data set was further modified. In this respect, the following cases were deleted for the transnational analysis and result in a smaller data set which was used for analyses differentiating by (sub-)Actions of questions for which the answer depends on the specific project experience.
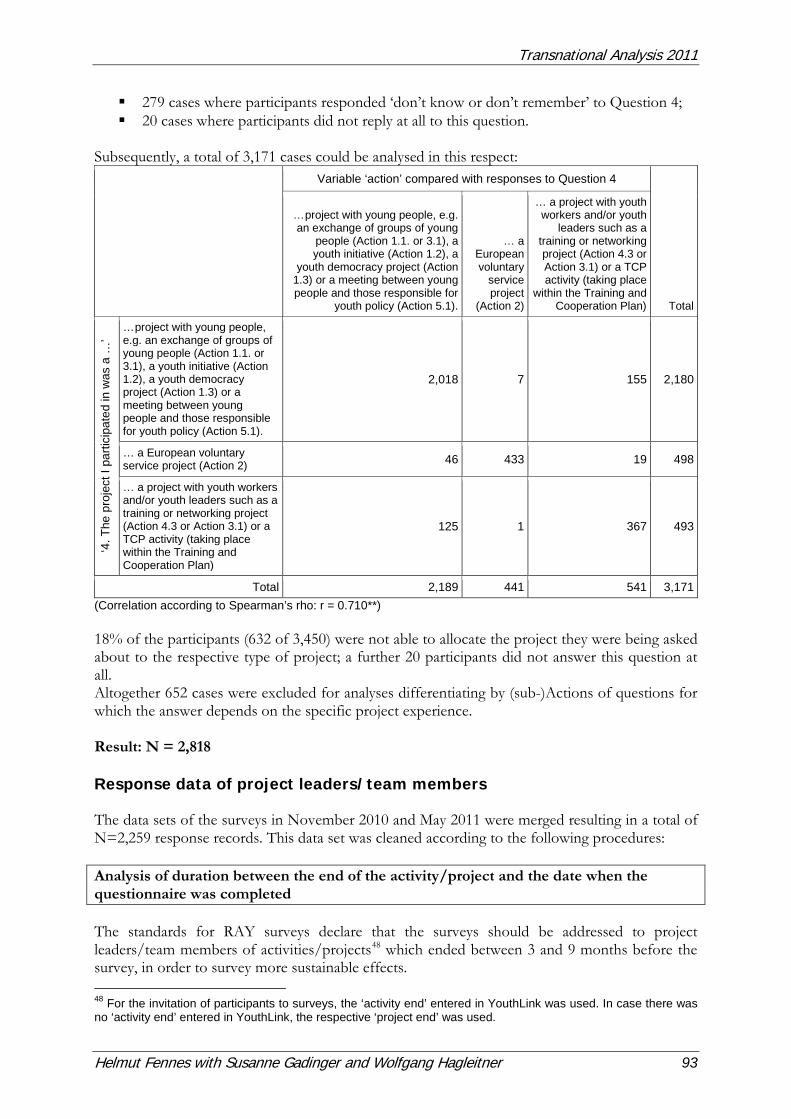
Transnational Analysis 2011
Helmut Fennes with Susanne Gadinger and Wolfgang Hagleitner 93
279 cases where participants responded ‘don’t know or don’t remember’ to Question 4; 20 cases where participants did not reply at all to this question.
Subsequently, a total of 3,171 cases could be analysed in this respect:
Variable ‘action’ compared with responses to Question 4
Total
… project with young people, e.g. an exchange of groups of young
people (Action 1.1. or 3.1), a youth initiative (Action 1.2), a
youth democracy project (Action 1.3) or a meeting between young people and those responsible for
youth policy (Action 5.1).
… a European voluntary
service project
(Action 2)
… a project with youth workers and/or youth
leaders such as a training or networking project (Action 4.3 or Action 3.1) or a TCP activity (taking place
within the Training and Cooperation Plan)
‘4. T
he p
roje
ct I
parti
cipa
ted
in w
as a
…’
… project with young people, e.g. an exchange of groups of young people (Action 1.1. or 3.1), a youth initiative (Action 1.2), a youth democracy project (Action 1.3) or a meeting between young people and those responsible for youth policy (Action 5.1).
2,018 7 155 2,180
… a European voluntary service project (Action 2) 46 433 19 498
… a project with youth workers and/or youth leaders such as a training or networking project (Action 4.3 or Action 3.1) or a TCP activity (taking place within the Training and Cooperation Plan)
125 1 367 493
Total 2,189 441 541 3,171 (Correlation according to Spearman’s rho: r = 0.710**) 18% of the participants (632 of 3,450) were not able to allocate the project they were being asked about to the respective type of project; a further 20 participants did not answer this question at all. Altogether 652 cases were excluded for analyses differentiating by (sub-)Actions of questions for which the answer depends on the specific project experience. Result: N = 2,818 Response data of project leaders/team members The data sets of the surveys in November 2010 and May 2011 were merged resulting in a total of N=2,259 response records. This data set was cleaned according to the following procedures: Analysis of duration between the end of the activity/project and the date when the questionnaire was completed The standards for RAY surveys declare that the surveys should be addressed to project leaders/team members of activities/projects48 which ended between 3 and 9 months before the survey, in order to survey more sustainable effects. 48 For the invitation of participants to surveys, the ‘activity end’ entered in YouthLink was used. In case there was no ‘activity end’ entered in YouthLink, the respective ‘project end’ was used.
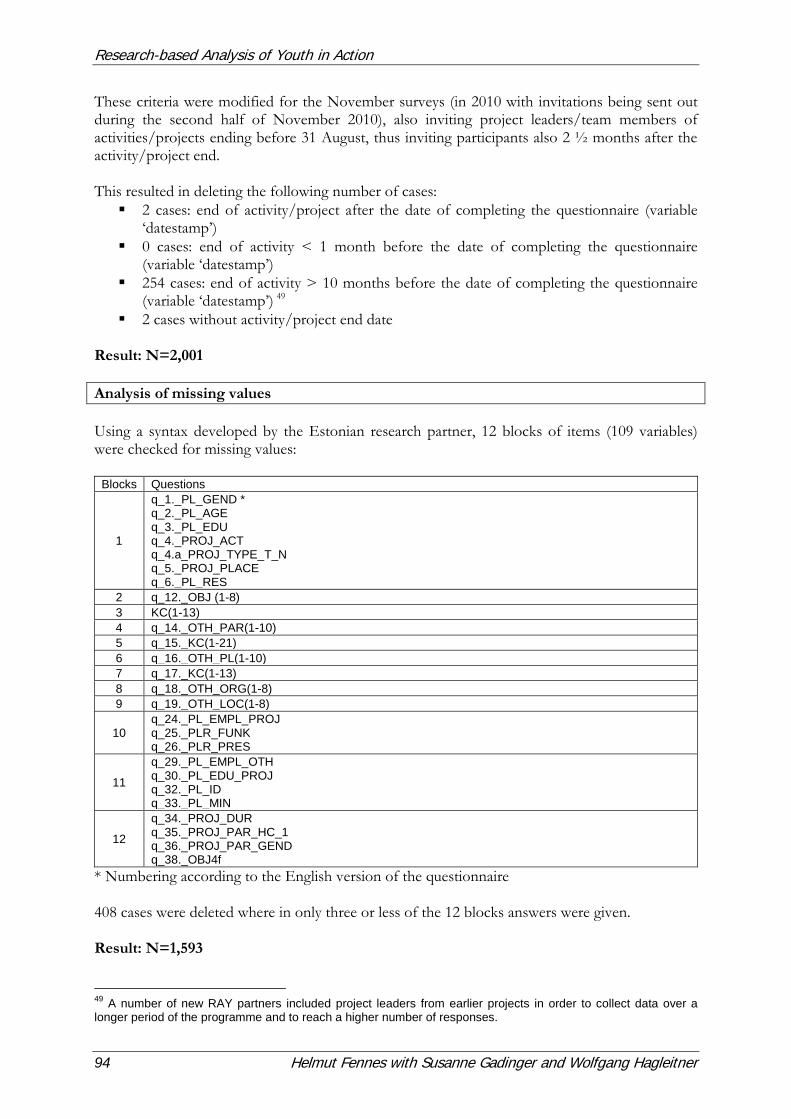
Research-based Analysis of Youth in Action
94 Helmut Fennes with Susanne Gadinger and Wolfgang Hagleitner
These criteria were modified for the November surveys (in 2010 with invitations being sent out during the second half of November 2010), also inviting project leaders/team members of activities/projects ending before 31 August, thus inviting participants also 2 ½ months after the activity/project end. This resulted in deleting the following number of cases: 2 cases: end of activity/project after the date of completing the questionnaire (variable
‘datestamp’) 0 cases: end of activity < 1 month before the date of completing the questionnaire
(variable ‘datestamp’) 254 cases: end of activity > 10 months before the date of completing the questionnaire
(variable ‘datestamp’) 49 2 cases without activity/project end date
Result: N=2,001 Analysis of missing values Using a syntax developed by the Estonian research partner, 12 blocks of items (109 variables) were checked for missing values:
Blocks Questions
1
q_1._PL_GEND * q_2._PL_AGE q_3._PL_EDU q_4._PROJ_ACT q_4.a_PROJ_TYPE_T_N q_5._PROJ_PLACE q_6._PL_RES
2 q_12._OBJ (1-8) 3 KC(1-13) 4 q_14._OTH_PAR(1-10) 5 q_15._KC(1-21) 6 q_16._OTH_PL(1-10) 7 q_17._KC(1-13) 8 q_18._OTH_ORG(1-8) 9 q_19._OTH_LOC(1-8)
10 q_24._PL_EMPL_PROJ q_25._PLR_FUNK q_26._PLR_PRES
11
q_29._PL_EMPL_OTH q_30._PL_EDU_PROJ q_32._PL_ID q_33._PL_MIN
12
q_34._PROJ_DUR q_35._PROJ_PAR_HC_1 q_36._PROJ_PAR_GEND q_38._OBJ4f
* Numbering according to the English version of the questionnaire 408 cases were deleted where in only three or less of the 12 blocks answers were given. Result: N=1,593 49 A number of new RAY partners included project leaders from earlier projects in order to collect data over a longer period of the programme and to reach a higher number of responses.
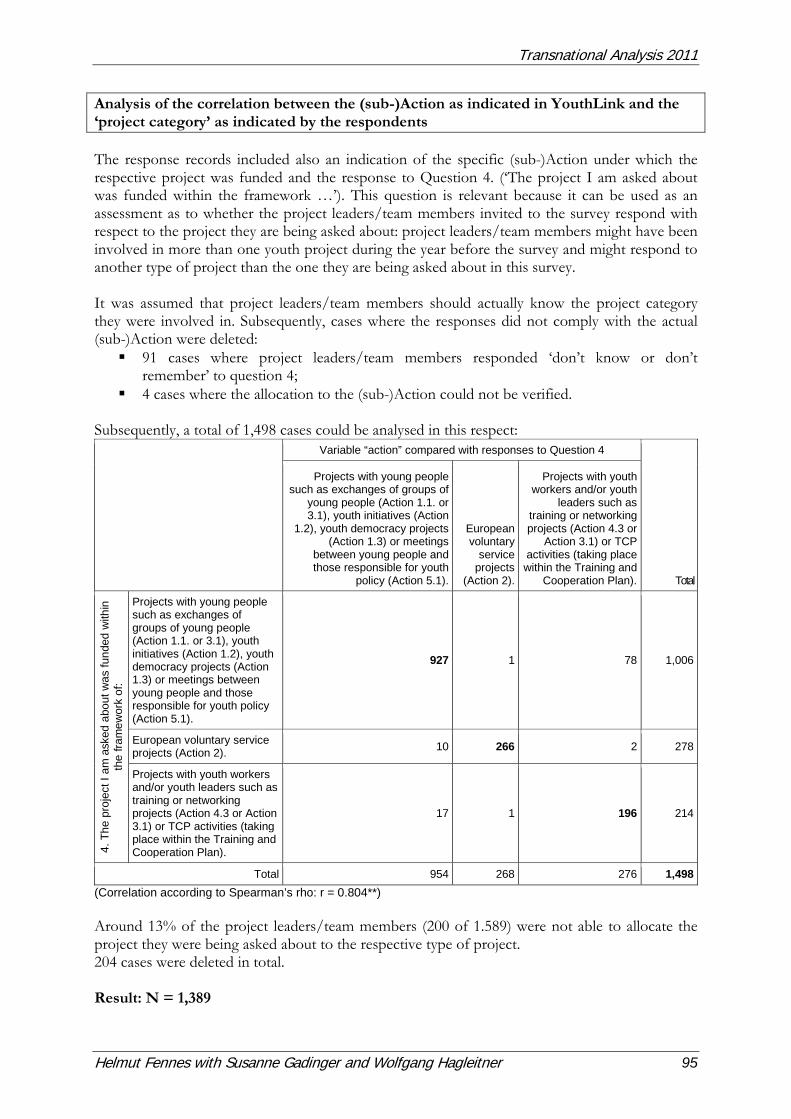
Transnational Analysis 2011
Helmut Fennes with Susanne Gadinger and Wolfgang Hagleitner 95
Analysis of the correlation between the (sub-)Action as indicated in YouthLink and the ‘project category’ as indicated by the respondents The response records included also an indication of the specific (sub-)Action under which the respective project was funded and the response to Question 4. (‘The project I am asked about was funded within the framework …’). This question is relevant because it can be used as an assessment as to whether the project leaders/team members invited to the survey respond with respect to the project they are being asked about: project leaders/team members might have been involved in more than one youth project during the year before the survey and might respond to another type of project than the one they are being asked about in this survey. It was assumed that project leaders/team members should actually know the project category they were involved in. Subsequently, cases where the responses did not comply with the actual (sub-)Action were deleted: 91 cases where project leaders/team members responded ‘don’t know or don’t
remember’ to question 4; 4 cases where the allocation to the (sub-)Action could not be verified.
Subsequently, a total of 1,498 cases could be analysed in this respect:
Variable “action” compared with responses to Question 4
Total
Projects with young people such as exchanges of groups of
young people (Action 1.1. or 3.1), youth initiatives (Action
1.2), youth democracy projects (Action 1.3) or meetings
between young people and those responsible for youth
policy (Action 5.1).
European voluntary
service projects
(Action 2).
Projects with youth workers and/or youth
leaders such as training or networking projects (Action 4.3 or
Action 3.1) or TCP activities (taking place within the Training and
Cooperation Plan).
4. T
he p
roje
ct I
am a
sked
abo
ut w
as fu
nded
with
in
the
fram
ewor
k of
:
Projects with young people such as exchanges of groups of young people (Action 1.1. or 3.1), youth initiatives (Action 1.2), youth democracy projects (Action 1.3) or meetings between young people and those responsible for youth policy (Action 5.1).
927 1 78 1,006
European voluntary service projects (Action 2). 10 266 2 278
Projects with youth workers and/or youth leaders such as training or networking projects (Action 4.3 or Action 3.1) or TCP activities (taking place within the Training and Cooperation Plan).
17 1 196 214
Total 954 268 276 1,498 (Correlation according to Spearman’s rho: r = 0.804**) Around 13% of the project leaders/team members (200 of 1.589) were not able to allocate the project they were being asked about to the respective type of project. 204 cases were deleted in total. Result: N = 1,389
Research-based Analysis of Youth in Action
96 Helmut Fennes with Susanne Gadinger and Wolfgang Hagleitner
Project leaders of projects funded by non-RAY countries For the surveys in November 2010 and May 2011 project leaders also coming from RAY countries who were involved in projects funded by non-RAY countries were invited. The responses from these project leaders (n=168) were deleted in order to limit the analysis only to projects funded by RAY network members. Result: N = 1,221 Project leaders of TCP activities While it was not planned to invite project leaders of TCP activities to the survey, due to a misunderstanding the invitation was also sent to some of these leaders. 6 TCP project leaders completed the questionnaire. The respective responses (n=6) were deleted. Result: N = 1,215
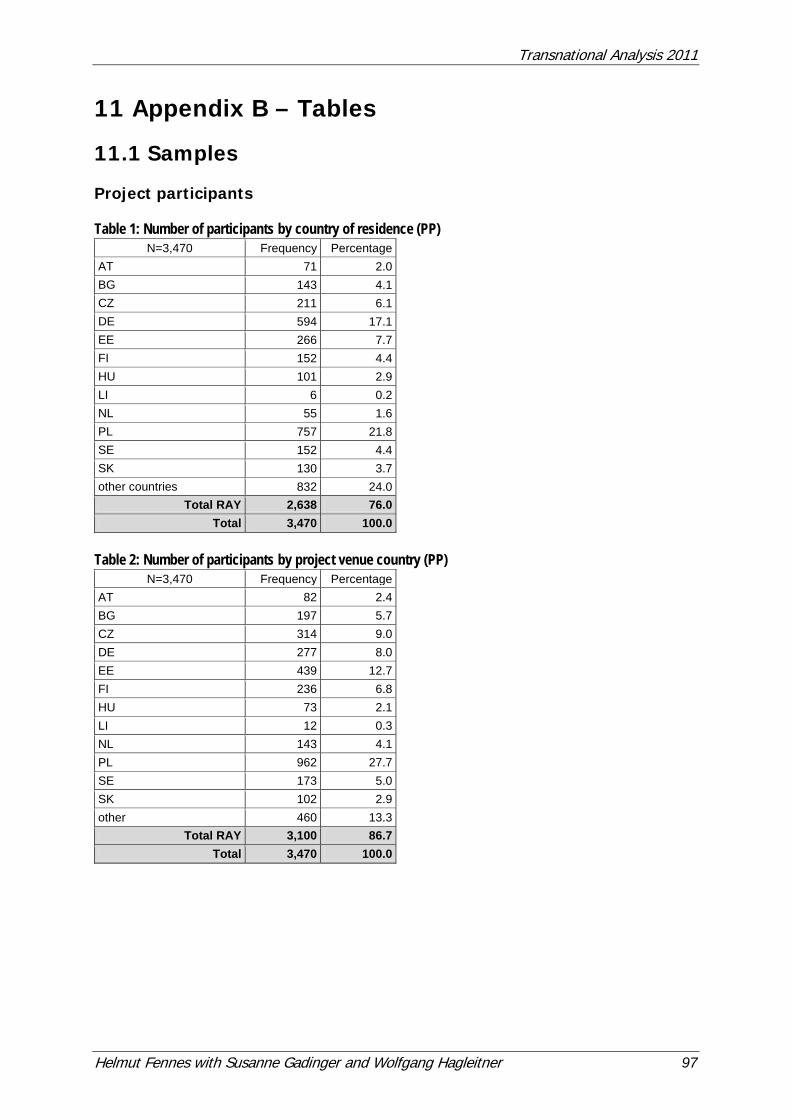
Transnational Analysis 2011
Helmut Fennes with Susanne Gadinger and Wolfgang Hagleitner 97
11 Appendix B – Tables
11.1 Samples Project participants Table 1: Number of participants by country of residence (PP)
N=3,470 Frequency Percentage AT 71 2.0 BG 143 4.1 CZ 211 6.1 DE 594 17.1 EE 266 7.7 FI 152 4.4 HU 101 2.9 LI 6 0.2 NL 55 1.6 PL 757 21.8 SE 152 4.4 SK 130 3.7 other countries 832 24.0
Total RAY 2,638 76.0 Total 3,470 100.0
Table 2: Number of participants by project venue country (PP)
N=3,470 Frequency Percentage AT 82 2.4 BG 197 5.7 CZ 314 9.0 DE 277 8.0 EE 439 12.7 FI 236 6.8 HU 73 2.1 LI 12 0.3 NL 143 4.1 PL 962 27.7 SE 173 5.0 SK 102 2.9 other 460 13.3
Total RAY 3,100 86.7 Total 3,470 100.0
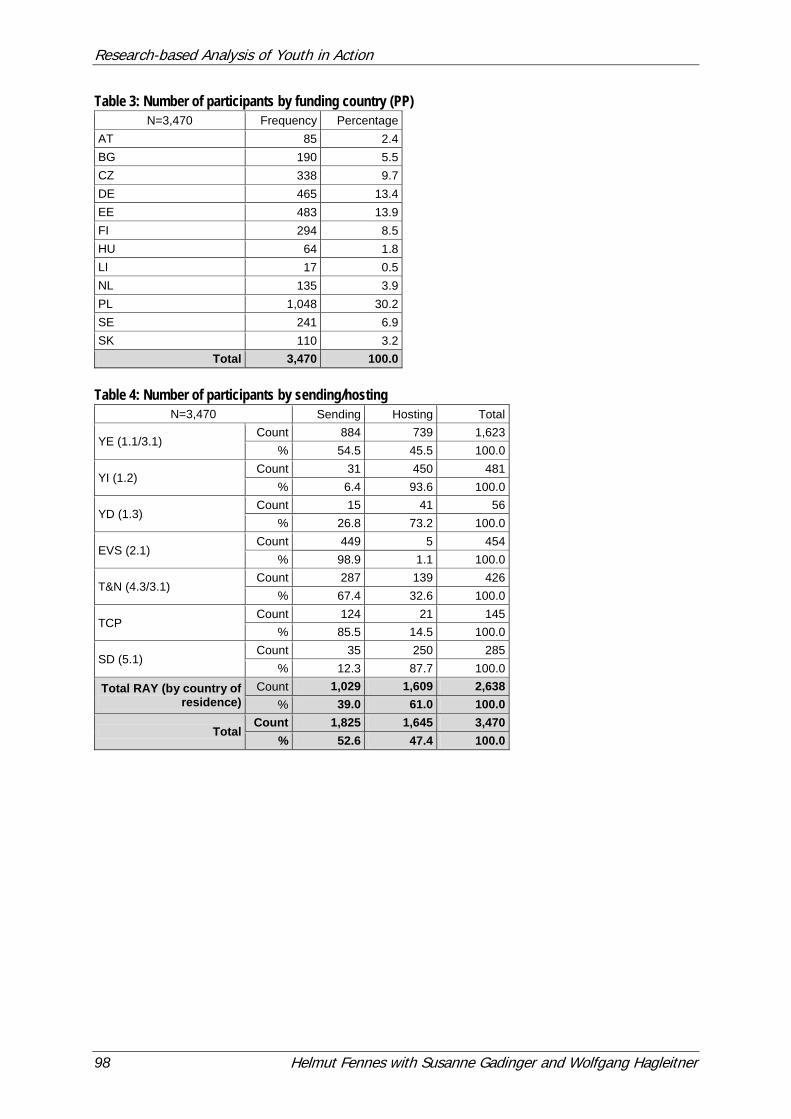
Research-based Analysis of Youth in Action
98 Helmut Fennes with Susanne Gadinger and Wolfgang Hagleitner
Table 3: Number of participants by funding country (PP) N=3,470 Frequency Percentage
AT 85 2.4 BG 190 5.5 CZ 338 9.7 DE 465 13.4 EE 483 13.9 FI 294 8.5 HU 64 1.8 LI 17 0.5 NL 135 3.9 PL 1,048 30.2 SE 241 6.9 SK 110 3.2
Total 3,470 100.0 Table 4: Number of participants by sending/hosting
N=3,470 Sending Hosting Total
YE (1.1/3.1) Count 884 739 1,623
% 54.5 45.5 100.0
YI (1.2) Count 31 450 481
% 6.4 93.6 100.0
YD (1.3) Count 15 41 56
% 26.8 73.2 100.0
EVS (2.1) Count 449 5 454
% 98.9 1.1 100.0
T&N (4.3/3.1) Count 287 139 426
% 67.4 32.6 100.0
TCP Count 124 21 145
% 85.5 14.5 100.0
SD (5.1) Count 35 250 285
% 12.3 87.7 100.0
Total RAY (by country of residence)
Count 1,029 1,609 2,638 % 39.0 61.0 100.0
Total Count 1,825 1,645 3,470
% 52.6 47.4 100.0
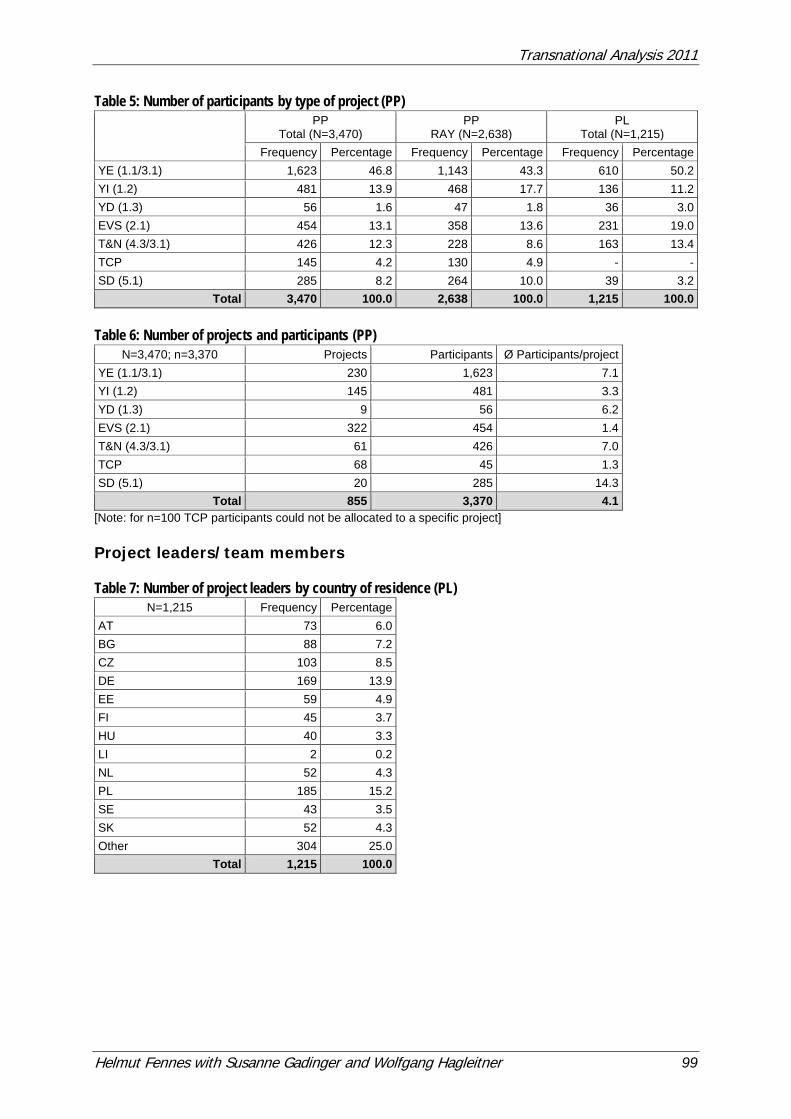
Transnational Analysis 2011
Helmut Fennes with Susanne Gadinger and Wolfgang Hagleitner 99
Table 5: Number of participants by type of project (PP)
PP
Total (N=3,470) PP
RAY (N=2,638) PL
Total (N=1,215) Frequency Percentage Frequency Percentage Frequency Percentage
YE (1.1/3.1) 1,623 46.8 1,143 43.3 610 50.2 YI (1.2) 481 13.9 468 17.7 136 11.2 YD (1.3) 56 1.6 47 1.8 36 3.0 EVS (2.1) 454 13.1 358 13.6 231 19.0 T&N (4.3/3.1) 426 12.3 228 8.6 163 13.4 TCP 145 4.2 130 4.9 - - SD (5.1) 285 8.2 264 10.0 39 3.2
Total 3,470 100.0 2,638 100.0 1,215 100.0 Table 6: Number of projects and participants (PP)
N=3,470; n=3,370 Projects Participants Ø Participants/project YE (1.1/3.1) 230 1,623 7.1 YI (1.2) 145 481 3.3 YD (1.3) 9 56 6.2 EVS (2.1) 322 454 1.4 T&N (4.3/3.1) 61 426 7.0 TCP 68 45 1.3 SD (5.1) 20 285 14.3
Total 855 3,370 4.1 [Note: for n=100 TCP participants could not be allocated to a specific project] Project leaders/team members Table 7: Number of project leaders by country of residence (PL)
N=1,215 Frequency Percentage AT 73 6.0 BG 88 7.2 CZ 103 8.5 DE 169 13.9 EE 59 4.9 FI 45 3.7 HU 40 3.3 LI 2 0.2 NL 52 4.3 PL 185 15.2 SE 43 3.5 SK 52 4.3 Other 304 25.0
Total 1,215 100.0
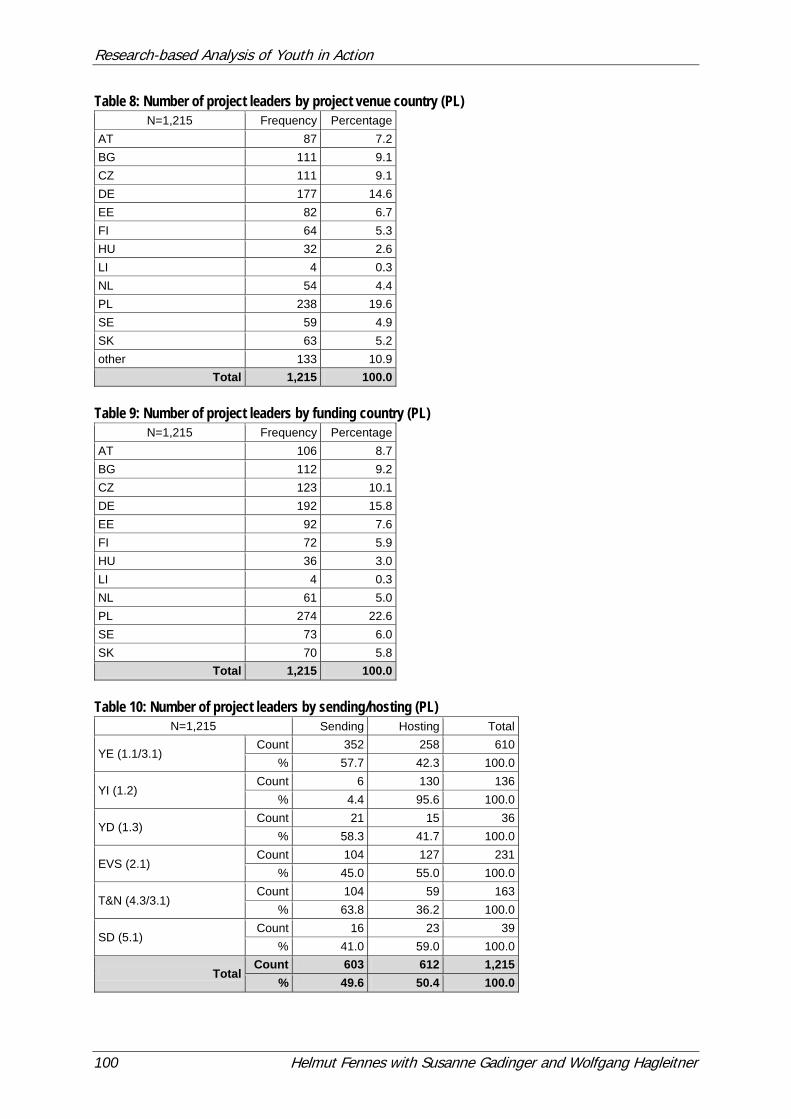
Research-based Analysis of Youth in Action
100 Helmut Fennes with Susanne Gadinger and Wolfgang Hagleitner
Table 8: Number of project leaders by project venue country (PL) N=1,215 Frequency Percentage
AT 87 7.2 BG 111 9.1 CZ 111 9.1 DE 177 14.6 EE 82 6.7 FI 64 5.3 HU 32 2.6 LI 4 0.3 NL 54 4.4 PL 238 19.6 SE 59 4.9 SK 63 5.2 other 133 10.9
Total 1,215 100.0 Table 9: Number of project leaders by funding country (PL)
N=1,215 Frequency Percentage AT 106 8.7 BG 112 9.2 CZ 123 10.1 DE 192 15.8 EE 92 7.6 FI 72 5.9 HU 36 3.0 LI 4 0.3 NL 61 5.0 PL 274 22.6 SE 73 6.0 SK 70 5.8
Total 1,215 100.0 Table 10: Number of project leaders by sending/hosting (PL)
N=1,215 Sending Hosting Total
YE (1.1/3.1) Count 352 258 610
% 57.7 42.3 100.0
YI (1.2) Count 6 130 136
% 4.4 95.6 100.0
YD (1.3) Count 21 15 36
% 58.3 41.7 100.0
EVS (2.1) Count 104 127 231
% 45.0 55.0 100.0
T&N (4.3/3.1) Count 104 59 163
% 63.8 36.2 100.0
SD (5.1) Count 16 23 39
% 41.0 59.0 100.0
Total Count 603 612 1,215
% 49.6 50.4 100.0
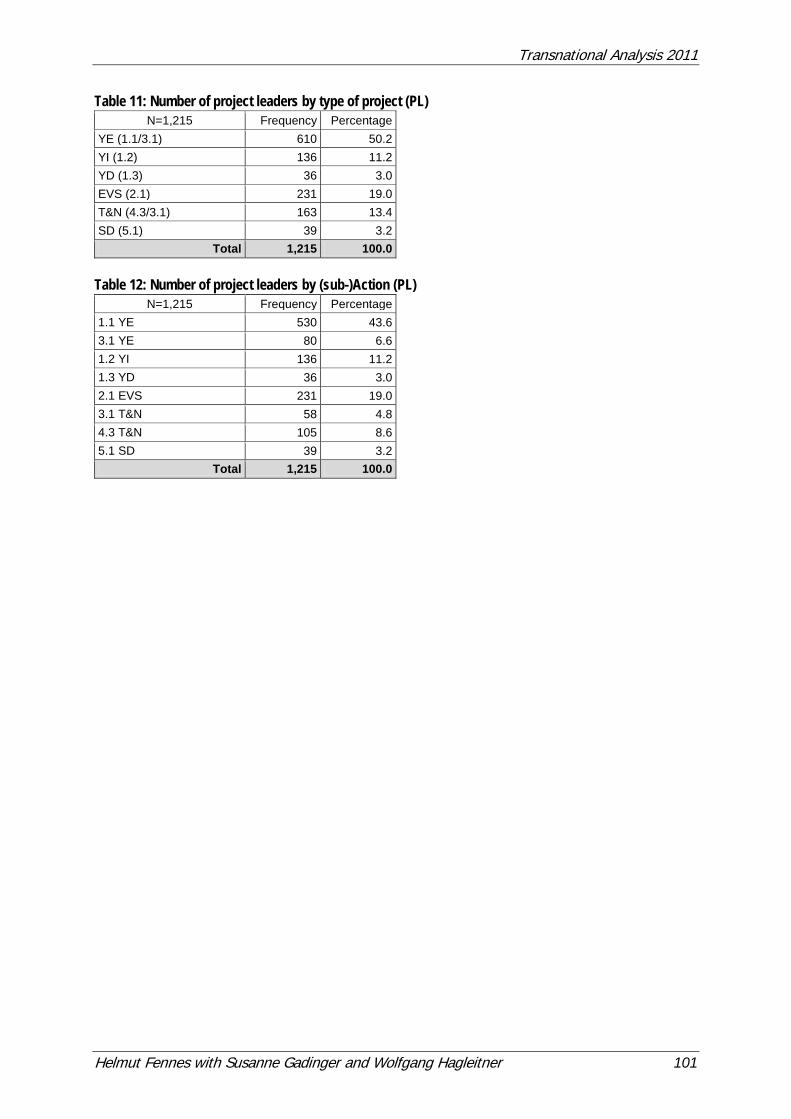
Transnational Analysis 2011
Helmut Fennes with Susanne Gadinger and Wolfgang Hagleitner 101
Table 11: Number of project leaders by type of project (PL) N=1,215 Frequency Percentage
YE (1.1/3.1) 610 50.2 YI (1.2) 136 11.2 YD (1.3) 36 3.0 EVS (2.1) 231 19.0 T&N (4.3/3.1) 163 13.4 SD (5.1) 39 3.2
Total 1,215 100.0 Table 12: Number of project leaders by (sub-)Action (PL)
N=1,215 Frequency Percentage 1.1 YE 530 43.6 3.1 YE 80 6.6 1.2 YI 136 11.2 1.3 YD 36 3.0 2.1 EVS 231 19.0 3.1 T&N 58 4.8 4.3 T&N 105 8.6 5.1 SD 39 3.2
Total 1,215 100.0
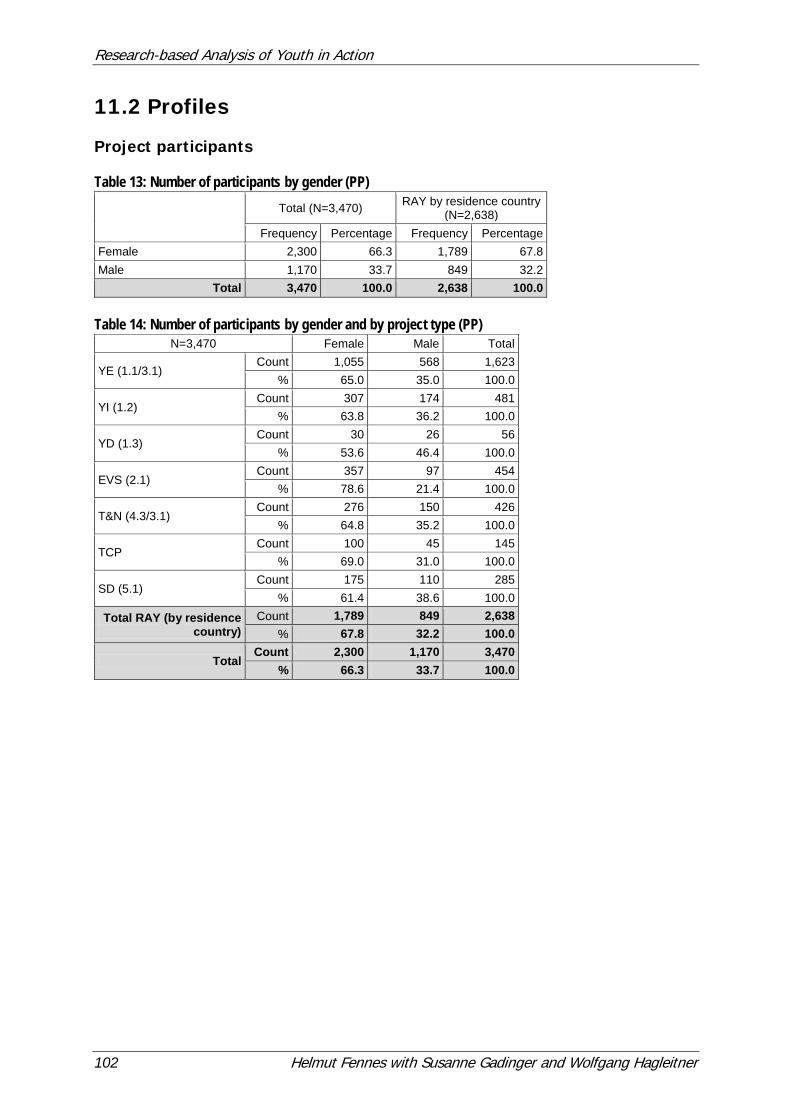
Research-based Analysis of Youth in Action
102 Helmut Fennes with Susanne Gadinger and Wolfgang Hagleitner
11.2 Profiles Project participants Table 13: Number of participants by gender (PP)
Total (N=3,470) RAY by residence country
(N=2,638) Frequency Percentage Frequency Percentage
Female 2,300 66.3 1,789 67.8 Male 1,170 33.7 849 32.2
Total 3,470 100.0 2,638 100.0 Table 14: Number of participants by gender and by project type (PP)
N=3,470 Female Male Total
YE (1.1/3.1) Count 1,055 568 1,623
% 65.0 35.0 100.0
YI (1.2) Count 307 174 481
% 63.8 36.2 100.0
YD (1.3) Count 30 26 56
% 53.6 46.4 100.0
EVS (2.1) Count 357 97 454
% 78.6 21.4 100.0
T&N (4.3/3.1) Count 276 150 426
% 64.8 35.2 100.0
TCP Count 100 45 145
% 69.0 31.0 100.0
SD (5.1) Count 175 110 285
% 61.4 38.6 100.0
Total RAY (by residence country)
Count 1,789 849 2,638 % 67.8 32.2 100.0
Total Count 2,300 1,170 3,470
% 66.3 33.7 100.0
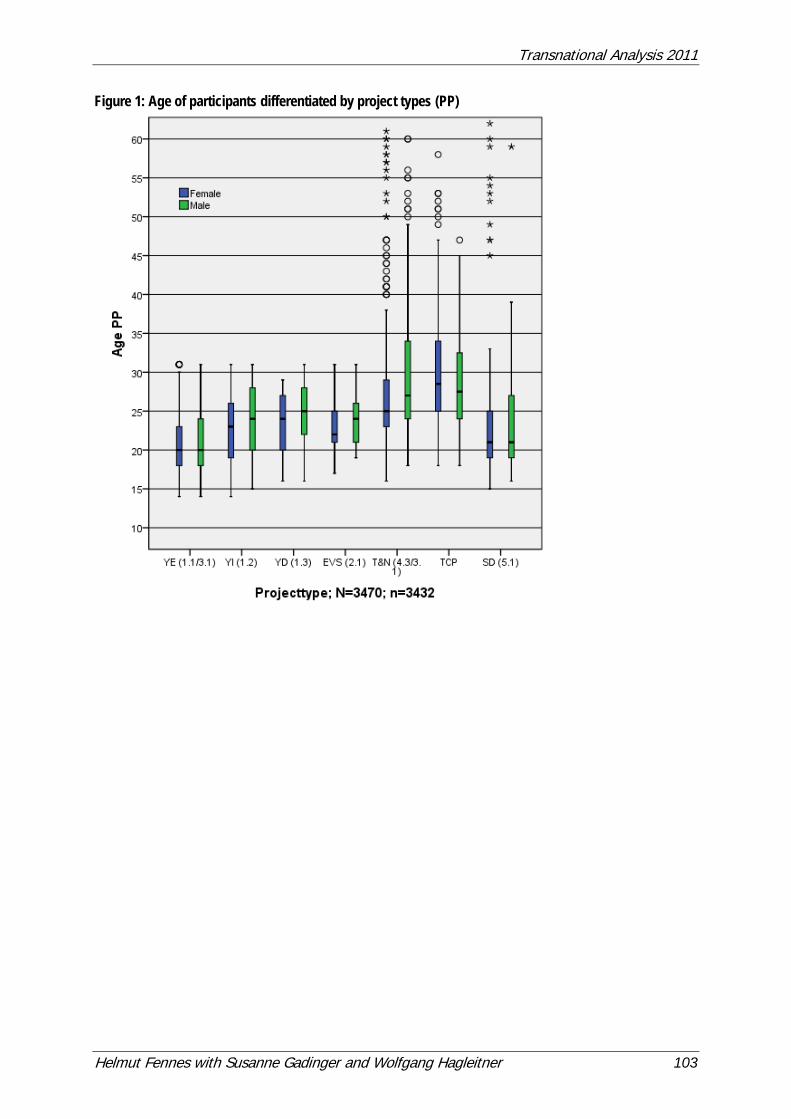
Transnational Analysis 2011
Helmut Fennes with Susanne Gadinger and Wolfgang Hagleitner 103
Figure 1: Age of participants differentiated by project types (PP)
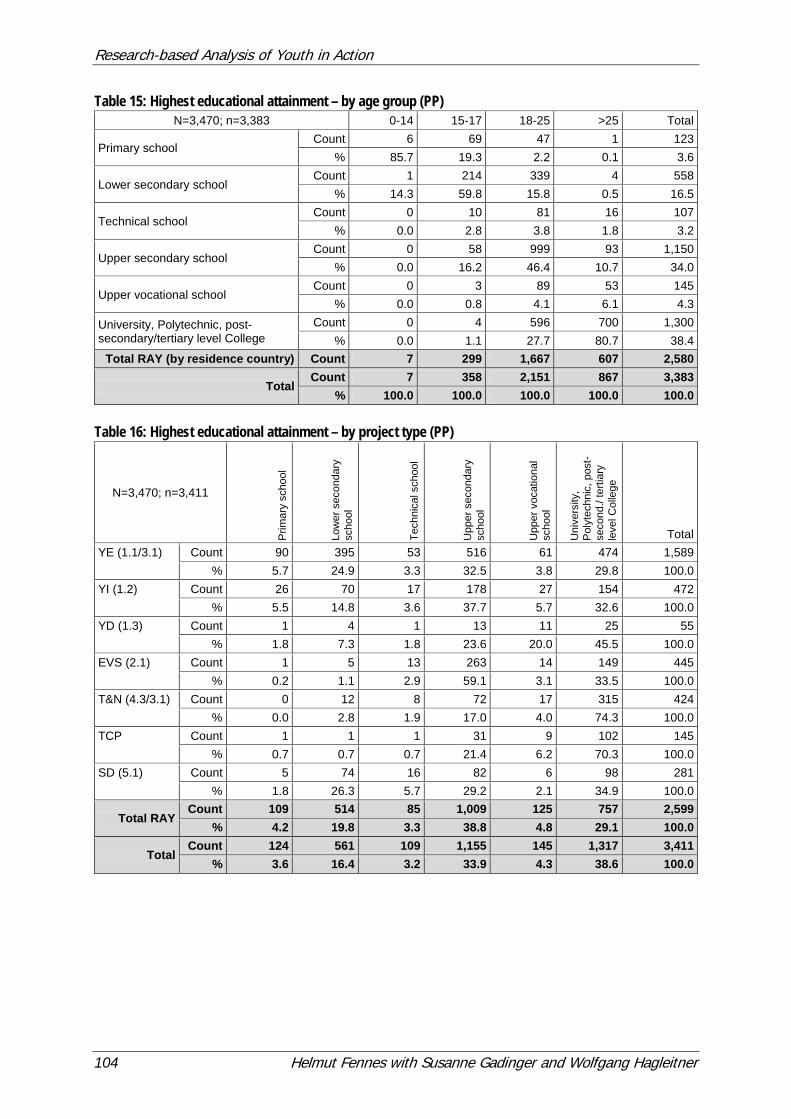
Research-based Analysis of Youth in Action
104 Helmut Fennes with Susanne Gadinger and Wolfgang Hagleitner
Table 15: Highest educational attainment – by age group (PP) N=3,470; n=3,383 0-14 15-17 18-25 >25 Total
Primary school Count 6 69 47 1 123
% 85.7 19.3 2.2 0.1 3.6
Lower secondary school Count 1 214 339 4 558
% 14.3 59.8 15.8 0.5 16.5
Technical school Count 0 10 81 16 107
% 0.0 2.8 3.8 1.8 3.2
Upper secondary school Count 0 58 999 93 1,150
% 0.0 16.2 46.4 10.7 34.0
Upper vocational school Count 0 3 89 53 145
% 0.0 0.8 4.1 6.1 4.3
University, Polytechnic, post-secondary/tertiary level College
Count 0 4 596 700 1,300 % 0.0 1.1 27.7 80.7 38.4
Total RAY (by residence country) Count 7 299 1,667 607 2,580
Total Count 7 358 2,151 867 3,383
% 100.0 100.0 100.0 100.0 100.0 Table 16: Highest educational attainment – by project type (PP)
N=3,470; n=3,411
Prim
ary
scho
ol
Low
er s
econ
dary
sc
hool
Tech
nica
l sch
ool
Upp
er s
econ
dary
sc
hool
Upp
er v
ocat
iona
l sc
hool
Uni
vers
ity,
Pol
ytec
hnic
, pos
t-se
cond
./ te
rtiar
y le
vel C
olle
ge
Total YE (1.1/3.1) Count 90 395 53 516 61 474 1,589
% 5.7 24.9 3.3 32.5 3.8 29.8 100.0 YI (1.2) Count 26 70 17 178 27 154 472
% 5.5 14.8 3.6 37.7 5.7 32.6 100.0 YD (1.3) Count 1 4 1 13 11 25 55
% 1.8 7.3 1.8 23.6 20.0 45.5 100.0 EVS (2.1) Count 1 5 13 263 14 149 445
% 0.2 1.1 2.9 59.1 3.1 33.5 100.0 T&N (4.3/3.1) Count 0 12 8 72 17 315 424
% 0.0 2.8 1.9 17.0 4.0 74.3 100.0 TCP Count 1 1 1 31 9 102 145
% 0.7 0.7 0.7 21.4 6.2 70.3 100.0 SD (5.1) Count 5 74 16 82 6 98 281
% 1.8 26.3 5.7 29.2 2.1 34.9 100.0
Total RAY Count 109 514 85 1,009 125 757 2,599
% 4.2 19.8 3.3 38.8 4.8 29.1 100.0
Total Count 124 561 109 1,155 145 1,317 3,411
% 3.6 16.4 3.2 33.9 4.3 38.6 100.0
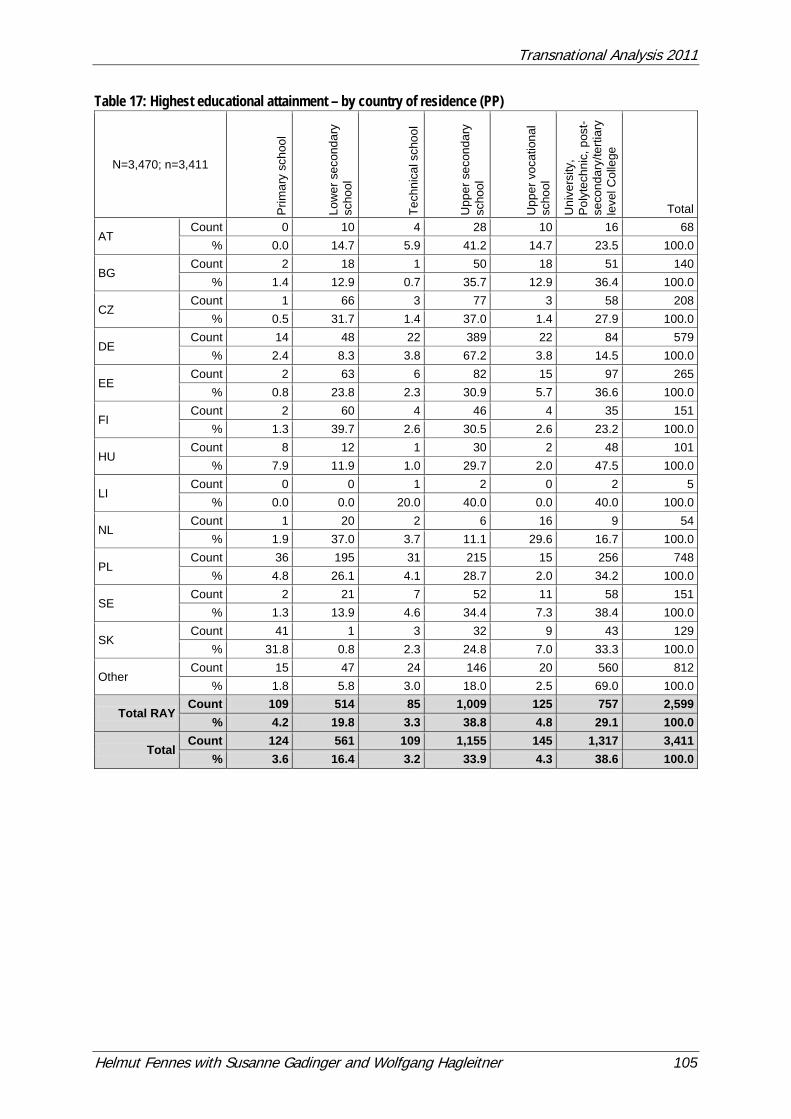
Transnational Analysis 2011
Helmut Fennes with Susanne Gadinger and Wolfgang Hagleitner 105
Table 17: Highest educational attainment – by country of residence (PP)
N=3,470; n=3,411
Prim
ary
scho
ol
Low
er s
econ
dary
sc
hool
Tech
nica
l sch
ool
Upp
er s
econ
dary
sc
hool
Upp
er v
ocat
iona
l sc
hool
Uni
vers
ity,
Pol
ytec
hnic
, pos
t-se
cond
ary/
terti
ary
leve
l Col
lege
Total
AT Count 0 10 4 28 10 16 68
% 0.0 14.7 5.9 41.2 14.7 23.5 100.0
BG Count 2 18 1 50 18 51 140
% 1.4 12.9 0.7 35.7 12.9 36.4 100.0
CZ Count 1 66 3 77 3 58 208
% 0.5 31.7 1.4 37.0 1.4 27.9 100.0
DE Count 14 48 22 389 22 84 579
% 2.4 8.3 3.8 67.2 3.8 14.5 100.0
EE Count 2 63 6 82 15 97 265
% 0.8 23.8 2.3 30.9 5.7 36.6 100.0
FI Count 2 60 4 46 4 35 151
% 1.3 39.7 2.6 30.5 2.6 23.2 100.0
HU Count 8 12 1 30 2 48 101
% 7.9 11.9 1.0 29.7 2.0 47.5 100.0
LI Count 0 0 1 2 0 2 5
% 0.0 0.0 20.0 40.0 0.0 40.0 100.0
NL Count 1 20 2 6 16 9 54
% 1.9 37.0 3.7 11.1 29.6 16.7 100.0
PL Count 36 195 31 215 15 256 748
% 4.8 26.1 4.1 28.7 2.0 34.2 100.0
SE Count 2 21 7 52 11 58 151
% 1.3 13.9 4.6 34.4 7.3 38.4 100.0
SK Count 41 1 3 32 9 43 129
% 31.8 0.8 2.3 24.8 7.0 33.3 100.0
Other Count 15 47 24 146 20 560 812
% 1.8 5.8 3.0 18.0 2.5 69.0 100.0
Total RAY Count 109 514 85 1,009 125 757 2,599
% 4.2 19.8 3.3 38.8 4.8 29.1 100.0
Total Count 124 561 109 1,155 145 1,317 3,411
% 3.6 16.4 3.2 33.9 4.3 38.6 100.0
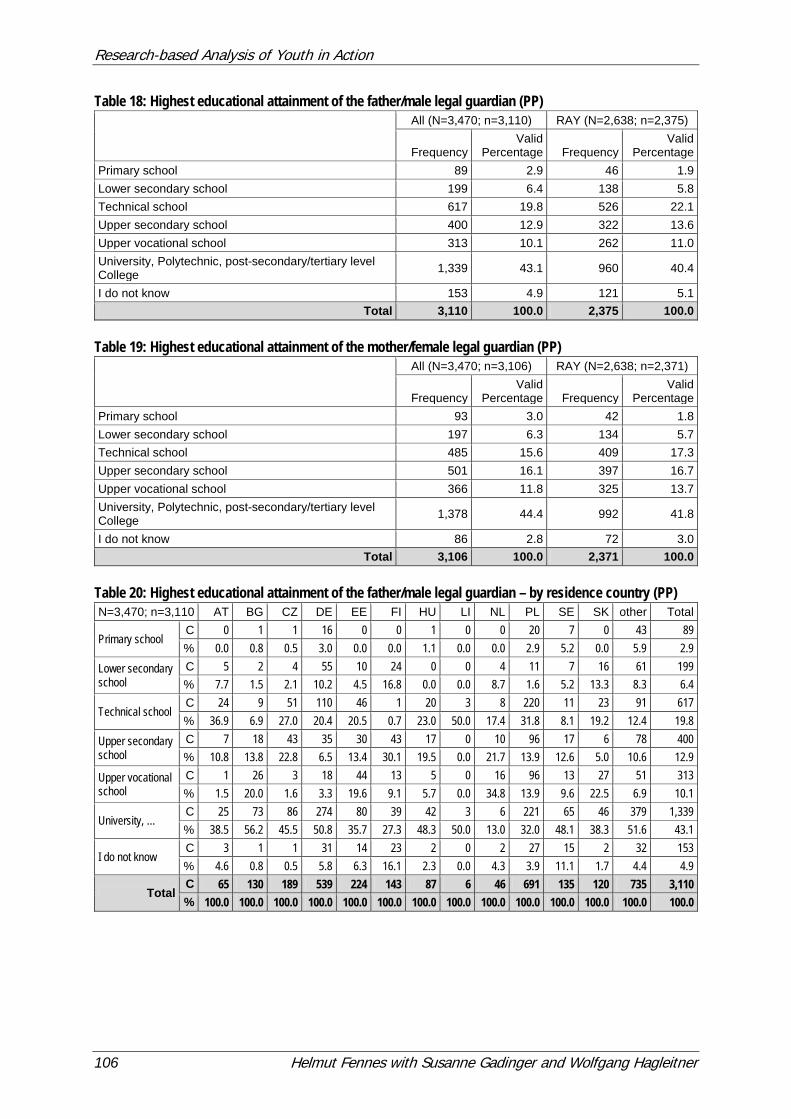
Research-based Analysis of Youth in Action
106 Helmut Fennes with Susanne Gadinger and Wolfgang Hagleitner
Table 18: Highest educational attainment of the father/male legal guardian (PP)
All (N=3,470; n=3,110) RAY (N=2,638; n=2,375)
Frequency Valid
Percentage Frequency Valid
Percentage Primary school 89 2.9 46 1.9 Lower secondary school 199 6.4 138 5.8 Technical school 617 19.8 526 22.1 Upper secondary school 400 12.9 322 13.6 Upper vocational school 313 10.1 262 11.0 University, Polytechnic, post-secondary/tertiary level College 1,339 43.1 960 40.4
I do not know 153 4.9 121 5.1 Total 3,110 100.0 2,375 100.0
Table 19: Highest educational attainment of the mother/female legal guardian (PP)
All (N=3,470; n=3,106) RAY (N=2,638; n=2,371)
Frequency Valid
Percentage Frequency Valid
Percentage Primary school 93 3.0 42 1.8 Lower secondary school 197 6.3 134 5.7 Technical school 485 15.6 409 17.3 Upper secondary school 501 16.1 397 16.7 Upper vocational school 366 11.8 325 13.7 University, Polytechnic, post-secondary/tertiary level College 1,378 44.4 992 41.8
I do not know 86 2.8 72 3.0 Total 3,106 100.0 2,371 100.0
Table 20: Highest educational attainment of the father/male legal guardian – by residence country (PP) N=3,470; n=3,110 AT BG CZ DE EE FI HU LI NL PL SE SK other Total
Primary school C 0 1 1 16 0 0 1 0 0 20 7 0 43 89 % 0.0 0.8 0.5 3.0 0.0 0.0 1.1 0.0 0.0 2.9 5.2 0.0 5.9 2.9
Lower secondary school
C 5 2 4 55 10 24 0 0 4 11 7 16 61 199 % 7.7 1.5 2.1 10.2 4.5 16.8 0.0 0.0 8.7 1.6 5.2 13.3 8.3 6.4
Technical school C 24 9 51 110 46 1 20 3 8 220 11 23 91 617 % 36.9 6.9 27.0 20.4 20.5 0.7 23.0 50.0 17.4 31.8 8.1 19.2 12.4 19.8
Upper secondary school
C 7 18 43 35 30 43 17 0 10 96 17 6 78 400 % 10.8 13.8 22.8 6.5 13.4 30.1 19.5 0.0 21.7 13.9 12.6 5.0 10.6 12.9
Upper vocational school
C 1 26 3 18 44 13 5 0 16 96 13 27 51 313 % 1.5 20.0 1.6 3.3 19.6 9.1 5.7 0.0 34.8 13.9 9.6 22.5 6.9 10.1
University, … C 25 73 86 274 80 39 42 3 6 221 65 46 379 1,339 % 38.5 56.2 45.5 50.8 35.7 27.3 48.3 50.0 13.0 32.0 48.1 38.3 51.6 43.1
I do not know C 3 1 1 31 14 23 2 0 2 27 15 2 32 153 % 4.6 0.8 0.5 5.8 6.3 16.1 2.3 0.0 4.3 3.9 11.1 1.7 4.4 4.9
Total C 65 130 189 539 224 143 87 6 46 691 135 120 735 3,110 % 100.0 100.0 100.0 100.0 100.0 100.0 100.0 100.0 100.0 100.0 100.0 100.0 100.0 100.0
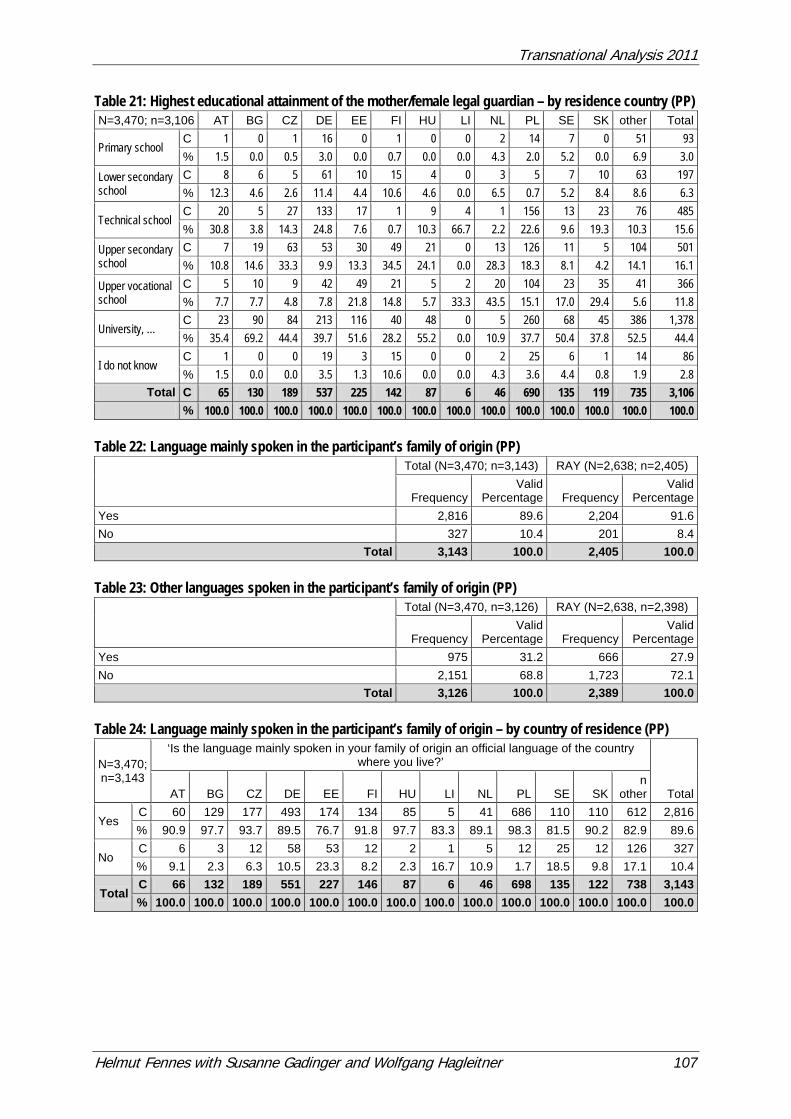
Transnational Analysis 2011
Helmut Fennes with Susanne Gadinger and Wolfgang Hagleitner 107
Table 21: Highest educational attainment of the mother/female legal guardian – by residence country (PP) N=3,470; n=3,106 AT BG CZ DE EE FI HU LI NL PL SE SK other Total
Primary school C 1 0 1 16 0 1 0 0 2 14 7 0 51 93 % 1.5 0.0 0.5 3.0 0.0 0.7 0.0 0.0 4.3 2.0 5.2 0.0 6.9 3.0
Lower secondary school
C 8 6 5 61 10 15 4 0 3 5 7 10 63 197 % 12.3 4.6 2.6 11.4 4.4 10.6 4.6 0.0 6.5 0.7 5.2 8.4 8.6 6.3
Technical school C 20 5 27 133 17 1 9 4 1 156 13 23 76 485 % 30.8 3.8 14.3 24.8 7.6 0.7 10.3 66.7 2.2 22.6 9.6 19.3 10.3 15.6
Upper secondary school
C 7 19 63 53 30 49 21 0 13 126 11 5 104 501 % 10.8 14.6 33.3 9.9 13.3 34.5 24.1 0.0 28.3 18.3 8.1 4.2 14.1 16.1
Upper vocational school
C 5 10 9 42 49 21 5 2 20 104 23 35 41 366 % 7.7 7.7 4.8 7.8 21.8 14.8 5.7 33.3 43.5 15.1 17.0 29.4 5.6 11.8
University, … C 23 90 84 213 116 40 48 0 5 260 68 45 386 1,378 % 35.4 69.2 44.4 39.7 51.6 28.2 55.2 0.0 10.9 37.7 50.4 37.8 52.5 44.4
I do not know C 1 0 0 19 3 15 0 0 2 25 6 1 14 86 % 1.5 0.0 0.0 3.5 1.3 10.6 0.0 0.0 4.3 3.6 4.4 0.8 1.9 2.8
Total C 65 130 189 537 225 142 87 6 46 690 135 119 735 3,106 % 100.0 100.0 100.0 100.0 100.0 100.0 100.0 100.0 100.0 100.0 100.0 100.0 100.0 100.0 Table 22: Language mainly spoken in the participant’s family of origin (PP)
Total (N=3,470; n=3,143) RAY (N=2,638; n=2,405)
Frequency Valid
Percentage Frequency Valid
Percentage Yes 2,816 89.6 2,204 91.6 No 327 10.4 201 8.4
Total 3,143 100.0 2,405 100.0 Table 23: Other languages spoken in the participant’s family of origin (PP)
Total (N=3,470, n=3,126) RAY (N=2,638, n=2,398)
Frequency Valid
Percentage Frequency Valid
Percentage Yes 975 31.2 666 27.9 No 2,151 68.8 1,723 72.1
Total 3,126 100.0 2,389 100.0 Table 24: Language mainly spoken in the participant’s family of origin – by country of residence (PP)
N=3,470; n=3,143
‘Is the language mainly spoken in your family of origin an official language of the country where you live?’
Total AT BG CZ DE EE FI HU LI NL PL SE SK n
other
Yes C 60 129 177 493 174 134 85 5 41 686 110 110 612 2,816 % 90.9 97.7 93.7 89.5 76.7 91.8 97.7 83.3 89.1 98.3 81.5 90.2 82.9 89.6
No C 6 3 12 58 53 12 2 1 5 12 25 12 126 327 % 9.1 2.3 6.3 10.5 23.3 8.2 2.3 16.7 10.9 1.7 18.5 9.8 17.1 10.4
Total C 66 132 189 551 227 146 87 6 46 698 135 122 738 3,143 % 100.0 100.0 100.0 100.0 100.0 100.0 100.0 100.0 100.0 100.0 100.0 100.0 100.0 100.0
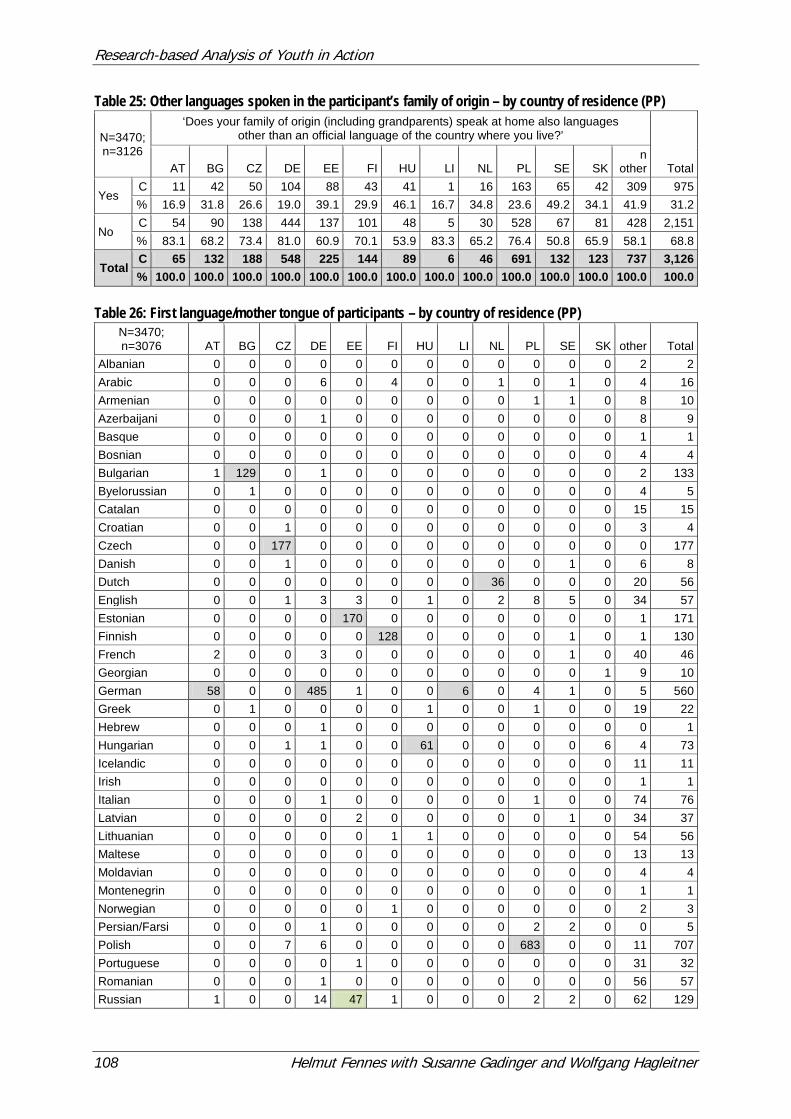
Research-based Analysis of Youth in Action
108 Helmut Fennes with Susanne Gadinger and Wolfgang Hagleitner
Table 25: Other languages spoken in the participant’s family of origin – by country of residence (PP)
N=3470; n=3126
‘Does your family of origin (including grandparents) speak at home also languages other than an official language of the country where you live?’
Total AT BG CZ DE EE FI HU LI NL PL SE SK n
other
Yes C 11 42 50 104 88 43 41 1 16 163 65 42 309 975 % 16.9 31.8 26.6 19.0 39.1 29.9 46.1 16.7 34.8 23.6 49.2 34.1 41.9 31.2
No C 54 90 138 444 137 101 48 5 30 528 67 81 428 2,151 % 83.1 68.2 73.4 81.0 60.9 70.1 53.9 83.3 65.2 76.4 50.8 65.9 58.1 68.8
Total C 65 132 188 548 225 144 89 6 46 691 132 123 737 3,126 % 100.0 100.0 100.0 100.0 100.0 100.0 100.0 100.0 100.0 100.0 100.0 100.0 100.0 100.0
Table 26: First language/mother tongue of participants – by country of residence (PP)
N=3470; n=3076 AT BG CZ DE EE FI HU LI NL PL SE SK other Total
Albanian 0 0 0 0 0 0 0 0 0 0 0 0 2 2 Arabic 0 0 0 6 0 4 0 0 1 0 1 0 4 16 Armenian 0 0 0 0 0 0 0 0 0 1 1 0 8 10 Azerbaijani 0 0 0 1 0 0 0 0 0 0 0 0 8 9 Basque 0 0 0 0 0 0 0 0 0 0 0 0 1 1 Bosnian 0 0 0 0 0 0 0 0 0 0 0 0 4 4 Bulgarian 1 129 0 1 0 0 0 0 0 0 0 0 2 133 Byelorussian 0 1 0 0 0 0 0 0 0 0 0 0 4 5 Catalan 0 0 0 0 0 0 0 0 0 0 0 0 15 15 Croatian 0 0 1 0 0 0 0 0 0 0 0 0 3 4 Czech 0 0 177 0 0 0 0 0 0 0 0 0 0 177 Danish 0 0 1 0 0 0 0 0 0 0 1 0 6 8 Dutch 0 0 0 0 0 0 0 0 36 0 0 0 20 56 English 0 0 1 3 3 0 1 0 2 8 5 0 34 57 Estonian 0 0 0 0 170 0 0 0 0 0 0 0 1 171 Finnish 0 0 0 0 0 128 0 0 0 0 1 0 1 130 French 2 0 0 3 0 0 0 0 0 0 1 0 40 46 Georgian 0 0 0 0 0 0 0 0 0 0 0 1 9 10 German 58 0 0 485 1 0 0 6 0 4 1 0 5 560 Greek 0 1 0 0 0 0 1 0 0 1 0 0 19 22 Hebrew 0 0 0 1 0 0 0 0 0 0 0 0 0 1 Hungarian 0 0 1 1 0 0 61 0 0 0 0 6 4 73 Icelandic 0 0 0 0 0 0 0 0 0 0 0 0 11 11 Irish 0 0 0 0 0 0 0 0 0 0 0 0 1 1 Italian 0 0 0 1 0 0 0 0 0 1 0 0 74 76 Latvian 0 0 0 0 2 0 0 0 0 0 1 0 34 37 Lithuanian 0 0 0 0 0 1 1 0 0 0 0 0 54 56 Maltese 0 0 0 0 0 0 0 0 0 0 0 0 13 13 Moldavian 0 0 0 0 0 0 0 0 0 0 0 0 4 4 Montenegrin 0 0 0 0 0 0 0 0 0 0 0 0 1 1 Norwegian 0 0 0 0 0 1 0 0 0 0 0 0 2 3 Persian/Farsi 0 0 0 1 0 0 0 0 0 2 2 0 0 5 Polish 0 0 7 6 0 0 0 0 0 683 0 0 11 707 Portuguese 0 0 0 0 1 0 0 0 0 0 0 0 31 32 Romanian 0 0 0 1 0 0 0 0 0 0 0 0 56 57 Russian 1 0 0 14 47 1 0 0 0 2 2 0 62 129
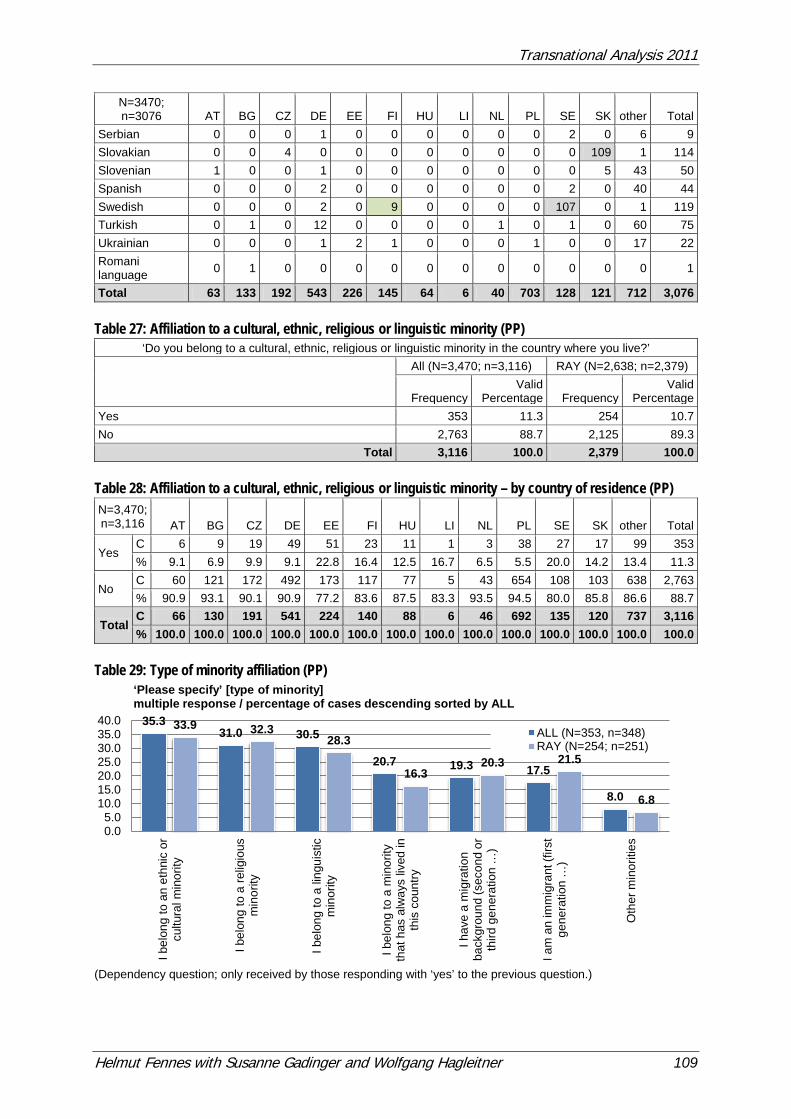
Transnational Analysis 2011
Helmut Fennes with Susanne Gadinger and Wolfgang Hagleitner 109
N=3470; n=3076 AT BG CZ DE EE FI HU LI NL PL SE SK other Total
Serbian 0 0 0 1 0 0 0 0 0 0 2 0 6 9 Slovakian 0 0 4 0 0 0 0 0 0 0 0 109 1 114 Slovenian 1 0 0 1 0 0 0 0 0 0 0 5 43 50 Spanish 0 0 0 2 0 0 0 0 0 0 2 0 40 44 Swedish 0 0 0 2 0 9 0 0 0 0 107 0 1 119 Turkish 0 1 0 12 0 0 0 0 1 0 1 0 60 75 Ukrainian 0 0 0 1 2 1 0 0 0 1 0 0 17 22 Romani language 0 1 0 0 0 0 0 0 0 0 0 0 0 1
Total 63 133 192 543 226 145 64 6 40 703 128 121 712 3,076 Table 27: Affiliation to a cultural, ethnic, religious or linguistic minority (PP)
‘Do you belong to a cultural, ethnic, religious or linguistic minority in the country where you live?’
All (N=3,470; n=3,116) RAY (N=2,638; n=2,379)
Frequency Valid
Percentage Frequency Valid
Percentage Yes 353 11.3 254 10.7 No 2,763 88.7 2,125 89.3
Total 3,116 100.0 2,379 100.0 Table 28: Affiliation to a cultural, ethnic, religious or linguistic minority – by country of residence (PP) N=3,470; n=3,116 AT BG CZ DE EE FI HU LI NL PL SE SK other Total
Yes C 6 9 19 49 51 23 11 1 3 38 27 17 99 353 % 9.1 6.9 9.9 9.1 22.8 16.4 12.5 16.7 6.5 5.5 20.0 14.2 13.4 11.3
No C 60 121 172 492 173 117 77 5 43 654 108 103 638 2,763 % 90.9 93.1 90.1 90.9 77.2 83.6 87.5 83.3 93.5 94.5 80.0 85.8 86.6 88.7
Total C 66 130 191 541 224 140 88 6 46 692 135 120 737 3,116 % 100.0 100.0 100.0 100.0 100.0 100.0 100.0 100.0 100.0 100.0 100.0 100.0 100.0 100.0
Table 29: Type of minority affiliation (PP)
(Dependency question; only received by those responding with ‘yes’ to the previous question.)
35.3 31.0 30.5
20.7 19.3 17.5
8.0
33.9 32.3 28.3
16.3 20.3 21.5
6.8
0.05.0
10.015.020.025.030.035.040.0
I bel
ong
to a
n et
hnic
or
cultu
ral m
inor
ity
I bel
ong
to a
relig
ious
min
ority
I bel
ong
to a
ling
uist
icm
inor
ity
I bel
ong
to a
min
ority
that
has
alw
ays
lived
inth
is c
ount
ry
I hav
e a
mig
ratio
n ba
ckgr
ound
(sec
ond
or
third
gen
erat
ion
…)
I am
an
imm
igra
nt (f
irst
gene
ratio
n …
)
Oth
er m
inor
ities
‘Please specify’ [type of minority] multiple response / percentage of cases descending sorted by ALL
ALL (N=353, n=348)RAY (N=254; n=251)
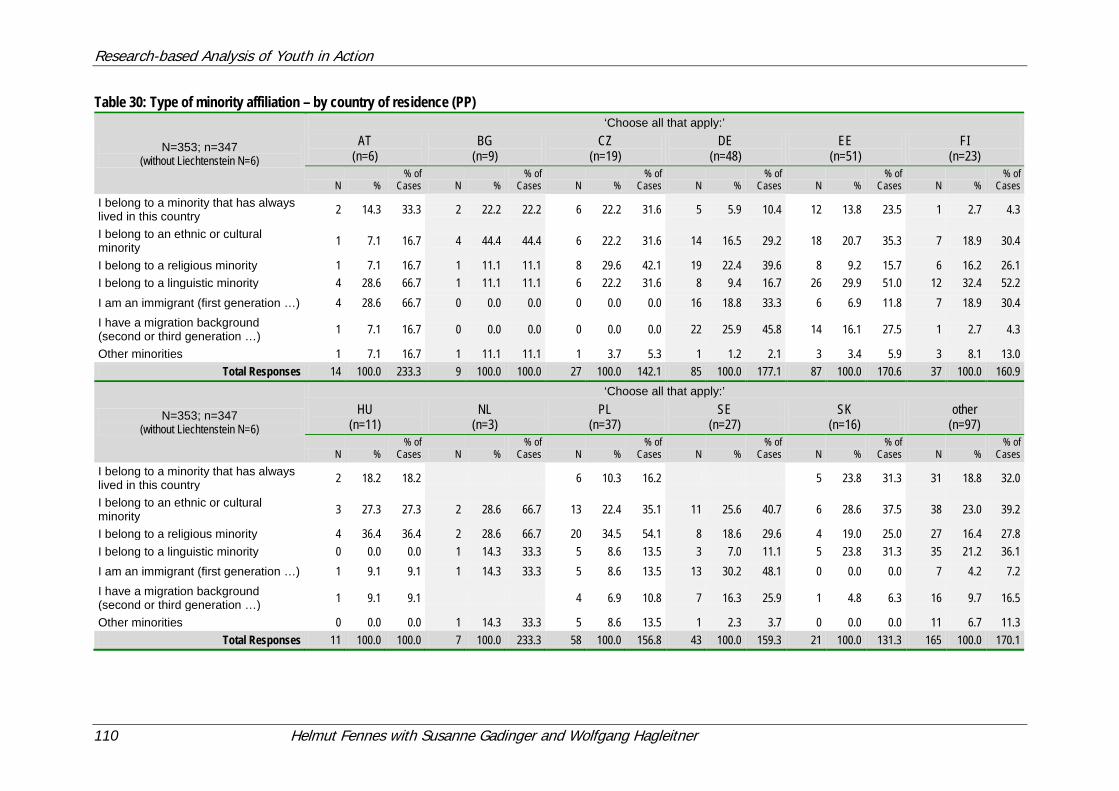
Research-based Analysis of Youth in Action
110 Helmut Fennes with Susanne Gadinger and Wolfgang Hagleitner
Table 30: Type of minority affiliation – by country of residence (PP)
N=353; n=347 (without Liechtenstein N=6)
‘Choose all that apply:’ AT
(n=6) BG
(n=9) CZ
(n=19) DE
(n=48) EE
(n=51) FI
(n=23)
N % % of
Cases N % % of
Cases N % % of
Cases N % % of
Cases N % % of
Cases N % % of
Cases I belong to a minority that has always lived in this country 2 14.3 33.3 2 22.2 22.2 6 22.2 31.6 5 5.9 10.4 12 13.8 23.5 1 2.7 4.3
I belong to an ethnic or cultural minority 1 7.1 16.7 4 44.4 44.4 6 22.2 31.6 14 16.5 29.2 18 20.7 35.3 7 18.9 30.4
I belong to a religious minority 1 7.1 16.7 1 11.1 11.1 8 29.6 42.1 19 22.4 39.6 8 9.2 15.7 6 16.2 26.1 I belong to a linguistic minority 4 28.6 66.7 1 11.1 11.1 6 22.2 31.6 8 9.4 16.7 26 29.9 51.0 12 32.4 52.2 I am an immigrant (first generation …) 4 28.6 66.7 0 0.0 0.0 0 0.0 0.0 16 18.8 33.3 6 6.9 11.8 7 18.9 30.4 I have a migration background (second or third generation …) 1 7.1 16.7 0 0.0 0.0 0 0.0 0.0 22 25.9 45.8 14 16.1 27.5 1 2.7 4.3
Other minorities 1 7.1 16.7 1 11.1 11.1 1 3.7 5.3 1 1.2 2.1 3 3.4 5.9 3 8.1 13.0 Total Responses 14 100.0 233.3 9 100.0 100.0 27 100.0 142.1 85 100.0 177.1 87 100.0 170.6 37 100.0 160.9
N=353; n=347 (without Liechtenstein N=6)
‘Choose all that apply:’ HU
(n=11) NL
(n=3) PL
(n=37) SE
(n=27) SK
(n=16) other
(n=97)
N % % of
Cases N % % of
Cases N % % of
Cases N % % of
Cases N % % of
Cases N % % of
Cases I belong to a minority that has always lived in this country 2 18.2 18.2 6 10.3 16.2 5 23.8 31.3 31 18.8 32.0
I belong to an ethnic or cultural minority 3 27.3 27.3 2 28.6 66.7 13 22.4 35.1 11 25.6 40.7 6 28.6 37.5 38 23.0 39.2
I belong to a religious minority 4 36.4 36.4 2 28.6 66.7 20 34.5 54.1 8 18.6 29.6 4 19.0 25.0 27 16.4 27.8 I belong to a linguistic minority 0 0.0 0.0 1 14.3 33.3 5 8.6 13.5 3 7.0 11.1 5 23.8 31.3 35 21.2 36.1 I am an immigrant (first generation …) 1 9.1 9.1 1 14.3 33.3 5 8.6 13.5 13 30.2 48.1 0 0.0 0.0 7 4.2 7.2 I have a migration background (second or third generation …) 1 9.1 9.1 4 6.9 10.8 7 16.3 25.9 1 4.8 6.3 16 9.7 16.5
Other minorities 0 0.0 0.0 1 14.3 33.3 5 8.6 13.5 1 2.3 3.7 0 0.0 0.0 11 6.7 11.3 Total Responses 11 100.0 100.0 7 100.0 233.3 58 100.0 156.8 43 100.0 159.3 21 100.0 131.3 165 100.0 170.1
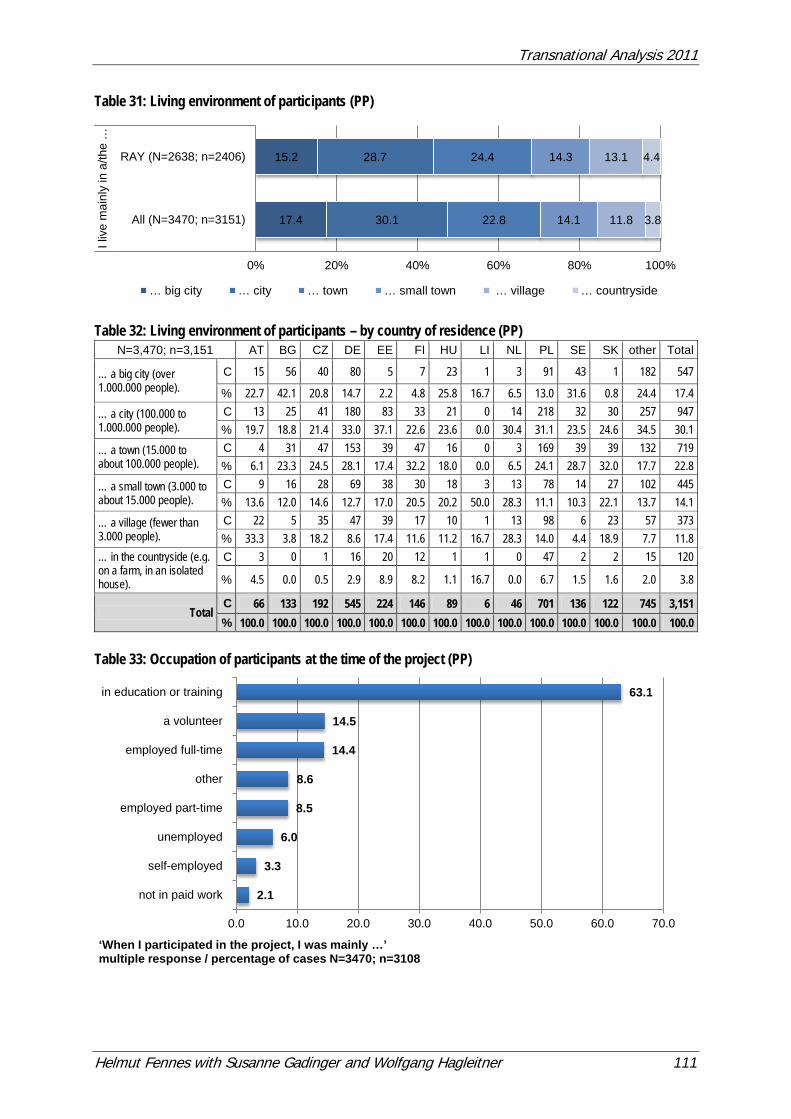
Transnational Analysis 2011
Helmut Fennes with Susanne Gadinger and Wolfgang Hagleitner 111
Table 31: Living environment of participants (PP)
Table 32: Living environment of participants – by country of residence (PP)
N=3,470; n=3,151 AT BG CZ DE EE FI HU LI NL PL SE SK other Total
… a big city (over 1.000.000 people).
C 15 56 40 80 5 7 23 1 3 91 43 1 182 547
% 22.7 42.1 20.8 14.7 2.2 4.8 25.8 16.7 6.5 13.0 31.6 0.8 24.4 17.4 … a city (100.000 to 1.000.000 people).
C 13 25 41 180 83 33 21 0 14 218 32 30 257 947 % 19.7 18.8 21.4 33.0 37.1 22.6 23.6 0.0 30.4 31.1 23.5 24.6 34.5 30.1
… a town (15.000 to about 100.000 people).
C 4 31 47 153 39 47 16 0 3 169 39 39 132 719 % 6.1 23.3 24.5 28.1 17.4 32.2 18.0 0.0 6.5 24.1 28.7 32.0 17.7 22.8
… a small town (3.000 to about 15.000 people).
C 9 16 28 69 38 30 18 3 13 78 14 27 102 445 % 13.6 12.0 14.6 12.7 17.0 20.5 20.2 50.0 28.3 11.1 10.3 22.1 13.7 14.1
… a village (fewer than 3.000 people).
C 22 5 35 47 39 17 10 1 13 98 6 23 57 373 % 33.3 3.8 18.2 8.6 17.4 11.6 11.2 16.7 28.3 14.0 4.4 18.9 7.7 11.8
… in the countryside (e.g. on a farm, in an isolated house).
C 3 0 1 16 20 12 1 1 0 47 2 2 15 120
% 4.5 0.0 0.5 2.9 8.9 8.2 1.1 16.7 0.0 6.7 1.5 1.6 2.0 3.8
Total C 66 133 192 545 224 146 89 6 46 701 136 122 745 3,151 % 100.0 100.0 100.0 100.0 100.0 100.0 100.0 100.0 100.0 100.0 100.0 100.0 100.0 100.0
Table 33: Occupation of participants at the time of the project (PP)
17.4
15.2
30.1
28.7
22.8
24.4
14.1
14.3
11.8
13.1
3.8
4.4
0% 20% 40% 60% 80% 100%
All (N=3470; n=3151)
RAY (N=2638; n=2406)
I liv
e m
ainl
y in
a/th
e …
… big city … city … town … small town … village … countryside
2.1
3.3
6.0
8.5
8.6
14.4
14.5
63.1
0.0 10.0 20.0 30.0 40.0 50.0 60.0 70.0
not in paid work
self-employed
unemployed
employed part-time
other
employed full-time
a volunteer
in education or training
‘When I participated in the project, I was mainly …’ multiple response / percentage of cases N=3470; n=3108
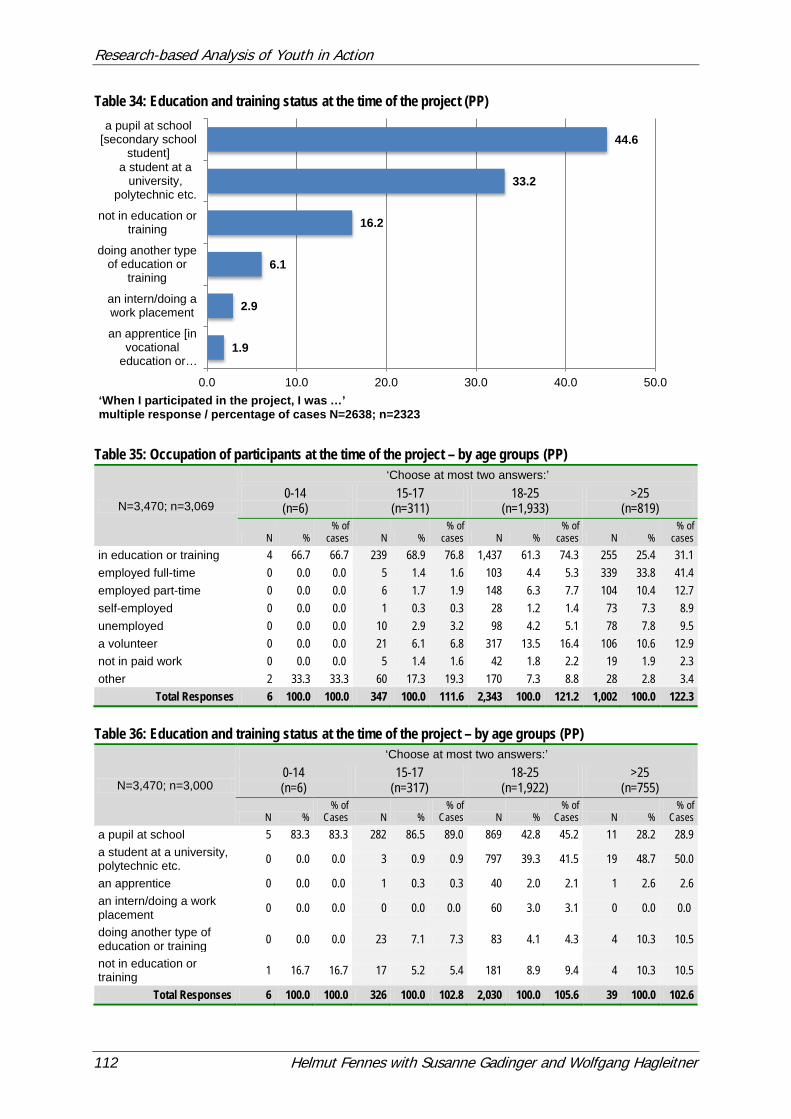
Research-based Analysis of Youth in Action
112 Helmut Fennes with Susanne Gadinger and Wolfgang Hagleitner
Table 34: Education and training status at the time of the project (PP)
Table 35: Occupation of participants at the time of the project – by age groups (PP)
N=3,470; n=3,069
‘Choose at most two answers:’ 0-14 (n=6)
15-17 (n=311)
18-25 (n=1,933)
>25 (n=819)
N % % of
cases N % % of
cases N % % of
cases N % % of
cases in education or training 4 66.7 66.7 239 68.9 76.8 1,437 61.3 74.3 255 25.4 31.1 employed full-time 0 0.0 0.0 5 1.4 1.6 103 4.4 5.3 339 33.8 41.4 employed part-time 0 0.0 0.0 6 1.7 1.9 148 6.3 7.7 104 10.4 12.7 self-employed 0 0.0 0.0 1 0.3 0.3 28 1.2 1.4 73 7.3 8.9 unemployed 0 0.0 0.0 10 2.9 3.2 98 4.2 5.1 78 7.8 9.5 a volunteer 0 0.0 0.0 21 6.1 6.8 317 13.5 16.4 106 10.6 12.9 not in paid work 0 0.0 0.0 5 1.4 1.6 42 1.8 2.2 19 1.9 2.3 other 2 33.3 33.3 60 17.3 19.3 170 7.3 8.8 28 2.8 3.4
Total Responses 6 100.0 100.0 347 100.0 111.6 2,343 100.0 121.2 1,002 100.0 122.3 Table 36: Education and training status at the time of the project – by age groups (PP)
N=3,470; n=3,000
‘Choose at most two answers:’ 0-14 (n=6)
15-17 (n=317)
18-25 (n=1,922)
>25 (n=755)
N % % of
Cases N % % of
Cases N % % of
Cases N % % of
Cases a pupil at school 5 83.3 83.3 282 86.5 89.0 869 42.8 45.2 11 28.2 28.9 a student at a university, polytechnic etc. 0 0.0 0.0 3 0.9 0.9 797 39.3 41.5 19 48.7 50.0
an apprentice 0 0.0 0.0 1 0.3 0.3 40 2.0 2.1 1 2.6 2.6 an intern/doing a work placement 0 0.0 0.0 0 0.0 0.0 60 3.0 3.1 0 0.0 0.0
doing another type of education or training 0 0.0 0.0 23 7.1 7.3 83 4.1 4.3 4 10.3 10.5
not in education or training 1 16.7 16.7 17 5.2 5.4 181 8.9 9.4 4 10.3 10.5
Total Responses 6 100.0 100.0 326 100.0 102.8 2,030 100.0 105.6 39 100.0 102.6
1.9
2.9
6.1
16.2
33.2
44.6
0.0 10.0 20.0 30.0 40.0 50.0
an apprentice [invocational
education or…
an intern/doing awork placement
doing another typeof education or
training
not in education ortraining
a student at auniversity,
polytechnic etc.
a pupil at school[secondary school
student]
‘When I participated in the project, I was …’ multiple response / percentage of cases N=2638; n=2323
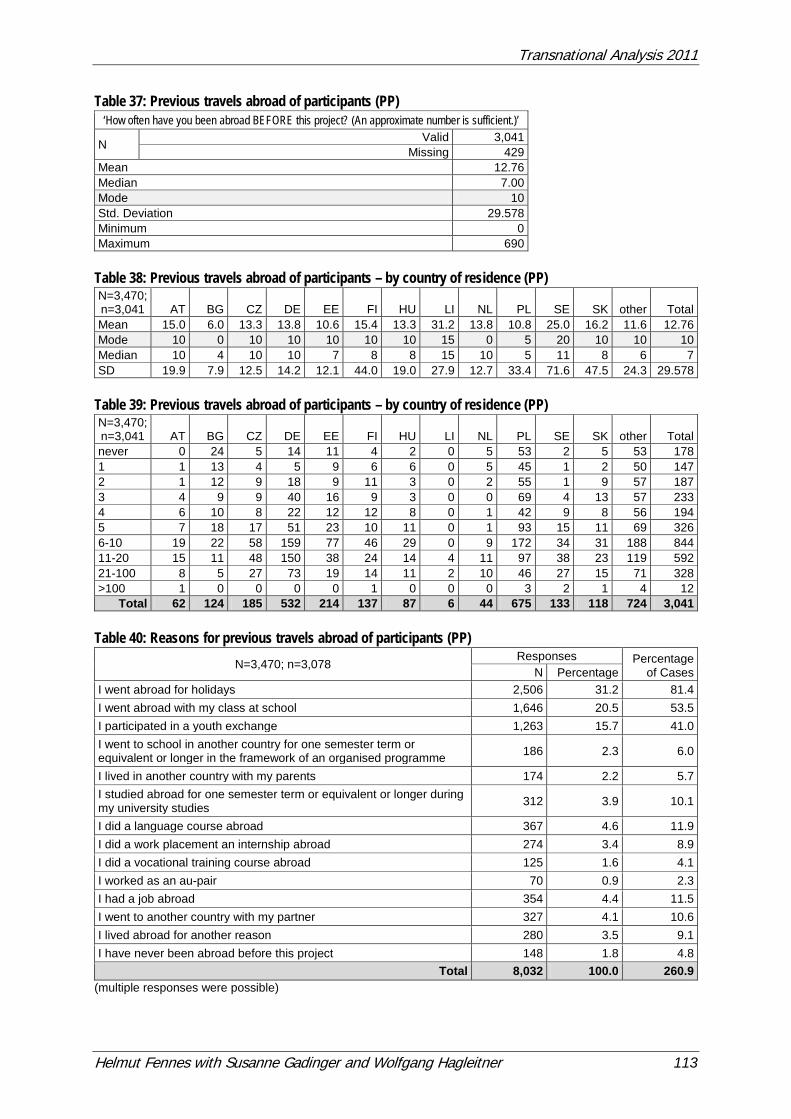
Transnational Analysis 2011
Helmut Fennes with Susanne Gadinger and Wolfgang Hagleitner 113
Table 37: Previous travels abroad of participants (PP) ‘How often have you been abroad BEFORE this project? (An approximate number is sufficient.)’
N Valid 3,041 Missing 429
Mean 12.76 Median 7.00 Mode 10 Std. Deviation 29.578 Minimum 0 Maximum 690 Table 38: Previous travels abroad of participants – by country of residence (PP) N=3,470; n=3,041 AT BG CZ DE EE FI HU LI NL PL SE SK other Total Mean 15.0 6.0 13.3 13.8 10.6 15.4 13.3 31.2 13.8 10.8 25.0 16.2 11.6 12.76 Mode 10 0 10 10 10 10 10 15 0 5 20 10 10 10 Median 10 4 10 10 7 8 8 15 10 5 11 8 6 7 SD 19.9 7.9 12.5 14.2 12.1 44.0 19.0 27.9 12.7 33.4 71.6 47.5 24.3 29.578 Table 39: Previous travels abroad of participants – by country of residence (PP) N=3,470; n=3,041 AT BG CZ DE EE FI HU LI NL PL SE SK other Total never 0 24 5 14 11 4 2 0 5 53 2 5 53 178 1 1 13 4 5 9 6 6 0 5 45 1 2 50 147 2 1 12 9 18 9 11 3 0 2 55 1 9 57 187 3 4 9 9 40 16 9 3 0 0 69 4 13 57 233 4 6 10 8 22 12 12 8 0 1 42 9 8 56 194 5 7 18 17 51 23 10 11 0 1 93 15 11 69 326 6-10 19 22 58 159 77 46 29 0 9 172 34 31 188 844 11-20 15 11 48 150 38 24 14 4 11 97 38 23 119 592 21-100 8 5 27 73 19 14 11 2 10 46 27 15 71 328 >100 1 0 0 0 0 1 0 0 0 3 2 1 4 12
Total 62 124 185 532 214 137 87 6 44 675 133 118 724 3,041 Table 40: Reasons for previous travels abroad of participants (PP)
N=3,470; n=3,078 Responses Percentage
of Cases N Percentage I went abroad for holidays 2,506 31.2 81.4 I went abroad with my class at school 1,646 20.5 53.5 I participated in a youth exchange 1,263 15.7 41.0 I went to school in another country for one semester term or equivalent or longer in the framework of an organised programme 186 2.3 6.0
I lived in another country with my parents 174 2.2 5.7 I studied abroad for one semester term or equivalent or longer during my university studies 312 3.9 10.1
I did a language course abroad 367 4.6 11.9 I did a work placement an internship abroad 274 3.4 8.9 I did a vocational training course abroad 125 1.6 4.1 I worked as an au-pair 70 0.9 2.3 I had a job abroad 354 4.4 11.5 I went to another country with my partner 327 4.1 10.6 I lived abroad for another reason 280 3.5 9.1 I have never been abroad before this project 148 1.8 4.8
Total 8,032 100.0 260.9 (multiple responses were possible)
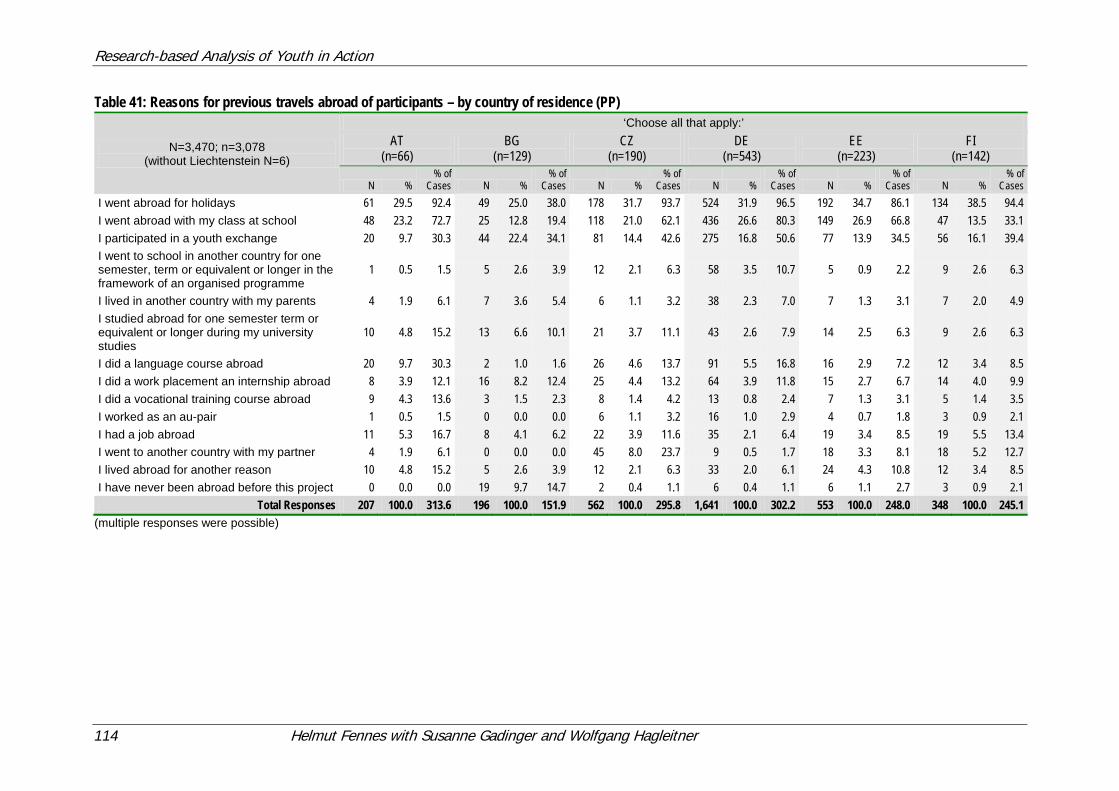
Research-based Analysis of Youth in Action
114 Helmut Fennes with Susanne Gadinger and Wolfgang Hagleitner
Table 41: Reasons for previous travels abroad of participants – by country of residence (PP)
N=3,470; n=3,078 (without Liechtenstein N=6)
‘Choose all that apply:’ AT
(n=66) BG
(n=129) CZ
(n=190) DE
(n=543) EE
(n=223) FI
(n=142)
N % % of
Cases N % % of
Cases N % % of
Cases N % % of
Cases N % % of
Cases N % % of
Cases I went abroad for holidays 61 29.5 92.4 49 25.0 38.0 178 31.7 93.7 524 31.9 96.5 192 34.7 86.1 134 38.5 94.4 I went abroad with my class at school 48 23.2 72.7 25 12.8 19.4 118 21.0 62.1 436 26.6 80.3 149 26.9 66.8 47 13.5 33.1 I participated in a youth exchange 20 9.7 30.3 44 22.4 34.1 81 14.4 42.6 275 16.8 50.6 77 13.9 34.5 56 16.1 39.4 I went to school in another country for one semester, term or equivalent or longer in the framework of an organised programme
1 0.5 1.5 5 2.6 3.9 12 2.1 6.3 58 3.5 10.7 5 0.9 2.2 9 2.6 6.3
I lived in another country with my parents 4 1.9 6.1 7 3.6 5.4 6 1.1 3.2 38 2.3 7.0 7 1.3 3.1 7 2.0 4.9 I studied abroad for one semester term or equivalent or longer during my university studies
10 4.8 15.2 13 6.6 10.1 21 3.7 11.1 43 2.6 7.9 14 2.5 6.3 9 2.6 6.3
I did a language course abroad 20 9.7 30.3 2 1.0 1.6 26 4.6 13.7 91 5.5 16.8 16 2.9 7.2 12 3.4 8.5 I did a work placement an internship abroad 8 3.9 12.1 16 8.2 12.4 25 4.4 13.2 64 3.9 11.8 15 2.7 6.7 14 4.0 9.9 I did a vocational training course abroad 9 4.3 13.6 3 1.5 2.3 8 1.4 4.2 13 0.8 2.4 7 1.3 3.1 5 1.4 3.5 I worked as an au-pair 1 0.5 1.5 0 0.0 0.0 6 1.1 3.2 16 1.0 2.9 4 0.7 1.8 3 0.9 2.1 I had a job abroad 11 5.3 16.7 8 4.1 6.2 22 3.9 11.6 35 2.1 6.4 19 3.4 8.5 19 5.5 13.4 I went to another country with my partner 4 1.9 6.1 0 0.0 0.0 45 8.0 23.7 9 0.5 1.7 18 3.3 8.1 18 5.2 12.7 I lived abroad for another reason 10 4.8 15.2 5 2.6 3.9 12 2.1 6.3 33 2.0 6.1 24 4.3 10.8 12 3.4 8.5 I have never been abroad before this project 0 0.0 0.0 19 9.7 14.7 2 0.4 1.1 6 0.4 1.1 6 1.1 2.7 3 0.9 2.1
Total Responses 207 100.0 313.6 196 100.0 151.9 562 100.0 295.8 1,641 100.0 302.2 553 100.0 248.0 348 100.0 245.1 (multiple responses were possible)
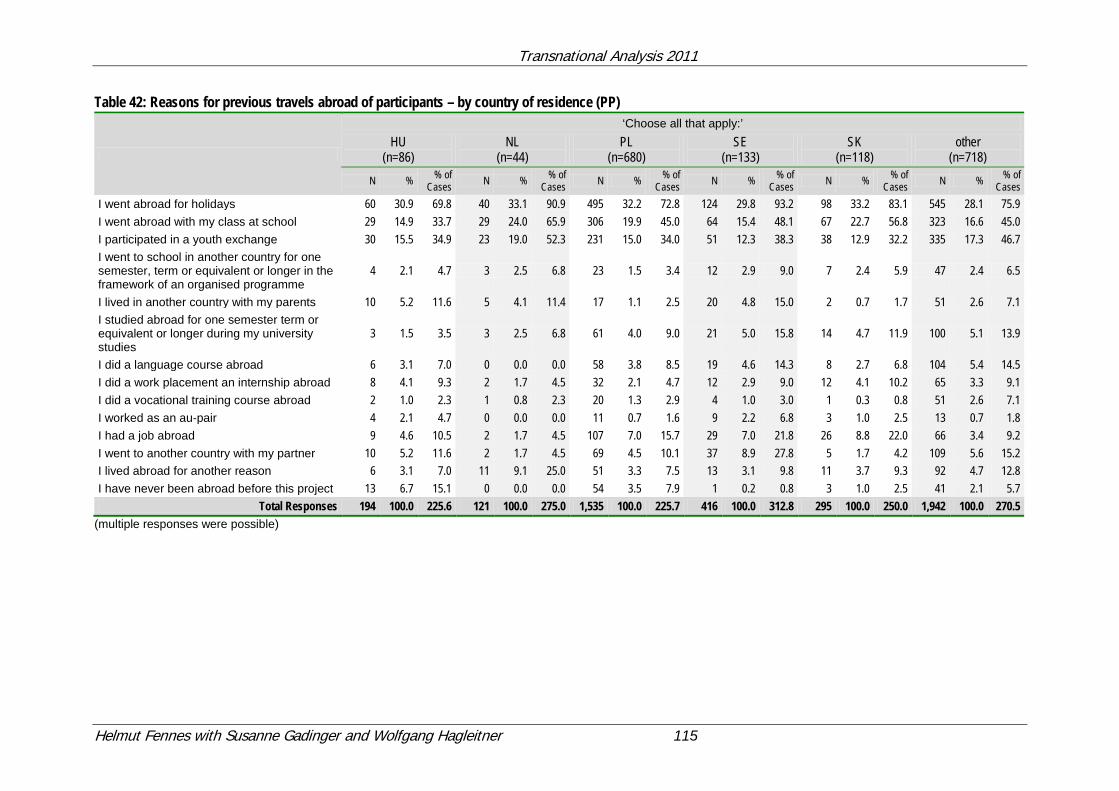
Transnational Analysis 2011
Helmut Fennes with Susanne Gadinger and Wolfgang Hagleitner 115
Table 42: Reasons for previous travels abroad of participants – by country of residence (PP)
‘Choose all that apply:’ HU
(n=86) NL
(n=44) PL
(n=680) SE
(n=133) SK
(n=118) other
(n=718) N % % of
Cases N % % of Cases N % % of
Cases N % % of Cases N % % of
Cases N % % of Cases
I went abroad for holidays 60 30.9 69.8 40 33.1 90.9 495 32.2 72.8 124 29.8 93.2 98 33.2 83.1 545 28.1 75.9 I went abroad with my class at school 29 14.9 33.7 29 24.0 65.9 306 19.9 45.0 64 15.4 48.1 67 22.7 56.8 323 16.6 45.0 I participated in a youth exchange 30 15.5 34.9 23 19.0 52.3 231 15.0 34.0 51 12.3 38.3 38 12.9 32.2 335 17.3 46.7 I went to school in another country for one semester, term or equivalent or longer in the framework of an organised programme
4 2.1 4.7 3 2.5 6.8 23 1.5 3.4 12 2.9 9.0 7 2.4 5.9 47 2.4 6.5
I lived in another country with my parents 10 5.2 11.6 5 4.1 11.4 17 1.1 2.5 20 4.8 15.0 2 0.7 1.7 51 2.6 7.1 I studied abroad for one semester term or equivalent or longer during my university studies
3 1.5 3.5 3 2.5 6.8 61 4.0 9.0 21 5.0 15.8 14 4.7 11.9 100 5.1 13.9
I did a language course abroad 6 3.1 7.0 0 0.0 0.0 58 3.8 8.5 19 4.6 14.3 8 2.7 6.8 104 5.4 14.5 I did a work placement an internship abroad 8 4.1 9.3 2 1.7 4.5 32 2.1 4.7 12 2.9 9.0 12 4.1 10.2 65 3.3 9.1 I did a vocational training course abroad 2 1.0 2.3 1 0.8 2.3 20 1.3 2.9 4 1.0 3.0 1 0.3 0.8 51 2.6 7.1 I worked as an au-pair 4 2.1 4.7 0 0.0 0.0 11 0.7 1.6 9 2.2 6.8 3 1.0 2.5 13 0.7 1.8 I had a job abroad 9 4.6 10.5 2 1.7 4.5 107 7.0 15.7 29 7.0 21.8 26 8.8 22.0 66 3.4 9.2 I went to another country with my partner 10 5.2 11.6 2 1.7 4.5 69 4.5 10.1 37 8.9 27.8 5 1.7 4.2 109 5.6 15.2 I lived abroad for another reason 6 3.1 7.0 11 9.1 25.0 51 3.3 7.5 13 3.1 9.8 11 3.7 9.3 92 4.7 12.8 I have never been abroad before this project 13 6.7 15.1 0 0.0 0.0 54 3.5 7.9 1 0.2 0.8 3 1.0 2.5 41 2.1 5.7
Total Responses 194 100.0 225.6 121 100.0 275.0 1,535 100.0 225.7 416 100.0 312.8 295 100.0 250.0 1,942 100.0 270.5 (multiple responses were possible)
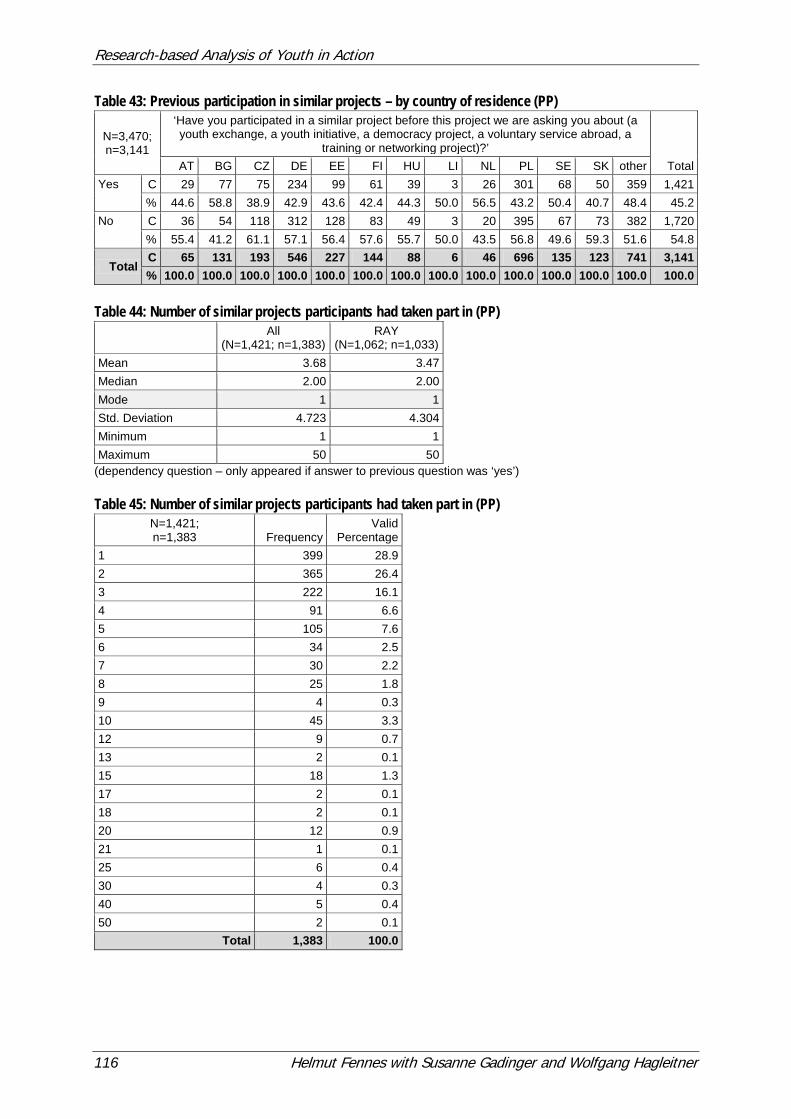
Research-based Analysis of Youth in Action
116 Helmut Fennes with Susanne Gadinger and Wolfgang Hagleitner
Table 43: Previous participation in similar projects – by country of residence (PP)
N=3,470; n=3,141
‘Have you participated in a similar project before this project we are asking you about (a youth exchange, a youth initiative, a democracy project, a voluntary service abroad, a
training or networking project)?’ Total AT BG CZ DE EE FI HU LI NL PL SE SK other
Yes C 29 77 75 234 99 61 39 3 26 301 68 50 359 1,421 % 44.6 58.8 38.9 42.9 43.6 42.4 44.3 50.0 56.5 43.2 50.4 40.7 48.4 45.2
No C 36 54 118 312 128 83 49 3 20 395 67 73 382 1,720 % 55.4 41.2 61.1 57.1 56.4 57.6 55.7 50.0 43.5 56.8 49.6 59.3 51.6 54.8
Total C 65 131 193 546 227 144 88 6 46 696 135 123 741 3,141 % 100.0 100.0 100.0 100.0 100.0 100.0 100.0 100.0 100.0 100.0 100.0 100.0 100.0 100.0
Table 44: Number of similar projects participants had taken part in (PP) All
(N=1,421; n=1,383) RAY
(N=1,062; n=1,033) Mean 3.68 3.47 Median 2.00 2.00 Mode 1 1 Std. Deviation 4.723 4.304 Minimum 1 1 Maximum 50 50
(dependency question – only appeared if answer to previous question was ‘yes’) Table 45: Number of similar projects participants had taken part in (PP)
N=1,421; n=1,383 Frequency
Valid Percentage
1 399 28.9 2 365 26.4 3 222 16.1 4 91 6.6 5 105 7.6 6 34 2.5 7 30 2.2 8 25 1.8 9 4 0.3 10 45 3.3 12 9 0.7 13 2 0.1 15 18 1.3 17 2 0.1 18 2 0.1 20 12 0.9 21 1 0.1 25 6 0.4 30 4 0.3 40 5 0.4 50 2 0.1
Total 1,383 100.0
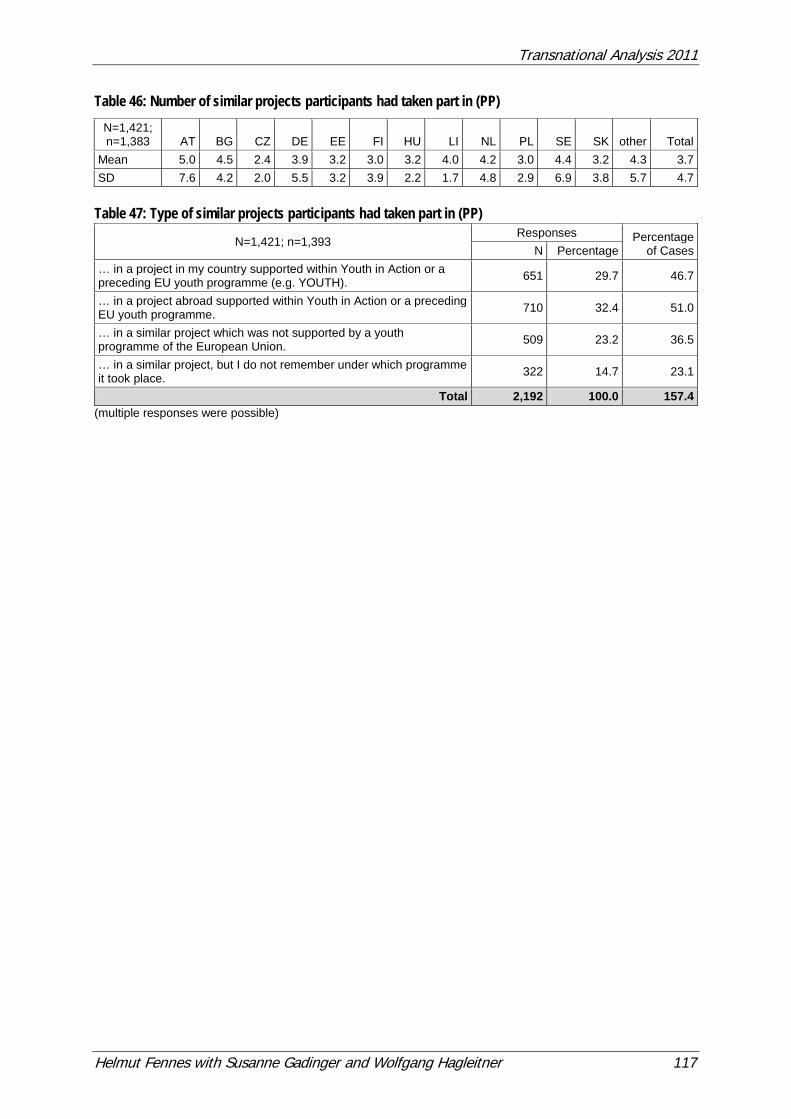
Transnational Analysis 2011
Helmut Fennes with Susanne Gadinger and Wolfgang Hagleitner 117
Table 46: Number of similar projects participants had taken part in (PP)
Table 47: Type of similar projects participants had taken part in (PP)
N=1,421; n=1,393 Responses Percentage
of Cases N Percentage … in a project in my country supported within Youth in Action or a preceding EU youth programme (e.g. YOUTH). 651 29.7 46.7
… in a project abroad supported within Youth in Action or a preceding EU youth programme. 710 32.4 51.0
… in a similar project which was not supported by a youth programme of the European Union. 509 23.2 36.5
… in a similar project, but I do not remember under which programme it took place. 322 14.7 23.1
Total 2,192 100.0 157.4 (multiple responses were possible)
N=1,421; n=1,383 AT BG CZ DE EE FI HU LI NL PL SE SK other Total
Mean 5.0 4.5 2.4 3.9 3.2 3.0 3.2 4.0 4.2 3.0 4.4 3.2 4.3 3.7 SD 7.6 4.2 2.0 5.5 3.2 3.9 2.2 1.7 4.8 2.9 6.9 3.8 5.7 4.7
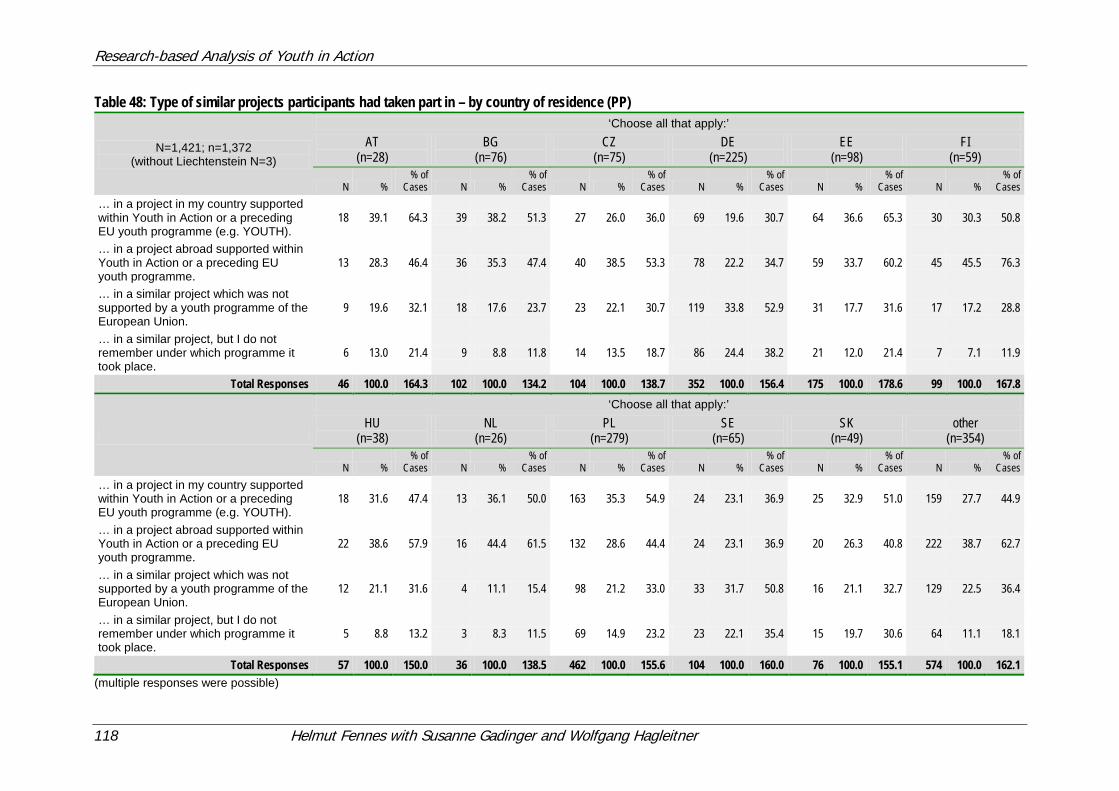
Research-based Analysis of Youth in Action
118 Helmut Fennes with Susanne Gadinger and Wolfgang Hagleitner
Table 48: Type of similar projects participants had taken part in – by country of residence (PP)
N=1,421; n=1,372 (without Liechtenstein N=3)
‘Choose all that apply:’ AT
(n=28) BG
(n=76) CZ
(n=75) DE
(n=225) EE
(n=98) FI
(n=59)
N % % of
Cases N % % of
Cases N % % of
Cases N % % of
Cases N % % of
Cases N % % of
Cases … in a project in my country supported within Youth in Action or a preceding EU youth programme (e.g. YOUTH).
18 39.1 64.3 39 38.2 51.3 27 26.0 36.0 69 19.6 30.7 64 36.6 65.3 30 30.3 50.8
… in a project abroad supported within Youth in Action or a preceding EU youth programme.
13 28.3 46.4 36 35.3 47.4 40 38.5 53.3 78 22.2 34.7 59 33.7 60.2 45 45.5 76.3
… in a similar project which was not supported by a youth programme of the European Union.
9 19.6 32.1 18 17.6 23.7 23 22.1 30.7 119 33.8 52.9 31 17.7 31.6 17 17.2 28.8
… in a similar project, but I do not remember under which programme it took place.
6 13.0 21.4 9 8.8 11.8 14 13.5 18.7 86 24.4 38.2 21 12.0 21.4 7 7.1 11.9
Total Responses 46 100.0 164.3 102 100.0 134.2 104 100.0 138.7 352 100.0 156.4 175 100.0 178.6 99 100.0 167.8
‘Choose all that apply:’ HU
(n=38) NL
(n=26) PL
(n=279) SE
(n=65) SK
(n=49) other
(n=354)
N % % of
Cases N % % of
Cases N % % of
Cases N % % of
Cases N % % of
Cases N % % of
Cases … in a project in my country supported within Youth in Action or a preceding EU youth programme (e.g. YOUTH).
18 31.6 47.4 13 36.1 50.0 163 35.3 54.9 24 23.1 36.9 25 32.9 51.0 159 27.7 44.9
… in a project abroad supported within Youth in Action or a preceding EU youth programme.
22 38.6 57.9 16 44.4 61.5 132 28.6 44.4 24 23.1 36.9 20 26.3 40.8 222 38.7 62.7
… in a similar project which was not supported by a youth programme of the European Union.
12 21.1 31.6 4 11.1 15.4 98 21.2 33.0 33 31.7 50.8 16 21.1 32.7 129 22.5 36.4
… in a similar project, but I do not remember under which programme it took place.
5 8.8 13.2 3 8.3 11.5 69 14.9 23.2 23 22.1 35.4 15 19.7 30.6 64 11.1 18.1
Total Responses 57 100.0 150.0 36 100.0 138.5 462 100.0 155.6 104 100.0 160.0 76 100.0 155.1 574 100.0 162.1 (multiple responses were possible)
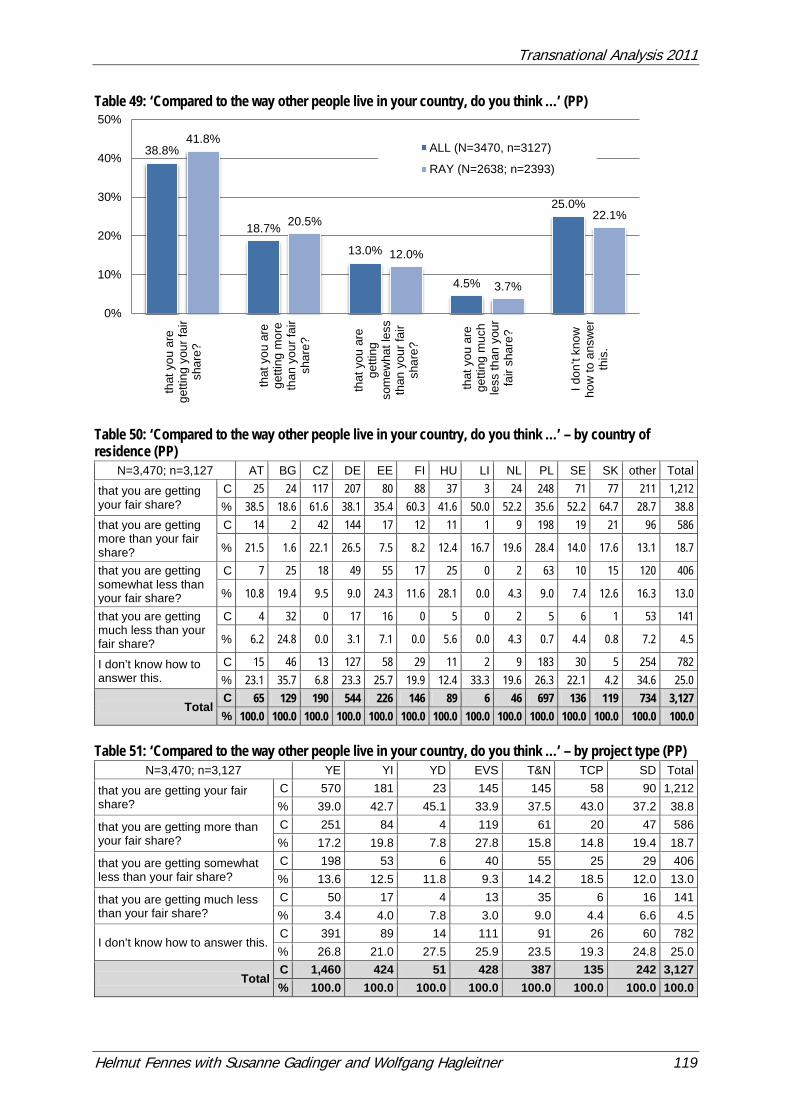
Transnational Analysis 2011
Helmut Fennes with Susanne Gadinger and Wolfgang Hagleitner 119
Table 49: ‘Compared to the way other people live in your country, do you think …’ (PP)
Table 50: ‘Compared to the way other people live in your country, do you think …’ – by country of residence (PP)
N=3,470; n=3,127 AT BG CZ DE EE FI HU LI NL PL SE SK other Total
that you are getting your fair share?
C 25 24 117 207 80 88 37 3 24 248 71 77 211 1,212 % 38.5 18.6 61.6 38.1 35.4 60.3 41.6 50.0 52.2 35.6 52.2 64.7 28.7 38.8
that you are getting more than your fair share?
C 14 2 42 144 17 12 11 1 9 198 19 21 96 586
% 21.5 1.6 22.1 26.5 7.5 8.2 12.4 16.7 19.6 28.4 14.0 17.6 13.1 18.7
that you are getting somewhat less than your fair share?
C 7 25 18 49 55 17 25 0 2 63 10 15 120 406
% 10.8 19.4 9.5 9.0 24.3 11.6 28.1 0.0 4.3 9.0 7.4 12.6 16.3 13.0
that you are getting much less than your fair share?
C 4 32 0 17 16 0 5 0 2 5 6 1 53 141
% 6.2 24.8 0.0 3.1 7.1 0.0 5.6 0.0 4.3 0.7 4.4 0.8 7.2 4.5
I don’t know how to answer this.
C 15 46 13 127 58 29 11 2 9 183 30 5 254 782 % 23.1 35.7 6.8 23.3 25.7 19.9 12.4 33.3 19.6 26.3 22.1 4.2 34.6 25.0
Total C 65 129 190 544 226 146 89 6 46 697 136 119 734 3,127 % 100.0 100.0 100.0 100.0 100.0 100.0 100.0 100.0 100.0 100.0 100.0 100.0 100.0 100.0
Table 51: ‘Compared to the way other people live in your country, do you think …’ – by project type (PP)
N=3,470; n=3,127 YE YI YD EVS T&N TCP SD Total
that you are getting your fair share?
C 570 181 23 145 145 58 90 1,212 % 39.0 42.7 45.1 33.9 37.5 43.0 37.2 38.8
that you are getting more than your fair share?
C 251 84 4 119 61 20 47 586 % 17.2 19.8 7.8 27.8 15.8 14.8 19.4 18.7
that you are getting somewhat less than your fair share?
C 198 53 6 40 55 25 29 406 % 13.6 12.5 11.8 9.3 14.2 18.5 12.0 13.0
that you are getting much less than your fair share?
C 50 17 4 13 35 6 16 141 % 3.4 4.0 7.8 3.0 9.0 4.4 6.6 4.5
I don’t know how to answer this. C 391 89 14 111 91 26 60 782 % 26.8 21.0 27.5 25.9 23.5 19.3 24.8 25.0
Total C 1,460 424 51 428 387 135 242 3,127 % 100.0 100.0 100.0 100.0 100.0 100.0 100.0 100.0
38.8%
18.7%
13.0%
4.5%
25.0%
41.8%
20.5%
12.0%
3.7%
22.1%
0%
10%
20%
30%
40%
50%
that
you
are
getti
ng y
our f
air
shar
e?
that
you
are
getti
ng m
ore
than
you
r fai
rsh
are?
that
you
are
getti
ngso
mew
hat l
ess
than
you
r fai
rsh
are?
that
you
are
getti
ng m
uch
less
than
you
rfa
ir sh
are?
I don
’t kn
ow
how
to a
nsw
er
this
.
ALL (N=3470, n=3127)
RAY (N=2638; n=2393)
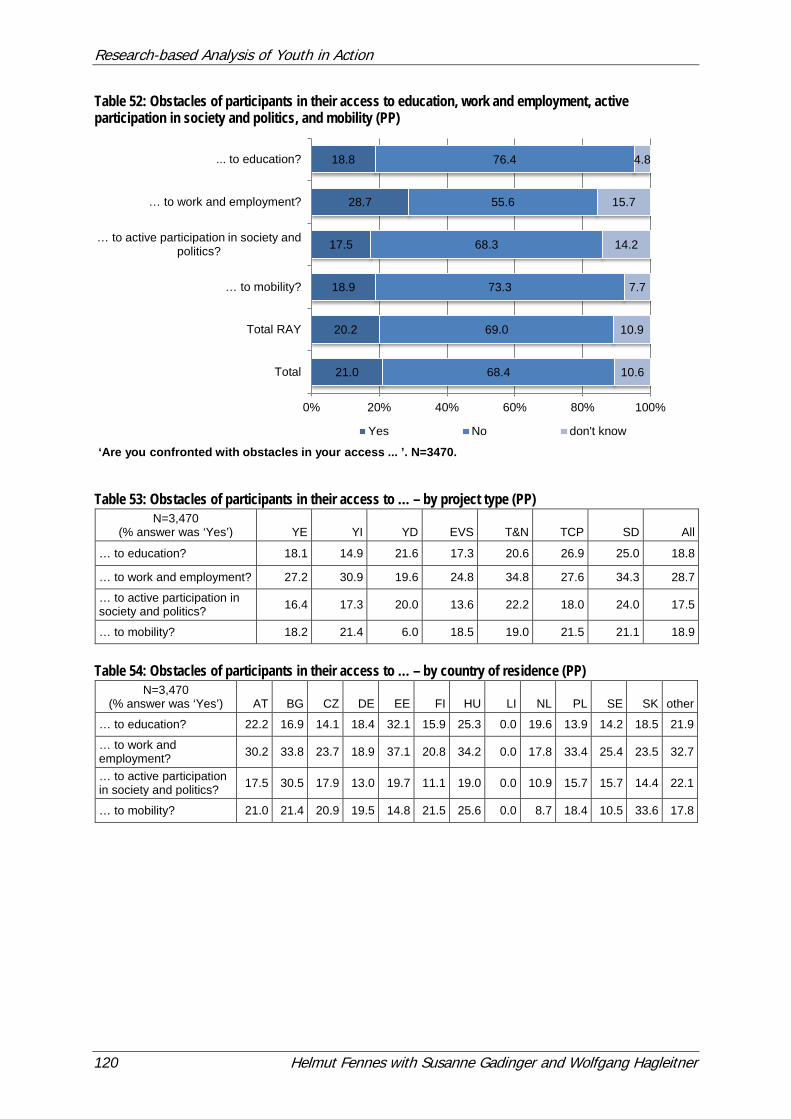
Research-based Analysis of Youth in Action
120 Helmut Fennes with Susanne Gadinger and Wolfgang Hagleitner
Table 52: Obstacles of participants in their access to education, work and employment, active participation in society and politics, and mobility (PP)
Table 53: Obstacles of participants in their access to … – by project type (PP)
N=3,470 (% answer was ‘Yes’) YE YI YD EVS T&N TCP SD All
… to education? 18.1 14.9 21.6 17.3 20.6 26.9 25.0 18.8
… to work and employment? 27.2 30.9 19.6 24.8 34.8 27.6 34.3 28.7
… to active participation in society and politics? 16.4 17.3 20.0 13.6 22.2 18.0 24.0 17.5
… to mobility? 18.2 21.4 6.0 18.5 19.0 21.5 21.1 18.9
Table 54: Obstacles of participants in their access to … – by country of residence (PP)
N=3,470 (% answer was ‘Yes’) AT BG CZ DE EE FI HU LI NL PL SE SK other
… to education? 22.2 16.9 14.1 18.4 32.1 15.9 25.3 0.0 19.6 13.9 14.2 18.5 21.9
… to work and employment? 30.2 33.8 23.7 18.9 37.1 20.8 34.2 0.0 17.8 33.4 25.4 23.5 32.7
… to active participation in society and politics? 17.5 30.5 17.9 13.0 19.7 11.1 19.0 0.0 10.9 15.7 15.7 14.4 22.1
… to mobility? 21.0 21.4 20.9 19.5 14.8 21.5 25.6 0.0 8.7 18.4 10.5 33.6 17.8
21.0
20.2
18.9
17.5
28.7
18.8
68.4
69.0
73.3
68.3
55.6
76.4
10.6
10.9
7.7
14.2
15.7
4.8
0% 20% 40% 60% 80% 100%
Total
Total RAY
… to mobility?
… to active participation in society and politics?
… to work and employment?
... to education?
‘Are you confronted with obstacles in your access ... ’. N=3470.
Yes No don't know
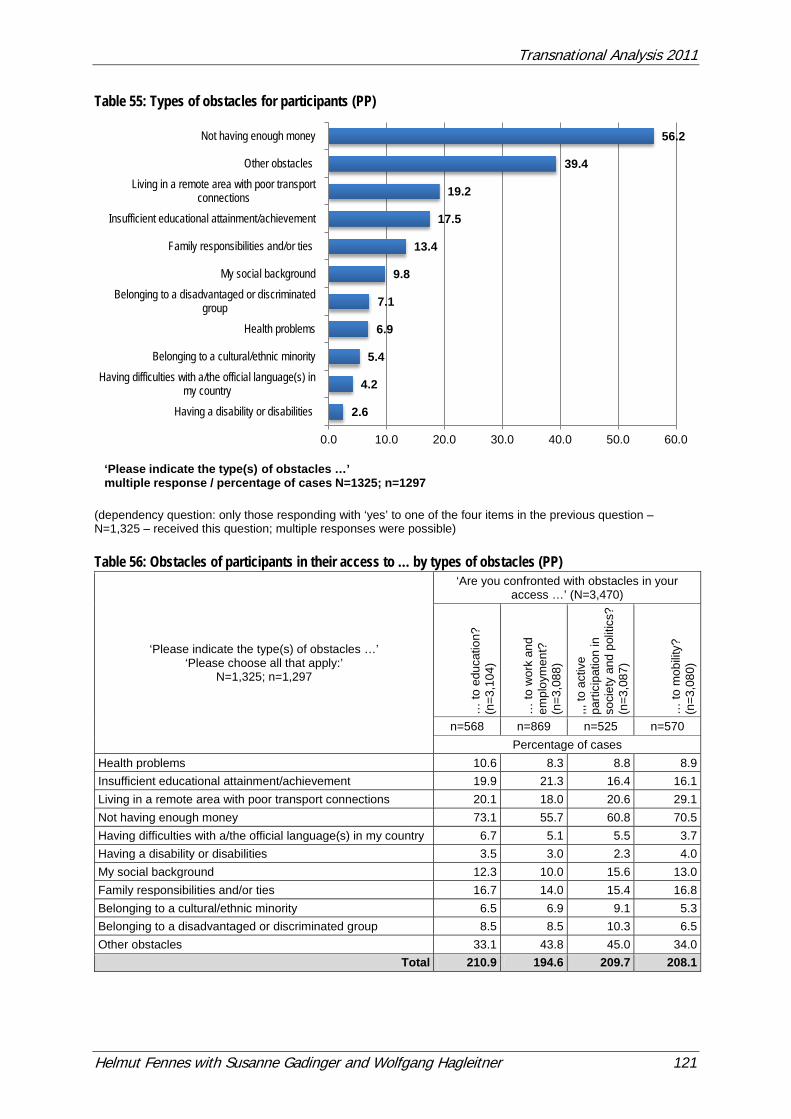
Transnational Analysis 2011
Helmut Fennes with Susanne Gadinger and Wolfgang Hagleitner 121
Table 55: Types of obstacles for participants (PP)
(dependency question: only those responding with ‘yes’ to one of the four items in the previous question – N=1,325 – received this question; multiple responses were possible) Table 56: Obstacles of participants in their access to … by types of obstacles (PP)
‘Please indicate the type(s) of obstacles …’ ‘Please choose all that apply:’
N=1,325; n=1,297
‘Are you confronted with obstacles in your access …’ (N=3,470)
… to
edu
catio
n?
(n=3
,104
)
… to
wor
k an
d em
ploy
men
t?
(n=3
,088
)
,,, to
act
ive
parti
cipa
tion
in
soci
ety
and
polit
ics?
(n
=3,0
87)
… to
mob
ility
? (n
=3,0
80)
n=568 n=869 n=525 n=570 Percentage of cases
Health problems 10.6 8.3 8.8 8.9 Insufficient educational attainment/achievement 19.9 21.3 16.4 16.1 Living in a remote area with poor transport connections 20.1 18.0 20.6 29.1 Not having enough money 73.1 55.7 60.8 70.5 Having difficulties with a/the official language(s) in my country 6.7 5.1 5.5 3.7 Having a disability or disabilities 3.5 3.0 2.3 4.0 My social background 12.3 10.0 15.6 13.0 Family responsibilities and/or ties 16.7 14.0 15.4 16.8 Belonging to a cultural/ethnic minority 6.5 6.9 9.1 5.3 Belonging to a disadvantaged or discriminated group 8.5 8.5 10.3 6.5 Other obstacles 33.1 43.8 45.0 34.0
Total 210.9 194.6 209.7 208.1
2.6
4.2
5.4
6.9
7.1
9.8
13.4
17.5
19.2
39.4
56.2
0.0 10.0 20.0 30.0 40.0 50.0 60.0
Having a disability or disabilities
Having difficulties with a/the official language(s) inmy country
Belonging to a cultural/ethnic minority
Health problems
Belonging to a disadvantaged or discriminatedgroup
My social background
Family responsibilities and/or ties
Insufficient educational attainment/achievement
Living in a remote area with poor transportconnections
Other obstacles
Not having enough money
‘Please indicate the type(s) of obstacles …’ multiple response / percentage of cases N=1325; n=1297
Research-based Analysis of Youth in Action
122 Helmut Fennes with Susanne Gadinger and Wolfgang Hagleitner
Table 57: Obstacles of participants in their access to … by affiliation to a minority type (PP)
'Do you belong to a cultural, ethnic, religious or linguistic minority in the country where you live?’ (N=3,470; n=3,116)
‘If yes please specify’ (N=353; n=348) ‘Please choose all that apply:’
‘Are you confronted with obstacles in your access …’ (N=3,470)
… to
edu
catio
n?
(n=3
104)
… to
wor
k an
d em
ploy
men
t?
(n=3
088)
… to
act
ive
parti
cipa
tion
in
soci
ety
and
polit
ics?
(n
=308
7)
… to
mob
ility
? (n
=308
0)
n=98 n=148 n=114 n=73 Percentage of cases
I belong to a minority that has always lived in this country. [autochthonous/indigenous minority] 21.4 24.3 23.7 24.7
I belong to an ethnic or cultural minority 44.9 40.5 40.4 41.1 I belong to a religious minority 27.6 29.1 28.9 31.5 I belong to a linguistic minority 34.7 33.8 32.5 34.2 I am an immigrant (first generation – I was born in another country) 19.4 18.2 20.2 17.8
I have a migration background (second or third generation – my parents or grandparents were born in another country). 23.5 18.2 21.1 17.8
Other minorities 10.2 9.5 12.3 13.7 Total 181.6 173.6 178.9 180.8
Table 58: Obstacles for participants in their access to education … by affiliation to a minority (PP)
N=3,470; n=3,080 ‘Are you confronted with obstacles in your
access to education?’ Total yes no don´t know
‘Do you belong to a cultural, ethnic, religious or linguistic minority in the country where you live?’
Yes Count 99 232 16 347
% horizontal 28.5 66.9 4.6 100.0 % vertical 17.1 9.8 11.1 11,3
No Count 480 2,125 128 2,733
% horizontal 17.6 77.8 4.7 100.0 % vertical 82.9 90.2 88.9 88.7
Total Count 579 2,357 144 3,080
% horizontal 18.8 76.5 4.7 100.0 % vertical 100.0 100.0 100.0 100.0
Table 59: Obstacles for participants in their access to participation … by affiliation to a minority (PP)
N=3,470; n=3,063
‘Are you confronted with obstacles in your access to active participation in society and
politics?’ Total yes no don´t know
‘Do you belong to a cultural, ethnic, religious or linguistic minority in the country where you live?’
Yes Count 117 192 36 345
% horizontal 33.9 55.7 10.4 100.0 % vertical 21.8 9.2 8.4 11.3
No Count 420 1,904 394 2,718
% horizontal 15.5 70.1 14.5 100.0 % vertical 78.2 90.8 91.6 88.7
Total Count 537 2,096 430 3,063
% horizontal 17.5 68.4 14.0 100.0 % vertical 100.0 100.0 100.0 100.0
Transnational Analysis 2011
Helmut Fennes with Susanne Gadinger and Wolfgang Hagleitner 123
Table 60: Obstacles for participants in their access to mobility … by affiliation to a minority (PP)
N=3,470; n=3,056 ‘Are you confronted with obstacles in your
access to mobility?’ Total yes no don´t know
‘Do you belong to a cultural, ethnic, religious or linguistic minority in the country where you live?’
Yes Count 74 240 29 343
% horizontal 21.6 70.0 8.5 100.0 % vertical 12.8 10.7 12.4 11.2
No Count 504 2,005 204 2,713
% horizontal 18.6 73.9 7.5 100.0 % vertical 87.2 89.3 87.6 88.8
Total Count 578 2,245 233 3,056
% horizontal 18.9 73.5 7.6 100.0 % vertical 100.0 100.0 100.0 100.0
Table 61: Young people with fewer opportunities participating in the projects – by (sub-)Action (PL)
N=1,052; n=1,007 ‘Did young people with fewer opportunities participate in the project?’
Total 1.1 YE 3.1 YE 1.2 YI 1.3 YD 2.1 EVS 5.1 SD
Yes Count 291 45 86 16 57 21 516
% 57.1 60.0 65.2 47.1 25.9 58.3 51.2
No Count 141 20 24 8 135 9 337
% 27.6 26.7 18.2 23.5 61.4 25.0 33.5
Don’t remember/ don’t know
Count 78 10 22 10 28 6 154 % 15.3 13.3 16.7 29.4 12.7 16.7 15.3
Total Count 510 75 132 34 220 36 1,007
% 100.0 100.0 100.0 100.0 100.0 100.0 100.0 (dependency question: project leaders of T&N projects did not receive this question) Table 62: Young people with fewer opportunities participating in the projects – types of obstacles (PL)
‘Please specify which obstacles prevented them from having access to education, mobility, participation, active citizenship, empowerment and inclusion in society at
large…’
N=516; n=508 Responses Percentage
of Cases N Percentage Social obstacles 315 24.0 62.0 Economic obstacles 361 27.6 71.1 Education difficulties 174 13.3 34.3 Cultural differences 133 10.2 26.2 Physical or mental disabilities 101 7.7 19.9 Health problems 73 5.6 14.4 Geographical obstacles 153 11.7 30.1
Total 1,310 100.0 257.9 (dependency question: only project leaders ticking ‘yes’ in the previous question received this question; multiple responses were possible.)
Research-based Analysis of Youth in Action
124 Helmut Fennes with Susanne Gadinger and Wolfgang Hagleitner
Table 63: Participants in T&N projects working with young people with fewer opportunities (PL)
N=163; n=155
‘Did persons working with young people with fewer opportunities
participate in the project?’ Total 3.1 T&N 4.3 T&N
Yes Count 36 68 104
% 67.9 66.7 67.1
No Count 11 16 27
% 20.8 15.7 17.4
Don’t know Count 6 18 24
% 11.3 17.6 15.5
Total Count 53 102 155
% 100.0 100.0 100.0 (dependency question: only project leaders of T&N projects received this question)
Transnational Analysis 2011
Helmut Fennes with Susanne Gadinger and Wolfgang Hagleitner 125
Table 64: Types of obstacles for participants – by country of residence (PP)
N=1,325; n=1,297 (without Liechtenstein N=6)
‘Choose all that apply:’ AT
(n=25) BG
(n=62) CZ
(n=74) DE
(n=209) EE
(n=115) FI
(n=45)
N % % of
cases N % % of
cases N % % of
cases N % % of
cases N % % of
cases N % % of
cases Health problems 2 4.7 8.0 3 3.1 4.8 5 4.0 6.8 9 2.4 4.3 5 2.2 4.3 8 7.5 17.8 Insufficient educational attainment/achievement 0 0.0 0.0 13 13.3 21.0 9 7.3 12.2 26 7.0 12.4 36 15.9 31.3 8 7.5 17.8
Living in a remote area with poor transport connections 11 25.6 44.0 7 7.1 11.3 10 8.1 13.5 46 12.4 22.0 10 4.4 8.7 15 14.0 33.3
Not having enough money 13 30.2 52.0 29 29.6 46.8 48 38.7 64.9 128 34.5 61.2 74 32.6 64.3 29 27.1 64.4 Having difficulties with a/the official language(s) in my country 1 2.3 4.0 0 0.0 0.0 1 0.8 1.4 4 1.1 1.9 23 10.1 20.0 3 2.8 6.7
Having a disability or disabilities 0 0.0 0.0 1 1.0 1.6 3 2.4 4.1 6 1.6 2.9 4 1.8 3.5 7 6.5 15.6 My social background 3 7.0 12.0 13 13.3 21.0 9 7.3 12.2 29 7.8 13.9 5 2.2 4.3 6 5.6 13.3 Family responsibilities and/or ties 1 2.3 4.0 3 3.1 4.8 9 7.3 12.2 18 4.9 8.6 18 7.9 15.7 11 10.3 24.4 Belonging to a cultural/ethnic minority 1 2.3 4.0 0 0.0 0.0 3 2.4 4.1 14 3.8 6.7 14 6.2 12.2 1 0.9 2.2
Belonging to a disadvantaged or discriminated group 2 4.7 8.0 6 6.1 9.7 3 2.4 4.1 10 2.7 4.8 9 4.0 7.8 6 5.6 13.3
Other obstacles 9 20.9 36.0 23 23.5 37.1 24 19.4 32.4 81 21.8 38.8 29 12.8 25.2 13 12.1 28.9 Total Responses 43 100.0 172.0 98 100.0 158.1 124 100.0 167.6 371 100.0 177.5 227 100.0 197.4 107 100.0 237.8
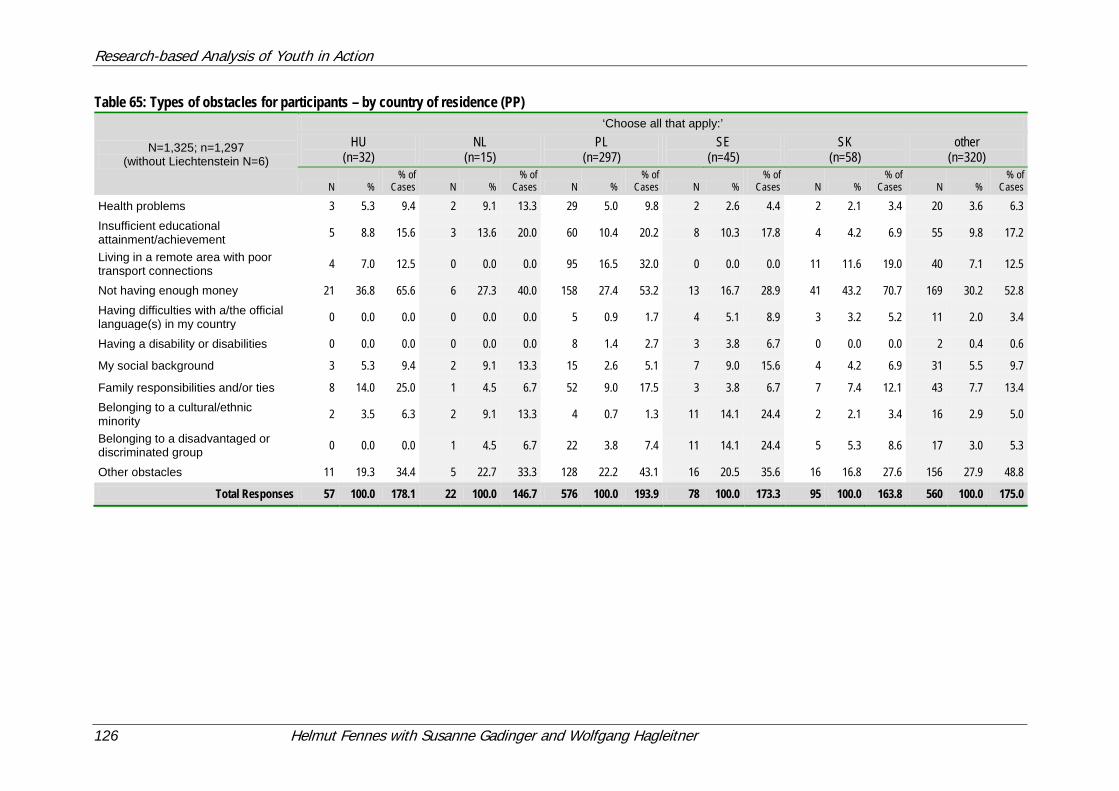
Research-based Analysis of Youth in Action
126 Helmut Fennes with Susanne Gadinger and Wolfgang Hagleitner
Table 65: Types of obstacles for participants – by country of residence (PP)
N=1,325; n=1,297 (without Liechtenstein N=6)
‘Choose all that apply:’ HU
(n=32) NL
(n=15) PL
(n=297) SE
(n=45) SK
(n=58) other
(n=320)
N % % of
Cases N % % of
Cases N % % of
Cases N % % of
Cases N % % of
Cases N % % of
Cases
Health problems 3 5.3 9.4 2 9.1 13.3 29 5.0 9.8 2 2.6 4.4 2 2.1 3.4 20 3.6 6.3 Insufficient educational attainment/achievement 5 8.8 15.6 3 13.6 20.0 60 10.4 20.2 8 10.3 17.8 4 4.2 6.9 55 9.8 17.2
Living in a remote area with poor transport connections 4 7.0 12.5 0 0.0 0.0 95 16.5 32.0 0 0.0 0.0 11 11.6 19.0 40 7.1 12.5
Not having enough money 21 36.8 65.6 6 27.3 40.0 158 27.4 53.2 13 16.7 28.9 41 43.2 70.7 169 30.2 52.8 Having difficulties with a/the official language(s) in my country 0 0.0 0.0 0 0.0 0.0 5 0.9 1.7 4 5.1 8.9 3 3.2 5.2 11 2.0 3.4
Having a disability or disabilities 0 0.0 0.0 0 0.0 0.0 8 1.4 2.7 3 3.8 6.7 0 0.0 0.0 2 0.4 0.6
My social background 3 5.3 9.4 2 9.1 13.3 15 2.6 5.1 7 9.0 15.6 4 4.2 6.9 31 5.5 9.7
Family responsibilities and/or ties 8 14.0 25.0 1 4.5 6.7 52 9.0 17.5 3 3.8 6.7 7 7.4 12.1 43 7.7 13.4 Belonging to a cultural/ethnic minority 2 3.5 6.3 2 9.1 13.3 4 0.7 1.3 11 14.1 24.4 2 2.1 3.4 16 2.9 5.0
Belonging to a disadvantaged or discriminated group 0 0.0 0.0 1 4.5 6.7 22 3.8 7.4 11 14.1 24.4 5 5.3 8.6 17 3.0 5.3
Other obstacles 11 19.3 34.4 5 22.7 33.3 128 22.2 43.1 16 20.5 35.6 16 16.8 27.6 156 27.9 48.8
Total Responses 57 100.0 178.1 22 100.0 146.7 576 100.0 193.9 78 100.0 173.3 95 100.0 163.8 560 100.0 175.0
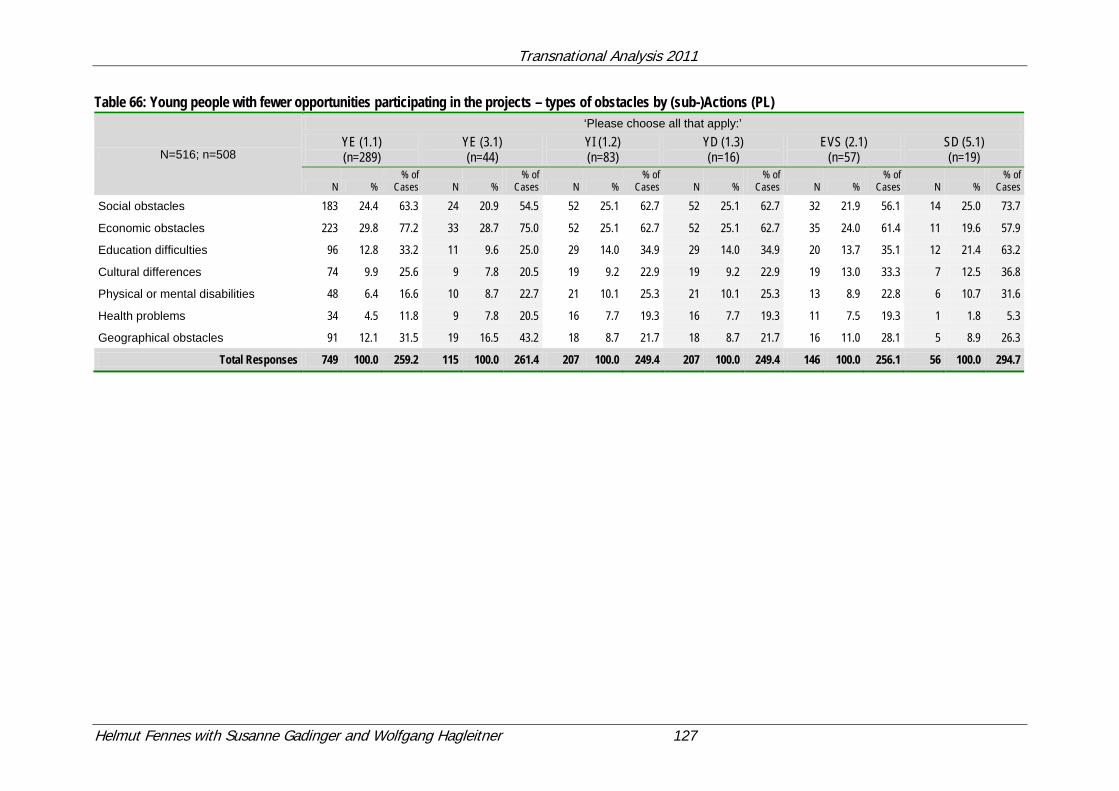
Transnational Analysis 2011
Helmut Fennes with Susanne Gadinger and Wolfgang Hagleitner 127
Table 66: Young people with fewer opportunities participating in the projects – types of obstacles by (sub-)Actions (PL)
N=516; n=508
‘Please choose all that apply:’ YE (1.1) (n=289)
YE (3.1) (n=44)
YI (1.2) (n=83)
YD (1.3) (n=16)
EVS (2.1) (n=57)
SD (5.1) (n=19)
N % % of
Cases N % % of
Cases N % % of
Cases N % % of
Cases N % % of
Cases N % % of
Cases
Social obstacles 183 24.4 63.3 24 20.9 54.5 52 25.1 62.7 52 25.1 62.7 32 21.9 56.1 14 25.0 73.7
Economic obstacles 223 29.8 77.2 33 28.7 75.0 52 25.1 62.7 52 25.1 62.7 35 24.0 61.4 11 19.6 57.9
Education difficulties 96 12.8 33.2 11 9.6 25.0 29 14.0 34.9 29 14.0 34.9 20 13.7 35.1 12 21.4 63.2
Cultural differences 74 9.9 25.6 9 7.8 20.5 19 9.2 22.9 19 9.2 22.9 19 13.0 33.3 7 12.5 36.8
Physical or mental disabilities 48 6.4 16.6 10 8.7 22.7 21 10.1 25.3 21 10.1 25.3 13 8.9 22.8 6 10.7 31.6
Health problems 34 4.5 11.8 9 7.8 20.5 16 7.7 19.3 16 7.7 19.3 11 7.5 19.3 1 1.8 5.3
Geographical obstacles 91 12.1 31.5 19 16.5 43.2 18 8.7 21.7 18 8.7 21.7 16 11.0 28.1 5 8.9 26.3
Total Responses 749 100.0 259.2 115 100.0 261.4 207 100.0 249.4 207 100.0 249.4 146 100.0 256.1 56 100.0 294.7
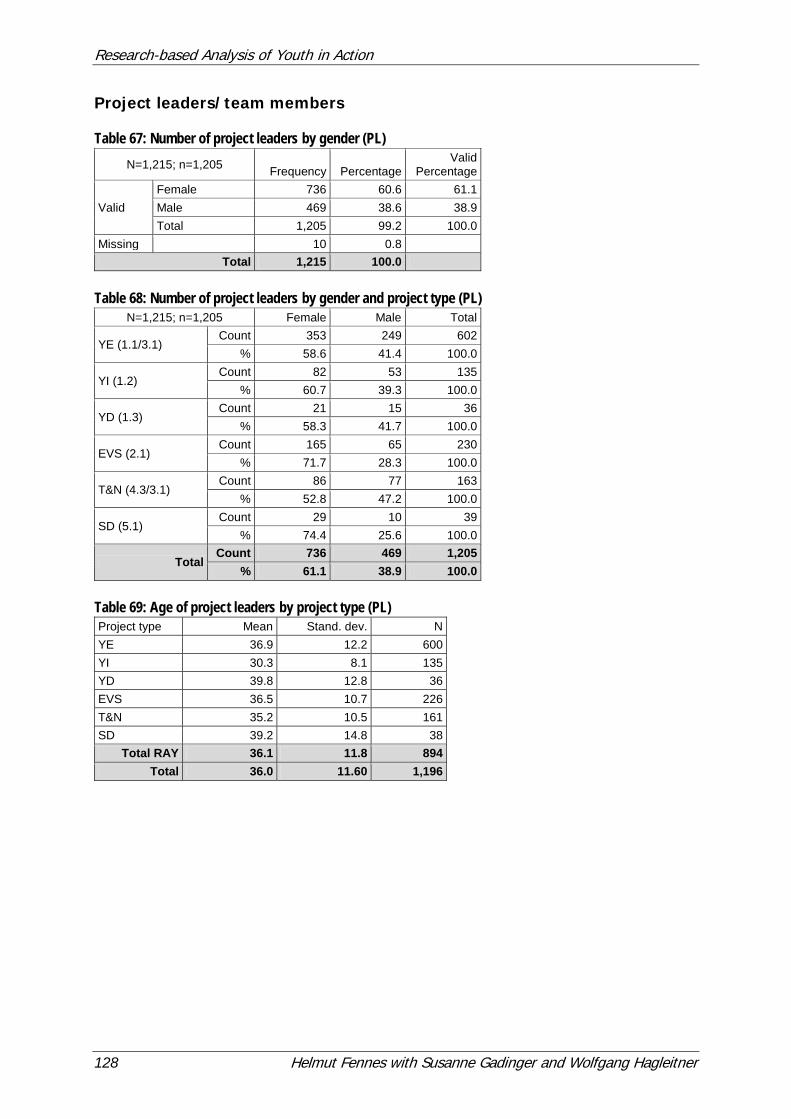
Research-based Analysis of Youth in Action
128 Helmut Fennes with Susanne Gadinger and Wolfgang Hagleitner
Project leaders/team members Table 67: Number of project leaders by gender (PL)
N=1,215; n=1,205 Frequency Percentage Valid
Percentage
Valid Female 736 60.6 61.1 Male 469 38.6 38.9 Total 1,205 99.2 100.0
Missing 10 0.8 Total 1,215 100.0
Table 68: Number of project leaders by gender and project type (PL)
N=1,215; n=1,205 Female Male Total
YE (1.1/3.1) Count 353 249 602
% 58.6 41.4 100.0
YI (1.2) Count 82 53 135
% 60.7 39.3 100.0
YD (1.3) Count 21 15 36
% 58.3 41.7 100.0
EVS (2.1) Count 165 65 230
% 71.7 28.3 100.0
T&N (4.3/3.1) Count 86 77 163
% 52.8 47.2 100.0
SD (5.1) Count 29 10 39
% 74.4 25.6 100.0
Total Count 736 469 1,205
% 61.1 38.9 100.0 Table 69: Age of project leaders by project type (PL) Project type Mean Stand. dev. N YE 36.9 12.2 600 YI 30.3 8.1 135 YD 39.8 12.8 36 EVS 36.5 10.7 226 T&N 35.2 10.5 161 SD 39.2 14.8 38
Total RAY 36.1 11.8 894 Total 36.0 11.60 1,196
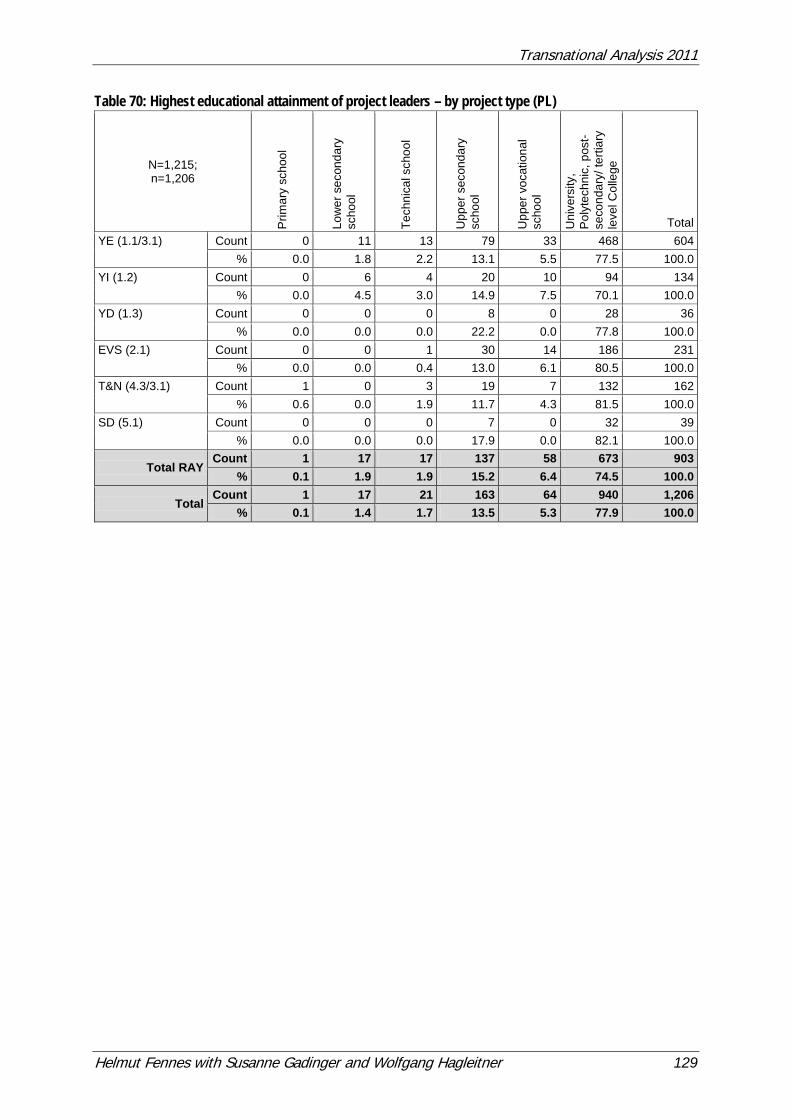
Transnational Analysis 2011
Helmut Fennes with Susanne Gadinger and Wolfgang Hagleitner 129
Table 70: Highest educational attainment of project leaders – by project type (PL)
N=1,215; n=1,206
Prim
ary
scho
ol
Low
er s
econ
dary
sc
hool
Tech
nica
l sch
ool
Upp
er s
econ
dary
sc
hool
Upp
er v
ocat
iona
l sc
hool
Uni
vers
ity,
Pol
ytec
hnic
, pos
t-se
cond
ary/
terti
ary
leve
l Col
lege
Total YE (1.1/3.1) Count 0 11 13 79 33 468 604
% 0.0 1.8 2.2 13.1 5.5 77.5 100.0 YI (1.2) Count 0 6 4 20 10 94 134
% 0.0 4.5 3.0 14.9 7.5 70.1 100.0 YD (1.3) Count 0 0 0 8 0 28 36
% 0.0 0.0 0.0 22.2 0.0 77.8 100.0 EVS (2.1) Count 0 0 1 30 14 186 231
% 0.0 0.0 0.4 13.0 6.1 80.5 100.0 T&N (4.3/3.1) Count 1 0 3 19 7 132 162
% 0.6 0.0 1.9 11.7 4.3 81.5 100.0 SD (5.1) Count 0 0 0 7 0 32 39
% 0.0 0.0 0.0 17.9 0.0 82.1 100.0
Total RAY Count 1 17 17 137 58 673 903
% 0.1 1.9 1.9 15.2 6.4 74.5 100.0
Total Count 1 17 21 163 64 940 1,206
% 0.1 1.4 1.7 13.5 5.3 77.9 100.0
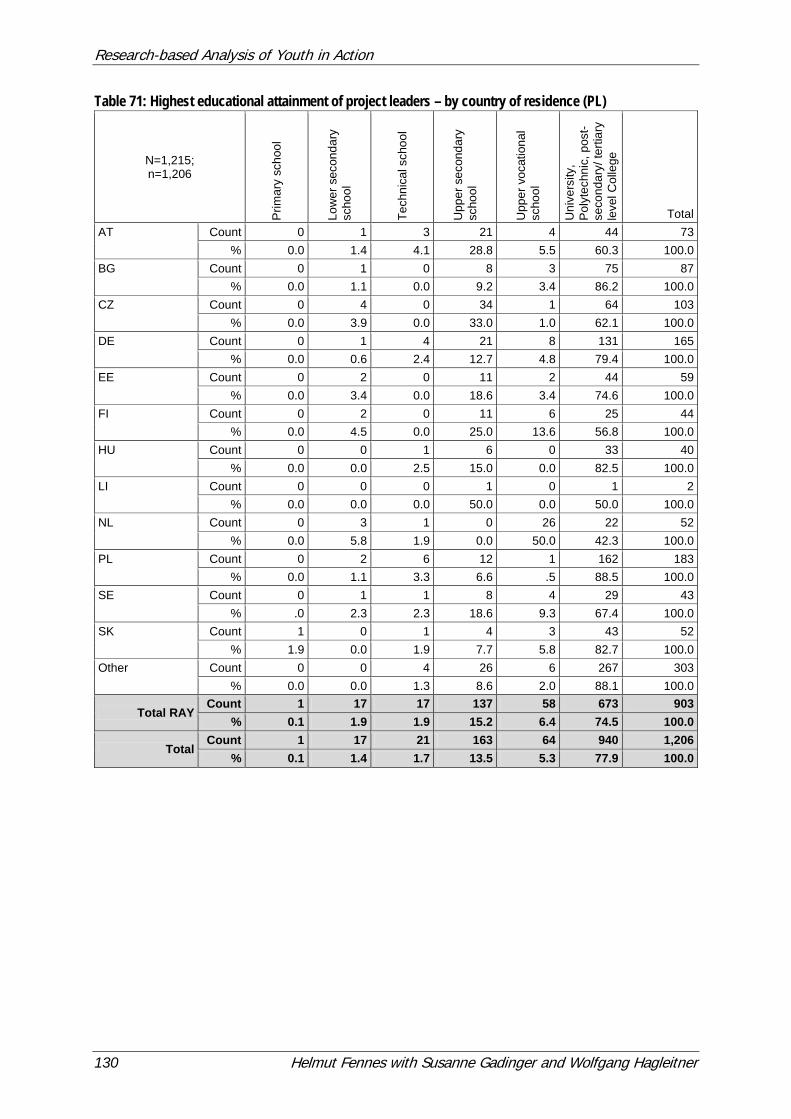
Research-based Analysis of Youth in Action
130 Helmut Fennes with Susanne Gadinger and Wolfgang Hagleitner
Table 71: Highest educational attainment of project leaders – by country of residence (PL)
N=1,215; n=1,206
Prim
ary
scho
ol
Low
er s
econ
dary
sc
hool
Tech
nica
l sch
ool
Upp
er s
econ
dary
sc
hool
Upp
er v
ocat
iona
l sc
hool
Uni
vers
ity,
Pol
ytec
hnic
, pos
t-se
cond
ary/
terti
ary
leve
l Col
lege
Total AT Count 0 1 3 21 4 44 73
% 0.0 1.4 4.1 28.8 5.5 60.3 100.0 BG Count 0 1 0 8 3 75 87
% 0.0 1.1 0.0 9.2 3.4 86.2 100.0 CZ Count 0 4 0 34 1 64 103
% 0.0 3.9 0.0 33.0 1.0 62.1 100.0 DE Count 0 1 4 21 8 131 165
% 0.0 0.6 2.4 12.7 4.8 79.4 100.0 EE Count 0 2 0 11 2 44 59
% 0.0 3.4 0.0 18.6 3.4 74.6 100.0 FI Count 0 2 0 11 6 25 44
% 0.0 4.5 0.0 25.0 13.6 56.8 100.0 HU Count 0 0 1 6 0 33 40
% 0.0 0.0 2.5 15.0 0.0 82.5 100.0 LI Count 0 0 0 1 0 1 2
% 0.0 0.0 0.0 50.0 0.0 50.0 100.0 NL Count 0 3 1 0 26 22 52
% 0.0 5.8 1.9 0.0 50.0 42.3 100.0 PL Count 0 2 6 12 1 162 183
% 0.0 1.1 3.3 6.6 .5 88.5 100.0 SE Count 0 1 1 8 4 29 43
% .0 2.3 2.3 18.6 9.3 67.4 100.0 SK Count 1 0 1 4 3 43 52
% 1.9 0.0 1.9 7.7 5.8 82.7 100.0 Other Count 0 0 4 26 6 267 303
% 0.0 0.0 1.3 8.6 2.0 88.1 100.0
Total RAY Count 1 17 17 137 58 673 903
% 0.1 1.9 1.9 15.2 6.4 74.5 100.0
Total Count 1 17 21 163 64 940 1,206
% 0.1 1.4 1.7 13.5 5.3 77.9 100.0
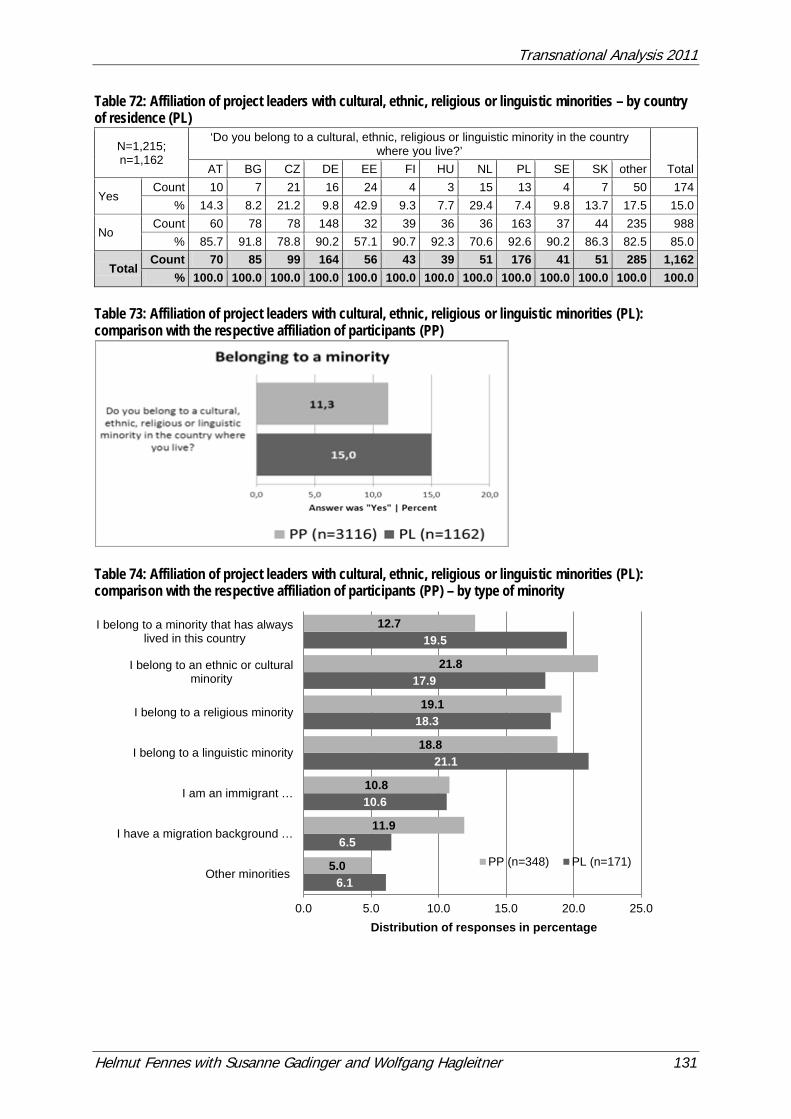
Transnational Analysis 2011
Helmut Fennes with Susanne Gadinger and Wolfgang Hagleitner 131
Table 72: Affiliation of project leaders with cultural, ethnic, religious or linguistic minorities – by country of residence (PL)
N=1,215; n=1,162
‘Do you belong to a cultural, ethnic, religious or linguistic minority in the country where you live?’
Total AT BG CZ DE EE FI HU NL PL SE SK other
Yes Count 10 7 21 16 24 4 3 15 13 4 7 50 174
% 14.3 8.2 21.2 9.8 42.9 9.3 7.7 29.4 7.4 9.8 13.7 17.5 15.0
No Count 60 78 78 148 32 39 36 36 163 37 44 235 988
% 85.7 91.8 78.8 90.2 57.1 90.7 92.3 70.6 92.6 90.2 86.3 82.5 85.0
Total Count 70 85 99 164 56 43 39 51 176 41 51 285 1,162
% 100.0 100.0 100.0 100.0 100.0 100.0 100.0 100.0 100.0 100.0 100.0 100.0 100.0 Table 73: Affiliation of project leaders with cultural, ethnic, religious or linguistic minorities (PL): comparison with the respective affiliation of participants (PP)
Table 74: Affiliation of project leaders with cultural, ethnic, religious or linguistic minorities (PL): comparison with the respective affiliation of participants (PP) – by type of minority
6.1
6.5
10.6
21.1
18.3
17.9
19.5
5.0
11.9
10.8
18.8
19.1
21.8
12.7
0.0 5.0 10.0 15.0 20.0 25.0
Other minorities
I have a migration background …
I am an immigrant …
I belong to a linguistic minority
I belong to a religious minority
I belong to an ethnic or culturalminority
I belong to a minority that has alwayslived in this country
Distribution of responses in percentage
PP (n=348) PL (n=171)
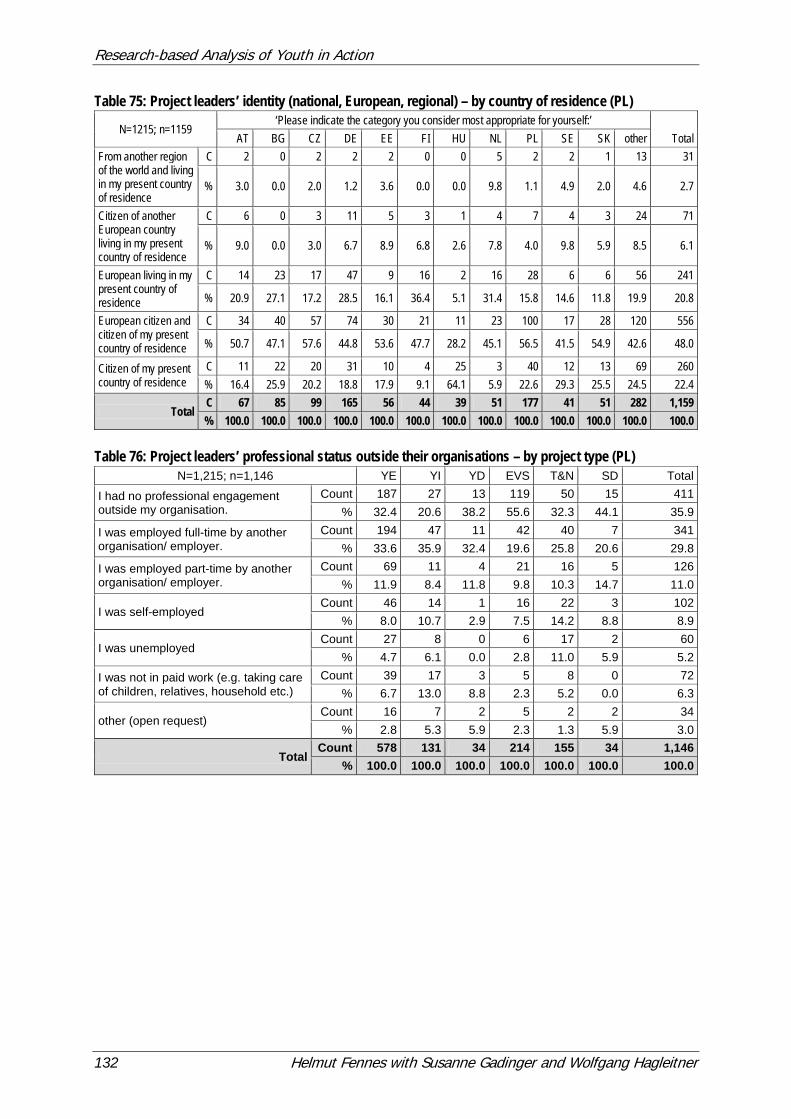
Research-based Analysis of Youth in Action
132 Helmut Fennes with Susanne Gadinger and Wolfgang Hagleitner
Table 75: Project leaders’ identity (national, European, regional) – by country of residence (PL)
N=1215; n=1159 ‘Please indicate the category you consider most appropriate for yourself:’
Total AT BG CZ DE EE FI HU NL PL SE SK other From another region of the world and living in my present country of residence
C 2 0 2 2 2 0 0 5 2 2 1 13 31
% 3.0 0.0 2.0 1.2 3.6 0.0 0.0 9.8 1.1 4.9 2.0 4.6 2.7
Citizen of another European country living in my present country of residence
C 6 0 3 11 5 3 1 4 7 4 3 24 71
% 9.0 0.0 3.0 6.7 8.9 6.8 2.6 7.8 4.0 9.8 5.9 8.5 6.1
European living in my present country of residence
C 14 23 17 47 9 16 2 16 28 6 6 56 241
% 20.9 27.1 17.2 28.5 16.1 36.4 5.1 31.4 15.8 14.6 11.8 19.9 20.8
European citizen and citizen of my present country of residence
C 34 40 57 74 30 21 11 23 100 17 28 120 556
% 50.7 47.1 57.6 44.8 53.6 47.7 28.2 45.1 56.5 41.5 54.9 42.6 48.0
Citizen of my present country of residence
C 11 22 20 31 10 4 25 3 40 12 13 69 260 % 16.4 25.9 20.2 18.8 17.9 9.1 64.1 5.9 22.6 29.3 25.5 24.5 22.4
Total C 67 85 99 165 56 44 39 51 177 41 51 282 1,159 % 100.0 100.0 100.0 100.0 100.0 100.0 100.0 100.0 100.0 100.0 100.0 100.0 100.0
Table 76: Project leaders’ professional status outside their organisations – by project type (PL)
N=1,215; n=1,146 YE YI YD EVS T&N SD Total
I had no professional engagement outside my organisation.
Count 187 27 13 119 50 15 411 % 32.4 20.6 38.2 55.6 32.3 44.1 35.9
I was employed full-time by another organisation/ employer.
Count 194 47 11 42 40 7 341 % 33.6 35.9 32.4 19.6 25.8 20.6 29.8
I was employed part-time by another organisation/ employer.
Count 69 11 4 21 16 5 126 % 11.9 8.4 11.8 9.8 10.3 14.7 11.0
I was self-employed Count 46 14 1 16 22 3 102
% 8.0 10.7 2.9 7.5 14.2 8.8 8.9
I was unemployed Count 27 8 0 6 17 2 60
% 4.7 6.1 0.0 2.8 11.0 5.9 5.2
I was not in paid work (e.g. taking care of children, relatives, household etc.)
Count 39 17 3 5 8 0 72 % 6.7 13.0 8.8 2.3 5.2 0.0 6.3
other (open request) Count 16 7 2 5 2 2 34
% 2.8 5.3 5.9 2.3 1.3 5.9 3.0
Total Count 578 131 34 214 155 34 1,146
% 100.0 100.0 100.0 100.0 100.0 100.0 100.0
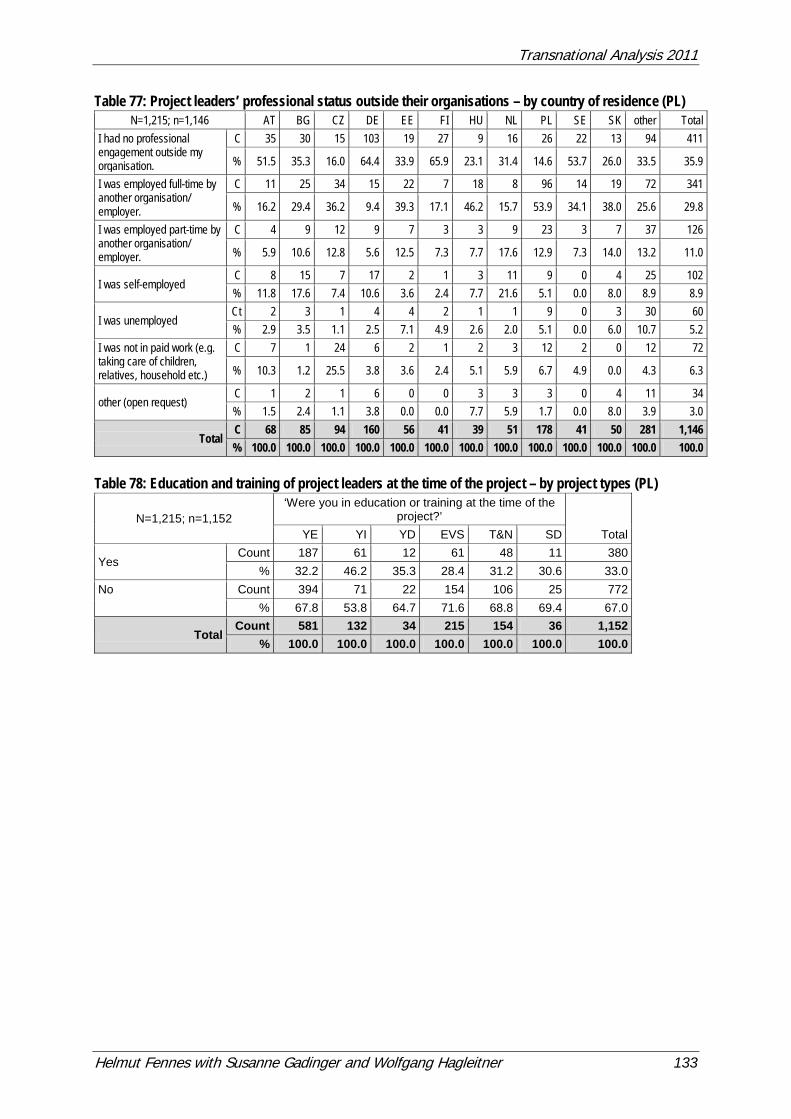
Transnational Analysis 2011
Helmut Fennes with Susanne Gadinger and Wolfgang Hagleitner 133
Table 77: Project leaders’ professional status outside their organisations – by country of residence (PL) N=1,215; n=1,146 AT BG CZ DE EE FI HU NL PL SE SK other Total
I had no professional engagement outside my organisation.
C 35 30 15 103 19 27 9 16 26 22 13 94 411
% 51.5 35.3 16.0 64.4 33.9 65.9 23.1 31.4 14.6 53.7 26.0 33.5 35.9
I was employed full-time by another organisation/ employer.
C 11 25 34 15 22 7 18 8 96 14 19 72 341
% 16.2 29.4 36.2 9.4 39.3 17.1 46.2 15.7 53.9 34.1 38.0 25.6 29.8
I was employed part-time by another organisation/ employer.
C 4 9 12 9 7 3 3 9 23 3 7 37 126
% 5.9 10.6 12.8 5.6 12.5 7.3 7.7 17.6 12.9 7.3 14.0 13.2 11.0
I was self-employed C 8 15 7 17 2 1 3 11 9 0 4 25 102 % 11.8 17.6 7.4 10.6 3.6 2.4 7.7 21.6 5.1 0.0 8.0 8.9 8.9
I was unemployed Ct 2 3 1 4 4 2 1 1 9 0 3 30 60 % 2.9 3.5 1.1 2.5 7.1 4.9 2.6 2.0 5.1 0.0 6.0 10.7 5.2
I was not in paid work (e.g. taking care of children, relatives, household etc.)
C 7 1 24 6 2 1 2 3 12 2 0 12 72
% 10.3 1.2 25.5 3.8 3.6 2.4 5.1 5.9 6.7 4.9 0.0 4.3 6.3
other (open request) C 1 2 1 6 0 0 3 3 3 0 4 11 34 % 1.5 2.4 1.1 3.8 0.0 0.0 7.7 5.9 1.7 0.0 8.0 3.9 3.0
Total C 68 85 94 160 56 41 39 51 178 41 50 281 1,146 % 100.0 100.0 100.0 100.0 100.0 100.0 100.0 100.0 100.0 100.0 100.0 100.0 100.0
Table 78: Education and training of project leaders at the time of the project – by project types (PL)
N=1,215; n=1,152 ‘Were you in education or training at the time of the
project?’ Total YE YI YD EVS T&N SD
Yes Count 187 61 12 61 48 11 380
% 32.2 46.2 35.3 28.4 31.2 30.6 33.0 No Count 394 71 22 154 106 25 772
% 67.8 53.8 64.7 71.6 68.8 69.4 67.0
Total Count 581 132 34 215 154 36 1,152
% 100.0 100.0 100.0 100.0 100.0 100.0 100.0
Research-based Analysis of Youth in Action
134 Helmut Fennes with Susanne Gadinger and Wolfgang Hagleitner
Table 79: Education and training of project leaders at the time of the project – by residence country (PL) N=1,215; n=1,152 AT BG CZ DE EE FI HU NL PL SE SK other Total
Yes Count 25 27 39 24 20 6 11 20 85 5 16 101 380
% 36.2 31.4 41.5 14.7 35.7 14.6 28.2 40.0 48.0 12.2 31.4 35.7 33.0
No Count 44 59 55 139 36 35 28 30 92 36 35 182 772
% 63.8 68.6 58.5 85.3 64.3 85.4 71.8 60.0 52.0 87.8 68.6 64.3 67.0
Total Count 69 86 94 163 56 41 39 50 177 41 51 283 1,152
% 100.0 100.0 100.0 100.0 100.0 100.0 100.0 100.0 100.0 100.0 100.0 100.0 100.0 Table 80: Project leaders’ previous involvement in EU youth programmes (PL) ‘Did you participate already before in projects organised in the framework of Youth in Action or
a preceding EU youth programme’
N=1,215; n=1,154 Responses Percentage
of Cases N Percentage Yes, as project leader/member of the project team 626 46.0 54.2 Yes, as participant (including in projects/training for youth workers/leaders) 384 28.2 33.3
No 352 25.8 30.5 Total 1,362 100.0 118.0
Table 81: Project leaders’ previous involvement as project leaders in EU youth programmes (PL)
N=626; n=620 Responses Percentage
of Cases N Percentage Youth exchange 483 41.2 77.9 Youth initiative 127 10.8 20.5 Youth democracy project 40 3.4 6.5 European voluntary service 229 19.6 36.9 Training and networking 233 19.9 37.6 Meeting between young people and persons responsible for youth policy (structured dialogue) 57 4.9 9.2
I do not remember 2 0.2 0.3 Total 1,171 100.0 188.9
(Note: dependency question; only those ticking ‘yes, as a project leader …’ received this question) Table 82: Project leaders’ previous involvement as project leaders in EU youth programmes – number of previous projects (PL)
N=626; n=607 Frequency Valid
Percentage Cumulative Percentage
1 project 43 7.1 7.1 2 projects 93 15.3 22.4 3 projects 64 10.5 32.9 4 projects 68 11.2 44.2 5 projects 58 9.6 53.7 6 - 10 projects 163 26.9 80.6 11 - 20 projects 66 10.9 91.4 21 - 30 projects 28 4.6 96.0 > 31 projects 24 4.0 100.0 Total 607 100.0
(Note: dependency question; only those ticking ‘yes, as a project leader …’ received this question)
Transnational Analysis 2011
Helmut Fennes with Susanne Gadinger and Wolfgang Hagleitner 135
Table 83: Project leaders’ previous involvement as project leaders in EU youth programmes – number of previous projects – by project types (PL)
N=626; n=607
YE (1.1/3.1) (n=315)
YI (1.2) (n=35)
YD (1.3) (n=12)
EVS (2.1) (n=137)
T&N (4.3/3.1) (n=95)
SD (5.1) (n=13)
F % F % F % F % F % F % 1 project 29 9.2 3 8.6 1 8.3 6 4.4 2 2.1 2 15.4 2 projects 55 17.5 14 40.0 1 8.3 11 8.0 9 9.5 3 23.1 3 projects 39 12.4 7 20.0 1 8.3 8 5.8 7 7.4 2 15.4 4 projects 44 14.0 2 5.7 1 8.3 10 7.3 9 9.5 2 15.4 5 projects 28 8.9 2 5.7 3 25.0 10 7.3 13 13.7 2 15.4
Subtotal 195 62.0 28 80.0 7 58.2 45 32.8 40 42.2 11 84.7 6 - 10 projects 74 23.5 7 20.0 1 8.3 47 34.3 33 34.7 1 7.7 11 - 20 projects 27 8.6 0 0.0 3 25.0 22 16.1 14 14.7 0 0.0 21 - 30 projects 12 3.8 0 0.0 1 8.3 8 5.8 7 7.4 0 0.0 > 31 projects 7 2.2 0 0.0 0 0.0 15 10.9 1 1.1 1 7.7
Total Responses 315 100.0 35 100.0 12 100.0 137 100.0 95 100.0 13 100.0 Table 84: Project leaders’ previous involvement as project leaders in EU youth programmes – number of previous projects – by country of residence (PL)
N=626; n=607
AT (n=35)
BG (n=43)
CZ (n=52)
DE (n=94)
EE (n=31)
FI (n=25)
F % F % F % F % F % F % 1 project 2 5.7 3 7.0 3 5.8 3 3.2 4 12.9 1 4.0 2 projects 5 14.3 12 27.9 8 15.4 18 19.1 2 6.5 5 20.0 3 projects 6 17.1 3 7.0 12 23.1 9 9.6 4 12.9 1 4.0 4 projects 5 14.3 9 20.9 11 21.2 5 5.3 6 19.4 3 12.0 5 projects 3 8.6 2 4.7 5 9.6 7 7.4 0 0.0 2 8.0
Subtotal 21 60 29 67.5 39 75.1 42 44.6 16 51.7 12 48 6 - 10 projects 4 11.4 7 16.3 11 21.2 24 25.5 6 19.4 10 40.0 11 - 20 projects 1 2.9 4 9.3 1 1.9 12 12.8 6 19.4 3 12.0 21 - 30 projects 6 17.1 1 2.3 1 1.9 8 8.5 2 6.5 0 0.0 > 31 projects 3 8.6 2 4.7 0 0.0 8 8.5 1 3.2 0 0.0
Total Responses 35 100.0 43 100.0 52 100.0 94 100.0 31 100.0 25 100.0
N=626; n=607
HU (n=21)
NL (n=25)
PL (n=78)
SE (n=18)
SK (n=26)
other (n=158)
F % F % F % F % F % F % 1 project 3 14.3 2 8.0 7 9.0 3 16.7 1 3.8 11 7.0 2 projects 2 9.5 4 16.0 13 16.7 1 5.6 3 11.5 20 12.7 3 projects 4 19.0 2 8.0 7 9.0 0 0.0 2 7.7 14 8.9 4 projects 4 19.0 3 12.0 5 6.4 3 16.7 2 7.7 12 7.6 5 projects 0 0.0 3 12.0 15 19.2 0 0.0 4 15.4 17 10.8
Subtotal 13 61.8 14 56 47 60.3 7 39 12 46.1 74 47 6 - 10 projects 4 19.0 6 24.0 23 29.5 7 38.9 7 26.9 53 33.5 11 - 20 projects 2 9.5 2 8.0 6 7.7 3 16.7 7 26.9 19 12.0 21 - 30 projects 0 0.0 0 0.0 1 1.3 1 5.6 0 0.0 8 5.1 > 31 projects 2 9.5 3 12.0 1 1.3 0 0.0 0 0.0 4 2.5
Total Responses 21 100.0 25 100.0 78 100.0 18 100.0 26 100.0 158 100.0
Research-based Analysis of Youth in Action
136 Helmut Fennes with Susanne Gadinger and Wolfgang Hagleitner
Table 85: Project leaders’ previous involvement as participants in EU youth programmes (PL)
N=384; n=372 Responses Percentage
of Cases N Percentage Youth exchange 231 35.7 62.1 Youth initiative 54 8.3 14.5 Youth democracy project 41 6.3 11.0 European voluntary service 66 10.2 17.7 Training and networking 207 32.0 55.6 Meeting between young people and persons responsible for youth policy 43 6.6 11.6
I do not remember 5 .8 1.3 Total 647 100.0 173.9
(Note: dependency question; only those ticking ‘yes, as a participant …’ received this question)
Transnational Analysis 2011
Helmut Fennes with Susanne Gadinger and Wolfgang Hagleitner 137
Table 86: Project leaders’ previous involvement in EU youth programmes – by project type (PL)
N=1,215; n=1,154
‘Please choose all that apply:’ YE (1.1/3.1)
(n=580) YI (1.2) (n=134)
YD (1.3) (n=34)
EVS (2.1) (n=217)
T&N (4.3/3.1) (n=154)
SD (5.1) (n=35)
N % % of
Cases N % % of
Cases N % % of
Cases N % % of
Cases N % % of
Cases N % % of
Cases
Yes, as project leader/member of the project team 328 48.2 56.6 35 25.2 26.1 12 33.3 35.3 143 53.0 65.9 95 48.2 61.7 95 48.2 61.7 Yes, as participant (including in projects/training for youth workers/leaders) 190 27.9 32.8 22 15.8 16.4 9 25.0 26.5 74 27.4 34.1 76 38.6 49.4 76 38.6 49.4
No 162 23.8 27.9 82 59.0 61.2 15 41.7 44.1 53 19.6 24.4 26 13.2 16.9 26 13.2 16.9 Total Responses 680 100.0 117.2 139 100.0 103.7 36 100.0 105.9 270 100.0 124.4 197 100.0 127.9 197 100.0 127.9
Table 87: Project leaders’ previous involvement in EU youth programmes – by country of residence (PL)
N=1,215; n=1,154
‘Please choose all that apply:’ AT
(n=69) BG
(n=84) CZ
(n=94) DE
(n=167) EE
(n=56) FI
(n=42)
N % % of
Cases N % % of
Cases N % % of
Cases N % % of
Cases N % % of
Cases N % % of
Cases Yes, as project leader/member of the project team 38 46.3 55.1 43 45.3 51.2 53 47.7 56.4 99 51.8 59.3 31 46.3 55.4 25 49.0 59.5
Yes, as participant (including in projects/training for youth workers/leaders) 22 26.8 31.9 27 28.4 32.1 28 25.2 29.8 41 21.5 24.6 20 29.9 35.7 18 35.3 42.9
No 22 26.8 31.9 25 26.3 29.8 30 27.0 31.9 51 26.7 30.5 16 23.9 28.6 8 15.7 19.0 Total Responses 82 100.0 118.8 95 100.0 113.1 111 100.0 118.1 191 100.0 114.4 67 100.0 119.6 51 100.0 121.4
N=1,215; n=1,154
‘Please choose all that apply:’ HU
(n=39) NL
(n=50) PL
(n=178) SE
(n=41) SK
(n=49) other
(n=283)
N % % of
Cases N % % of
Cases N % % of
Cases N % % of
Cases N % % of
Cases N % % of
Cases Yes, as project leader/member of the project team 25 49.0 59.5 25 42.4 50.0 80 37.9 44.9 18 36.7 43.9 26 41.9 53.1 166 49.3 58.7
Yes, as participant (including in projects/training for youth workers/leaders) 18 35.3 42.9 17 28.8 34.0 65 30.8 36.5 14 28.6 34.1 20 32.3 40.8 100 29.7 35.3
No 8 15.7 19.0 17 28.8 34.0 66 31.3 37.1 17 34.7 41.5 16 25.8 32.7 71 21.1 25.1 Total Responses 51 100.0 121.4 59 100.0 118.0 211 100.0 118.5 49 100.0 119.5 62 100.0 126.5 337 100.0 119.1
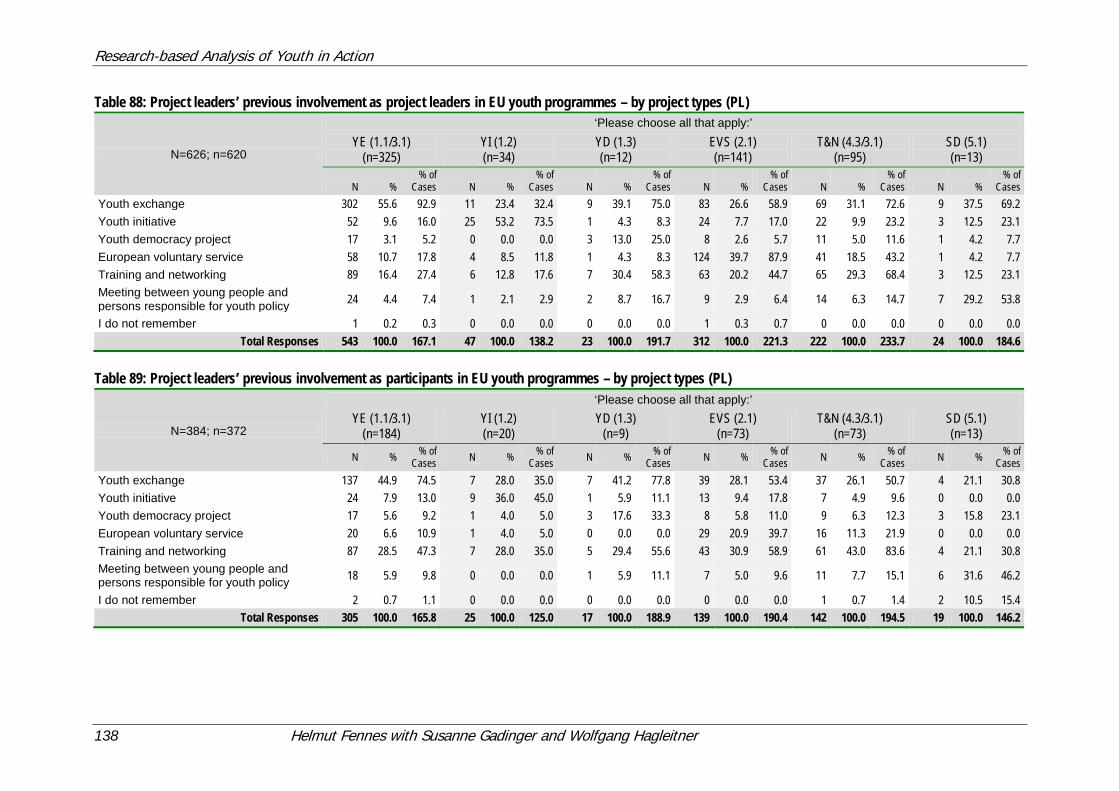
Research-based Analysis of Youth in Action
138 Helmut Fennes with Susanne Gadinger and Wolfgang Hagleitner
Table 88: Project leaders’ previous involvement as project leaders in EU youth programmes – by project types (PL)
N=626; n=620
‘Please choose all that apply:’ YE (1.1/3.1)
(n=325) YI (1.2) (n=34)
YD (1.3) (n=12)
EVS (2.1) (n=141)
T&N (4.3/3.1) (n=95)
SD (5.1) (n=13)
N % % of
Cases N % % of
Cases N % % of
Cases N % % of
Cases N % % of
Cases N % % of
Cases Youth exchange 302 55.6 92.9 11 23.4 32.4 9 39.1 75.0 83 26.6 58.9 69 31.1 72.6 9 37.5 69.2 Youth initiative 52 9.6 16.0 25 53.2 73.5 1 4.3 8.3 24 7.7 17.0 22 9.9 23.2 3 12.5 23.1 Youth democracy project 17 3.1 5.2 0 0.0 0.0 3 13.0 25.0 8 2.6 5.7 11 5.0 11.6 1 4.2 7.7 European voluntary service 58 10.7 17.8 4 8.5 11.8 1 4.3 8.3 124 39.7 87.9 41 18.5 43.2 1 4.2 7.7 Training and networking 89 16.4 27.4 6 12.8 17.6 7 30.4 58.3 63 20.2 44.7 65 29.3 68.4 3 12.5 23.1 Meeting between young people and persons responsible for youth policy 24 4.4 7.4 1 2.1 2.9 2 8.7 16.7 9 2.9 6.4 14 6.3 14.7 7 29.2 53.8
I do not remember 1 0.2 0.3 0 0.0 0.0 0 0.0 0.0 1 0.3 0.7 0 0.0 0.0 0 0.0 0.0 Total Responses 543 100.0 167.1 47 100.0 138.2 23 100.0 191.7 312 100.0 221.3 222 100.0 233.7 24 100.0 184.6
Table 89: Project leaders’ previous involvement as participants in EU youth programmes – by project types (PL)
N=384; n=372
‘Please choose all that apply:’ YE (1.1/3.1)
(n=184) YI (1.2) (n=20)
YD (1.3) (n=9)
EVS (2.1) (n=73)
T&N (4.3/3.1) (n=73)
SD (5.1) (n=13)
N % % of Cases N % % of
Cases N % % of Cases N % % of
Cases N % % of Cases N % % of
Cases Youth exchange 137 44.9 74.5 7 28.0 35.0 7 41.2 77.8 39 28.1 53.4 37 26.1 50.7 4 21.1 30.8 Youth initiative 24 7.9 13.0 9 36.0 45.0 1 5.9 11.1 13 9.4 17.8 7 4.9 9.6 0 0.0 0.0 Youth democracy project 17 5.6 9.2 1 4.0 5.0 3 17.6 33.3 8 5.8 11.0 9 6.3 12.3 3 15.8 23.1 European voluntary service 20 6.6 10.9 1 4.0 5.0 0 0.0 0.0 29 20.9 39.7 16 11.3 21.9 0 0.0 0.0 Training and networking 87 28.5 47.3 7 28.0 35.0 5 29.4 55.6 43 30.9 58.9 61 43.0 83.6 4 21.1 30.8 Meeting between young people and persons responsible for youth policy 18 5.9 9.8 0 0.0 0.0 1 5.9 11.1 7 5.0 9.6 11 7.7 15.1 6 31.6 46.2
I do not remember 2 0.7 1.1 0 0.0 0.0 0 0.0 0.0 0 0.0 0.0 1 0.7 1.4 2 10.5 15.4 Total Responses 305 100.0 165.8 25 100.0 125.0 17 100.0 188.9 139 100.0 190.4 142 100.0 194.5 19 100.0 146.2
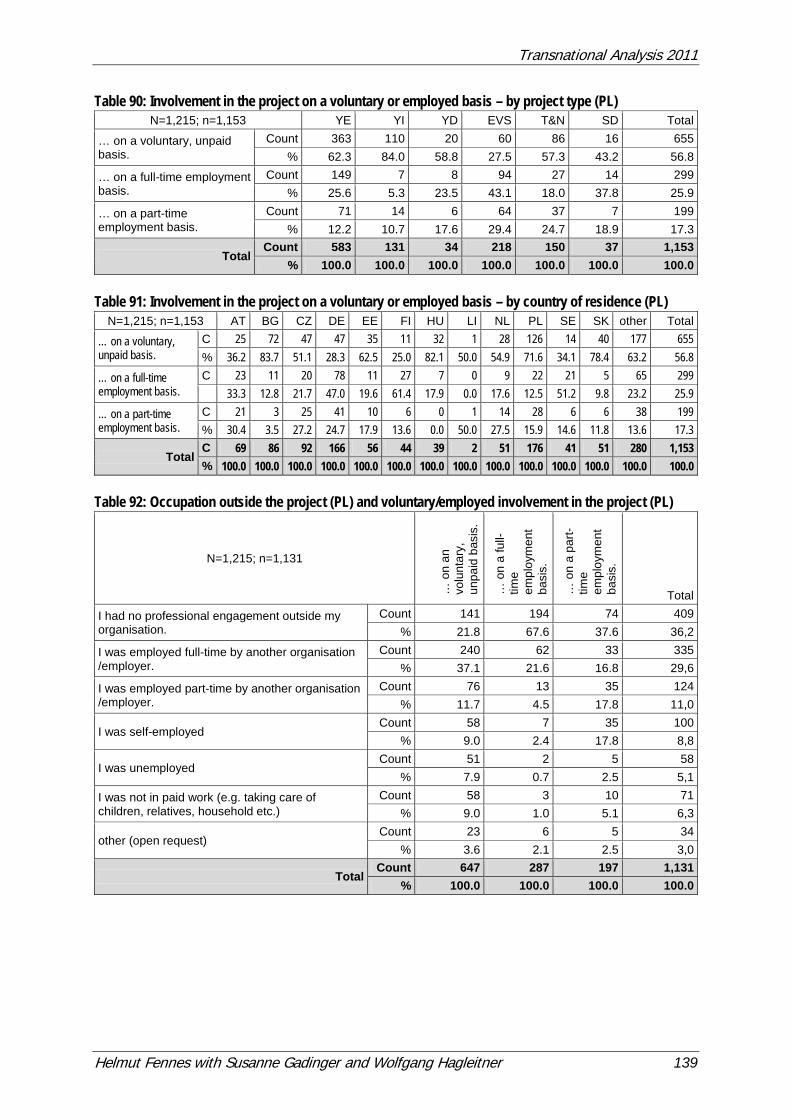
Transnational Analysis 2011
Helmut Fennes with Susanne Gadinger and Wolfgang Hagleitner 139
Table 90: Involvement in the project on a voluntary or employed basis – by project type (PL) N=1,215; n=1,153 YE YI YD EVS T&N SD Total
… on a voluntary, unpaid basis.
Count 363 110 20 60 86 16 655 % 62.3 84.0 58.8 27.5 57.3 43.2 56.8
… on a full-time employment basis.
Count 149 7 8 94 27 14 299 % 25.6 5.3 23.5 43.1 18.0 37.8 25.9
… on a part-time employment basis.
Count 71 14 6 64 37 7 199 % 12.2 10.7 17.6 29.4 24.7 18.9 17.3
Total Count 583 131 34 218 150 37 1,153
% 100.0 100.0 100.0 100.0 100.0 100.0 100.0 Table 91: Involvement in the project on a voluntary or employed basis – by country of residence (PL)
N=1,215; n=1,153 AT BG CZ DE EE FI HU LI NL PL SE SK other Total
… on a voluntary, unpaid basis.
C 25 72 47 47 35 11 32 1 28 126 14 40 177 655 % 36.2 83.7 51.1 28.3 62.5 25.0 82.1 50.0 54.9 71.6 34.1 78.4 63.2 56.8
… on a full-time employment basis.
C 23 11 20 78 11 27 7 0 9 22 21 5 65 299 33.3 12.8 21.7 47.0 19.6 61.4 17.9 0.0 17.6 12.5 51.2 9.8 23.2 25.9
… on a part-time employment basis.
C 21 3 25 41 10 6 0 1 14 28 6 6 38 199 % 30.4 3.5 27.2 24.7 17.9 13.6 0.0 50.0 27.5 15.9 14.6 11.8 13.6 17.3
Total C 69 86 92 166 56 44 39 2 51 176 41 51 280 1,153 % 100.0 100.0 100.0 100.0 100.0 100.0 100.0 100.0 100.0 100.0 100.0 100.0 100.0 100.0
Table 92: Occupation outside the project (PL) and voluntary/employed involvement in the project (PL)
N=1,215; n=1,131
… o
n an
vo
lunt
ary,
un
paid
bas
is.
… o
n a
full-
time
empl
oym
ent
basi
s.
… o
n a
part-
time
empl
oym
ent
basi
s.
Total
I had no professional engagement outside my organisation.
Count 141 194 74 409 % 21.8 67.6 37.6 36,2
I was employed full-time by another organisation /employer.
Count 240 62 33 335 % 37.1 21.6 16.8 29,6
I was employed part-time by another organisation /employer.
Count 76 13 35 124 % 11.7 4.5 17.8 11,0
I was self-employed Count 58 7 35 100
% 9.0 2.4 17.8 8,8
I was unemployed Count 51 2 5 58
% 7.9 0.7 2.5 5,1
I was not in paid work (e.g. taking care of children, relatives, household etc.)
Count 58 3 10 71 % 9.0 1.0 5.1 6,3
other (open request) Count 23 6 5 34
% 3.6 2.1 2.5 3,0
Total Count 647 287 197 1,131
% 100.0 100.0 100.0 100.0
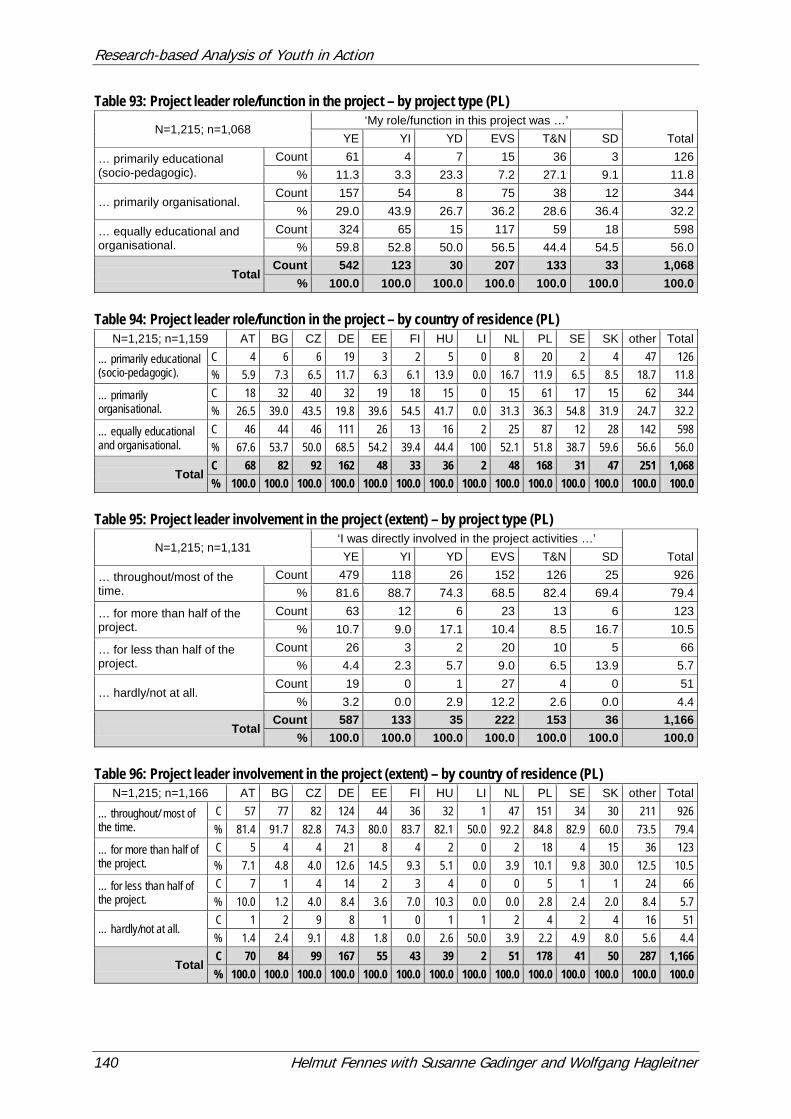
Research-based Analysis of Youth in Action
140 Helmut Fennes with Susanne Gadinger and Wolfgang Hagleitner
Table 93: Project leader role/function in the project – by project type (PL)
N=1,215; n=1,068 ‘My role/function in this project was …’
Total YE YI YD EVS T&N SD
… primarily educational (socio-pedagogic).
Count 61 4 7 15 36 3 126 % 11.3 3.3 23.3 7.2 27.1 9.1 11.8
… primarily organisational. Count 157 54 8 75 38 12 344
% 29.0 43.9 26.7 36.2 28.6 36.4 32.2
… equally educational and organisational.
Count 324 65 15 117 59 18 598 % 59.8 52.8 50.0 56.5 44.4 54.5 56.0
Total Count 542 123 30 207 133 33 1,068
% 100.0 100.0 100.0 100.0 100.0 100.0 100.0 Table 94: Project leader role/function in the project – by country of residence (PL)
N=1,215; n=1,159 AT BG CZ DE EE FI HU LI NL PL SE SK other Total
… primarily educational (socio-pedagogic).
C 4 6 6 19 3 2 5 0 8 20 2 4 47 126 % 5.9 7.3 6.5 11.7 6.3 6.1 13.9 0.0 16.7 11.9 6.5 8.5 18.7 11.8
… primarily organisational.
C 18 32 40 32 19 18 15 0 15 61 17 15 62 344 % 26.5 39.0 43.5 19.8 39.6 54.5 41.7 0.0 31.3 36.3 54.8 31.9 24.7 32.2
… equally educational and organisational.
C 46 44 46 111 26 13 16 2 25 87 12 28 142 598 % 67.6 53.7 50.0 68.5 54.2 39.4 44.4 100 52.1 51.8 38.7 59.6 56.6 56.0
Total C 68 82 92 162 48 33 36 2 48 168 31 47 251 1,068 % 100.0 100.0 100.0 100.0 100.0 100.0 100.0 100.0 100.0 100.0 100.0 100.0 100.0 100.0
Table 95: Project leader involvement in the project (extent) – by project type (PL)
N=1,215; n=1,131 ‘I was directly involved in the project activities …’
Total YE YI YD EVS T&N SD
… throughout/most of the time.
Count 479 118 26 152 126 25 926 % 81.6 88.7 74.3 68.5 82.4 69.4 79.4
… for more than half of the project.
Count 63 12 6 23 13 6 123 % 10.7 9.0 17.1 10.4 8.5 16.7 10.5
… for less than half of the project.
Count 26 3 2 20 10 5 66 % 4.4 2.3 5.7 9.0 6.5 13.9 5.7
… hardly/not at all. Count 19 0 1 27 4 0 51
% 3.2 0.0 2.9 12.2 2.6 0.0 4.4
Total Count 587 133 35 222 153 36 1,166
% 100.0 100.0 100.0 100.0 100.0 100.0 100.0 Table 96: Project leader involvement in the project (extent) – by country of residence (PL)
N=1,215; n=1,166 AT BG CZ DE EE FI HU LI NL PL SE SK other Total
… throughout/ most of the time.
C 57 77 82 124 44 36 32 1 47 151 34 30 211 926 % 81.4 91.7 82.8 74.3 80.0 83.7 82.1 50.0 92.2 84.8 82.9 60.0 73.5 79.4
… for more than half of the project.
C 5 4 4 21 8 4 2 0 2 18 4 15 36 123 % 7.1 4.8 4.0 12.6 14.5 9.3 5.1 0.0 3.9 10.1 9.8 30.0 12.5 10.5
… for less than half of the project.
C 7 1 4 14 2 3 4 0 0 5 1 1 24 66 % 10.0 1.2 4.0 8.4 3.6 7.0 10.3 0.0 0.0 2.8 2.4 2.0 8.4 5.7
… hardly/not at all. C 1 2 9 8 1 0 1 1 2 4 2 4 16 51 % 1.4 2.4 9.1 4.8 1.8 0.0 2.6 50.0 3.9 2.2 4.9 8.0 5.6 4.4
Total C 70 84 99 167 55 43 39 2 51 178 41 50 287 1,166 % 100.0 100.0 100.0 100.0 100.0 100.0 100.0 100.0 100.0 100.0 100.0 100.0 100.0 100.0
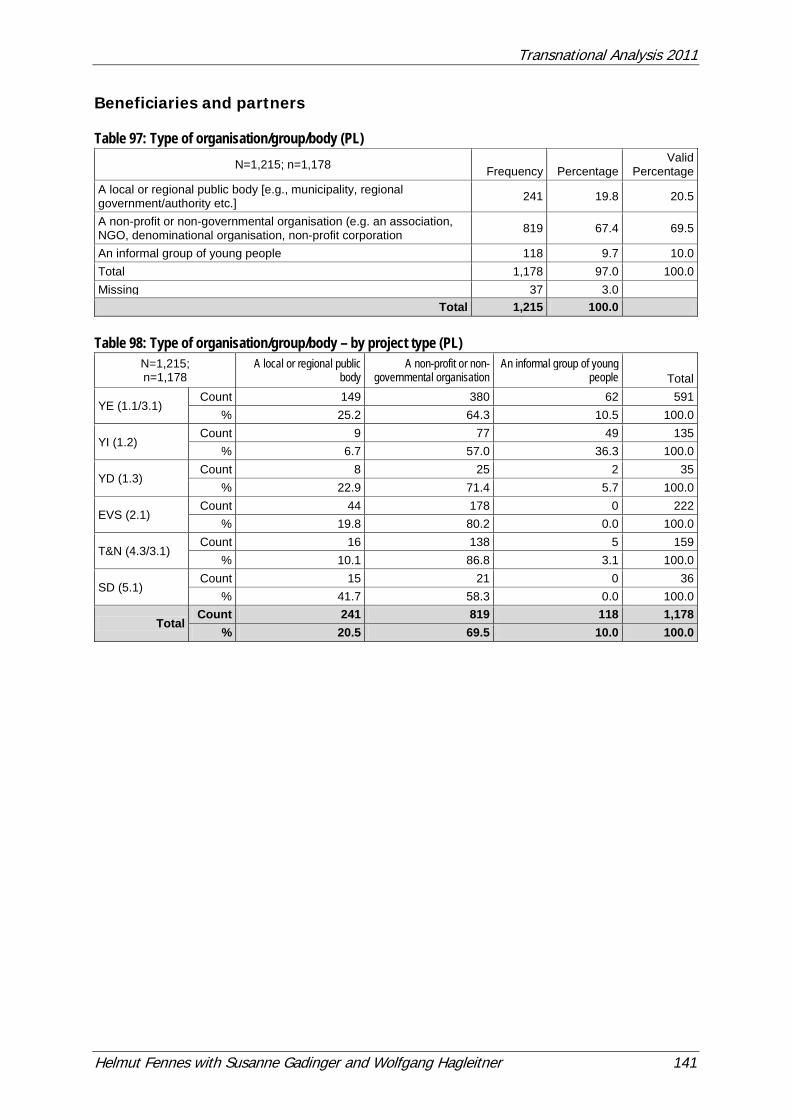
Transnational Analysis 2011
Helmut Fennes with Susanne Gadinger and Wolfgang Hagleitner 141
Beneficiaries and partners Table 97: Type of organisation/group/body (PL)
N=1,215; n=1,178 Frequency Percentage Valid
Percentage A local or regional public body [e.g., municipality, regional government/authority etc.] 241 19.8 20.5
A non-profit or non-governmental organisation (e.g. an association, NGO, denominational organisation, non-profit corporation 819 67.4 69.5
An informal group of young people 118 9.7 10.0 Total 1,178 97.0 100.0 Missing 37 3.0
Total 1,215 100.0 Table 98: Type of organisation/group/body – by project type (PL)
N=1,215; n=1,178
A local or regional public body
A non-profit or non-governmental organisation
An informal group of young people Total
YE (1.1/3.1) Count 149 380 62 591
% 25.2 64.3 10.5 100.0
YI (1.2) Count 9 77 49 135
% 6.7 57.0 36.3 100.0
YD (1.3) Count 8 25 2 35
% 22.9 71.4 5.7 100.0
EVS (2.1) Count 44 178 0 222
% 19.8 80.2 0.0 100.0
T&N (4.3/3.1) Count 16 138 5 159
% 10.1 86.8 3.1 100.0
SD (5.1) Count 15 21 0 36
% 41.7 58.3 0.0 100.0
Total Count 241 819 118 1,178
% 20.5 69.5 10.0 100.0
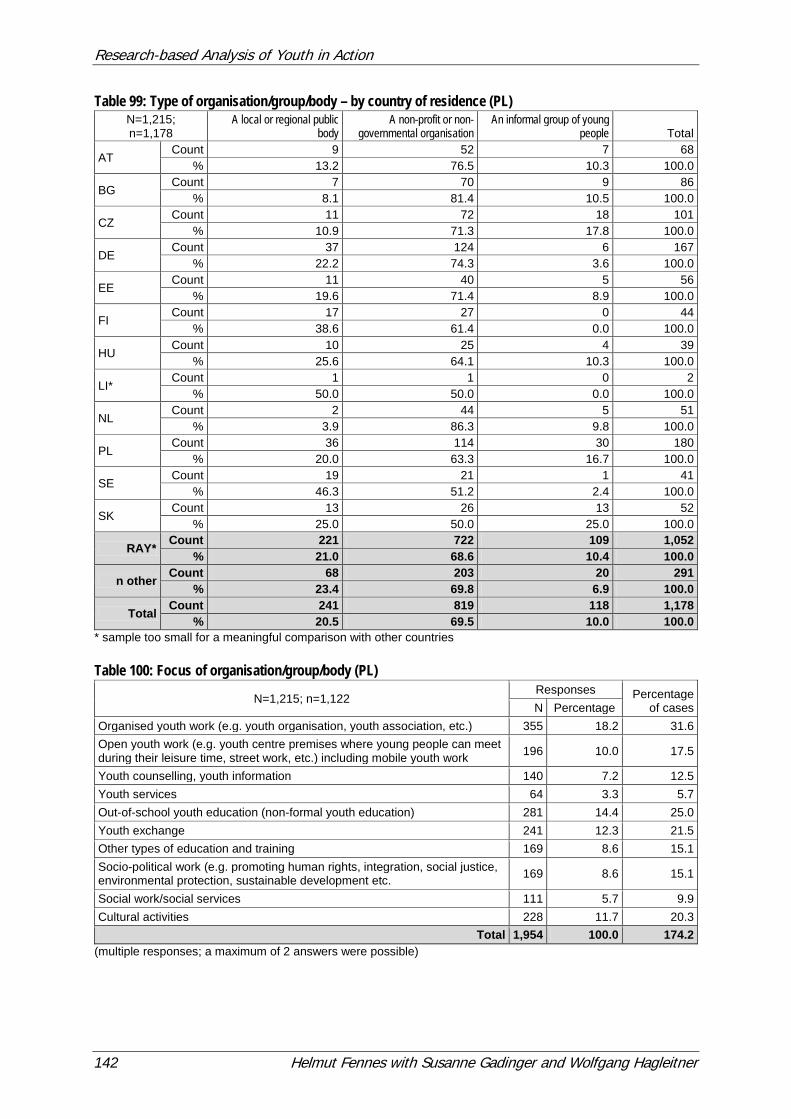
Research-based Analysis of Youth in Action
142 Helmut Fennes with Susanne Gadinger and Wolfgang Hagleitner
Table 99: Type of organisation/group/body – by country of residence (PL) N=1,215; n=1,178
A local or regional public body
A non-profit or non-governmental organisation
An informal group of young people Total
AT Count 9 52 7 68
% 13.2 76.5 10.3 100.0
BG Count 7 70 9 86
% 8.1 81.4 10.5 100.0
CZ Count 11 72 18 101
% 10.9 71.3 17.8 100.0
DE Count 37 124 6 167
% 22.2 74.3 3.6 100.0
EE Count 11 40 5 56
% 19.6 71.4 8.9 100.0
FI Count 17 27 0 44
% 38.6 61.4 0.0 100.0
HU Count 10 25 4 39
% 25.6 64.1 10.3 100.0
LI* Count 1 1 0 2
% 50.0 50.0 0.0 100.0
NL Count 2 44 5 51
% 3.9 86.3 9.8 100.0
PL Count 36 114 30 180
% 20.0 63.3 16.7 100.0
SE Count 19 21 1 41
% 46.3 51.2 2.4 100.0
SK Count 13 26 13 52
% 25.0 50.0 25.0 100.0
RAY* Count 221 722 109 1,052
% 21.0 68.6 10.4 100.0
n other Count 68 203 20 291 % 23.4 69.8 6.9 100.0
Total Count 241 819 118 1,178 % 20.5 69.5 10.0 100.0
* sample too small for a meaningful comparison with other countries Table 100: Focus of organisation/group/body (PL)
N=1,215; n=1,122 Responses Percentage
of cases N Percentage Organised youth work (e.g. youth organisation, youth association, etc.) 355 18.2 31.6 Open youth work (e.g. youth centre premises where young people can meet during their leisure time, street work, etc.) including mobile youth work 196 10.0 17.5
Youth counselling, youth information 140 7.2 12.5 Youth services 64 3.3 5.7 Out-of-school youth education (non-formal youth education) 281 14.4 25.0 Youth exchange 241 12.3 21.5 Other types of education and training 169 8.6 15.1 Socio-political work (e.g. promoting human rights, integration, social justice, environmental protection, sustainable development etc. 169 8.6 15.1
Social work/social services 111 5.7 9.9 Cultural activities 228 11.7 20.3
Total 1,954 100.0 174.2 (multiple responses; a maximum of 2 answers were possible)
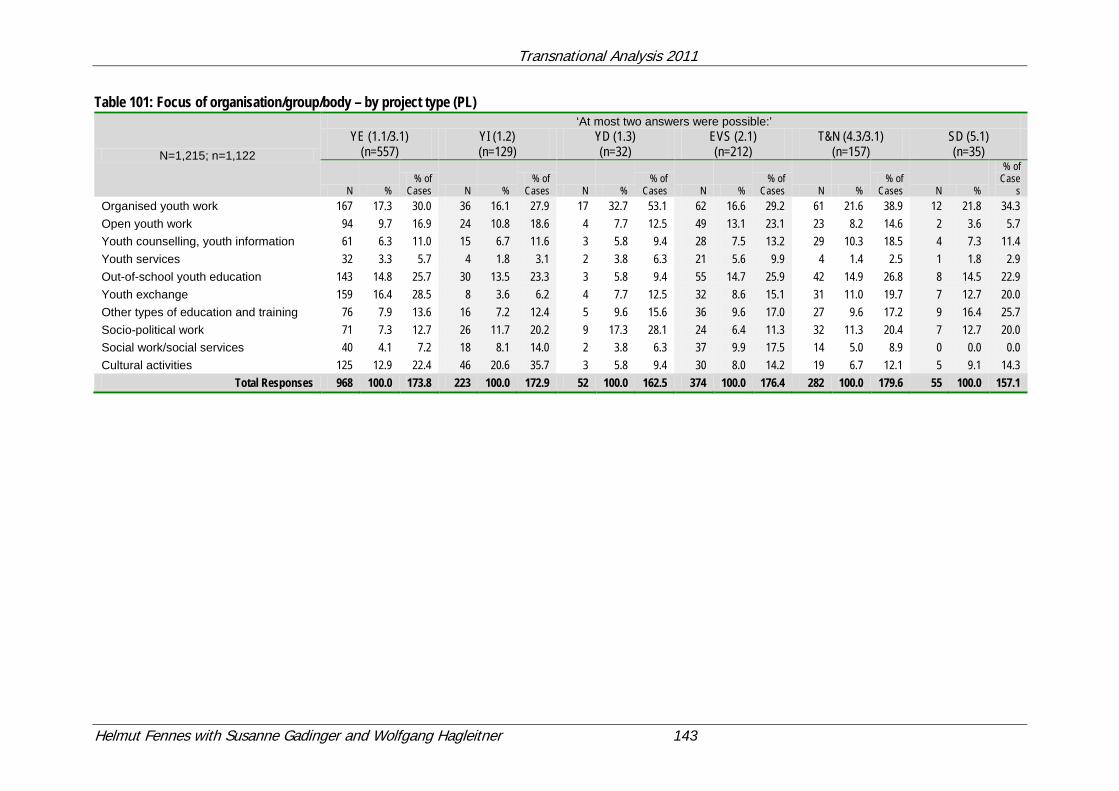
Transnational Analysis 2011
Helmut Fennes with Susanne Gadinger and Wolfgang Hagleitner 143
Table 101: Focus of organisation/group/body – by project type (PL)
N=1,215; n=1,122
‘At most two answers were possible:’ YE (1.1/3.1)
(n=557) YI (1.2) (n=129)
YD (1.3) (n=32)
EVS (2.1) (n=212)
T&N (4.3/3.1) (n=157)
SD (5.1) (n=35)
N % % of
Cases N % % of
Cases N % % of
Cases N % % of
Cases N % % of
Cases N %
% of Case
s Organised youth work 167 17.3 30.0 36 16.1 27.9 17 32.7 53.1 62 16.6 29.2 61 21.6 38.9 12 21.8 34.3 Open youth work 94 9.7 16.9 24 10.8 18.6 4 7.7 12.5 49 13.1 23.1 23 8.2 14.6 2 3.6 5.7 Youth counselling, youth information 61 6.3 11.0 15 6.7 11.6 3 5.8 9.4 28 7.5 13.2 29 10.3 18.5 4 7.3 11.4 Youth services 32 3.3 5.7 4 1.8 3.1 2 3.8 6.3 21 5.6 9.9 4 1.4 2.5 1 1.8 2.9 Out-of-school youth education 143 14.8 25.7 30 13.5 23.3 3 5.8 9.4 55 14.7 25.9 42 14.9 26.8 8 14.5 22.9 Youth exchange 159 16.4 28.5 8 3.6 6.2 4 7.7 12.5 32 8.6 15.1 31 11.0 19.7 7 12.7 20.0 Other types of education and training 76 7.9 13.6 16 7.2 12.4 5 9.6 15.6 36 9.6 17.0 27 9.6 17.2 9 16.4 25.7 Socio-political work 71 7.3 12.7 26 11.7 20.2 9 17.3 28.1 24 6.4 11.3 32 11.3 20.4 7 12.7 20.0 Social work/social services 40 4.1 7.2 18 8.1 14.0 2 3.8 6.3 37 9.9 17.5 14 5.0 8.9 0 0.0 0.0 Cultural activities 125 12.9 22.4 46 20.6 35.7 3 5.8 9.4 30 8.0 14.2 19 6.7 12.1 5 9.1 14.3
Total Responses 968 100.0 173.8 223 100.0 172.9 52 100.0 162.5 374 100.0 176.4 282 100.0 179.6 55 100.0 157.1
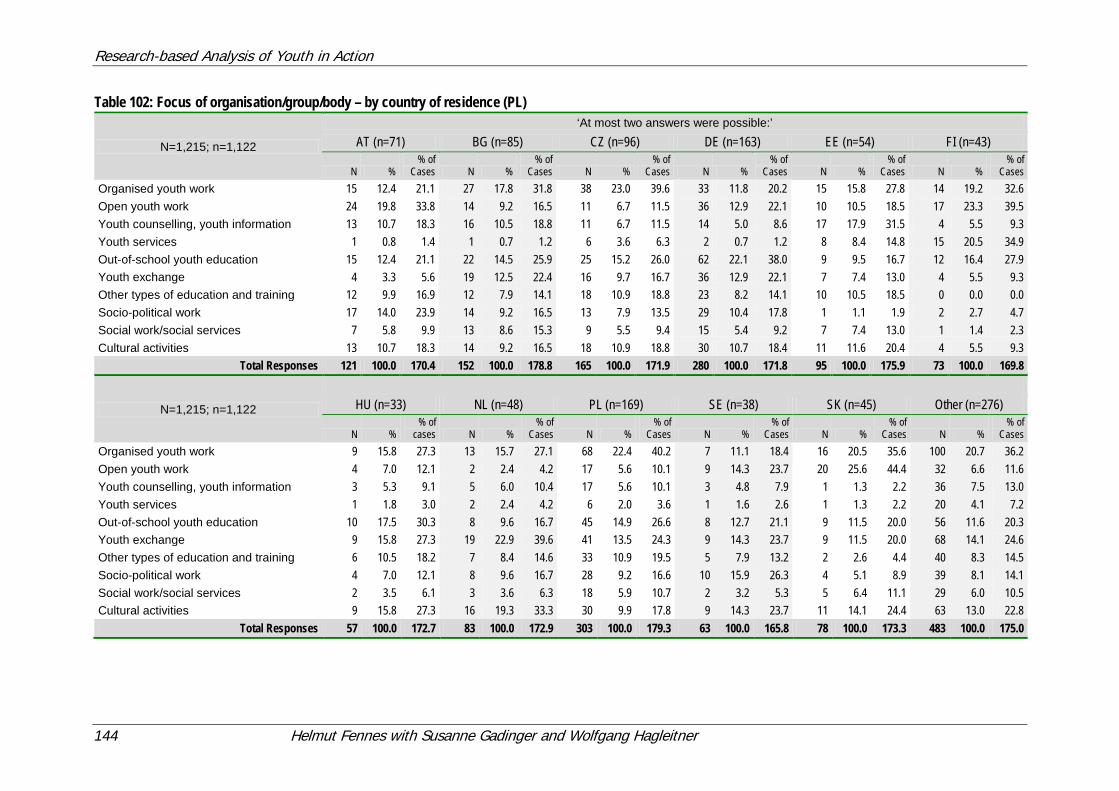
Research-based Analysis of Youth in Action
144 Helmut Fennes with Susanne Gadinger and Wolfgang Hagleitner
Table 102: Focus of organisation/group/body – by country of residence (PL)
N=1,215; n=1,122
‘At most two answers were possible:’ AT (n=71) BG (n=85) CZ (n=96) DE (n=163) EE (n=54) FI (n=43)
N % % of
Cases N % % of
Cases N % % of
Cases N % % of
Cases N % % of
Cases N % % of
Cases Organised youth work 15 12.4 21.1 27 17.8 31.8 38 23.0 39.6 33 11.8 20.2 15 15.8 27.8 14 19.2 32.6 Open youth work 24 19.8 33.8 14 9.2 16.5 11 6.7 11.5 36 12.9 22.1 10 10.5 18.5 17 23.3 39.5 Youth counselling, youth information 13 10.7 18.3 16 10.5 18.8 11 6.7 11.5 14 5.0 8.6 17 17.9 31.5 4 5.5 9.3 Youth services 1 0.8 1.4 1 0.7 1.2 6 3.6 6.3 2 0.7 1.2 8 8.4 14.8 15 20.5 34.9 Out-of-school youth education 15 12.4 21.1 22 14.5 25.9 25 15.2 26.0 62 22.1 38.0 9 9.5 16.7 12 16.4 27.9 Youth exchange 4 3.3 5.6 19 12.5 22.4 16 9.7 16.7 36 12.9 22.1 7 7.4 13.0 4 5.5 9.3 Other types of education and training 12 9.9 16.9 12 7.9 14.1 18 10.9 18.8 23 8.2 14.1 10 10.5 18.5 0 0.0 0.0 Socio-political work 17 14.0 23.9 14 9.2 16.5 13 7.9 13.5 29 10.4 17.8 1 1.1 1.9 2 2.7 4.7 Social work/social services 7 5.8 9.9 13 8.6 15.3 9 5.5 9.4 15 5.4 9.2 7 7.4 13.0 1 1.4 2.3 Cultural activities 13 10.7 18.3 14 9.2 16.5 18 10.9 18.8 30 10.7 18.4 11 11.6 20.4 4 5.5 9.3
Total Responses 121 100.0 170.4 152 100.0 178.8 165 100.0 171.9 280 100.0 171.8 95 100.0 175.9 73 100.0 169.8
N=1,215; n=1,122
HU (n=33) NL (n=48) PL (n=169) SE (n=38) SK (n=45) Other (n=276)
N % % of
cases N % % of
Cases N % % of
Cases N % % of
Cases N % % of
Cases N % % of
Cases Organised youth work 9 15.8 27.3 13 15.7 27.1 68 22.4 40.2 7 11.1 18.4 16 20.5 35.6 100 20.7 36.2 Open youth work 4 7.0 12.1 2 2.4 4.2 17 5.6 10.1 9 14.3 23.7 20 25.6 44.4 32 6.6 11.6 Youth counselling, youth information 3 5.3 9.1 5 6.0 10.4 17 5.6 10.1 3 4.8 7.9 1 1.3 2.2 36 7.5 13.0 Youth services 1 1.8 3.0 2 2.4 4.2 6 2.0 3.6 1 1.6 2.6 1 1.3 2.2 20 4.1 7.2 Out-of-school youth education 10 17.5 30.3 8 9.6 16.7 45 14.9 26.6 8 12.7 21.1 9 11.5 20.0 56 11.6 20.3 Youth exchange 9 15.8 27.3 19 22.9 39.6 41 13.5 24.3 9 14.3 23.7 9 11.5 20.0 68 14.1 24.6 Other types of education and training 6 10.5 18.2 7 8.4 14.6 33 10.9 19.5 5 7.9 13.2 2 2.6 4.4 40 8.3 14.5 Socio-political work 4 7.0 12.1 8 9.6 16.7 28 9.2 16.6 10 15.9 26.3 4 5.1 8.9 39 8.1 14.1 Social work/social services 2 3.5 6.1 3 3.6 6.3 18 5.9 10.7 2 3.2 5.3 5 6.4 11.1 29 6.0 10.5 Cultural activities 9 15.8 27.3 16 19.3 33.3 30 9.9 17.8 9 14.3 23.7 11 14.1 24.4 63 13.0 22.8
Total Responses 57 100.0 172.7 83 100.0 172.9 303 100.0 179.3 63 100.0 165.8 78 100.0 173.3 483 100.0 175.0
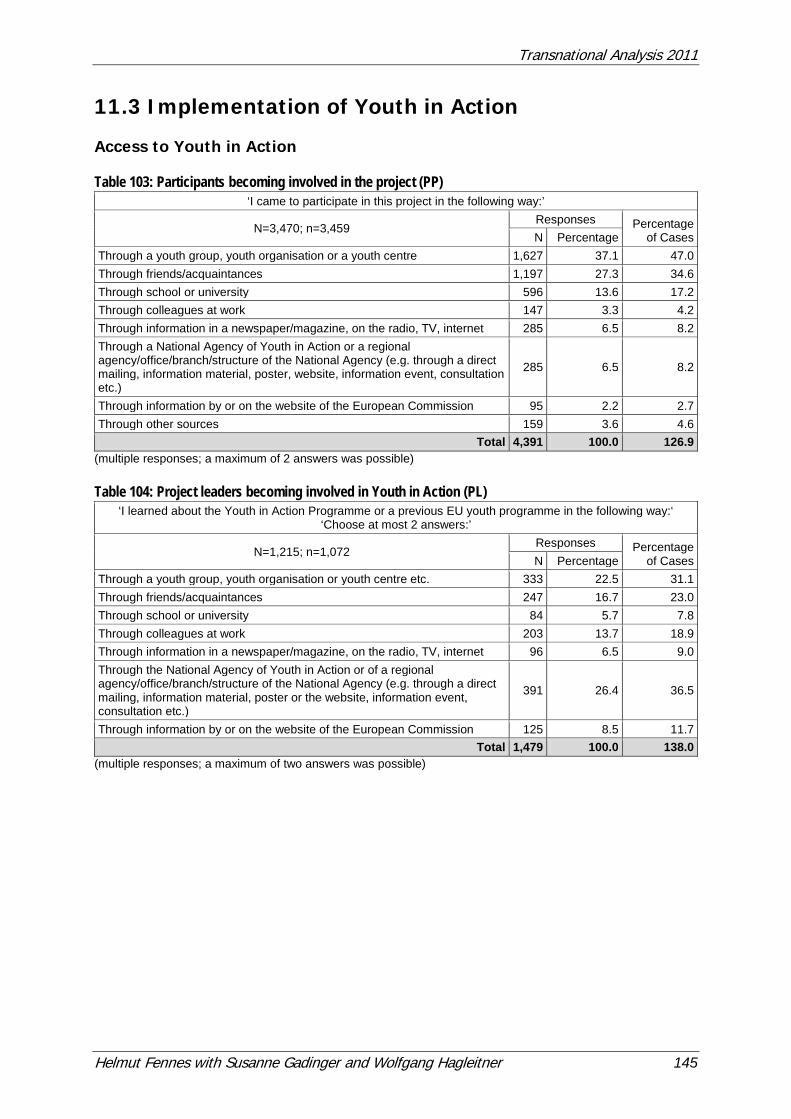
Transnational Analysis 2011
Helmut Fennes with Susanne Gadinger and Wolfgang Hagleitner 145
11.3 Implementation of Youth in Action Access to Youth in Action Table 103: Participants becoming involved in the project (PP)
‘I came to participate in this project in the following way:’
N=3,470; n=3,459 Responses Percentage
of Cases N Percentage Through a youth group, youth organisation or a youth centre 1,627 37.1 47.0 Through friends/acquaintances 1,197 27.3 34.6 Through school or university 596 13.6 17.2 Through colleagues at work 147 3.3 4.2 Through information in a newspaper/magazine, on the radio, TV, internet 285 6.5 8.2 Through a National Agency of Youth in Action or a regional agency/office/branch/structure of the National Agency (e.g. through a direct mailing, information material, poster, website, information event, consultation etc.)
285 6.5 8.2
Through information by or on the website of the European Commission 95 2.2 2.7 Through other sources 159 3.6 4.6
Total 4,391 100.0 126.9 (multiple responses; a maximum of 2 answers was possible) Table 104: Project leaders becoming involved in Youth in Action (PL)
‘I learned about the Youth in Action Programme or a previous EU youth programme in the following way:‘ ‘Choose at most 2 answers:’
N=1,215; n=1,072 Responses Percentage
of Cases N Percentage Through a youth group, youth organisation or youth centre etc. 333 22.5 31.1 Through friends/acquaintances 247 16.7 23.0 Through school or university 84 5.7 7.8 Through colleagues at work 203 13.7 18.9 Through information in a newspaper/magazine, on the radio, TV, internet 96 6.5 9.0 Through the National Agency of Youth in Action or of a regional agency/office/branch/structure of the National Agency (e.g. through a direct mailing, information material, poster or the website, information event, consultation etc.)
391 26.4 36.5
Through information by or on the website of the European Commission 125 8.5 11.7 Total 1,479 100.0 138.0
(multiple responses; a maximum of two answers was possible)
Research-based Analysis of Youth in Action
146 Helmut Fennes with Susanne Gadinger and Wolfgang Hagleitner
Table 105: Participants becoming involved in the project – by type of project (PP)
(multiple responses; a maximum of two answers was possible)
54.3
46.9
33.9
18.1
58.0
22.1
51.2
36.5
47.9
25.0
36.4
24.2
6.2
30.4
21.1
21.5
35.7
6.2
6.8
25.8
10.8
12.4
6.0
7.1
28.7
5.6
10.3
11.0
6.6
59.3
10.2
14.3
8.3
10.7
10.4
5.6
0.0 20.0 40.0 60.0 80.0 100.0 120.0 140.0
YE
YI
YD
EVS
T&N
TCP
SD
‘Becoming involved in the project ... ‘ multiple Response / percentage of cases N=3470; n=3459
Through a youth group, youth organisation or a youth centre
Through friends /acquaintances
Through school or university
Through colleagues at work
Through information in a newspaper /magazine, on the radio, TV, internet
Through a NA of Youth in Action or a regional agency /office /branch /structure of theNAThrough information by or on the website of the European Commission
Transnational Analysis 2011
Helmut Fennes with Susanne Gadinger and Wolfgang Hagleitner 147
Table 106: Project leaders becoming involved in Youth in Action – by project type (PL)
N=1,215; n=1,072
‘At most two answers were possible:’ YE (1.1/3.1)
(n=543) YI (1.2) (n=129)
YD (1.3) (n=33)
EVS (2.1) (n=184)
T&N (4.3/3.1) (n=149)
SD (5.1) (n=34)
N % % of
Cases N % % of
Cases N % % of
Cases N % % of
Cases N % % of
Cases N % % of
Cases Through a youth group, youth organisation or youth centre etc. 184 24.1 33.9 39 22.3 30.2 10 20.8 30.3 32 13.4 17.4 58 28.2 38.9 10 20.4 29.4
Through friends/acquaintances 117 15.3 21.5 49 28.0 38.0 6 12.5 18.2 43 18.1 23.4 27 13.1 18.1 5 10.2 14.7 Through school or university 53 6.9 9.8 9 5.1 7.0 3 6.3 9.1 12 5.0 6.5 4 1.9 2.7 3 6.1 8.8 Through colleagues at work 98 12.8 18.0 14 8.0 10.9 7 14.6 21.2 50 21.0 27.2 28 13.6 18.8 6 12.2 17.6 Through information in a newspaper/magazine, on the radio, TV, internet 57 7.5 10.5 16 9.1 12.4 2 4.2 6.1 8 3.4 4.3 10 4.9 6.7 3 6.1 8.8
Through the National Agency … 190 24.9 35.0 32 18.3 24.8 15 31.3 45.5 76 31.9 41.3 59 28.6 39.6 19 38.8 55.9 Through information by or on the website of the European Commission 64 8.4 11.8 16 9.1 12.4 5 10.4 15.2 17 7.1 9.2 20 9.7 13.4 3 6.1 8.8
Total Responses 763 100.0 140.5 175 100.0 135.7 48 100.0 145.5 238 100.0 129.3 206 100.0 138.3 49 100.0 144.1
Research-based Analysis of Youth in Action
148 Helmut Fennes with Susanne Gadinger and Wolfgang Hagleitner
Table 107: Participants becoming involved in the project – by country of residence (PP)
(multiple responses; a maximum of two answers was possible)
38.0
50.0
45.2
29.3
38.0
54.6
50.0
56.4
48.9
43.4
43.1
60.8
45.1
40.8
47.6
30.9
46.2
28.3
40.0
40.0
38.6
21.1
40.8
26.1
11.3
15.5
21.9
17.2
18.4
9.9
22.0
20.0
23.4
15.1
23.8
10.9
6.3
5.6
7.9
9.1
7.9
14.1
5.6
19.4
6.4
5.0
9.1
7.3
5.9
6.1
7.0
9.9
5.2
6.6
13.9
8.6
7.0
9.2
11.8
10.8
6.7
8.3
5.6
4.9
9.9
6.6
10.9
5.3
0.0 20.0 40.0 60.0 80.0 100.0 120.0 140.0 160.0
AT
BG
CZ
DE
EE
FI
HU
NL
PL
SE
SK
other
‘Becoming involved in the project ...’ multiple responses / percentage of cases N=3470; n=3453
Through a youth group, youth organisation or a youth centreThrough friends /acquaintancesThrough school or universityThrough colleagues at workThrough information in a newspaper /magazine, on the radio, TV, internetThrough a NA of Youth in Action or a regional agency /office /branch /structure of the NAThrough information by or on the website of the European CommissionThrough other sources
Transnational Analysis 2011
Helmut Fennes with Susanne Gadinger and Wolfgang Hagleitner 149
Table 108: Project leaders becoming involved in Youth in Action – by country of residence (PL)
N=1,215; n=1,072
‘At most two answers were possible:’ AT
(n=62) BG
(n=80) CZ
(n=91) DE
(n=140) EE
(n=55) FI
(n=43)
N % % of
Cases N % % of
Cases N % % of
Cases N % % of
Cases N % % of
Cases N % % of
Cases Through a youth group, youth organisation or youth centre etc. 12 14.6 19.4 26 21.1 32.5 20 17.4 22.0 25 13.2 17.9 20 26.7 36.4 9 14.5 20.9
Through friends/acquaintances 8 9.8 12.9 22 17.9 27.5 30 26.1 33.0 22 11.6 15.7 22 29.3 40.0 9 14.5 20.9 Through school or university 4 4.9 6.5 7 5.7 8.8 13 11.3 14.3 8 4.2 5.7 3 4.0 5.5 3 4.8 7.0 Through colleagues at work 14 17.1 22.6 6 4.9 7.5 19 16.5 20.9 49 25.8 35.0 4 5.3 7.3 12 19.4 27.9 Through information in a newspaper/magazine, on the radio, TV, internet 3 3.7 4.8 6 4.9 7.5 13 11.3 14.3 6 3.2 4.3 7 9.3 12.7 1 1.6 2.3
Through the National Agency … 33 40.2 53.2 36 29.3 45.0 19 16.5 20.9 55 28.9 39.3 17 22.7 30.9 25 40.3 58.1 Through information by or on the website of the European Commission 8 9.8 12.9 20 16.3 25.0 1 0.9 1.1 25 13.2 17.9 2 2.7 3.6 3 4.8 7.0
Total Responses 82 100.0 132.3 123 100.0 153.8 115 100.0 126.4 190 100.0 135.7 75 100.0 136.4 62 100.0 144.2
N=1,215; n=1,072
‘At most two answers were possible:‘ HU
(n=39) NL
(n=45) PL
(n=168) SE
(n=32) SK
(n=46) other
(n=269)
N % % of
Cases N % % of
Cases N % % of
Cases N % % of
Cases N % % of
Cases N % % of
Cases Through a youth group, youth organisation or youth centre etc. 17 28.8 43.6 17 29.8 37.8 43 18.0 25.6 8 21.1 25.0 13 22.0 28.3 123 32.6 45.7
Through friends/acquaintances 8 13.6 20.5 7 12.3 15.6 56 23.4 33.3 3 7.9 9.4 13 22.0 28.3 47 12.5 17.5 Through school or university 2 3.4 5.1 1 1.8 2.2 19 7.9 11.3 3 7.9 9.4 5 8.5 10.9 15 4.0 5.6 Through colleagues at work 7 11.9 17.9 11 19.3 24.4 23 9.6 13.7 9 23.7 28.1 3 5.1 6.5 46 12.2 17.1 Through information in a newspaper/magazine, on the radio, TV, internet 8 13.6 20.5 4 7.0 8.9 18 7.5 10.7 1 2.6 3.1 5 8.5 10.9 24 6.4 8.9
Through the National Agency … 14 23.7 35.9 14 24.6 31.1 67 28.0 39.9 11 28.9 34.4 18 30.5 39.1 80 21.2 29.7 Through information by or on the website of the European Commission 3 5.1 7.7 3 5.3 6.7 13 5.4 7.7 3 7.9 9.4 2 3.4 4.3 42 11.1 15.6
Total Responses 59 100.0 151.3 57 100.0 126.7 239 100.0 142.3 38 100.0 118.8 59 100.0 128.3 377 100.0 140.1
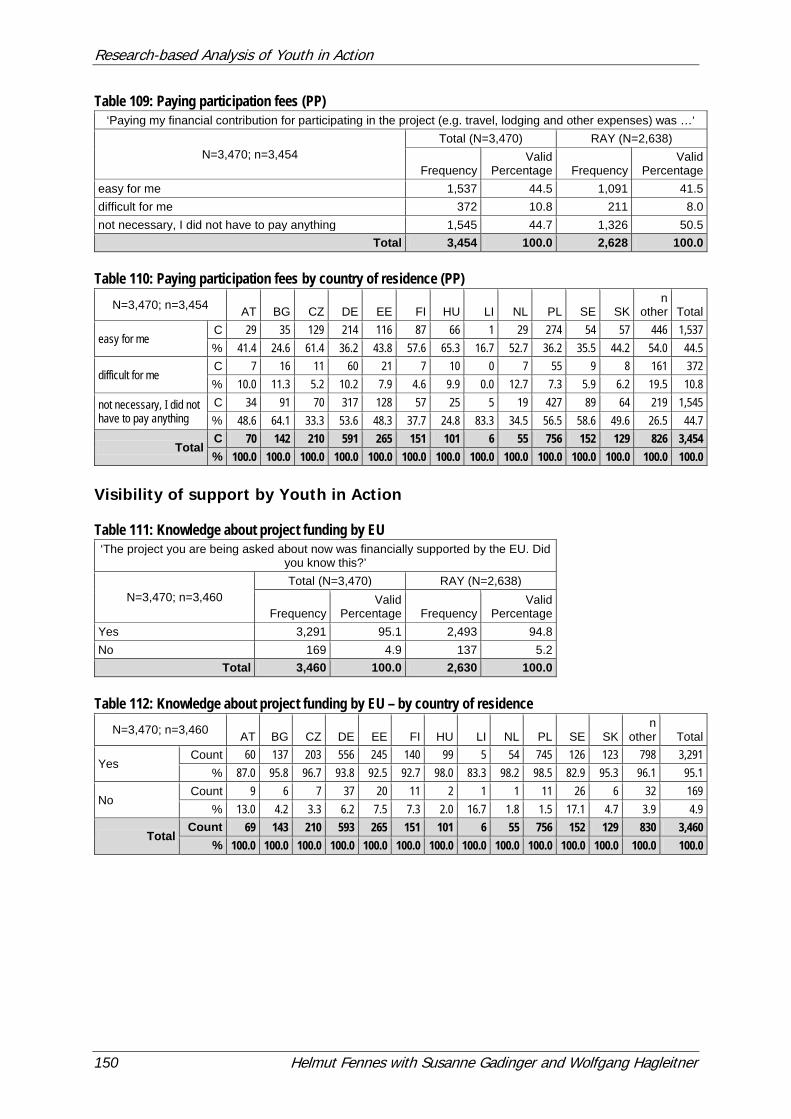
Research-based Analysis of Youth in Action
150 Helmut Fennes with Susanne Gadinger and Wolfgang Hagleitner
Table 109: Paying participation fees (PP) ‘Paying my financial contribution for participating in the project (e.g. travel, lodging and other expenses) was …‘
N=3,470; n=3,454 Total (N=3,470) RAY (N=2,638)
Frequency Valid
Percentage Frequency Valid
Percentage easy for me 1,537 44.5 1,091 41.5 difficult for me 372 10.8 211 8.0 not necessary, I did not have to pay anything 1,545 44.7 1,326 50.5
Total 3,454 100.0 2,628 100.0 Table 110: Paying participation fees by country of residence (PP)
N=3,470; n=3,454 AT BG CZ DE EE FI HU LI NL PL SE SK n
other Total
easy for me C 29 35 129 214 116 87 66 1 29 274 54 57 446 1,537 % 41.4 24.6 61.4 36.2 43.8 57.6 65.3 16.7 52.7 36.2 35.5 44.2 54.0 44.5
difficult for me C 7 16 11 60 21 7 10 0 7 55 9 8 161 372 % 10.0 11.3 5.2 10.2 7.9 4.6 9.9 0.0 12.7 7.3 5.9 6.2 19.5 10.8
not necessary, I did not have to pay anything
C 34 91 70 317 128 57 25 5 19 427 89 64 219 1,545 % 48.6 64.1 33.3 53.6 48.3 37.7 24.8 83.3 34.5 56.5 58.6 49.6 26.5 44.7
Total C 70 142 210 591 265 151 101 6 55 756 152 129 826 3,454 % 100.0 100.0 100.0 100.0 100.0 100.0 100.0 100.0 100.0 100.0 100.0 100.0 100.0 100.0
Visibility of support by Youth in Action Table 111: Knowledge about project funding by EU ‘The project you are being asked about now was financially supported by the EU. Did
you know this?’
N=3,470; n=3,460 Total (N=3,470) RAY (N=2,638)
Frequency Valid
Percentage Frequency Valid
Percentage Yes 3,291 95.1 2,493 94.8 No 169 4.9 137 5.2
Total 3,460 100.0 2,630 100.0 Table 112: Knowledge about project funding by EU – by country of residence
N=3,470; n=3,460 AT BG CZ DE EE FI HU LI NL PL SE SK n
other Total
Yes Count 60 137 203 556 245 140 99 5 54 745 126 123 798 3,291
% 87.0 95.8 96.7 93.8 92.5 92.7 98.0 83.3 98.2 98.5 82.9 95.3 96.1 95.1
No Count 9 6 7 37 20 11 2 1 1 11 26 6 32 169
% 13.0 4.2 3.3 6.2 7.5 7.3 2.0 16.7 1.8 1.5 17.1 4.7 3.9 4.9
Total Count 69 143 210 593 265 151 101 6 55 756 152 129 830 3,460
% 100.0 100.0 100.0 100.0 100.0 100.0 100.0 100.0 100.0 100.0 100.0 100.0 100.0 100.0
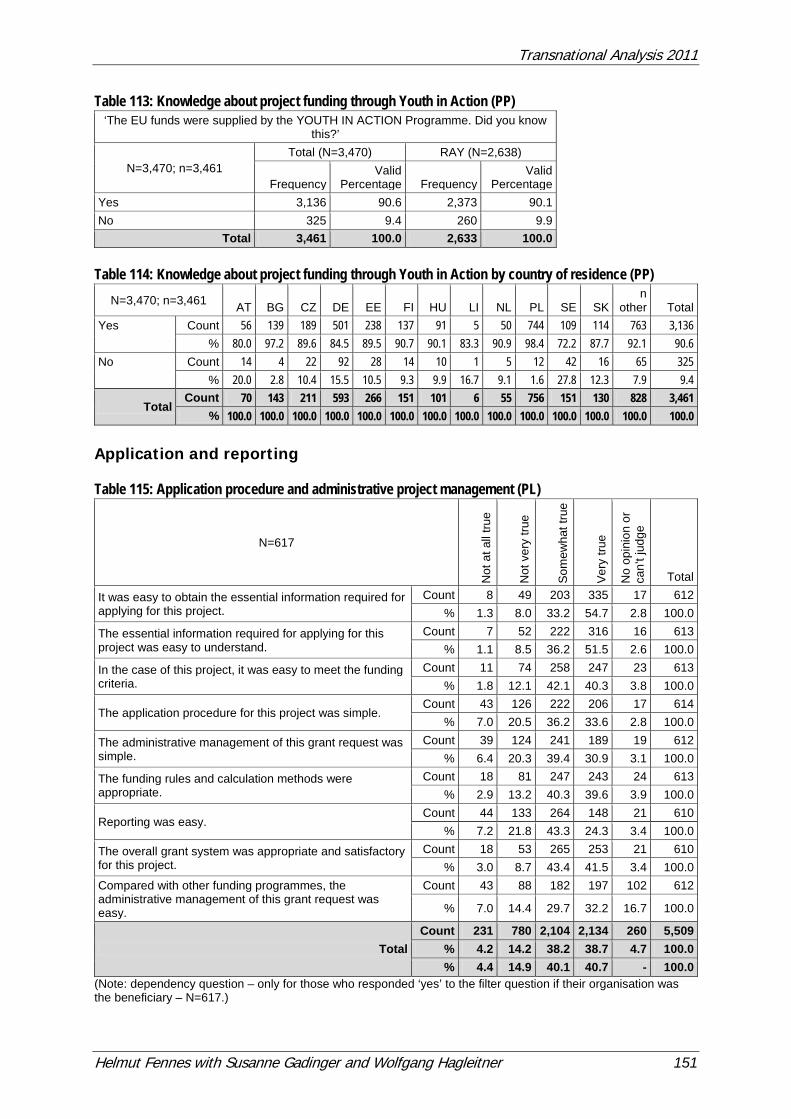
Transnational Analysis 2011
Helmut Fennes with Susanne Gadinger and Wolfgang Hagleitner 151
Table 113: Knowledge about project funding through Youth in Action (PP) ‘The EU funds were supplied by the YOUTH IN ACTION Programme. Did you know
this?’
N=3,470; n=3,461 Total (N=3,470) RAY (N=2,638)
Frequency Valid
Percentage Frequency Valid
Percentage Yes 3,136 90.6 2,373 90.1 No 325 9.4 260 9.9
Total 3,461 100.0 2,633 100.0 Table 114: Knowledge about project funding through Youth in Action by country of residence (PP)
N=3,470; n=3,461 AT BG CZ DE EE FI HU LI NL PL SE SK n
other Total Yes Count 56 139 189 501 238 137 91 5 50 744 109 114 763 3,136
% 80.0 97.2 89.6 84.5 89.5 90.7 90.1 83.3 90.9 98.4 72.2 87.7 92.1 90.6 No Count 14 4 22 92 28 14 10 1 5 12 42 16 65 325
% 20.0 2.8 10.4 15.5 10.5 9.3 9.9 16.7 9.1 1.6 27.8 12.3 7.9 9.4
Total Count 70 143 211 593 266 151 101 6 55 756 151 130 828 3,461
% 100.0 100.0 100.0 100.0 100.0 100.0 100.0 100.0 100.0 100.0 100.0 100.0 100.0 100.0 Application and reporting Table 115: Application procedure and administrative project management (PL)
N=617
Not
at a
ll tru
e
Not
ver
y tru
e
Som
ewha
t tru
e
Ver
y tru
e
No
opin
ion
or
can’
t jud
ge
Total
It was easy to obtain the essential information required for applying for this project.
Count 8 49 203 335 17 612 % 1.3 8.0 33.2 54.7 2.8 100.0
The essential information required for applying for this project was easy to understand.
Count 7 52 222 316 16 613 % 1.1 8.5 36.2 51.5 2.6 100.0
In the case of this project, it was easy to meet the funding criteria.
Count 11 74 258 247 23 613 % 1.8 12.1 42.1 40.3 3.8 100.0
The application procedure for this project was simple. Count 43 126 222 206 17 614
% 7.0 20.5 36.2 33.6 2.8 100.0
The administrative management of this grant request was simple.
Count 39 124 241 189 19 612 % 6.4 20.3 39.4 30.9 3.1 100.0
The funding rules and calculation methods were appropriate.
Count 18 81 247 243 24 613 % 2.9 13.2 40.3 39.6 3.9 100.0
Reporting was easy. Count 44 133 264 148 21 610
% 7.2 21.8 43.3 24.3 3.4 100.0
The overall grant system was appropriate and satisfactory for this project.
Count 18 53 265 253 21 610 % 3.0 8.7 43.4 41.5 3.4 100.0
Compared with other funding programmes, the administrative management of this grant request was easy.
Count 43 88 182 197 102 612
% 7.0 14.4 29.7 32.2 16.7 100.0
Total Count 231 780 2,104 2,134 260 5,509
% 4.2 14.2 38.2 38.7 4.7 100.0 % 4.4 14.9 40.1 40.7 - 100.0
(Note: dependency question – only for those who responded ‘yes’ to the filter question if their organisation was the beneficiary – N=617.)
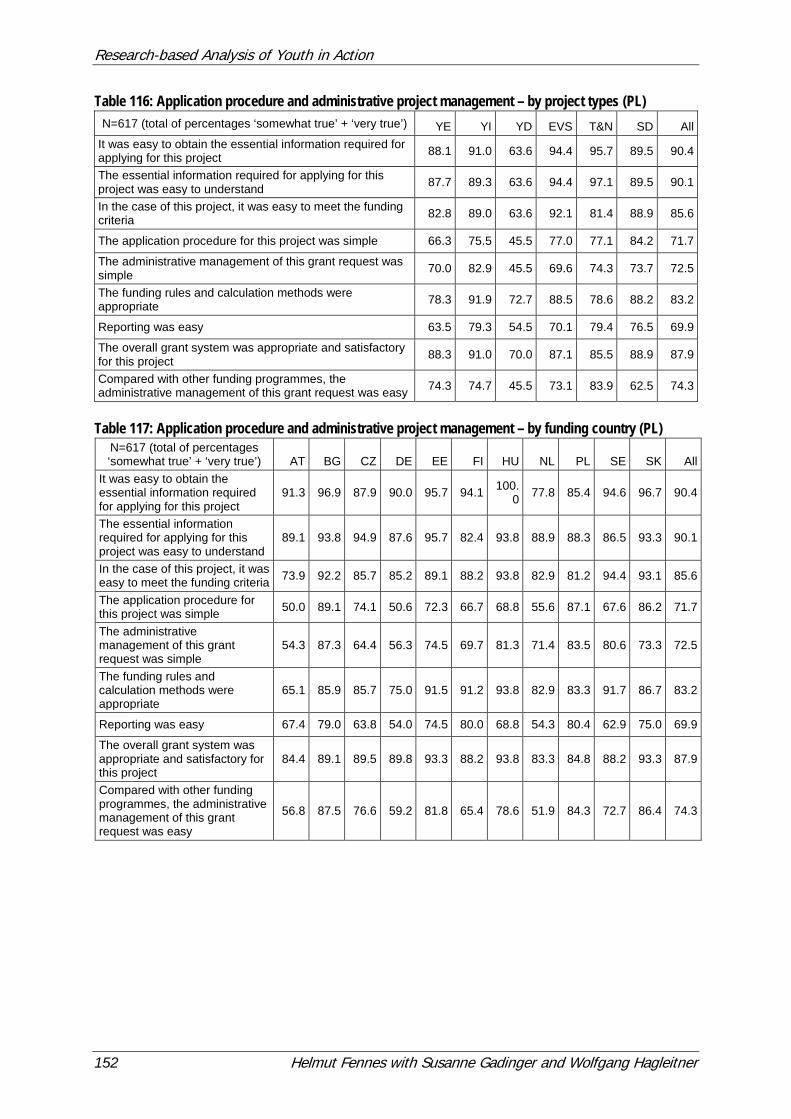
Research-based Analysis of Youth in Action
152 Helmut Fennes with Susanne Gadinger and Wolfgang Hagleitner
Table 116: Application procedure and administrative project management – by project types (PL) N=617 (total of percentages ‘somewhat true’ + ‘very true’) YE YI YD EVS T&N SD All
It was easy to obtain the essential information required for applying for this project 88.1 91.0 63.6 94.4 95.7 89.5 90.4
The essential information required for applying for this project was easy to understand 87.7 89.3 63.6 94.4 97.1 89.5 90.1
In the case of this project, it was easy to meet the funding criteria 82.8 89.0 63.6 92.1 81.4 88.9 85.6
The application procedure for this project was simple 66.3 75.5 45.5 77.0 77.1 84.2 71.7
The administrative management of this grant request was simple 70.0 82.9 45.5 69.6 74.3 73.7 72.5
The funding rules and calculation methods were appropriate 78.3 91.9 72.7 88.5 78.6 88.2 83.2
Reporting was easy 63.5 79.3 54.5 70.1 79.4 76.5 69.9
The overall grant system was appropriate and satisfactory for this project 88.3 91.0 70.0 87.1 85.5 88.9 87.9
Compared with other funding programmes, the administrative management of this grant request was easy 74.3 74.7 45.5 73.1 83.9 62.5 74.3
Table 117: Application procedure and administrative project management – by funding country (PL)
N=617 (total of percentages ‘somewhat true’ + ‘very true’) AT BG CZ DE EE FI HU NL PL SE SK All
It was easy to obtain the essential information required for applying for this project
91.3 96.9 87.9 90.0 95.7 94.1 100.0 77.8 85.4 94.6 96.7 90.4
The essential information required for applying for this project was easy to understand
89.1 93.8 94.9 87.6 95.7 82.4 93.8 88.9 88.3 86.5 93.3 90.1
In the case of this project, it was easy to meet the funding criteria 73.9 92.2 85.7 85.2 89.1 88.2 93.8 82.9 81.2 94.4 93.1 85.6
The application procedure for this project was simple 50.0 89.1 74.1 50.6 72.3 66.7 68.8 55.6 87.1 67.6 86.2 71.7
The administrative management of this grant request was simple
54.3 87.3 64.4 56.3 74.5 69.7 81.3 71.4 83.5 80.6 73.3 72.5
The funding rules and calculation methods were appropriate
65.1 85.9 85.7 75.0 91.5 91.2 93.8 82.9 83.3 91.7 86.7 83.2
Reporting was easy 67.4 79.0 63.8 54.0 74.5 80.0 68.8 54.3 80.4 62.9 75.0 69.9
The overall grant system was appropriate and satisfactory for this project
84.4 89.1 89.5 89.8 93.3 88.2 93.8 83.3 84.8 88.2 93.3 87.9
Compared with other funding programmes, the administrative management of this grant request was easy
56.8 87.5 76.6 59.2 81.8 65.4 78.6 51.9 84.3 72.7 86.4 74.3
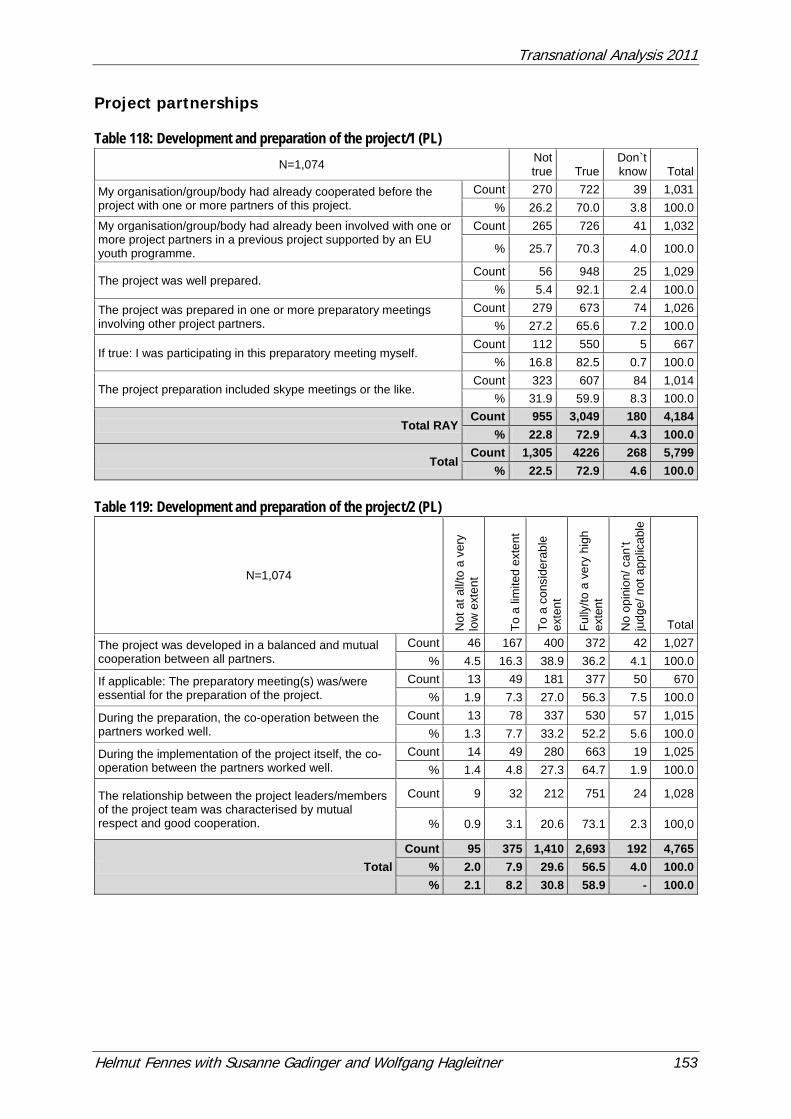
Transnational Analysis 2011
Helmut Fennes with Susanne Gadinger and Wolfgang Hagleitner 153
Project partnerships Table 118: Development and preparation of the project/1 (PL)
N=1,074 Not true True
Don`t know Total
My organisation/group/body had already cooperated before the project with one or more partners of this project.
Count 270 722 39 1,031 % 26.2 70.0 3.8 100.0
My organisation/group/body had already been involved with one or more project partners in a previous project supported by an EU youth programme.
Count 265 726 41 1,032
% 25.7 70.3 4.0 100.0
The project was well prepared. Count 56 948 25 1,029
% 5.4 92.1 2.4 100.0
The project was prepared in one or more preparatory meetings involving other project partners.
Count 279 673 74 1,026 % 27.2 65.6 7.2 100.0
If true: I was participating in this preparatory meeting myself. Count 112 550 5 667
% 16.8 82.5 0.7 100.0
The project preparation included skype meetings or the like. Count 323 607 84 1,014
% 31.9 59.9 8.3 100.0
Total RAY Count 955 3,049 180 4,184
% 22.8 72.9 4.3 100.0
Total Count 1,305 4226 268 5,799
% 22.5 72.9 4.6 100.0 Table 119: Development and preparation of the project/2 (PL)
N=1,074
Not
at a
ll/to
a v
ery
low
ext
ent
To a
lim
ited
exte
nt
To a
con
side
rabl
e ex
tent
Fully
/to a
ver
y hi
gh
exte
nt
No
opin
ion/
can
’t ju
dge/
not
app
licab
le
Total
The project was developed in a balanced and mutual cooperation between all partners.
Count 46 167 400 372 42 1,027 % 4.5 16.3 38.9 36.2 4.1 100.0
If applicable: The preparatory meeting(s) was/were essential for the preparation of the project.
Count 13 49 181 377 50 670 % 1.9 7.3 27.0 56.3 7.5 100.0
During the preparation, the co-operation between the partners worked well.
Count 13 78 337 530 57 1,015 % 1.3 7.7 33.2 52.2 5.6 100.0
During the implementation of the project itself, the co-operation between the partners worked well.
Count 14 49 280 663 19 1,025 % 1.4 4.8 27.3 64.7 1.9 100.0
The relationship between the project leaders/members of the project team was characterised by mutual respect and good cooperation.
Count 9 32 212 751 24 1,028
% 0.9 3.1 20.6 73.1 2.3 100,0
Total Count 95 375 1,410 2,693 192 4,765
% 2.0 7.9 29.6 56.5 4.0 100.0 % 2.1 8.2 30.8 58.9 - 100.0
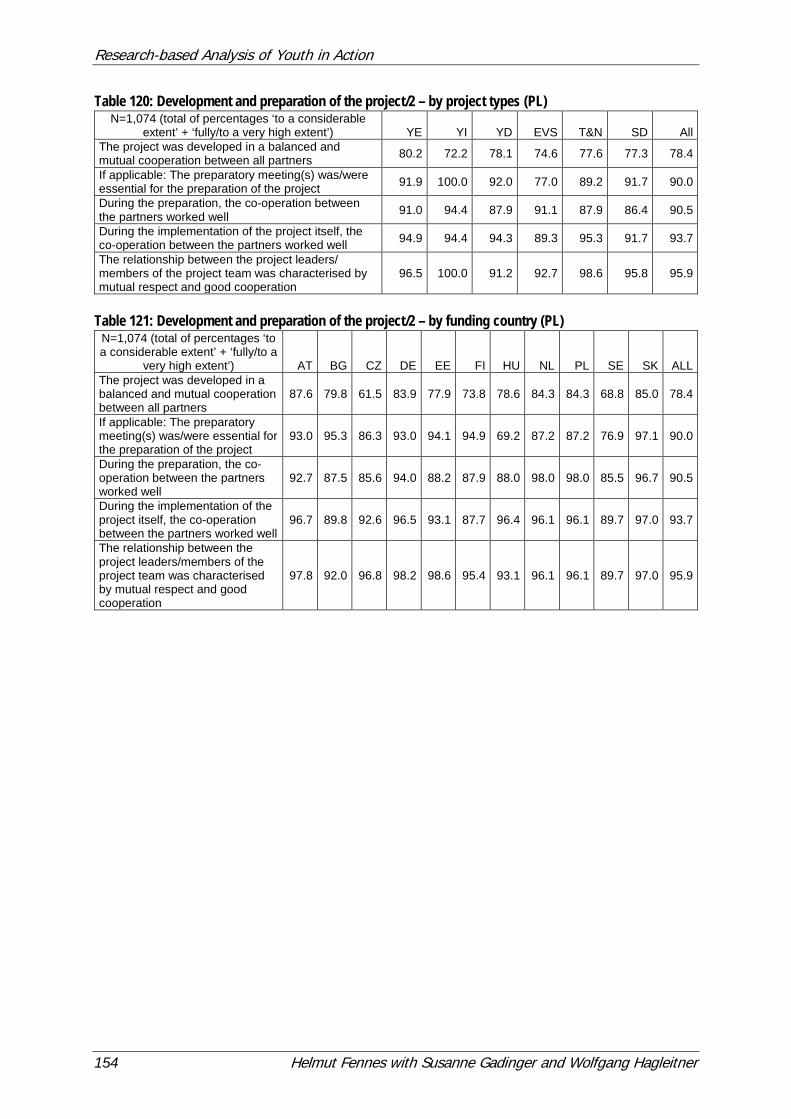
Research-based Analysis of Youth in Action
154 Helmut Fennes with Susanne Gadinger and Wolfgang Hagleitner
Table 120: Development and preparation of the project/2 – by project types (PL) N=1,074 (total of percentages ‘to a considerable
extent’ + ‘fully/to a very high extent’) YE YI YD EVS T&N SD All The project was developed in a balanced and mutual cooperation between all partners 80.2 72.2 78.1 74.6 77.6 77.3 78.4
If applicable: The preparatory meeting(s) was/were essential for the preparation of the project 91.9 100.0 92.0 77.0 89.2 91.7 90.0
During the preparation, the co-operation between the partners worked well 91.0 94.4 87.9 91.1 87.9 86.4 90.5
During the implementation of the project itself, the co-operation between the partners worked well 94.9 94.4 94.3 89.3 95.3 91.7 93.7
The relationship between the project leaders/ members of the project team was characterised by mutual respect and good cooperation
96.5 100.0 91.2 92.7 98.6 95.8 95.9
Table 121: Development and preparation of the project/2 – by funding country (PL)
N=1,074 (total of percentages ‘to a considerable extent’ + ‘fully/to a
very high extent’) AT BG CZ DE EE FI HU NL PL SE SK ALL The project was developed in a balanced and mutual cooperation between all partners
87.6 79.8 61.5 83.9 77.9 73.8 78.6 84.3 84.3 68.8 85.0 78.4
If applicable: The preparatory meeting(s) was/were essential for the preparation of the project
93.0 95.3 86.3 93.0 94.1 94.9 69.2 87.2 87.2 76.9 97.1 90.0
During the preparation, the co-operation between the partners worked well
92.7 87.5 85.6 94.0 88.2 87.9 88.0 98.0 98.0 85.5 96.7 90.5
During the implementation of the project itself, the co-operation between the partners worked well
96.7 89.8 92.6 96.5 93.1 87.7 96.4 96.1 96.1 89.7 97.0 93.7
The relationship between the project leaders/members of the project team was characterised by mutual respect and good cooperation
97.8 92.0 96.8 98.2 98.6 95.4 93.1 96.1 96.1 89.7 97.0 95.9
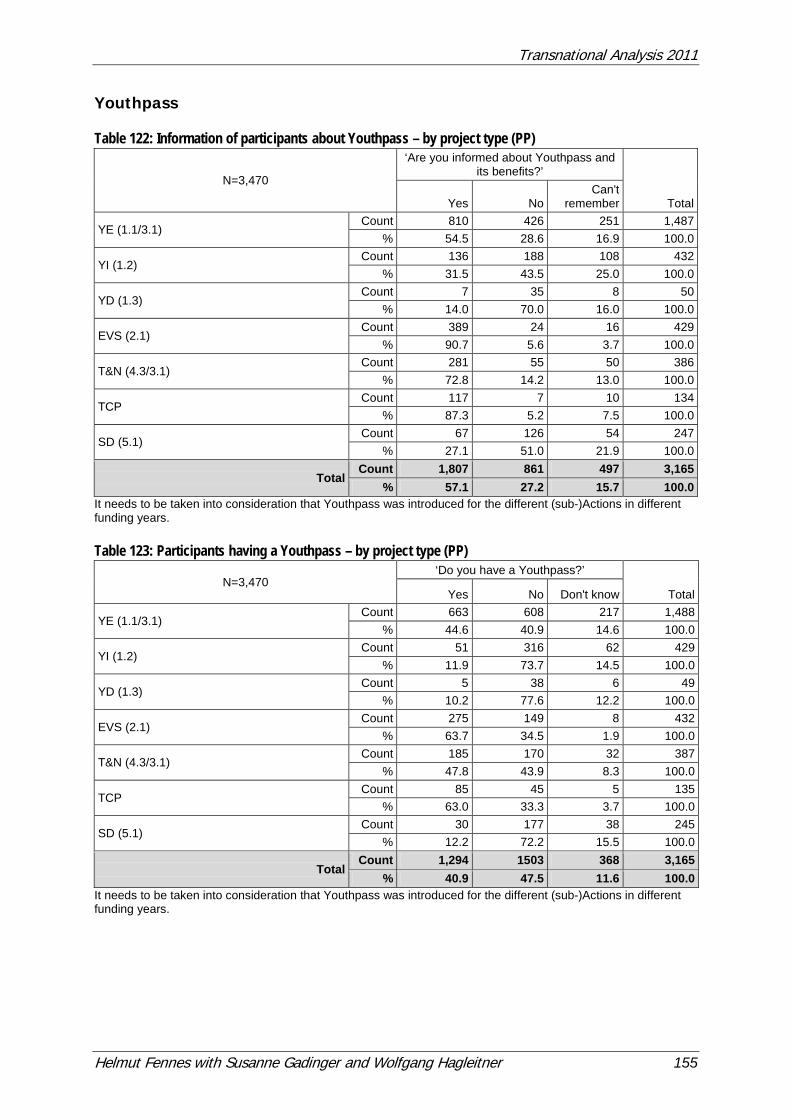
Transnational Analysis 2011
Helmut Fennes with Susanne Gadinger and Wolfgang Hagleitner 155
Youthpass Table 122: Information of participants about Youthpass – by project type (PP)
N=3,470
‘Are you informed about Youthpass and its benefits?’
Total Yes No Can't
remember
YE (1.1/3.1) Count 810 426 251 1,487
% 54.5 28.6 16.9 100.0
YI (1.2) Count 136 188 108 432
% 31.5 43.5 25.0 100.0
YD (1.3) Count 7 35 8 50
% 14.0 70.0 16.0 100.0
EVS (2.1) Count 389 24 16 429
% 90.7 5.6 3.7 100.0
T&N (4.3/3.1) Count 281 55 50 386
% 72.8 14.2 13.0 100.0
TCP Count 117 7 10 134
% 87.3 5.2 7.5 100.0
SD (5.1) Count 67 126 54 247
% 27.1 51.0 21.9 100.0
Total Count 1,807 861 497 3,165
% 57.1 27.2 15.7 100.0 It needs to be taken into consideration that Youthpass was introduced for the different (sub-)Actions in different funding years. Table 123: Participants having a Youthpass – by project type (PP)
N=3,470 ‘Do you have a Youthpass?’
Total Yes No Don't know
YE (1.1/3.1) Count 663 608 217 1,488
% 44.6 40.9 14.6 100.0
YI (1.2) Count 51 316 62 429
% 11.9 73.7 14.5 100.0
YD (1.3) Count 5 38 6 49
% 10.2 77.6 12.2 100.0
EVS (2.1) Count 275 149 8 432
% 63.7 34.5 1.9 100.0
T&N (4.3/3.1) Count 185 170 32 387
% 47.8 43.9 8.3 100.0
TCP Count 85 45 5 135
% 63.0 33.3 3.7 100.0
SD (5.1) Count 30 177 38 245
% 12.2 72.2 15.5 100.0
Total Count 1,294 1503 368 3,165
% 40.9 47.5 11.6 100.0 It needs to be taken into consideration that Youthpass was introduced for the different (sub-)Actions in different funding years.
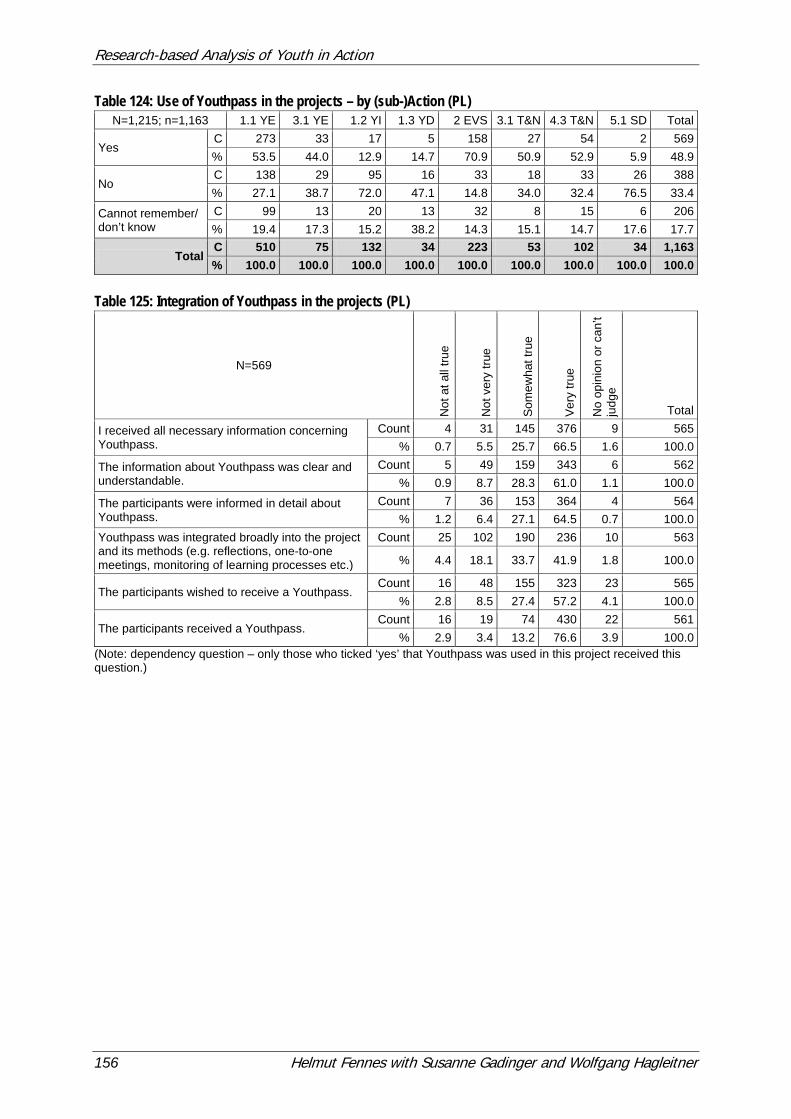
Research-based Analysis of Youth in Action
156 Helmut Fennes with Susanne Gadinger and Wolfgang Hagleitner
Table 124: Use of Youthpass in the projects – by (sub-)Action (PL) N=1,215; n=1,163 1.1 YE 3.1 YE 1.2 YI 1.3 YD 2 EVS 3.1 T&N 4.3 T&N 5.1 SD Total
Yes C 273 33 17 5 158 27 54 2 569 % 53.5 44.0 12.9 14.7 70.9 50.9 52.9 5.9 48.9
No C 138 29 95 16 33 18 33 26 388 % 27.1 38.7 72.0 47.1 14.8 34.0 32.4 76.5 33.4
Cannot remember/ don’t know
C 99 13 20 13 32 8 15 6 206 % 19.4 17.3 15.2 38.2 14.3 15.1 14.7 17.6 17.7
Total C 510 75 132 34 223 53 102 34 1,163 % 100.0 100.0 100.0 100.0 100.0 100.0 100.0 100.0 100.0
Table 125: Integration of Youthpass in the projects (PL)
N=569
Not
at a
ll tru
e
Not
ver
y tru
e
Som
ewha
t tru
e
Ver
y tru
e
No
opin
ion
or c
an’t
judg
e
Total
I received all necessary information concerning Youthpass.
Count 4 31 145 376 9 565 % 0.7 5.5 25.7 66.5 1.6 100.0
The information about Youthpass was clear and understandable.
Count 5 49 159 343 6 562 % 0.9 8.7 28.3 61.0 1.1 100.0
The participants were informed in detail about Youthpass.
Count 7 36 153 364 4 564 % 1.2 6.4 27.1 64.5 0.7 100.0
Youthpass was integrated broadly into the project and its methods (e.g. reflections, one-to-one meetings, monitoring of learning processes etc.)
Count 25 102 190 236 10 563
% 4.4 18.1 33.7 41.9 1.8 100.0
The participants wished to receive a Youthpass. Count 16 48 155 323 23 565
% 2.8 8.5 27.4 57.2 4.1 100.0
The participants received a Youthpass. Count 16 19 74 430 22 561
% 2.9 3.4 13.2 76.6 3.9 100.0 (Note: dependency question – only those who ticked ‘yes’ that Youthpass was used in this project received this question.)
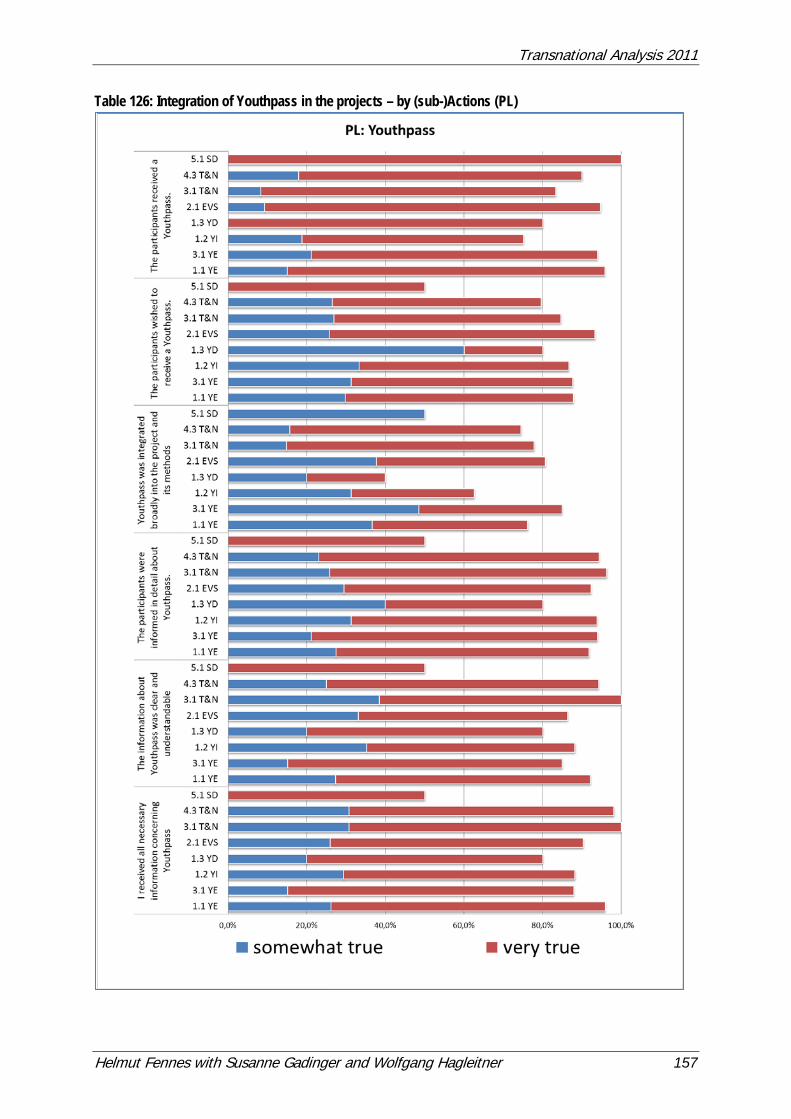
Transnational Analysis 2011
Helmut Fennes with Susanne Gadinger and Wolfgang Hagleitner 157
Table 126: Integration of Youthpass in the projects – by (sub-)Actions (PL)
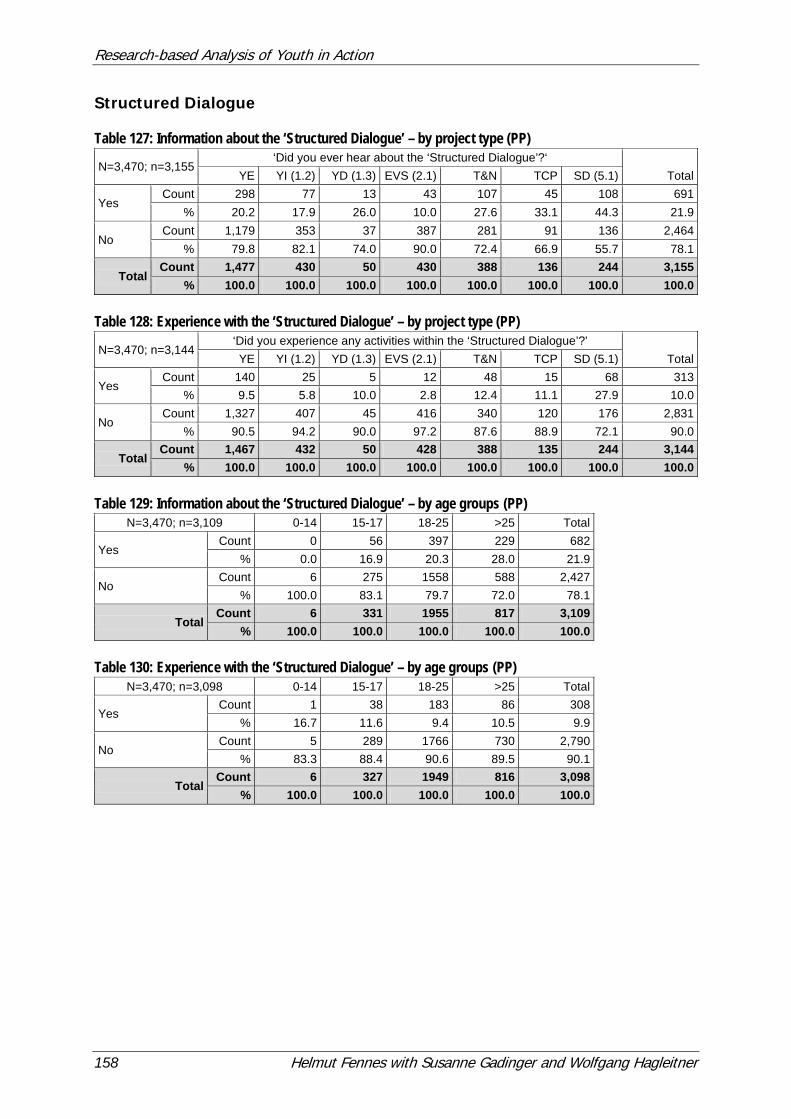
Research-based Analysis of Youth in Action
158 Helmut Fennes with Susanne Gadinger and Wolfgang Hagleitner
Structured Dialogue Table 127: Information about the ‘Structured Dialogue’ – by project type (PP)
N=3,470; n=3,155 ‘Did you ever hear about the ‘Structured Dialogue’?‘
Total YE YI (1.2) YD (1.3) EVS (2.1) T&N TCP SD (5.1)
Yes Count 298 77 13 43 107 45 108 691
% 20.2 17.9 26.0 10.0 27.6 33.1 44.3 21.9
No Count 1,179 353 37 387 281 91 136 2,464
% 79.8 82.1 74.0 90.0 72.4 66.9 55.7 78.1
Total Count 1,477 430 50 430 388 136 244 3,155
% 100.0 100.0 100.0 100.0 100.0 100.0 100.0 100.0 Table 128: Experience with the ‘Structured Dialogue’ – by project type (PP)
N=3,470; n=3,144 ‘Did you experience any activities within the ‘Structured Dialogue’?’
Total YE YI (1.2) YD (1.3) EVS (2.1) T&N TCP SD (5.1)
Yes Count 140 25 5 12 48 15 68 313
% 9.5 5.8 10.0 2.8 12.4 11.1 27.9 10.0
No Count 1,327 407 45 416 340 120 176 2,831
% 90.5 94.2 90.0 97.2 87.6 88.9 72.1 90.0
Total Count 1,467 432 50 428 388 135 244 3,144
% 100.0 100.0 100.0 100.0 100.0 100.0 100.0 100.0 Table 129: Information about the ‘Structured Dialogue’ – by age groups (PP)
N=3,470; n=3,109 0-14 15-17 18-25 >25 Total
Yes Count 0 56 397 229 682
% 0.0 16.9 20.3 28.0 21.9
No Count 6 275 1558 588 2,427
% 100.0 83.1 79.7 72.0 78.1
Total Count 6 331 1955 817 3,109
% 100.0 100.0 100.0 100.0 100.0 Table 130: Experience with the ‘Structured Dialogue’ – by age groups (PP)
N=3,470; n=3,098 0-14 15-17 18-25 >25 Total
Yes Count 1 38 183 86 308
% 16.7 11.6 9.4 10.5 9.9
No Count 5 289 1766 730 2,790
% 83.3 88.4 90.6 89.5 90.1
Total Count 6 327 1949 816 3,098
% 100.0 100.0 100.0 100.0 100.0
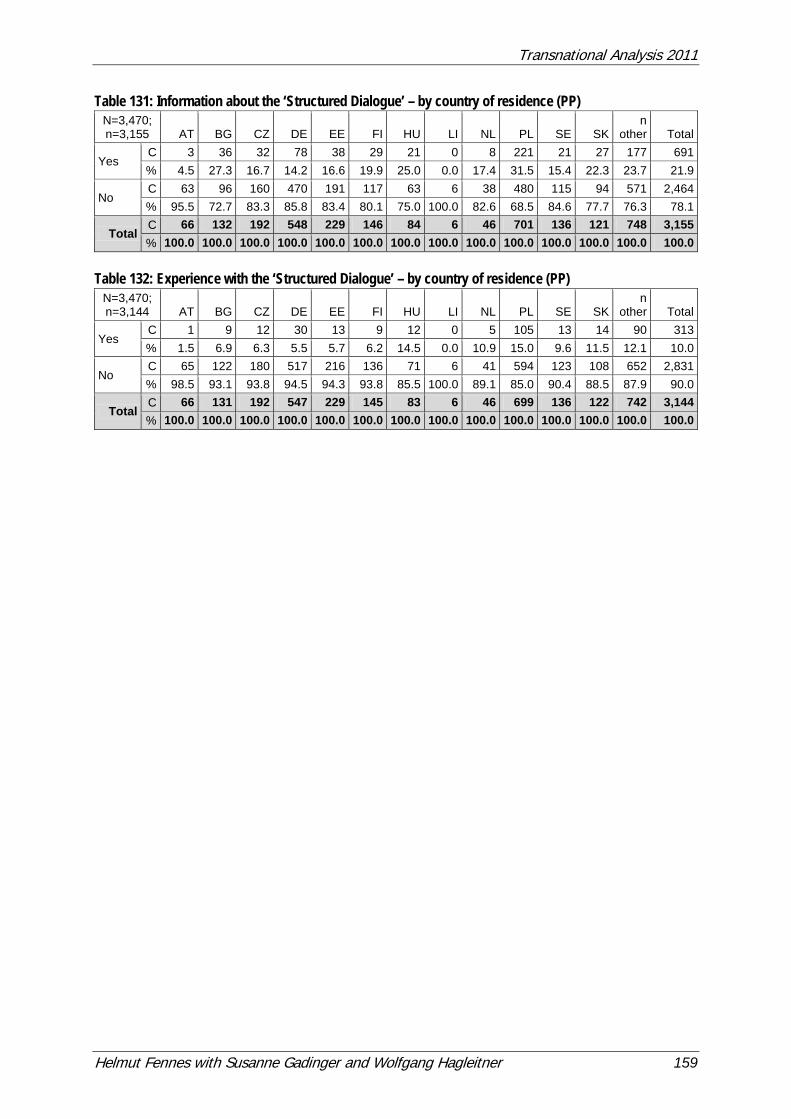
Transnational Analysis 2011
Helmut Fennes with Susanne Gadinger and Wolfgang Hagleitner 159
Table 131: Information about the ‘Structured Dialogue’ – by country of residence (PP) N=3,470; n=3,155 AT BG CZ DE EE FI HU LI NL PL SE SK
n other Total
Yes C 3 36 32 78 38 29 21 0 8 221 21 27 177 691 % 4.5 27.3 16.7 14.2 16.6 19.9 25.0 0.0 17.4 31.5 15.4 22.3 23.7 21.9
No C 63 96 160 470 191 117 63 6 38 480 115 94 571 2,464 % 95.5 72.7 83.3 85.8 83.4 80.1 75.0 100.0 82.6 68.5 84.6 77.7 76.3 78.1
Total C 66 132 192 548 229 146 84 6 46 701 136 121 748 3,155 % 100.0 100.0 100.0 100.0 100.0 100.0 100.0 100.0 100.0 100.0 100.0 100.0 100.0 100.0
Table 132: Experience with the ‘Structured Dialogue’ – by country of residence (PP)
N=3,470; n=3,144 AT BG CZ DE EE FI HU LI NL PL SE SK
n other Total
Yes C 1 9 12 30 13 9 12 0 5 105 13 14 90 313 % 1.5 6.9 6.3 5.5 5.7 6.2 14.5 0.0 10.9 15.0 9.6 11.5 12.1 10.0
No C 65 122 180 517 216 136 71 6 41 594 123 108 652 2,831 % 98.5 93.1 93.8 94.5 94.3 93.8 85.5 100.0 89.1 85.0 90.4 88.5 87.9 90.0
Total C 66 131 192 547 229 145 83 6 46 699 136 122 742 3,144 % 100.0 100.0 100.0 100.0 100.0 100.0 100.0 100.0 100.0 100.0 100.0 100.0 100.0 100.0
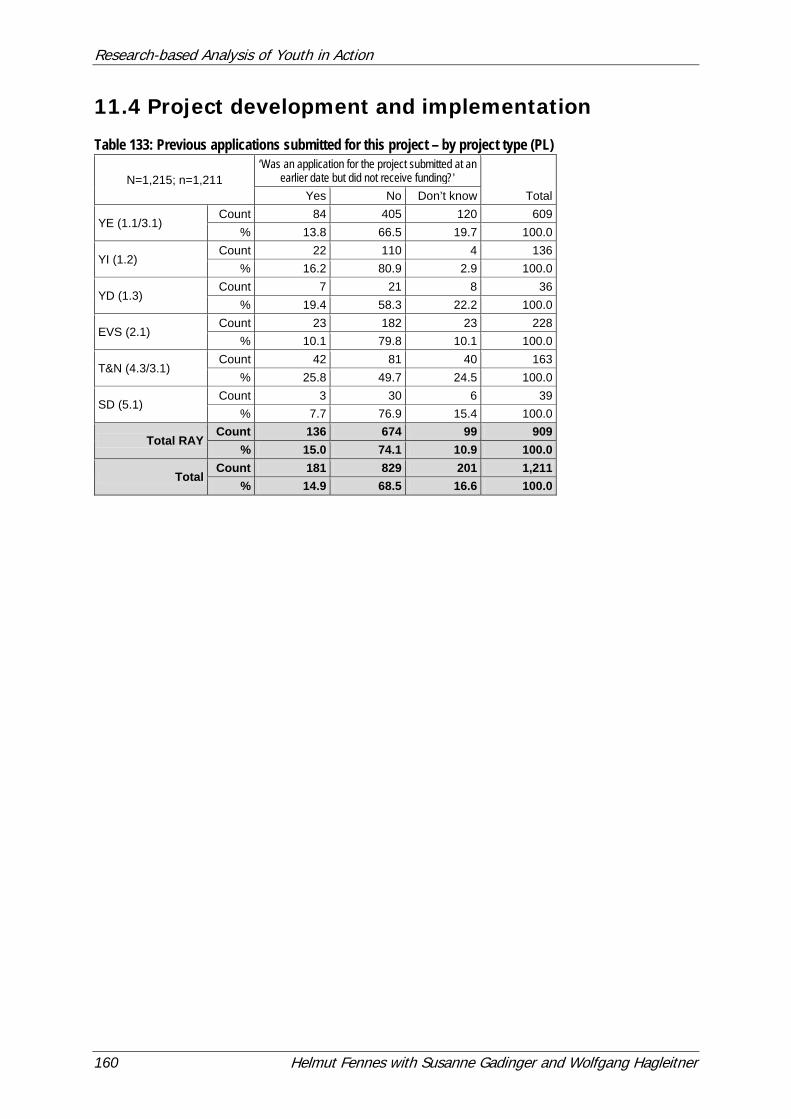
Research-based Analysis of Youth in Action
160 Helmut Fennes with Susanne Gadinger and Wolfgang Hagleitner
11.4 Project development and implementation Table 133: Previous applications submitted for this project – by project type (PL)
N=1,215; n=1,211 ‘Was an application for the project submitted at an
earlier date but did not receive funding?’ Total Yes No Don’t know
YE (1.1/3.1) Count 84 405 120 609
% 13.8 66.5 19.7 100.0
YI (1.2) Count 22 110 4 136
% 16.2 80.9 2.9 100.0
YD (1.3) Count 7 21 8 36
% 19.4 58.3 22.2 100.0
EVS (2.1) Count 23 182 23 228
% 10.1 79.8 10.1 100.0
T&N (4.3/3.1) Count 42 81 40 163
% 25.8 49.7 24.5 100.0
SD (5.1) Count 3 30 6 39
% 7.7 76.9 15.4 100.0
Total RAY Count 136 674 99 909
% 15.0 74.1 10.9 100.0
Total Count 181 829 201 1,211
% 14.9 68.5 16.6 100.0
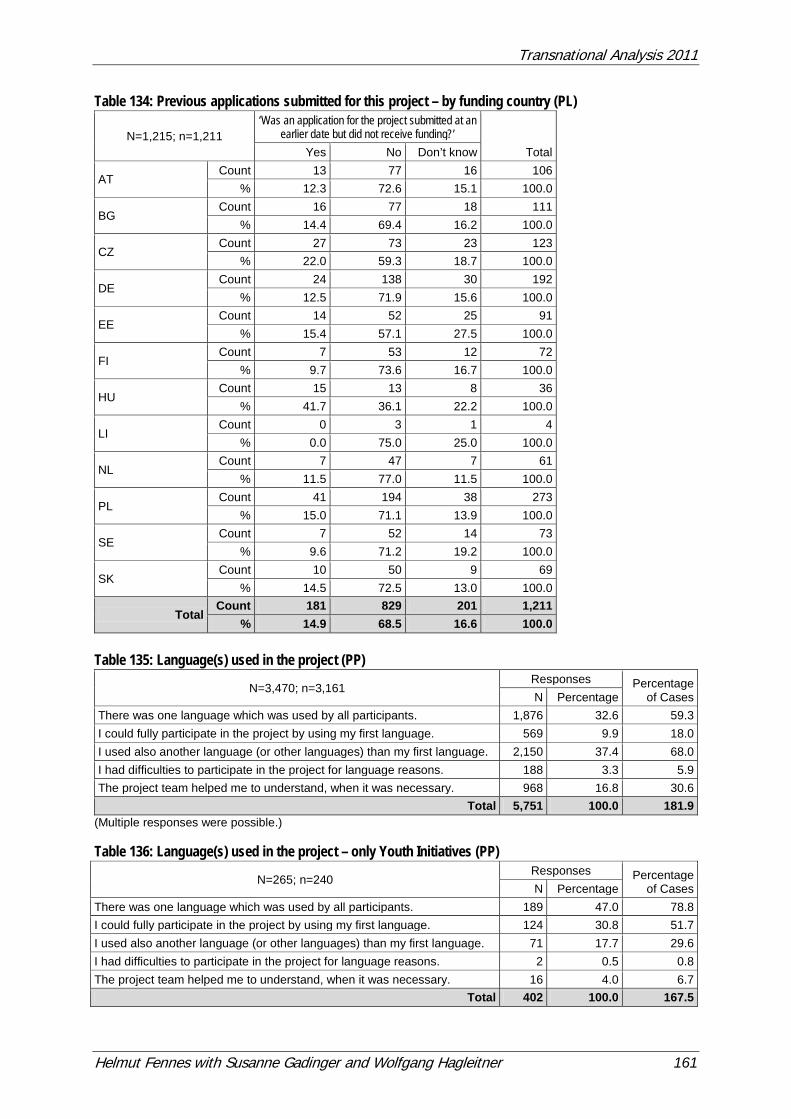
Transnational Analysis 2011
Helmut Fennes with Susanne Gadinger and Wolfgang Hagleitner 161
Table 134: Previous applications submitted for this project – by funding country (PL)
N=1,215; n=1,211 ‘Was an application for the project submitted at an
earlier date but did not receive funding?’ Total Yes No Don’t know
AT Count 13 77 16 106
% 12.3 72.6 15.1 100.0
BG Count 16 77 18 111
% 14.4 69.4 16.2 100.0
CZ Count 27 73 23 123
% 22.0 59.3 18.7 100.0
DE Count 24 138 30 192
% 12.5 71.9 15.6 100.0
EE Count 14 52 25 91
% 15.4 57.1 27.5 100.0
FI Count 7 53 12 72
% 9.7 73.6 16.7 100.0
HU Count 15 13 8 36
% 41.7 36.1 22.2 100.0
LI Count 0 3 1 4
% 0.0 75.0 25.0 100.0
NL Count 7 47 7 61
% 11.5 77.0 11.5 100.0
PL Count 41 194 38 273
% 15.0 71.1 13.9 100.0
SE Count 7 52 14 73
% 9.6 71.2 19.2 100.0
SK Count 10 50 9 69
% 14.5 72.5 13.0 100.0
Total Count 181 829 201 1,211
% 14.9 68.5 16.6 100.0 Table 135: Language(s) used in the project (PP)
N=3,470; n=3,161 Responses Percentage
of Cases N Percentage There was one language which was used by all participants. 1,876 32.6 59.3 I could fully participate in the project by using my first language. 569 9.9 18.0 I used also another language (or other languages) than my first language. 2,150 37.4 68.0 I had difficulties to participate in the project for language reasons. 188 3.3 5.9 The project team helped me to understand, when it was necessary. 968 16.8 30.6
Total 5,751 100.0 181.9 (Multiple responses were possible.) Table 136: Language(s) used in the project – only Youth Initiatives (PP)
N=265; n=240 Responses Percentage
of Cases N Percentage There was one language which was used by all participants. 189 47.0 78.8 I could fully participate in the project by using my first language. 124 30.8 51.7 I used also another language (or other languages) than my first language. 71 17.7 29.6 I had difficulties to participate in the project for language reasons. 2 0.5 0.8 The project team helped me to understand, when it was necessary. 16 4.0 6.7
Total 402 100.0 167.5
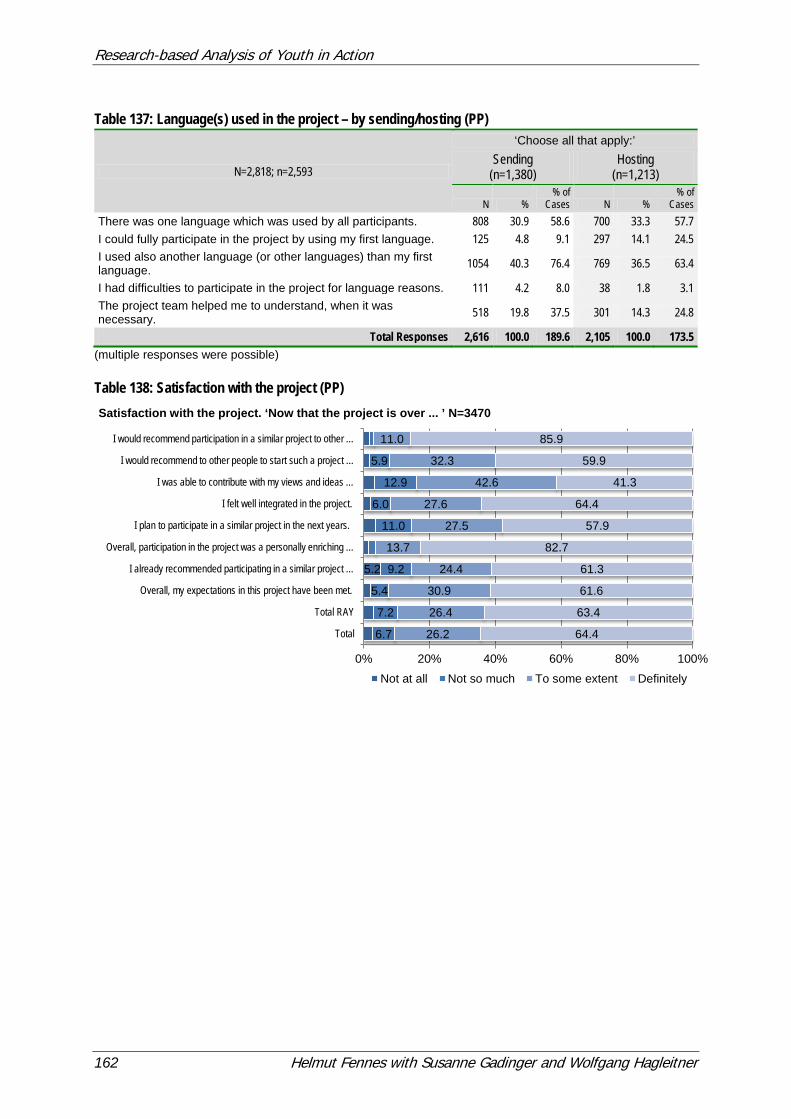
Research-based Analysis of Youth in Action
162 Helmut Fennes with Susanne Gadinger and Wolfgang Hagleitner
Table 137: Language(s) used in the project – by sending/hosting (PP)
N=2,818; n=2,593
‘Choose all that apply:’ Sending
(n=1,380) Hosting
(n=1,213)
N % % of
Cases N % % of
Cases There was one language which was used by all participants. 808 30.9 58.6 700 33.3 57.7 I could fully participate in the project by using my first language. 125 4.8 9.1 297 14.1 24.5 I used also another language (or other languages) than my first language. 1054 40.3 76.4 769 36.5 63.4
I had difficulties to participate in the project for language reasons. 111 4.2 8.0 38 1.8 3.1 The project team helped me to understand, when it was necessary. 518 19.8 37.5 301 14.3 24.8
Total Responses 2,616 100.0 189.6 2,105 100.0 173.5 (multiple responses were possible) Table 138: Satisfaction with the project (PP)
5.2
6.7
7.2
5.4
9.2
11.0
6.0
12.9
5.9
26.2
26.4
30.9
24.4
13.7
27.5
27.6
42.6
32.3
11.0
64.4
63.4
61.6
61.3
82.7
57.9
64.4
41.3
59.9
85.9
0% 20% 40% 60% 80% 100%
Total
Total RAY
Overall, my expectations in this project have been met.
I already recommended participating in a similar project …
Overall, participation in the project was a personally enriching …
I plan to participate in a similar project in the next years.
I felt well integrated in the project.
I was able to contribute with my views and ideas …
I would recommend to other people to start such a project …
I would recommend participation in a similar project to other …
Satisfaction with the project. ‘Now that the project is over ... ’ N=3470
Not at all Not so much To some extent Definitely
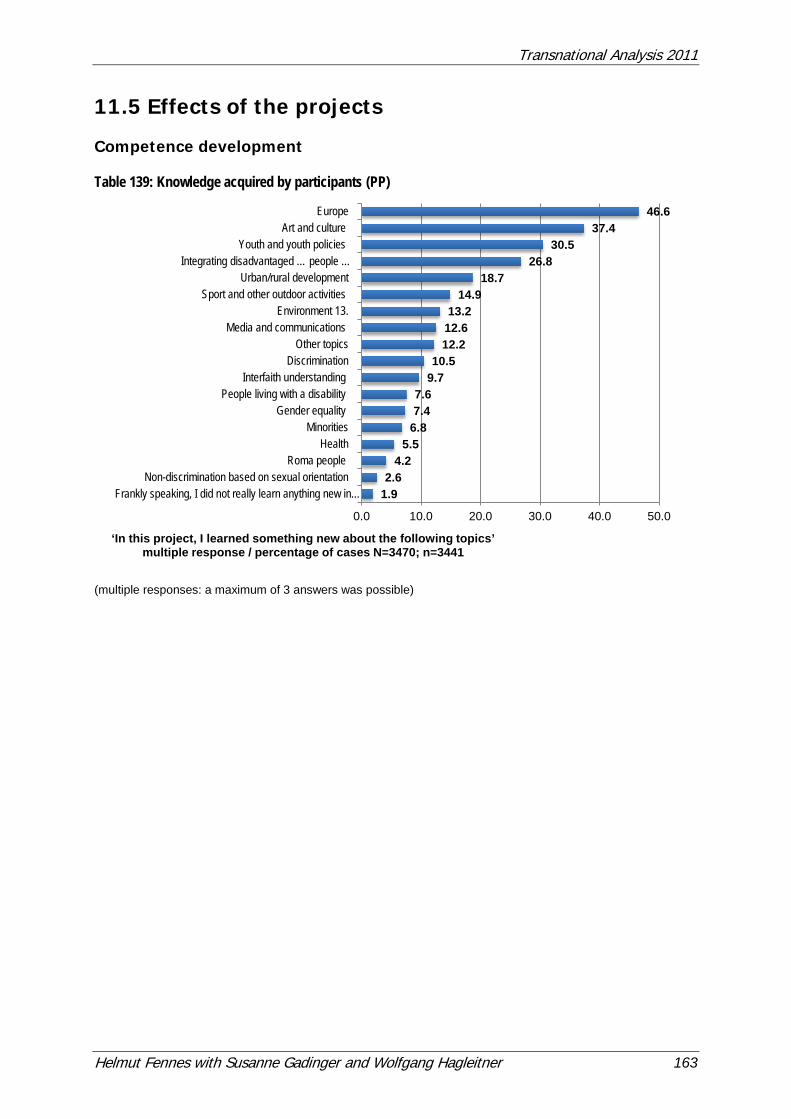
Transnational Analysis 2011
Helmut Fennes with Susanne Gadinger and Wolfgang Hagleitner 163
11.5 Effects of the projects Competence development Table 139: Knowledge acquired by participants (PP)
(multiple responses: a maximum of 3 answers was possible)
1.9 2.6
4.2 5.5
6.8 7.4 7.6
9.7 10.5
12.2 12.6 13.2
14.9 18.7
26.8 30.5
37.4 46.6
0.0 10.0 20.0 30.0 40.0 50.0
Frankly speaking, I did not really learn anything new in…Non-discrimination based on sexual orientation
Roma peopleHealth
MinoritiesGender equality
People living with a disabilityInterfaith understanding
DiscriminationOther topics
Media and communicationsEnvironment 13.
Sport and other outdoor activitiesUrban/rural development
Integrating disadvantaged … people … Youth and youth policies
Art and cultureEurope
‘In this project, I learned something new about the following topics’ multiple response / percentage of cases N=3470; n=3441
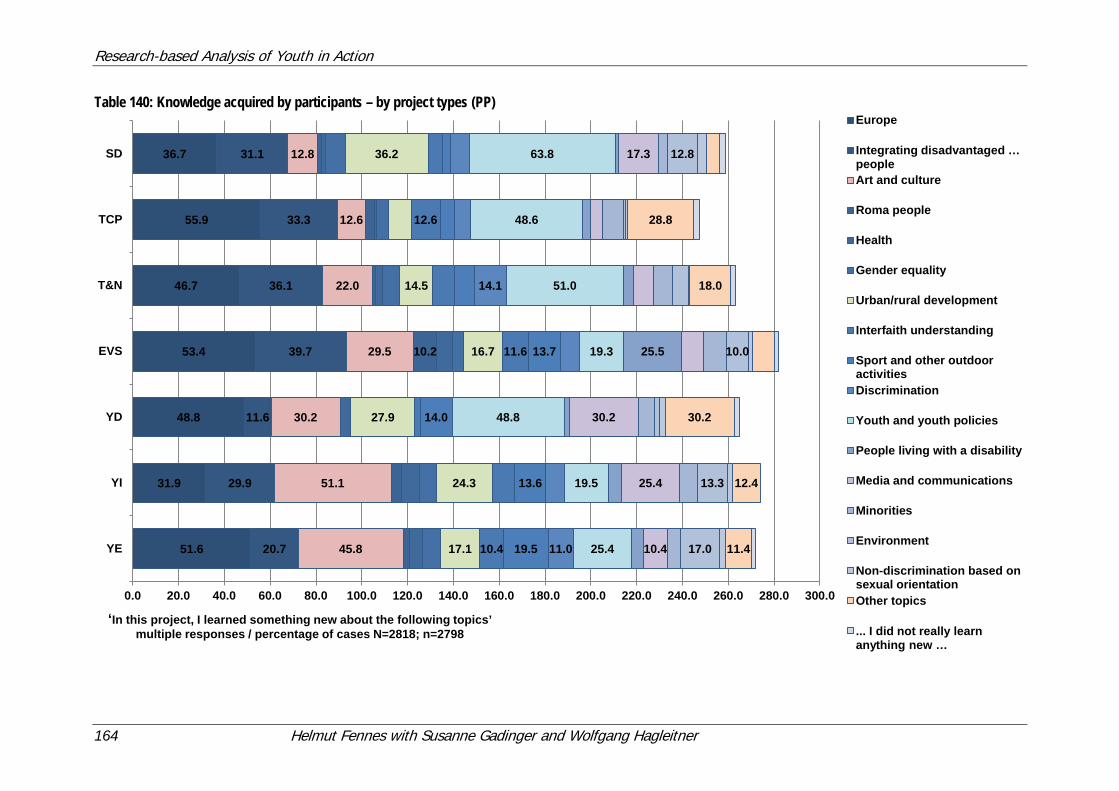
Research-based Analysis of Youth in Action
164 Helmut Fennes with Susanne Gadinger and Wolfgang Hagleitner
Table 140: Knowledge acquired by participants – by project types (PP)
51.6
31.9
48.8
53.4
46.7
55.9
36.7
20.7
29.9
11.6
39.7
36.1
33.3
31.1
45.8
51.1
30.2
29.5
22.0
12.6
12.8
10.2
17.1
24.3
27.9
16.7
14.5
36.2
10.4
11.6
12.6
19.5
13.6
14.0
13.7
11.0
14.1
25.4
19.5
48.8
19.3
51.0
48.6
63.8
25.5
10.4
25.4
30.2
17.3
17.0
13.3
10.0
12.8
11.4
12.4
30.2
18.0
28.8
0.0 20.0 40.0 60.0 80.0 100.0 120.0 140.0 160.0 180.0 200.0 220.0 240.0 260.0 280.0 300.0
YE
YI
YD
EVS
T&N
TCP
SD
‘In this project, I learned something new about the following topics’ multiple responses / percentage of cases N=2818; n=2798
Europe
Integrating disadvantaged … people Art and culture
Roma people
Health
Gender equality
Urban/rural development
Interfaith understanding
Sport and other outdooractivitiesDiscrimination
Youth and youth policies
People living with a disability
Media and communications
Minorities
Environment
Non-discrimination based onsexual orientationOther topics
... I did not really learn anything new …
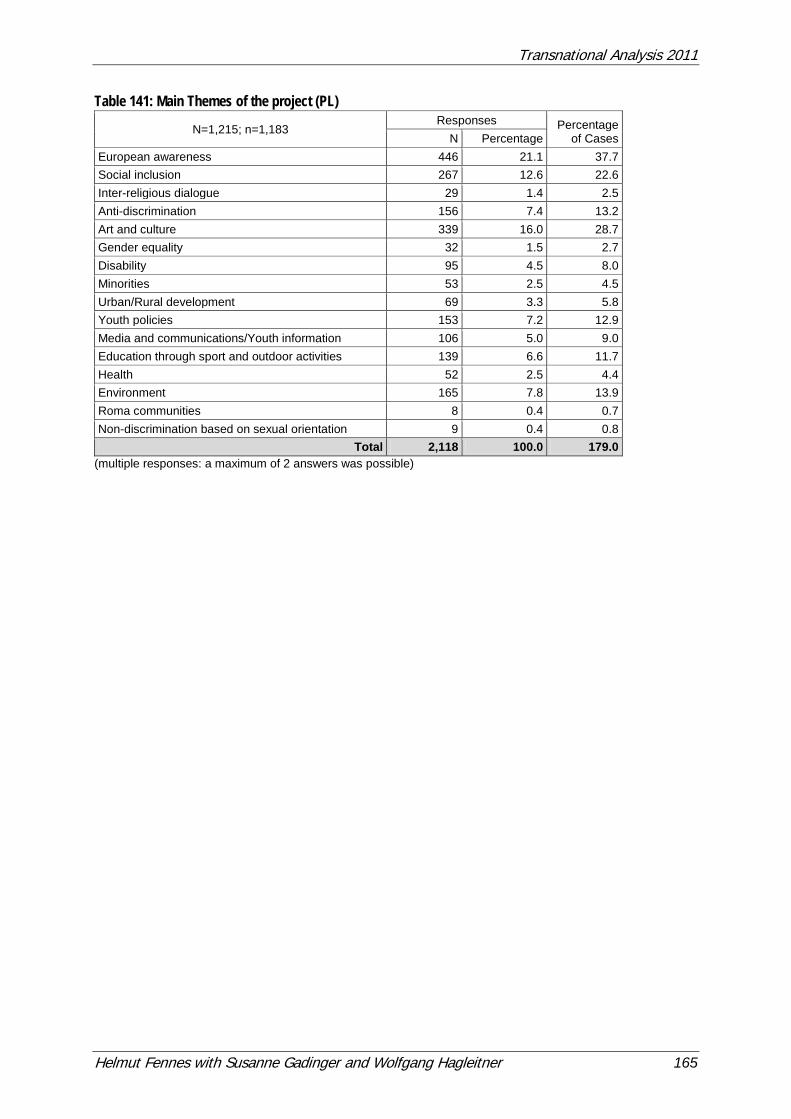
Transnational Analysis 2011
Helmut Fennes with Susanne Gadinger and Wolfgang Hagleitner 165
Table 141: Main Themes of the project (PL)
N=1,215; n=1,183 Responses Percentage
of Cases N Percentage European awareness 446 21.1 37.7 Social inclusion 267 12.6 22.6 Inter-religious dialogue 29 1.4 2.5 Anti-discrimination 156 7.4 13.2 Art and culture 339 16.0 28.7 Gender equality 32 1.5 2.7 Disability 95 4.5 8.0 Minorities 53 2.5 4.5 Urban/Rural development 69 3.3 5.8 Youth policies 153 7.2 12.9 Media and communications/Youth information 106 5.0 9.0 Education through sport and outdoor activities 139 6.6 11.7 Health 52 2.5 4.4 Environment 165 7.8 13.9 Roma communities 8 0.4 0.7 Non-discrimination based on sexual orientation 9 0.4 0.8
Total 2,118 100.0 179.0 (multiple responses: a maximum of 2 answers was possible)
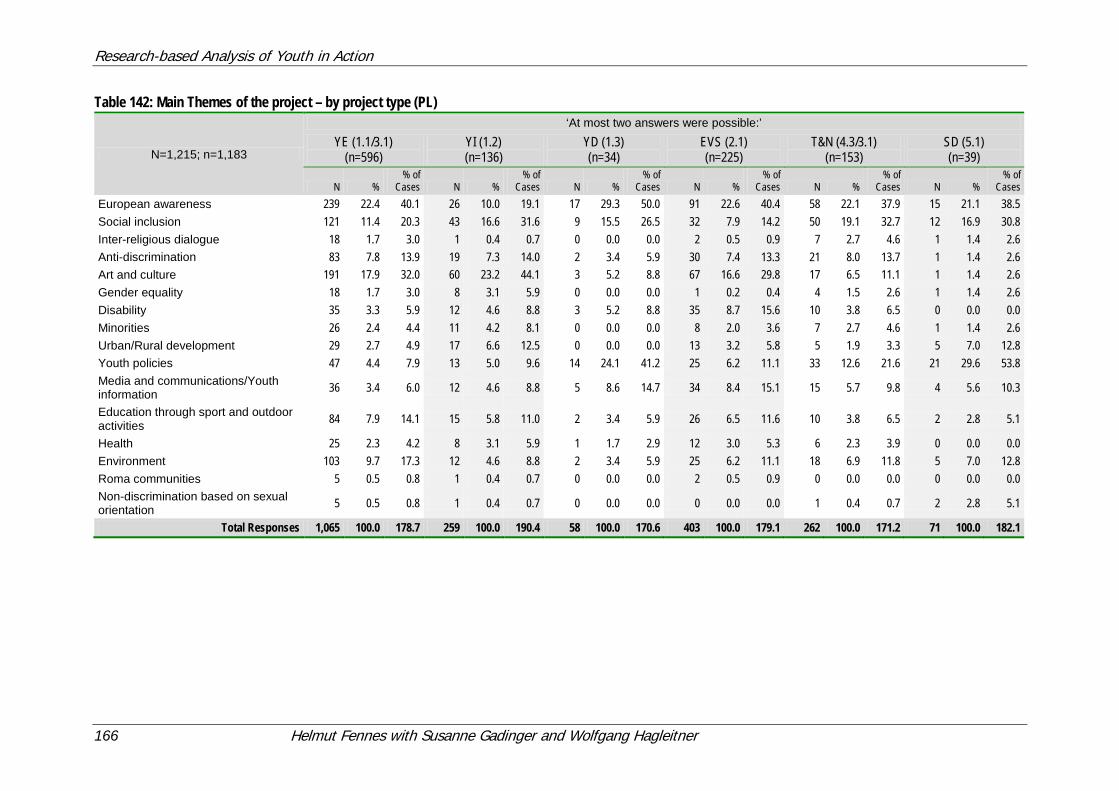
Research-based Analysis of Youth in Action
166 Helmut Fennes with Susanne Gadinger and Wolfgang Hagleitner
Table 142: Main Themes of the project – by project type (PL)
N=1,215; n=1,183
‘At most two answers were possible:’ YE (1.1/3.1)
(n=596) YI (1.2) (n=136)
YD (1.3) (n=34)
EVS (2.1) (n=225)
T&N (4.3/3.1) (n=153)
SD (5.1) (n=39)
N % % of
Cases N % % of
Cases N % % of
Cases N % % of
Cases N % % of
Cases N % % of
Cases European awareness 239 22.4 40.1 26 10.0 19.1 17 29.3 50.0 91 22.6 40.4 58 22.1 37.9 15 21.1 38.5 Social inclusion 121 11.4 20.3 43 16.6 31.6 9 15.5 26.5 32 7.9 14.2 50 19.1 32.7 12 16.9 30.8 Inter-religious dialogue 18 1.7 3.0 1 0.4 0.7 0 0.0 0.0 2 0.5 0.9 7 2.7 4.6 1 1.4 2.6 Anti-discrimination 83 7.8 13.9 19 7.3 14.0 2 3.4 5.9 30 7.4 13.3 21 8.0 13.7 1 1.4 2.6 Art and culture 191 17.9 32.0 60 23.2 44.1 3 5.2 8.8 67 16.6 29.8 17 6.5 11.1 1 1.4 2.6 Gender equality 18 1.7 3.0 8 3.1 5.9 0 0.0 0.0 1 0.2 0.4 4 1.5 2.6 1 1.4 2.6 Disability 35 3.3 5.9 12 4.6 8.8 3 5.2 8.8 35 8.7 15.6 10 3.8 6.5 0 0.0 0.0 Minorities 26 2.4 4.4 11 4.2 8.1 0 0.0 0.0 8 2.0 3.6 7 2.7 4.6 1 1.4 2.6 Urban/Rural development 29 2.7 4.9 17 6.6 12.5 0 0.0 0.0 13 3.2 5.8 5 1.9 3.3 5 7.0 12.8 Youth policies 47 4.4 7.9 13 5.0 9.6 14 24.1 41.2 25 6.2 11.1 33 12.6 21.6 21 29.6 53.8 Media and communications/Youth information 36 3.4 6.0 12 4.6 8.8 5 8.6 14.7 34 8.4 15.1 15 5.7 9.8 4 5.6 10.3
Education through sport and outdoor activities 84 7.9 14.1 15 5.8 11.0 2 3.4 5.9 26 6.5 11.6 10 3.8 6.5 2 2.8 5.1
Health 25 2.3 4.2 8 3.1 5.9 1 1.7 2.9 12 3.0 5.3 6 2.3 3.9 0 0.0 0.0 Environment 103 9.7 17.3 12 4.6 8.8 2 3.4 5.9 25 6.2 11.1 18 6.9 11.8 5 7.0 12.8 Roma communities 5 0.5 0.8 1 0.4 0.7 0 0.0 0.0 2 0.5 0.9 0 0.0 0.0 0 0.0 0.0 Non-discrimination based on sexual orientation 5 0.5 0.8 1 0.4 0.7 0 0.0 0.0 0 0.0 0.0 1 0.4 0.7 2 2.8 5.1
Total Responses 1,065 100.0 178.7 259 100.0 190.4 58 100.0 170.6 403 100.0 179.1 262 100.0 171.2 71 100.0 182.1
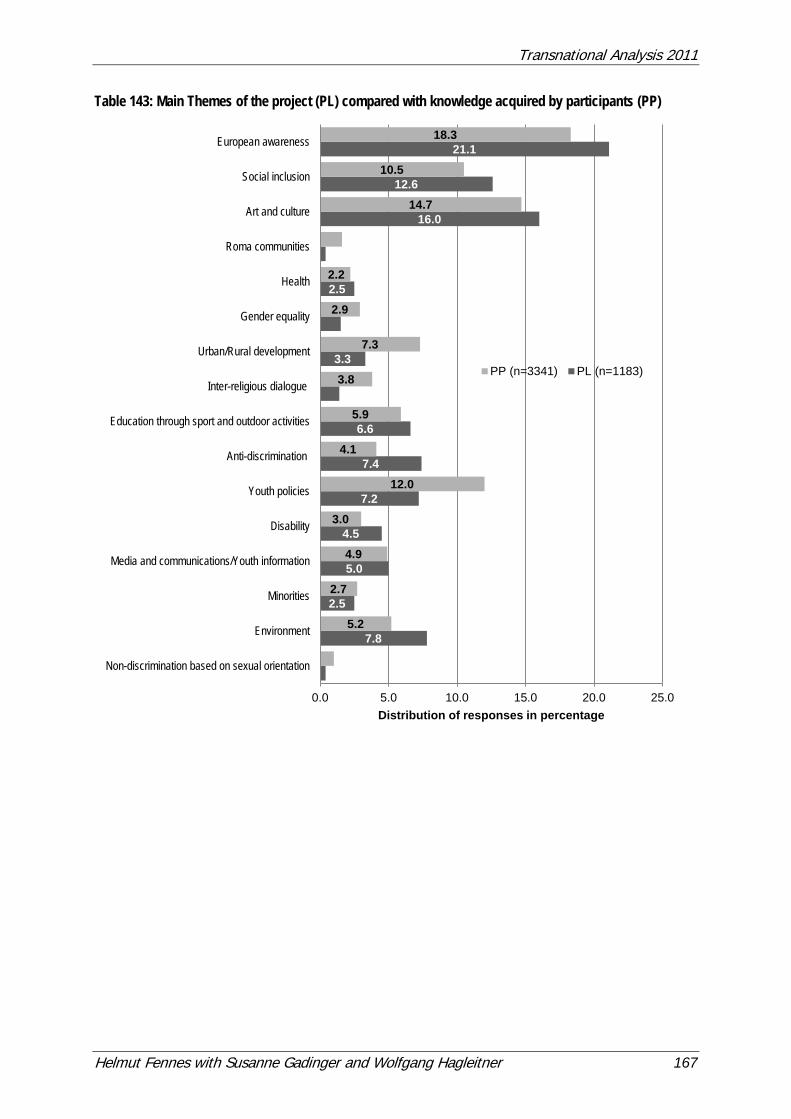
Transnational Analysis 2011
Helmut Fennes with Susanne Gadinger and Wolfgang Hagleitner 167
Table 143: Main Themes of the project (PL) compared with knowledge acquired by participants (PP)
0.4
7.8
2.5
5.0
4.5
7.2
7.4
6.6
3.3
2.5
0.4
16.0
12.6
21.1
5.2
2.7
4.9
3.0
12.0
4.1
5.9
3.8
7.3
2.9
2.2
14.7
10.5
18.3
0.0 5.0 10.0 15.0 20.0 25.0
Non-discrimination based on sexual orientation
Environment
Minorities
Media and communications/Youth information
Disability
Youth policies
Anti-discrimination
Education through sport and outdoor activities
Inter-religious dialogue
Urban/Rural development
Gender equality
Health
Roma communities
Art and culture
Social inclusion
European awareness
Distribution of responses in percentage
PP (n=3341) PL (n=1183)
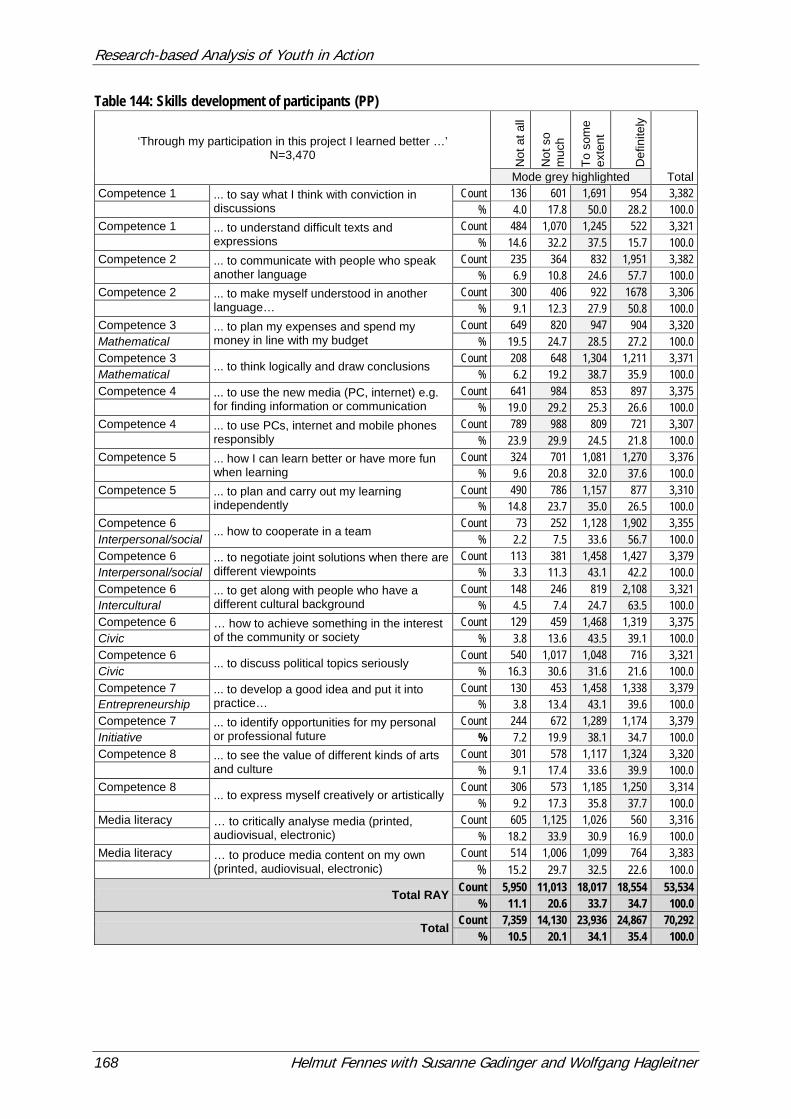
Research-based Analysis of Youth in Action
168 Helmut Fennes with Susanne Gadinger and Wolfgang Hagleitner
Table 144: Skills development of participants (PP)
‘Through my participation in this project I learned better …’ N=3,470
Not
at a
ll
Not
so
muc
h
To s
ome
exte
nt
Def
inite
ly
Total Mode grey highlighted Competence 1 ... to say what I think with conviction in
discussions Count 136 601 1,691 954 3,382
% 4.0 17.8 50.0 28.2 100.0 Competence 1 ... to understand difficult texts and
expressions Count 484 1,070 1,245 522 3,321
% 14.6 32.2 37.5 15.7 100.0 Competence 2 ... to communicate with people who speak
another language Count 235 364 832 1,951 3,382
% 6.9 10.8 24.6 57.7 100.0 Competence 2 ... to make myself understood in another
language… Count 300 406 922 1678 3,306
% 9.1 12.3 27.9 50.8 100.0 Competence 3 ... to plan my expenses and spend my
money in line with my budget Count 649 820 947 904 3,320
Mathematical % 19.5 24.7 28.5 27.2 100.0 Competence 3
... to think logically and draw conclusions Count 208 648 1,304 1,211 3,371
Mathematical % 6.2 19.2 38.7 35.9 100.0 Competence 4 ... to use the new media (PC, internet) e.g.
for finding information or communication Count 641 984 853 897 3,375
% 19.0 29.2 25.3 26.6 100.0 Competence 4 ... to use PCs, internet and mobile phones
responsibly Count 789 988 809 721 3,307
% 23.9 29.9 24.5 21.8 100.0 Competence 5 ... how I can learn better or have more fun
when learning Count 324 701 1,081 1,270 3,376
% 9.6 20.8 32.0 37.6 100.0 Competence 5 ... to plan and carry out my learning
independently Count 490 786 1,157 877 3,310
% 14.8 23.7 35.0 26.5 100.0 Competence 6
... how to cooperate in a team Count 73 252 1,128 1,902 3,355
Interpersonal/social % 2.2 7.5 33.6 56.7 100.0 Competence 6 ... to negotiate joint solutions when there are
different viewpoints Count 113 381 1,458 1,427 3,379
Interpersonal/social % 3.3 11.3 43.1 42.2 100.0 Competence 6 ... to get along with people who have a
different cultural background Count 148 246 819 2,108 3,321
Intercultural % 4.5 7.4 24.7 63.5 100.0 Competence 6 … how to achieve something in the interest
of the community or society Count 129 459 1,468 1,319 3,375
Civic % 3.8 13.6 43.5 39.1 100.0 Competence 6
... to discuss political topics seriously Count 540 1,017 1,048 716 3,321
Civic % 16.3 30.6 31.6 21.6 100.0 Competence 7 ... to develop a good idea and put it into
practice… Count 130 453 1,458 1,338 3,379
Entrepreneurship % 3.8 13.4 43.1 39.6 100.0 Competence 7 ... to identify opportunities for my personal
or professional future Count 244 672 1,289 1,174 3,379
Initiative % 7.2 19.9 38.1 34.7 100.0 Competence 8 ... to see the value of different kinds of arts
and culture Count 301 578 1,117 1,324 3,320
% 9.1 17.4 33.6 39.9 100.0 Competence 8
... to express myself creatively or artistically Count 306 573 1,185 1,250 3,314
% 9.2 17.3 35.8 37.7 100.0 Media literacy … to critically analyse media (printed,
audiovisual, electronic) Count 605 1,125 1,026 560 3,316
% 18.2 33.9 30.9 16.9 100.0 Media literacy … to produce media content on my own
(printed, audiovisual, electronic) Count 514 1,006 1,099 764 3,383
% 15.2 29.7 32.5 22.6 100.0
Total RAY Count 5,950 11,013 18,017 18,554 53,534 % 11.1 20.6 33.7 34.7 100.0
Total Count 7,359 14,130 23,936 24,867 70,292 % 10.5 20.1 34.1 35.4 100.0
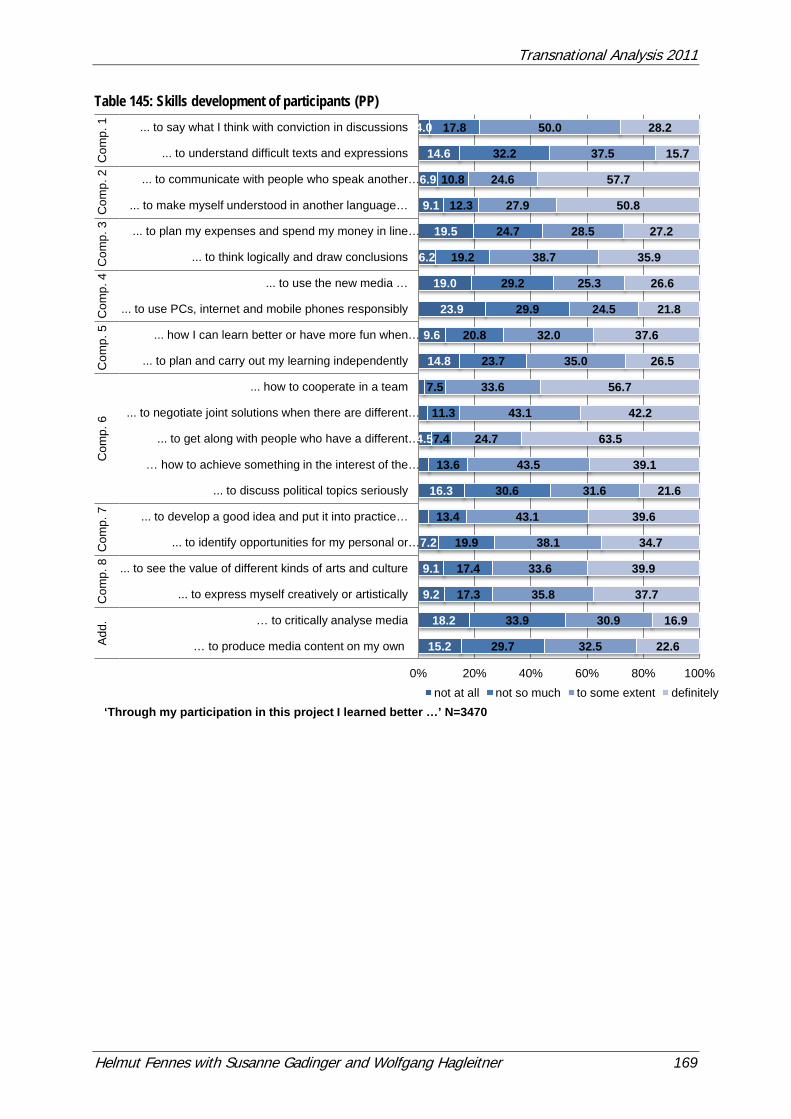
Transnational Analysis 2011
Helmut Fennes with Susanne Gadinger and Wolfgang Hagleitner 169
Table 145: Skills development of participants (PP)
15.2
18.2
9.2
9.1
7.2
16.3
4.5
14.8
9.6
23.9
19.0
6.2
19.5
9.1
6.9
14.6
4.0
29.7
33.9
17.3
17.4
19.9
13.4
30.6
13.6
7.4
11.3
7.5
23.7
20.8
29.9
29.2
19.2
24.7
12.3
10.8
32.2
17.8
32.5
30.9
35.8
33.6
38.1
43.1
31.6
43.5
24.7
43.1
33.6
35.0
32.0
24.5
25.3
38.7
28.5
27.9
24.6
37.5
50.0
22.6
16.9
37.7
39.9
34.7
39.6
21.6
39.1
63.5
42.2
56.7
26.5
37.6
21.8
26.6
35.9
27.2
50.8
57.7
15.7
28.2
0% 20% 40% 60% 80% 100%
… to produce media content on my own
… to critically analyse media
... to express myself creatively or artistically
... to see the value of different kinds of arts and culture
... to identify opportunities for my personal or…
... to develop a good idea and put it into practice…
... to discuss political topics seriously
… how to achieve something in the interest of the …
... to get along with people who have a different…
... to negotiate joint solutions when there are different…
... how to cooperate in a team
... to plan and carry out my learning independently
... how I can learn better or have more fun when…
... to use PCs, internet and mobile phones responsibly
... to use the new media …
... to think logically and draw conclusions
... to plan my expenses and spend my money in line…
... to make myself understood in another language…
... to communicate with people who speak another…
... to understand difficult texts and expressions
... to say what I think with conviction in discussions
Add
.C
omp.
8C
omp.
7C
omp.
6C
omp.
5C
omp.
4C
omp.
3C
omp.
2C
omp.
1
‘Through my participation in this project I learned better …’ N=3470 not at all not so much to some extent definitely
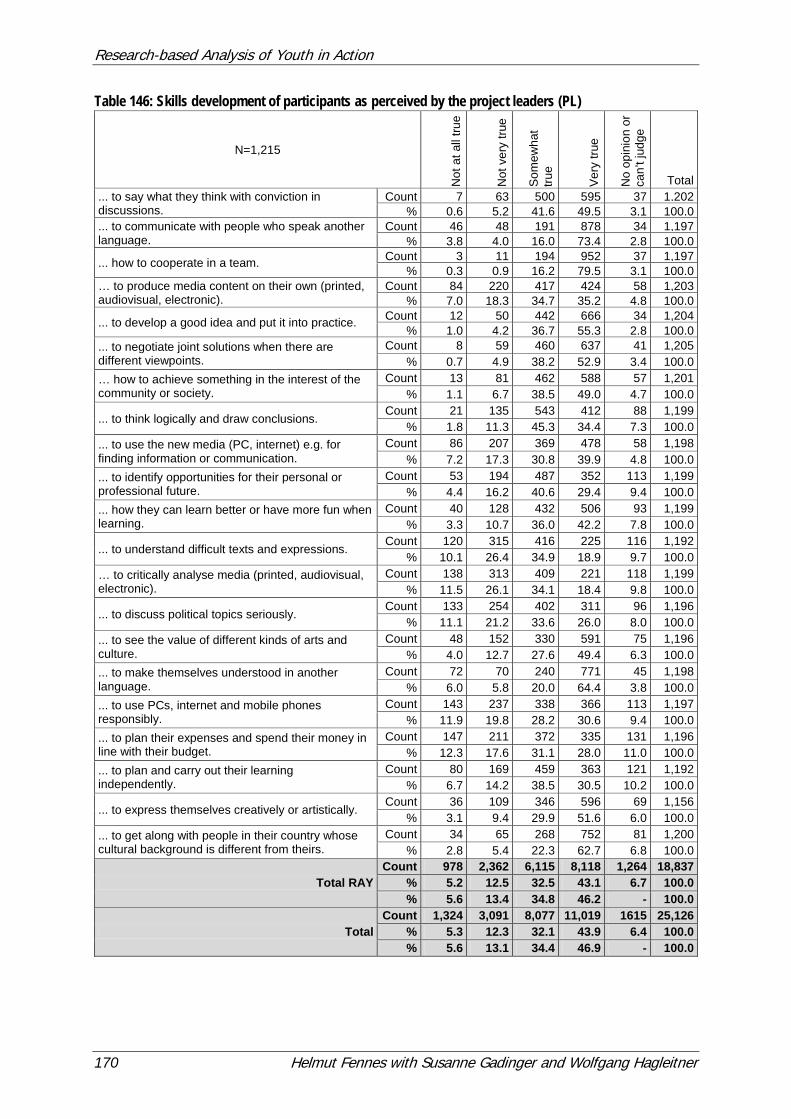
Research-based Analysis of Youth in Action
170 Helmut Fennes with Susanne Gadinger and Wolfgang Hagleitner
Table 146: Skills development of participants as perceived by the project leaders (PL)
N=1,215
Not
at a
ll tru
e
Not
ver
y tru
e
Som
ewha
t tru
e
Ver
y tru
e
No
opin
ion
or
can’
t jud
ge
Total ... to say what they think with conviction in discussions.
Count 7 63 500 595 37 1,202 % 0.6 5.2 41.6 49.5 3.1 100.0
... to communicate with people who speak another language.
Count 46 48 191 878 34 1,197 % 3.8 4.0 16.0 73.4 2.8 100.0
... how to cooperate in a team. Count 3 11 194 952 37 1,197 % 0.3 0.9 16.2 79.5 3.1 100.0
… to produce media content on their own (printed, audiovisual, electronic).
Count 84 220 417 424 58 1,203 % 7.0 18.3 34.7 35.2 4.8 100.0
... to develop a good idea and put it into practice. Count 12 50 442 666 34 1,204 % 1.0 4.2 36.7 55.3 2.8 100.0
... to negotiate joint solutions when there are different viewpoints.
Count 8 59 460 637 41 1,205 % 0.7 4.9 38.2 52.9 3.4 100.0
… how to achieve something in the interest of the community or society.
Count 13 81 462 588 57 1,201 % 1.1 6.7 38.5 49.0 4.7 100.0
... to think logically and draw conclusions. Count 21 135 543 412 88 1,199
% 1.8 11.3 45.3 34.4 7.3 100.0 ... to use the new media (PC, internet) e.g. for finding information or communication.
Count 86 207 369 478 58 1,198 % 7.2 17.3 30.8 39.9 4.8 100.0
... to identify opportunities for their personal or professional future.
Count 53 194 487 352 113 1,199 % 4.4 16.2 40.6 29.4 9.4 100.0
... how they can learn better or have more fun when learning.
Count 40 128 432 506 93 1,199 % 3.3 10.7 36.0 42.2 7.8 100.0
... to understand difficult texts and expressions. Count 120 315 416 225 116 1,192
% 10.1 26.4 34.9 18.9 9.7 100.0 … to critically analyse media (printed, audiovisual, electronic).
Count 138 313 409 221 118 1,199 % 11.5 26.1 34.1 18.4 9.8 100.0
... to discuss political topics seriously. Count 133 254 402 311 96 1,196
% 11.1 21.2 33.6 26.0 8.0 100.0 ... to see the value of different kinds of arts and culture.
Count 48 152 330 591 75 1,196 % 4.0 12.7 27.6 49.4 6.3 100.0
... to make themselves understood in another language.
Count 72 70 240 771 45 1,198 % 6.0 5.8 20.0 64.4 3.8 100.0
... to use PCs, internet and mobile phones responsibly.
Count 143 237 338 366 113 1,197 % 11.9 19.8 28.2 30.6 9.4 100.0
... to plan their expenses and spend their money in line with their budget.
Count 147 211 372 335 131 1,196 % 12.3 17.6 31.1 28.0 11.0 100.0
... to plan and carry out their learning independently.
Count 80 169 459 363 121 1,192 % 6.7 14.2 38.5 30.5 10.2 100.0
... to express themselves creatively or artistically. Count 36 109 346 596 69 1,156
% 3.1 9.4 29.9 51.6 6.0 100.0 ... to get along with people in their country whose cultural background is different from theirs.
Count 34 65 268 752 81 1,200 % 2.8 5.4 22.3 62.7 6.8 100.0
Total RAY Count 978 2,362 6,115 8,118 1,264 18,837
% 5.2 12.5 32.5 43.1 6.7 100.0 % 5.6 13.4 34.8 46.2 - 100.0
Total Count 1,324 3,091 8,077 11,019 1615 25,126
% 5.3 12.3 32.1 43.9 6.4 100.0 % 5.6 13.1 34.4 46.9 - 100.0
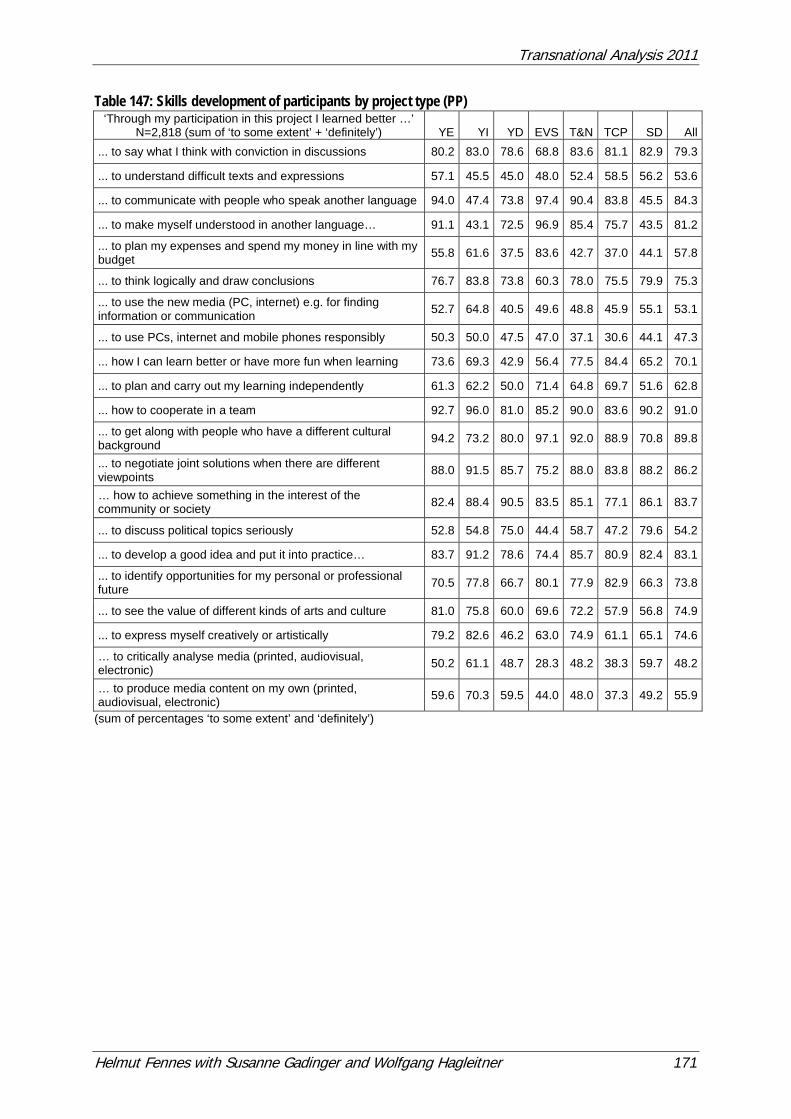
Transnational Analysis 2011
Helmut Fennes with Susanne Gadinger and Wolfgang Hagleitner 171
Table 147: Skills development of participants by project type (PP) ‘Through my participation in this project I learned better …’
N=2,818 (sum of ‘to some extent’ + ‘definitely’) YE YI YD EVS T&N TCP SD All ... to say what I think with conviction in discussions 80.2 83.0 78.6 68.8 83.6 81.1 82.9 79.3
... to understand difficult texts and expressions 57.1 45.5 45.0 48.0 52.4 58.5 56.2 53.6
... to communicate with people who speak another language 94.0 47.4 73.8 97.4 90.4 83.8 45.5 84.3
... to make myself understood in another language… 91.1 43.1 72.5 96.9 85.4 75.7 43.5 81.2
... to plan my expenses and spend my money in line with my budget 55.8 61.6 37.5 83.6 42.7 37.0 44.1 57.8
... to think logically and draw conclusions 76.7 83.8 73.8 60.3 78.0 75.5 79.9 75.3
... to use the new media (PC, internet) e.g. for finding information or communication 52.7 64.8 40.5 49.6 48.8 45.9 55.1 53.1
... to use PCs, internet and mobile phones responsibly 50.3 50.0 47.5 47.0 37.1 30.6 44.1 47.3
... how I can learn better or have more fun when learning 73.6 69.3 42.9 56.4 77.5 84.4 65.2 70.1
... to plan and carry out my learning independently 61.3 62.2 50.0 71.4 64.8 69.7 51.6 62.8
... how to cooperate in a team 92.7 96.0 81.0 85.2 90.0 83.6 90.2 91.0
... to get along with people who have a different cultural background 94.2 73.2 80.0 97.1 92.0 88.9 70.8 89.8
... to negotiate joint solutions when there are different viewpoints 88.0 91.5 85.7 75.2 88.0 83.8 88.2 86.2
… how to achieve something in the interest of the community or society 82.4 88.4 90.5 83.5 85.1 77.1 86.1 83.7
... to discuss political topics seriously 52.8 54.8 75.0 44.4 58.7 47.2 79.6 54.2
... to develop a good idea and put it into practice… 83.7 91.2 78.6 74.4 85.7 80.9 82.4 83.1
... to identify opportunities for my personal or professional future 70.5 77.8 66.7 80.1 77.9 82.9 66.3 73.8
... to see the value of different kinds of arts and culture 81.0 75.8 60.0 69.6 72.2 57.9 56.8 74.9
... to express myself creatively or artistically 79.2 82.6 46.2 63.0 74.9 61.1 65.1 74.6
… to critically analyse media (printed, audiovisual, electronic) 50.2 61.1 48.7 28.3 48.2 38.3 59.7 48.2
… to produce media content on my own (printed, audiovisual, electronic) 59.6 70.3 59.5 44.0 48.0 37.3 49.2 55.9
(sum of percentages ‘to some extent’ and ‘definitely’)
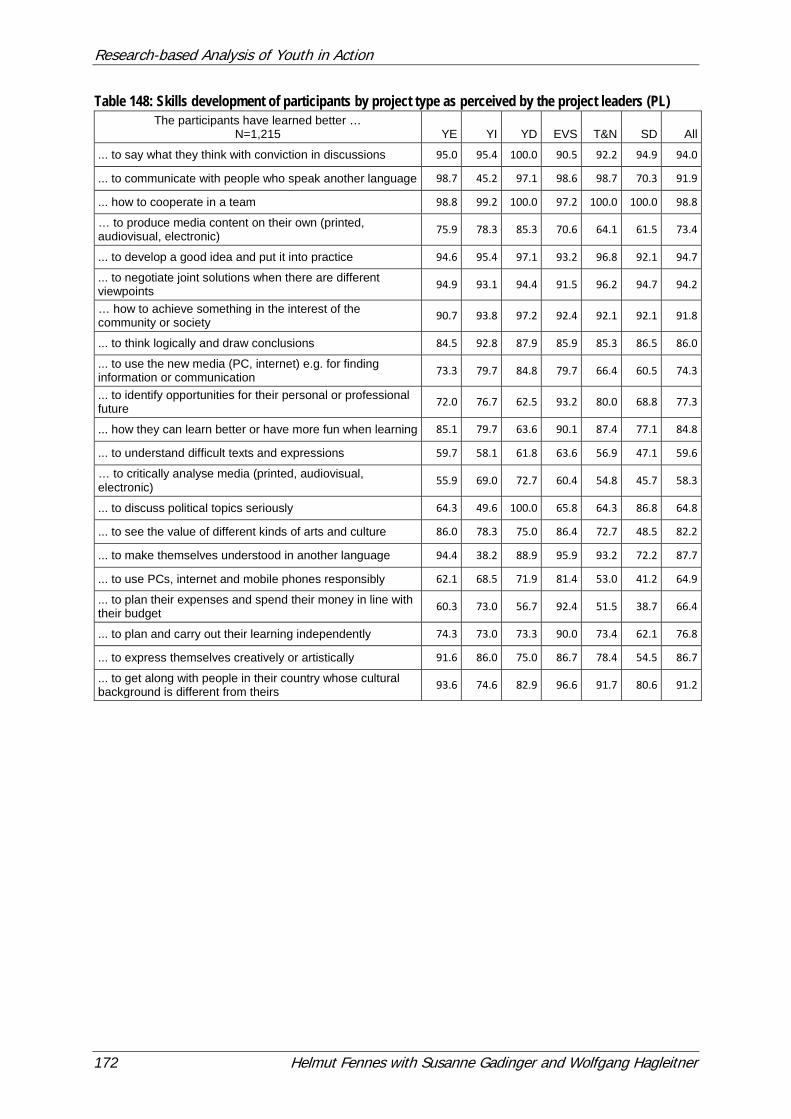
Research-based Analysis of Youth in Action
172 Helmut Fennes with Susanne Gadinger and Wolfgang Hagleitner
Table 148: Skills development of participants by project type as perceived by the project leaders (PL) The participants have learned better …
N=1,215 YE YI YD EVS T&N SD All
... to say what they think with conviction in discussions 95.0 95.4 100.0 90.5 92.2 94.9 94.0
... to communicate with people who speak another language 98.7 45.2 97.1 98.6 98.7 70.3 91.9
... how to cooperate in a team 98.8 99.2 100.0 97.2 100.0 100.0 98.8
… to produce media content on their own (printed, audiovisual, electronic) 75.9 78.3 85.3 70.6 64.1 61.5 73.4
... to develop a good idea and put it into practice 94.6 95.4 97.1 93.2 96.8 92.1 94.7
... to negotiate joint solutions when there are different viewpoints 94.9 93.1 94.4 91.5 96.2 94.7 94.2
… how to achieve something in the interest of the community or society 90.7 93.8 97.2 92.4 92.1 92.1 91.8
... to think logically and draw conclusions 84.5 92.8 87.9 85.9 85.3 86.5 86.0
... to use the new media (PC, internet) e.g. for finding information or communication 73.3 79.7 84.8 79.7 66.4 60.5 74.3
... to identify opportunities for their personal or professional future 72.0 76.7 62.5 93.2 80.0 68.8 77.3
... how they can learn better or have more fun when learning 85.1 79.7 63.6 90.1 87.4 77.1 84.8
... to understand difficult texts and expressions 59.7 58.1 61.8 63.6 56.9 47.1 59.6
… to critically analyse media (printed, audiovisual, electronic) 55.9 69.0 72.7 60.4 54.8 45.7 58.3
... to discuss political topics seriously 64.3 49.6 100.0 65.8 64.3 86.8 64.8
... to see the value of different kinds of arts and culture 86.0 78.3 75.0 86.4 72.7 48.5 82.2
... to make themselves understood in another language 94.4 38.2 88.9 95.9 93.2 72.2 87.7
... to use PCs, internet and mobile phones responsibly 62.1 68.5 71.9 81.4 53.0 41.2 64.9
... to plan their expenses and spend their money in line with their budget 60.3 73.0 56.7 92.4 51.5 38.7 66.4
... to plan and carry out their learning independently 74.3 73.0 73.3 90.0 73.4 62.1 76.8
... to express themselves creatively or artistically 91.6 86.0 75.0 86.7 78.4 54.5 86.7
... to get along with people in their country whose cultural background is different from theirs 93.6 74.6 82.9 96.6 91.7 80.6 91.2
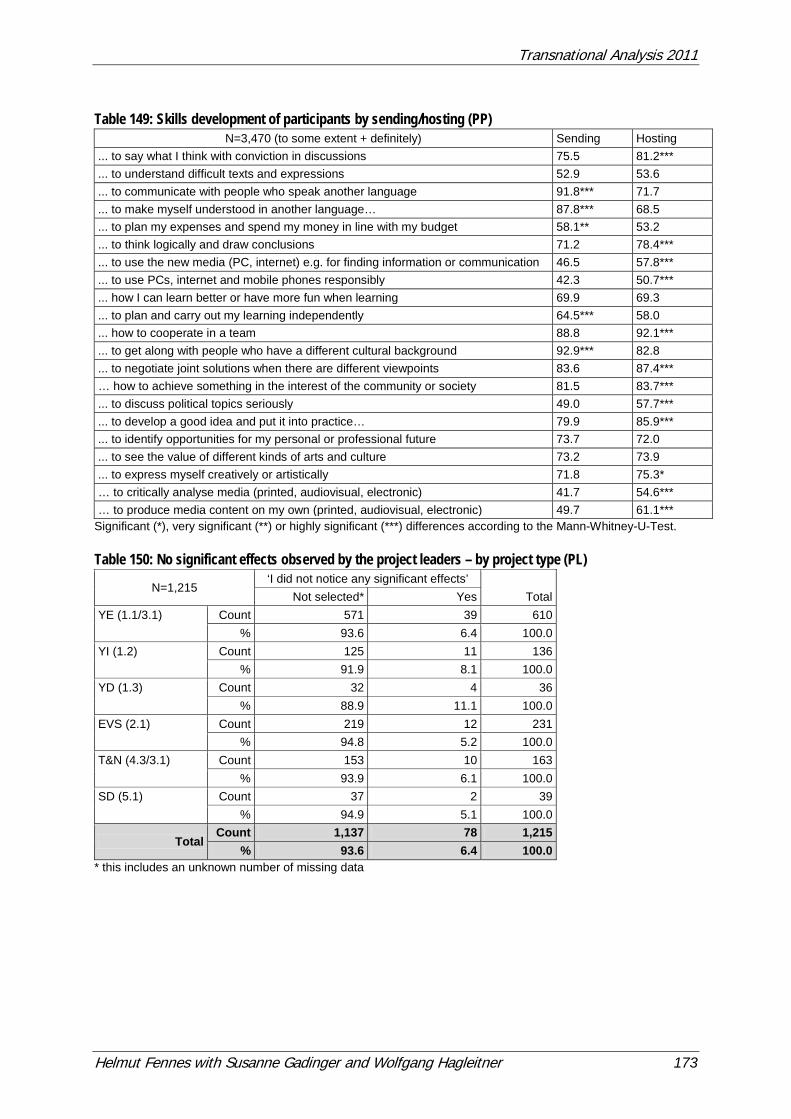
Transnational Analysis 2011
Helmut Fennes with Susanne Gadinger and Wolfgang Hagleitner 173
Table 149: Skills development of participants by sending/hosting (PP)
N=3,470 (to some extent + definitely) Sending Hosting ... to say what I think with conviction in discussions 75.5 81.2*** ... to understand difficult texts and expressions 52.9 53.6 ... to communicate with people who speak another language 91.8*** 71.7 ... to make myself understood in another language… 87.8*** 68.5 ... to plan my expenses and spend my money in line with my budget 58.1** 53.2 ... to think logically and draw conclusions 71.2 78.4*** ... to use the new media (PC, internet) e.g. for finding information or communication 46.5 57.8*** ... to use PCs, internet and mobile phones responsibly 42.3 50.7*** ... how I can learn better or have more fun when learning 69.9 69.3 ... to plan and carry out my learning independently 64.5*** 58.0 ... how to cooperate in a team 88.8 92.1*** ... to get along with people who have a different cultural background 92.9*** 82.8 ... to negotiate joint solutions when there are different viewpoints 83.6 87.4*** … how to achieve something in the interest of the community or society 81.5 83.7*** ... to discuss political topics seriously 49.0 57.7*** ... to develop a good idea and put it into practice… 79.9 85.9*** ... to identify opportunities for my personal or professional future 73.7 72.0 ... to see the value of different kinds of arts and culture 73.2 73.9 ... to express myself creatively or artistically 71.8 75.3* … to critically analyse media (printed, audiovisual, electronic) 41.7 54.6*** … to produce media content on my own (printed, audiovisual, electronic) 49.7 61.1***
Significant (*), very significant (**) or highly significant (***) differences according to the Mann-Whitney-U-Test. Table 150: No significant effects observed by the project leaders – by project type (PL)
N=1,215 ‘I did not notice any significant effects’
Total Not selected* Yes YE (1.1/3.1) Count 571 39 610
% 93.6 6.4 100.0 YI (1.2) Count 125 11 136
% 91.9 8.1 100.0 YD (1.3) Count 32 4 36
% 88.9 11.1 100.0 EVS (2.1) Count 219 12 231
% 94.8 5.2 100.0 T&N (4.3/3.1) Count 153 10 163
% 93.9 6.1 100.0 SD (5.1) Count 37 2 39
% 94.9 5.1 100.0
Total Count 1,137 78 1,215
% 93.6 6.4 100.0 * this includes an unknown number of missing data
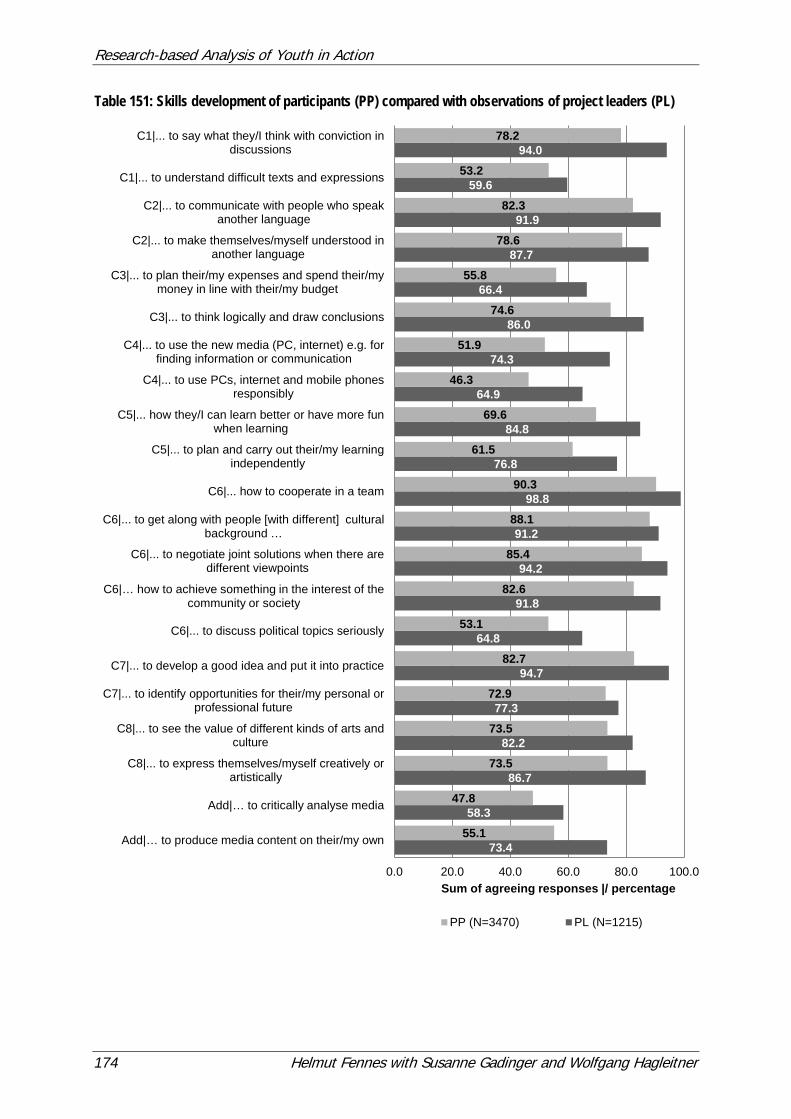
Research-based Analysis of Youth in Action
174 Helmut Fennes with Susanne Gadinger and Wolfgang Hagleitner
Table 151: Skills development of participants (PP) compared with observations of project leaders (PL)
73.4
58.3
86.7
82.2
77.3
94.7
64.8
91.8
94.2
91.2
98.8
76.8
84.8
64.9
74.3
86.0
66.4
87.7
91.9
59.6
94.0
55.1
47.8
73.5
73.5
72.9
82.7
53.1
82.6
85.4
88.1
90.3
61.5
69.6
46.3
51.9
74.6
55.8
78.6
82.3
53.2
78.2
0.0 20.0 40.0 60.0 80.0 100.0
Add|… to produce media content on their/my own
Add|… to critically analyse media
C8|... to express themselves/myself creatively orartistically
C8|... to see the value of different kinds of arts andculture
C7|... to identify opportunities for their/my personal orprofessional future
C7|... to develop a good idea and put it into practice
C6|... to discuss political topics seriously
C6|… how to achieve something in the interest of the community or society
C6|... to negotiate joint solutions when there aredifferent viewpoints
C6|... to get along with people [with different] cultural background …
C6|... how to cooperate in a team
C5|... to plan and carry out their/my learningindependently
C5|... how they/I can learn better or have more funwhen learning
C4|... to use PCs, internet and mobile phonesresponsibly
C4|... to use the new media (PC, internet) e.g. forfinding information or communication
C3|... to think logically and draw conclusions
C3|... to plan their/my expenses and spend their/mymoney in line with their/my budget
C2|... to make themselves/myself understood inanother language
C2|... to communicate with people who speakanother language
C1|... to understand difficult texts and expressions
C1|... to say what they/I think with conviction indiscussions
Sum of agreeing responses |/ percentage
PP (N=3470) PL (N=1215)
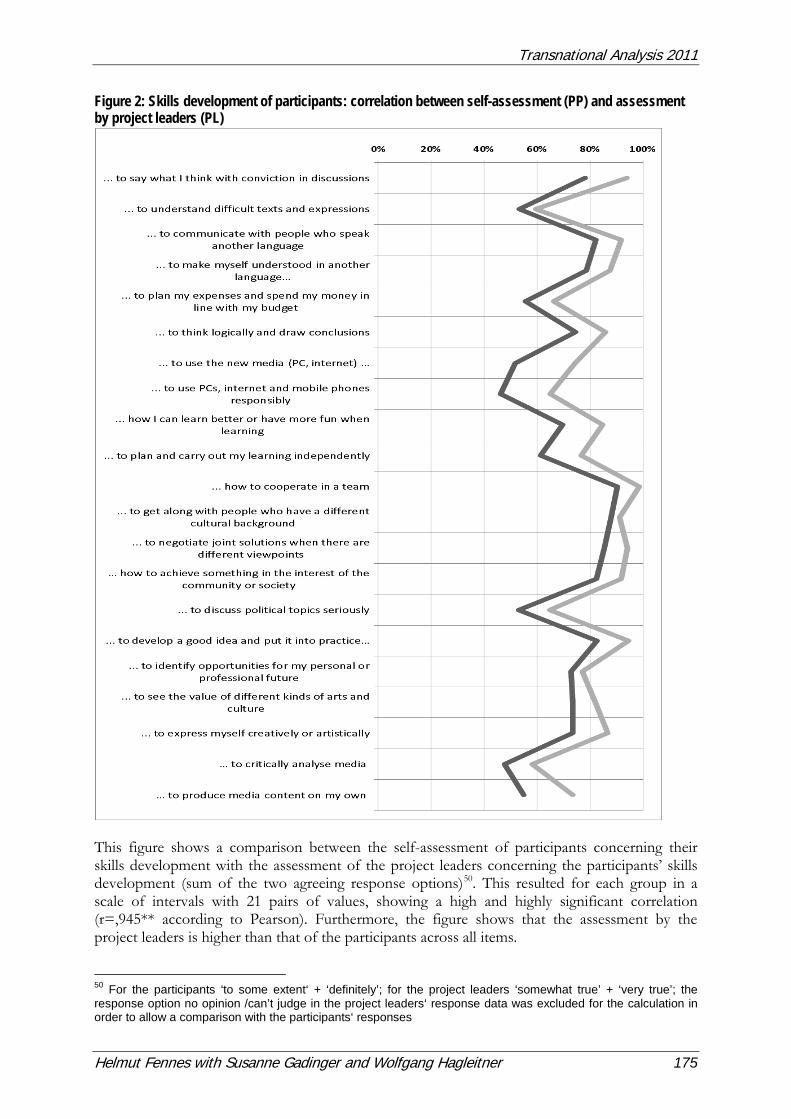
Transnational Analysis 2011
Helmut Fennes with Susanne Gadinger and Wolfgang Hagleitner 175
Figure 2: Skills development of participants: correlation between self-assessment (PP) and assessment by project leaders (PL)
This figure shows a comparison between the self-assessment of participants concerning their skills development with the assessment of the project leaders concerning the participants’ skills development (sum of the two agreeing response options)50. This resulted for each group in a scale of intervals with 21 pairs of values, showing a high and highly significant correlation (r=,945** according to Pearson). Furthermore, the figure shows that the assessment by the project leaders is higher than that of the participants across all items.
50 For the participants ‘to some extent‘ + ‘definitely’; for the project leaders ‘somewhat true’ + ‘very true’; the response option no opinion /can’t judge in the project leaders‘ response data was excluded for the calculation in order to allow a comparison with the participants‘ responses
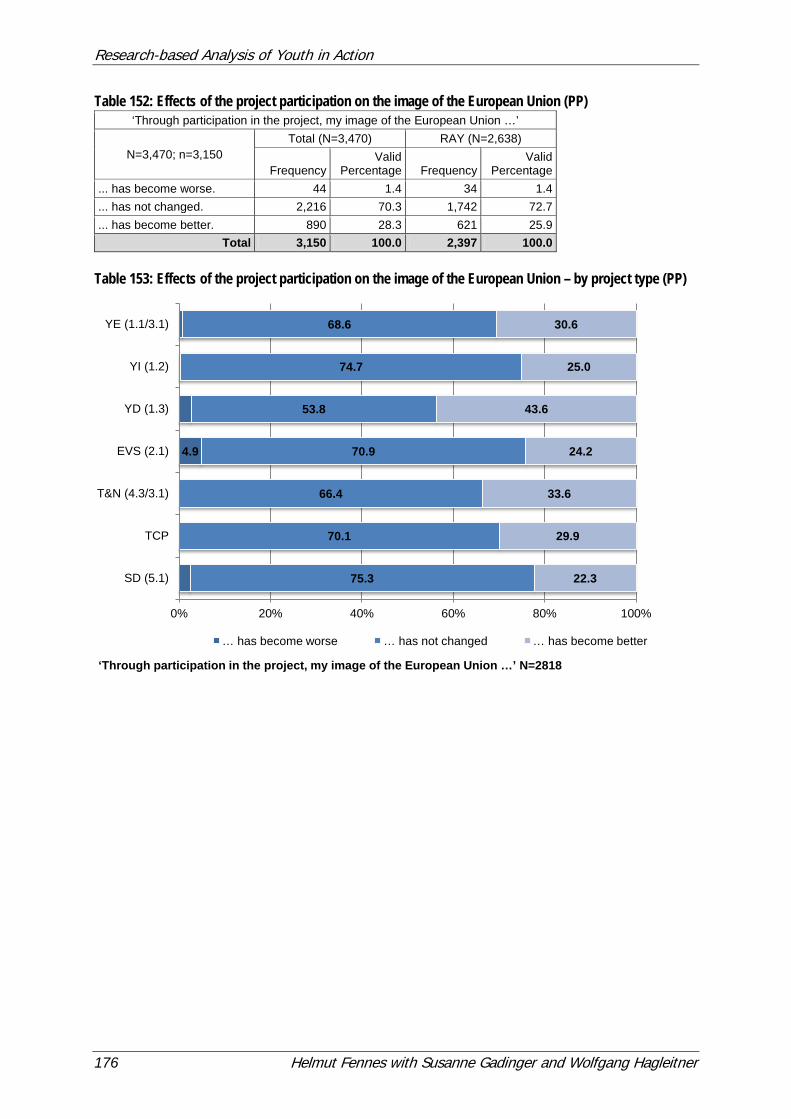
Research-based Analysis of Youth in Action
176 Helmut Fennes with Susanne Gadinger and Wolfgang Hagleitner
Table 152: Effects of the project participation on the image of the European Union (PP) ‘Through participation in the project, my image of the European Union …’
N=3,470; n=3,150 Total (N=3,470) RAY (N=2,638)
Frequency Valid
Percentage Frequency Valid
Percentage ... has become worse. 44 1.4 34 1.4 ... has not changed. 2,216 70.3 1,742 72.7 ... has become better. 890 28.3 621 25.9
Total 3,150 100.0 2,397 100.0 Table 153: Effects of the project participation on the image of the European Union – by project type (PP)
4.9
75.3
70.1
66.4
70.9
53.8
74.7
68.6
22.3
29.9
33.6
24.2
43.6
25.0
30.6
0% 20% 40% 60% 80% 100%
SD (5.1)
TCP
T&N (4.3/3.1)
EVS (2.1)
YD (1.3)
YI (1.2)
YE (1.1/3.1)
‘Through participation in the project, my image of the European Union …’ N=2818
… has become worse … has not changed … has become better
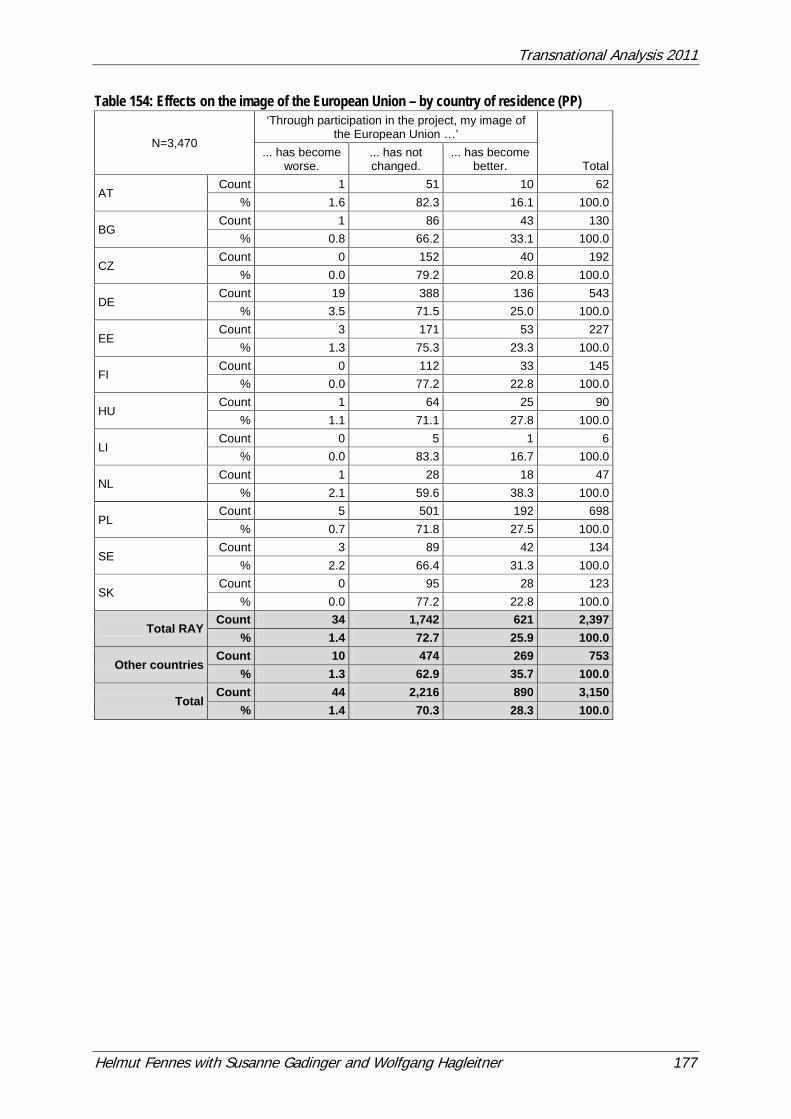
Transnational Analysis 2011
Helmut Fennes with Susanne Gadinger and Wolfgang Hagleitner 177
Table 154: Effects on the image of the European Union – by country of residence (PP)
N=3,470
‘Through participation in the project, my image of the European Union …’
Total ... has become
worse. ... has not changed.
... has become better.
AT Count 1 51 10 62
% 1.6 82.3 16.1 100.0
BG Count 1 86 43 130
% 0.8 66.2 33.1 100.0
CZ Count 0 152 40 192
% 0.0 79.2 20.8 100.0
DE Count 19 388 136 543
% 3.5 71.5 25.0 100.0
EE Count 3 171 53 227
% 1.3 75.3 23.3 100.0
FI Count 0 112 33 145
% 0.0 77.2 22.8 100.0
HU Count 1 64 25 90
% 1.1 71.1 27.8 100.0
LI Count 0 5 1 6
% 0.0 83.3 16.7 100.0
NL Count 1 28 18 47
% 2.1 59.6 38.3 100.0
PL Count 5 501 192 698
% 0.7 71.8 27.5 100.0
SE Count 3 89 42 134
% 2.2 66.4 31.3 100.0
SK Count 0 95 28 123
% 0.0 77.2 22.8 100.0
Total RAY Count 34 1,742 621 2,397
% 1.4 72.7 25.9 100.0
Other countries Count 10 474 269 753
% 1.3 62.9 35.7 100.0
Total Count 44 2,216 890 3,150
% 1.4 70.3 28.3 100.0
Research-based Analysis of Youth in Action
178 Helmut Fennes with Susanne Gadinger and Wolfgang Hagleitner
Figure 3: Comparison between image of the EU (Eurobarometer 74) and improvement of the image of the EU through YiA
(Source: European Commission, 2011, p. 47)
25%
38%
23%
16%
31%
21% 23%
28%
23% 28%
33%
32%
40%
27% 28%
34% 32%
38% 39%
52% 56% 57%
0%
10%
20%
30%
40%
50%
60%
DE NL FI AT SE CZ EE HU SK PL BG
YIA survey: 'My Image of the EU... has become better' (by country of residence)
EB74: 'Does the EU conjure up for you a very/fairly positive … image?'
Linear (YIA survey: 'My Image of the EU... has become better' (by country of residence))
Linear (EB74: 'Does the EU conjure up for you a very/fairly positive … image?')
Transnational Analysis 2011
Helmut Fennes with Susanne Gadinger and Wolfgang Hagleitner 179
Table 155: Effects on values and attitudes (PP)
7.4
52.4
53.8
34.8
41.7
70.1
39.8
40.6
49.4
58
58.4
48.2
55
54.3
78.2
46
44.5
64.1
56.6
22.5
59
58.4
49.5
41.3
40.4
51
44.3
45.1
19.4
0% 20% 40% 60% 80% 100%
Total
Total RAY
Respect for other cultures
Self-fulfilment
Religion
Tolerance
Solidarity, support for others
Equality
Peace
Democracy
Individual freedom
Human rights
Respect for human life
Rule of law
‘As a result of participating in the project, the following has become for me …’ N=3470
less important has not changed more important
Research-based Analysis of Youth in Action
180 Helmut Fennes with Susanne Gadinger and Wolfgang Hagleitner
Table 156: Competence development of participants as perceived by the project leaders (PL)
N=1,215
Not
at a
ll tru
e
Not
ver
y tru
e
Som
ewha
t tru
e
Ver
y tru
e
No
opin
ion
or
can’
t jud
ge
Total
Communication in the first language (mother tongue)
Count 179 336 323 274 75 1,187 % 15.1 28.3 27.2 23.1 6.3 100.0
Communication in a foreign language Count 69 63 168 851 37 1,188
% 5.8 5.3 14.1 71.6 3.1 100.0
Mathematical competence Count 485 324 209 72 89 1,179
% 41.1 27.5 17.7 6.1 7.5 100.0
Basic competences in science and technology
Count 390 306 290 129 69 1,184 % 32.9 25.8 24.5 10.9 5.8 100.0
Digital competence Count 221 252 402 269 49 1,193
% 18.5 21.1 33.7 22.5 4.1 100.0
Learning to learn Count 39 112 373 626 41 1,191
% 3.3 9.4 31.3 52.6 3.4 100.0
Interpersonal and social competence Count 7 17 166 955 57 1,202
% 0.6 1.4 13.8 79.5 4.7 100.0
Intercultural competence Count 14 36 161 909 77 1,197
% 1.2 3.0 13.5 75.9 6.4 100.0
Civic competence Count 26 127 377 590 74 1,194
% 2.2 10.6 31.6 49.4 6.2 100.0
Cultural awareness and expression Count 29 121 278 695 82 1,205
% 2.4 10.0 23.1 57.7 6.8 100.0
Sense of initiative Count 9 39 285 804 67 1,204
% 0.7 3.2 23.7 66.8 5.6 100.0
Sense of entrepreneurship Count 106 247 361 407 72 1,193
% 8.9 20.7 30.3 34.1 6.0 100.0
Media literacy Count 107 253 432 329 75 1,196
% 8.9 21.2 36.1 27.5 6.3 100.0
Total Count 1,681 2,233 3,825 6,910 864 15,513
% 10.8 14.4 24.7 44.5 5.6 100.0
Transnational Analysis 2011
Helmut Fennes with Susanne Gadinger and Wolfgang Hagleitner 181
Table 157: Competence development of participants as perceived by the project leaders – by sending/hosting (PL)
Significant (*), very significant (**) or highly significant (***) differences according to the Mann-Whitney-U-Test.
18.9
31.0
12.5
3.4
37.5
42.2
37.1
38.6
21.0
26.1
10.5
10.7
3.6
5.4
6.2
8.9
6.1
3.4
3.6
8.5
10.8
10.2
16.2
26.0
30.4
10.4
5.2
27.9
32.9
32.2
32.2
24.0
27.0
17.5
16.5
5.2
7.4
3.2
12.5
12.8
13.4
11.7
5.8
7.0
15.6
21.4
22.5
28.5
29.7
24.4
23.7
33.3
24.1
18.5
21.2
22.0
35.8
34.5
42.0
40.7
31.8
35.6
25.2
32.6
36.6
42.2
31.4
34.1
30.5
36.4
31.8
32.6
34.3
36.7
25.3
14.2
53.5
58.0
10.5
6.4
9.6
7.1
19.1
12.4
30.1
32.0
64.4
56.7
63.9
62.2
45.6
38.9
46.3
48.1
60.2
53.0
44.1
35.1
32.9
18.5
0% 20% 40% 60% 80% 100%
***Hosting
Sending
Hosting
***Sending
**Hosting
Sending
Hosting
Sending
***Hosting
Sending
Hosting
Sending
**Hosting
Sending
Hosting
Sending
Hosting
Sending
Hosting
Sending
*Hosting
Sending
***Hosting
Sending
***Hosting
Sending
Comm
unica
tion i
n the
first
langu
age
Comm
unica
tion i
n afor
eign
langu
age
Mathe
matic
alco
mpete
nce
Basic
comp
etenc
es i
n scie
nce
and
techn
ology
Digit
alco
mpete
nce
Lear
ning t
olea
rn
Inter
perso
nal
and
socia
lco
mpete
nce
sInt
ercu
ltura
lco
mpete
nce
Civic
comp
etenc
e
Cultu
ral
awar
enes
san
dex
pres
sion
Sens
e of
initia
tive
Sens
e of
entre
pren
eursh
ipMe
dialite
racy
Not at all true Not very true Somewhat true Very true
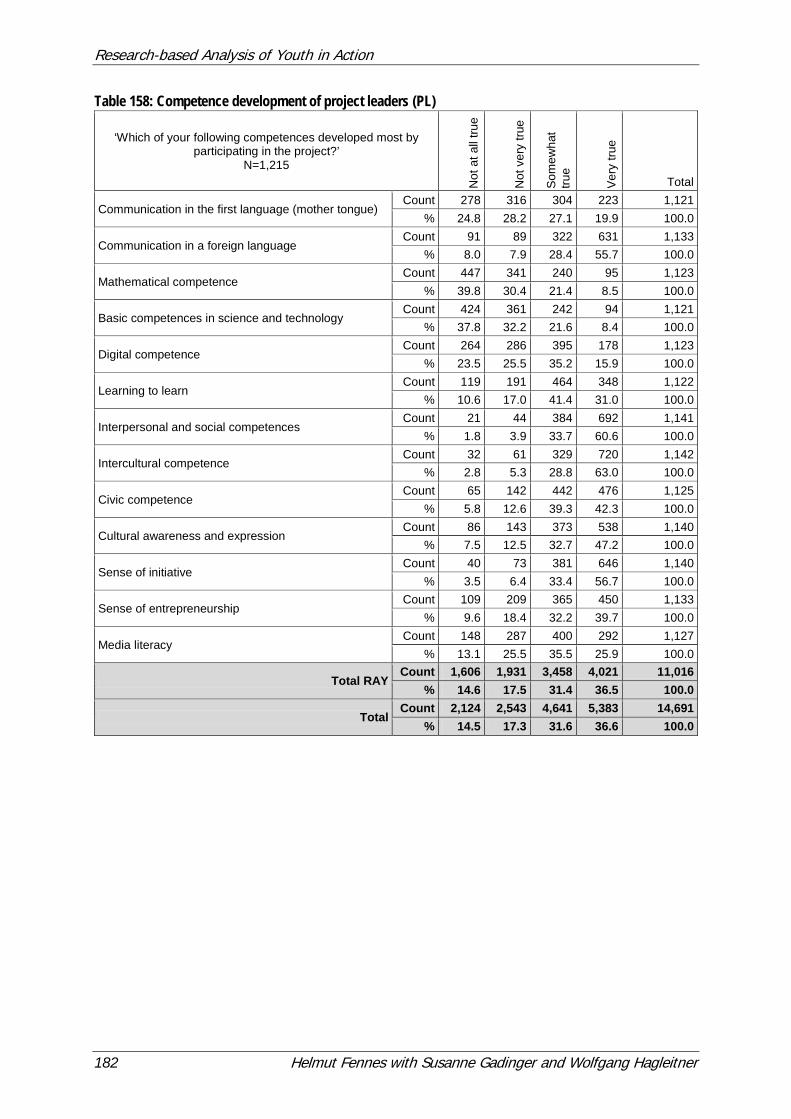
Research-based Analysis of Youth in Action
182 Helmut Fennes with Susanne Gadinger and Wolfgang Hagleitner
Table 158: Competence development of project leaders (PL)
‘Which of your following competences developed most by participating in the project?’
N=1,215
Not
at a
ll tru
e
Not
ver
y tru
e
Som
ewha
t tru
e
Ver
y tru
e
Total
Communication in the first language (mother tongue) Count 278 316 304 223 1,121
% 24.8 28.2 27.1 19.9 100.0
Communication in a foreign language Count 91 89 322 631 1,133
% 8.0 7.9 28.4 55.7 100.0
Mathematical competence Count 447 341 240 95 1,123
% 39.8 30.4 21.4 8.5 100.0
Basic competences in science and technology Count 424 361 242 94 1,121
% 37.8 32.2 21.6 8.4 100.0
Digital competence Count 264 286 395 178 1,123
% 23.5 25.5 35.2 15.9 100.0
Learning to learn Count 119 191 464 348 1,122
% 10.6 17.0 41.4 31.0 100.0
Interpersonal and social competences Count 21 44 384 692 1,141
% 1.8 3.9 33.7 60.6 100.0
Intercultural competence Count 32 61 329 720 1,142
% 2.8 5.3 28.8 63.0 100.0
Civic competence Count 65 142 442 476 1,125
% 5.8 12.6 39.3 42.3 100.0
Cultural awareness and expression Count 86 143 373 538 1,140
% 7.5 12.5 32.7 47.2 100.0
Sense of initiative Count 40 73 381 646 1,140
% 3.5 6.4 33.4 56.7 100.0
Sense of entrepreneurship Count 109 209 365 450 1,133
% 9.6 18.4 32.2 39.7 100.0
Media literacy Count 148 287 400 292 1,127
% 13.1 25.5 35.5 25.9 100.0
Total RAY Count 1,606 1,931 3,458 4,021 11,016
% 14.6 17.5 31.4 36.5 100.0
Total Count 2,124 2,543 4,641 5,383 14,691
% 14.5 17.3 31.6 36.6 100.0
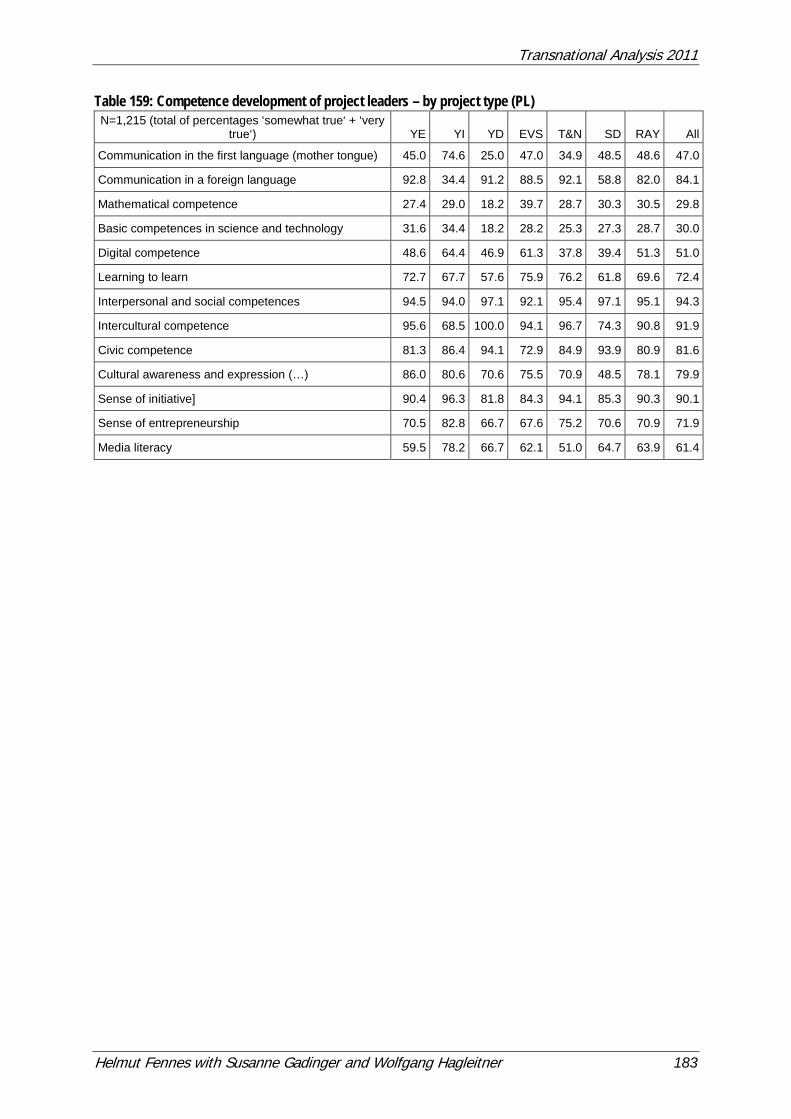
Transnational Analysis 2011
Helmut Fennes with Susanne Gadinger and Wolfgang Hagleitner 183
Table 159: Competence development of project leaders – by project type (PL) N=1,215 (total of percentages ‘somewhat true‘ + ‘very
true‘) YE YI YD EVS T&N SD RAY All
Communication in the first language (mother tongue) 45.0 74.6 25.0 47.0 34.9 48.5 48.6 47.0
Communication in a foreign language 92.8 34.4 91.2 88.5 92.1 58.8 82.0 84.1
Mathematical competence 27.4 29.0 18.2 39.7 28.7 30.3 30.5 29.8
Basic competences in science and technology 31.6 34.4 18.2 28.2 25.3 27.3 28.7 30.0
Digital competence 48.6 64.4 46.9 61.3 37.8 39.4 51.3 51.0
Learning to learn 72.7 67.7 57.6 75.9 76.2 61.8 69.6 72.4
Interpersonal and social competences 94.5 94.0 97.1 92.1 95.4 97.1 95.1 94.3
Intercultural competence 95.6 68.5 100.0 94.1 96.7 74.3 90.8 91.9
Civic competence 81.3 86.4 94.1 72.9 84.9 93.9 80.9 81.6
Cultural awareness and expression (…) 86.0 80.6 70.6 75.5 70.9 48.5 78.1 79.9
Sense of initiative] 90.4 96.3 81.8 84.3 94.1 85.3 90.3 90.1
Sense of entrepreneurship 70.5 82.8 66.7 67.6 75.2 70.6 70.9 71.9
Media literacy 59.5 78.2 66.7 62.1 51.0 64.7 63.9 61.4
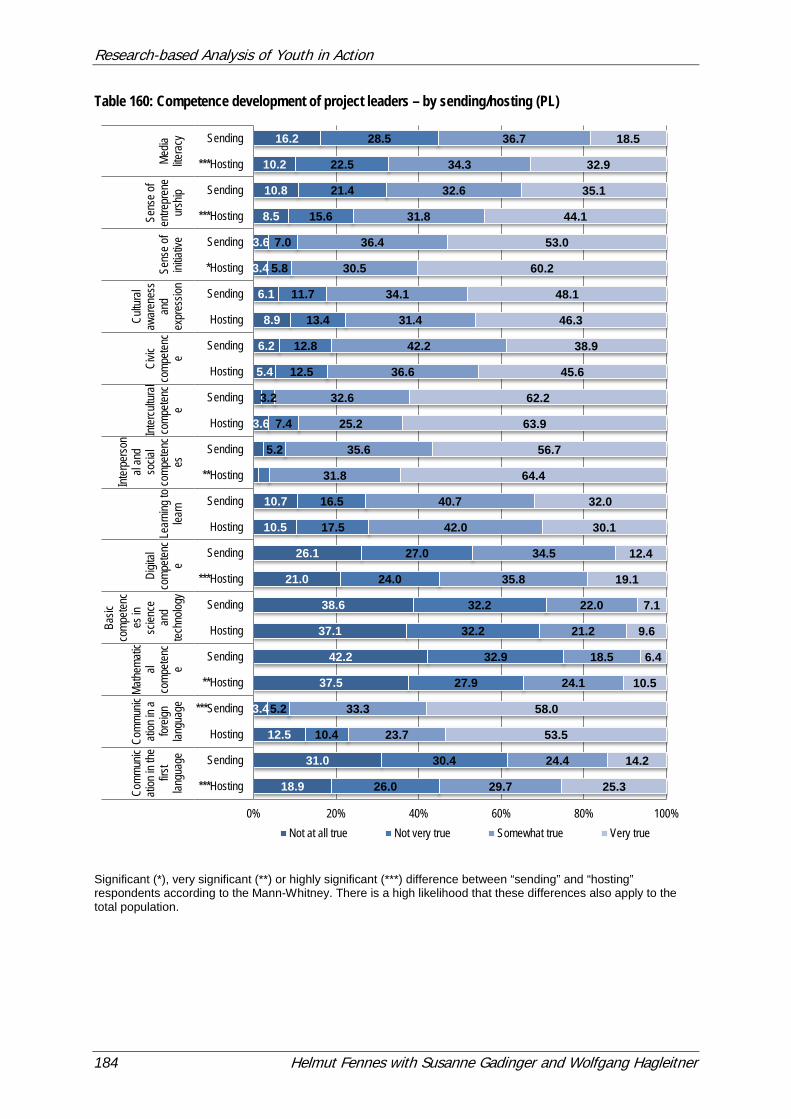
Research-based Analysis of Youth in Action
184 Helmut Fennes with Susanne Gadinger and Wolfgang Hagleitner
Table 160: Competence development of project leaders – by sending/hosting (PL)
Significant (*), very significant (**) or highly significant (***) difference between “sending” and “hosting” respondents according to the Mann-Whitney. There is a high likelihood that these differences also apply to the total population.
18.9
31.0
12.5
3.4
37.5
42.2
37.1
38.6
21.0
26.1
10.5
10.7
3.6
5.4
6.2
8.9
6.1
3.4
3.6
8.5
10.8
10.2
16.2
26.0
30.4
10.4
5.2
27.9
32.9
32.2
32.2
24.0
27.0
17.5
16.5
5.2
7.4
3.2
12.5
12.8
13.4
11.7
5.8
7.0
15.6
21.4
22.5
28.5
29.7
24.4
23.7
33.3
24.1
18.5
21.2
22.0
35.8
34.5
42.0
40.7
31.8
35.6
25.2
32.6
36.6
42.2
31.4
34.1
30.5
36.4
31.8
32.6
34.3
36.7
25.3
14.2
53.5
58.0
10.5
6.4
9.6
7.1
19.1
12.4
30.1
32.0
64.4
56.7
63.9
62.2
45.6
38.9
46.3
48.1
60.2
53.0
44.1
35.1
32.9
18.5
0% 20% 40% 60% 80% 100%
***Hosting
Sending
Hosting
***Sending
**Hosting
Sending
Hosting
Sending
***Hosting
Sending
Hosting
Sending
**Hosting
Sending
Hosting
Sending
Hosting
Sending
Hosting
Sending
*Hosting
Sending
***Hosting
Sending
***Hosting
SendingCo
mmun
icati
on in
the
first
langu
age
Comm
unic
ation
in a
foreig
nlan
guag
e
Mathe
matic
alco
mpete
nce
Basic
comp
etenc
es in
scien
cean
dtec
hnolo
gy
Digit
alco
mpete
nce
Lear
ning t
olea
rn
Inter
perso
nal
and
socia
lco
mpete
nces
Inter
cultu
ral
comp
etenc
e
Civic
comp
etenc
e
Cultu
ral
awar
enes
san
dex
pres
sion
Sens
e of
initia
tive
Sens
e of
entre
pren
eur
ship
Media
litera
cy
Not at all true Not very true Somewhat true Very true
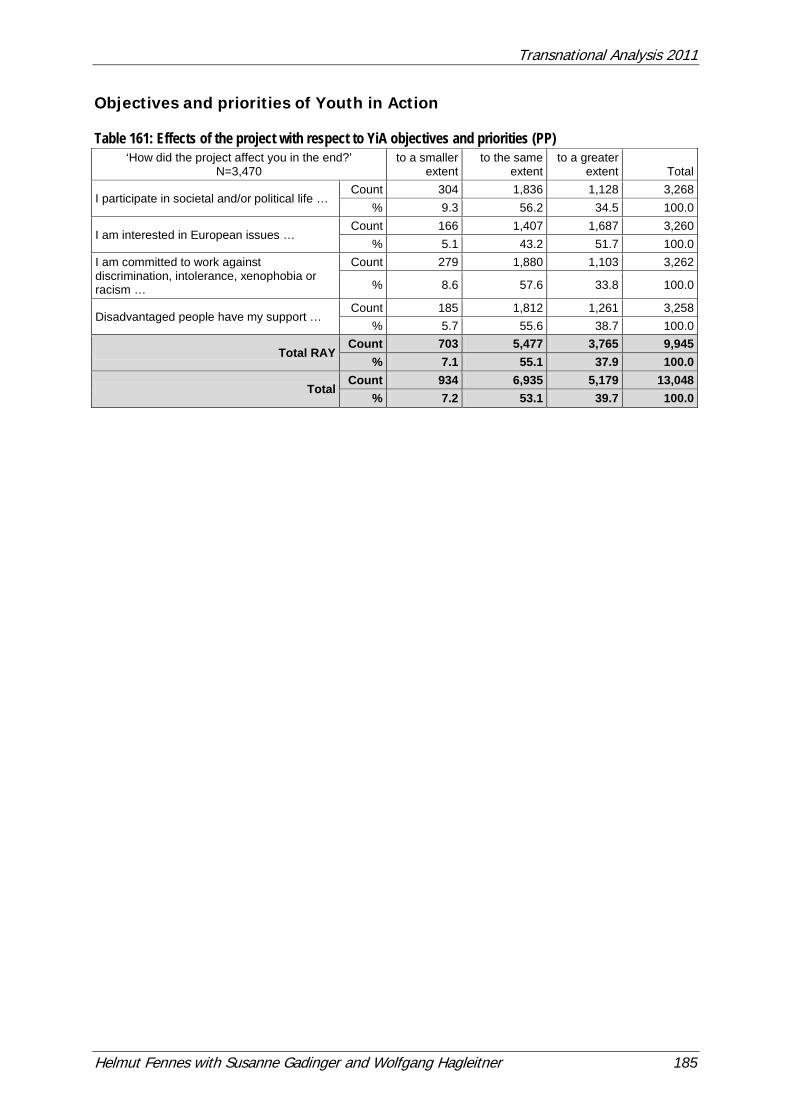
Transnational Analysis 2011
Helmut Fennes with Susanne Gadinger and Wolfgang Hagleitner 185
Objectives and priorities of Youth in Action Table 161: Effects of the project with respect to YiA objectives and priorities (PP)
‘How did the project affect you in the end?’ N=3,470
to a smaller extent
to the same extent
to a greater extent Total
I participate in societal and/or political life … Count 304 1,836 1,128 3,268
% 9.3 56.2 34.5 100.0
I am interested in European issues … Count 166 1,407 1,687 3,260
% 5.1 43.2 51.7 100.0 I am committed to work against discrimination, intolerance, xenophobia or racism …
Count 279 1,880 1,103 3,262
% 8.6 57.6 33.8 100.0
Disadvantaged people have my support … Count 185 1,812 1,261 3,258
% 5.7 55.6 38.7 100.0
Total RAY Count 703 5,477 3,765 9,945
% 7.1 55.1 37.9 100.0
Total Count 934 6,935 5,179 13,048
% 7.2 53.1 39.7 100.0
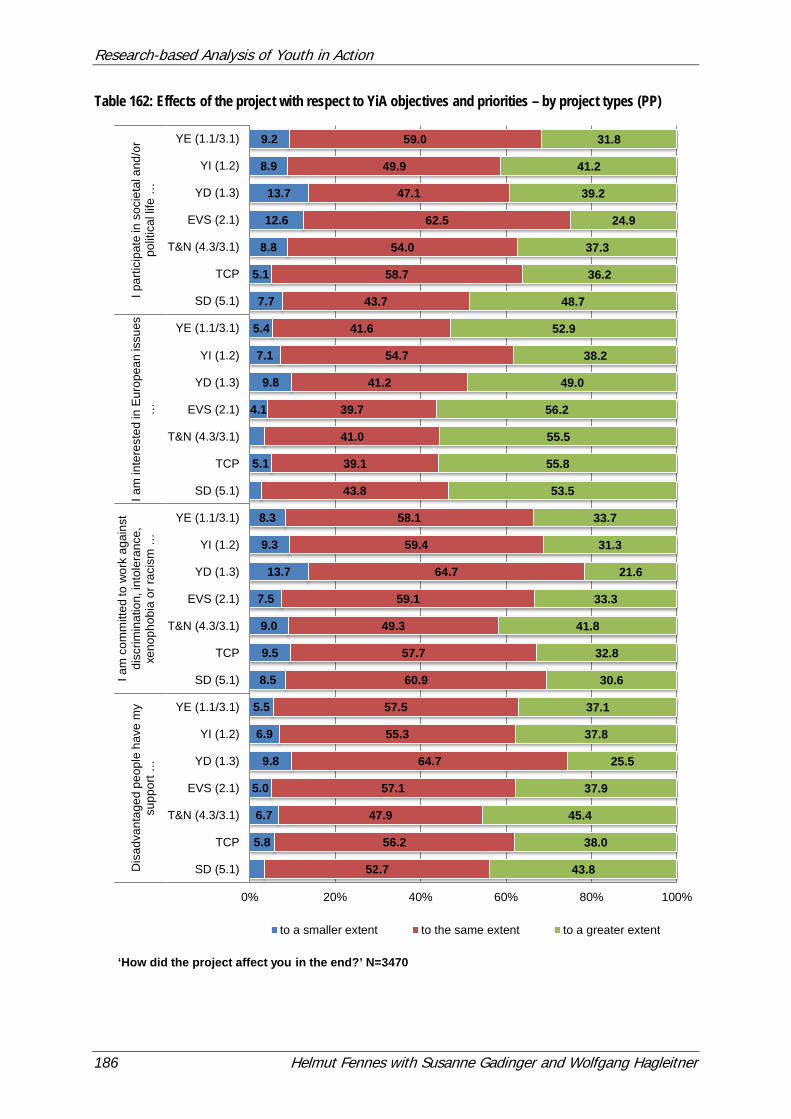
Research-based Analysis of Youth in Action
186 Helmut Fennes with Susanne Gadinger and Wolfgang Hagleitner
Table 162: Effects of the project with respect to YiA objectives and priorities – by project types (PP)
5.8
6.7
5.0
9.8
6.9
5.5
8.5
9.5
9.0
7.5
13.7
9.3
8.3
5.1
4.1
9.8
7.1
5.4
7.7
5.1
8.8
12.6
13.7
8.9
9.2
52.7
56.2
47.9
57.1
64.7
55.3
57.5
60.9
57.7
49.3
59.1
64.7
59.4
58.1
43.8
39.1
41.0
39.7
41.2
54.7
41.6
43.7
58.7
54.0
62.5
47.1
49.9
59.0
43.8
38.0
45.4
37.9
25.5
37.8
37.1
30.6
32.8
41.8
33.3
21.6
31.3
33.7
53.5
55.8
55.5
56.2
49.0
38.2
52.9
48.7
36.2
37.3
24.9
39.2
41.2
31.8
0% 20% 40% 60% 80% 100%
SD (5.1)
TCP
T&N (4.3/3.1)
EVS (2.1)
YD (1.3)
YI (1.2)
YE (1.1/3.1)
SD (5.1)
TCP
T&N (4.3/3.1)
EVS (2.1)
YD (1.3)
YI (1.2)
YE (1.1/3.1)
SD (5.1)
TCP
T&N (4.3/3.1)
EVS (2.1)
YD (1.3)
YI (1.2)
YE (1.1/3.1)
SD (5.1)
TCP
T&N (4.3/3.1)
EVS (2.1)
YD (1.3)
YI (1.2)
YE (1.1/3.1)D
isad
vant
aged
peo
ple
have
my
supp
ort …
I am
com
mitt
ed to
wor
k ag
ains
t di
scrim
inat
ion,
into
lera
nce,
xe
noph
obia
or r
acis
m …
I a
m in
tere
sted
in E
urop
ean
issu
es
…
I par
ticip
ate
in s
ocie
tal a
nd/o
r po
litic
al li
fe …
‘How did the project affect you in the end?’ N=3470
to a smaller extent to the same extent to a greater extent
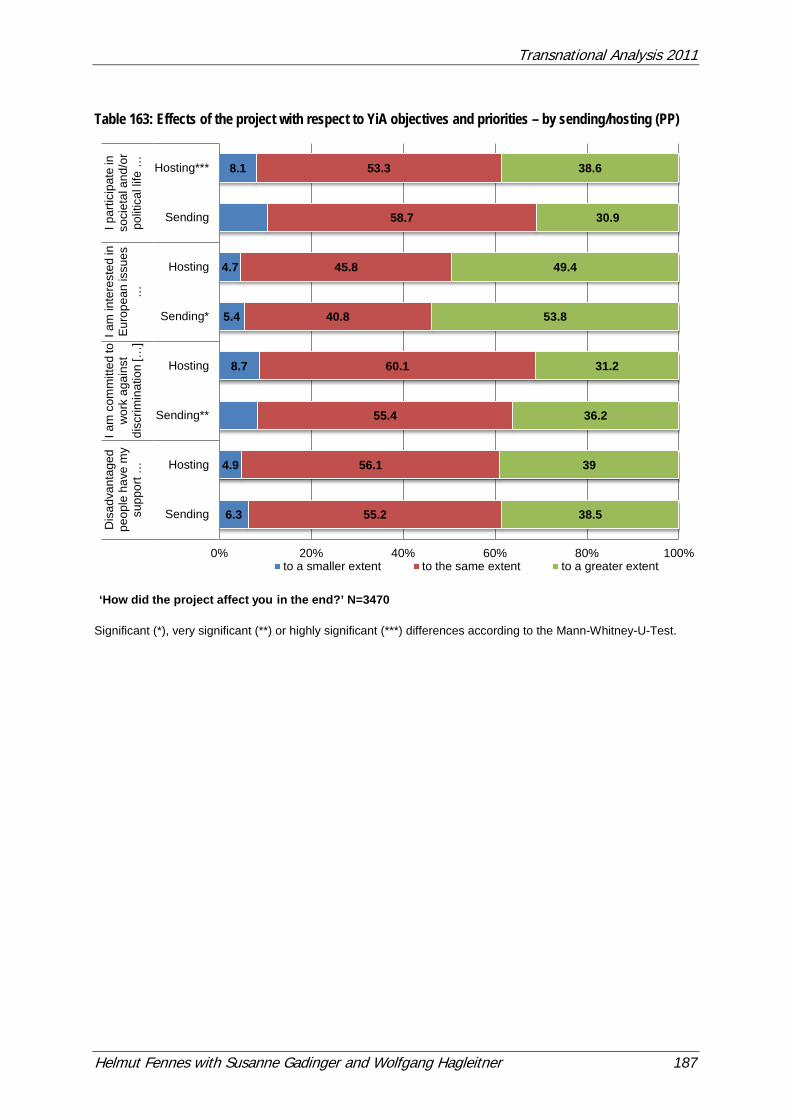
Transnational Analysis 2011
Helmut Fennes with Susanne Gadinger and Wolfgang Hagleitner 187
Table 163: Effects of the project with respect to YiA objectives and priorities – by sending/hosting (PP)
Significant (*), very significant (**) or highly significant (***) differences according to the Mann-Whitney-U-Test.
6.3
4.9
8.7
5.4
4.7
8.1
55.2
56.1
55.4
60.1
40.8
45.8
58.7
53.3
38.5
39
36.2
31.2
53.8
49.4
30.9
38.6
0% 20% 40% 60% 80% 100%
Sending
Hosting
Sending**
Hosting
Sending*
Hosting
Sending
Hosting***
Dis
adva
ntag
ed
peop
le h
ave
my
supp
ort …
I am
com
mitt
ed to
w
ork
agai
nst
disc
rimin
atio
n […
]
I am
inte
rest
ed in
E
urop
ean
issu
es
…
I par
ticip
ate
in
soci
etal
and
/or
polit
ical
life
…
‘How did the project affect you in the end?’ N=3470
to a smaller extent to the same extent to a greater extent
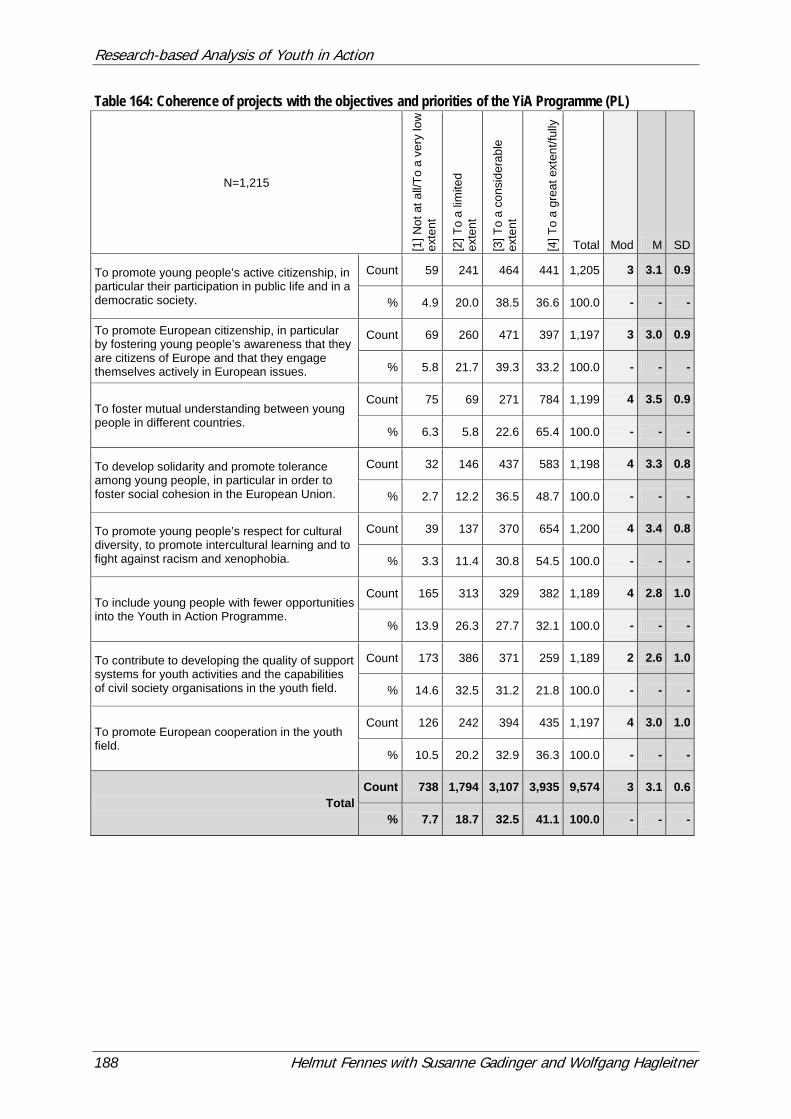
Research-based Analysis of Youth in Action
188 Helmut Fennes with Susanne Gadinger and Wolfgang Hagleitner
Table 164: Coherence of projects with the objectives and priorities of the YiA Programme (PL)
N=1,215
[1] N
ot a
t all/
To a
ver
y lo
w
exte
nt
[2] T
o a
limite
d
exte
nt
[3] T
o a
cons
ider
able
ex
tent
[4] T
o a
grea
t ext
ent/f
ully
Total Mod M SD
To promote young people’s active citizenship, in particular their participation in public life and in a democratic society.
Count 59 241 464 441 1,205 3 3.1 0.9
% 4.9 20.0 38.5 36.6 100.0 - - -
To promote European citizenship, in particular by fostering young people’s awareness that they are citizens of Europe and that they engage themselves actively in European issues.
Count 69 260 471 397 1,197 3 3.0 0.9
% 5.8 21.7 39.3 33.2 100.0 - - -
To foster mutual understanding between young people in different countries.
Count 75 69 271 784 1,199 4 3.5 0.9
% 6.3 5.8 22.6 65.4 100.0 - - -
To develop solidarity and promote tolerance among young people, in particular in order to foster social cohesion in the European Union.
Count 32 146 437 583 1,198 4 3.3 0.8
% 2.7 12.2 36.5 48.7 100.0 - - -
To promote young people’s respect for cultural diversity, to promote intercultural learning and to fight against racism and xenophobia.
Count 39 137 370 654 1,200 4 3.4 0.8
% 3.3 11.4 30.8 54.5 100.0 - - -
To include young people with fewer opportunities into the Youth in Action Programme.
Count 165 313 329 382 1,189 4 2.8 1.0
% 13.9 26.3 27.7 32.1 100.0 - - -
To contribute to developing the quality of support systems for youth activities and the capabilities of civil society organisations in the youth field.
Count 173 386 371 259 1,189 2 2.6 1.0
% 14.6 32.5 31.2 21.8 100.0 - - -
To promote European cooperation in the youth field.
Count 126 242 394 435 1,197 4 3.0 1.0
% 10.5 20.2 32.9 36.3 100.0 - - -
Total Count 738 1,794 3,107 3,935 9,574 3 3.1 0.6
% 7.7 18.7 32.5 41.1 100.0 - - -
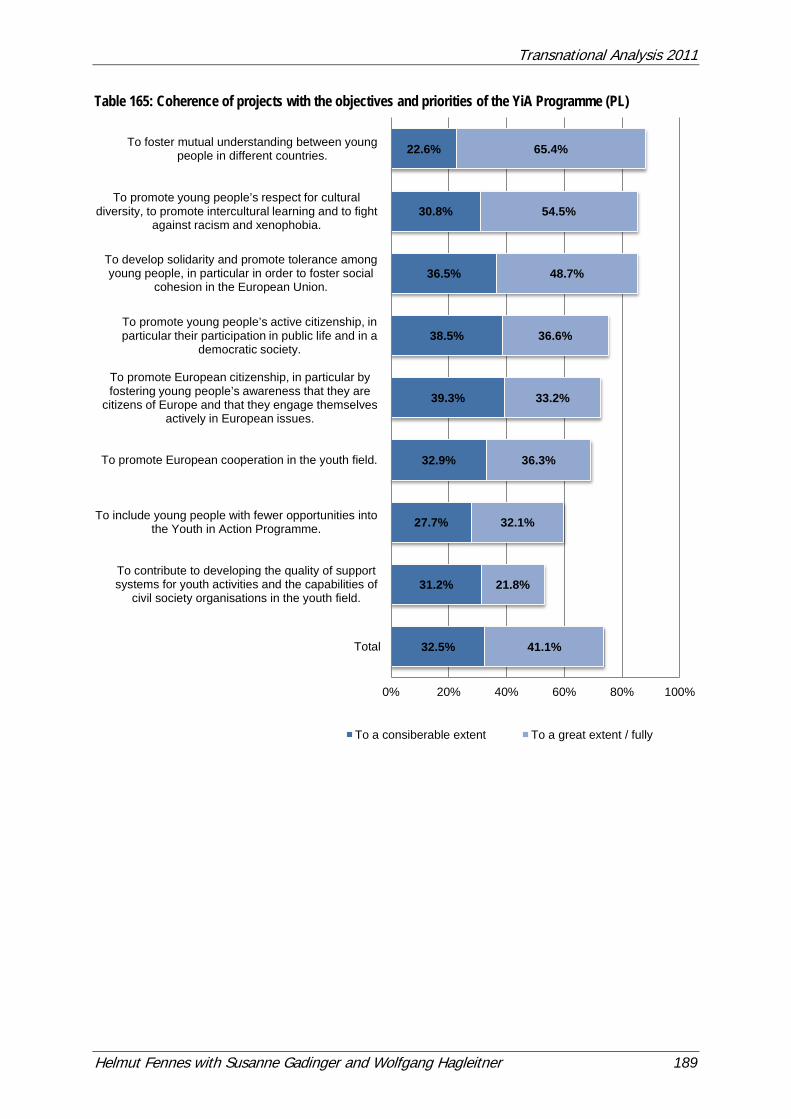
Transnational Analysis 2011
Helmut Fennes with Susanne Gadinger and Wolfgang Hagleitner 189
Table 165: Coherence of projects with the objectives and priorities of the YiA Programme (PL)
32.5%
31.2%
27.7%
32.9%
39.3%
38.5%
36.5%
30.8%
22.6%
41.1%
21.8%
32.1%
36.3%
33.2%
36.6%
48.7%
54.5%
65.4%
0% 20% 40% 60% 80% 100%
Total
To contribute to developing the quality of supportsystems for youth activities and the capabilities of
civil society organisations in the youth field.
To include young people with fewer opportunities intothe Youth in Action Programme.
To promote European cooperation in the youth field.
To promote European citizenship, in particular by fostering young people’s awareness that they are
citizens of Europe and that they engage themselves actively in European issues.
To promote young people’s active citizenship, in particular their participation in public life and in a
democratic society.
To develop solidarity and promote tolerance amongyoung people, in particular in order to foster social
cohesion in the European Union.
To promote young people’s respect for cultural diversity, to promote intercultural learning and to fight
against racism and xenophobia.
To foster mutual understanding between youngpeople in different countries.
To a consiberable extent To a great extent / fully
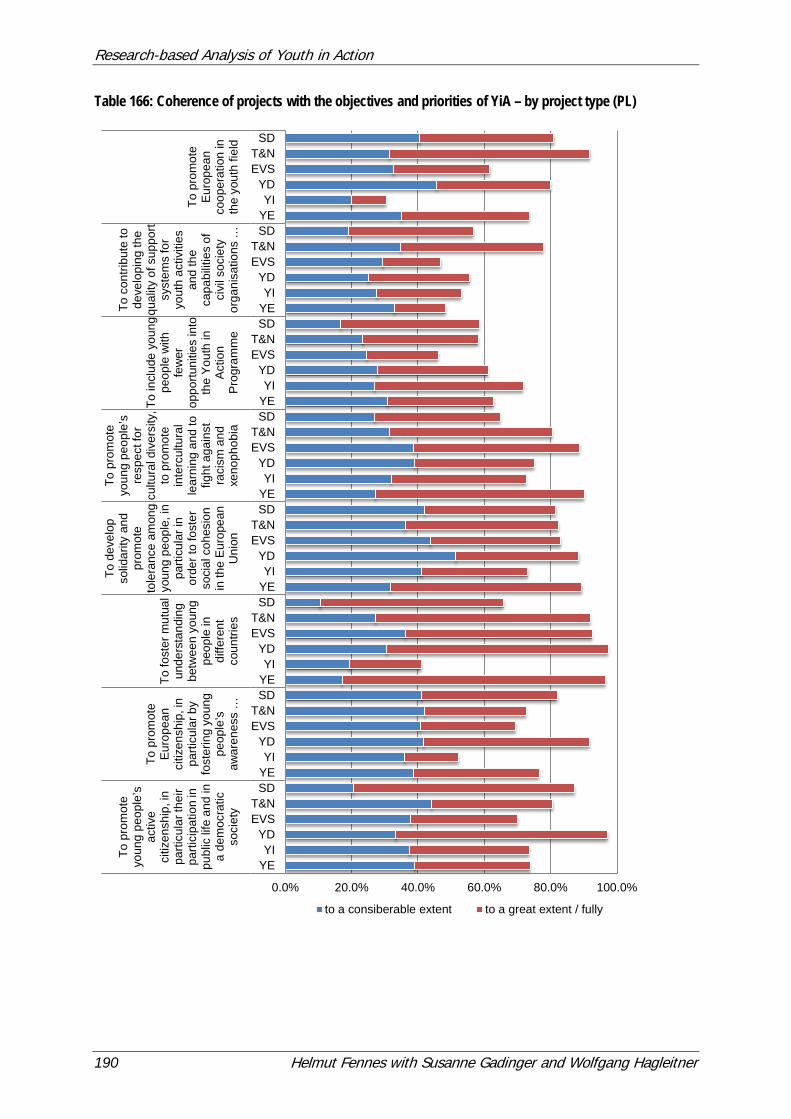
Research-based Analysis of Youth in Action
190 Helmut Fennes with Susanne Gadinger and Wolfgang Hagleitner
Table 166: Coherence of projects with the objectives and priorities of YiA – by project type (PL)
0.0% 20.0% 40.0% 60.0% 80.0% 100.0%
YEYI
YDEVST&N
SDYEYI
YDEVST&N
SDYEYI
YDEVST&N
SDYEYI
YDEVST&N
SDYEYI
YDEVST&N
SDYEYI
YDEVST&N
SDYEYI
YDEVST&N
SDYEYI
YDEVST&N
SDTo
pro
mot
e yo
ung
peop
le’s
ac
tive
citiz
ensh
ip, i
n pa
rticu
lar t
heir
parti
cipa
tion
in
publ
ic li
fe a
nd in
a
dem
ocra
tic
soci
ety
To p
rom
ote
Eur
opea
n ci
tizen
ship
, in
parti
cula
r by
fost
erin
g yo
ung
peop
le’s
aw
aren
ess
…
To fo
ster
mut
ual
unde
rsta
ndin
gbe
twee
n yo
ung
peop
le in
diffe
rent
coun
tries
To d
evel
opso
lidar
ity a
ndpr
omot
eto
lera
nce
amon
gyo
ung
peop
le, i
npa
rticu
lar i
nor
der t
o fo
ster
soci
al c
ohes
ion
in th
e E
urop
ean
Uni
on
To p
rom
ote
youn
g pe
ople
’s
resp
ect f
or
cultu
ral d
iver
sity
, to
pro
mot
e in
terc
ultu
ral
lear
ning
and
to
fight
aga
inst
ra
cism
and
xe
noph
obia
To in
clud
e yo
ung
peop
le w
ithfe
wer
oppo
rtuni
ties
into
the
You
th in
Act
ion
Pro
gram
me
To c
ontri
bute
to
deve
lopi
ng th
e qu
ality
of s
uppo
rt sy
stem
s fo
r yo
uth
activ
ities
an
d th
e ca
pabi
litie
s of
ci
vil s
ocie
ty
orga
nisa
tions
…
To p
rom
ote
Eur
opea
nco
oper
atio
n in
the
yout
h fie
ld
to a consiberable extent to a great extent / fully
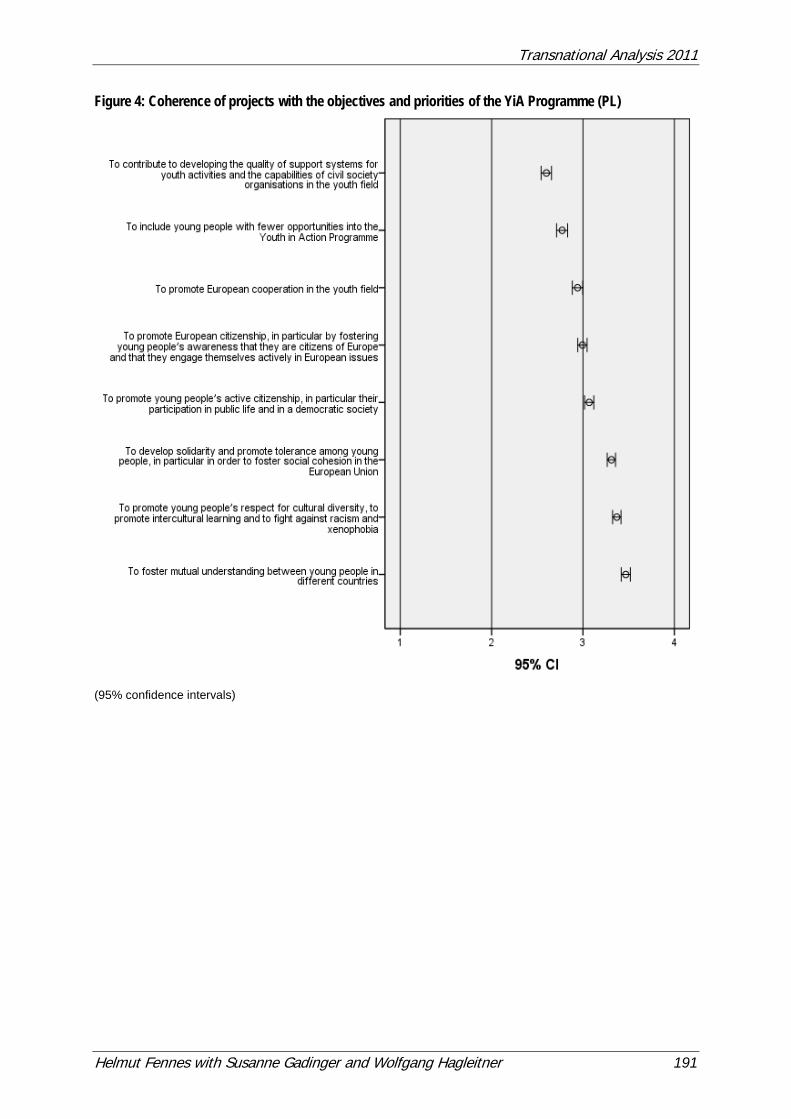
Transnational Analysis 2011
Helmut Fennes with Susanne Gadinger and Wolfgang Hagleitner 191
Figure 4: Coherence of projects with the objectives and priorities of the YiA Programme (PL)
(95% confidence intervals)
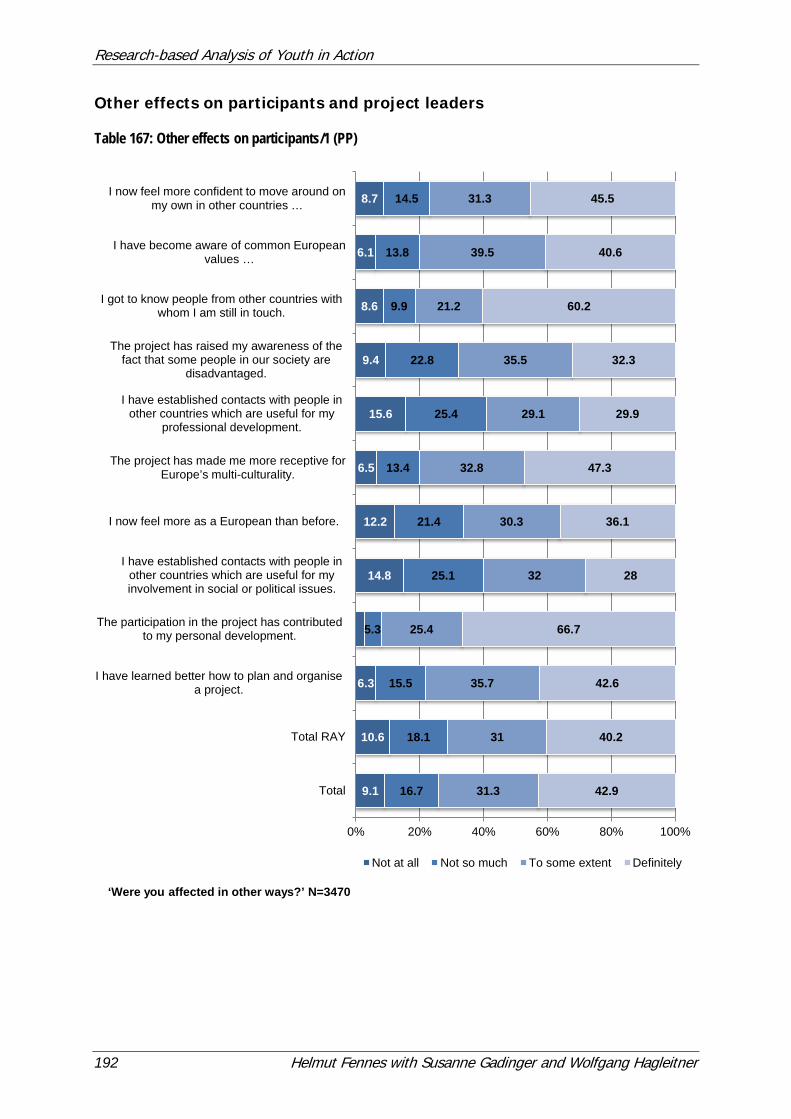
Research-based Analysis of Youth in Action
192 Helmut Fennes with Susanne Gadinger and Wolfgang Hagleitner
Other effects on participants and project leaders Table 167: Other effects on participants/1 (PP)
9.1
10.6
6.3
14.8
12.2
6.5
15.6
9.4
8.6
6.1
8.7
16.7
18.1
15.5
5.3
25.1
21.4
13.4
25.4
22.8
9.9
13.8
14.5
31.3
31
35.7
25.4
32
30.3
32.8
29.1
35.5
21.2
39.5
31.3
42.9
40.2
42.6
66.7
28
36.1
47.3
29.9
32.3
60.2
40.6
45.5
0% 20% 40% 60% 80% 100%
Total
Total RAY
I have learned better how to plan and organisea project.
The participation in the project has contributedto my personal development.
I have established contacts with people inother countries which are useful for myinvolvement in social or political issues.
I now feel more as a European than before.
The project has made me more receptive for Europe’s multi-culturality.
I have established contacts with people inother countries which are useful for my
professional development.
The project has raised my awareness of thefact that some people in our society are
disadvantaged.
I got to know people from other countries withwhom I am still in touch.
I have become aware of common European values …
I now feel more confident to move around on my own in other countries …
‘Were you affected in other ways?’ N=3470
Not at all Not so much To some extent Definitely
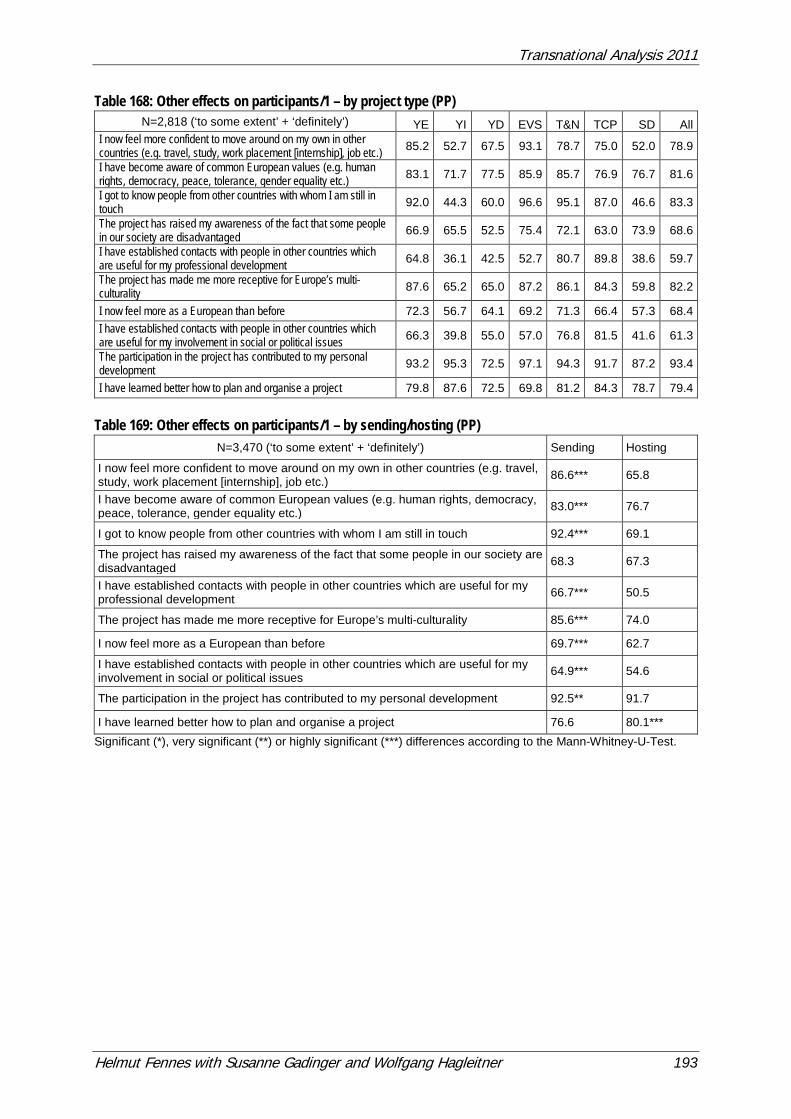
Transnational Analysis 2011
Helmut Fennes with Susanne Gadinger and Wolfgang Hagleitner 193
Table 168: Other effects on participants/1 – by project type (PP) N=2,818 (‘to some extent’ + ‘definitely’) YE YI YD EVS T&N TCP SD All
I now feel more confident to move around on my own in other countries (e.g. travel, study, work placement [internship], job etc.) 85.2 52.7 67.5 93.1 78.7 75.0 52.0 78.9
I have become aware of common European values (e.g. human rights, democracy, peace, tolerance, gender equality etc.) 83.1 71.7 77.5 85.9 85.7 76.9 76.7 81.6
I got to know people from other countries with whom I am still in touch 92.0 44.3 60.0 96.6 95.1 87.0 46.6 83.3
The project has raised my awareness of the fact that some people in our society are disadvantaged 66.9 65.5 52.5 75.4 72.1 63.0 73.9 68.6
I have established contacts with people in other countries which are useful for my professional development 64.8 36.1 42.5 52.7 80.7 89.8 38.6 59.7
The project has made me more receptive for Europe’s multi-culturality 87.6 65.2 65.0 87.2 86.1 84.3 59.8 82.2
I now feel more as a European than before 72.3 56.7 64.1 69.2 71.3 66.4 57.3 68.4 I have established contacts with people in other countries which are useful for my involvement in social or political issues 66.3 39.8 55.0 57.0 76.8 81.5 41.6 61.3
The participation in the project has contributed to my personal development 93.2 95.3 72.5 97.1 94.3 91.7 87.2 93.4
I have learned better how to plan and organise a project 79.8 87.6 72.5 69.8 81.2 84.3 78.7 79.4
Table 169: Other effects on participants/1 – by sending/hosting (PP)
N=3,470 (‘to some extent’ + ‘definitely’) Sending Hosting
I now feel more confident to move around on my own in other countries (e.g. travel, study, work placement [internship], job etc.) 86.6*** 65.8
I have become aware of common European values (e.g. human rights, democracy, peace, tolerance, gender equality etc.) 83.0*** 76.7
I got to know people from other countries with whom I am still in touch 92.4*** 69.1
The project has raised my awareness of the fact that some people in our society are disadvantaged 68.3 67.3
I have established contacts with people in other countries which are useful for my professional development 66.7*** 50.5
The project has made me more receptive for Europe’s multi-culturality 85.6*** 74.0
I now feel more as a European than before 69.7*** 62.7
I have established contacts with people in other countries which are useful for my involvement in social or political issues 64.9*** 54.6
The participation in the project has contributed to my personal development 92.5** 91.7
I have learned better how to plan and organise a project 76.6 80.1*** Significant (*), very significant (**) or highly significant (***) differences according to the Mann-Whitney-U-Test.
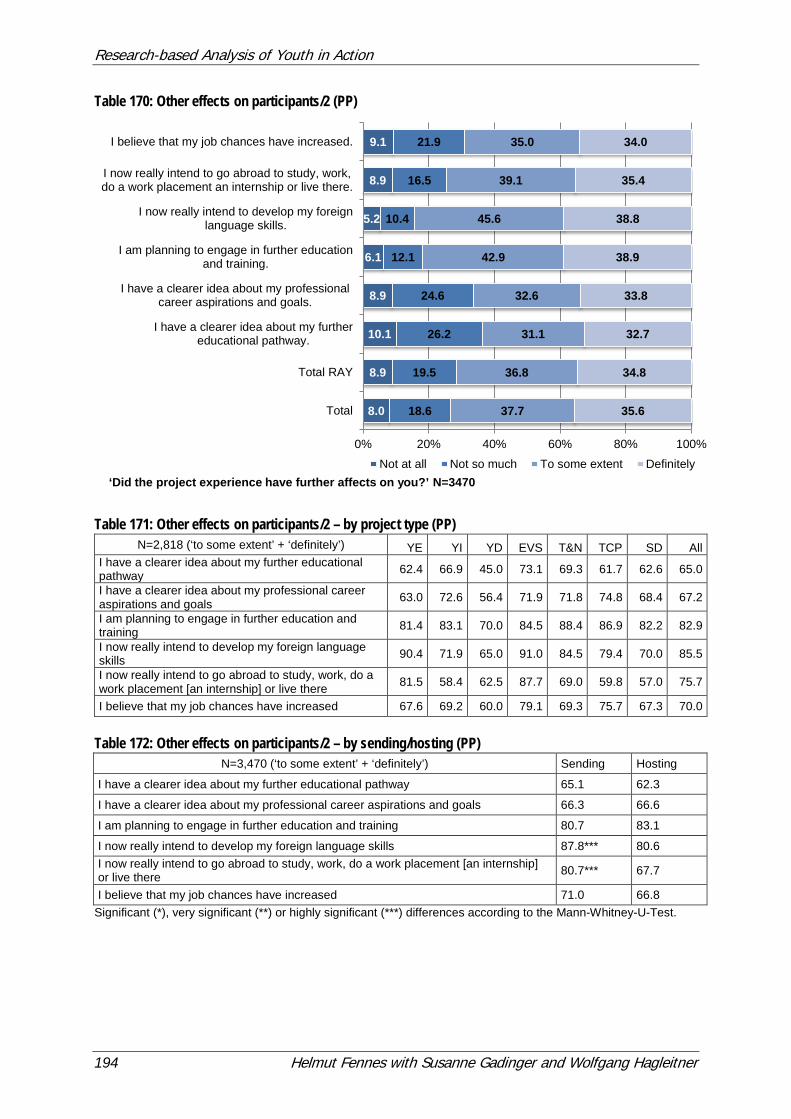
Research-based Analysis of Youth in Action
194 Helmut Fennes with Susanne Gadinger and Wolfgang Hagleitner
Table 170: Other effects on participants/2 (PP)
Table 171: Other effects on participants/2 – by project type (PP)
N=2,818 (‘to some extent’ + ‘definitely’) YE YI YD EVS T&N TCP SD All I have a clearer idea about my further educational pathway 62.4 66.9 45.0 73.1 69.3 61.7 62.6 65.0
I have a clearer idea about my professional career aspirations and goals 63.0 72.6 56.4 71.9 71.8 74.8 68.4 67.2
I am planning to engage in further education and training 81.4 83.1 70.0 84.5 88.4 86.9 82.2 82.9
I now really intend to develop my foreign language skills 90.4 71.9 65.0 91.0 84.5 79.4 70.0 85.5
I now really intend to go abroad to study, work, do a work placement [an internship] or live there 81.5 58.4 62.5 87.7 69.0 59.8 57.0 75.7
I believe that my job chances have increased 67.6 69.2 60.0 79.1 69.3 75.7 67.3 70.0
Table 172: Other effects on participants/2 – by sending/hosting (PP)
N=3,470 (‘to some extent’ + ‘definitely’) Sending Hosting
I have a clearer idea about my further educational pathway 65.1 62.3
I have a clearer idea about my professional career aspirations and goals 66.3 66.6
I am planning to engage in further education and training 80.7 83.1
I now really intend to develop my foreign language skills 87.8*** 80.6 I now really intend to go abroad to study, work, do a work placement [an internship] or live there 80.7*** 67.7
I believe that my job chances have increased 71.0 66.8 Significant (*), very significant (**) or highly significant (***) differences according to the Mann-Whitney-U-Test.
8.0
8.9
10.1
8.9
6.1
5.2
8.9
9.1
18.6
19.5
26.2
24.6
12.1
10.4
16.5
21.9
37.7
36.8
31.1
32.6
42.9
45.6
39.1
35.0
35.6
34.8
32.7
33.8
38.9
38.8
35.4
34.0
0% 20% 40% 60% 80% 100%
Total
Total RAY
I have a clearer idea about my furthereducational pathway.
I have a clearer idea about my professionalcareer aspirations and goals.
I am planning to engage in further educationand training.
I now really intend to develop my foreignlanguage skills.
I now really intend to go abroad to study, work,do a work placement an internship or live there.
I believe that my job chances have increased.
‘Did the project experience have further affects on you?’ N=3470 Not at all Not so much To some extent Definitely
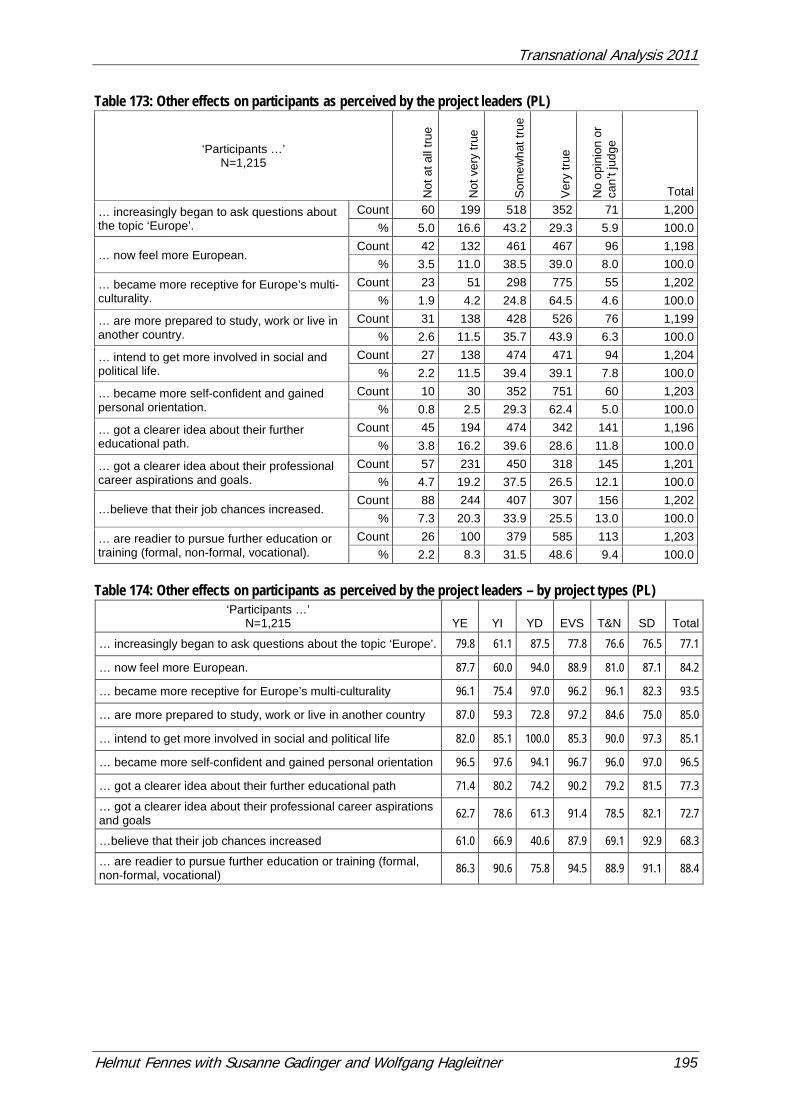
Transnational Analysis 2011
Helmut Fennes with Susanne Gadinger and Wolfgang Hagleitner 195
Table 173: Other effects on participants as perceived by the project leaders (PL)
‘Participants …’ N=1,215
Not
at a
ll tru
e
Not
ver
y tru
e
Som
ewha
t tru
e
Ver
y tru
e
No
opin
ion
or
can’
t jud
ge
Total
… increasingly began to ask questions about the topic ‘Europe’.
Count 60 199 518 352 71 1,200 % 5.0 16.6 43.2 29.3 5.9 100.0
… now feel more European. Count 42 132 461 467 96 1,198
% 3.5 11.0 38.5 39.0 8.0 100.0
… became more receptive for Europe’s multi-culturality.
Count 23 51 298 775 55 1,202 % 1.9 4.2 24.8 64.5 4.6 100.0
… are more prepared to study, work or live in another country.
Count 31 138 428 526 76 1,199 % 2.6 11.5 35.7 43.9 6.3 100.0
… intend to get more involved in social and political life.
Count 27 138 474 471 94 1,204 % 2.2 11.5 39.4 39.1 7.8 100.0
… became more self-confident and gained personal orientation.
Count 10 30 352 751 60 1,203 % 0.8 2.5 29.3 62.4 5.0 100.0
… got a clearer idea about their further educational path.
Count 45 194 474 342 141 1,196 % 3.8 16.2 39.6 28.6 11.8 100.0
… got a clearer idea about their professional career aspirations and goals.
Count 57 231 450 318 145 1,201 % 4.7 19.2 37.5 26.5 12.1 100.0
…believe that their job chances increased. Count 88 244 407 307 156 1,202
% 7.3 20.3 33.9 25.5 13.0 100.0
… are readier to pursue further education or training (formal, non-formal, vocational).
Count 26 100 379 585 113 1,203 % 2.2 8.3 31.5 48.6 9.4 100.0
Table 174: Other effects on participants as perceived by the project leaders – by project types (PL)
‘Participants …’ N=1,215 YE YI YD EVS T&N SD Total
… increasingly began to ask questions about the topic ‘Europe’. 79.8 61.1 87.5 77.8 76.6 76.5 77.1
… now feel more European. 87.7 60.0 94.0 88.9 81.0 87.1 84.2
… became more receptive for Europe’s multi-culturality 96.1 75.4 97.0 96.2 96.1 82.3 93.5
… are more prepared to study, work or live in another country 87.0 59.3 72.8 97.2 84.6 75.0 85.0
… intend to get more involved in social and political life 82.0 85.1 100.0 85.3 90.0 97.3 85.1
… became more self-confident and gained personal orientation 96.5 97.6 94.1 96.7 96.0 97.0 96.5
… got a clearer idea about their further educational path 71.4 80.2 74.2 90.2 79.2 81.5 77.3 … got a clearer idea about their professional career aspirations and goals 62.7 78.6 61.3 91.4 78.5 82.1 72.7
…believe that their job chances increased 61.0 66.9 40.6 87.9 69.1 92.9 68.3 … are readier to pursue further education or training (formal, non-formal, vocational) 86.3 90.6 75.8 94.5 88.9 91.1 88.4
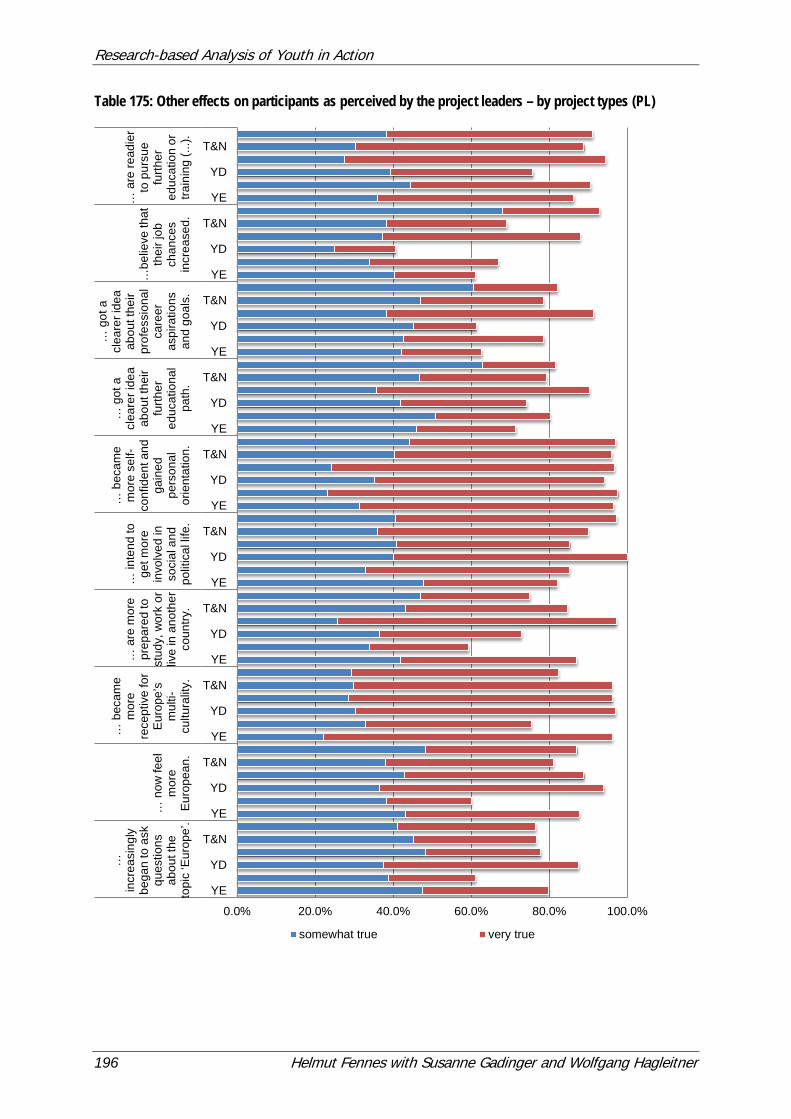
Research-based Analysis of Youth in Action
196 Helmut Fennes with Susanne Gadinger and Wolfgang Hagleitner
Table 175: Other effects on participants as perceived by the project leaders – by project types (PL)
0.0% 20.0% 40.0% 60.0% 80.0% 100.0%
YE
YD
T&N
YE
YD
T&N
YE
YD
T&N
YE
YD
T&N
YE
YD
T&N
YE
YD
T&N
YE
YD
T&N
YE
YD
T&N
YE
YD
T&N
YE
YD
T&N
…
incr
easi
ngly
be
gan
to a
sk
ques
tions
ab
out t
he
topi
c ‘E
urop
e’.
… n
ow fe
el
mor
e E
urop
ean.
… b
ecam
e m
ore
rece
ptiv
e fo
r E
urop
e’s
mul
ti-cu
ltura
lity.
… a
re m
ore
prep
ared
to
stud
y, w
ork
or
live
in a
noth
er
coun
try.
… in
tend
to
get m
ore
invo
lved
in
soci
al a
nd
polit
ical
life
.
… b
ecam
e m
ore
self-
conf
iden
t and
ga
ined
pe
rson
al
orie
ntat
ion.
… g
ot a
cl
eare
r ide
a ab
out t
heir
furth
er
educ
atio
nal
path
.
… g
ot a
cl
eare
r ide
a ab
out t
heir
prof
essi
onal
ca
reer
as
pira
tions
an
d go
als.
…be
lieve
that
th
eir j
ob
chan
ces
incr
ease
d.
… a
re re
adie
r to
pur
sue
furth
er
educ
atio
n or
tra
inin
g (..
.).
somewhat true very true
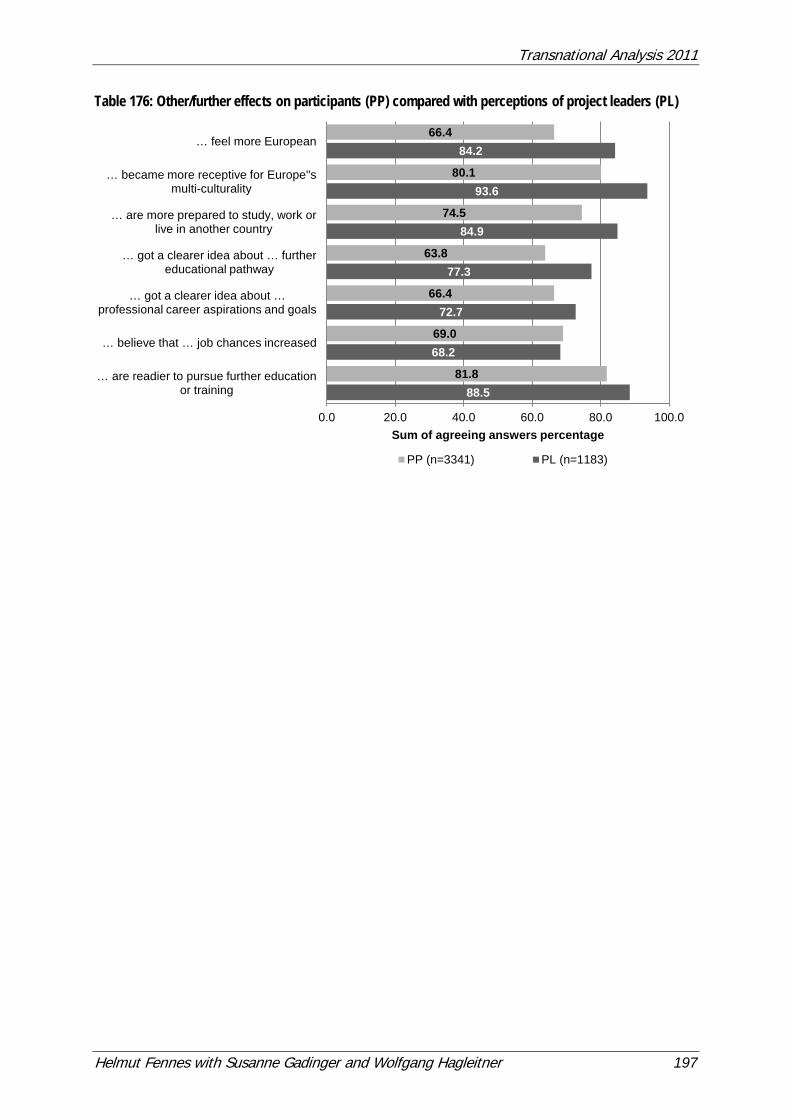
Transnational Analysis 2011
Helmut Fennes with Susanne Gadinger and Wolfgang Hagleitner 197
Table 176: Other/further effects on participants (PP) compared with perceptions of project leaders (PL)
88.5
68.2
72.7
77.3
84.9
93.6
84.2
81.8
69.0
66.4
63.8
74.5
80.1
66.4
0.0 20.0 40.0 60.0 80.0 100.0
… are readier to pursue further education or training
… believe that … job chances increased
… got a clearer idea about … professional career aspirations and goals
… got a clearer idea about … further educational pathway
… are more prepared to study, work or live in another country
… became more receptive for Europe''s multi-culturality
… feel more European
Sum of agreeing answers percentage
PP (n=3341) PL (n=1183)
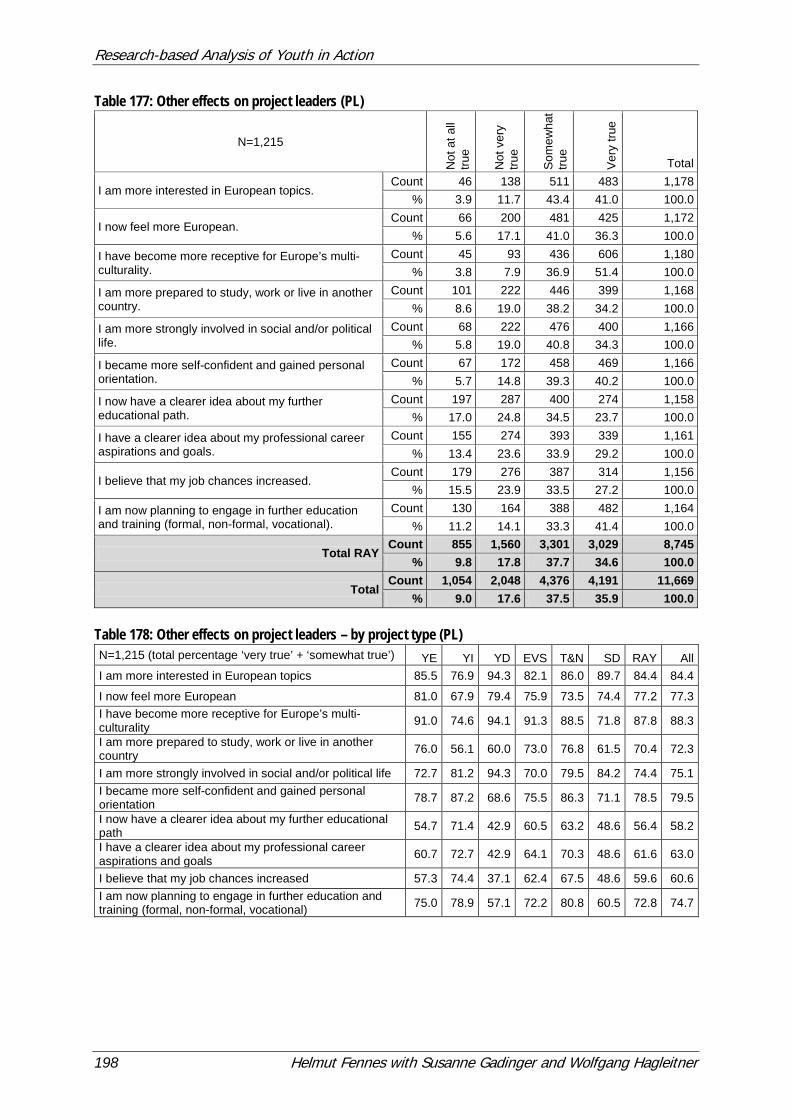
Research-based Analysis of Youth in Action
198 Helmut Fennes with Susanne Gadinger and Wolfgang Hagleitner
Table 177: Other effects on project leaders (PL)
N=1,215
Not
at a
ll tru
e
Not
ver
y tru
e
Som
ewha
t tru
e
Ver
y tru
e
Total
I am more interested in European topics. Count 46 138 511 483 1,178
% 3.9 11.7 43.4 41.0 100.0
I now feel more European. Count 66 200 481 425 1,172
% 5.6 17.1 41.0 36.3 100.0
I have become more receptive for Europe’s multi-culturality.
Count 45 93 436 606 1,180 % 3.8 7.9 36.9 51.4 100.0
I am more prepared to study, work or live in another country.
Count 101 222 446 399 1,168 % 8.6 19.0 38.2 34.2 100.0
I am more strongly involved in social and/or political life.
Count 68 222 476 400 1,166 % 5.8 19.0 40.8 34.3 100.0
I became more self-confident and gained personal orientation.
Count 67 172 458 469 1,166 % 5.7 14.8 39.3 40.2 100.0
I now have a clearer idea about my further educational path.
Count 197 287 400 274 1,158 % 17.0 24.8 34.5 23.7 100.0
I have a clearer idea about my professional career aspirations and goals.
Count 155 274 393 339 1,161 % 13.4 23.6 33.9 29.2 100.0
I believe that my job chances increased. Count 179 276 387 314 1,156
% 15.5 23.9 33.5 27.2 100.0
I am now planning to engage in further education and training (formal, non-formal, vocational).
Count 130 164 388 482 1,164 % 11.2 14.1 33.3 41.4 100.0
Total RAY Count 855 1,560 3,301 3,029 8,745
% 9.8 17.8 37.7 34.6 100.0
Total Count 1,054 2,048 4,376 4,191 11,669
% 9.0 17.6 37.5 35.9 100.0 Table 178: Other effects on project leaders – by project type (PL) N=1,215 (total percentage ‘very true’ + ‘somewhat true’) YE YI YD EVS T&N SD RAY All I am more interested in European topics 85.5 76.9 94.3 82.1 86.0 89.7 84.4 84.4
I now feel more European 81.0 67.9 79.4 75.9 73.5 74.4 77.2 77.3 I have become more receptive for Europe’s multi-culturality 91.0 74.6 94.1 91.3 88.5 71.8 87.8 88.3
I am more prepared to study, work or live in another country 76.0 56.1 60.0 73.0 76.8 61.5 70.4 72.3
I am more strongly involved in social and/or political life 72.7 81.2 94.3 70.0 79.5 84.2 74.4 75.1 I became more self-confident and gained personal orientation 78.7 87.2 68.6 75.5 86.3 71.1 78.5 79.5
I now have a clearer idea about my further educational path 54.7 71.4 42.9 60.5 63.2 48.6 56.4 58.2
I have a clearer idea about my professional career aspirations and goals 60.7 72.7 42.9 64.1 70.3 48.6 61.6 63.0
I believe that my job chances increased 57.3 74.4 37.1 62.4 67.5 48.6 59.6 60.6 I am now planning to engage in further education and training (formal, non-formal, vocational) 75.0 78.9 57.1 72.2 80.8 60.5 72.8 74.7
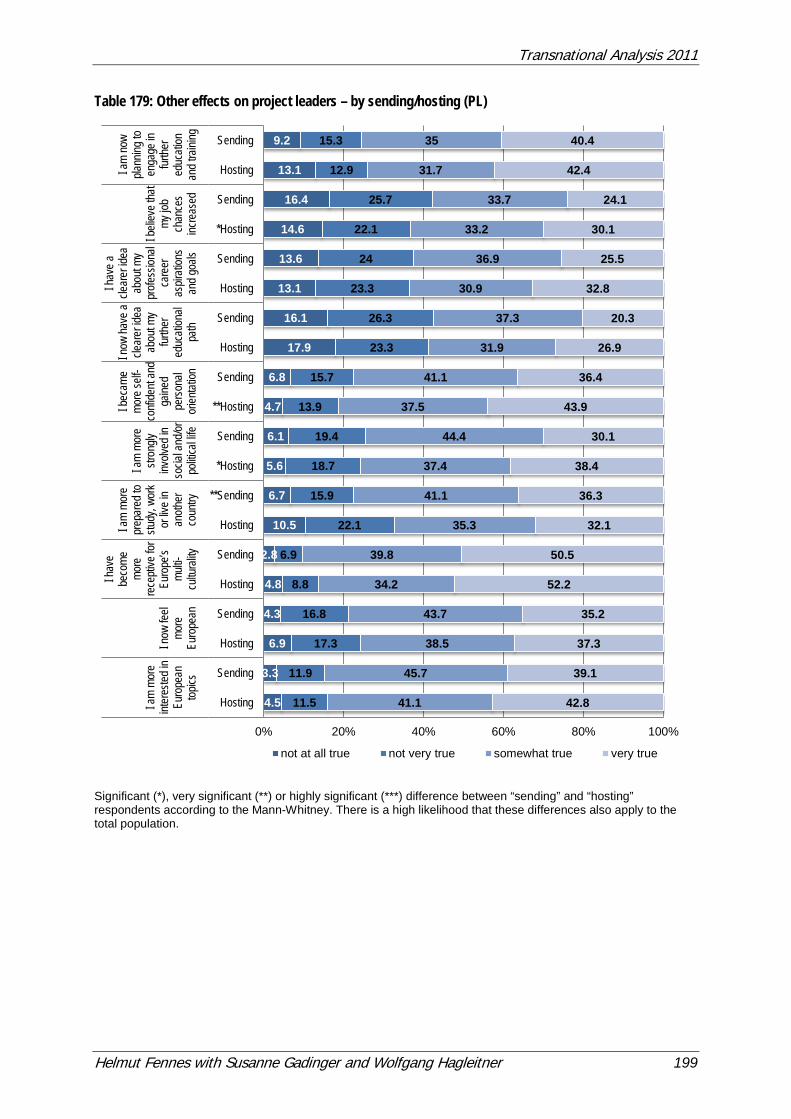
Transnational Analysis 2011
Helmut Fennes with Susanne Gadinger and Wolfgang Hagleitner 199
Table 179: Other effects on project leaders – by sending/hosting (PL)
Significant (*), very significant (**) or highly significant (***) difference between “sending” and “hosting” respondents according to the Mann-Whitney. There is a high likelihood that these differences also apply to the total population.
4.5
3.3
6.9
4.3
4.8
2.8
10.5
6.7
5.6
6.1
4.7
6.8
17.9
16.1
13.1
13.6
14.6
16.4
13.1
9.2
11.5
11.9
17.3
16.8
8.8
6.9
22.1
15.9
18.7
19.4
13.9
15.7
23.3
26.3
23.3
24
22.1
25.7
12.9
15.3
41.1
45.7
38.5
43.7
34.2
39.8
35.3
41.1
37.4
44.4
37.5
41.1
31.9
37.3
30.9
36.9
33.2
33.7
31.7
35
42.8
39.1
37.3
35.2
52.2
50.5
32.1
36.3
38.4
30.1
43.9
36.4
26.9
20.3
32.8
25.5
30.1
24.1
42.4
40.4
0% 20% 40% 60% 80% 100%
Hosting
Sending
Hosting
Sending
Hosting
Sending
Hosting
**Sending
*Hosting
Sending
**Hosting
Sending
Hosting
Sending
Hosting
Sending
*Hosting
Sending
Hosting
SendingI a
m mo
reint
eres
ted in
Euro
pean
topics
I now
feel
more
Euro
pean
I hav
e be
come
mo
re
rece
ptive
for
Euro
pe’s
multi-
cultu
rality
I am
more
prep
ared
tostu
dy, w
ork
or liv
e in
anoth
erco
untry
I am
more
stron
glyinv
olved
inso
cial a
nd/or
politi
cal li
fe
I bec
ame
more
self-
confi
dent
and
gaine
dpe
rsona
lor
ientat
ion
I now
have
acle
arer
idea
abou
t my
furthe
red
ucati
onal
path
I hav
e acle
arer
idea
abou
t my
profe
ssion
alca
reer
aspir
ation
san
d goa
ls
I beli
eve t
hat
my jo
bch
ance
sinc
reas
ed
I am
now
plann
ing to
enga
ge in
furthe
red
ucati
onan
d tra
ining
not at all true not very true somewhat true very true
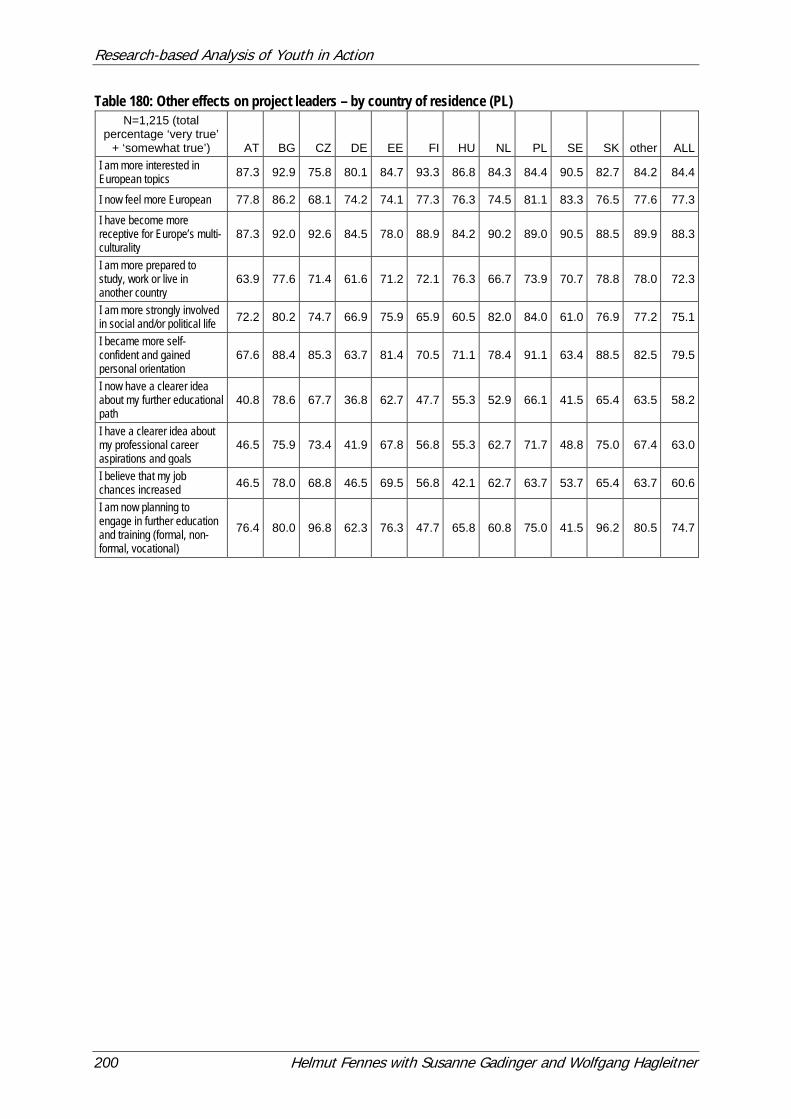
Research-based Analysis of Youth in Action
200 Helmut Fennes with Susanne Gadinger and Wolfgang Hagleitner
Table 180: Other effects on project leaders – by country of residence (PL) N=1,215 (total
percentage ‘very true’ + ‘somewhat true’) AT BG CZ DE EE FI HU NL PL SE SK other ALL
I am more interested in European topics 87.3 92.9 75.8 80.1 84.7 93.3 86.8 84.3 84.4 90.5 82.7 84.2 84.4
I now feel more European 77.8 86.2 68.1 74.2 74.1 77.3 76.3 74.5 81.1 83.3 76.5 77.6 77.3
I have become more receptive for Europe’s multi-culturality
87.3 92.0 92.6 84.5 78.0 88.9 84.2 90.2 89.0 90.5 88.5 89.9 88.3
I am more prepared to study, work or live in another country
63.9 77.6 71.4 61.6 71.2 72.1 76.3 66.7 73.9 70.7 78.8 78.0 72.3
I am more strongly involved in social and/or political life 72.2 80.2 74.7 66.9 75.9 65.9 60.5 82.0 84.0 61.0 76.9 77.2 75.1
I became more self-confident and gained personal orientation
67.6 88.4 85.3 63.7 81.4 70.5 71.1 78.4 91.1 63.4 88.5 82.5 79.5
I now have a clearer idea about my further educational path
40.8 78.6 67.7 36.8 62.7 47.7 55.3 52.9 66.1 41.5 65.4 63.5 58.2
I have a clearer idea about my professional career aspirations and goals
46.5 75.9 73.4 41.9 67.8 56.8 55.3 62.7 71.7 48.8 75.0 67.4 63.0
I believe that my job chances increased 46.5 78.0 68.8 46.5 69.5 56.8 42.1 62.7 63.7 53.7 65.4 63.7 60.6
I am now planning to engage in further education and training (formal, non-formal, vocational)
76.4 80.0 96.8 62.3 76.3 47.7 65.8 60.8 75.0 41.5 96.2 80.5 74.7
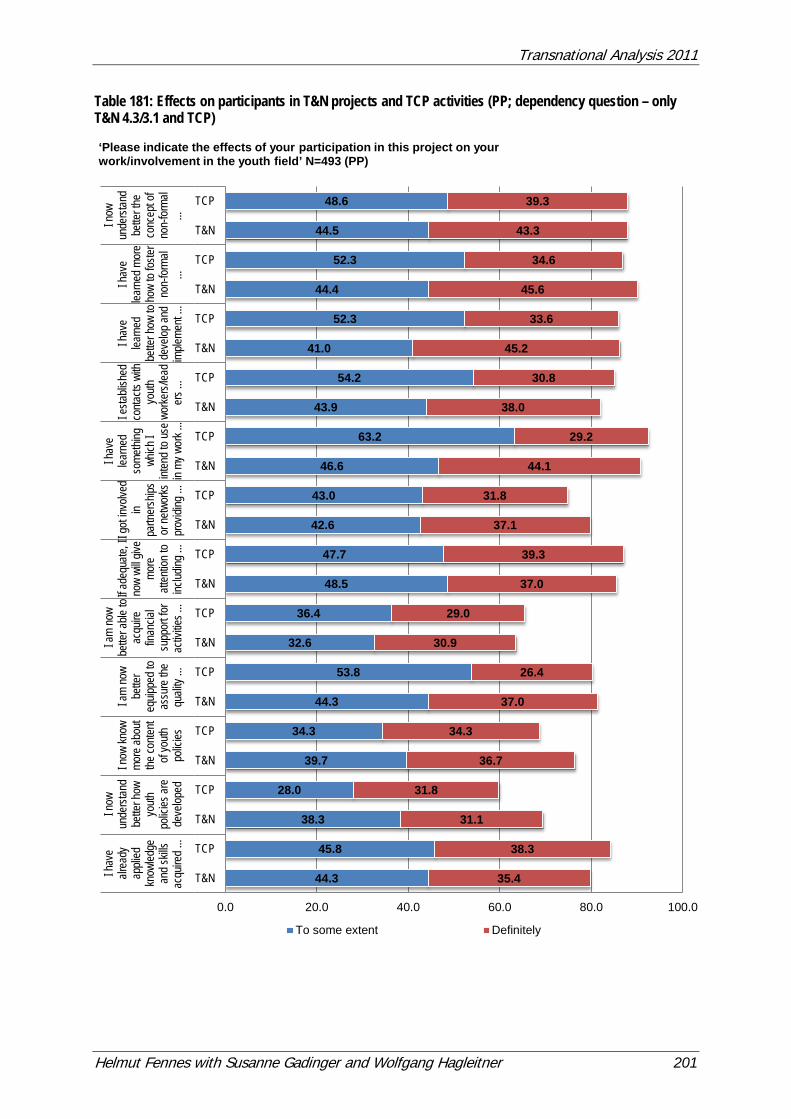
Transnational Analysis 2011
Helmut Fennes with Susanne Gadinger and Wolfgang Hagleitner 201
Table 181: Effects on participants in T&N projects and TCP activities (PP; dependency question – only T&N 4.3/3.1 and TCP)
44.3
45.8
38.3
28.0
39.7
34.3
44.3
53.8
32.6
36.4
48.5
47.7
42.6
43.0
46.6
63.2
43.9
54.2
41.0
52.3
44.4
52.3
44.5
48.6
35.4
38.3
31.1
31.8
36.7
34.3
37.0
26.4
30.9
29.0
37.0
39.3
37.1
31.8
44.1
29.2
38.0
30.8
45.2
33.6
45.6
34.6
43.3
39.3
0.0 20.0 40.0 60.0 80.0 100.0
T&N
TCP
T&N
TCP
T&N
TCP
T&N
TCP
T&N
TCP
T&N
TCP
T&N
TCP
T&N
TCP
T&N
TCP
T&N
TCP
T&N
TCP
T&N
TCP
I hav
e alr
eady
ap
plied
kn
owled
ge
and s
kills
acqu
ired …
I now
unde
rstan
dbe
tter h
owyo
uthpo
licies
are
deve
loped
I now
know
more
abou
tthe
conte
ntof
youth
polic
ies
I am
now
bette
r eq
uippe
d to
assu
re th
e qu
ality
…
I am
now
bette
r able
to
acqu
ire
finan
cial
supp
ort fo
r ac
tivitie
s … If a
dequ
ate, I
no
w wi
ll give
mo
re
atten
tion t
o inc
luding
… I g
ot inv
olved
in
partn
ersh
ips
or ne
twor
ks
prov
iding
…
I hav
elea
rned
some
thing
which
Iint
end t
o use
in my
wor
k ...I e
stabli
shed
co
ntacts
with
yo
uth
worke
rs/lea
der
s …
I hav
e lea
rned
be
tter h
ow to
de
velop
and
imple
ment
…
I hav
e lea
rned
mor
e ho
w to
foster
no
n-for
mal
…
I now
un
derst
and
bette
r the
co
ncep
t of
non-
forma
l …
‘Please indicate the effects of your participation in this project on your work/involvement in the youth field’ N=493 (PP)
To some extent Definitely
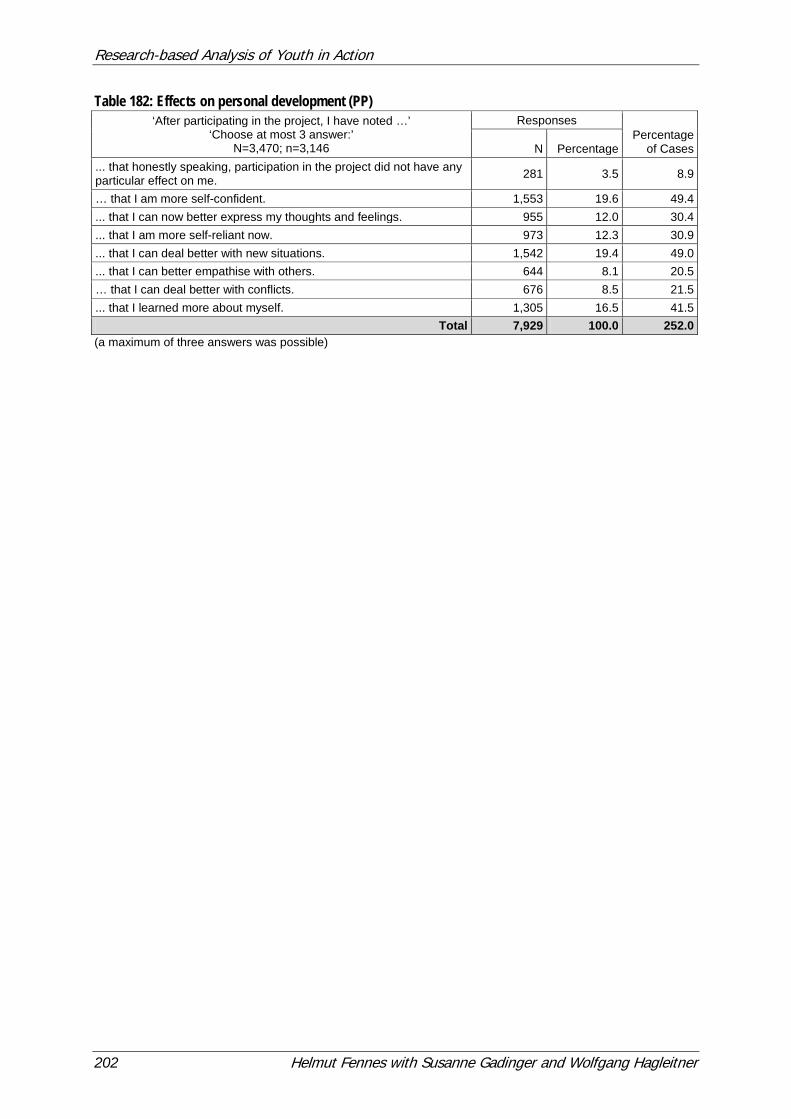
Research-based Analysis of Youth in Action
202 Helmut Fennes with Susanne Gadinger and Wolfgang Hagleitner
Table 182: Effects on personal development (PP) ‘After participating in the project, I have noted …’
‘Choose at most 3 answer:’ N=3,470; n=3,146
Responses Percentage
of Cases N Percentage ... that honestly speaking, participation in the project did not have any particular effect on me. 281 3.5 8.9
… that I am more self-confident. 1,553 19.6 49.4 ... that I can now better express my thoughts and feelings. 955 12.0 30.4 ... that I am more self-reliant now. 973 12.3 30.9 ... that I can deal better with new situations. 1,542 19.4 49.0 ... that I can better empathise with others. 644 8.1 20.5 … that I can deal better with conflicts. 676 8.5 21.5 ... that I learned more about myself. 1,305 16.5 41.5
Total 7,929 100.0 252.0 (a maximum of three answers was possible)
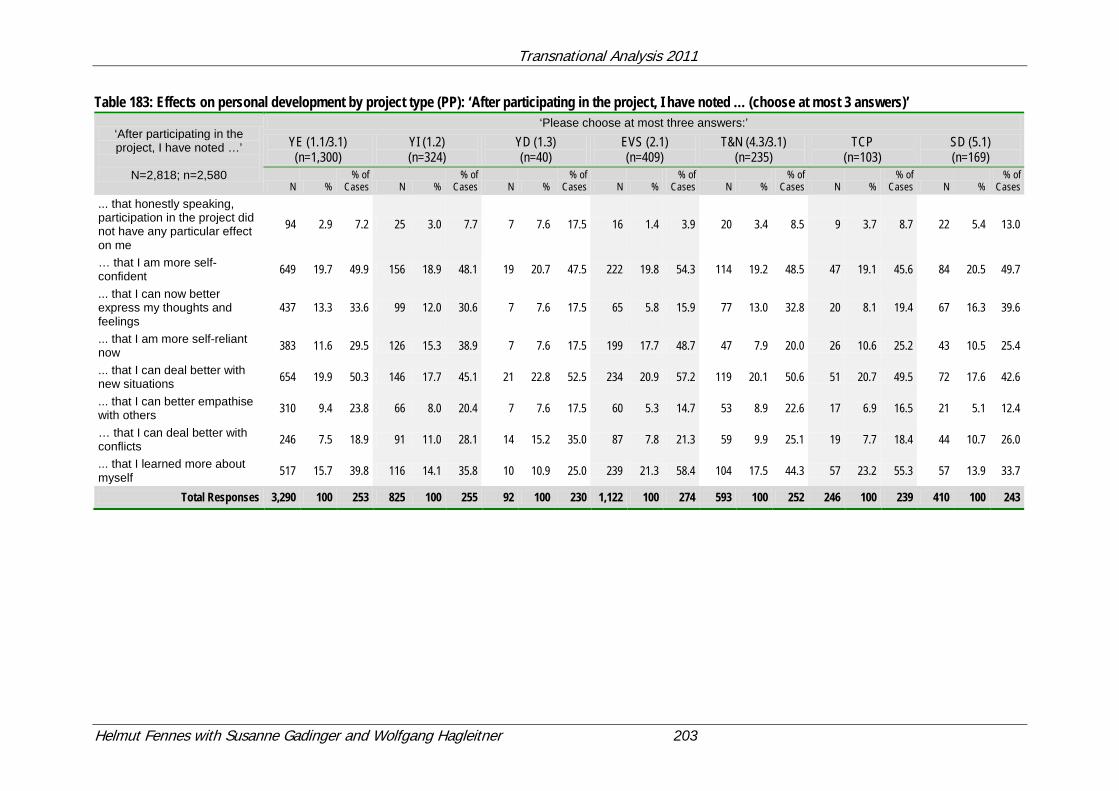
Transnational Analysis 2011
Helmut Fennes with Susanne Gadinger and Wolfgang Hagleitner 203
Table 183: Effects on personal development by project type (PP): ‘After participating in the project, I have noted … (choose at most 3 answers)’
‘After participating in the project, I have noted …’
N=2,818; n=2,580
‘Please choose at most three answers:’ YE (1.1/3.1) (n=1,300)
YI (1.2) (n=324)
YD (1.3) (n=40)
EVS (2.1) (n=409)
T&N (4.3/3.1) (n=235)
TCP (n=103)
SD (5.1) (n=169)
N % % of
Cases N % % of
Cases N % % of
Cases N % % of
Cases N % % of
Cases N % % of
Cases N % % of
Cases ... that honestly speaking, participation in the project did not have any particular effect on me
94 2.9 7.2 25 3.0 7.7 7 7.6 17.5 16 1.4 3.9 20 3.4 8.5 9 3.7 8.7 22 5.4 13.0
… that I am more self-confident 649 19.7 49.9 156 18.9 48.1 19 20.7 47.5 222 19.8 54.3 114 19.2 48.5 47 19.1 45.6 84 20.5 49.7
... that I can now better express my thoughts and feelings
437 13.3 33.6 99 12.0 30.6 7 7.6 17.5 65 5.8 15.9 77 13.0 32.8 20 8.1 19.4 67 16.3 39.6
... that I am more self-reliant now 383 11.6 29.5 126 15.3 38.9 7 7.6 17.5 199 17.7 48.7 47 7.9 20.0 26 10.6 25.2 43 10.5 25.4
... that I can deal better with new situations 654 19.9 50.3 146 17.7 45.1 21 22.8 52.5 234 20.9 57.2 119 20.1 50.6 51 20.7 49.5 72 17.6 42.6
... that I can better empathise with others 310 9.4 23.8 66 8.0 20.4 7 7.6 17.5 60 5.3 14.7 53 8.9 22.6 17 6.9 16.5 21 5.1 12.4
… that I can deal better with conflicts 246 7.5 18.9 91 11.0 28.1 14 15.2 35.0 87 7.8 21.3 59 9.9 25.1 19 7.7 18.4 44 10.7 26.0
... that I learned more about myself 517 15.7 39.8 116 14.1 35.8 10 10.9 25.0 239 21.3 58.4 104 17.5 44.3 57 23.2 55.3 57 13.9 33.7
Total Responses 3,290 100 253 825 100 255 92 100 230 1,122 100 274 593 100 252 246 100 239 410 100 243
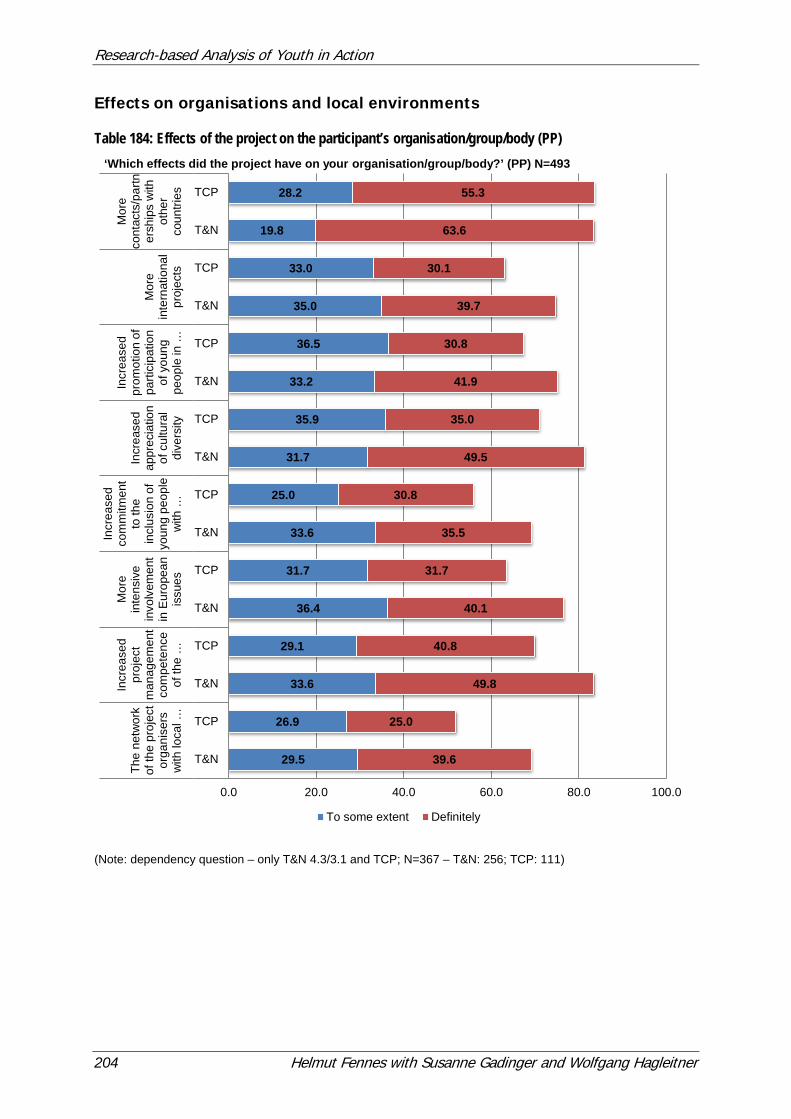
Research-based Analysis of Youth in Action
204 Helmut Fennes with Susanne Gadinger and Wolfgang Hagleitner
Effects on organisations and local environments Table 184: Effects of the project on the participant’s organisation/group/body (PP)
(Note: dependency question – only T&N 4.3/3.1 and TCP; N=367 – T&N: 256; TCP: 111)
29.5
26.9
33.6
29.1
36.4
31.7
33.6
25.0
31.7
35.9
33.2
36.5
35.0
33.0
19.8
28.2
39.6
25.0
49.8
40.8
40.1
31.7
35.5
30.8
49.5
35.0
41.9
30.8
39.7
30.1
63.6
55.3
0.0 20.0 40.0 60.0 80.0 100.0
T&N
TCP
T&N
TCP
T&N
TCP
T&N
TCP
T&N
TCP
T&N
TCP
T&N
TCP
T&N
TCP
The
netw
ork
of th
e pr
ojec
t or
gani
sers
w
ith lo
cal …
Incr
ease
d pr
ojec
t m
anag
emen
t co
mpe
tenc
e of
the
…
Mor
ein
tens
ive
invo
lvem
ent
in E
urop
ean
issu
es
Incr
ease
d co
mm
itmen
t to
the
incl
usio
n of
yo
ung
peop
le
with
…
Incr
ease
dap
prec
iatio
nof
cul
tura
ldi
vers
ity
Incr
ease
d pr
omot
ion
of
parti
cipa
tion
of y
oung
pe
ople
in …
Mor
ein
tern
atio
nal
proj
ects
Mor
eco
ntac
ts/p
artn
ersh
ips
with
othe
rco
untri
es‘Which effects did the project have on your organisation/group/body?’ (PP) N=493
To some extent Definitely
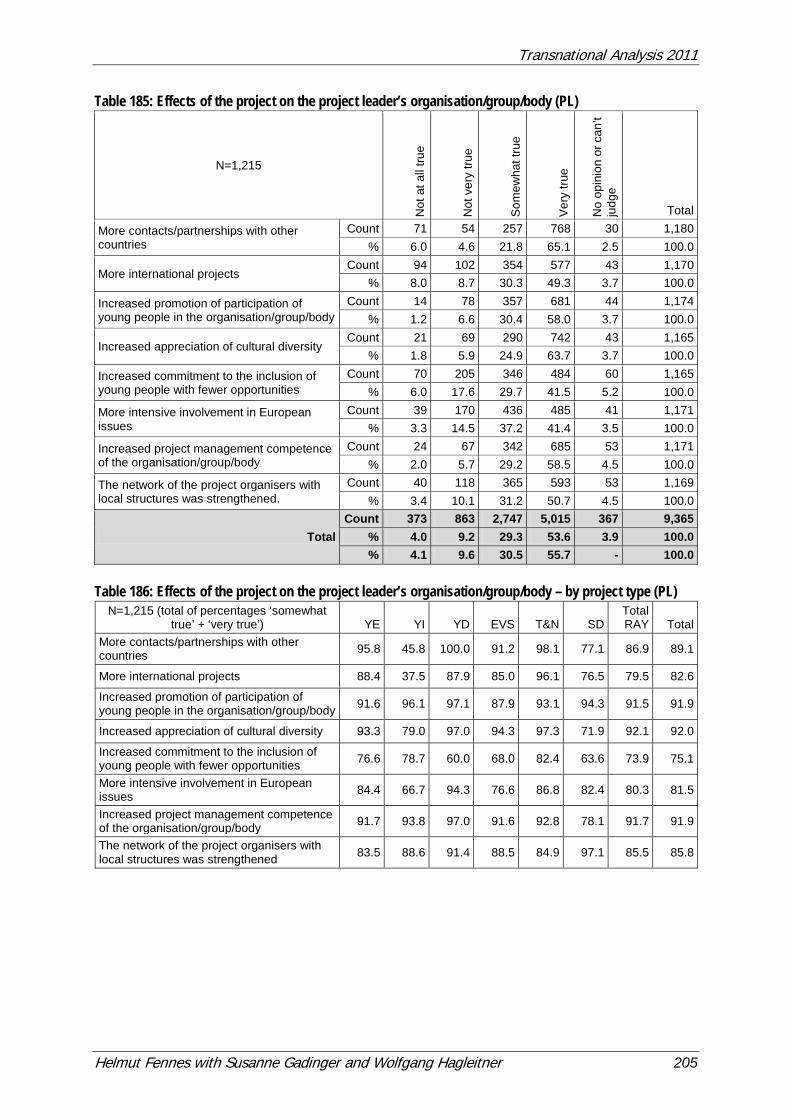
Transnational Analysis 2011
Helmut Fennes with Susanne Gadinger and Wolfgang Hagleitner 205
Table 185: Effects of the project on the project leader’s organisation/group/body (PL)
N=1,215
Not
at a
ll tru
e
Not
ver
y tru
e
Som
ewha
t tru
e
Ver
y tru
e
No
opin
ion
or c
an’t
judg
e
Total
More contacts/partnerships with other countries
Count 71 54 257 768 30 1,180 % 6.0 4.6 21.8 65.1 2.5 100.0
More international projects Count 94 102 354 577 43 1,170
% 8.0 8.7 30.3 49.3 3.7 100.0
Increased promotion of participation of young people in the organisation/group/body
Count 14 78 357 681 44 1,174 % 1.2 6.6 30.4 58.0 3.7 100.0
Increased appreciation of cultural diversity Count 21 69 290 742 43 1,165
% 1.8 5.9 24.9 63.7 3.7 100.0
Increased commitment to the inclusion of young people with fewer opportunities
Count 70 205 346 484 60 1,165 % 6.0 17.6 29.7 41.5 5.2 100.0
More intensive involvement in European issues
Count 39 170 436 485 41 1,171 % 3.3 14.5 37.2 41.4 3.5 100.0
Increased project management competence of the organisation/group/body
Count 24 67 342 685 53 1,171 % 2.0 5.7 29.2 58.5 4.5 100.0
The network of the project organisers with local structures was strengthened.
Count 40 118 365 593 53 1,169 % 3.4 10.1 31.2 50.7 4.5 100.0
Total Count 373 863 2,747 5,015 367 9,365
% 4.0 9.2 29.3 53.6 3.9 100.0 % 4.1 9.6 30.5 55.7 - 100.0
Table 186: Effects of the project on the project leader’s organisation/group/body – by project type (PL)
N=1,215 (total of percentages ‘somewhat true’ + ‘very true’) YE YI YD EVS T&N SD
Total RAY Total
More contacts/partnerships with other countries 95.8 45.8 100.0 91.2 98.1 77.1 86.9 89.1
More international projects 88.4 37.5 87.9 85.0 96.1 76.5 79.5 82.6
Increased promotion of participation of young people in the organisation/group/body 91.6 96.1 97.1 87.9 93.1 94.3 91.5 91.9
Increased appreciation of cultural diversity 93.3 79.0 97.0 94.3 97.3 71.9 92.1 92.0
Increased commitment to the inclusion of young people with fewer opportunities 76.6 78.7 60.0 68.0 82.4 63.6 73.9 75.1
More intensive involvement in European issues 84.4 66.7 94.3 76.6 86.8 82.4 80.3 81.5
Increased project management competence of the organisation/group/body 91.7 93.8 97.0 91.6 92.8 78.1 91.7 91.9
The network of the project organisers with local structures was strengthened 83.5 88.6 91.4 88.5 84.9 97.1 85.5 85.8
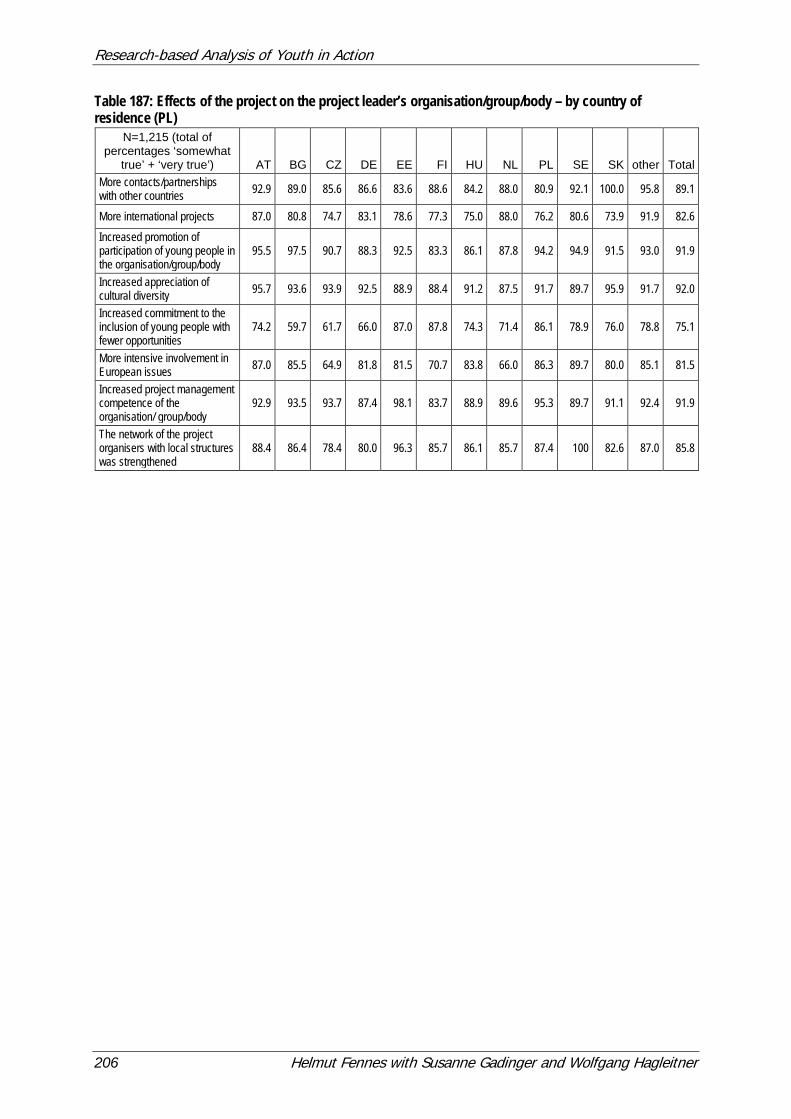
Research-based Analysis of Youth in Action
206 Helmut Fennes with Susanne Gadinger and Wolfgang Hagleitner
Table 187: Effects of the project on the project leader’s organisation/group/body – by country of residence (PL)
N=1,215 (total of percentages ‘somewhat
true’ + ‘very true’) AT BG CZ DE EE FI HU NL PL SE SK other Total More contacts/partnerships with other countries 92.9 89.0 85.6 86.6 83.6 88.6 84.2 88.0 80.9 92.1 100.0 95.8 89.1
More international projects 87.0 80.8 74.7 83.1 78.6 77.3 75.0 88.0 76.2 80.6 73.9 91.9 82.6 Increased promotion of participation of young people in the organisation/group/body
95.5 97.5 90.7 88.3 92.5 83.3 86.1 87.8 94.2 94.9 91.5 93.0 91.9
Increased appreciation of cultural diversity 95.7 93.6 93.9 92.5 88.9 88.4 91.2 87.5 91.7 89.7 95.9 91.7 92.0
Increased commitment to the inclusion of young people with fewer opportunities
74.2 59.7 61.7 66.0 87.0 87.8 74.3 71.4 86.1 78.9 76.0 78.8 75.1
More intensive involvement in European issues 87.0 85.5 64.9 81.8 81.5 70.7 83.8 66.0 86.3 89.7 80.0 85.1 81.5
Increased project management competence of the organisation/ group/body
92.9 93.5 93.7 87.4 98.1 83.7 88.9 89.6 95.3 89.7 91.1 92.4 91.9
The network of the project organisers with local structures was strengthened
88.4 86.4 78.4 80.0 96.3 85.7 86.1 85.7 87.4 100 82.6 87.0 85.8
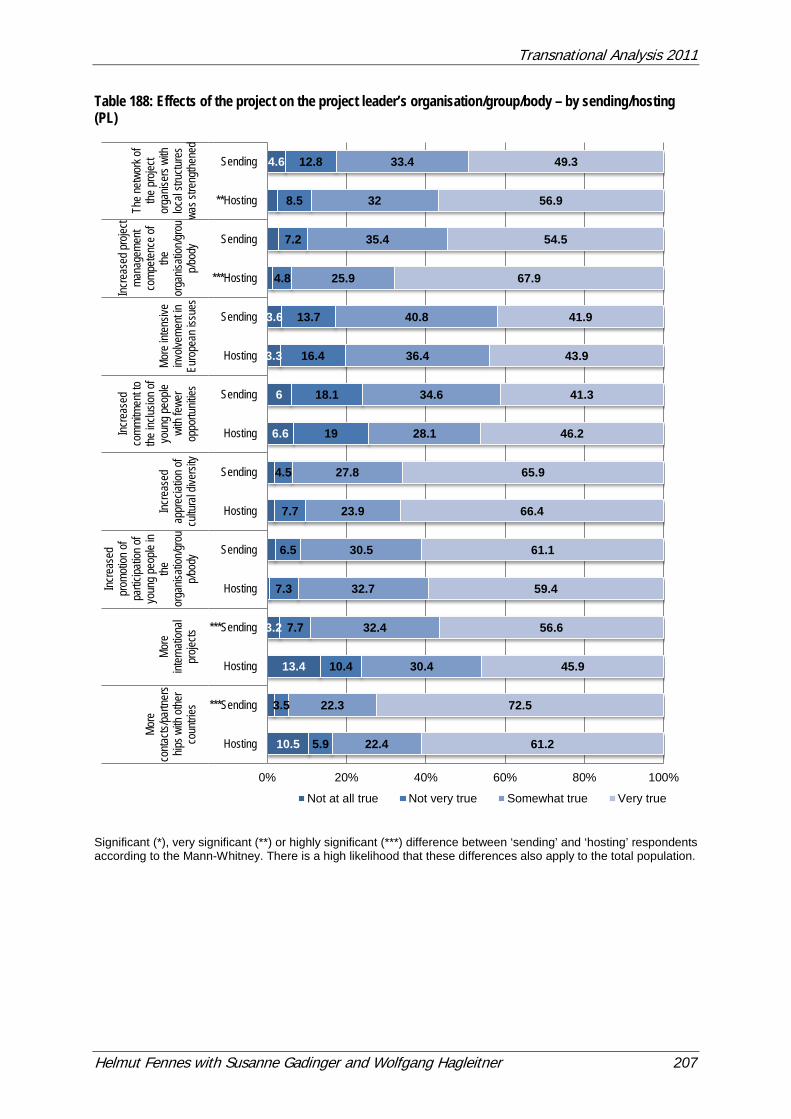
Transnational Analysis 2011
Helmut Fennes with Susanne Gadinger and Wolfgang Hagleitner 207
Table 188: Effects of the project on the project leader’s organisation/group/body – by sending/hosting (PL)
Significant (*), very significant (**) or highly significant (***) difference between ‘sending’ and ‘hosting’ respondents according to the Mann-Whitney. There is a high likelihood that these differences also apply to the total population.
10.5
13.4
3.2
6.6
6
3.3
3.6
4.6
5.9
3.5
10.4
7.7
7.3
6.5
7.7
4.5
19
18.1
16.4
13.7
4.8
7.2
8.5
12.8
22.4
22.3
30.4
32.4
32.7
30.5
23.9
27.8
28.1
34.6
36.4
40.8
25.9
35.4
32
33.4
61.2
72.5
45.9
56.6
59.4
61.1
66.4
65.9
46.2
41.3
43.9
41.9
67.9
54.5
56.9
49.3
0% 20% 40% 60% 80% 100%
Hosting
***Sending
Hosting
***Sending
Hosting
Sending
Hosting
Sending
Hosting
Sending
Hosting
Sending
***Hosting
Sending
**Hosting
SendingMo
reco
ntacts
/partn
ers
hips w
ith ot
her
coun
tries
More
inter
natio
nal
proje
cts
Incre
ased
prom
otion
ofpa
rticipa
tion o
fyo
ung p
eople
inthe
orga
nisati
on/gr
oup/b
ody
Incre
ased
appr
eciat
ion of
cultu
ral d
iversi
ty
Incre
ased
comm
itmen
t tothe
inclu
sion o
fyo
ung p
eople
with
fewer
oppo
rtunit
ies
More
inten
sive
involv
emen
t inEu
rope
an is
sues
Incre
ased
proje
ctma
nage
ment
comp
etenc
e of
theor
ganis
ation
/grou
p/bod
y
The n
etwor
k of
the pr
oject
orga
niser
s with
local
struc
tures
was s
treng
thene
d
Not at all true Not very true Somewhat true Very true
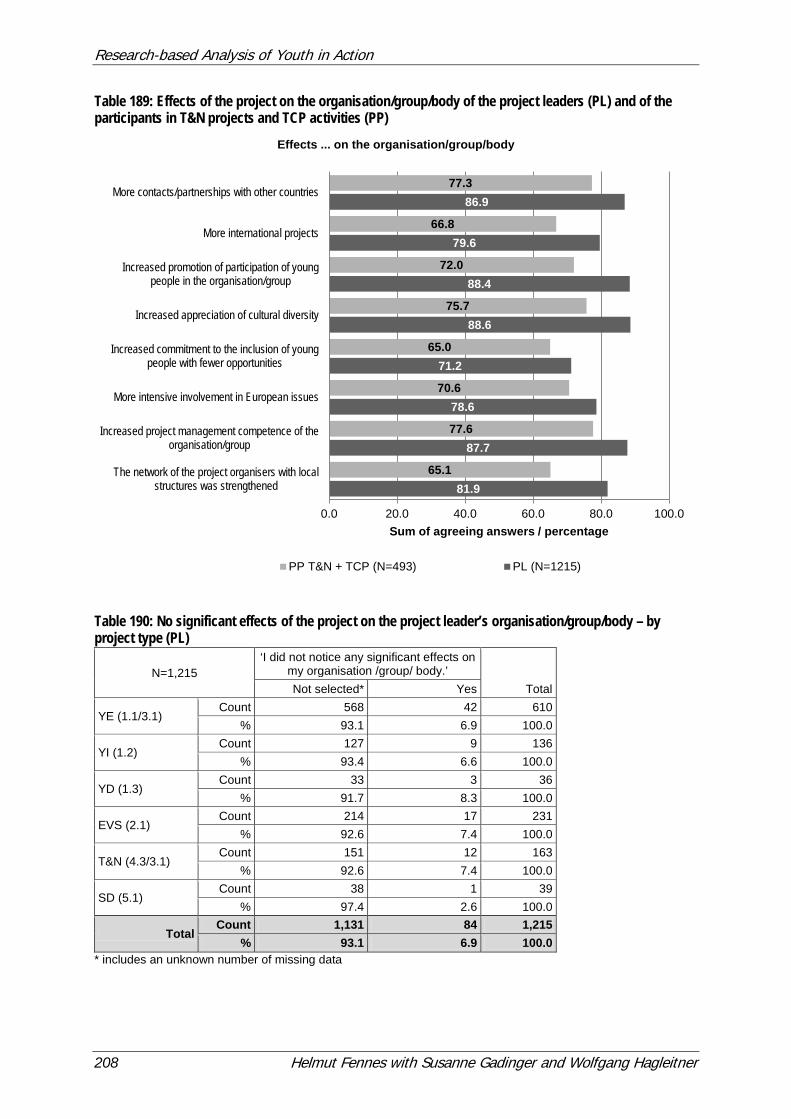
Research-based Analysis of Youth in Action
208 Helmut Fennes with Susanne Gadinger and Wolfgang Hagleitner
Table 189: Effects of the project on the organisation/group/body of the project leaders (PL) and of the participants in T&N projects and TCP activities (PP)
Table 190: No significant effects of the project on the project leader’s organisation/group/body – by project type (PL)
N=1,215 ‘I did not notice any significant effects on
my organisation /group/ body.’ Total Not selected* Yes
YE (1.1/3.1) Count 568 42 610
% 93.1 6.9 100.0
YI (1.2) Count 127 9 136
% 93.4 6.6 100.0
YD (1.3) Count 33 3 36
% 91.7 8.3 100.0
EVS (2.1) Count 214 17 231
% 92.6 7.4 100.0
T&N (4.3/3.1) Count 151 12 163
% 92.6 7.4 100.0
SD (5.1) Count 38 1 39
% 97.4 2.6 100.0
Total Count 1,131 84 1,215
% 93.1 6.9 100.0 * includes an unknown number of missing data
81.9
87.7
78.6
71.2
88.6
88.4
79.6
86.9
65.1
77.6
70.6
65.0
75.7
72.0
66.8
77.3
0.0 20.0 40.0 60.0 80.0 100.0
The network of the project organisers with localstructures was strengthened
Increased project management competence of theorganisation/group
More intensive involvement in European issues
Increased commitment to the inclusion of youngpeople with fewer opportunities
Increased appreciation of cultural diversity
Increased promotion of participation of youngpeople in the organisation/group
More international projects
More contacts/partnerships with other countries
Sum of agreeing answers / percentage
Effects ... on the organisation/group/body
PP T&N + TCP (N=493) PL (N=1215)
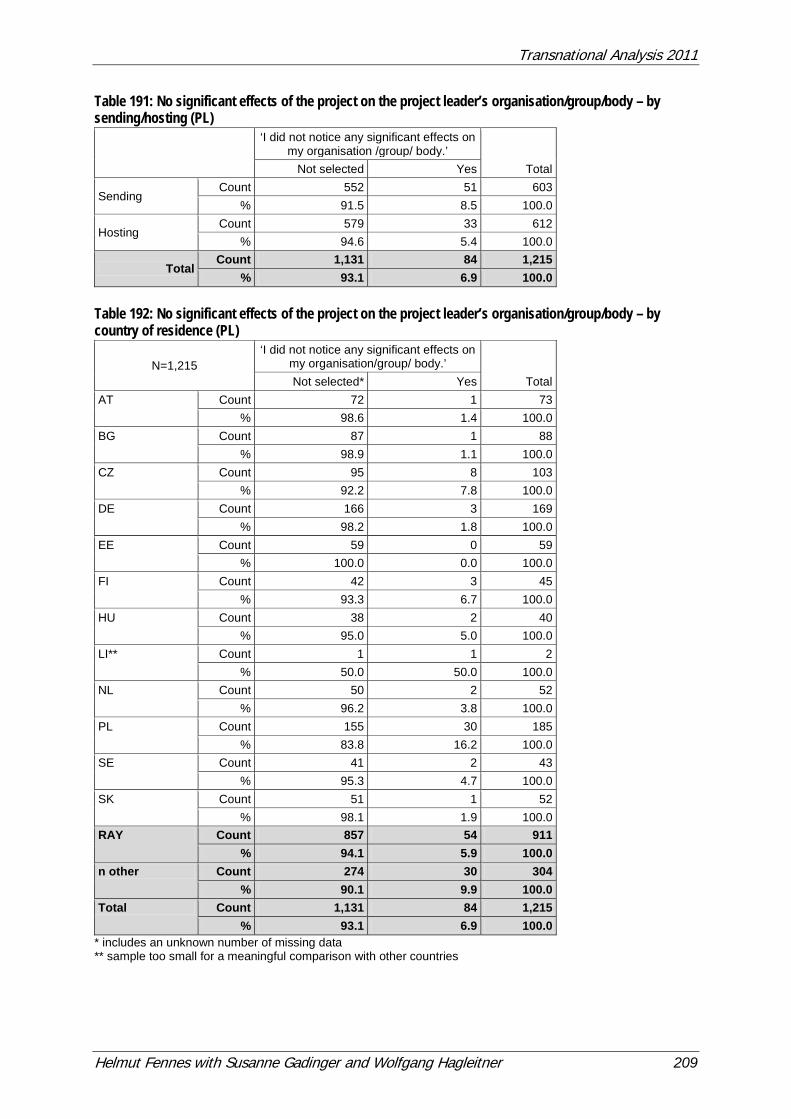
Transnational Analysis 2011
Helmut Fennes with Susanne Gadinger and Wolfgang Hagleitner 209
Table 191: No significant effects of the project on the project leader’s organisation/group/body – by sending/hosting (PL)
‘I did not notice any significant effects on
my organisation /group/ body.’ Total Not selected Yes
Sending Count 552 51 603
% 91.5 8.5 100.0
Hosting Count 579 33 612
% 94.6 5.4 100.0
Total Count 1,131 84 1,215
% 93.1 6.9 100.0 Table 192: No significant effects of the project on the project leader’s organisation/group/body – by country of residence (PL)
N=1,215 ‘I did not notice any significant effects on
my organisation/group/ body.’ Total Not selected* Yes
AT Count 72 1 73 % 98.6 1.4 100.0
BG Count 87 1 88 % 98.9 1.1 100.0
CZ Count 95 8 103 % 92.2 7.8 100.0
DE Count 166 3 169 % 98.2 1.8 100.0
EE Count 59 0 59 % 100.0 0.0 100.0
FI Count 42 3 45 % 93.3 6.7 100.0
HU Count 38 2 40 % 95.0 5.0 100.0
LI** Count 1 1 2 % 50.0 50.0 100.0
NL Count 50 2 52 % 96.2 3.8 100.0
PL Count 155 30 185 % 83.8 16.2 100.0
SE Count 41 2 43 % 95.3 4.7 100.0
SK Count 51 1 52 % 98.1 1.9 100.0
RAY Count 857 54 911 % 94.1 5.9 100.0
n other Count 274 30 304 % 90.1 9.9 100.0
Total Count 1,131 84 1,215 % 93.1 6.9 100.0
* includes an unknown number of missing data ** sample too small for a meaningful comparison with other countries
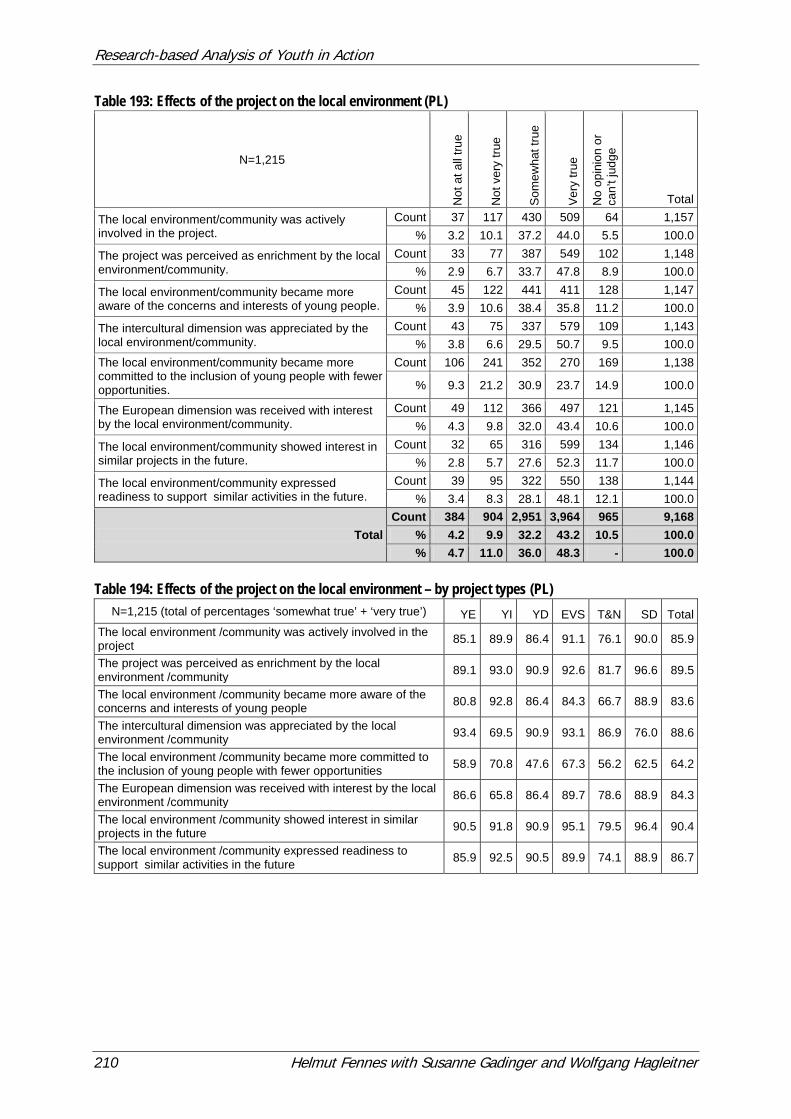
Research-based Analysis of Youth in Action
210 Helmut Fennes with Susanne Gadinger and Wolfgang Hagleitner
Table 193: Effects of the project on the local environment (PL)
N=1,215
Not
at a
ll tru
e
Not
ver
y tru
e
Som
ewha
t tru
e
Ver
y tru
e
No
opin
ion
or
can’
t jud
ge
Total
The local environment/community was actively involved in the project.
Count 37 117 430 509 64 1,157 % 3.2 10.1 37.2 44.0 5.5 100.0
The project was perceived as enrichment by the local environment/community.
Count 33 77 387 549 102 1,148 % 2.9 6.7 33.7 47.8 8.9 100.0
The local environment/community became more aware of the concerns and interests of young people.
Count 45 122 441 411 128 1,147 % 3.9 10.6 38.4 35.8 11.2 100.0
The intercultural dimension was appreciated by the local environment/community.
Count 43 75 337 579 109 1,143 % 3.8 6.6 29.5 50.7 9.5 100.0
The local environment/community became more committed to the inclusion of young people with fewer opportunities.
Count 106 241 352 270 169 1,138
% 9.3 21.2 30.9 23.7 14.9 100.0
The European dimension was received with interest by the local environment/community.
Count 49 112 366 497 121 1,145 % 4.3 9.8 32.0 43.4 10.6 100.0
The local environment/community showed interest in similar projects in the future.
Count 32 65 316 599 134 1,146 % 2.8 5.7 27.6 52.3 11.7 100.0
The local environment/community expressed readiness to support similar activities in the future.
Count 39 95 322 550 138 1,144 % 3.4 8.3 28.1 48.1 12.1 100.0
Total Count 384 904 2,951 3,964 965 9,168
% 4.2 9.9 32.2 43.2 10.5 100.0 % 4.7 11.0 36.0 48.3 - 100.0
Table 194: Effects of the project on the local environment – by project types (PL)
N=1,215 (total of percentages ‘somewhat true’ + ‘very true’) YE YI YD EVS T&N SD Total The local environment /community was actively involved in the project 85.1 89.9 86.4 91.1 76.1 90.0 85.9
The project was perceived as enrichment by the local environment /community 89.1 93.0 90.9 92.6 81.7 96.6 89.5
The local environment /community became more aware of the concerns and interests of young people 80.8 92.8 86.4 84.3 66.7 88.9 83.6
The intercultural dimension was appreciated by the local environment /community 93.4 69.5 90.9 93.1 86.9 76.0 88.6
The local environment /community became more committed to the inclusion of young people with fewer opportunities 58.9 70.8 47.6 67.3 56.2 62.5 64.2
The European dimension was received with interest by the local environment /community 86.6 65.8 86.4 89.7 78.6 88.9 84.3
The local environment /community showed interest in similar projects in the future 90.5 91.8 90.9 95.1 79.5 96.4 90.4
The local environment /community expressed readiness to support similar activities in the future 85.9 92.5 90.5 89.9 74.1 88.9 86.7
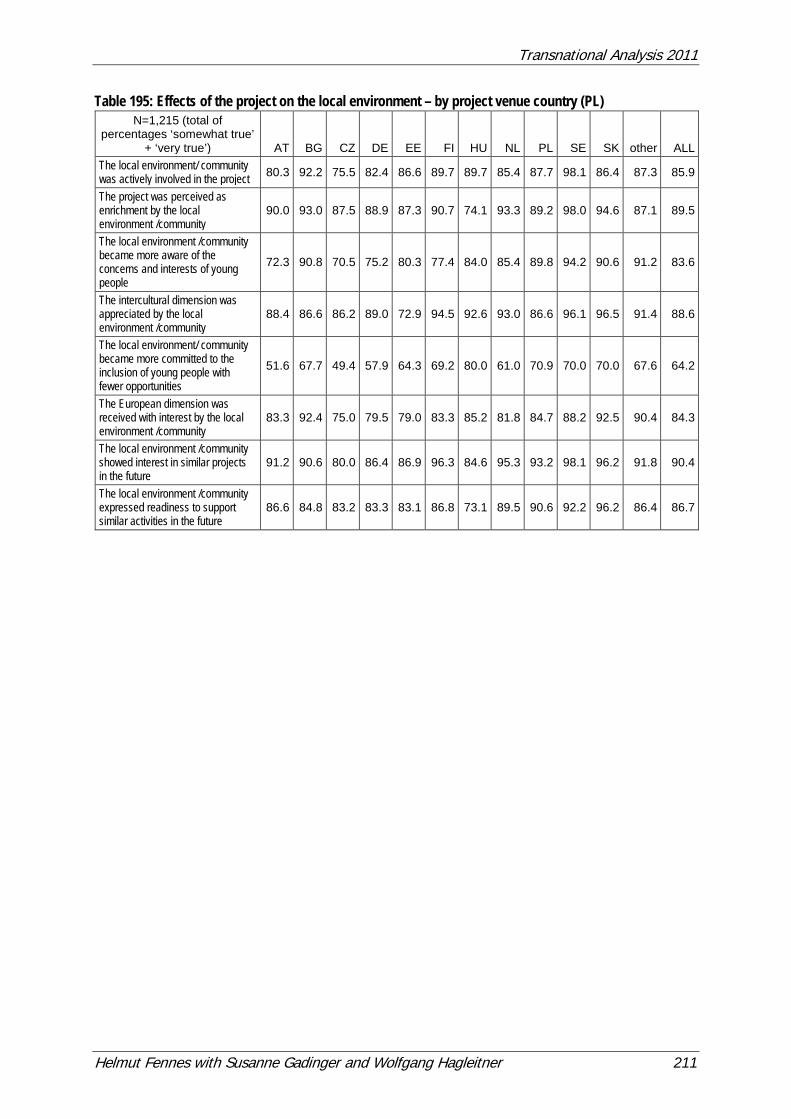
Transnational Analysis 2011
Helmut Fennes with Susanne Gadinger and Wolfgang Hagleitner 211
Table 195: Effects of the project on the local environment – by project venue country (PL) N=1,215 (total of
percentages ‘somewhat true’ + ‘very true’) AT BG CZ DE EE FI HU NL PL SE SK other ALL
The local environment/ community was actively involved in the project 80.3 92.2 75.5 82.4 86.6 89.7 89.7 85.4 87.7 98.1 86.4 87.3 85.9
The project was perceived as enrichment by the local environment /community
90.0 93.0 87.5 88.9 87.3 90.7 74.1 93.3 89.2 98.0 94.6 87.1 89.5
The local environment /community became more aware of the concerns and interests of young people
72.3 90.8 70.5 75.2 80.3 77.4 84.0 85.4 89.8 94.2 90.6 91.2 83.6
The intercultural dimension was appreciated by the local environment /community
88.4 86.6 86.2 89.0 72.9 94.5 92.6 93.0 86.6 96.1 96.5 91.4 88.6
The local environment/ community became more committed to the inclusion of young people with fewer opportunities
51.6 67.7 49.4 57.9 64.3 69.2 80.0 61.0 70.9 70.0 70.0 67.6 64.2
The European dimension was received with interest by the local environment /community
83.3 92.4 75.0 79.5 79.0 83.3 85.2 81.8 84.7 88.2 92.5 90.4 84.3
The local environment /community showed interest in similar projects in the future
91.2 90.6 80.0 86.4 86.9 96.3 84.6 95.3 93.2 98.1 96.2 91.8 90.4
The local environment /community expressed readiness to support similar activities in the future
86.6 84.8 83.2 83.3 83.1 86.8 73.1 89.5 90.6 92.2 96.2 86.4 86.7
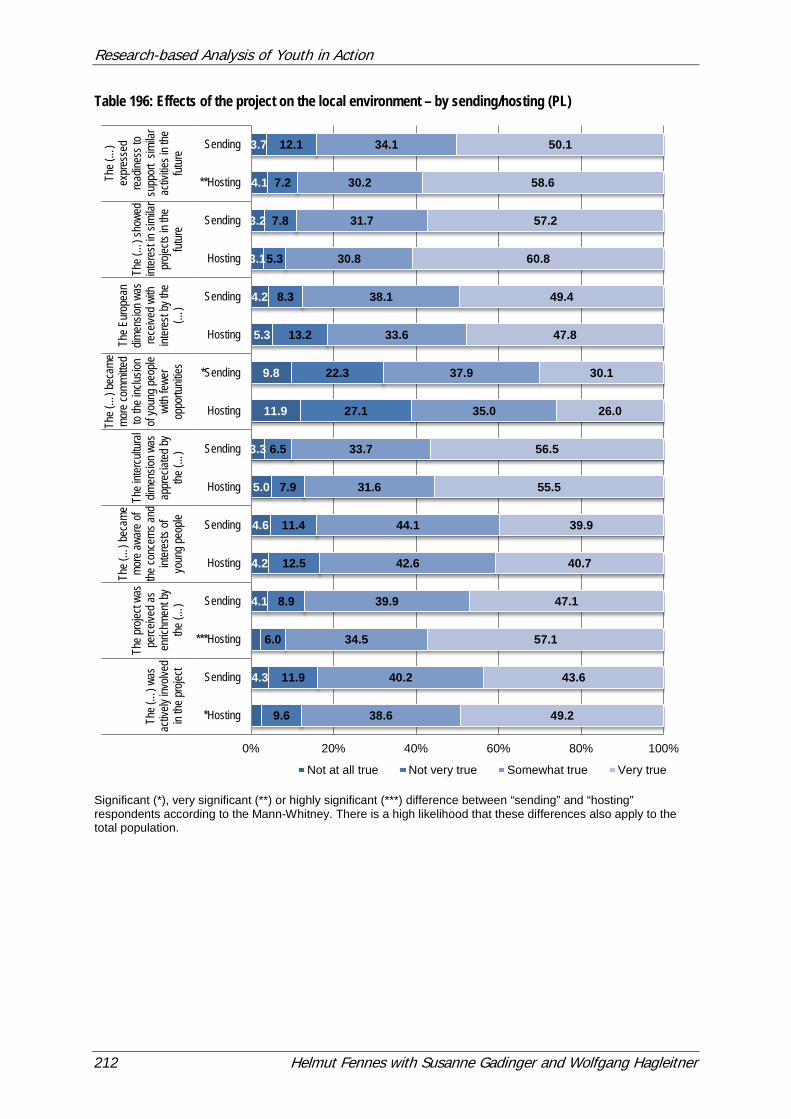
Research-based Analysis of Youth in Action
212 Helmut Fennes with Susanne Gadinger and Wolfgang Hagleitner
Table 196: Effects of the project on the local environment – by sending/hosting (PL)
Significant (*), very significant (**) or highly significant (***) difference between “sending” and “hosting” respondents according to the Mann-Whitney. There is a high likelihood that these differences also apply to the total population.
4.3
4.1
4.2
4.6
5.0
3.3
11.9
9.8
5.3
4.2
3.1
3.2
4.1
3.7
9.6
11.9
6.0
8.9
12.5
11.4
7.9
6.5
27.1
22.3
13.2
8.3
5.3
7.8
7.2
12.1
38.6
40.2
34.5
39.9
42.6
44.1
31.6
33.7
35.0
37.9
33.6
38.1
30.8
31.7
30.2
34.1
49.2
43.6
57.1
47.1
40.7
39.9
55.5
56.5
26.0
30.1
47.8
49.4
60.8
57.2
58.6
50.1
0% 20% 40% 60% 80% 100%
*Hosting
Sending
***Hosting
Sending
Hosting
Sending
Hosting
Sending
Hosting
*Sending
Hosting
Sending
Hosting
Sending
**Hosting
SendingTh
e (…
) was
ac
tively
invo
lved
in the
proje
ct
The p
rojec
t was
pe
rceive
d as
enric
hmen
t by
the (…
)
The (
…) b
ecam
e mo
re aw
are
of the
conc
erns
and
inter
ests
of yo
ung p
eople
The i
ntercu
ltura
l dim
ensio
n was
ap
prec
iated
by
the (…
)
The (
…) b
ecam
e mo
re co
mmitte
d to
the in
clusio
n of
youn
g peo
ple
with
fewer
op
portu
nities
The E
urop
ean
dimen
sion w
as
rece
ived w
ith
inter
est b
y the
(…
)
The (
…) s
howe
d int
eres
t in si
milar
pr
ojects
in th
e fut
ure
The (
…)
expr
esse
d re
adine
ss to
su
ppor
t sim
ilar
activ
ities i
n the
fut
ure
Not at all true Not very true Somewhat true Very true
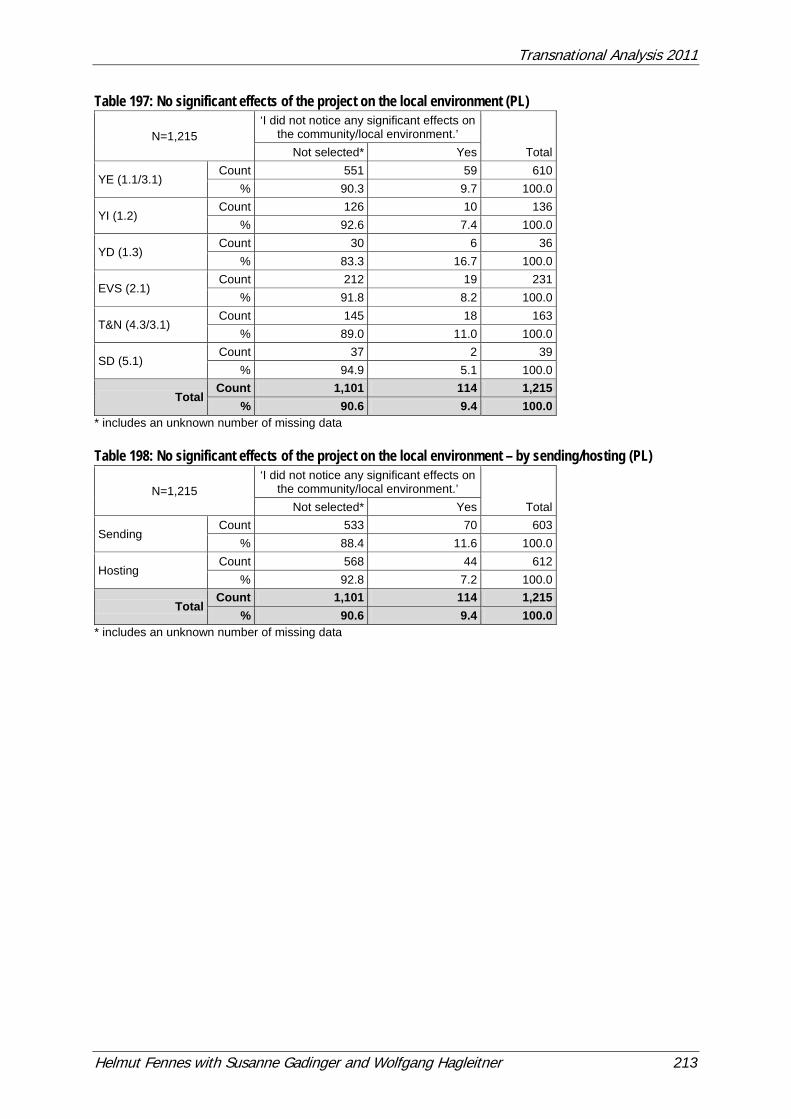
Transnational Analysis 2011
Helmut Fennes with Susanne Gadinger and Wolfgang Hagleitner 213
Table 197: No significant effects of the project on the local environment (PL)
N=1,215 ‘I did not notice any significant effects on
the community/local environment.’ Total Not selected* Yes
YE (1.1/3.1) Count 551 59 610
% 90.3 9.7 100.0
YI (1.2) Count 126 10 136
% 92.6 7.4 100.0
YD (1.3) Count 30 6 36
% 83.3 16.7 100.0
EVS (2.1) Count 212 19 231
% 91.8 8.2 100.0
T&N (4.3/3.1) Count 145 18 163
% 89.0 11.0 100.0
SD (5.1) Count 37 2 39
% 94.9 5.1 100.0
Total Count 1,101 114 1,215
% 90.6 9.4 100.0 * includes an unknown number of missing data Table 198: No significant effects of the project on the local environment – by sending/hosting (PL)
N=1,215 ‘I did not notice any significant effects on
the community/local environment.’ Total Not selected* Yes
Sending Count 533 70 603
% 88.4 11.6 100.0
Hosting Count 568 44 612
% 92.8 7.2 100.0
Total Count 1,101 114 1,215
% 90.6 9.4 100.0 * includes an unknown number of missing data
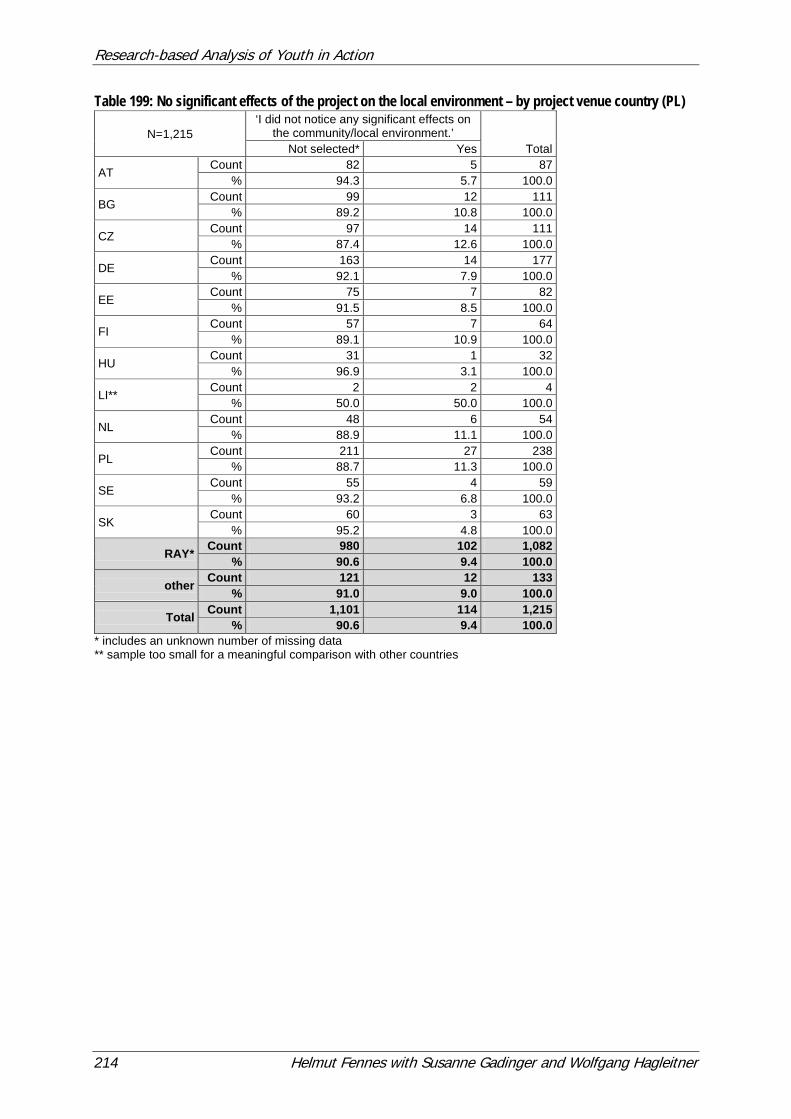
Research-based Analysis of Youth in Action
214 Helmut Fennes with Susanne Gadinger and Wolfgang Hagleitner
Table 199: No significant effects of the project on the local environment – by project venue country (PL)
N=1,215 ‘I did not notice any significant effects on
the community/local environment.’ Total Not selected* Yes
AT Count 82 5 87
% 94.3 5.7 100.0
BG Count 99 12 111 % 89.2 10.8 100.0
CZ Count 97 14 111
% 87.4 12.6 100.0
DE Count 163 14 177
% 92.1 7.9 100.0
EE Count 75 7 82
% 91.5 8.5 100.0
FI Count 57 7 64
% 89.1 10.9 100.0
HU Count 31 1 32
% 96.9 3.1 100.0
LI** Count 2 2 4 % 50.0 50.0 100.0
NL Count 48 6 54
% 88.9 11.1 100.0
PL Count 211 27 238
% 88.7 11.3 100.0
SE Count 55 4 59
% 93.2 6.8 100.0
SK Count 60 3 63
% 95.2 4.8 100.0
RAY* Count 980 102 1,082 % 90.6 9.4 100.0
other Count 121 12 133 % 91.0 9.0 100.0
Total Count 1,101 114 1,215 % 90.6 9.4 100.0
* includes an unknown number of missing data ** sample too small for a meaningful comparison with other countries
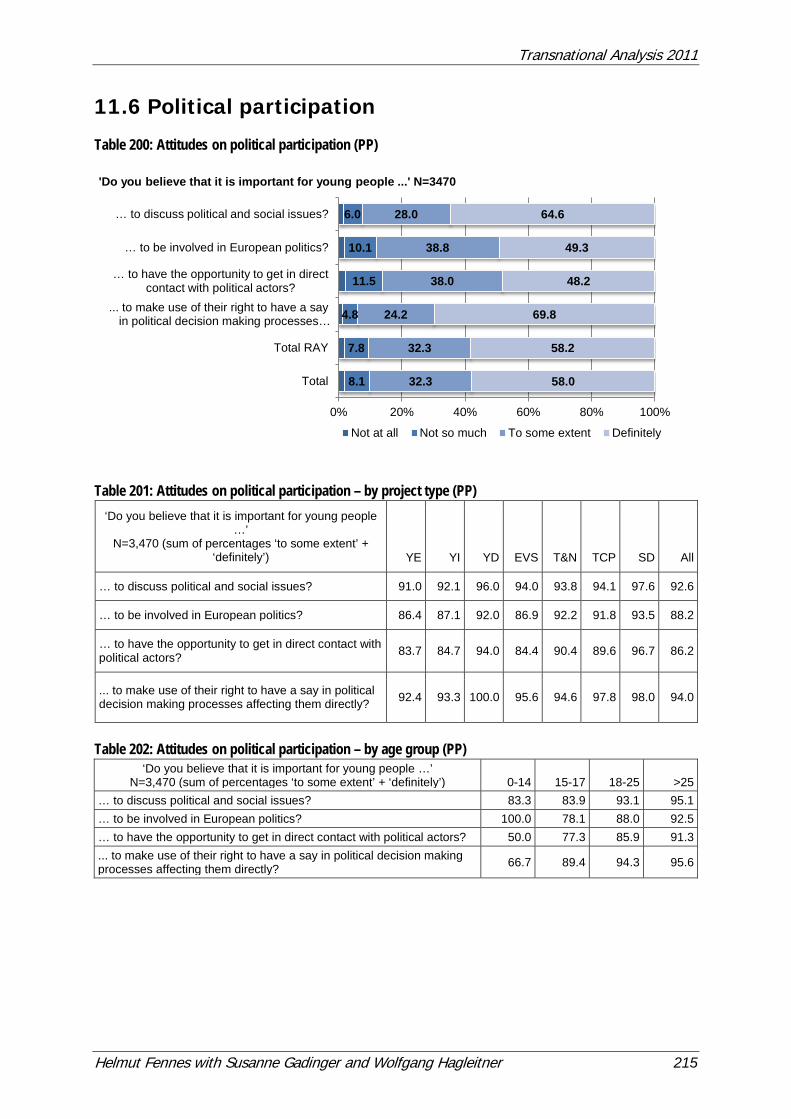
Transnational Analysis 2011
Helmut Fennes with Susanne Gadinger and Wolfgang Hagleitner 215
11.6 Political participation Table 200: Attitudes on political participation (PP)
Table 201: Attitudes on political participation – by project type (PP)
‘Do you believe that it is important for young people …’
N=3,470 (sum of percentages ‘to some extent’ + ‘definitely’) YE YI YD EVS T&N TCP SD All
… to discuss political and social issues? 91.0 92.1 96.0 94.0 93.8 94.1 97.6 92.6
… to be involved in European politics? 86.4 87.1 92.0 86.9 92.2 91.8 93.5 88.2
… to have the opportunity to get in direct contact with political actors? 83.7 84.7 94.0 84.4 90.4 89.6 96.7 86.2
... to make use of their right to have a say in political decision making processes affecting them directly? 92.4 93.3 100.0 95.6 94.6 97.8 98.0 94.0
Table 202: Attitudes on political participation – by age group (PP)
‘Do you believe that it is important for young people …’ N=3,470 (sum of percentages ‘to some extent’ + ‘definitely’) 0-14 15-17 18-25 >25
… to discuss political and social issues? 83.3 83.9 93.1 95.1 … to be involved in European politics? 100.0 78.1 88.0 92.5 … to have the opportunity to get in direct contact with political actors? 50.0 77.3 85.9 91.3 ... to make use of their right to have a say in political decision making processes affecting them directly? 66.7 89.4 94.3 95.6
8.1
7.8
4.8
11.5
10.1
6.0
32.3
32.3
24.2
38.0
38.8
28.0
58.0
58.2
69.8
48.2
49.3
64.6
0% 20% 40% 60% 80% 100%
Total
Total RAY
... to make use of their right to have a sayin political decision making processes…
… to have the opportunity to get in direct contact with political actors?
… to be involved in European politics?
… to discuss political and social issues?
'Do you believe that it is important for young people ...' N=3470
Not at all Not so much To some extent Definitely
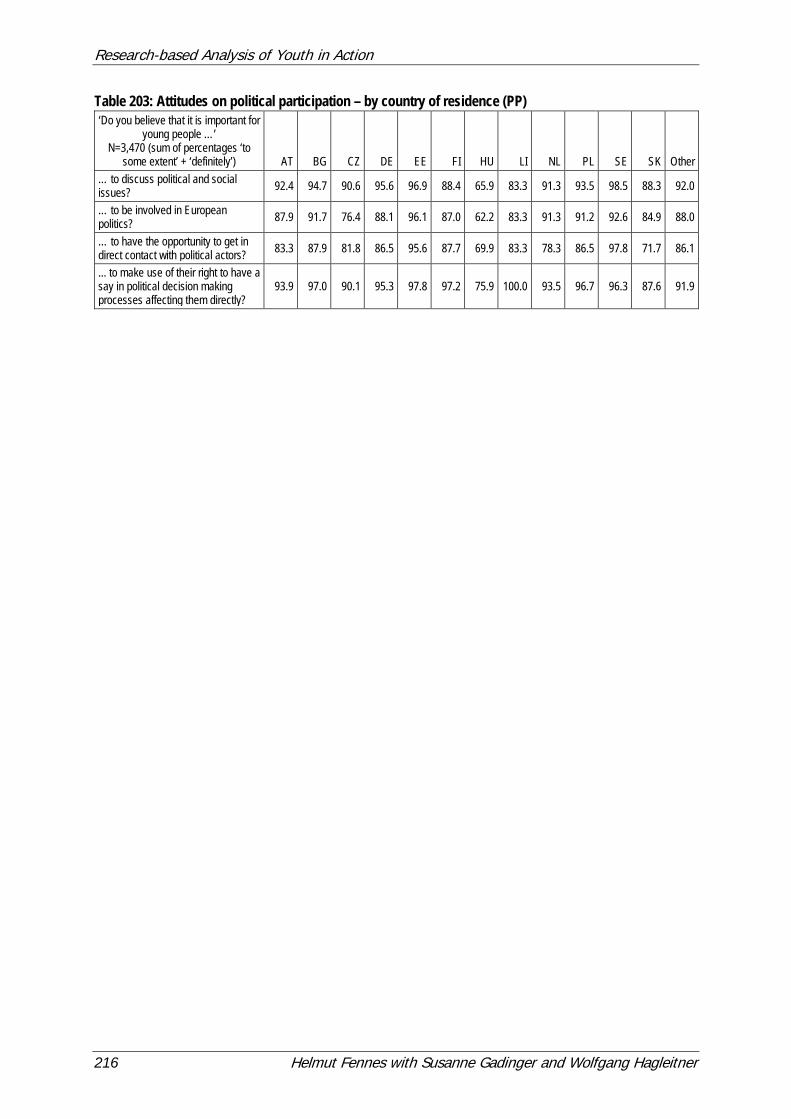
Research-based Analysis of Youth in Action
216 Helmut Fennes with Susanne Gadinger and Wolfgang Hagleitner
Table 203: Attitudes on political participation – by country of residence (PP) ‘Do you believe that it is important for
young people …’ N=3,470 (sum of percentages ‘to
some extent’ + ‘definitely’) AT BG CZ DE EE FI HU LI NL PL SE SK Other … to discuss political and social issues? 92.4 94.7 90.6 95.6 96.9 88.4 65.9 83.3 91.3 93.5 98.5 88.3 92.0
… to be involved in European politics? 87.9 91.7 76.4 88.1 96.1 87.0 62.2 83.3 91.3 91.2 92.6 84.9 88.0
… to have the opportunity to get in direct contact with political actors? 83.3 87.9 81.8 86.5 95.6 87.7 69.9 83.3 78.3 86.5 97.8 71.7 86.1
... to make use of their right to have a say in political decision making processes affecting them directly?
93.9 97.0 90.1 95.3 97.8 97.2 75.9 100.0 93.5 96.7 96.3 87.6 91.9
Transnational Analysis 2011
Helmut Fennes with Susanne Gadinger and Wolfgang Hagleitner 217
12 Appendix C – Youth in Action
12.1 Establishment of Youth in Action The YiA Programme was established and funded by the EU for the period 2007 to 2013 on the basis of a decision taken by the European Parliament and the Council in November 2006 (European Parliament and Council, 2006a). Predecessors of the YiA Programme were the Youth for Europe Programmes (1989–91, 1992–94 and 1995–99) and the Youth Programme (2000–06).
12.2 Programme objectives and priorities According to the YiA Programme Guide, “the Youth in Action Programme aims to respond at European level to the needs of young people from adolescence to adulthood. It makes an important contribution to the acquisition of competences and is therefore a key instrument in providing young people with opportunities for non-formal and informal learning with a European dimension.” (see European Commission, 2010, pp. 4–5) The programme follows five general objectives (see European Parliament and Council, 2006a):
a) “to promote young people’s active citizenship in general and their European citizenship in particular;
b) to develop solidarity and promote tolerance among young people, in particular in order to reinforce social cohesion in the EU;
c) to foster mutual understanding between young people in different countries; d) to contribute to developing the quality of support systems for youth activities and the
capabilities of civil society organisations in the youth field; e) to promote European cooperation in the youth field.”
The general objectives are complemented with permanent priorities and annual priorities, which should be implemented on a project level within the legal framework of the YiA Programme (see European Commission, 2010). The permanent priorities are: European citizenship: “Making young people aware that they are European citizens is a
priority of the Youth in Action Programme. The objective is to encourage young people to reflect on European topics and to involve them in the discussion on the construction and the future of the European Union.”
Participation of young people: “A main priority of the Youth in Action Programme is the active participation of young people in their daily life. The overall aim is to encourage young people to be active citizens.”
Cultural diversity: “The respect for cultural diversity together with the fight against racism and xenophobia are priorities of the Youth in Action Programme. By facilitating joint activities of young people from different cultural, ethnic and religious backgrounds, the Programme aims to develop the intercultural learning of young people.”
Inclusion of young people with fewer opportunities: “An important priority for the European Union is to give access to all young people, including young people with fewer opportunities, to the Youth in Action Programme.”
Research-based Analysis of Youth in Action
218 Helmut Fennes with Susanne Gadinger and Wolfgang Hagleitner
Annual priorities are defined in addition to the permanent priorities. The annual priorities for 2009 (the year during which most of the surveyed projects took place) were the following:51 European Year of Creativity and Innovation; Young people’s active participation in the European Parliament elections; Combating violence against women; Sport as a tool to promote active citizenship and social inclusion of young people; Promoting healthy lifestyles through physical activities including sport; Promoting the inclusion of young people with disabilities; Awareness-raising around global challenges (such as sustainable development and climate
change); Young people’s involvement in the revision of the European framework of cooperation
in the field of youth policy; Intercultural dialogue.
12.3 Actions and sub-Actions The implementation of YiA objectives and priorities is realised at the project level. The projects are promoted and funded within five action lines. Most of the projects are funded in a decentralised way through the National Agencies of the YiA Programme. Only projects under ‘decentralised’ actions were analysed as part of RAY. A rather small proportion of projects have to be applied for and are funded through the Education, Audio-visual and Culture Executive Agency (EACEA) at European level and were not analysed as part of the present study. The following boxes provide an overview of the ‘decentralised’ actions and sub-Actions funded through the National Agencies (see European Commission, 2010). Action 1 – Youth for Europe (Sub-)Action 1.1 – Youth Exchanges, which offer an opportunity for groups of young people from different countries to meet and learn about each other’s cultures. (Sub-)Action 1.2 – Youth Initiatives, which support group projects designed at local, regional and national levels. (Sub-)Action 1.3 – Youth Democracy Projects, which support young people’s participation in the democratic life of their local, regional or national community, and at international level. Action 2 – European Voluntary Service The aim of the EVS is to support young people’s participation in various forms of voluntary activities, both within and outside the EU. Under this action, young people take part individually or in groups in non-profit, unpaid activities. Action 3 – Youth in the World This action supports Youth Exchanges as well as Training and Networking projects involving countries both from inside and outside the EU. 51 European Commission. Website of the Youth in Action Programme. Annual priorities for 2007, 2008, 2009 and 2010. Retrieved from http://ec.europa.eu/youth/youth-in-action-programme/previous-annual-priorities_en.htm, accessed 17.08.2011.
Transnational Analysis 2011
Helmut Fennes with Susanne Gadinger and Wolfgang Hagleitner 219
Action 4 – Youth Support Systems Action 4 supports the following sub-Action in a decentralised way: (Sub-)Action 4.3 – Training and Networking of those active in youth work and youth organisations. This sub-Action supports the training of those active in youth work and youth organisations, in particular the exchange of experiences, expertise and good practice as well as activities that may lead to long-lasting quality projects, partnerships and networks. Action 5 – Support for European Cooperation in the Youth Field Action 5 supports the following sub-Action in a decentralised way: Sub-Action 5.1 – Meetings of young people and those responsible for youth policy. This sub-Action supports cooperation, seminars and ‘structured dialogue’ between young people, those active in youth work and those responsible for youth policy. Furthermore, the YiA Programme promotes training and networking activities for youth workers and youth leaders through the Training and Cooperation Plan (TCP) of the YiA National Agencies. These activities are implemented directly by the YiA National Agencies and by other beneficiaries funded through the YiA Programme. These activities have been included in the present study.
12.4 Young people with fewer opportunities – types of obstacles
The following is a list of situations and obstacles for young people with fewer opportunities (see European Commission, 2010, p. 5): “Social obstacles: young people facing discrimination because of gender, ethnicity,
religion, sexual orientation, disability etc.; young people with limited social skills or anti-social or risky sexual behaviours; young people in a precarious situation; (ex-)offenders, (ex-)drug or alcohol abusers; young and/or single parents; orphans; young people from broken families.
Economic obstacles: young people with a low standard of living, low income, dependence on the social welfare system; in long-term unemployment or poverty; young people who are homeless, young people in debt or with financial problems.
Disability: young people with mental (intellectual, cognitive, learning), physical, sensory or other disabilities.
Educational difficulties: young people with learning difficulties; early school-leavers and school dropouts; lower qualified persons; young people with poor school performance.
Cultural differences: young immigrants or refugees or descendants from immigrant or refugee families; young people belonging to a national or ethnic minority; young people with linguistic adaptation and cultural inclusion problems.
Health problems: young people with chronic health problems, severe illnesses or psychiatric conditions; young people with mental health problems.
Geographical obstacles: young people from remote or rural areas; young people living on small islands or in peripheral regions; young people from urban problem zones; young people from less serviced areas (limited public transport, poor facilities, and abandoned villages).”
Research-based Analysis of Youth in Action
220 Helmut Fennes with Susanne Gadinger and Wolfgang Hagleitner
12.5 Terminology The following section provides explanations and definitions of specific terms of the YiA Programme as used in the YiA Programme Guide (see European Commission, 2010). Activity start/end: the dates when, within a funded project, the core activity starts/ends, for example a youth exchange (when young people from different countries meet in one country), a seminar, a training course, etc. Beneficiary: an organisation/group/body receiving a grant for a YiA project, normally involving other organisations/groups/bodies. Funding country: the country where the beneficiary is registered; normally, the funding country is the same as the venue country. Residence country/country of residence: the country from which a participant/project leader/team member comes (country of residence immediately before the project). Hosting organisation: an organisation/group/body that hosts one or more participants from other countries within a funded project. Partner countries: in particular countries in South East Europe, countries in Eastern Europe, and in the Caucasus and Mediterranean countries. Programme countries: Member states of the EU, countries that are members of the European Economic Area (Iceland, Liechtenstein and Norway) and candidate countries for accession to the EU (Turkey – for the period the study is addressing). Project start/end: the dates when a funded project starts/ends; the duration of a project is normally much longer than that of the core activity (see activity start/end) – the project also includes the preparation of and the follow-up to the core activity; for example, a youth exchange project might have an activity duration of one week while the project duration might be three months or more. Sending organisation: an organisation/group/body that, within a funded project, sends one or more participants to another country. Training and networking projects: training or networking projects implemented within the Actions 3.1 and 4.1. Training and Cooperation plan (TCP): the YiA Programme includes a training strategy “for sustainable capacity building of youth workers and other key actors. It provides support for them to acquire the necessary attitudes and competences, especially in the field of non-formal learning and working with young people on a European level and in a European context”. The TCPs are “the National Agencies’ instrument of quality support in their role as an intermediate structure” (see European Commission, 2010, p. 20). Venue country/host country: the country in which the project/core activity takes place; generally, the project/activity takes place in the country where the beneficiary is registered.
Transnational Analysis 2011
Helmut Fennes with Susanne Gadinger and Wolfgang Hagleitner 221
13 Appendix D – Research project partners This study was implemented by the Institute of Educational Science at the University of Innsbruck in Austria in cooperation with the National Agencies and their research partners in Austria, Bulgaria, the Czech Republic, Estonia, Finland, Germany, Hungary, Liechtenstein, the Netherlands, Poland, Slovakia and Sweden. National research reports can be requested from the respective National Agencies and their research partners listed below. Austria Interkulturelles Zentrum Lindengasse 41/10 A-1070 Vienna www.iz.or.at Institut für Erziehungswissenschaft der Universität Innsbruck Institute of Educational Science, University of Innsbruck Liebeneggstraße 8 A-6020 Innsbruck http://homepage.uibk.ac.at/~c603207/index.html Bulgaria National Centre "European Youth Programmes and Initiatives" 125 Tsarigradsko shose blvd. BG – 1113 Sofia www.youthbg.info «Брайт Консулт & Рисърч» ЕООД/"Bright Consult & Research" Sofia The Czech Republic Česká národní agentura Mládež Národní institut dětí a mládeže MŠMT Na Poříčí 1035/4 CZ – 110 00 Praha 1 www.mladezvakci.cz Filosofická fakulta Masarykovy university Institute of Educational Sciences, Masaryk University Arna Nováka 1/1 CZ – 602 00 Brno http://www.phil.muni.cz/wff/index_html-en/view?set_language=en
Research-based Analysis of Youth in Action
222 Helmut Fennes with Susanne Gadinger and Wolfgang Hagleitner
Estonia Foundation Archimedes – Euroopa Noored Eesti büroo Koidula, 13A EE - 10125 Tallinn http://euroopa.noored.ee Noorteuuring OÜ Kivmurru 36-12 11411 Tallinn Institute of International and Social Studies at Tallinn University Uus-Sadama 5 - 605 10120 Tallinn http://www.tlu.ee/?LangID=2&CatID=2830, http://www.iiss.ee/?language=3 Finland Centre for International Mobility (CIMO) P.O. Box 343 (Hakaniemenranta 6) FI - 00531 Helsinki http://www.cimo.fi/youth-in-action Germany JUGEND für Europa (JfE) Deutsche Agentur für das EU-Programm JUGEND IN AKTION Godesberger Allee 142-148 D - 53175 Bonn www.webforum-jugend.de IKAB e.V. Institute for Applied Communication Research in Non-formal Education Poppelsdorfer Allee 92 D-53115 Bonn http://www.ikab.de/index_en.html Forschungsgruppe Jugend und Europa am Centrum für angewandte Politikforschung C•A•P Maria-Theresia-Straße 21 D-81675 München www.cap-lmu.de Hungary National Employment and Social Office Mobilitás National Youth Service Youth in Action Programme Office Szemere utca, 7 HU - 1054 Budapest, Postbox. 20 Tel.: +36-1-374.9060 Fax: +36-1-374.9070 www.mobilitas.hu
Transnational Analysis 2011
Helmut Fennes with Susanne Gadinger and Wolfgang Hagleitner 223
Liechtenstein Aha – Tipps & Infos für junge Leute Bahnhof Postfach 356 FL - 9494 Schaan Tel.: +423-239.91.15 Fax: +423-239.91.19 http://www.aha.li The Netherlands Nederlands Jeugd Instituut (NJi) Catharijnesingel, 47 Postbus 19221 NL - 3501 DE Utrecht Tel.: +31-30.230.63.44 Fax: +31-30.230.65.40 www.youthinaction.nl Poland Fundacja Rozwoju Systemu Edukacji Polska Narodowa Agencja Programu “Młodzież w działaniu” ul. Mokotowska 43 PL - 00-551 Warsaw www.mlodziez.org.pl Slovakia IUVENTA - Národná Agentúra Mládež v akcii Búdková cesta 2 SK - 811 04 Bratislava Website: http://www.mladezvakcii.sk Vysoká škola zdravotníctva a sociálnej práce Sv. Alžbety St. Elizabeth University College of Health and Social Work Ulica pod Brehmi 4/A (Polianky) 841 01 Bratislava Sweden Ungdomsstyrelsen/National Board for Youth Affairs Medborgarplatsen 3, Box 17 801 SE–118 94 Stockholm Tel.: +46-8-566.219.00 Fax: +46-8-566.219.98 www.ungdomsstyrelsen.se/ungochaktiv