Embed Size (px)
Citation preview

RESEARCH ARTICLES
CURRENT SCIENCE, VOL. 109, NO. 5, 10 SEPTEMBER 2015 902
*For correspondence. (e-mail: [email protected])
Air quality assessment and its relation to potential health impacts in Delhi, India Sanjoy Maji1, Sirajuddin Ahmed2,* and Weqar Ahmad Siddiqui1 1Department of Applied Sciences and Humanities, and 2Department of Civil Engineering, Jamia Millia Islamia (Central University), Jamia Nagar, New Delhi 110 025, India
The main objective of the air quality index (AQI) system is to interpret air quality in a standardized in-dicator to enable the public to understand the likely health and environmental impacts of air pollutant concentration levels monitored on any given day. The daily averaged concentration data of air pollutants of monitoring sites under the National Ambient Air Quality Monitoring Programme of Delhi were ana-lysed for the period 2001–2010 using the AQI system. This study was undertaken to (i) evaluate the trends of air quality for the past 10 years, (ii) ascertain the association of air quality with mortality and respira-tory morbidity rate of Delhi, and (iii) examine the sea-sonal variation of air quality. The air quality status was found to be varying from ‘moderate’ to ‘unhealthy for sensitive group’ category from the health impact point of view. Non-trauma mortality (r = 0.877, P < 0.01) as well as respiratory morbidity were found to be significantly correlated with AQI values. The present study increases public awareness of the health implications of air pollution and helps assess pollution trends in a more meaningful way. Keywords: Air quality index, health impacts, mortality, respiratory morbidity. OVER the last few decades, several studies have been un-dertaken in various parts of the world to assess the rela-tionship between air quality and health1–3. Evidence from different studies has shown that respiratory and cardio-pulmonary disease is strongly associated with air quality3–5. Many studies in the western countries have reported increase in daily mortality rate, hospital admission and emergency visits to hospitals with fluctuation of daily air pollution level2,6–8. However, few studies have been con-ducted for the Asian region9. According to World Health Organization (WHO)10, urban air pollution is responsible for approximately 800,000 deaths and 4.6 million lost life-years annually around the globe. The problem of air pollution has assumed serious proportions in Delhi, which is also reflected by an increase in the respiratory and cardiovascular mortality11. A report published by the Directorate of Economics and Statistics, Government of
National Capital Territory (NCT) of Delhi (New Delhi, India) found a higher percentage of certified death (24.9% in 2009 compared to 16.4% in 2005) due to dis-ease of respiratory and circulatory system12; both of which are believed to have direct linkages with air pollution. Many cities in India are considered to be among the polluted megacities of the world. Although the available national statistics on air quality provides a gloomy pic-ture, studies documenting the health impact due to dete-riorating air quality are only a handful. There have been few studies in Delhi, the capital city of India, document-ing the association of air pollution with adverse health effects13–16 as well as other cities like Mumbai17 and Kol-kata18, linking adverse health effects due to prevailing air pollution levels. Delhi is considered among the most polluted megaci-ties of the world19 and offers a first-hand choice to study air pollution problems. The air quality report published by the Central Pollution Control Board (CPCB), Government of India (GoI) reported that Delhi has exceeded the annual average respirable particulate matter (RSPM) con-centration limit by more than four times the national annual standards20. Of late, the air quality of Delhi has undergone many changes in terms of the level of pollut-ants and control measures taken to reduce them. Under the supervision of the Supreme Court of India, the Gov-ernment of NCT of Delhi has taken several steps to reduce air pollution levels in the city during the past years. Significant among them are the following rulings: (1) switching over to CNG in case of public transport, (2) introduction of Bharat IV stage (equivalent to Euro-IV) fuel, (3) closure of hazardous industries in the city, (4) introduction of metro system, etc. In spite of all these measures, population growth coupled with rapid urbani-zation have contributed to an increase in air pollution in Delhi. The city itself accounts for about 8% of the total registered motor vehicles in India, which is more than three other megapolitan cities (Mumbai, Kolkata and Chennai) taken together21. Currently, Delhi adds over 1000 new personal vehicles each day on its roads. The annual report on registration of births and deaths in Delhi11 also shows an increasing trend in respiratory mortality in certified deaths for the period 2004–2010 (Figure 1).
doi: 10.18520/v109/i5/902-909

RESEARCH ARTICLES
CURRENT SCIENCE, VOL. 109, NO. 5, 10 SEPTEMBER 2015 903
In the past, some studies were undertaken for air qua-lity assessment of Delhi22–26. The analysis was based on annual or monthly averages of air quality data to deter-mine the trend of air quality in comparison to ambient air quality standards. Sharma et al.27 proposed an air quality index (AQI) system and interpreted the air quality of Delhi. However, the present study interprets the daily averaged concentration data of air pollutants for the period 2001–2010 based on AQI values proposed by the US Environmental Protection Agency (USEPA)28 and correlates AQI with primary hospital admission data and mortality data collected. Daily AQI values allow interpre-tation of air quality data from health significance levels. Further, categorization of AQI in various health signifi-cance levels allow more in-depth analysis of air pollution problem in Delhi.
Air quality index
Air quality index (also known as the air pollution index (API)) is a number used by government agencies to char-acterize the daily air quality. The main objective of the AQI system is to interpret air quality in a standardized indicator to enable the public to understand the likely health and environmental impacts of air pollutant concen-tration levels monitored. As on any given day AQI increases, an increasingly large percentage of the popula-tion is likely to experience increasingly severe adverse health effects. The pollutant concentrations are divided into index range 0–500 and the overall range is sub-divided into six sub-indices which correspond to six cate-gories of air quality based on their potential health and environmental impacts (Table 1).
Materials and methods
Study area
Delhi city is located in North India, at 282417 and 285300N lat., 774530 and 772130E long., and
Figure 1. Trend of respiratory mortality in certified deaths in Delhi for the period 2004–2010.
approximately 216 m amsl. The city is spread over 1483 sq. km (47% urban, 53% rural) of area. Delhi is lo-cated in the subtropical belt. The climate is mainly influ-enced by its inland position and the prevalence of continental type of climate during major part of the year. The climate is characterized by extreme dryness with an intensely hot summer and cold winter. Delhi experiences four well-defined seasons: winter (December to Febru-ary), summer (March to June), monsoon (July to Septem-ber) and post-monsoon (October and November). At present the total population of Delhi is approximately 16.79 million (Census 2011) and is constantly increasing due to migration pressure from all over the India. The density of population per square kilometre is about 11,320 (the national average is 382 per sq. km). There has been a significant increase in environmental pollution over the past decade.
Air quality data
CPCB, GoI continuously monitors (twice a week) the level of pollutants in different parts of Delhi under the National Ambient Air Quality Monitoring Programme (NAAQMP). The daily data on air pollution levels (24 h average RSPM (particulate matter with an aerodynamic diameter less than 10 m, i.e. PM10) concentration, oxides of nitrogen (NOx) and sulphur dioxide (SOx) were obtained directly from the CPCB for monitoring stations Ashok Vihar/Pitampura (note 1), Janakpuri, Siri Fort, Nizamuddin, Sahazada Bagh and Sahadara for the period 2001–2010. Figure 2 shows the location of the monitor-ing stations.
Population and health data
Population and mortality data were obtained from the Delhi Statistical Handbook21 and ‘Report on medical certification of cause of deaths in Delhi’12. The data on yearly counts of out patient department (OPD) patients with respiratory diseases were collected directly from the medical records of Safdarjung Hospital and Dr Ram Manohar Lohia Hospital, New Delhi. Both are among the four largest hospitals under the Ministry of Health and
Table 1. Air quality index (AQI) values and descriptors
AQI value Levels of health concern
0–50 Good 51–100 Moderate 101–150 Unhealthy for sensitive groups 151–200 Unhealthy 201–300 Very unhealthy 301–400 Hazardous 401–500 Hazardous

RESEARCH ARTICLES
CURRENT SCIENCE, VOL. 109, NO. 5, 10 SEPTEMBER 2015 904
Figure 2. Map of Delhi showing air quality monitoring stations. Family Welfare, GoI, with free beds. Safdarjung Hospital is located in the South Delhi and has approximately 1500 beds. Dr Ram Manohar Lohia Hospital is located in Cen-tral Delhi and has 937 beds. Safdarjung Hospital receives patient from all parts of Delhi and its neighbourhood, whereas Dr Ram Manohar Lohia Hospital receives patients mainly from nearby areas.
Development of AQI
The US EPA AQI is based on daily concentration of five of the criteria pollutants (viz. particulate matter (PM10/ PM2.5), sulphur dioxide, ozone, nitrogen dioxide and car-bon monoxide). However, as all the pollutants are not measured under NAAQMP, our calculation is based on three criteria pollutants (RSPM, SOx, NOx) only. The daily sub-index values are computed based on maximum operator concept like that of the US EPA AQI. The maximum value of sub-indices for each pollutant was taken to represent overall AQI of the location. The fol-lowing mathematical equation was used for calculating the sub-indices
high lowlow low
high low( ) ,
I IC C I
C CI
(1)
where I is the (air pollution) index, C the pollutant con-centration, Clow the concentration breakpoint that is C, Chigh the concentration breakpoint that is C, Ilow the index breakpoint corresponding to Clow, and Ihigh the index breakpoint corresponding to Chigh.
Data analysis
Daily averaged concentration data of air pollutants were interpreted into AQI values for different air quality moni-toring stations for the period 2001–2010 based on the US EPA method28. Air quality monitoring stations were compared based on yearly percentage trend in each of the health categories (AQI code frequency). For studying the seasonal variation of the AQI values, the whole year was divided into the following seasons: rainy season (July–September), summer (March–June), post-monsoon (Octo-ber and November) and winter (December–February). Daily AQI values calculated based on concentration of criteria air pollutants at each of the air quality monitoring stations were used to obtain the seasonal distribution of AQI code frequency percentage. The degree of association of AQI values with all non-trauma mortality (all causes, excluding accident and suicide) rate and yearly respiratory OPD patient count was determined through correlation study. It is difficult to certify the exact cause of death; therefore, the relation-ship between air quality and premature mortality is most often studied using variations of all non-trauma deaths with pollution levels. Since there are relative changes in different air quality classes over the years, it is difficult to study the effects of individual AQI classes on mortality rate. Higher AQI value denotes poor air quality and an increasingly large percentage of the population is likely to experience increasingly severe adverse health effects. To study the strength of association of AQI values on mortality rate, weighting factor (e.g. 1 for AQI category ‘Good’, 2 for ‘Moderate’, 3 for ‘Unhealthy for sensitive groups’, 4 for ‘Unhealthy’, 5 for ‘Very unhealthy’, 6 for ‘hazardous’, and 7 for ‘most hazardous’) was used for aggregating the frequency percentage of different AQI classes. The weighted aggregated AQI (WAAQI) values were correlated with all non-trauma mortality rate and respiratory morbidity rate to study the association of AQI with health implications. The respiratory OPD patient count for Safdarjung Hos-pital was correlated with frequency percentage of com-posite average AQI values of Delhi, whereas for Dr Ram Manohar Lohia Hospital the correlation study was per-formed with AQI value of Nizamuddin monitoring station which is the nearest residential ambient air quality moni-toring station with air quality similar to that in and around the hospital area.
Results and discussion
The air quality trends were compared on annual basis for all the monitoring stations keeping in mind the number of days with unhealthy conditions. For inter-annual and inter-spatial comparison, percentage distribution in each AQI category was multiplied with the AQI category

RESEARCH ARTICLES
CURRENT SCIENCE, VOL. 109, NO. 5, 10 SEPTEMBER 2015 905
Table 2. Variability of AQI sub-index values of Pitampura for 2001–2010
AQI class/year 0–50 51–100 101–150 151–200 201–300 301–400 401–500
2001 2 68 26 2 0 2 0 2002 6 51 35 6 2 0 0 2003 7 56 34 3 0 0 0 2004 7 74 9 3 3 4 0 2005 9 72 14 5 0 0 0 2006 4 69 16 11 0 0 0 2007 16 30 36 5 3 8 2 2008 0 63 24 9 3 1 0 2009 0 34 53 13 0 0 0 2010 2 26 36 28 3 4 1
Table 3. Variability of AQI sub-index values of Janakpuri for 2001–2010
AQI class/year 0–50 51–100 101–150 151–200 201–300 301–400 401–500
2001 10 63 22 5 0 0 0 2002 6 54 33 5 2 0 0 2003 3 66 27 2 2 0 0 2004 5 71 17 5 2 0 0 2005 3 64 30 3 0 0 0 2006 7 44 40 9 0 0 0 2007 8 44 37 7 3 0 1 2008 0 35 27 27 5 3 3 2009 0 8 33 25 13 13 8 2010 0 14 27 19 22 12 6
Table 4. Variability of AQI sub-index values of Siri Fort for 2001–2010
AQI class/year 0–50 51–100 101–150 151–200 201–300 301–400 401–500
2001 18 60 19 3 0 0 0 2002 5 65 21 7 2 0 0 2003 14 69 10 7 0 0 0 2004 8 65 25 1 1 0 0 2005 13 68 15 4 0 0 0 2006 17 50 20 11 2 0 0 2007 4 38 32 21 4 1 0 2008 3 26 41 18 8 4 0 2009 0 11 36 34 14 4 1 2010 5 21 38 24 8 3 1
number and added. These values were compared to ana-lyse the severity trends of air quality.
AQI analysis of different air quality monitoring stations
Tables 2–7 show the frequency percentage of AQI values for different ambient air quality monitoring stations dur-ing 2001–2010. The severity trends are found to increase for all the ambient air quality monitoring stations during the study period and are most significant from the year 2008 onwards. In the analysis it was also observed that AQI values vary widely among different stations. Inter-annual variability of AQI values for the different air qual-ity monitoring stations are discussed below: Pitampura monitoring station: For this station (Table 2), air quality up to 2006, mostly falls in the ‘moderate’
to ‘unhealthy for sensitive group’ category. However, from 2007 onwards the frequency of ‘unhealthy’ category increases from 5% to 28%. But the air quality in 2010 is the worst among all years; it reaches the ‘hazardous’ category on several occasions. Janakpuri monitoring station: Air quality at this station (Table 3) is found to be most severe amongst all the mon-itoring stations where the air quality reaches the ‘hazard-ous’ and ‘severe’ category 13% and 8% of the time in 2009 and 12% and 6% of time in 2010 respectively. The air quality gradually deteriorates from 2005 onwards, with 2009 being the worst among all the years. Siri Fort monitoring station: In this station (Table 4), from 2006 onwards there is gradual increase in severity trends of air quality. Number of days with air quality under ‘moderate’ category decreases gradually, whereas

RESEARCH ARTICLES
CURRENT SCIENCE, VOL. 109, NO. 5, 10 SEPTEMBER 2015 906
Table 5. Variability of AQI sub-index values of Nizamuddin for 2001–2010
AQI class/year 0–50 51–100 101–150 151–200 201–300 301–400 401–500
2001 17 68 12 3 0 0 0 2002 4 60 32 4 0 0 0 2003 6 67 24 3 0 0 0 2004 5 69 21 4 1 0 0 2005 11 77 12 0 0 0 0 2006 14 59 22 5 0 0 0 2007 22 58 17 3 0 0 0 2008 7 42 20 16 5 5 5 2009 1 10 24 35 19 7 4 2010 0 20 33 35 7 3 2
Table 6. Variability of AQI sub-index values of Sahazada Bagh for 2001–2010
AQI class/year 0–50 51–100 101–150 151–200 201–300 301–400 401–500
2001 0 33 53 13 1 0 0 2002 2 38 48 8 2 2 0 2003 2 57 35 6 0 0 0 2004 3 69 23 5 0 0 0 2005 2 71 22 5 0 0 0 2006 10 40 45 3 2 0 0 2007 6 56 22 14 1 1 0 2008 0 52 24 10 6 4 4 2009 0 20 54 21 1 4 0 2010 4 16 42 25 7 4 2
Table 7. Variability of AQI sub-index values of Sahadara for 2001–2010
AQI class/year 0–50 51–100 101–150 151–200 201–300 301–400 401–500
2001 19 66 14 1 0 0 0 2002 6 46 41 5 2 0 0 2003 6 60 29 5 0 0 0 2004 9 64 23 4 0 0 0 2005 3 70 22 4 0 0 1 2006 4 59 25 10 1 1 0 2007 4 41 33 16 4 2 0 2008 1 34 38 21 4 1 1 2009 0 21 59 20 0 0 0 2010 1 18 28 32 15 5 1
days under ‘unhealthy for sensitive group’ and ‘un-healthy’ categories. In 2009 and 2010, air quality reaches the ‘hazardous’ and ‘most hazardous’ categories as well. Nizamuddin monitoring station: There is a predomi-nantly ‘moderate’ air quality in the Nizamuddin area (Table 5) up to 2007. Year 2008 onwards, air quality touches to ‘unhealthy’, ‘hazardous’ and ‘most hazardous’ category on a few occasions. Year 2001 is found to be best amongst all the years, with air quality being within NAAQS standards about 85% of the time. Sahazada Bagh monitoring station: Air quality at this station (Table 6) shows a pattern where there is a gradual improvement up to 2005, and gradual deterioration from 2006 onwards. Air quality at this station touched ‘hazardous’ category 4% of the time during the years 2008, 2009 and 2010.
Sahadara monitoring station: This station (Table 7) shows a pattern similar to the Sahazada Bagh monitoring station. There is a gradual improvement in air quality from 2002 to 2005 (2001 is the best amongst all the years) and the air quality deteriorates gradually from 2006 onwards. The air quality in 2010 is worst amongst all the years for the station; air quality reaches ‘hazard-ous’ category 5% of the time.
Analysis of AQI trend for different seasons
Figure 3 shows the monthly variations of frequency per-centage of AQI values greater than 100 (the ‘safe’ limit) for different air quality monitoring stations for the period 2001–2010. The general trend of AQI for all the monitor-ing stations during winter (December–February) is found to be the highest. On the other hand, the minimum values
RESEARCH ARTICLES
CURRENT SCIENCE, VOL. 109, NO. 5, 10 SEPTEMBER 2015 907
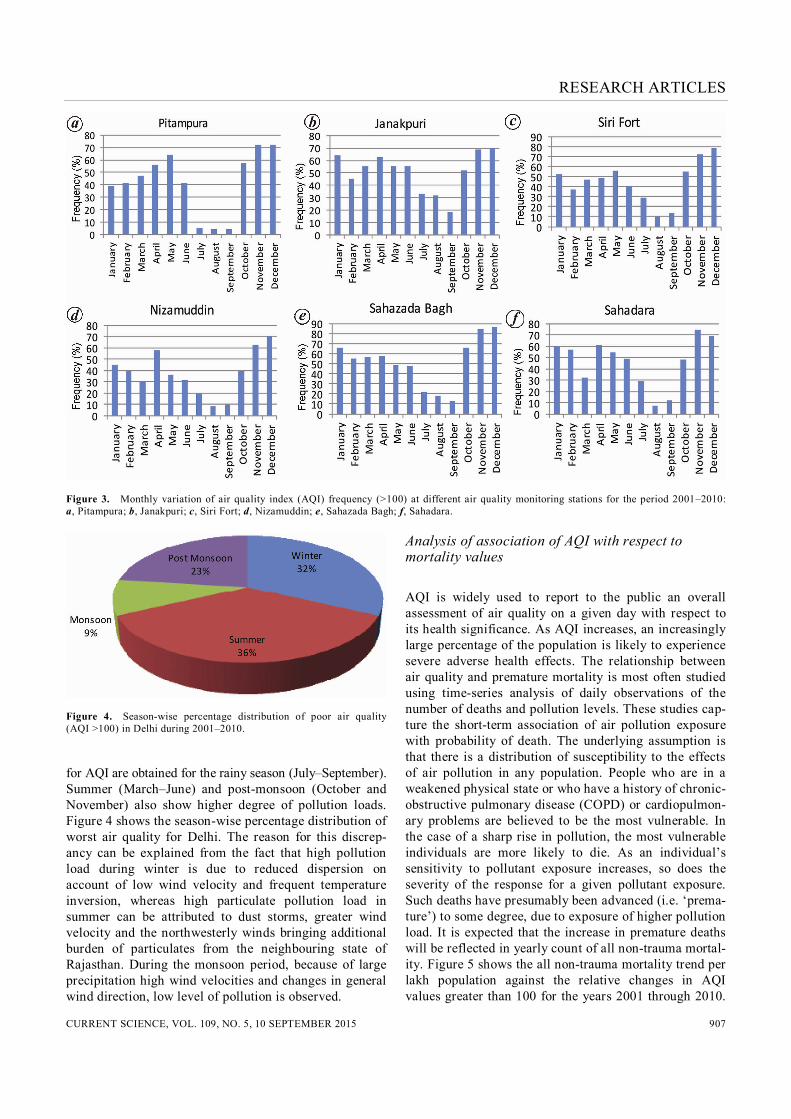
Figure 3. Monthly variation of air quality index (AQI) frequency (>100) at different air quality monitoring stations for the period 2001–2010: a, Pitampura; b, Janakpuri; c, Siri Fort; d, Nizamuddin; e, Sahazada Bagh; f, Sahadara.
Figure 4. Season-wise percentage distribution of poor air quality (AQI >100) in Delhi during 2001–2010. for AQI are obtained for the rainy season (July–September). Summer (March–June) and post-monsoon (October and November) also show higher degree of pollution loads. Figure 4 shows the season-wise percentage distribution of worst air quality for Delhi. The reason for this discrep-ancy can be explained from the fact that high pollution load during winter is due to reduced dispersion on account of low wind velocity and frequent temperature inversion, whereas high particulate pollution load in summer can be attributed to dust storms, greater wind velocity and the northwesterly winds bringing additional burden of particulates from the neighbouring state of Rajasthan. During the monsoon period, because of large precipitation high wind velocities and changes in general wind direction, low level of pollution is observed.
Analysis of association of AQI with respect to mortality values
AQI is widely used to report to the public an overall assessment of air quality on a given day with respect to its health significance. As AQI increases, an increasingly large percentage of the population is likely to experience severe adverse health effects. The relationship between air quality and premature mortality is most often studied using time-series analysis of daily observations of the number of deaths and pollution levels. These studies cap-ture the short-term association of air pollution exposure with probability of death. The underlying assumption is that there is a distribution of susceptibility to the effects of air pollution in any population. People who are in a weakened physical state or who have a history of chronic-obstructive pulmonary disease (COPD) or cardiopulmon-ary problems are believed to be the most vulnerable. In the case of a sharp rise in pollution, the most vulnerable individuals are more likely to die. As an individual’s sensitivity to pollutant exposure increases, so does the severity of the response for a given pollutant exposure. Such deaths have presumably been advanced (i.e. ‘prema-ture’) to some degree, due to exposure of higher pollution load. It is expected that the increase in premature deaths will be reflected in yearly count of all non-trauma mortal-ity. Figure 5 shows the all non-trauma mortality trend per lakh population against the relative changes in AQI values greater than 100 for the years 2001 through 2010.

RESEARCH ARTICLES
CURRENT SCIENCE, VOL. 109, NO. 5, 10 SEPTEMBER 2015 908
The plot clearly shows that mortality rate follows the trends of change in AQI sub-indices values. This associa-tion of AQI trends with yearly all non-trauma mortality rate is more prominent from 2005 onwards; with an increase in the frequency percentage of higher index val-ues (i.e. index value >100), there is an increase in all non-trauma mortality rate. However, male mortality rate is found to be higher than female mortality rate. A signifi-cant correlation was found between all non-trauma mor-tality rate (per lakh population) and weighted aggregated AQI values (WAAQI; r = 0.877, P < 0.01; Figure 6).
Analysis of association of respiratory morbidity with AQI values
The health damages associated with air pollution are gener-ally studied by the changes in respiratory morbidity rate as-sociated with fluctuation in pollution level. A significant
Figure 5. Association of yearly mortality rate with relative changes in AQI sub-index values among the Delhi population for the period 2001–2010.
Figure 6. Correlation analysis between all non-trauma mortality rate (per lakh population) and weighted aggregated air quality index (WAAQI) of Delhi for 2001–2010.
correlation was observed between respiratory morbidity rate and weighted aggregated frequency percentage of different AQI classes for the period 2001–2010. Since, Safdarjung Hospital receives patient from all parts of Delhi and Dr Ram Manohar Lohia Hospital receives patients mainly from hereby areas, weighted aggregated frequency percentage of different AQI classes of all air quality monitoring stations and weighted aggregated fre-quency percentage of different AQI classes of Nizamud-din air quality monitoring stations (nearest to Dr Ram Manohar Lohia Hospital) for the period 2001–2010 were correlated with yearly count of respiratory OPD patients in the two hospitals, respectively. A significant correla-tion was observed between yearly count of respiratory OPD patients at Safdarjung Hospital with weighted com-posite WAAQI of all air quality monitoring stations (r = 0.766; P < 0.01; Figure 7). Yearly count of respira-tory OPD patients at Dr Ram Manohar Lohia Hospital was found to be significantly correlated with WAAQI of Nizamuddin air quality monitoring station (r = 0.631, P < 0.05; Figure 8).
Conclusion
This study shows a significant relationship of AQI values with mortality rate as well as respiratory morbidity rate.
Figure 7. Correlation analysis between respiratory OPD count at Safdarjung Hospital and WAAQI of Delhi for 2001–2010.
Figure 8. Correlation analysis between respiratory OPD count at Dr R. M. Lohia Hospital and WAAQI of Nizamuddin air quality moni-toring station for 2001–2010.

RESEARCH ARTICLES
CURRENT SCIENCE, VOL. 109, NO. 5, 10 SEPTEMBER 2015 909
The air quality data interpretation through AQI system shows more in-depth analysis of air quality in comparison to interpretation based on ambient air quality standards. The study shows that AQI values give a proper represen-tation of the air quality interpreting data for a whole year with respect to different health categories. The analysis of air quality in Delhi shows a gradual deterioration in with respect to the AQI values from 2005 onwards. Statistical analysis shows a significant association of the AQI values in relation to the all non-trauma mortality rate (r = 0.877, P < 0.01) and respiratory morbidity rate prevailing among the Delhi population. Note 1. In the year 2006, Ashok Vihar monitoring stations was shifted to
the adjacent Pitampura area. For the sake of AQI calculations, they are considered the same.
1. WHO, Health aspects of air pollution with particulate matter, ozone and nitrogen dioxide: report on a WHO working group. World Health Organization, Bonn, Germany 13–15 January 2003.
2. WHO, Air quality guidelines for Europe. World Health Organiza-tion, 2000.
3. WHO, Evaluation and use of epidemiological evidence for envi-ronmental health risk assessment: Guideline document. World Health Organization, 2000.
4. Chen, R., Kan, H., Chen, B., Huang, W., Bai, Z., Song, G. and Pan, G., Association of particulate air pollution with daily mortality: the China air pollution and health effects study. Am. J. Epidemiol., 2012, kwr425.
5. Mostofsky, E., Schwartz, J., Coull, B. A., Koutrakis, P., Wel-lenius, G. A., Suh, H. H. and Mittleman, M. A., Modeling the as-sociation between particle constituents of air pollution and health outcomes. Am. J. Epidemiol., 2012, kws018.
6. Anderson, H. R., de Leon, A. P., Bland, J. M., Bower, J. S. and Strachan, D. P., Air pollution and daily mortality in London: 1987–92. Br. Med. J., 1996, 312(7032), 665–669.
7. Dockery, D. W., Ware, J. H., Ferris Jr B. G., Speizer, F. E., Cook, N. R. and Herman, S. M., Change in pulmonary function in chil-dren associated with air pollution episodes. J. Air Pollut. Control Assoc., 1982, 32(9), 937–942.
8. Pope III, C. A., Thun, M. J., Namboodiri, M. M., Dockery, D. W., Evans, J. S., Speizer, F. E. and Heath Jr C. W., Particulate air pol-lution as a predictor of mortality in a prospective study of US adults. Am. J.R. Crit. Care Med., 1995, 151(3_pt_1), 669–674.
9. HEI International Oversight Committee (2004), Health effects of outdoor air pollution in developing countries of Asia: a literature review. Health Effects Institute, Boston, USA, 2004.
10. WHO, The World Health Report 2002; reducing risks, promoting healthy life. World Health Organization, Geneva, 2002; http:// www.who.int/whr/2002/en/whr02_en.pdf
11. Annual report, on registration of births and deaths in Delhi. Direc-torate of Economics and Statistics, Government of Delhi, New Delhi, 2010.
12. Report on medical certification of cause of Deaths in Delhi. Direc-torate of Economics and Statistics, Government of National Capital Territory of Delhi, 2001–2010.
13. Cropper, M., Simon, N. B., Alberini, A. and Sharma, P. K., The health effects of air pollution in Delhi, India. World Bank Policy Research Working Paper No. 1860, 1997.
14. Chhabra, S. K., Chhabra, P., Rajpal, S. and Gupta, R. K., Ambient air pollution and chronic respiratory morbidity in Delhi. Arch. Environ. Health: Int. J., 2001, 56(1), 58–64.
15. Pande, J. N., Bhatta, N., Biswas, D., Pandey, R. M., Ahluwalia, G., Siddaramaiah, N. H. and Khilnani, G. C., Outdoor air pollution and emergency room visits at a hospital in Delhi. Indian J. Chest Dis. Allied Sci., 2002, 44(1), 13–20.
16. Jayaraman, G., Air pollution and associated respiratory morbidity in Delhi. Health Care Manage. Sci., 2008, 11(2), 132–138.
17. Kamat, S. R. and Doshi, V. B., Sequential health effect study in relation to air pollution in Bombay, India. Eur. J. Epidemiol., 1987, 3(3), 265–277.
18. Lahiri, T., Roy, S., Basu, C., Ganguly, S., Ray, M. R. and Lahiri, P., Air pollution in Calcutta elicits adverse pulmonary reaction in children. Indian J. Med. Res., 2000, 112, 21–26.
19. Gurjar, B. R., Jain, A., Sharma, A., Agarwal, A., Gupta, P., Nag-pure, A. S. and Lelieveld, J., Human health risks in megacities due to air pollution. Atmos. Environ., 2010, 44(36), 4606–4613.
20. CPCB, Epidemiological study on effect of air pollution on human health (adults) in Delhi, Central Pollution Control Board, New Delhi, 2012; EHMS/01/2012, 2012; http://cpcb.nic.in/upload/NewItems/ NewItem_188_Epidemiological_study_AP_Report.pdf
21. Delhi Statistical Handbook, Directorate of Economics and Statis-tics, Government of National Capital Territory of Delhi, 2001–2010.
22. Aneja, V. P., Agarwal, A., Roelle, P. A., Phillips, S. B., Tong, Q., Watkins, N. and Yablonsky, R., Measurements and analysis of cri-teria pollutants in New Delhi, India. Environ. Int., 2001, 27(1), 35–42.
23. Goyal, P., Present scenario of air quality in Delhi: a case study of CNG implementation. Atmos. Environ., 2003, 37(38), 5423–5431.
24. Gurjar, B. R., Van Aardenne, J. A., Lelieveld, J. and Mohan, M., Emission estimates and trends (1990–2000) for megacity Delhi and implications. Atmos. Environ., 2004, 38(33), 5663–5681.
25. Mohan, M. and Kandya, A., An analysis of the annual and sea-sonal trends of air quality index of Delhi. Environ. Monit. Assess., 2007, 131(1–3), 267–277.
26. Gupta, I. and Kumar, R., Trends of particulate matter in four cities in India. Atmos. Environ., 2006, 40(14), 2552–2566.
27. Sharma, M., Pandey, R., Maheshwary, M., Sengupta, B., Shukla, B. P. and Mishra, A., Air quality index and its interpretation for the city of Delhi. Int. J. Energy Clean Environ., 2003, 4(3), 1–15.
28. EPA, Technical assistance document for the reporting of daily air quality – air quality index (AQI). Environmental Protection Agency, Office of Air Quality Planning and Standards, North Carolina, USA, 2013.
ACKNOWLEDGEMENTS. We thank Medical Records Department of Safdarjung Hospital, New Delhi and Dr Ram Manohar Lohia Hospi-tal and Central Pollution Control Board, New Delhi for providing data on respiratory patients and pollutants concentration. Received 29 January 2015; revised accepted 26 May 2015