Embed Size (px)
Citation preview
Hindawi Publishing CorporationJournal of SpectroscopyVolume 2013, Article ID 836372, 5 pageshttp://dx.doi.org/10.1155/2013/836372
Research ArticleUltraviolet Spectrophotometric Method for Determination ofGlipizide in Presence of Liposomal/Proliposomal Turbidity
Neelkant Prasad, Roshan Issarani, and Badri Prakash Nagori
Lachoo Memorial College of Science and Technology, Pharmacy Wing, Sector-A, Shastri Nagar, Jodhpur, Rajasthan 342003, India
Correspondence should be addressed to Neelkant Prasad; [email protected]
Received 27 May 2013; Revised 17 July 2013; Accepted 18 July 2013
Academic Editor: Renata Diniz
Copyright © 2013 Neelkant Prasad et al.This is an open access article distributed under theCreativeCommonsAttribution License,which permits unrestricted use, distribution, and reproduction in any medium, provided the original work is properly cited.
A simple and sensitive ultraviolet spectrophotometricmethod for quantitative estimation of glipizide in presence of lipid turbidity isdescribed to avoid false estimation due to diffraction by turbidity. UV detection was performed at 230 nm, 225 nm, and 235 nm, andthe calibration curve was plotted between resultant of absorbance of [230 nm− (225 nm+ 235 nm)/2] and concentration of analyte.The calibration curve was linear over the concentration range tested (1–20 𝜇g/mL) with limit of detection of 0.27𝜇g/mL and limitof quantification of 0.82 𝜇g/mL. Percent relative standard deviations and percent relative mean error, representing precision andaccuracy, respectively, for clear as well as turbid solutions, were found to bewithin acceptable limits, that is, always less than 0.69 and0.41, respectively, for clear solution and 0.65 and 0.47, respectively, for turbid solution. Conclusively, our method was successfullyapplied for the determination of glipizide in clear as well as turbid solutions, and it was found that the drug analyte in both typesof solutions can be detected from the same calibration curve accurately and precisely and glipizide entrapped in the liposomes orin proliposomal matrix was not detected.
1. Introduction
The samples of dissolution of liposomes/proliposomes con-tain lipid turbidity, as the literature review revealed thatthe drug released is measured after separation of the lipidturbidity in cooling ultracentrifuges at high speeds [1, 2].During ultracentrifuge, at such a high speed, the liposomesmight rupture and the drug is released to the dissolutionmedium all at once and can affect the actual concentrationof the solution. Another method of dissolution of liposomesis using dialysis bags. The liposomal formulation is filled inthe dialysis tubing, and both the ends of it are tied with thehelp of tying clips. The tied tubing is then dipped in thedissolutionmedium.The drug thus released does not take theliposomal turbidity with it in the dissolutionmedium and canbe detected easily without any interference due to turbidity[1, 3]. This method increases the evaluation cost by addingthe cost of dialysis tubing.
Derivative spectrophotometric methods, difference spec-trophotometry, and bichromatic methods can also be appliedfor elimination of background absorption and/or scattering,
but all these methods are more or less complex. Also deriva-tive spectrophotometry results in more complex spectrum.
Various methods from different researchers are availablefor assay of GLIP. Some of them [4, 5] have used nonaqueoussolvents and can be used for assay of drug and formulationsbut are not suitable for assessment of aqueous dissolutionsamples. Available HPLC method by Shaodong et al. [6] canbe used for the purpose but is a complex, expensive, and time-consuming extraction procedure. Various procedures foraqueous sample assessment are also available [7–12], but noneof them can be used for estimation of dissolution samples ofthe liposomes or proliposomes of the drugwithout separationof turbidity; that is, separation of turbidity is required forestimation by these methods because turbidity results in falseestimation of the drug due to the fact that diffraction ordissolution studies would be carried out using dialysis bagsso that turbidity does not reach the dissolution medium. Ahigh-speed cooling ultracentrifuge is required for separationthat might result in bursting of liposomes during separationleading to release of the entrapped drug all at once in the solu-tion to give increased concentrations, and later one increases

2 Journal of Spectroscopy
the cost of study by adding the cost of dialysis tubing. Inthe method by Phalke et al. (1997) [13], GLIP has derivatizedby complexation with acridine yellow, and then the complexhas been extracted in chloroform and then evaluated. Firstly,this method is time consuming, and, secondly, presence oflipid/turbidity might affect the complexation reaction. Henryet al. (2009) [14] estimated molar extinction coefficient of thedrug that also requires a clear solution. Similarly, methodsfrom other writers like Skold et al. (2006) [15] and Vargas etal. (2000) [16] are also not suitable due to similar reasons forGLIP liposome/proliposome dissolution samples estimationdirectly along with turbidity present in it.
A simple, easy to calculate, ultraviolet spectrophotomet-ric method is described here to eliminate the effect of lipidturbidity.Themethod is successfully applied to quantitativelyestimate the drug in presence of lipid turbidity duringdissolution as well as to determine drug content of theliposomes/proliposomal matrices. By this method the drugentrapped inside the liposomes/proliposomal matrices is notdetected. Further, the same method is found to be applicableto quantitatively estimate the pure drug also. In the proposedmethod, there is no need to filter the samples to remove anyundissolved drug before estimation because the undissolveddrug in the samples does not absorb light, instead it diffracts.
In this method, the turbidity added from outside isin the form of blank processed lipid components of lipo-somes/proliposomes without drug in the appropriate ratiosuch that they form liposomes when come in contact with theaqueous medium. Now, as the lipid molecules self-assemblewhen they come in contact with the aqueous medium tomake the lamellar bodies, the prepared turbid samples canbe the proper model for real liposomal and proliposomalformulations.
2. Experimental
2.1. Materials and Methods. All chemicals used were ofreagent grade. Glipizide was kindly gifted by Alkem Labora-tories Limited, Taloja, Raigarh, Maharashtra, India.
Acetonitrile (ACN), double-distilled water, sodium hy-droxide, and potassium-dihydrogenorthophosphate wereprocured from Loba Chemie Pvt. Ltd., Mumbai, India.
2.1.1. Stock Solution A. A 1000 𝜇g/mL stock solution was pre-pared by dissolving 50mg GLIP in 3 : 1 ACN : Phosphatebuffer pH 7.4 in a 50.0mL volumetric flask and making thevolume upto the mark with the same solvent.
2.1.2. Stock Solution B. A 50𝜇g/mL working stock solutionwas prepared by diluting 12.5mL of the stock solution A uptomark in a 250mL volumetric flask with Phosphate buffer pH7.4 ± 0.1.
2.1.3. Stock Solution C. A 50 𝜇g/mL working turbid stocksolution was prepared by adding 20mg of the blank, pro-cessed proliposomal components without drug to the pre-viously prepared working stock solution B (50 𝜇g/mL) in a100mL volumetric flask. The solution was sonicated for 15minutes andmade the volume uptomark with the same stock
so as to ensure a drug: lipid ratio of 20 : 80 (maximum in allworking standards).
2.2. Instrumentation. A Shimadzu Pharmspec UV 1800ultraviolet-visible spectrophotometer was used.
2.3. Method. Various aliquots of working stock solutions Band C were transferred to 10mL volumetric flasks so as toprepare various alternate clear and turbid working standarddilutions of 1, 1.5, 2, 3, 4, 6, 8, 12, 16, and 20𝜇g/mL, andvolume was made upto mark with phosphate buffer pH 7.4 ±0.1. The calibration curve was prepared from these dilutionsagainst clear blank by taking the absorbances of the preparedstandard dilutions at three wavelengths, that is, wavelength ofmaximum absorption 𝜆max (230 nm) and at two wavelengthsequidistant on either side of 𝜆max, that is, 225 nm and 235 nm,taking the average of the later two, subtracting this averagefrom the absorbance at 𝜆max, and plotting the result againstconcentration.
3. Results and Discussion
The UV spectra of the prepared clear as well as turbidsolutions of GLIP were run between 400 nm and 200 nm.Both exhibited a prominent peak at 230 nm (Figure 1).The peak was very much clear in both spectra, so it wasselected for further studies as 𝜆max. Two other wavelengthsof measurements used were 225 nm and 235 nm (equidistanton either side of 𝜆max), and the standard curve was preparedby plotting corrected absorbance [𝐴
230− (𝐴
225+ 𝐴
235)/2]
on 𝑦-axis against concentration on 𝑥-axis (Figure 2). TheBeer’s law was validated from 1–20𝜇g/mL. The dilutionswere prepared as alternate clear and turbid to prove that theeffect of turbidity had been overcome. The linear regressionequation was found to be 𝑦 = 0.00533𝑥 + 0.00009 where 𝐴is the absorbance and 𝑥 is the concentration. The detectionlimit and limit of quantification determined with acceptableaccuracy and precision were 0.27 and 0.82 𝜇g/mL, respec-tively. The low values of limit of detection (LOD) and limitof quantification (LOQ) showed negligible scatter of pointswith respect to line of regression. The method was validatedfor assessment of both clear as well as turbid solutions, andwithin acceptable range validation parameters indicated thatthe developed method was specific, rapid, reliable, accurate,precise, and reproducible.
3.1. Method Validation. The validity of the method forlinearity, specificity, accuracy, repeatability, and precisionaccording to recommendations was tested (ICH GuidelinesQ2 (R1), 2005) [17]. The results are shown in Tables 1–4. TheLOD was determined by establishing the minimum level atwhich the analyte can be reliably detected.TheLODand LOQwere calculated according to the following equation:
LOD = (3.3 (SDintercept
Slope)) ,
LOQ = (10(SDintercept
Slope)) ,
(1)

Journal of Spectroscopy 3
Table 1: Analytical parameters for determination of GLIP using theproposed method.
Parameter ValueAnalytical wavelengths (nm) 225, 230, and 235Equation used for standard curve 𝐴230 − (𝐴225 + 𝐴235)/2
Linearity range (𝜇g/mL) 1–20Regression equation (𝐴 = 𝑎𝐶 + 𝑏)a
Slope (𝑎) 0.00533Intercept (𝑏) 0.00009
SD of intercept (𝑛 = 6) 4.39 × 10
−4
LOD (3.3 (SDintercept /Slope)) (𝜇g/mL) 0.27LOQ (10 (SDintercept/Slope)) (𝜇g/mL) 0.82Correlation coefficient 0.99929a𝐴: absorbance and 𝐶: concentration.
Table 2: Test for residuals.
Predicted conc.(𝜇g/mL)
Observed conc.(𝜇g/mL)
Residual amount(𝜇g/mL)
1 1.202627 0.2026271.5 1.571607 0.0716072 2.057849 0.0578493 2.9803 −0.01974 4.010632 0.0106326 5.852408 −0.147598 7.777048 −0.2229512 11.99312 −0.0068816 15.77236 −0.2276420 20.32395 0.323952
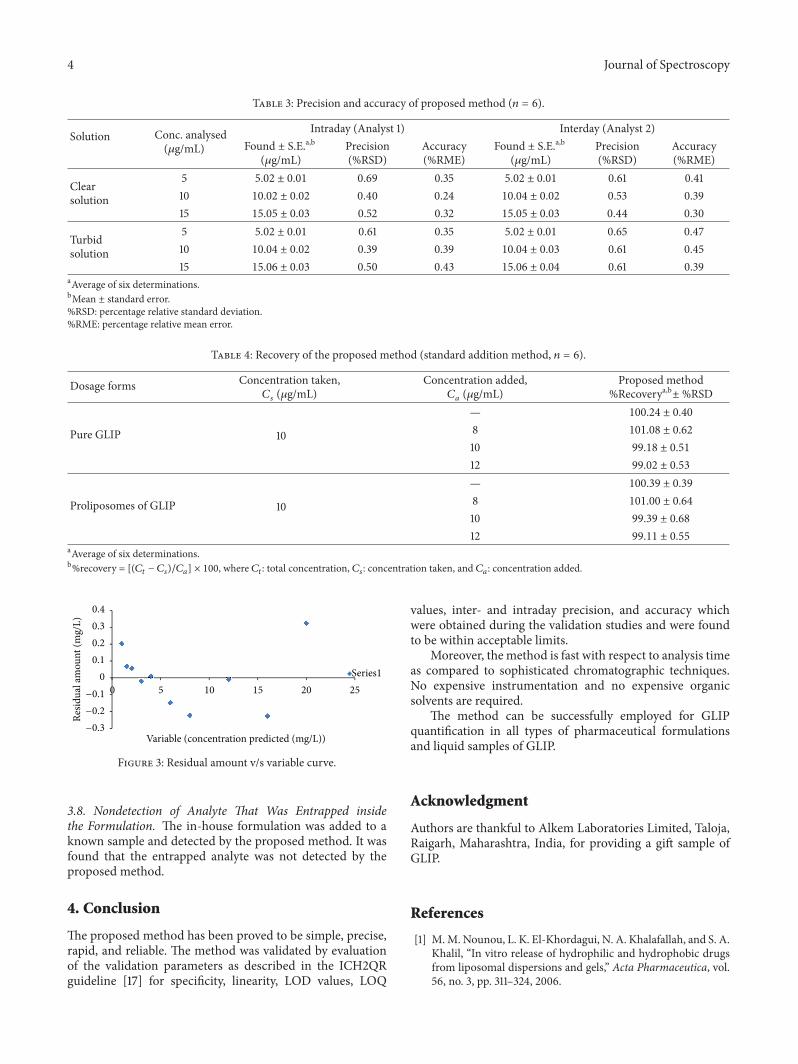
where SDintercept is standard deviation of the intercept ofregression line and Slope is the slope of calibration curve.The proposed method was evaluated for the linearity (linearregression analysis as shown in Table 1 as well as test forresiduals as shown in Table 2 and Figure 3, accuracy aspercent relative mean error (%RME), and the precision aspercent relative standard deviation (%RSD) (Table 3). Therecovery studies were also performed for the developedmethod (Table 4).
3.2. Linearity. The curve was found to be linear as shown bylinear regression equation and the regression coefficient ofthe formed standard curve as shown in Table 1. The linearitywas also proved by test for residuals. A random pattern ofresiduals supports the linearity [18] as shown in Table 2 andFigure 3.
3.3. Accuracy and Precision. To test the accuracy and preci-sion of the proposed method a certain amount of GLIP wasassayed by the proposed method three different times a day(intraday accuracy and precision) and three different days(interday accuracy and precision) in both clear and turbidsolutions. The low values of %RME (represents accuracy)and %RSD (represents precision) indicate that the developedmethod is accurate as well as precise. Table 3 shows theobtained values for accuracy (%RME always less than 0.41
200.00 250.00 300.00 350.00 400.00(nm)
2.977
2.000
1.000
0.000
1
12
43
42
53
50
UV spectrum of turbid solution of GLIP
UV spectrum of clear solution of GLIP
Abso
rban
ce
−0.271 9 3 7
Figure 1: Overlain UV spectra of clear and turbid solutions ofglipizide.
0.020
0.040.060.08
0.10.12
1 3 5 7 9 11 13 15 17 19 21Re
sulta
nt ab
sorb
ance
Concentration (mg/L)
y = 0.00533x + 0.00009Correlation coefficient R2
= 0.99929
Figure 2: Standard curve.
and 0.47 for clear and turbid solutions, resp.) and precision(%RSD always less than 0.69 and 0.65 for clear and turbidsolutions, resp.). The repeatability and reproducibility of thegivenmethod are fairly good as indicated by the low values of%RSD and %RME.
3.4. Repeatability/Reproducibility. The repeatability andreproducibility of the given method are fairly good asindicated by the low values of %RSD and %RME.
3.5. Specificity. As turbidity from outside was added to thealternate dilutions and the rest of validation parameters werewithin acceptable ranges, the method can be said to bespecific.
3.6. Robustness of the Method. The robustness of the methodadopted is demonstrated by the consistency of the absorbancewith the deliberate minor changes in the experiment, such assonication time and pH of the buffer by ±1.
3.7. Recovery Studies. The recovery studies were performedby adding known amounts of the drug to the preanalysedsamples from pure drug and in-house preparation at threedifferent levels, that is, 80%, 100%, and 120% (standardaddition method). The mean recoveries for GLIP weredetermined for both clear and turbid solutions (Table 4) andwere found to be within acceptable limits, that is, 99.02% to101.08% for clear solution and 99.11% to 101.00% for turbidsolution.
4 Journal of Spectroscopy
Table 3: Precision and accuracy of proposed method (𝑛 = 6).
Solution Conc. analysed(𝜇g/mL)
Intraday (Analyst 1) Interday (Analyst 2)Found ± S.E.a,b
(𝜇g/mL)Precision(%RSD)
Accuracy(%RME)
Found ± S.E.a,b(𝜇g/mL)
Precision(%RSD)
Accuracy(%RME)
Clearsolution
5 5.02 ± 0.01 0.69 0.35 5.02 ± 0.01 0.61 0.4110 10.02 ± 0.02 0.40 0.24 10.04 ± 0.02 0.53 0.3915 15.05 ± 0.03 0.52 0.32 15.05 ± 0.03 0.44 0.30
Turbidsolution
5 5.02 ± 0.01 0.61 0.35 5.02 ± 0.01 0.65 0.4710 10.04 ± 0.02 0.39 0.39 10.04 ± 0.03 0.61 0.4515 15.06 ± 0.03 0.50 0.43 15.06 ± 0.04 0.61 0.39
aAverage of six determinations.bMean ± standard error.%RSD: percentage relative standard deviation.%RME: percentage relative mean error.
Table 4: Recovery of the proposed method (standard addition method, 𝑛 = 6).
Dosage forms Concentration taken,𝐶
𝑠(𝜇g/mL)
Concentration added,𝐶
𝑎(𝜇g/mL)
Proposed method%Recoverya,b± %RSD
Pure GLIP 10
— 100.24 ± 0.40
8 101.08 ± 0.62
10 99.18 ± 0.51
12 99.02 ± 0.53
Proliposomes of GLIP 10
— 100.39 ± 0.39
8 101.00 ± 0.64
10 99.39 ± 0.68
12 99.11 ± 0.55
aAverage of six determinations.b%recovery = [(𝐶𝑡 − 𝐶𝑠)/𝐶𝑎] × 100, where 𝐶𝑡: total concentration, 𝐶𝑠: concentration taken, and 𝐶𝑎: concentration added.
00.10.20.30.4
0 5 10 15 20 25Series1
Variable (concentration predicted (mg/L))
Resid
ual a
mou
nt (m
g/L)
−0.1
−0.2
−0.3
Figure 3: Residual amount v/s variable curve.
3.8. Nondetection of Analyte That Was Entrapped insidethe Formulation. The in-house formulation was added to aknown sample and detected by the proposed method. It wasfound that the entrapped analyte was not detected by theproposed method.
4. Conclusion
The proposed method has been proved to be simple, precise,rapid, and reliable. The method was validated by evaluationof the validation parameters as described in the ICH2QRguideline [17] for specificity, linearity, LOD values, LOQ
values, inter- and intraday precision, and accuracy whichwere obtained during the validation studies and were foundto be within acceptable limits.
Moreover, the method is fast with respect to analysis timeas compared to sophisticated chromatographic techniques.No expensive instrumentation and no expensive organicsolvents are required.
The method can be successfully employed for GLIPquantification in all types of pharmaceutical formulationsand liquid samples of GLIP.
Acknowledgment
Authors are thankful to Alkem Laboratories Limited, Taloja,Raigarh, Maharashtra, India, for providing a gift sample ofGLIP.
References
[1] M.M. Nounou, L. K. El-Khordagui, N. A. Khalafallah, and S. A.Khalil, “In vitro release of hydrophilic and hydrophobic drugsfrom liposomal dispersions and gels,” Acta Pharmaceutica, vol.56, no. 3, pp. 311–324, 2006.

Journal of Spectroscopy 5
[2] M. P. Ramprasad, G. M. Anantharamaiah, D. W. Garber,and N. V. Katre, “Sustained-delivery of an apolipoprotein E-peptidomimetic using multivesicular liposomes lowers serumcholesterol levels,” Journal of Controlled Release, vol. 79, no. 1–3,pp. 207–218, 2002.
[3] R. J. Mumper and A. S. Hoffman, “The stabilization and releaseof hirudin from liposomes or lipid-assemblies coated withhydrophobically modified dextran,”AAPS PharmSciTech, vol. 1,no. 1, article E3, 2000.
[4] L. Adhikari, S. Jagadev, S. Sahoo, P. N.Murthy, andU. S.Mishra,“Devlopement and validation of UV-visible spectrophotomet-ric method for simultaneous determination of pioglitazonehydrochloride, metformin hydrochloride and glipizide in itsbulk and pharmaceutical dosage form,” International Journal ofChemTech Research, vol. 4, no. 2, pp. 625–630, 2012.
[5] A. Gumieniczek and A. Berecka, “Comparison of capillary elec-trophoresis and UV derivative spectrophotometry for deter-mination of pioglitazone, glipizide and repaglinide,” AnnalesUniversitatis Mariae Curie-Sklodowska DDD, vol. 24, no. 1, pp.15–23, 2011.
[6] J. Shaodong, W. J. Lee, J. W. Ee, J. H. Park, S. W. Kwon, andJ. Lee, “Comparison of ultraviolet detection, evaporative lightscattering detection and charged aerosol detection methods forliquid-chromatographic determination of anti-diabetic drugs,”Journal of Pharmaceutical and Biomedical Analysis, vol. 51, no.4, pp. 973–978, 2010.
[7] D. R. Rathod, M. N. Dole, and S. D. Sawant, “Spectrophotomet-ric determination of glipizide in bulk and tablet dosage form byabsorptionmaxima, first order derivative spectroscopy and areaunder the curve,” Asian Journal of Pharmaceutical and ClinicalResearch, vol. 5, supplement 3, pp. 102–104, 2012.
[8] T. T. Chungath, Y. P. Reddy, and N. Devanna, “Simultaneousspectrophotometric estimation of metformin hydrochlorideand glipizide in tablet dosage forms,” International Journal ofPharmTech Research, vol. 3, no. 4, pp. 2064–2067, 2011.
[9] A. Aruna and K. Nancey, “Simultaneous estimation of met-formin HCL and glipizide in solid dosage forms by ultravioletspectrophotometry,” Indian Drugs, vol. 37, no. 11, pp. 533–536,2000.
[10] H.N. Shivakumar, B. G.Desai, S. Pandya, and S. S. Karki, “Influ-ence of 𝛽-cyclodextrin complexation on glipizide release fromhydroxypropyl methylcellulose matrix tablets,” PDA Journal ofPharmaceutical Science and Technology, vol. 61, no. 6, pp. 472–491, 2007.
[11] R. K. Verma and S. Garg, “Selection of excipients for extendedrelease formulations of glipizide through drug-excipient com-patibility testing,” Journal of Pharmaceutical and BiomedicalAnalysis, vol. 38, no. 4, pp. 633–644, 2005.
[12] A. E. M. Radi and S. H. Eissa, “Voltammetric and spectropho-tometric studies on the inclusion complex of glipizide with 𝛽-cyclodextrin,” Eurasian Journal of Analytical Chemistry, vol. 6,no. 1, pp. 13–21, 2011.
[13] P. N. Phalke, A. V. Sherikar, and P. M. Dhadke, “Directspectrophotometric analysis of glipizide and phenforminhydrochloride in pharmaceutical dosage forms,” Indian Journalof Pharmaceutical Sciences, vol. 59, no. 1, pp. 18–21, 1997.
[14] B. Henry, C. Foti, and K. Alsante, “Can light absorption andphotostability data be used to assess the photosafety risks inpatients for a new drug molecule?” Journal of Photochemistryand Photobiology B, vol. 96, no. 1, pp. 57–62, 2009.
[15] C. Skold, S. Winiwarter, J. Wernevik et al., “Presentation of astructurally diverse and commercially available drug data set
for correlation and benchmarking studies,” Journal of MedicinalChemistry, vol. 49, no. 23, pp. 6660–6671, 2006.
[16] F. Vargas, H. Mendez, E. Tropper, M. Velazquez, and G. Fraile,“Studies on the in vitro phototoxicity of the antidiabetes drugglipizide,” In Vitro and Molecular Toxicology, vol. 13, no. 1, pp.17–24, 2000.
[17] ICH Guidelines Q2 (R1), “Validation of analytical procedures:text and methodology,” in ICH Harmonized Tripartite Guide-lines, 2005.
[18] “Variations of linearity,” http://people.duke.edu/∼rnau/testing.htm.

Submit your manuscripts athttp://www.hindawi.com
Hindawi Publishing Corporationhttp://www.hindawi.com Volume 2014
Inorganic ChemistryInternational Journal of
Hindawi Publishing Corporation http://www.hindawi.com Volume 2014
International Journal ofPhotoenergy
Hindawi Publishing Corporationhttp://www.hindawi.com Volume 2014
Carbohydrate Chemistry
International Journal of
Hindawi Publishing Corporationhttp://www.hindawi.com Volume 2014
Journal of
Chemistry
Hindawi Publishing Corporationhttp://www.hindawi.com Volume 2014
Advances in
Physical Chemistry
Hindawi Publishing Corporationhttp://www.hindawi.com
Analytical Methods in Chemistry
Journal of
Volume 2014
Bioinorganic Chemistry and ApplicationsHindawi Publishing Corporationhttp://www.hindawi.com Volume 2014
SpectroscopyInternational Journal of
Hindawi Publishing Corporationhttp://www.hindawi.com Volume 2014
The Scientific World JournalHindawi Publishing Corporation http://www.hindawi.com Volume 2014
Medicinal ChemistryInternational Journal of
Hindawi Publishing Corporationhttp://www.hindawi.com Volume 2014
Chromatography Research International
Hindawi Publishing Corporationhttp://www.hindawi.com Volume 2014
Applied ChemistryJournal of
Hindawi Publishing Corporationhttp://www.hindawi.com Volume 2014
Hindawi Publishing Corporationhttp://www.hindawi.com Volume 2014
Theoretical ChemistryJournal of
Hindawi Publishing Corporationhttp://www.hindawi.com Volume 2014
Journal of
Spectroscopy
Analytical ChemistryInternational Journal of
Hindawi Publishing Corporationhttp://www.hindawi.com Volume 2014
Journal of
Hindawi Publishing Corporationhttp://www.hindawi.com Volume 2014
Quantum Chemistry
Hindawi Publishing Corporationhttp://www.hindawi.com Volume 2014
Organic Chemistry International
ElectrochemistryInternational Journal of
Hindawi Publishing Corporation http://www.hindawi.com Volume 2014
Hindawi Publishing Corporationhttp://www.hindawi.com Volume 2014
CatalystsJournal of