Embed Size (px)
Citation preview
Available Online: https://iarconsortium.org/journal-info/IARJBM 91
IAR Journal of Business Management ISSN Print : 2708-5139 | ISSN Online : 2708-5147 Frequency : Bi-Monthly Language : English Origin : Kenya Website : https://www.iarconsortium.org/journal-info/IARJBM
Research Article
The Effect of Loyalty and Responsibility on Job Performance of the
Teachers at SMP Negeri 02 Kikim Selatan of Lahat Regency
Abstract: The purose of this study was to determine the effect of loyalty on
job performance of the teachers, and to determine the effect of responsibility on teacher’s job performance, and also simultaneously to find
out the effect of loyalty and responsibility on teacher’s job performance at SMP Negeri 02 Kikim Selatan, Lahat Regency.The results showed that loyalty and responsibility simultaneously had a positive and significant
effect on teacher’s job performance. It can be seen from F value > F table (28.887> 2.39) and the significance value < significance level of f (α) 0.05
(0.000 <0.05). The loyalty had a positive and significant effect on teacher’s job performance. Because t-sig = 0.04 was lower than the result of significance (α | = 0.05), H0 was rejected and H1 was accepted, it meant
that loyalty had a positive and significant effect on teacher’s job performance. Furthermore, responsibility had a positive and significant effect on teacher’s job performance. Because t sig = 0.00 was lower than
the result of significance (α | = 0.05), so H0 was rejected and H1 was accepted, it showed that responsibility had a pos itive and significant effect
on teacher’s job performance.
Keywords: Loyalty, Responsibility, Job Performance.
INTRODUCTION
Human are an important resource in achieving organizational goals that have different characteristics with other resources. Humans are said to be an important resource because no matter how sophisticated the existing
technology is, human are the main actors in the technology itself. The role of man cannot be replaced by even the most sophisticated instruments.
Therefore, humans are the most important factor in supporting the success of an organization. As well as an organization
with perpect and excellent management, whether in terms of planning, implementing, controlling, or possessing technology facilities, all of it will not be able to run itselves when no human factor as the driving force involved.
One indicator of a qualified human being is having high job performance. This job performance is needed by various
educational institutions. Teachers who have high job performance will always be fully aware of their respective
responsibilities and try to carry out all the tasks assigned to them properly according to their abilities to get maximum work results. In other hand, when a teacher does not have job performance, they will only have a negative impact on the teachers and the school where they works for. For this reason, improving the job performance of the teacher really needs
to be conducted both individually and in groups as an effort to improve better results.
Job performance is an important factor to support the success of a teacher's job both in a personal capacity and as an educator in a school. Many of the unfavorable consequences for schools are caused by the low job performance of teachers. The consequences of a teacher's lack of job performance are, for example, in the various forms of actions
carried out every day such as slowness and negligence in their works, punctuality in attending the working hours, underestimating the job given, and many others.
The job performance of a teacher is commonly determined by loyalty. According to Poewadarminta (2012: 609) loyalty can be defined as devotion and trust given or shown to a person or organization. So loyalty is usually seen from a
long working period at school, so itcan be concluded that the longer the teacher's working period, the higher the loyalty to the school.
Article History
Received: 30.03.2021
Revision: 10.04.2021
Accepted: 20.04.2021
Published: 30.04.2021
Author Details Nidyawati
Authors Affiliations
STIE Serelo Lahat
Corresponding Author* Nidyawati
How to Cite the Article: Nidyawati (2020); The Effect of Loyalty
and Responsibility on Job Performance of
the Teachers at Smp Negeri 02 Kikim
Selatan of Lahat Regency. IAR J Bus Mng, 2(2), 91-98
Copyright @ 2021: This is an open-access article distributed under the terms of the Creative Commons Attribution license which permits unrestricted use, distribution, and reproduction in any medium for non commercial use (NonCommercial, or CC-BY-NC) provided the original author and source are credited.
Nidyawati; IAR J Bus Mng; Vol-2: Iss- 2 (Mar-April, 2021): 91-98
Available Online: https://iarconsortium.org/journal-info/IARJBM 92
However, loyalty is not only seen from working
period, but also be measured through several factors such as high discipline, working well on job and teacher involvement in solving problems at a job. Therefore,
schools must also be able to pay attention to teacher loyalty because it is an important factor in increasing job performance.
Another factor that can determine job performance
is responsibility. Responsibility is a condition of being obliged to bear everything. So that being responsible, according to the general Indonesian dictionary, it is the
obligation to bear, take responsibility, bear everything, or give responsibility and bear the consequences. Responsibility is man's awareness of his behavior or
actions, whether intentionaly or unintentionaly. Responsibility also means acting as a manifestation of
awareness of one's obligations. Personal responsibility is a person's ability to choose a response and accept the consequences for the decisions made. Personally
responsible people will not blame the circumstances, conditions, nor conditioning of the behavior they experienced, because the results achieved is a conscious
choice based on their values.
According to Stubbs (Cottrell, 2014), personal responsibility refers to the quality or condition of being responsible, something for which someone is
responsible. For example, morally, legally, or mentally it can be held accountable.
According to Robbins (2012), the organization must really evaluate and reassess every task and
responsibility given to employees. Because often changes in job, it makes a job description ineffective. Therefore, giving trust to individual teachers in
educational institutions must be designed so that they are able to be responsible for work in accordance with the expectations of the educational institution.
Based on observations and interviews conducted
with several teachers at SMP Negeri 02 Kikim Selatan, Lahat Regency, there were several problems occured, namely the existence of some teachers who came late to
school not in accordance with the working hours set by the school, for example arriving at 07.30 and returning home after teaching and learning activities ends. Some
teachers come to school only during teaching hours; there are even teachers who do not teach without giving
any information to the school or leaving assignments for students.
In addition, there are also some teachers who leave early, even though they have carried out their duties. Whereas the obligation of a teacher at school is not only
to come to teach and then go home, but also to carry out several administrations in the school such as attendance and reports to the picket officers after finishing teaching
and learning activities. Of course, that habits are often
carried out like this will be very detrimental, especially
in terms of services for both students and alumni. From the problems discussed above, it was found
that teacher’s job performance was influenced by various factors besides loyalty, there were also other factors affected. However, responsibility also
determines the success of a teacher in achieving job performance. Based on the description above, the writer
was interested in conducting research entitled "THE EFFECT OF LOYALTY AND RESPONSIBILITY ON JOB PERFORMNCE OF THE TEACHERS At SMP
NEGERI 02 KIKIM SELATAN OF LAHAT REGENCY".
LITERATURE REVIEW Loyalty
In general, the definition of loyalty is related to
obedience, and willingness to accept what it is, not easily shifting to other goals. Loyalty is an attitude of devotion, obedience, and willingness to accept from an
employee to the organization (Malayu, 2015: 35). Employee loyalty to the organization means a
person's willingness to perpetuate his relationship with the organization, if necessary at the expense of his
personal interests without expecting anything. The willingness of employees to defend themselves to work in the organization is important in supporting employee
commitment to the organization where they work. It can be conducted when the employees feel a sense of security and satisfaction in the organization where they
work for. Responsibiliy
According to Siagian in Lubis (2010: The definition of responsibility quite hard to explain precisely.
Sometimes responsibility is associated with the need to do something, or sometimes it is associated with sadness to accept the consequences of an act. Several
definitions of responsibility causes it is difficult to put it into simply and easily understood words, however,
when it is indepth research explanation, the notion of responsibility always revolves around the awareness to do, the willingness to do, and the ability to do.
Responsibility is awareness to do or willingness to
do something in accordance with organizational rules
and regulations (Malayu, 2015: 12). In our culture, generally "responsibility" is defined as the obligation to
"bear" and "answer" in other words, it is an obligation to bear the consequences caused by one's behavior in order to solve a problem.
Job Performance
The definition of job performance is a result
achieved by employees in carrying out their duties or work efficiently and effectively. Job performance is the
Nidyawati; IAR J Bus Mng; Vol-2: Iss- 2 (Mar-April, 2021): 91-98
Available Online: https://iarconsortium.org/journal-info/IARJBM 93
work success that a person gets from the deeds or results concerned. The definition of work performance
according to Malayu (2015: 30) is a result of work achieved by a person in carrying out the tasks assigned to him based on skills, experience, seriousness, and
time.
A person's job performance can be said to be high when a work target is completed at the right time or does not exceed the limit provided. A person's job
performance can also be said to be low when it is completed beyond the specified time limit or is not completed at all. According to Mangkunegara (2012:
67), job performance is the result of work in quality and quantity achieved by an employee in carrying out his
duties in accordance with the responsibilities assigned to him. The quality aspect refers to the perfection and neatness of the work that has been completed, while the
quantity refers to the workload or work target in completing the work.
RESEARCH METHODOLOGY In this study, the writer used a descriptive method
research with a quantitative approach. Basically, it is
from one of the existing methods. According to Sugiyono (2012: 10-11) classifies research methods into three parts as follows:
Descriptive research is research conducted to determine the value of the independent variable, either one or more (independent) variables without
making comparisons or linking with other variables.
Comparative research is a study that is comparison thing.
Associative research is research that aims to
determine the relationship between two or more variables.
This study used a quantitative approach because the
data obtained used numbers and the analysis used statistics, the quantitative approach used for research was a specific population or sample.
RESULTS AND DISCUSSION Validity Test
Priyatno (2011: 90) states that "the validity test is often used to measure the accuracy of an item in a questionnaire or scale, whether the items on the
questionnaire are correct in measuring what you want to measure".
Testing the validity of the data in this study used Bivariate Pearson correlation method (Pearson Product
Moment Correlation). Priyatno (2011: 90) states that this analysis is carried out by correlating each item's score with the total score. The total score is the sum of
all items. Question items that have a significant correlation with the total score indicate that these items are able to provide support in revealing what they want
to reveal.
The test used a two-sided test with a significance level of 0.05. The testing criteria is if r value ≥ r table then the instrument or statement items have a
significant correlation to the total score (declared valid). The amount of data (n) = 32, then the r table was 0.286.
After testing the validity of the data on the variable of loyalty and job performance, all statement items
were valid, as well as the work productivity variable, all statement items were also valid.
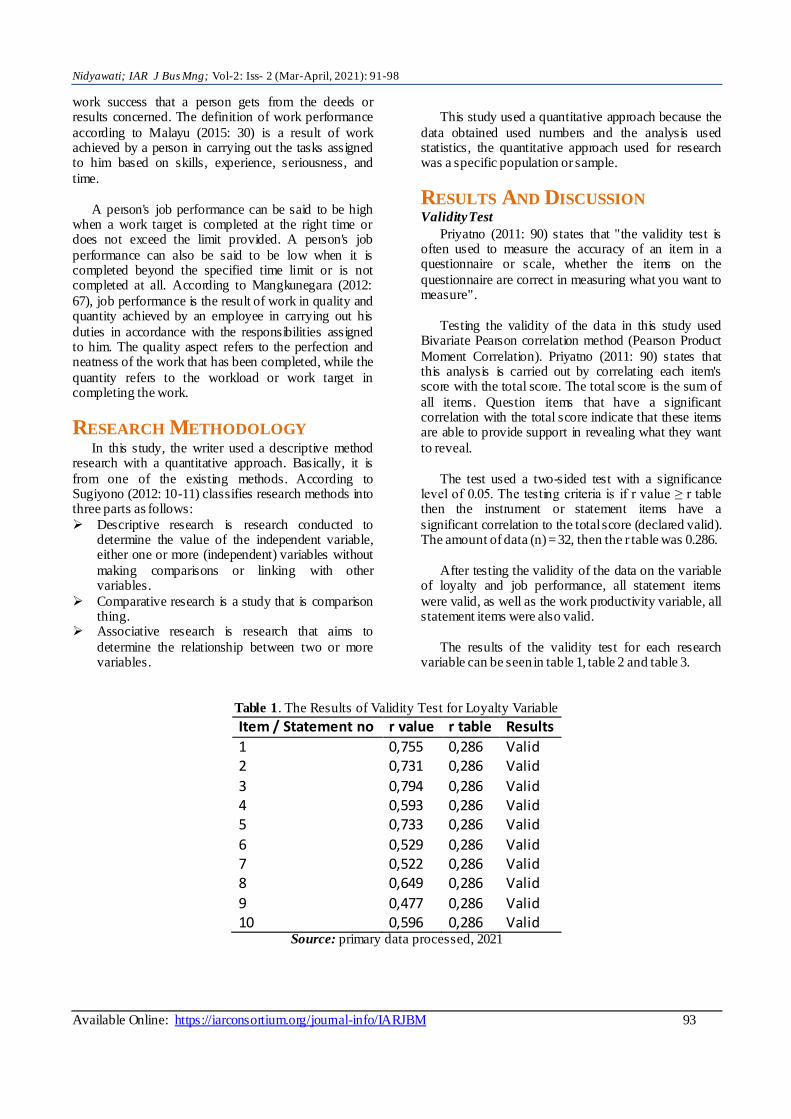
The results of the validity test for each research variable can be seen in table 1, table 2 and table 3.
Table 1. The Results of Validity Test for Loyalty Variable
Item / Statement no r value r table Results
1 0,755 0,286 Valid 2 0,731 0,286 Valid
3 0,794 0,286 Valid 4 0,593 0,286 Valid 5 0,733 0,286 Valid
6 0,529 0,286 Valid 7 0,522 0,286 Valid 8 0,649 0,286 Valid
9 0,477 0,286 Valid 10 0,596 0,286 Valid
Source: primary data processed, 2021
Nidyawati; IAR J Bus Mng; Vol-2: Iss- 2 (Mar-April, 2021): 91-98
Available Online: https://iarconsortium.org/journal-info/IARJBM 94
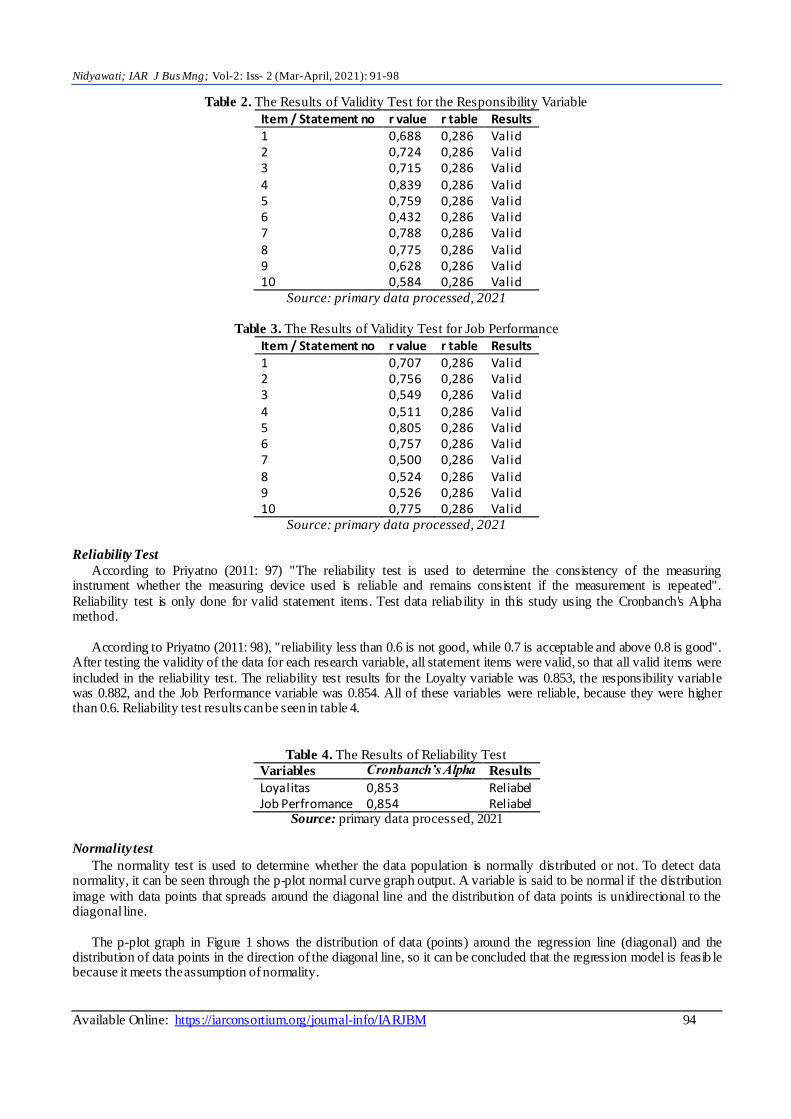
Table 2. The Results of Validity Test for the Responsibility Variable
Item / Statement no r value r table Results 1 0,688 0,286 Valid 2 0,724 0,286 Valid 3 0,715 0,286 Valid 4 0,839 0,286 Valid 5 0,759 0,286 Valid 6 0,432 0,286 Valid 7 0,788 0,286 Valid 8 0,775 0,286 Valid 9 0,628 0,286 Valid 10 0,584 0,286 Valid
Source: primary data processed, 2021
Table 3. The Results of Validity Test for Job Performance
Item / Statement no r value r table Results 1 0,707 0,286 Valid 2 0,756 0,286 Valid 3 0,549 0,286 Valid 4 0,511 0,286 Valid 5 0,805 0,286 Valid 6 0,757 0,286 Valid 7 0,500 0,286 Valid 8 0,524 0,286 Valid 9 0,526 0,286 Valid 10 0,775 0,286 Valid
Source: primary data processed, 2021
Reliability Test
According to Priyatno (2011: 97) "The reliability test is used to determine the consistency of the measuring instrument whether the measuring device used is reliable and remains consistent if the measurement is repeated".
Reliability test is only done for valid statement items. Test data reliability in this study using the Cronbanch's Alpha method.
According to Priyatno (2011: 98), "reliability less than 0.6 is not good, while 0.7 is acceptable and above 0.8 is good".
After testing the validity of the data for each research variable, all statement items were valid, so that all valid items were
included in the reliability test. The reliability test results for the Loyalty variable was 0.853, the responsibility variable was 0.882, and the Job Performance variable was 0.854. All of these variables were reliable, because they were higher than 0.6. Reliability test results can be seen in table 4.
Table 4. The Results of Reliability Test
Variables Cronbanch’s Alpha Results
Loyalitas 0,853 Reliabel Job Perfromance 0,854 Reliabel
Source: primary data processed, 2021
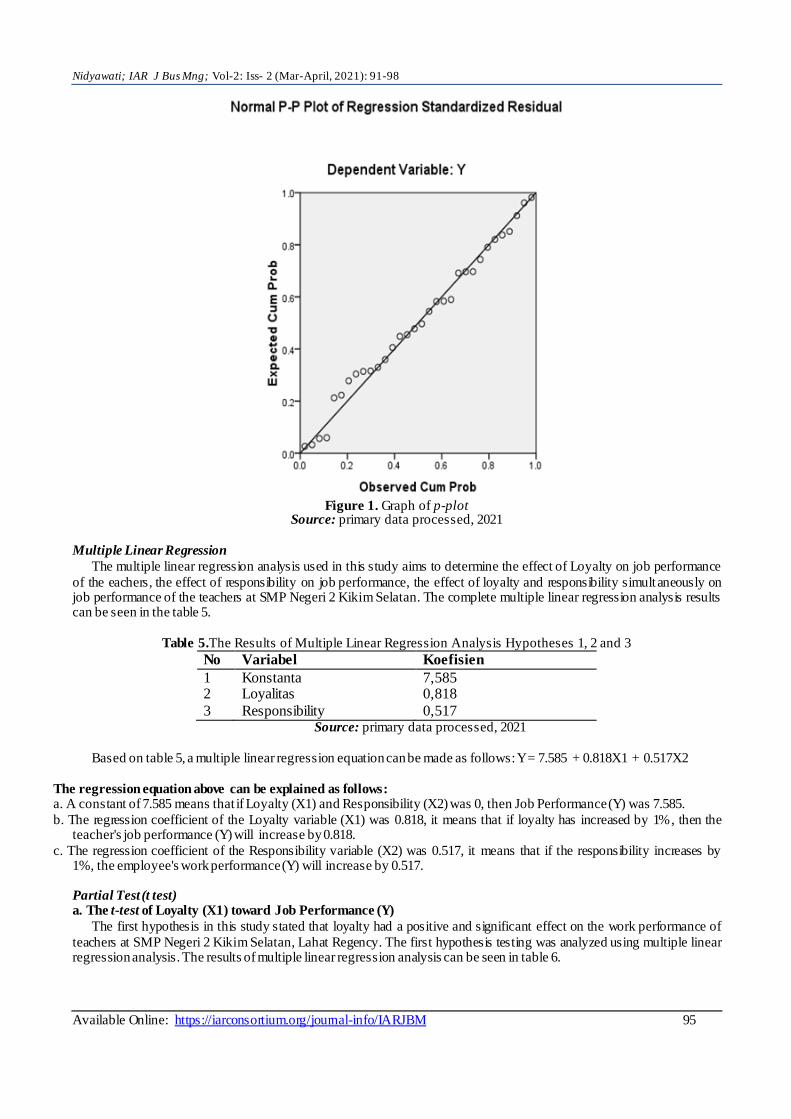
Normality test
The normality test is used to determine whether the data population is normally distributed or not. To detect data normality, it can be seen through the p-plot normal curve graph output. A variable is said to be normal if the distribution
image with data points that spreads around the diagonal line and the distribution of data points is unidirectional to the diagonal line.
The p-plot graph in Figure 1 shows the distribution of data (points) around the regression line (diagonal) and the distribution of data points in the direction of the diagonal line, so it can be concluded that the regression model is feasib le because it meets the assumption of normality.
Nidyawati; IAR J Bus Mng; Vol-2: Iss- 2 (Mar-April, 2021): 91-98
Available Online: https://iarconsortium.org/journal-info/IARJBM 95
Figure 1. Graph of p-plot
Source: primary data processed, 2021
Multiple Linear Regression
The multiple linear regression analysis used in this study aims to determine the effect of Loyalty on job performance
of the eachers, the effect of responsibility on job performance, the effect of loyalty and responsibility simultaneously on job performance of the teachers at SMP Negeri 2 Kikim Selatan. The complete multiple linear regression analysis results can be seen in the table 5.
Table 5.The Results of Multiple Linear Regression Analysis Hypotheses 1, 2 and 3
No Variabel Koefisien
1 Konstanta 7,585 2 Loyalitas 0,818
3 Responsibility 0,517 Source: primary data processed, 2021
Based on table 5, a multiple linear regression equation can be made as follows: Y = 7.585 + 0.818X1 + 0.517X2
The regression equation above can be explained as follows: a. A constant of 7.585 means that if Loyalty (X1) and Responsibility (X2) was 0, then Job Performance (Y) was 7.585.
b. The regression coefficient of the Loyalty variable (X1) was 0.818, it means that if loyalty has increased by 1%, then the teacher's job performance (Y) will increase by 0.818.
c. The regression coefficient of the Responsibility variable (X2) was 0.517, it means that if the responsibility increases by 1%, the employee's work performance (Y) will increase by 0.517. Partial Test (t test) a. The t-test of Loyalty (X1) toward Job Performance (Y)
The first hypothesis in this study stated that loyalty had a positive and significant effect on the work performance of
teachers at SMP Negeri 2 Kikim Selatan, Lahat Regency. The first hypothesis testing was analyzed using multiple linear regression analysis. The results of multiple linear regression analysis can be seen in table 6.
Nidyawati; IAR J Bus Mng; Vol-2: Iss- 2 (Mar-April, 2021): 91-98
Available Online: https://iarconsortium.org/journal-info/IARJBM 96
Table 6. The Results of t-test from First Hypothesis
Coefficientsa
Model
Unstandardized Coefficients Standardized Coefficients
t Sig. B Std. Error Beta
1 (Constant) 7.585 5.092 1.490 .005
X1 .818 .114 .821 7.196 .000
X2 .517 .116 .516 4.142 .004
a. Dependent Variable: Y
Source: primary data processed, 2021
Determine the formulations Ho and H1 H0: b1 = 0: there was no effect between the independent variable and the dependent variable separately.
H1: b1 ≠ 0: there was effect between the independent variable and the dependent variable separately. The level of significant a = 5%
Testing criteria
H0 is accepted if t sig> 0.05
H0 is rejected if t sig <0.05
Conclusion Because t sig = 0.00 was lower than the result of significance (α | = 0.05), H0 was rejected and H1 was accepted, it meant that loyalty had a positive and significant effect on the job performance of Teachers at SMP Negeri 2 Kikim
Selatan, Lahat Regency. The t-test for Responsibility (X2) toward Job Performance (Y)
The second hypothesis in this study statedthat responsibility had a positive and significant effect on job performance of teachers at SMP Negeri 2 Kikim Selatan, Lahat Regency. The second hypothesis testing was analyzed using multiple
linear regression analysis. The results of multiple linear regression analysis can be seen in table 7.
Table 7. The Results of t-test for Second Hypothesis
Coefficientsa
Model
Unstandardized Coefficients
Standardized
Coefficients
t Sig. B Std. Error Beta
1 (Constant) 7.585 5.092 1.490 .005
X1 .818 .114 .821 7.196 .000
X2 .517 .116 .516 4.142 .004
a. Dependent Variable: Y
Source: primary data processed, 2021
Determine the formulations of Ho and H1
H0: b2 = 0: there was no effect between the independent variable and the dependent variable separately. H1: b2 ≠ 0: there was effect between the independent variable and the dependent variable separately.
Level of significant a = 5% Testing criteria
H0 was accepted if t sig> 0.05 H0 was rejected if t sig <0.05
Conclusion
Nidyawati; IAR J Bus Mng; Vol-2: Iss- 2 (Mar-April, 2021): 91-98
Available Online: https://iarconsortium.org/journal-info/IARJBM 97
Because t sig = 0.04 was lower than the result of significance (α | = 0.05), H0 was rejected and H1 was accepted, it meant that responsibility had a positive and significant effect on the job performance of teachers of SMP Negeri 2 Kikim
Selatan, Lahat Regency. Simultaneous Test (Test F)
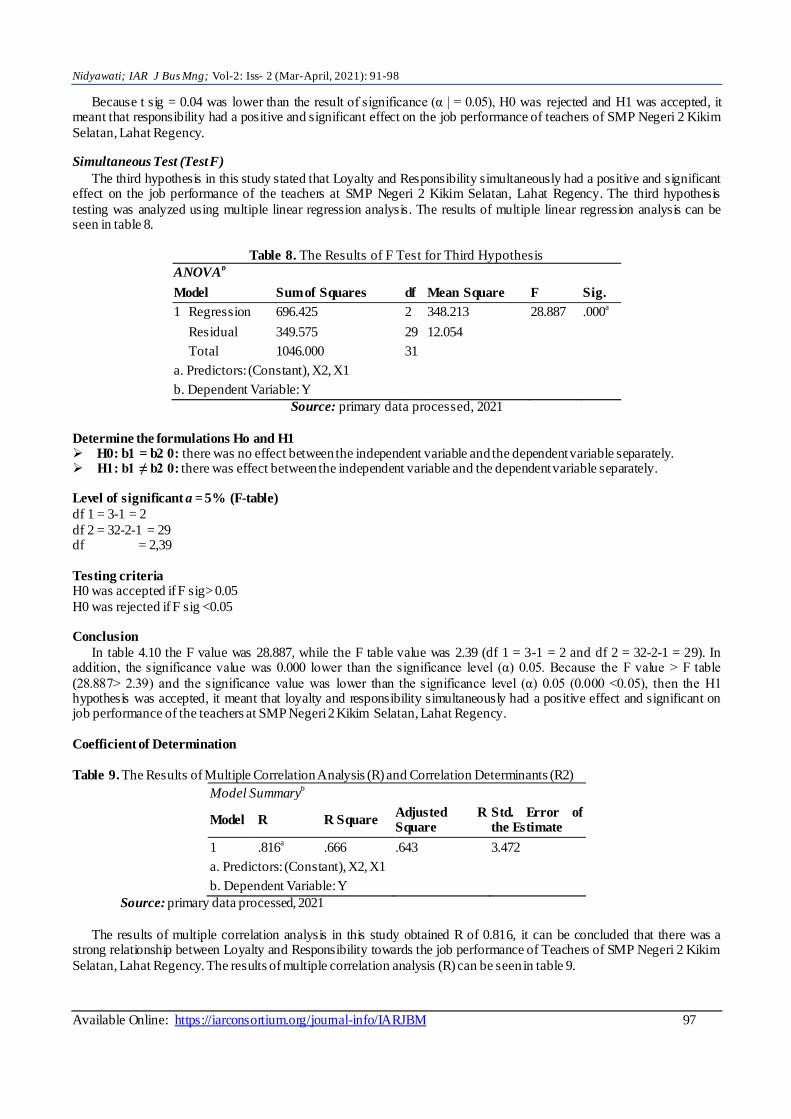
The third hypothesis in this study stated that Loyalty and Responsibility simultaneously had a positive and significant effect on the job performance of the teachers at SMP Negeri 2 Kikim Selatan, Lahat Regency. The third hypothesis
testing was analyzed using multiple linear regression analysis. The results of multiple linear regression analysis can be seen in table 8.
Table 8. The Results of F Test for Third Hypothesis
ANOVAb
Model Sum of Squares df Mean Square F Sig.
1 Regression 696.425 2 348.213 28.887 .000a
Residual 349.575 29 12.054
Total 1046.000 31
a. Predictors: (Constant), X2, X1
b. Dependent Variable: Y
Source: primary data processed, 2021
Determine the formulations Ho and H1 H0: b1 = b2 0: there was no effect between the independent variable and the dependent variable separately. H1: b1 ≠ b2 0: there was effect between the independent variable and the dependent variable separately.
Level of significant a = 5% (F-table)
df 1 = 3-1 = 2
df 2 = 32-2-1 = 29 df = 2,39
Testing criteria H0 was accepted if F sig> 0.05
H0 was rejected if F sig <0.05 Conclusion
In table 4.10 the F value was 28.887, while the F table value was 2.39 (df 1 = 3-1 = 2 and df 2 = 32-2-1 = 29). In addition, the significance value was 0.000 lower than the significance level (α) 0.05. Because the F value > F table
(28.887> 2.39) and the significance value was lower than the significance level (α) 0.05 (0.000 <0.05), then the H1 hypothesis was accepted, it meant that loyalty and responsibility simultaneously had a positive effect and significant on job performance of the teachers at SMP Negeri 2 Kikim Selatan, Lahat Regency.
Coefficient of Determination
Table 9. The Results of Multiple Correlation Analysis (R) and Correlation Determinants (R2)
Model Summaryb
Model R R Square Adjusted R Square
Std. Error of the Estimate
1 .816a .666 .643 3.472
a. Predictors: (Constant), X2, X1
b. Dependent Variable: Y
Source: primary data processed, 2021
The results of multiple correlation analysis in this study obtained R of 0.816, it can be concluded that there was a strong relationship between Loyalty and Responsibility towards the job performance of Teachers of SMP Negeri 2 Kikim
Selatan, Lahat Regency. The results of multiple correlation analysis (R) can be seen in table 9.
Nidyawati; IAR J Bus Mng; Vol-2: Iss- 2 (Mar-April, 2021): 91-98
Available Online: https://iarconsortium.org/journal-info/IARJBM 98
The analysis of determination (R2) was used to determine the percentage of the contribution of the
influence of the independent variables (X1, X2) simultaneously on the dependent variable (Y). R2 wass
equal to 0, so there was not the slightest percentage of the influence contribution given by the independent variable to the dependent variable, on the contrary R2
was equal to 1, then the percentage contribution of the influence given by the independent variable to the dependent variable was perfect.
The results of the determination analysis showed
that the R2 (R Square) number was 0.643 or (64.3%). It showed that the percentage of the contribution of the influence of the independent variable (Loyalty and
Responsibility) to the dependent variable (Job Performance) was 64.3% or the variation of the independent variables used in the model (Loyalty and
Responsibility) was able to explain 64.3% of the dependent variable ( Job Performance), while the
remaining 35.7% was influenced or explained by other variables excluded in this research model.
CONCLUSION
Based on the results of the research and discussion, it can be concluded that: 1. The F value was 28.887, while the F table was 2.39
(df 1 = 3-1 = 2 and df 2 = 32-2-1 = 29). In addition, the significance value was 0.000 lower than the
significance level α) 0.05. Because F value > F table (28.887> 2.39) and the significance value was lower than the significance level (α) 0.05 (0.000 <0.05),
then the H1 hypothesis was accepted, it meant that loyalty and responsibility simultaneously had positive and significant effect on job performance of
teachers at SMP Negeri 2 Kikim Selatan, Lahat Regency.
2. The t value for the Loyalty variable was 7.196, while the t table was 2.045. In addition, the significance value was 0.000, which was lower than
the significance level (α) 0.05. Because the t-value > t table (7,196> 2,045), then the hypothesis H1 was accepted, it meant that loyalty has a positive and
significant effect on the job performance of teachers at SMP Negeri 2 Kikim Selatan, Lahat Regency.
3. The t value for the Responsibility variable was 4.142, while the t table was 2.045. In addition, the
significance value was 0.004 lower than the significance level (α) 0.05. Because the value of t-
value > t-table (4.142 > 2.045), then the hypothesis H1 was accepted, it meant that responsibility had a positive and significant effect on job performance of
the teachers at SMP Negeri 2 Kikim Selatan, Lahat Regency.
REFERRENCES
1. Dharma, S. (2013). Human Resource Competency Development. First Edition, Second Edition. Student
Library, Yogyakarta. 2. Ferdinand, A. (2015). Management Research
Methods: Research Guidelines for Thesis, Thesis
and Management Science Dissertation. Semarang: Diponerogo University.
3. Ghazali, I. (2012). Multivariate Analysis
Application with SPSS Program. Semarang: Bandung, Diponerogo University Publisher.
4. Handoko, T. Hani. (2013). Personnel and Human Resources Management. Yogyakarta: BPFE.
5. Hasibuan, M.S.P. (2015). Human Resource
Management. Jakarta: PT. Bumi Aksara. 6. Husein, U. (2013). Research Methods for Thesis and
Thesis. Jakarta: Rajawali.
7. Law of the Republic of Indonesia Number 14 of 2005 concerning Teachers and Lecturers. Surabaya:
Kesindo Utama. 8. Mangkunegara, AAP. (2012). Human Resource
Management. Bandung: PT. Remaja Rosdakarya.
9. Munir. (2014). Humane and Organizational Approaches to Personnel Development, Gunung Agung: Jakarta.
10. Ranupandojo, H., & Husnan, S. (2011). Personnel Management. Edition III. Yogyakarta: BPFE.
11. Sudjana. (2012). Statistical Methods. Bandung: Sinar Baru Algesindo.
12. Sugiyono, (2012). Qualitative and Quantitative
Research Methods R & D. Bandung: Alfabeta. 13. Suharsimi, A. (2012). Research Procedure A
Practice Approach. Jakarta. PT. Rhineka Cipta.
14. Tulus, W. (2014). Statistics in Psychological Research and Education. Malang: UMM Press.