Embed Size (px)
Citation preview

Research ArticleStatus of the GRANIT Facility
Damien Roulier12 Francis Vezzu3 Stefan Baeszligler4 Benoicirct Cleacutement3 Daniel Morton4
Valery V Nesvizhevsky2 Guillaume Pignol3 and Dominique Rebreyend3
1Universite Grenoble-Alpes 38000 Grenoble France2Institut Max von Laue-Paul Langevin 71 avenue des Martyrs 38000 Grenoble France3LPSC Grenoble Universite Grenoble-Alpes CNRSIN2P3 53 avenue des Martyrs 38026 Grenoble Cedex France4Physics Department University of Virginia 382 McCormick Road Charlottesville VA 22904 USA
Correspondence should be addressed to Damien Roulier roulierillfr
Received 6 June 2014 Accepted 6 August 2014
Academic Editor Ignatios Antoniadis
Copyright copy 2015 Damien Roulier et alThis is an open access article distributed under theCreative CommonsAttribution Licensewhich permits unrestricted use distribution and reproduction in any medium provided the original work is properly cited Thepublication of this article was funded by SCOAP3
The GRANIT facility is a follow-up project which is motivated by the recent discovery of gravitational quantum states of ultracoldneutrons The goal of the project is to approach the ultimate accuracy in measuring parameters of such quantum states and also toapply this phenomenon and related experimental techniques to a broad range of applications in particle physics as well as in surfaceand nanoscience studies We overview the current status of this facility the recent test measurements and the nearest prospects
1 Introduction
The GRANIT facility [1 2] is a follow-up project whichis motivated by the recent discovery of gravitational quan-tum states of ultracold neutrons (UCNs) [3ndash5] The maingoal of the project is to realize the resonance spectroscopyof those quantum states with the prospect of achievingan unprecedented sensitivity Such precision measurementswould address in particular searches for extra short-rangefundamental forces [6ndash9] Also the phenomenon of gravita-tional quantum states and related experimental techniquescould be applied to a broad range of other applications inparticle physics as well as in surface and nanoscience studies[10]
GRANIT is located at the level C of the Institut Laue-Langevin (ILL) in Grenoble at the H172A beamline as shownin Figure 1 The instrument comprises an ultracold neutronsource based on the production of UCNs in superfluidhelium and a spectrometer installed in an ISO 5 class cleanroom pictured in Figure 2 A monochromatic neutron beam(089 nm wavelength) is extracted from a white cold neutronbeam with a monochromator [11] and guided towards the
superfluid helium bath where UCNs are produced [2 12 13]An extraction guide allows us then to transfer those UCNs tothe spectrometer
In the spectrometer UCNs are first stored in an interme-diate storage volume To exit this volume neutrons must gothrough an extraction slit of height asymp100 120583m a compromisebetween the total UCN flux and the UCN phase-spacedensity Then neutrons will bounce over high quality mirrorsvery close to the surface and the method of resonancespectroscopy [14] will be applied The resonance can beinduced by a vibration of the bottom mirror as used by theQBounce collaboration [15] or an oscillating magnetic fieldgradient as in the GRANIT spectrometer [16]
In 2013 we have performed extensive tests of the vari-ous components of the facility and connected for the firsttime the source to the spectrometer In this paper we willpresent the characterization of the whole UCN chain the089 nm neutron beam the cryogenic production volumethe extraction guides and the mirror assembly We alsopresent a confrontation of the measurements to Monte-Carlo simulations Finally we present the first UCN fluxmeasurement in the GRANIT spectrometer
Hindawi Publishing CorporationAdvances in High Energy PhysicsVolume 2015 Article ID 730437 10 pageshttpdxdoiorg1011552015730437
2 Advances in High Energy Physics
Beamline
Monochromator
Cleanroom
SpectrometerMovable
Cryostat
neutron guide
Figure 1 The GRANIT instrument at Level C of ILL Grenoble
Coils
Granite
Vacuum chamber Vibration isolators
Neutron transportStorage volume
Transport
UCN guide
ILL floor level
Clean room floor level
Clean room UCN beam
table
mirror
Figure 2 The spectrometer in the cleanroom Measurement andcontrol instruments are installed on a flat massive granite table withthe mass of 550 kg all inside a welded aluminum vacuum chamberwith passivated wall surfaces All this is placed in a clean controlledarea (ISO 5) in order to protect the delicate optical elements
2 089 nm Neutrons Beam
In superfluid helium cold neutrons with the wavelength of120582 = 089 nm can be converted into UCNs through resonantphonon excitation [17] Therefore the UCN production ratein the source will depend directly on the neutron flux at thisprecise wavelength (119889Φ119889120582)|
089 nm
21 Monochromator Adjustment Themonochromator [11] iscomposed of 18 intercalated stage-2 KC
24crystals with a
lattice constant of119889 = 874 A According to the Bragg formulafor the first order reflection 2119889 sin 120579 = 120582 the outgoingbeamline angle corresponding to 120582 = 089 nm is found to be2120579 = 612 degrees defining the geometry of the installationdownstream
1400
1200
1000
800
600
400
200
020 30 40 50 60 70 80
9000
8000
7000
6000
5000
4000
3000
2000
1000
0
CN UCN120583 = 4993 plusmn 021 120583 = 5046 plusmn 026
120590 = 725 plusmn 027 120590 = 788 plusmn 043
THe-II = 075K
ROT (au)
CN300
s
UCN
18
s
Figure 3 Neutron rate as a function of themonochromator rotationangle for UCNs (dots) and cold neutrons (squares)
The position and orientation of the monochromator canbe adjusted remotely with five parameters rotation twotilt angles and two translation axes These parameters areoptimized bymaximizing theUCNflux out of the sourceThemost critical parameter is the rotation of themonochromatorfor which the neutron count rate varies by 80 of maximuma few degrees away from the optimal position For the otherparameters within their whole range the count rate variesat most by 40 The result of the scan is shown in Figure 3We checked that maximum UCN flux coincides with themaximum cold neutron flux indicating that the setup isaligned correctly
22 Differential Neutron Flux We have characterized thewavelength distribution in the beam using the time of flight(TOF) technique Two measurements were performed thefirst over a flight length of 78 plusmn 1 cm the second over 28 plusmn1 cm The spectrum of the first measurement is presented inFigure 4 together with a fit of the peaks We obtained for thefirst order peak the central wavelength 120582 = 0879(11) nmTheuncertainty is dominated by the error on the flight lengthwhich is itself defined by the uncertainty of knowledge of theposition in the gaseous detector where the reaction occuredThe width of the peak 120590 = 0022 nm is compatible with theexpected TOF resolution
The relative intensities of the peak shown in Figure 4do not reflect the relative intensities of the correspondingneutron fluxes due to at least three important effects Firstthe detector efficiency is proportional to 120582 according to the1V law Second losses in air estimated to be 13 for 089 nmneutrons are also proportional to 120582 Finally since differentwavelength components of the beam have different angulardivergencies the geometrical acceptance of the setup is alsowavelength dependent To suppress the latter a second TOFmeasurement with a shorter flight length of 28 plusmn 1 cm wasperformed
We show in Figure 5 the TOF spectrum recorded at theshort distance After correcting for the detector efficiency we
Advances in High Energy Physics 3
00
50
100
150
200
250
300
350
02 04 06 08 1 12 14
1224722Prob 1725e minus 28
Offset (nm) 0001246 plusmn 0000236
120582 (nm)
120582 (nm)
08791 plusmn 00004
1205909 (nm) 002182 plusmn 000021
1205905 (nm)1205903 (nm)
001551 plusmn 000014
001353 plusmn 000016
A9 2478 plusmn 30
A5
A3
3306 plusmn 40
1171 plusmn 23
C
ount
s per
10minus
3nm
1205942ndf
Figure 4 Long-distance (78 cm) TOF spectrum It is assumed thatthe three main peaks arise from the three first orders of Braggdiffraction which fixes the wavelengths 1205822 and 1205823 for the secondand third order peaksThere are 21 other free parameters to accountfor the offset of the119883-axis the amplitudes andwidth of theGaussianpeaks as well as ad hoc background description
0 02 04 06 08 1 12 140
20406080
100120140160180200220240 3157283
Prob 00883
Offset (nm) minus1113e minus 06 plusmn 4921e minus 03
120582 (nm)
120582 (nm)
08929 plusmn 00058
1205909 (nm) 01025 plusmn 00014
1205905 (nm) 01072 plusmn 00020
1926 plusmn 20A9
4091 plusmn 091A5
Cou
nts p
er3middot10minus
3nm
1205942ndf
Figure 5 Short-distance (28 cm) TOF spectrum The analysis issimilar to that for Figure 4 The dashed line is here to guide the eyeand the corresponding data points were not included in the fit
determined the relative contribution of the first and secondorder diffraction peaks to the total flux as
119901089= 074 119901
0445= 026 (1)
23 Integral Neutron Flux To determine the integral neutronflux of the H172A beamline we have used the standard goldfoil activation technique that allows us tomeasure the captureflux density defined by
Φgold = int119889120601
119889120582
120582
120582th119889120582 (2)
where 120582th = 018 nm is the wavelength of thermal neutronsIn July 2012 with a reactor power of 48MW we have obtainedthe following capture flux density
Φgold = 65 times 108 cmminus2sminus1 (3)
Knowing the proportion of each diffracted peak 119901120582
neutron flux in the 089 peak can be calculated
Φ[089 nm] = Φgold times
018 nm089 nm
times ( sum
120582isinpeaks
119901120582
119901089
times
120582
089 nm)
minus1
(4)
From the differential neutron flux results (equation (1)) weestimate Φ
[089 nm] = (11 plusmn 01) times 108 cmminus2 sminus1 Although the
intrinsic width of the peak is unknown it cannot be largerthan the measured TOF width 120590 = 002 nm Assuming aGaussian shape for 119889Φ119889120582 we deduce a worst case scenarioestimate (with our limit on 120590) of the differential neutron fluxat 089 nm
119889Φ
119889120582
10038161003816100381610038161003816100381610038161003816089 nm= Φ[089 nm] times
1
120590radic2120587
(5)
The actual flux inside the UCN conversion volume is fur-ther reduced by two effects First the walls of the conversionvolume (085mm thick aluminum and 1mm thick beryllium)attenuates the beam by a factor of 0895Then because of theangular divergence of the beam of 30mrad the fraction of thecold beam interacting with the source is 072 (estimated witha Monte-Carlo simulation)
Thus the effective 089 nm differential flux inside thesource is
119889Φ
119889120582
10038161003816100381610038161003816100381610038161003816
eff
089 nm= (13 plusmn 02) times 10
9 cmminus2sminus1nmminus1 (6)
with the reactor power of 48MW As the conversion rate inBeO vessel can be estimated [2] the volumic production rateis
119875 = (497 plusmn 038) times 10
minus9 nm sdot cmminus1 times 119889Φ119889120582
10038161003816100381610038161003816100381610038161003816
eff
089 nm (7)
We deduce that we produce 119875 times 119881 = 32000UCNs in our5-liter vessel with the reactor power of 48MW
3 UCN Source
The GRANIT superthermal UCN source is an evolution ofthe SUN1 apparatus [12 13] The UCN conversion volumeconsists of a vessel made out of BeOBe filled in withsuperfluid 4He where 089 nmneutrons are downscattered tothe UCN energy range by resonant phonon excitation Thisrectangular volume of the size 7 times 7 times 100 cm3 is placed incontinuity with the neutron guide which is also of squaredsection (7 times 7 cm2) The conversion volume is encased in acryostat that allows cooling the volume down to below 08 KA first commissioning of SUN1 at its definitive position wasreported in [12 13] where a large diameter extraction guidefrom the source to a UCN detector was installed In order toavoid diluting of UCNs in the phase-space density a moreelaborate extraction guide assembly with smaller diameterin particular was designed and built In the following wereport the necessarymodifications to the source as well as thecurrent performances
4 Advances in High Energy Physics
Figure 6 Extraction guides from the source to the spectrometerThe extraction guides are composed of several tubular elementswhich are thin foils of stainless steel inserted inside tubesThe designof the guides allows compensating for themisalignment between thesource and the spectrometer
To determine these performances a temporary set-upwas installed A box (filled in with Argon to reduce the UCNlosses) was connected to the UCN extraction guide outsidethe clean room That set-up allowed us to perform our firstmeasurements with UCNs
31 Cryostat With the assembly of the new extraction pre-sented in Figure 6 which connects the coldest part to theambient temperature first tests showed a loss of cryogenicpower In the first configuration it was not possible to cooldown the UCN volume below the temperature of 1 K thuswe had to increase the cryogenic power of the refrigeratorA first temporary set-up using a LN
2cooling system for the
thermal screens (around the inner parts of the extraction)was installed in order to validate that increasing power couldsolve the problem This set-up permitted us to reach thetemperature of 074K In the second configuration this LN
2
cooling system was replaced with a Sumitomo cold head150W 77K The outlet box of the cryostat and somethermal screens were also replaced The current cryogenicsystem is now adapted for our configuration Figure 7 showsa cool down and filling of the conversion volume
32 Separation Windows In several occurrences we needto physically separate volumes at different pressures keepingUCN-transparency This is the case for any gaseous UCNdetector Also the spectrometer vacuum has to be separatedfrom the extraction vacuum to avoid reheating in case ofspectrometer openings Any material separation is a cause ofextra UCN losses due to quantum reflection and absorption
The first choice for a material was aluminum that hasboth low optical potential (54 neV corresponding to a criticalvelocity of 32ms) and small neutronic absorption cross-section (sim102 barn for 5ms neutrons) However soft UCNs
1
10
100
0 20 40 60 80 100 120 140
T (K
)
Time (h)Startcryogenerators
Liquefactionstarting
Fillingstarting
Volumefilled
Cold headUCN volume4He pot3He pot
Figure 7 A successful cooldown in 100 hours The temperatureof several areas of the cryostat is constantly monitored It takes48 hours from the beginning to start 4He liquefaction whichhelps cooling the conversion volume 48 hours later the conversionvolume is cold enough for keeping liquid 4He 52 additional hoursare needed to fill in this volumeThen He-II can be cooled down tothe temperature of 074K
07
06
05
04
03
02
01
0
TiV
TiAl alloyAl
Mea
n tr
ansm
issio
n
E (neV)0 50 100 150 200 250
Figure 8 An analytical calculation of the probability of transmis-sion of UCNs through two foils (15120583m each for Ti V and TiAl alloy30 120583m each for Al) for an isotropic UCN gas as a function of UCNenergy
(with the velocity lower than 32ms) are supposed torepresent a nonnegligible fraction of UCNs extractable out ofthe source A simple calculation of the transmission throughtwo windows (one in the extraction and one for the gaseousdetector) considering an isotropic angular distribution ofUCNs illustrated in Figure 8 shows that better materialsexist for our application
We conclude that titaniumwould be better-suited as longas soft UCNs are available and pure titanium windows arequite easy to set up However the thickness of the windows isfar more critical for titanium than for aluminum (because of
Advances in High Energy Physics 5
Figure 9 Vacuum-separating window in the extraction guidesThefoil must guarantee the vacuum tightness but also it should resist toan overpressure of 15 bar max in both directions in case of eventualfast heating of the source Such overpressure is limited using twosafety valves The window is made with 2 aluminum half piecesmilled by electrocutting reinforced by letting ribs 025mm thickBetween these two parts a titanium foil 0015mm thick and 2 orsquoringsare insertedThe assembly is boltedThe window assembly had beentested with success under vacuum and under 5 bar pressure
the absorption cross-section for neutrons) Thus dependingon mechanical constraints the windows should be as thinas possible Figure 9 shows the extraction window betweenthe extraction and the spectrometer that was designed forGRANIT
33 UCN Count Rate versus Temperature Ameasurement ofthe UCN count rate as a function of He-II temperature wasrealizedwith a 3He counterThe extractionwindowwasmadeof a 30 120583m aluminum foil as well as the detector entrancewindow The result is presented in Figure 10
Two regimes appear When 119879 ge 12K the UCN flux ishighly dependent on temperature because of the upscatteringof UCNs in He-II At lower temperature (119879 le 09K) theUCN flux saturates because the main losses are caused byabsorption of UCNs in the beryllium walls of the conversionvolume If this effect was an order of magnitude smallerthe transition would occur at a lower temperature andthe saturation UCN density would be nearly an order ofmagnitude higher
When the UCN valve of the source is open radiativeheat on He-II causes an important increase in temperature(0045Kmin) For this reason the valve should not beopened for longer than 10ndash15 seconds in order to have areliable and stable measurement as well as to be able to coolback down He-II (sim10min) Thus the source can operate ina pulsed regime at a temperature below 09 K (stable as longas the opening time of the valve is short) or in a continuousmode at a higher but always stable temperature (sim13 K) butwith a smaller UCN flux
34 Source and Extraction Characteristic Times We definetwo characteristic times for this system The emptying time120591emptying is the average time necessary to extract UCNs fromthe apparatus The storage time 120591storage is the average lifetimeof UCNs in the isolated source
UCN
flux
(sminus1)
100
10
06 08 1 12 14 16 18 2
Source temperature (K)
1
Figure 10UCNcount rate versus the temperature ofHe-IIThe coldneutron beam constantly passes through the source and the UCNvalve is opened periodically
UCN
coun
t rat
e(sminus1)
Time (s)
1000
100
0 10 20 30 40 50 60
THe-II = 081K
CR0 = 1308 plusmn 27 sminus1
120591 = 129 plusmn 04 s
Figure 11 Emptying time ofUCNs in the source and extractionwithTi windows
Table 1 Emptying time of UCNs in the source and extraction withtwo titanium windows for several waiting times
Waiting time (s) 120591emptying (s)0 129 plusmn 04
50 186 plusmn 06
100 238 plusmn 14
Theemptying time ismeasured by accumulatingUCNs inthe source during 2min then closing the cold beam shutterand waiting for a few seconds The UCNs are then releasedthrough the extraction to a UCN detector with a differentialUCN count measurement The data are fitted with a singleexponential as illustrated in Figure 11The results for differentwainting times are summarized in Table 1 One can noticethat the longer the waiting time the longer the emptyingtime We conclude that the softer UCNs are stored longerin the source and that a sufficiently long time must bechosen to integrate the number of neutrons extractedwithoutintroducing a bias between measurements with differentwaiting times
The storage time ismeasured in a similar way but the totalnumber of extracted neutrons is counted and the procedure
6 Advances in High Energy Physics
10000
1000
1000 50 100 150 200
Waiting time (s)
UCN
s
THe-II = 081KN1 = 11174 plusmn 617
1205911 = 288 plusmn 18 s
N2 = 861 plusmn 655
1205912 = 1062 plusmn 480 s
Figure 12 Storage time of UCNs in the source with Ti windows
Table 2 Storage time in different configurations
Extraction Detector 120591storage (s) 081 KAl Al 210 plusmn 04
Ti Al 213 plusmn 04
Ti Ti 304 plusmn 07
is repeated for different waiting times This time is obtainedby fitting the data with a double exponential as shown inFigure 12 and calculating theweighted geometricmean of thetwo decay constants The two exponentials allow accountingfor several UCN populations with different velocities andstorage times where a single exponential is not sufficient
The storage timemeasurement was performed for severalcombinations of extraction and detector windows materialsThe results are summarized in Table 2 Having at least onealuminum window cuts out the soft UCNs resulting insimilar storage times for Al-Al and Ti-Al configurationsUsing only titanium allows recovering the soft UCNs Thenoticable increase of the storage time is expected as slowerUCNs have less collisions on the source walls The choice oftitanium windows is therefore justified and gives us access toa nonnegligible fraction of the UCN velocity spectrum
The results show that 120591emptying lt 120591storage the source canwork in an accumulationmodewhereUCNs are accumulatedin the source and then released all at the same time towardsthe spectrometer
35 UCN Velocity Spectrum The velocity distribution ofUCNs can be determined with a free fall experiment asdescribed in Figure 13 The height of free fall for a UCN witha defined horizontal velocity is
ℎ =
119892
2
(
119889freefallVUCN)
2
(8)
Assuming we have spatially isotropic distribution ofUCNs within our collimation system (this assumption isvalid with high accuracy for any broad angular distributionof UCNs in the extraction system) the measurement of
Vacuum UCNs
UCNs
Ti foil
AbsorberMirror
B4C Argon
500120583m
26 cm
12 cm
Polyethylene foil
D
H
Figure 13 Set-up for free fall measurement in an argon-filled boxthe UCN beam is collimated with a 12 cm long absorber-mirrorsystem forming a slit of height 500 120583mA detector with a 15 120583m thicktitaniumwindow is placed at the distance of 26 cm from the slit andrecord the neutron count as a function of the fixed free fall height
horizontal velocity of the collimated UCNs is representativeof the velocity distribution of the UCNs in the extraction
The recorded UCNs counts as a function of the free fallheight are shown in Figure 14 In order to obtain a velocityspectrum for this measurement we make a Monte-Carlosimulation of the experiment to fit the initial velocity spectrato the data Two shapeswere assumed for the initial spectruma Gaussian distribution and an asymetric triangular distribu-tion Both fitted correctly the data and the obtained resultsfor the mean and RMS of the distribution are
120583Gauss = 51m sdot sminus1 120590Gauss = 16m sdot s
minus1
120583Triangle = 53m sdot sminus1 120590Triangle = 14m sdot s
minus1
(9)
The asymetric triangular distribution is zero below 22msmaximum at 45ms and zero above 90ms In both caseswe obtain a coarse UCN velocity spectrum and notice a quitewide distribution around the mean value
Because of the low statistics (some hundreds of UCNscounted for 30 minutes) the valve was always open (thusthe temperature was 135 K) In this configuration there isno accumulation of soft UCNs in the source thus a highermean velocity than what we could have This method ofmeasurement for the velocity spectrum of UCNs thoughlacking in precision was successful The precision could beimproved by designing a UCN detector with a dedicatedgeometry or a large position-sensitive detector and a vacuum-tight environmentThe result itself is in agreement with whatwe expected and confirms that the sourceextraction systemwe use is well-suited for the GRANIT spectrometer
4 Spectrometer
41 Description UCNs are transported through the extrac-tion guide from the He-II source to the spectrometer asshown in Figure 6 The extraction guides and the extractionwindow are the same as the previous configuration Theguides connect the source to an intermediate storage volumedepicted in Figure 15 Optical elements at the heart ofthe spectrometer are connected at the exit of the storagevolume They are sets of silica pieces with different coatings
Advances in High Energy Physics 7U
CN1800
s
Free fall height (cm)
120
100
80
60
40
20
0minus1 0 1 2 3 4 5 6
Measurement
Fit Gauss 1205942dof = 26635
Fit Triangle 1205942dof = 30636
Figure 14 Number of UCNs detected for 30min versus the freefall height During the measurement the temperature of He-II was135 K Since the UCN spectrum is defined by the storage andtransmission properties of the whole system and the temperatureof He-II affects only the total count rates the exact value of thetemperature is of no importanceThismeasurement was fittedwith aMonte-Carlo simulation assuming an initial triangular or Gaussianspectrum
Connection with
Window for the
Aluminum platescoated with DLC
the UCN valve
connection of mirrors
Figure 15The DLC-coated storage volumeThe inner sizes are 40times40 times 340mm3
and roughness states providing different conditions to thetransport of UCNs They are described in Figures 16 and 17All these parts have been provided by the SESO Company inAix en Provence (France) and Diamond-Like Carbon (DLC)coatings were applied by Advanced Material Laboratory(IN2P3 France)
The intermediate storage volume made of several alu-minum parts coated with DLC is designed to randomize theUCNs trajectories In order to close the storage volume anickel-coated butterfly valve is used preventing the UCNsfrom returning into the source The exit of the intermediatestorage volume is closed by the first optical elements ofthe spectrometer forming a slit and allowing only UCNs
Transport mirrorwith edges
Scatterer
Extraction mirror
Resonant transitions
Absorber
UCNs
Adjustment micrometric screws
005 lt slit lt 02mm
Figure 16 Schematics and pictures of the optical elements Theextraction mirror and the scatterer have the same sizes (300 times 100 times20mm3) and each consists of 3 pieces of 100 times 100 times 20mm3 gluedtogether The mean roughness of the extraction mirror (floor) isvery low (05 nm) to allow for specular bouncing whereas the meanroughness of the scatterer (ceiling) is intentionally high (56 120583m)to allow UCNs with too high vertical velocity to be diffused backThe transport mirror (300 times 250 times 70mm3) has a surface meanroughness of 05 nm and a planarity of 80 nm The absorber mirroris 300 times 90 times 30mm3
UCNs
Piezo element
Piezo element
The complete installation
Transport mirror
AbsorberExtraction mirror and scatterer
UCN detector with Cd shielding
adjustment of thetransport mirror absorber
adjustment of the
Figure 17 The optical elements on the granit table The extractionmirrors assembly and the transport mirror are placed on twoseparate adjustable supports Their adjustment could be done with3 + 3 micrometric screws To adjust the height and the orientationof the surface of the transport mirror with a great accuracy we use 3piezo-electric elements The distance between the absorber and thetransportmirror is adjustable as well using 3 piezo-electric elementsThe piezos are driven from the control computer with a Labviewapplication
with negligible vertical velocity to be transmitted The slitis composed of an extraction mirror and a scatterer Thescatterer is placed above the extraction mirror at a heightbetween 50 and 200 120583m Both are coated with DLC in orderto provide reflection of UCNs with a broad velocity rangefrom the surfaces and thus to assure proper operation of theso-called semidiffusive slit [18 19]
8 Advances in High Energy Physics
4 modules ready to be connected
128-wires array
No convectionCooling system is required
Circulation of cooled N2
+ LN2 heat exchanger
50W to be evacuated
Figure 18 The magnetic excitation array is made of 4 modules of 32 wires each (1mm2) constituting a 128-wire array The wires are spacedby 025mm
The second part of the spectrometer is a transportmirror aligned with the slit (or positionned a few microm-eters abovebelow the slit allowing the selection of quan-tum states) The magnetic excitation array [16] describedin Figure 18 can be placed above it To induce resonanttransitions between quantum states a periodicmagnetic fieldgradient will be producedwith an array of wires located abovethe transport mirror The third part of the spectrometer is anabsorber placed above and at the end of the transport mirrorat an adjustable height to filter the quantum states
42 Cooling of the Magnetic Excitation Array The magneticexcitation array was built and tested before set-up Thecurrent needed (5A in average) to generate a sufficientmagnetic field gradient produces 50W of power that hasto be dissipated without affecting too much the transportmirror The wire system must be cooled down Circulationof cooled gaseous N
2will be used for that purpose To test
the cooling in conditions as close as in the experimental set-up the magnetic excitation array was placed in a vacuumchamber and connected to a power supply (5 A 8V) Theheat exchanger was placed in a LN
2tank at a distance of
9m from the magnetic excitation array and a circulating N2
circuit linked the heat exchanger to the magnetic excitationarray Results of that test were very good and we could easilystabilize the temperature of the wires at 15∘C during 12 hwithout human intervention The magnetic excitation arrayequipped with the cooling system will be installed duringautumn 2014
43 Preliminary Results In summer 2013 we conducted thefirst tests of the full extraction chain During this cycle thesource temperature could not be cooled lower than 135 KRemoving the transport mirror and the absorber and placingthe detector at the exit of the extraction slit of height 127 120583mwe measured the first UCNs in the GRANIT spectrometerThe 3He detector was equipped with a titanium window In
Signal amplitude (V)06 08 1 12 14 16 18 2
0
100
200
300
400
500
600
Measurement 1471 eventsNormalized background 832 events
Amplitude spectrum of UCNs and backgroundN
umbe
r of e
vent
s dur
ing58842
s
Figure 19 Amplitude spectrum of UCNs and background Thetemperature of the source was 135 K
this configuration we measured (109 plusmn 15) times 10minus3UCNs asshown in Figure 19
This count rate is one order of magnitude lower thanexpected in this configuration and two orders of magnitudelower than targeted Potential explanations include (i) a defectin the extraction which because of the modifications of theconfiguration did not exist in the previous measurements(ii) defects in the DLC-coated storage volume which hasnot been characterized on its own due to its particulargeometry and (iii) the collection of impurities on a cold spoton the extraction window This opens the way to furtherimprovements and tests in the next cycles which could notbe done immediately because of the long reactor shutdownright after this measurement In addition the backgroundestimated to 14times10minus3 eventss is high compared to the signalbecause of background fast neutrons in the reactor building
Advances in High Energy Physics 9
He-II inBeBeO volume
Iron valve Extraction
Titanium window
Figure 20 Geometry described and used in the simulation
Extra-shielding will be added to the installation in order toreduce this background
5 Simulation
STARucn (Simulation of Transmission Absorption andReflection of ultracold neutrons) is a public Monte-Carlosoftware designed to simulate experimental set-ups andguides for UCNs developped at LPSC Grenoble [20] It reliesheavily on CERNrsquos ROOT packages [21] Its main features aremodularity easy configuration of geometry and simulationpropagation of UCNs with or without gravity interaction involumes through effective lifetime and interaction at surface(quantum reflection or transmission surface losses due toabsorbtion upon reflection and specular and diffuse reflec-tion) These features had been successfully benchmarkedagainst analytical calculations and existing codes such asMCUCN of PSI and GEANT4UCN [22]
In STARucn a material is described with its Fermipotential119881
119865 its fraction of diffuse reflections 119889 its loss factor
120578 defined as the ratio of imaginary to real part of the Fermipotential and its effective lifetime 120591 in the material
Severalmeasurements of the source characteristics can beused to estimate the unknown values of the parameters of thevarious materials Our simulation (with geometries such asin Figure 20) shows that the build-up time within the sourceis only driven by the losses on the Be and BeO surfaces ofthe source Using results from 2010 measurement [12 13] weset 120578Be = 27 times 10
minus4 In a similar way the emptying timedepends mostly on the reflective properties of the stainlesssteel extraction Assuming this property is uniform in allthe extraction the best fit is found at 119889steel extraction = 3The parameter 119889Be was arbitrarily set to 01 because thesimulation showed that it had no significant influence on anymeasurement
Assuming a production of 38000UCNs isotropicallydistributed in phase space in the source (corresponding tothe reactor power of 56MW) the expected number of UCNsdetected in the simulation is around 5 times higher thanwhat is measured No satisfactory explanation was found forinstance a 12 cm2 hole in the extraction combinedwith a high120578steel extraction would be needed The most relevant figures arein Table 3
Possible candidates to explain these losses are a largerangular divergency of the incoming beam of cold neutronsin the source than estimated an eventual misalignement ofthe monochromator reducing the production rate eventual
Table 3 Comparison of previous and recent measurements withsimulations The number of extractible UCNs correponds to thenumber of UCNs available in the source after the UCN densityhas been saturated according to the simulation The number ofextracted UCNs corresponds to the number of UCNs detectedduring the experiments The measured (resp simulated) extractionefficiency is the ratio of the number of UCNs detected during themeasurement (resp the simulation) to the simulated number ofextractible UCNs The missing factor is calculated according to thediscrepancy between these two efficiencies
Configuration 2010 [12 13] 2013Storage time (meas) 67 s 30 sExtractible UCNs (sim) 22 times 10
610 times 10
6
Extracted UCNs (meas) 274000 21000
Extraction efficiency (meas) 13 21Extraction efficiency (sim) 65ndash50 15ndash5Missing factor 4-5 25ndash7
defects or losses in the extraction andor degradation of theBeO source volumeThese options will be investigated duringthe next ILL reactor cycles
Moreover simulating the experiment of Section 43 withthe corresponding count rate as measured in Section 21and the spectrum as measured in Section 35 the numberof neutrons measured is 10 times lower than simulatedHowever no other measurement during this cycle can ruleout a problem with the source or the extraction
6 Improvements
These tests of all elements of theGRANIT experiment promptus tomodify some parts of the set-up Some of improvementsare quite easy to perform The cleanliness of the extractionguides could be easily improved starting with a rigorous anddefined production process then having good proceduresfor washing stoving and packaging each part just beforeinstallation
Moreover due to the narrow UCN velocity range pro-duced in the UCN source DLC coating in extraction mir-rors and intermediate storage volume is no longer crucialFor the next steps we will replace the stainless steel foils ofthe extraction (that were dued to be DLC-coated) by elec-tropolished tubes This will decrease the UCN losses due tothe properties of the surface (mainly roughness and hydrogenadsorption) of these foils and will considerably help for theassembly of the guide as well as for connecting source tospectrometer thus diminishing risks of damage
For the same reasons the intermediate storage volumewill be replaced with a new one made of oxygen free highconductivity copper and in a cylindrical shape thus increasingthe life time of UCNs in the volume and decreasing UCNlosses Another effort must be done to adjust the opticalelements with more reliability without the contact of a probeA solution using laser sensors is under study
10 Advances in High Energy Physics
7 Conclusion
We have overviewed the current status of the GRANITfacility First complete test of the GRANIT UCN source andspectrometer was performed during the last reactor cyclein 2013 Further improvements are identified based on themeasured results and they are being implemented
Conflict of Interests
The authors declare that there is no conflict of interestsregarding the publication of this paper
Acknowledgments
The authors thank all the members of the GRANIT collabo-ration
References
[1] S Baessler M Beau M Kreuz et al ldquoThe GRANIT spectrom-eterrdquo Comptes Rendus Physique vol 12 no 8 pp 707ndash728 2011
[2] P Schmidt-Wellenburg K H Andersen P Courtois et alldquoUltracold-neutron infrastructure for the gravitational spec-trometer GRANITrdquoNuclear Instruments andMethods in PhysicsResearch Section A Accelerators Spectrometers Detectors andAssociated Equipment vol 611 no 2-3 pp 267ndash271 2009
[3] V V Nesvizhevsky H G Borner A K Petukhov et al ldquoQuan-tum states of neutrons in the Earthrsquos gravitational fieldrdquo Naturevol 415 no 6869 pp 297ndash299 2002
[4] V V Nesvizhevsky H G Boerner AM Gagarsky et al ldquoMeas-urement of quantum states of neutrons in the Earthrsquos gravita-tional fieldrdquo Physical ReviewD vol 67 no 10 Article ID 1020029 pages 2003
[5] V V Nesvizhevsky A K Petukhov H G Borner et al ldquoStudy ofthe neutron quantum states in the gravity fieldrdquo The EuropeanPhysical Journal C vol 40 no 4 pp 479ndash491 2005
[6] S Baeszligler V V Nesvizhevsky K V Protasov andA Y VoroninldquoConstraint on the coupling of axionlike particles to matter viaan ultracold neutron gravitational experimentrdquo Physical ReviewDmdashParticles Fields Gravitation and Cosmology vol 75 no 7Article ID 075006 2007
[7] V VNesvizhevsky G Pignol andKV Protasov ldquoNeutron scat-tering and extra-short-range interactionsrdquo Physical Review Dvol 77 no 3 Article ID 034020 8 pages 2008
[8] I Antoniadis S BaesslerM Buchner et al ldquoShort-range funda-mental forcesrdquoComptes Rendus Physique vol 12 no 8 pp 755ndash778 2011
[9] P Brax and G Pignol ldquoStrongly coupled chameleons and theneutronic quantum bouncerrdquo Physical Review Letters vol 107no 11 Article ID 111301 4 pages 2011
[10] I Antoniadis S Baessler O Bertolami et al ldquoWorkshopGRANIT-2010 14-19 February 2010 Les Houches FrancerdquoComptes Rendus Physique vol 12 no 8 pp 703ndash706 2011
[11] P Courtois C Menthonnex R Hehn et al ldquoProduction andcharacterization of intercalated graphite crystals for cold neu-tron monochromatorsrdquo Nuclear Instruments and Methods inPhysics Research Section A Accelerators Spectrometers Detec-tors and Associated Equipment vol 634 no 1 pp S37ndashS40 2011
[12] O Zimmer FM Piegsa and SN Ivanov ldquoSuperthermal sourceof ultracold neutrons for fundamental physics experimentsrdquoPhysical Review Letters vol 107 no 13 Article ID 134801 4pages 2011
[13] F Piegsa M Fertl S N Ivanov et al ldquoNew source for ultracoldneutrons at the Institut Laue-Langevinrdquo Physical Review C vol90 no 1 Article ID 015501 10 pages 2014
[14] V V Nesvizhevsky and K V Protasov ldquoQuantum states of neu-trons in the Earthrsquos gravitational field state of the art applica-tions perspectivesrdquo in Trends in QuantumGravity Research pp65ndash107 Nova Science 2005
[15] T Jenke P Geltenbort H Lemmel and H Abele ldquoRealizationof a gravity-resonance-spectroscopy techniquerdquoNature Physicsvol 7 no 6 pp 468ndash472 2011
[16] G Pignol S Baeszligler VVNesvizhevsky K ProtasovD Rebrey-end and A Voronin ldquoGravitational resonance spectroscopywith an oscillating magnetic field gradient in the GRANIT flowthrough arrangementrdquo Advances in High Energy Physics vol2014 Article ID 628125 7 pages 2014
[17] R Golub and J M Pendlebury ldquoThe interaction of Ultra-ColdNeutrons (UCN) with liquid helium and a superthermal UCNsourcerdquo Physics Letters A vol 62 no 5 pp 337ndash339 1977
[18] J Barnard and V Nesvizhevsky ldquoAnalysis of a method forextracting angularly collimated UCNs from a volume withoutlosing the density insiderdquo Nuclear Instruments and Methods inPhysics Research Section A Accelerators Spectrometers Detec-tors and Associated Equipment vol 591 no 2 pp 431ndash435 2008
[19] P Schmidt-Wellenburg J Barnard PGeltenbort et al ldquoEfficientextraction of a collimated ultra-cold neutron beam usingdiffusive channelsrdquoNuclear Instruments andMethods in PhysicsResearch A vol 577 no 3 pp 623ndash625 2007
[20] httpsourceforgenetprojectsstarucn[21] R Brun and F Rademakers ldquoROOTmdashan object oriented data
analysis frameworkrdquoNuclear Instruments and Methods in Phys-ics Research Section A Accelerators Spectrometers Detectorsand Associated Equipment vol 389 no 1-2 pp 81ndash86 1997
[22] FAtchison T BrysMDaumet al ldquoThe simulation of ultracoldneutron experiments using GEANT4rdquoNuclear Instruments andMethods in Physics Research Section A vol 552 no 3 pp 513ndash521 2005
Submit your manuscripts athttpwwwhindawicom
Hindawi Publishing Corporationhttpwwwhindawicom Volume 2014
High Energy PhysicsAdvances in
The Scientific World JournalHindawi Publishing Corporation httpwwwhindawicom Volume 2014
Hindawi Publishing Corporationhttpwwwhindawicom Volume 2014
FluidsJournal of
Atomic and Molecular Physics
Journal of
Hindawi Publishing Corporationhttpwwwhindawicom Volume 2014
Hindawi Publishing Corporationhttpwwwhindawicom Volume 2014
Advances in Condensed Matter Physics
OpticsInternational Journal of
Hindawi Publishing Corporationhttpwwwhindawicom Volume 2014
Hindawi Publishing Corporationhttpwwwhindawicom Volume 2014
AstronomyAdvances in
International Journal of
Hindawi Publishing Corporationhttpwwwhindawicom Volume 2014
Superconductivity
Hindawi Publishing Corporationhttpwwwhindawicom Volume 2014
Statistical MechanicsInternational Journal of
Hindawi Publishing Corporationhttpwwwhindawicom Volume 2014
GravityJournal of
Hindawi Publishing Corporationhttpwwwhindawicom Volume 2014
AstrophysicsJournal of
Hindawi Publishing Corporationhttpwwwhindawicom Volume 2014
Physics Research International
Hindawi Publishing Corporationhttpwwwhindawicom Volume 2014
Solid State PhysicsJournal of
Computational Methods in Physics
Journal of
Hindawi Publishing Corporationhttpwwwhindawicom Volume 2014
Hindawi Publishing Corporationhttpwwwhindawicom Volume 2014
Soft MatterJournal of
Hindawi Publishing Corporationhttpwwwhindawicom
AerodynamicsJournal of
Volume 2014
Hindawi Publishing Corporationhttpwwwhindawicom Volume 2014
PhotonicsJournal of
Hindawi Publishing Corporationhttpwwwhindawicom Volume 2014
Journal of
Biophysics
Hindawi Publishing Corporationhttpwwwhindawicom Volume 2014
ThermodynamicsJournal of
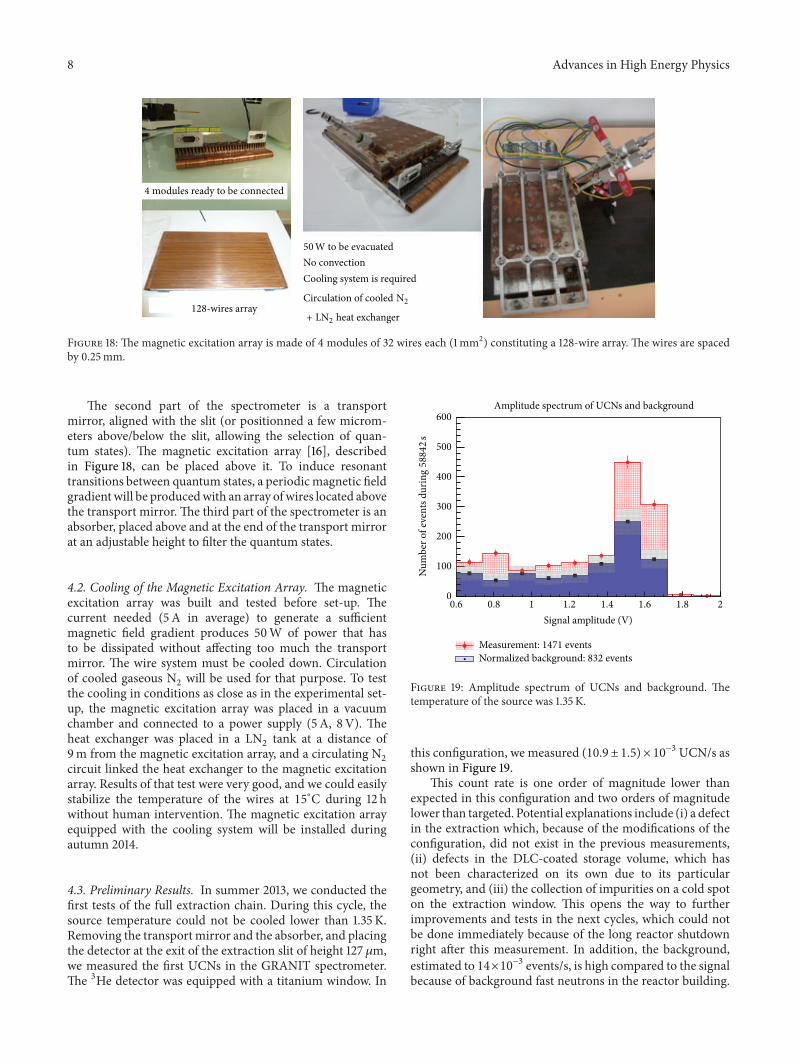