Embed Size (px)
Citation preview

Hindawi Publishing CorporationAdvances in HematologyVolume 2013, Article ID 237351, 9 pageshttp://dx.doi.org/10.1155/2013/237351
Research ArticleSonoclot Signature Analysis in Patients with Liver Disease andIts Correlation with Conventional Coagulation Studies
Priyanka Saxena,1 Chhagan Bihari,1 Archana Rastogi,2 Savita Agarwal,2
Lovkesh Anand,3 and Shiv Kumar Sarin3
1 Department of Hematology, Institute of Liver and Biliary Sciences, D-1, Vasant Kunj, New Delhi 110070, India2Department of Pathology, Institute of Liver and Biliary Sciences, D-1, Vasant Kunj, New Delhi 110070, India3 Department of Hepatology, Institute of Liver and Biliary Sciences, D-1, Vasant Kunj, New Delhi 110070, India
Correspondence should be addressed to Chhagan Bihari; [email protected]
Received 10 July 2013; Revised 29 September 2013; Accepted 2 October 2013
Academic Editor: John Roback
Copyright © 2013 Priyanka Saxena et al.This is an open access article distributed under theCreativeCommonsAttribution License,which permits unrestricted use, distribution, and reproduction in any medium, provided the original work is properly cited.
Introduction. Liver disease patients have complex hemostatic defects leading to a delicate, unstable balance between bleeding andthrombosis. Conventional tests such as PT and APTT are unable to depict these defects completely. Aims. This study aimed atanalyzing the abnormal effects of liver disease on sonoclot signature by using sonoclot analyzer (which depicts the entire hemostaticpathway) and assessing the correlations between sonoclot variables and conventional coagulation tests. Material and Methods.Clinical and laboratory data from fifty inpatients of four subgroups of liver disease, including decompensated cirrhosis, chronichepatitis, cirrhosis with HCC and acute-on-chronic liver failure were analyzed. All patients and controls were subjected to sonoclotanalysis and correlated with routine coagulation parameters including platelet count, PT, APTT, fibrinogen, and D-dimer. Results.The sonoclot signatures demonstrated statistically significant abnormalities in patients with liver disease as compared to healthycontrols. PT and APTT correlated positively with SONACT (𝑃 < 0.008 and <0.0015, resp.) while platelet count and fibrinogenlevels depicted significant positive and negative correlations with clot rate and SONACT respectively. Conclusion. Sonoclot analysismay prove to be an efficient tool to assess coagulopathies in liver disease patients. Clot rate could emerge as a potential predictorof hypercoagulability in these patients.
1. Introduction
Patients with liver disease show significant changes in thehemostatic system. Consequently, routine diagnostic testssuch as platelet count, prothrombin time (PT), and acti-vated partial thromboplastin time (APTT) are frequentlyabnormal. However, interpretation of these tests is much lessaccurate in patients with complex hemostatic disorders as canbe found in patients with liver disease [1]. It is now establishedthat patients with liver disease not only have bleeding tenden-cies but may develop thrombotic complications as well [2].
The inability of PT-INR andAPTT to predict the bleedingrisk can be explained by the fact that they incompletely reflectthe coagulation process. The parallel decline in the level ofnatural anticoagulants leading to a prothrombotic tendency isnot depicted by these tests. Additionally, significant variationsin the INR values have been reported in liver disease patients
when tested in different laboratories. Due to this poorreproducibility of INR values, models for end stage liverdisease (MELD) score variations up to 12 points have beennoted [3]. This could lead to significant discrepancies in themanagement of these patients.
Standard coagulation tests such as PT and APTT do notincorporate cellular elements. They tend to provide data onisolated aspects of coagulation cascade and overlook factorssuch as rate of clot formation, time taken for maximal clotretraction, and maximal clot strength. Instead, viscoelasticdevices such as sonoclot provide in vitro assessment ofglobal coagulation. Sonoclotmay also be useful in diagnosingsystemic fibrinolysis, though it may not reflect localized clotbreakdown by plasmin. Most conventional coagulation testsend when the first fibrin strands are developing, whereasviscoelastic coagulation tests begin at this point and continuethroughout clot development, retraction, and lysis [4].

2 Advances in Hematology
Clot
sign
al
0 5 10 15 20 25 30(min)
Time topeak
ACT
Peakamplitude
CRR1
R2
R3
Group description
Style Time Patient Test Result Range Comment Date12:42:16 p.m. gb ACT+
Clot rate = 38(96.0–182.0)(15.0–45.0)
(>1.6)
Mar 8, 2013
0
25
50
75
100
125
ACT = 103
Plateletfunction = 3.7
Figure 1: Normal sonoclot signature ACT (SONACT: activated clotting time), CR: clot rate.
This study was carried out to analyze the abnormal-ities of sonoclot signature in patients with liver diseasesincluding chronic hepatitis, decompensated cirrhosis, com-pensated cirrhosis with hepatocellular carcinoma, and acute-on-chronic liver failure. The sonoclot signature parametersstudied included sonoclot activated clotting time (SONACT),clot rate (CR), platelet function (PF), time to peak (TP),peak amplitude (PA), and R2 peak character. We also aimedto establish a correlation between the above mentionedsonoclot parameters and conventional coagulation tests likePT, international normalized ratio (INR), APTT, fibrinogenlevels, platelet count, and D-dimer levels in these patients.
2. Sonoclot Coagulation and Platelet FunctionAnalyzer, Sienco Inc., Arvada, CO, USA
The sonoclot analyser was introduced by von Kaulla etal. in 1975. Sonoclot measurements are based on detectionof viscoelastic changes in the whole blood sample. Theinstrument provides information on the entire hemostaticprocess in the form of a qualitative graph known as sonoclotsignature along with several quantitative measurements [5].
The quantitative measurements include sonoclot acti-vated clotting time (SONACT) which is the onset time inseconds till the beginning of fibrin formation. The rate offibrin formation from fibrinogen is depicted by the gradientof primary slope (R1) and is known as clot rate (CR). Itis expressed in units per minute. The secondary slope (R2)reflects fibrin polymerization and platelet-fibrin interaction.The R2 peak indicates completion of fibrin formation andhas two variables, the time to peak (in minutes), which is
an index of the rate of conversion of fibrinogen to fibrin,and peak amplitude (expressed in units), which is an indexof fibrinogen concentration. The downward slope (R3) afterthe peak is produced as platelets induce contraction of thecompleted clot. In cases of low platelet counts and/or poorplatelet function, a shallow R3 slope is obtained. Hence,the R3 slope gradient determines the number of availableplatelets and the level of platelet function and is recorded asplatelet function (PF) by the analyzer (Figure 1). In patientswith accelerated fibrinolysis, the decrease in signal after theR3 slope can be clinically used as a measure of fibrinolysis[6].
3. Material and Methods
3.1. Patients and Control. An observational study was carriedout over a period of three months wherein data of 50 adultinpatients without any anticoagulation therapy with liverdisease in a superspeciality liver institute were analyzed. Thestudy also included 10 healthy controls fromvoluntary donorsat the blood bank.None of the candidates in the control grouphad any other apparently known disease. Exclusion criteriafor controls were presence of any chronic medical condition(especially coagulopathies), patients on anticoagulation, andindividuals on long term medications.
Patients were classified into four groups:
(1) Group 1 (G1) or decompensated cirrhosis (D. cirrho-sis) included 16 (32%) patients with decompensatedcirrhosis which was defined by histological presenceof regenerative nodules surrounded by fibrosis withclinical stage 3 or 4 [7] along with presence of ascites,

Advances in Hematology 3
Table 1: Demographic and clinical data.
Demographic data Patient groups (𝑁 = 50) Control group (𝑁 = 10)Male : female 34 : 16 6 : 4Age mean ± SD 50.7 ± 10.68 34.2 ± 9.4
Clinical data Patient groupsG1 (𝑁 = 16) G2 (𝑁 = 14) G3 (𝑁 = 11) G4 (𝑁 = 09)
History of bleed 4 (25%) 1 (7%) 1 (9%) —Hepatic encephalopathy 8 (50%) 3 (21%) — 4 (44%)Sepsis 6 (37.5%) 3 (21%) 1 (9%) 3 (33%)G1: group 1 (decompensated cirrhosis), G2: group 2 (noncirrhotic liver disease), G3: group 3 (cirrhotic HCC), G4: group 4 (ACLF).
variceal haemorrhage, encephalopathy, or jaundice[8]. This group comprised eight patients with alco-holic cirrhosis, one patient with hepatitis C-relatedcirrhosis, five patients with cryptogenic cirrhosis,and two patients with nonalcoholic steatohepatitis(NASH) induced cirrhosis.
(2) Group 2 (G2) or chronic hepatitis (CH) included14 (28%) patients with chronic liver disease (CLD)other than cirrhosis (chronic hepatitis group). Thisgroup comprised four patients with chronic alcoholichepatitis, seven patients with chronic viral hepatitis,and three patients with chronic cholestatic hepatitis.
(3) Group 3 (G3) or cirrhosis included 11 (22%) patientswith compensated cirrhosis who had an additionalfinding of hepatocellular carcinoma (HCC).
(4) Group 4 (G4) or acute-on-chronic liver failure(ACLF) included nine (18%) patients with acuteon chronic liver failure (ACLF) as defined by theAsia Pacific Association for the Study of the Liver(APASL). The APASL’s definition of ACLF is “acutehepatic insult manifesting as jaundice and coagulopa-thy, complicated within 4 weeks by ascites and/orencephalopathy in a patient with previously diag-nosed or undiagnosed chronic liver disease” [9].
(5) A fifth group (control group) was created whichcomprised 10 voluntary healthy controls.
Patients in G3 (cirrhosis) were segregated fromG1 (D. cirrho-sis) (though both groups consisted of patients with cirrhosis)because there is sufficient recent evidence to indicate thatcompensated and decompensated cirrhosis are two separateentities and should be analyzed separately [8, 10]. In our study,the patient group of compensated cirrhosis had an additionalfinding of HCC.
3.2. Demographic Data andClinical Presentation. Theclinicalprofile of the patients including age, sex, clinical presentation,underlying liver disease, and bleeding history was recordedand summarized in Table 1.
There were 34 male (68%) and 16 female (32%) patients.The minimum age was 29 years while the maximum age was70 years with a mean age of 50.7 years (SD ± 10.68). Thecontrol group consisted of 6 male (60%) and 4 female (40%)patients. The minimum age was 20 years and the maximumwas 52 years with a mean age of 34.2 years (SD ± 9.4).
The most common cause in G1 (D. cirrhosis) wasalcoholic liver disease. Eight patients (50%) in the groupwere clinically reported to have hepatic encephalopathy.Additionally, four patients (44.4%) in G4 (ACLF) also hadhepatic encephalopathy. A total of 13 patients out of 50 (26%)developed features of sepsis, six of which belonged to G1(D. cirrhosis) (37.5%), three belonged to G2 (CH) (21%), onebelonged to G3 (cirrhosis) (9%), and three belonged to G4(ACLF) (33%). History of bleeding was present in six patients(12%) who included four patients from G1 (D. cirrhosis), onepatient from G2 (CH), and one patient from G3 (cirrhosis)(Table 1). Bleeding from varices was the commonest with fourpatients (66.7%) having history of variceal bleed (multipleemesis and/or melena), one patient with history of intra-abdominal bleed, and one patient having mucosal bleeds.
3.3. Laboratory Tests. The platelet count of all the patientsas well as control group was carried out on a hematologyautoanalyzer (Coulter Hmx Hematology Analyser; BeckmanCoulter Inc., Brea, California, USA).
For coagulation parameters, blood from patients andcontrols was collected in two citrated tubes contain-ing buffered sodium citrate (0.109M, 3.2%) in the ratioblood : anticoagulant 9 : 1. The citrated samples were pro-cessed within half an hour of collection. One of the tubescontaining citrated blood was centrifuged and plasma wasobtained.Theplasmawas run on fully automated coagulome-ter (Sysmex CA 1500; Sysmex Corporation, Kobe, Japan) andvalues of PT, INR, APTT, and fibrinogen were recorded. Theremainder of the plasma was used for determination of D-dimer levels by a semiquantitative rapid latex agglutinationslide test (D-Di test, Diagnostica Stago S.A.S., France).
The other tube containing citrated whole blood wasused for sonoclot analysis. 340 𝜇L of citrated whole bloodwas added to gb ACT+ (glass bead activated ACT) cuvetteprewarmed to 37∘C along with 20𝜇L of CaCl
2. Sonoclot
signature was obtained and recorded for a period of 30minutes on sonoclot analyzer (Sonoclot Coagulation andPlatelet Function Analyzer, Sienco Inc., Arvada, CO, USA).
SONACT, CR, and PF were calculated by the instrumentand recorded accordingly. TP and PA were calculated manu-ally from the signature. The R2 peak character was recordedas a qualitative parameter according to the type of peakobtained on the R2 slope of the signature. R2 peaks wereclassified as sharp (well-defined peaks, Figure 1), dull (poorlydefined peaks, Figure 2(a)), and flat signature (Figure 2(b)).

4 Advances in Hematology
Clot
sign
al
0 5 10 15 20 25 30(min)
Group description
Style Time Patient Test Result Range Comment Date10:25:48 a.m. gb ACT+
Clot rate = 11.6(98.0–182.0)(15.0–45.0)
(>1.5)
Feb 19, 2013
0
25
50
75
100
125
ACT = 135
Plateletfunction = 0.7
(a)
Clot
sign
al
0 5 10 15 20 25 30(min)
Group description
Style Time Patient Test Result Range Comment Date10:19:43 a.m. gb ACT+
Clot rate = 28(98.0–182.0)(15.0–45.0)
(>1.3)
Feb 16, 2013
0
25
50
75
100
125
ACT = 154
Plateletfunction = 0.1
(b)
Figure 2: (a) Dull rounded peak on sonoclot signature. (b) Flat sonoclot signature.
3.4. Statistical Methods. The coagulation profiles of thepatients as well as controls were groupwise tabulated.Quantitative data in different groups were expressed bymedian, mean, and standard deviation. Qualitative data wasexpressed as percentages. The sonoclot parameters obtainedfor different groups were compared with controls using theWilcoxon signed rank test. The statistically significant differ-ence between the patient groups and controls was reportedusing theWilcoxon critical values table (at alpha = 0.05 level).
Correlations between sonoclot parameters and conventionalcoagulation tests were calculated using Spearman’s rankcorrelation and calculated 𝑃 value. 𝑃 value was consideredsignificant if less than 0.05.
4. Results
Sonoclot signature parameters in different groups of liverdisease as well as control group were studied.

Advances in Hematology 5
Table 2: Comparison between sonoclot parameters in different groups.
Group G1 G2 G3 G4 Control
SONACTMean ± SD (s) 176.31 ± 51.41 146.14 ± 41.76 130.09 ± 31.23 152.44 ± 13.22 137 ± 24.46
Median (s) 164 147 140 148 143.5𝑊𝐶
88∗ 27∗ 22∗ 23∗ —
CRMean ± SD (u/min) 29.41 ± 11.31 42.5 ± 17.64 44.54 ± 10.44 34.88 ± 11.54 31.6 ± 7.63
Median (u/min) 30 44.5 48 30 44𝑊𝐶
50∗ 59∗ 56∗ 11∗ —
PFMean ± SD 1.54 ± 1.08 2.29 ± 1.31 2.97 ± 0.84 1.36 ± 1.13 2.53 ± 0.76
Median 1.5 2.7 3.0 1.4 2.45𝑊𝐶
98∗ 07¶ 45∗ 31∗ —
TPMean ± SD (min) 20.5 ± 10.2 11.5 ± 7.6 9.5 ± 10.4 15.3 ± 11.9 11.8 ± 2.8
Median 17 9.5 6 10 11.5𝑊𝐶
116∗ 18¶ 44∗ 11∗ —
PAMean ± SD (units) 75.31 ± 25.13 91.07 ± 21.94 97.91 ± 8.61 71.94 ± 24.99 95.7 ± 7.48
Median 80 95 100 75 93.5𝑊𝐶
88∗ 05¶ 32∗ 33∗ —𝑊𝑇
29 21 10 05 —G1: group 1 (decompensated cirrhosis), G2: group 2 (noncirrhotic liver disease), G3: group 3 (cirrhotic HCC), G4: group 4 (ACLF).SONACT: sonoclot activated clotting time, CR: clot rate, PF: platelet function, TP: time to peak, PA: peak amplitude.SD: standard deviation.𝑊𝐶: calculated Wilcoxon test statistic (patient groups versus controls),𝑊
𝑇: tabulated Wilcoxon critical value of alpha = 0.05 (𝑊
𝑐> 𝑊𝑇is considered to be
statistically significant).∗Significantly different values as compared to control group.¶Values are not significantly different as compared to controls.
SONACT. SONACT prolongation was seen maximally in G1(D. cirrhosis) followed by the G4 (ACLF). The variationsin SONACT values were also most pronounced in G1 (D.cirrhosis) as compared to other groups. A statistically signifi-cant difference was obtained between the SONACT values inpatient groups as compared to controls (Table 2).
CR. Mean value of CR was highest in G3 (cirrhosis) andlowest in G1 (D. cirrhosis). The control group was mostconsistent showing minimal variations in CR. The CR valuesin patient groups demonstrated a statistically significantdifference as compared to the control group (Table 2).
PF. Mean value of PF was lowest in G4 (ACLF) followedby G1 (D. cirrhosis). The difference in PF values betweencontrol group and G2 (CH) did not reach levels of statisticalsignificance while the other groups depicted a statisticallysignificant difference as compared to controls (Table 2).
TP. Mean value of TP was the highest in G1 (D. cirrhosis)followed byG4 (ACLF).Deviations from themean valueweremuch less in the control group. Again, the difference in valuesbetween control group and G2 (CH) did not reach levels ofstatistical significance (Table 2).
PA. Mean value of PA was lowest in G4 (ACLF) closelyfollowed byG1 (D. cirrhosis). All the patient groups except forG2 (CH) demonstrated a statistically significant difference ascompared to the control group (Table 2).
Table 3: Comparison between R2 peak characters in differentgroups.
R2 peak in G1 G2 G3 G4 Control groupSharp peak (%) 18.75 71.43 90.9 11.11 100Dull peak (%) 50 7.14 9.1 66.67 00Flat (%) 31.25 21.43 0 22.22 00G1: group 1 (decompensated cirrhosis), G2: group 2 (noncirrhotic liverdisease), G3: group 3 (cirrhotic HCC), G4: group 4 (ACLF).
4.1. R2 Peak Character. All the R2 peaks in the control groupwere sharp, well-defined peaks. In contrast, G1 (D. cirrhosis)and G4 (ACLF) showed grossly abnormal R2 peaks with G1(D. cirrhosis) having around half of the patient populationwith dull peaks and maximum numbers of flat sonoclotsignatures and G4 (ACLF) having around two-thirds of thepatients with dull, poorly defined R2 peaks and few flatsignatures as well (Table 3). One patient in G1 (D. cirrhosis)(NASH induced cirrhosis) depicted hyperfibrinolysis onsonoclot signature (Figure 3).
Sonoclot parameters and conventional coagulation testswere correlated and studied in patients with liver disease. Asignificant positive correlation was found between PT-INR,APTT and SONACT (𝑟 = 0.36, 𝑃 < 0.008 (PT) and 𝑟 = 0.43,𝑃 < 0.0015 (APTT)) and TP (𝑟 = 0.49, 𝑃 < 0.0002 (PT) and𝑟 = 0.34, 𝑃 < 0.01 (APTT)). PT and APTT were found toweakly correlate with CR and PA (𝑟 = −0.46, 𝑃 < 0.0006 and

6 Advances in Hematology
Clot
sign
al
0 5 10 15 20 25 30(min)
Group description
Style Time Patient Test Result Range Comment Date3:46:07 p.m. gb ACT+
Clot rate = 17(98.0–182.0)(15.0–45.0)
(>1.6)
Feb 20, 2013
0
25
50
75
100
125
ACT = 235
Plateletfunction = 1.0
Figure 3: Hyperfibrinolysis as detected on sonoclot signature. The characteristic rise of the signature as depicted by R2 peak (suggestiveof fibrin gel tightening by platelets) is not seen. Platelet function is subnormal (as calculated from the R3 gradient by the analyser). Thehyperfibrinolysis in this case was confirmed by inspecting the sample in the cuvette immediately after the test procedure and was found tobe in liquid state.
Table 4: Correlation obtained between sonoclot parameters and conventional coagulation variables in patients with liver disease.
Conventional tests PT-INR APTT Fibrinogen D-dimer Platelet count
Sonoclot parameters
𝑃 value (𝑟: correlation coefficient)SonACT <0.008 (𝑟 = 0.36) <0.0015 (𝑟 = 0.43) <0.037 (𝑟 = −0.29) 0.39 (𝑟 = 0.12) <0.01 (𝑟 = −0.34)
CR <0.0025 (𝑟 = −0.41) <0.0025 (𝑟 = −0.41) <0.004 (𝑟 = 0.39) 0.96 (𝑟 = −0.005) <0.03 (𝑟 = 0.3)PF 0.07 (𝑟 = −0.25) 0.2 (𝑟 = −0.16) <0.001 (𝑟 = 0.44) 0.89 (𝑟 = 0.02) <0.0001 (𝑟 = 0.62)TP <0.0002 (𝑟 = 0.49) <0.01 (𝑟 = 0.34) <0.0001 (𝑟 = −0.56) 0.12 (𝑟 = 0.22) <0.0001 (𝑟 = −0.61)PA <0.0006 (𝑟 = −0.46) <0.008 (𝑟 = −0.36) <0.0001 (𝑟 = 0.56) 0.6 (𝑟 = −0.08) <0.0002 (𝑟 = 0.5)
PT: prothrombin time, INR: international normalized ratio, APTT: activated partial thromboplastin time.SONACT: sonoclot activated clotting time, CR: clot rate, PF: platelet function, TP: time to peak, PA: peak amplitude.𝑟: Spearmans rank correlation coefficient.𝑃 value is significant if <0.05.
𝑟 = −0.36, 𝑃 < 0.008, resp.). As the coagulation was activatedby glass beads in the sonoclot analyser, these parameters maynot accurately correlate with PT and APTT. We also founda significant positive correlation between fibrinogen levels,platelet counts and CR, PF, PA and a significant negativecorrelation between these two conventional parameters andSONACT and TP. Regarding the D-dimer levels, statisticallysignificant levels were not obtained with any of the sonoclotparameters (Table 4).
Similar correlations were also obtained between thecoagulation variables (both sonoclot and conventional) andhistory of bleed without reaching levels of statistical signifi-cance.
5. Discussion
Thecoagulopathy of liver disease is complex and often unpre-dictable. While coagulopathy is the hallmark of ACLF group,
the diagnostic tests of coagulation are frequently abnormal inpatients with decompensated cirrhosis too [11]. Most of thesonoclot parameters in our study also demonstrate statisti-cally significant abnormalities in decompensated cirrhoticsand ACLF group while the noncirrhotic category showscomparatively fewer abnormalities. Prolonged SONACT andshortened CR in these cases can be attributed to decreasedsynthesis of Vitamin K dependent factors (II, VII, IX, andX). Additionally, prolonged TP and decreased PF could be aresult of thrombocytopenia caused by splenic sequestration.Also, impaired platelet aggregation responses to adenosinediphosphate, arachidonic acid, collagen, and thrombin leadto low PF values on sonoclot analysis in chronic liver disease[12].
Despite clear evidence of an increased tendency forbleeding in patients with liver disease, many circumstancesalso promote local and systemic hypercoagulable states [11,13].

Advances in Hematology 7
Clot
sign
al
0 5 10 15 20 25 30(min)
Group description
Style Time Patient Test Result Range Comment Date10:30:31 a.m. gb ACT+
Clot rate = 72(98.0–182.0)(15.0–45.0)
(>1.3)
Feb 14, 2013
0
25
50
75
100
125
ACT = 74
Plateletfunction = 4.0
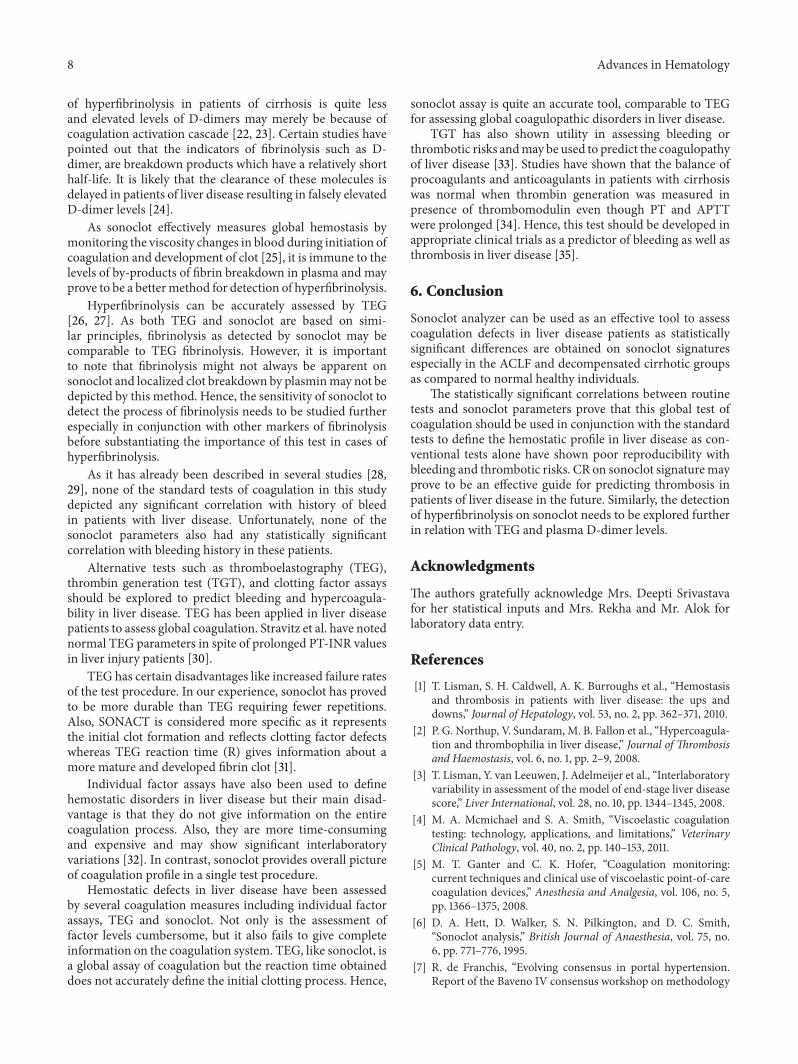
Figure 4: Hypercoagulability (ACT of sample < ACT normal range, CR of sample ≫ CR normal range). The steep slope of the signatureis depicted by increased clot rate (72 units/min). The characteristic rise of the graph (as seen by increased peak amplitude) and sharp peakdepict strong clot retraction by platelets. Note also the time to peak which is very short (<5 minutes). The platelet function is very good (ascalculated by the R3 gradient).
The routine coagulation tests give no insight regarding thehypercoagulable tendency in patients with liver disease. Dueto lack of propermeasurement tools to identify those patientswho are prone to develop clots, there is reliance on clinicalendpoints like deep vein thrombosis, portal vein thrombosis,and so forth to detect the presence of hypercoagulability inthese patients [14].
Assessment of prothrombotic states has been carriedout in cancer patients, using sonoclot analyser, by studyingsignificantly increased CRs. This study used powdered celiteas contact activator instead of glass beads [15]. In our study,the highest mean CR was observed in the cirrhotic HCCgroup followed by the chronic hepatitis group (Table 2).Some of the CRs of the patients in these groups were quitehigh as compared to the control group (reaching as high as72 units/min in one of the patients (Figure 4) (biologicalreference range: 15–45 units/min)). These abnormal valuescould help to define the underlying state of hypercoagulabilityin these patients. As our study did not include the subsequentfollowup of these cases, the predictive value of CR regardingthe prothrombotic tendency cannot be demonstrated withcertainty in these patients. Nevertheless, this sonoclot param-eter has ample potential to be explored as a predictor ofhypercoagulable state in liver diseases.
Hypercoagulable states in cirrhosis have been attributedto decrease in the levels of natural anticoagulant proteins(protein C, protein S, and antithrombin III) and increase infactor VIII and vonWillebrand factor levels [1]. Additionally,it is suggested that prothrombotic tendencies are commonin HCC patients due to the ability of tumor cells to secreteprocoagulants/fibrinolytic inhibitor factors and inflamma-tory cytokines [16]. Also, elevated homocysteine levels in
patients with HCC have been implicated in thromboembolictendencies [16]. (Whether the coagulation abnormalitiesdetected in cirrhotic-HCC group in our study were purelybecause of cirrhosis or influenced by an additional finding ofHCC or due to both could not be assessed as the number ofcases in this group was not sufficient for such analysis).
The correlation between conventional coagulation testsand sonoclot parameters is rather limited [17, 18]. In thisstudy we have tried to compare the sonoclot parameterswith conventional tests so as to be able to replace the needfor several coagulation tests in these patients with sonoclot.SONACT and TP have shown a statistically significantpositive correlation with PT-INR and APTT and a statisti-cally significant negative correlation with platelet count andfibrinogen levels, whereas CR and PA have demonstrateda statistically significant negative correlation with PT-INRand APTT and a highly significant positive correlation withfibrinogen levels and platelet count. These findings are inagreement with other studies aiming to establish similarcorrelations [19, 20]. These sonoclot variables once obtained,may subsequently be used to predict the PT-INR and APTTvalues as well as fibrinogen levels in liver disease patients.
The D-dimer levels in this study have not shown any sta-tistically significant correlation with the sonoclot parameters.D-dimer levels may act as marker for enhanced fibrinolyticactivity and disseminated intravascular coagulation (DIC)[21]. However, the increased levels do not always indicatehyperfibrinolysis. In our study, eight patients had very highlevels of plasma D-dimers out of which only one patienthad hyperfibrinolytic tracing on sonoclot signature. Thisfinding may be related to some studies which show that,in spite of increased levels of D-dimer, actual incidence
8 Advances in Hematology
of hyperfibrinolysis in patients of cirrhosis is quite lessand elevated levels of D-dimers may merely be because ofcoagulation activation cascade [22, 23]. Certain studies havepointed out that the indicators of fibrinolysis such as D-dimer, are breakdown products which have a relatively shorthalf-life. It is likely that the clearance of these molecules isdelayed in patients of liver disease resulting in falsely elevatedD-dimer levels [24].
As sonoclot effectively measures global hemostasis bymonitoring the viscosity changes in blood during initiation ofcoagulation and development of clot [25], it is immune to thelevels of by-products of fibrin breakdown in plasma and mayprove to be a bettermethod for detection of hyperfibrinolysis.
Hyperfibrinolysis can be accurately assessed by TEG[26, 27]. As both TEG and sonoclot are based on simi-lar principles, fibrinolysis as detected by sonoclot may becomparable to TEG fibrinolysis. However, it is importantto note that fibrinolysis might not always be apparent onsonoclot and localized clot breakdown by plasminmay not bedepicted by this method. Hence, the sensitivity of sonoclot todetect the process of fibrinolysis needs to be studied furtherespecially in conjunction with other markers of fibrinolysisbefore substantiating the importance of this test in cases ofhyperfibrinolysis.
As it has already been described in several studies [28,29], none of the standard tests of coagulation in this studydepicted any significant correlation with history of bleedin patients with liver disease. Unfortunately, none of thesonoclot parameters also had any statistically significantcorrelation with bleeding history in these patients.
Alternative tests such as thromboelastography (TEG),thrombin generation test (TGT), and clotting factor assaysshould be explored to predict bleeding and hypercoagula-bility in liver disease. TEG has been applied in liver diseasepatients to assess global coagulation. Stravitz et al. have notednormal TEG parameters in spite of prolonged PT-INR valuesin liver injury patients [30].
TEG has certain disadvantages like increased failure ratesof the test procedure. In our experience, sonoclot has provedto be more durable than TEG requiring fewer repetitions.Also, SONACT is considered more specific as it representsthe initial clot formation and reflects clotting factor defectswhereas TEG reaction time (R) gives information about amore mature and developed fibrin clot [31].
Individual factor assays have also been used to definehemostatic disorders in liver disease but their main disad-vantage is that they do not give information on the entirecoagulation process. Also, they are more time-consumingand expensive and may show significant interlaboratoryvariations [32]. In contrast, sonoclot provides overall pictureof coagulation profile in a single test procedure.
Hemostatic defects in liver disease have been assessedby several coagulation measures including individual factorassays, TEG and sonoclot. Not only is the assessment offactor levels cumbersome, but it also fails to give completeinformation on the coagulation system. TEG, like sonoclot, isa global assay of coagulation but the reaction time obtaineddoes not accurately define the initial clotting process. Hence,
sonoclot assay is quite an accurate tool, comparable to TEGfor assessing global coagulopathic disorders in liver disease.
TGT has also shown utility in assessing bleeding orthrombotic risks andmay be used to predict the coagulopathyof liver disease [33]. Studies have shown that the balance ofprocoagulants and anticoagulants in patients with cirrhosiswas normal when thrombin generation was measured inpresence of thrombomodulin even though PT and APTTwere prolonged [34]. Hence, this test should be developed inappropriate clinical trials as a predictor of bleeding as well asthrombosis in liver disease [35].
6. Conclusion
Sonoclot analyzer can be used as an effective tool to assesscoagulation defects in liver disease patients as statisticallysignificant differences are obtained on sonoclot signaturesespecially in the ACLF and decompensated cirrhotic groupsas compared to normal healthy individuals.
The statistically significant correlations between routinetests and sonoclot parameters prove that this global test ofcoagulation should be used in conjunction with the standardtests to define the hemostatic profile in liver disease as con-ventional tests alone have shown poor reproducibility withbleeding and thrombotic risks. CR on sonoclot signaturemayprove to be an effective guide for predicting thrombosis inpatients of liver disease in the future. Similarly, the detectionof hyperfibrinolysis on sonoclot needs to be explored furtherin relation with TEG and plasma D-dimer levels.
Acknowledgments
The authors gratefully acknowledge Mrs. Deepti Srivastavafor her statistical inputs and Mrs. Rekha and Mr. Alok forlaboratory data entry.
References
[1] T. Lisman, S. H. Caldwell, A. K. Burroughs et al., “Hemostasisand thrombosis in patients with liver disease: the ups anddowns,” Journal of Hepatology, vol. 53, no. 2, pp. 362–371, 2010.
[2] P. G. Northup, V. Sundaram, M. B. Fallon et al., “Hypercoagula-tion and thrombophilia in liver disease,” Journal of Thrombosisand Haemostasis, vol. 6, no. 1, pp. 2–9, 2008.
[3] T. Lisman, Y. van Leeuwen, J. Adelmeijer et al., “Interlaboratoryvariability in assessment of the model of end-stage liver diseasescore,” Liver International, vol. 28, no. 10, pp. 1344–1345, 2008.
[4] M. A. Mcmichael and S. A. Smith, “Viscoelastic coagulationtesting: technology, applications, and limitations,” VeterinaryClinical Pathology, vol. 40, no. 2, pp. 140–153, 2011.
[5] M. T. Ganter and C. K. Hofer, “Coagulation monitoring:current techniques and clinical use of viscoelastic point-of-carecoagulation devices,” Anesthesia and Analgesia, vol. 106, no. 5,pp. 1366–1375, 2008.
[6] D. A. Hett, D. Walker, S. N. Pilkington, and D. C. Smith,“Sonoclot analysis,” British Journal of Anaesthesia, vol. 75, no.6, pp. 771–776, 1995.
[7] R. de Franchis, “Evolving consensus in portal hypertension.Report of the Baveno IV consensus workshop on methodology

Advances in Hematology 9
of diagnosis and therapy in portal hypertension,” Journal ofHepatology, vol. 43, no. 1, pp. 167–176, 2005.
[8] G. Garcia-Tsao, J. Bosch, and R. J. Groszmann, “Portal hyper-tension and variceal bleeding—unresolved issues. Summary ofan American Association for the study of liver diseases andEuropean Association for the study of the liver single-topicconference,” Hepatology, vol. 47, no. 5, pp. 1764–1772, 2008.
[9] S. K. Sarin, A. Kumar, J. Almeida et al., “Acute on chronic liverfailure (ACLF): consensus recommendations of the Asia PacificAssociation for the Study of the Liver (APASL),” HepatologyInternational, vol. 3, pp. 269–282, 2009.
[10] A. Zipprich, G. Garcia-Tsao, S. Rogowski, W. E. Fleig, T.Seufferlein, and M. M. Dollinger, “Prognostic indicators ofsurvival in patients with compensated and decompensatedcirrhosis,” Liver International, vol. 39, pp. 1407–1414, 2012.
[11] R. Jalan, P. Gines, J. C. Olson et al., “Acute on chronic liverfailure,” Journal of Hepatology, vol. 57, pp. 1336–1348, 2012.
[12] M. Senzolo, P. Burra, E. Cholongitas, and A. K. Burroughs,“New insights into the coagulopathy of liver disease and livertransplantation,” World Journal of Gastroenterology, vol. 12, no.48, pp. 7725–7736, 2006.
[13] P. G. Northup, “Hypercoagulation in liver disease,” Clinics inLiver Disease, vol. 13, no. 1, pp. 109–116, 2009.
[14] P.G.Northup,M.M.McMahon,A. P. Ruhl et al., “Coagulopathydoes not fully protect hospitalized cirrhosis patients fromperipheral venous thromboembolism,” American Journal ofGastroenterology, vol. 101, no. 7, pp. 1524–1528, 2006.
[15] J. L. Francis, D. A. Francis, and G. J. Gunathilagan, “Assessmentof hypercoagulability in patients with cancer using the Sonoclotanalyzer(TM) and thromboelastography,”Thrombosis Research,vol. 74, no. 4, pp. 335–346, 1994.
[16] D. N. Samonakis, I. E. Koutroubakis, A. Sfiridaki et al., “Hyper-coagulable states in patients with hepatocellular carcinoma,”Digestive Diseases and Sciences, vol. 49, no. 5, pp. 854–858, 2004.
[17] B. L. D. Schaer, A. I. Bentz, R. C. Boston, J. E. Palmer, and P. A.Wilkins, “Comparison of viscoelastic coagulation analysis andstandard coagulation profiles in critically ill neonatal foals tooutcome,” Journal of Veterinary Emergency and Critical Care,vol. 19, no. 1, pp. 88–95, 2009.
[18] M. Furuhashi, N. Ura, K. Hasegawa et al., “Sonoclot coagulationanalysis: new bedside monitoring for determination of theappropriate heparin dose during haemodialysis,” NephrologyDialysis Transplantation, vol. 17, no. 8, pp. 1457–1462, 2002.
[19] T. Miyashita and M. Kuro, “Evaluation of platelet function bySonoclot analysis compared with other hemostatic variables incardiac surgery,” Anesthesia and Analgesia, vol. 87, no. 6, pp.1228–1233, 1998.
[20] J. J. Liszka-Hackzell andG. Ekback, “Analysis of the informationcontent in sonoclot data and reconstruction of coagulation testvariables,” Journal of Medical Systems, vol. 26, no. 1, pp. 1–8,2002.
[21] S. S. Adam, N. S. Key, and C. S. Greenberg, “D-dimer antigen:current concepts and future prospects,” Blood, vol. 113, no. 13,pp. 2878–2887, 2009.
[22] N. Bennani-Baiti and H. A. Daw, “Primary hyperfibrinolysis inliver disease: a critical review,” Clinical Advances in Hematology& Oncology, vol. 9, no. 3, pp. 250–252, 2011.
[23] D. Prisco and E. Grifoni, “The role of D-dimer testing inpatientswith suspected venous thromboembolism,” Seminars inThrombosis and Hemostasis, vol. 35, no. 1, pp. 50–59, 2009.
[24] F. Violi, D. Ferro, S. Basili et al., “Hyperfibrinolysis resultingfrom clotting activation in patients with different degrees ofcirrhosis,” Hepatology, vol. 17, no. 1, pp. 78–83, 1993.
[25] M. A. Lyew and W. C. Spaulding, “Template for rapid analysisof the Sonoclot signature,” Journal of Clinical Monitoring, vol.13, no. 4, pp. 273–277, 1997.
[26] A. Chen and J. Teruya, “Global hemostasis testing throm-boelastography: old technology, new applications,” Clinics inLaboratory Medicine, vol. 29, no. 2, pp. 391–407, 2009.
[27] R. Kaku,M.Matsumi,M. Ichiyama et al., “Massive bleeding dueto hyperfibrinolysis during living-related liver transplantationfor terminal liver cirrhosis, report of two cases,”Masui, vol. 52,no. 11, pp. 1195–1199, 2003.
[28] J. B. Segal and W. H. Dzik, “Paucity of studies to support thatabnormal coagulation test results predict bleeding in the settingof invasive procedures: an evidence-based review,” Transfusion,vol. 45, no. 9, pp. 1413–1425, 2005.
[29] K. Ewe, “Bleeding after liver biopsy does not correlate withindices of peripheral coagulation,” Digestive Diseases and Sci-ences, vol. 26, no. 5, pp. 388–393, 1981.
[30] R. T. Stravitz, T. Lisman, V. A. Luketic et al., “Minimal effects ofacute liver injury/acute liver failure on hemostasis as assessedby thromboelastography,” Journal of Hepatology, vol. 56, no. 1,pp. 129–136, 2012.
[31] K. A. Tanaka, F. Szlam, H. Y. Sun, T. Taketomi, and J. H.Levy, “Thrombin generation assay and viscoelastic coagulationmonitors demonstrate differences in the mode of thrombininhibition between unfractionated heparin and bivalirudin,”Anesthesia and Analgesia, vol. 105, no. 4, pp. 933–939, 2007.
[32] P. G. Northup and S. H. Caldwell, “Coagulation in liverdisease: a guide for the clinician,” Clinical Gastroenterology andHepatology, vol. 11, pp. 1064–1074, 2013.
[33] H. C. Hemker, R. Al Dieri, E. de Smedt, and S. Beguin,“Thrombin generation, a function test of the haemostatic-thrombotic system,” Thrombosis and Haemostasis, vol. 96, no.5, pp. 553–561, 2006.
[34] A. Tripodi, F. Salerno, V. Chantarangkul et al., “Evidence ofnormal thrombin generation in cirrhosis despite abnormalconventional coagulation tests,” Hepatology, vol. 41, no. 3, pp.553–558, 2005.
[35] R. Kar, S. S. Kar, and S. K. Sarin, “Hepatic coagulopathy-intricacies and challenges, a cross sectional descriptive study of110 patients from a superspeciality institute of North India withreview of literature,” Blood Coagulation and Fibrinolysis, vol. 24,pp. 175–180, 2013.

Submit your manuscripts athttp://www.hindawi.com
Stem CellsInternational
Hindawi Publishing Corporationhttp://www.hindawi.com Volume 2014
Hindawi Publishing Corporationhttp://www.hindawi.com Volume 2014
MEDIATORSINFLAMMATION
of
Hindawi Publishing Corporationhttp://www.hindawi.com Volume 2014
Behavioural Neurology
EndocrinologyInternational Journal of
Hindawi Publishing Corporationhttp://www.hindawi.com Volume 2014
Hindawi Publishing Corporationhttp://www.hindawi.com Volume 2014
Disease Markers
Hindawi Publishing Corporationhttp://www.hindawi.com Volume 2014
BioMed Research International
OncologyJournal of
Hindawi Publishing Corporationhttp://www.hindawi.com Volume 2014
Hindawi Publishing Corporationhttp://www.hindawi.com Volume 2014
Oxidative Medicine and Cellular Longevity
Hindawi Publishing Corporationhttp://www.hindawi.com Volume 2014
PPAR Research
The Scientific World JournalHindawi Publishing Corporation http://www.hindawi.com Volume 2014
Immunology ResearchHindawi Publishing Corporationhttp://www.hindawi.com Volume 2014
Journal of
ObesityJournal of
Hindawi Publishing Corporationhttp://www.hindawi.com Volume 2014
Hindawi Publishing Corporationhttp://www.hindawi.com Volume 2014
Computational and Mathematical Methods in Medicine
OphthalmologyJournal of
Hindawi Publishing Corporationhttp://www.hindawi.com Volume 2014
Diabetes ResearchJournal of
Hindawi Publishing Corporationhttp://www.hindawi.com Volume 2014
Hindawi Publishing Corporationhttp://www.hindawi.com Volume 2014
Research and TreatmentAIDS
Hindawi Publishing Corporationhttp://www.hindawi.com Volume 2014
Gastroenterology Research and Practice
Hindawi Publishing Corporationhttp://www.hindawi.com Volume 2014
Parkinson’s Disease
Evidence-Based Complementary and Alternative Medicine
Volume 2014Hindawi Publishing Corporationhttp://www.hindawi.com


![HOTAIR and its surrogate DNA methylation signature ... · oligonucleotide arrays, Gene Expression Omnibus acces-sion [GEO:GSE13876]). Patients gave informed consent for collection](https://img.pdfslide.us/doc/110x75/6120770f18fd6b3bae792c6e/hotair-and-its-surrogate-dna-methylation-signature-oligonucleotide-arrays-gene.jpg)