Embed Size (px)
Citation preview

Research ArticleRole of Forest Resources to Local LivelihoodsThe Case of East Mau Forest Ecosystem Kenya
D K Langat1 E K Maranga2 A A Aboud2 and J K Cheboiwo3
1Kenya Forestry Research Institute PO Box 5199 Kisumu 40108 Kenya2Department of Natural Resources Egerton University PO Box 536 Njoro 20115 Kenya3Kenya Forestry Research Institute PO Box 20412 Nairobi 00200 Kenya
Correspondence should be addressed to D K Langat dkipkiruiyahoocom
Received 11 November 2015 Accepted 3 February 2016
Academic Editor Piermaria Corona
Copyright copy 2016 D K Langat et al This is an open access article distributed under the Creative Commons Attribution Licensewhich permits unrestricted use distribution and reproduction in any medium provided the original work is properly cited
Forests in Kenya are threatened by unsustainable uses and conversion to alternative land uses In spite of the consequences offorest degradation and biodiversity loss and reliance of communities on forests livelihoods there is little empirical data on therole of forest resources in livelihoods of the local communities Socioeconomic demographic and forest use data were obtainedby interviewing 367 households Forest product market survey was undertaken to determine prices of various forest productsfor valuation of forest use Forest income was significant to households contributing 33 of total household income Fuel woodcontributed 50 food (27) construction material (18) and fodder and thatching material 5 to household forest incomeAbsolute forest income and relative forest income () were not significantly different across study locations and between ethnicgroups However absolute forest income and relative forest income () were significantly different among wealth classes Poorhouseholds were more dependent on forests resources However in absolute terms the rich households derived higher forestincomeThese results provide valuable information on the role of forest resources to livelihoods and could be applied in developingforest conservation policies for enhanced ecosystem services and livelihoods
1 Introduction
Forests are important in the livelihoods of local people inmost developing countries Local people depend on forestsresources for various products such as fuel wood construc-tion materials medicine and food Globally it is estimatedthat between 1095 billion and 1745 billion people depend tovarying degrees on forests for their livelihoods and about 200million indigenous communities are almost fully dependenton forests [1] Moreover 350million people who live adjacentto dense forests depend on them for subsistence and income[1 2] It is estimated that 20ndash25 of rural peoplesrsquo income isobtained from environmental resources in developing coun-tries [3] and act as safety nets in periods of crisis or duringseasonal food shortages [4 5] Deforestation and degradationof forest ecosystems in Kenya is widely acknowledged anddespite the widespread degradation there is dearth of quan-titative information on the role of forest resources to liveli-hoods and dependence to guide sustainable use This paper
analyzed the role of forest resources in local livelihoodsand determined the forest dependence in East Mau forestecosystem Kenya
2 Materials and Methods
21 Study Site This study was undertaken in East Mau Forestsituated about 50 km south of Nakuru Town at 35∘5810158400010158401015840Eand 00∘3210158400010158401015840S altitude range of 1200 and 2600m (Figure 1)It has an area of approximately 280 km2 and has the highestnumber of indigenous forest dwellersmdashthe Ogiek commu-nity East Mau forest forms an important watershed withinthe Mau Forest Complex feeding major rivers and streamsthat make up the hydrological systems of Lake Victoria andinland Lakes of Nakuru Baringo and Natron The forest ishome to endangered mammals like the yellow-backed duiker(Cephalophus sylvicultor) and the African golden cat (Felisaurata) and other important fauna such as Giant Forest HogGazelle Buffalo Leopard Hyena Antelope Monkey and
Hindawi Publishing CorporationInternational Journal of Forestry ResearchVolume 2016 Article ID 4537354 10 pageshttpdxdoiorg10115520164537354
2 International Journal of Forestry Research
Chebara
Elburgon
Njoro
Mauche
Mau Narok
Keringet
Olokurto
Mariashoni
Nessuit
KapkembuSilibwet
KapsimbeiywoTeret
Mauche
Kiambogo
Sururu
Tuiyotich
Mau Narok
Elburgon
Mau Narok
NjoroNjoro
Kihingo
Enjo
ro
Rong
ai
Ness
viet
Kipt
unga
RoadsStudy areasForest
RiversLocations
0 10 205(kms)
Kenya
EthiopiaSSudan
Uga
nda
Tanzania
Som
alia
IndianOcean
Studysite
Mombasa
Nairobi
35∘44
9984000998400998400E 35
∘52
9984000998400998400E 36
∘09984000998400998400E
35∘44
9984000998400998400E 35
∘52
9984000998400998400E
0∘32
9984000998400998400S
0∘40
9984000998400998400S
0∘24
9984000998400998400S
0∘32
9984000998400998400S
0∘40
9984000998400998400S
N
1
23
45
Figure 1 Map of the study area in East Mau forest in Kenya
small animals like the Giant African Genet Tree Hyraxand Honey badger [6] This makes the forest ecosysteman important resource base for the local communities andnational and international community The total forest areawas originally about 66000 ha but more than half of it wasexcised for human settlement in 2001 [7]
The area is comprised of the escarpments hills rollingland and plains with slopes ranging from 2 in the plainsto more than 30 in the foothills and geological studies haveshown that the area is mainly composed of quaternary andtertiary volcanic deposits [8] In the lowlands the top soils areofmainly clay loam (CL) to loam (L) in texture and the subsoiltexture ranges from silty clay loam (SCL) to clay loam (CL)and clay (C) with pH values ranging from 56 to 64 makingthem slightly to moderately acidic in nature [9] In thelowland Luvisol Vertisol Planosol Cambisol and Solonetzsoils from the Holocene sedimentary deposits are primarilyprevalent and occur in saline and sodic phases In the uplandareas however the soils have a high content of silt and clay
predominantly Ferrasols Nitisols Cambisols and Acricsols[9] The adjoining settlements have gentle slopes with deep-fertile-volcanic soils which are suitable for maize wheatpotatoes horticultural crops and livestock keeping [10]
The climate is characterized by a trimodal precipitationpattern with the long and intense rains from April toJune short rains in August and shorter less intense rainsfrom November to December with mean monthly rainfallbetween 30mm and 120mm and total annual precipitationof 1200mm The mean annual temperatures are in the rangeof 12 to 16∘C with greatest diurnal variation during the dryseason [11]
22 Data Collection Household data was collected fromrespondents from the month of January to May 2013 andSeptember to December 2013 All households within andadjacent to East Mau forest totaling 43257 householdsfrom 17 administrative units (locations) [12] constituted theresearch population Five administrative units were selected
International Journal of Forestry Research 3
in consultation with local administrative officials using twomain criteria age of settlement and ethnic compositionof residents The following administrative locations wereselected Mariashoni representing an old settlement pre-dominantly occupied by Ogiek indigenous communityKapkembumdashrepresenting a recent settlementwith a homoge-nous community of the Kipsigis Nessuitmdashrepresenting arecent settlement with a heterogeneous population of indige-nous and immigrant ethnic groups and Kapsimbeiywo andSilibwetmdashrepresenting a relatively old settlement with ahomogenous community of the Kipsigis community
Study villages in all the five locations were randomlyselected from the list of villages provided by local administra-tive officials and village elders Respondent households fromeach village were randomly selected from detailed house-holdsrsquo lists (with names of household head and assigned num-bers for use in random sampling) In polygamous unionshouseholds were listed according to the wifersquos name and eachconsidered a separate household The simple size for eachstudy village and location was determined using the mostrecent national census data [12] and applying the method byO Mugenda and A Mugenda [13] In total 367 householdswere selected for the study Sociodemographic data were col-lected using structured and semistructured questionnairesTo improve the confidence of the respondents and quality ofdata local trained research assistants conversant with locallanguages interviewed the respondents in the presence ofvillage elders In most cases the head of the household wasinterviewed and in the absence the wife or the eldest sonwas interviewed The following socioeconomic data werecollected from each household sources of cash incomeresources endowment (land size livestock size and physi-cal assets) literacy levels (education level) household sizeresident years ethnicity and distance from the forest For-est utilization data included consumption patterns of for-est products (including their sources average quantity permonth and household monthly consumption) collectionand type of forest products and other associated informationThe information obtained from respondents was triangulatedusing key informants and focus group discussions
The market survey captured the prices of various forestproducts traded in local markets and prices used to valuethe household forest-product consumption and determinedmonetary contribution of the forest products to the totalhousehold income
23 Data Analysis The collected field data were compiledand analyzed using the statistical package IBM SPSS version21 (2013) and Microsoft Office Excel 2010 The householdincomes were calculated without accounting for local labourcosts because of substantial variation in costs for each activityand the possibility of multiple tasks by households [14] Thehousehold incomes were computed using the formulae (1) to(4) as shown below
Household annual income = (forest Income + agricultureincome + return to wealth + wage income)
119884tinc =119899
sum
119894=1
[119904119894] (1)
where 119884tinc is total household income and 119904119894is income source
119868Forest income = (fuel wood annual income + wild fruits
income + poles income + thatching grass income and forestgrazing etc)
119884119891=
119899
sum
119894=1
[119865119894119875119894minus (119870119894)] (2)
where 119884119891is total forest income 119865
119894is quantity of product
collected 119868 119875119894is market price of forest product 119868 and 119870
119894is
production costs of forest product 119894The value of forest grazing was estimated by substitute
approach (the Appendix)Crop income this was summation of value of yield from
various crops grown by a household less all costs of produc-tion Total crop income was calculated as
119884119888=
119899
sum
119894=1
[119862119894119875119894minus (119870119894)] (3)
where119884119888is total crop income119862
119894is yield of crop 119868119875
119894is market
price of crop 119868 and119870119894is production costs of crop 119894
Livestock income = (cattle sale income + goats income +sheep income+donkeys income+ chicken income) + incomefrom livestock products that is
119884119897=
119899
sum
119894=1
[119873119894119875119894minus (119870119894)] +
119899
sum
119894=1
[119876119894119875119894minus (119870119894)] (4)
where 119884119897is total livestock income 119873
119894is number of livestock
in category 119868 119876119894is quantity of product from livestock 119868 119875
119894
is market price of livestock 119868 and 119870119894is cash costs of keeping
livestock 119894 like pay for herder costs of medicines feedsIncome from off-farm incomeemployment this was the
total value of earnings through hiring out of labour on otherhouseholdsrsquo lands for agricultural or any other economicactivity
231 Statistical Tests Socioeconomic data presents a chal-lenge in a heterogeneous community where extreme incomevalues from individual households are expected Data wassubjected to normality tests (box-plot histogram) All theidentified outliers in the data set were removed to conform tonormal distribution It was then that parametric tests (analy-sis of variance (ANOVA)) were applied [15] In all statisticaltests 119901 le 005 level of significance was used Tests wereconducted on socioeconomic characteristics 1205942 test beingfor association of locations and sources of forest productswealth education level and ethnicity Comparison of meansand one-way ANOVA were used to test the difference onforest incomes relative forest incomes on locations ethnicityand wealth class and separation of means undertaken usingTukey B
232 Measuring Forest Dependence The forest dependencewas measured using the relative forest income Relative forestincome (RFI) was computed as a share of net forest income to
4 International Journal of Forestry Research
total household income accounts derived from consumptionand sale of forest environmental resources This was derivedas
RFI = TFITI (5)
where TI is the total household income and TFI is total forestenvironmental income
To test the level of forest dependence of income groupssampled households were categorized into 3 income groupsbased on their level of total households income in KenyaShillings Poor 0ndash156000 Moderately Poor 156001ndash270000and Richgt271000The categories were based on local condi-tions and do not reflect the general poverty levels in the studyarea and Kenya
3 Results
31 Socioeconomic and Demographic Characteristics of House-holds The gender distribution of household heads showedthat 626 (119899 = 243) were males while 374 (119899 = 145) werefemales The mean age of household head was significantlydifferent (119901 lt 0001) for female (5335plusmn 19) andmale-headedhouseholds (4756 plusmn 12) The majority of the respondentsin the Kapsimbeiywo and Silibwet location were immigrants(100)while inNessuit therewas an equal presence of indige-nous (Ogiekmdash50) and nonindigenous people (50) InMariashoni and Nessuit the majority of households were ofOgiek tribe (65) and Nessuit (50) In Kapkembu the areawas inhabited mostly by nonindigenous group of Kipsigis(925) and a small proportion of Ogiek at 75 (Table 1)
The majority of households were not born in the currentplace of residence (648) and only about one-third (352)were born in current place of residence Results on thehighest educational level attained by heads of householdsrevealed that 734 have at least primary level of educationwhile 20 have attained secondary level of education andonly 69 have completed postsecondary education with thelowest 24 and 49 inNessuit andMariashoni respectively(Table 1)
32 Livelihood Activities of Households Most of the house-holds (905) interviewed were farmers (119899 = 344) relyingmostly on rain-fed agriculture and livestock keeping Otherlivelihood activities were small scale retail business wageemployment and sale of forest productsThe total householdincome (119865
(4372)= 510 119901 le 0001) was significantly
different across study location and between indigenous andnonindigenous groups (119865
(1372)= 782 119901 = 005) The total
household income in 3 locations of Kapsimbeiywo Nessuitand Kapkembu was significantly different However in Kap-kembu total household income differed significantly fromSilibwet and Mariashoni (Table 1) Agricultural income wassignificantly different across locations (119865
(4382)= 255 119901 =
005) Tukey B test separation of means showed that house-holds in Kapsimbeiywo differed significantly from the house-holds in other locations However agricultural householdincome in Silibwet Kapkembu Nessuit and Mariashoni wasnot significantly different In addition income from sale of
forest products was not significantly different across location(119865(472)= 123 119901 = 005) and between indigenous and
nonindigenous groups (119865(175)= 162 119901 = 005)
33 Assets331 Livestock Livestock keeping is an important economicactivity undertaken by households The average number ofcattle sheep goats donkeys and hens was 50 40 20 10and 70 respectively and the mean Tropical Livestock Unit(TLU) per household was 465 units Total livestock unitsper household across locations were significantly different(119865(4367)= 1186 119901 lt 005) Separation of means by Tukey B
test showed that TLU for households inNessuit (Mean = 349standard deviation (SD) = 281 and Kapsimbeiywo (Mean =633 SD = 260)) were significantly different Howeverhouseholds in 3 locations of Sililbwet (Mean = 499 SD =184) Kapkembu (Mean = 502 SD = 171) and Marioshion(Mean = 510 SD = 246) were not significantly different inlivestock units Wealth group differed significantly in totallivestock units (119865
(2367)= 806119901 lt 005) Separation ofmeans
by Tukey B test showed that the poor households (Mean =385 SD = 278) differed significantly from moderately poor(Mean = 523 SD = 241) and rich households (Mean = 476SD = 254) in livestock holdings Additionally livestock hold-ing (TLU) for indigenous and non-indigenous groups werenot significantly different (119865
(1367)= 0410 119901 gt 005)
332 Land Most households in the study area allocate theirland use to crops (both cash and food) Between 52 and74 of the land holding is allocated for agricultural crops andless than 21 (142ndash21) was allocated to forest resources(planted or natural regeneration) (Table 1) Total land sizeland under cash crops and pasture were significantly dif-ferent however land under forests (planted and natural)food crops and wastelands were not significantly different(Table 1) The ownership of land differs across locations withhighest number of households indicating alternative owner-ship of land was highest in Kapsimbeiywo (733) and leastin Nessuit (40) There was a strong association betweenalternative land ownership and location (1205942 = 11865 df = 4119901 lt 0001)
34 Forest Use and Dependence341 Sources of Forest Products Diverse forest products werecollected by households for home consumption and for sale(Table 2) Generally most of the products were obtainedfrom public forest of East Mau forest For example mosthouseholds reportedly obtained their firewood and charcoalfrom public forest compared to the other sources (729 and673 resp) and this was similarly observed for all products(Table 2)
Households obtained foods products such as indigenousfruits (340) mushrooms (493) game meat (471) andhoney (516) from public forest compared to other sources(own farms neighbours andmarkets) Overall 455 house-holds obtained various foods from the East Mau forestecosystem About fifty percent of the households obtained
International Journal of Forestry Research 5
Table1So
cioecono
micanddemograph
iccharacteris
ticso
fsam
pled
households
(119873=367)
Varia
ble
Locatio
nKa
psim
beyw
oSilib
wet
Kapk
embu
Nessuit
Mariashon
iSig(LSD
)Gender(HH)
Male
733
854
672
720
605
NS
Female
277
146
328
280
374
NS
Ethn
icity
()
Indigeno
us00
00
7550
65005lowast
Non
indigeno
us100
100
925
5035
005lowast
Educationlevel()
Prim
ary
667
604
627
879
893
005lowast
Second
ary
333
271
224
9758
NS
Posts
econ
dary
00
125
149
24
49
NS
Prim
ary
667
604
627
879
893
005lowast
HHsiz
eNum
ber
90plusmn24
101plusmn31
98plusmn26
89plusmn30
73plusmn36
NS
Adultequ
ivalent
49plusmn14
60plusmn18
57plusmn15
51plusmn
1933plusmn16
NS
Land
sizea
nduse
Land
size(Ha)
25plusmn12
21plusmn
08
21plusmn
09
17plusmn14
19plusmn15
NS
Naturalforest
04plusmn03
04plusmn02
04plusmn02
03plusmn02
04plusmn03
000lowastlowastlowast
Plantedforest
04plusmn02
03plusmn01
03plusmn01
03plusmn03
04plusmn02
NS
Food
crop
s08plusmn04
07plusmn03
07plusmn03
08plusmn07
08plusmn05
NS
Cash
crop
05plusmn02
04plusmn03
04plusmn02
03plusmn02
06plusmn07
0017lowast
Pastu
reland
06plusmn06
03plusmn01
03plusmn02
06plusmn06
08plusmn07
000lowastlowastlowast
Wasteland
s04plusmn03
03plusmn01
03plusmn02
03plusmn02
04plusmn02
NS
Resid
entyears
248plusmn20
230plusmn18
136plusmn54
148plusmn27
162plusmn45
NS
Food
mon
ths
36plusmn04
47plusmn03
44plusmn03
43plusmn02
40plusmn02
NS
Age
ofHH(years)
448plusmn20
485plusmn19
403plusmn16
423plusmn14
424plusmn07
005lowast
Hou
seho
ldcash
incomes
(KES
)To
tal
17007585plusmn1923775a
2593
6380plusmn21404
55b
c20338534plusmn95
0664a
b21228669plusmn1067774
ab2479
5286plusmn94
4839
bc001lowast
Agriculture
4896552plusmn78
4179a
5654545plusmn78
9930a
b6553
030plusmn514001
ab7330508plusmn462689
ab5881739plusmn41619
6ab
005lowast
Livesto
ck60644
82plusmn75
9954a
b8652
167plusmn895522
c6223134plusmn45714
1ab3700790plusmn364
259
a5189966plusmn471023
ab001lowast
Forestprod
uct
1866667plusmn1566667a
793750plusmn216115a
510000plusmn18
0555a
2598214plusmn818206
a1972000plusmn333593
aNS
Offfarm
1277
8965plusmn1502136a
1415
6311plusmn1270857a
13087313plusmn670283
a119
69818plusmn75
0990a
11471456plusmn698897
aNS
LSDisleastsignificantd
ifferenceN
Sdeno
tesn
osig
nificantd
ifference
at119901le5
level
Hou
seho
ldincomes
means
(row
)with
acom
mon
superscriptimplythem
eandifferenceisn
otsig
nificantat119901le5
level
ldquolowastrdquoreferstosig
nificance
levelat5ldquolowastlowastlowastrdquod
enotes
significance
at1
6 International Journal of Forestry Research
Table 2 Reported sources of forest products by of households (119873 =367)
Product Sources ( households)Public forest Own farm Neighbours Market
Firewood 729 216 34 21Timber 580 166 62 192Charcoal 673 82 76 169Honey 516 138 97 249Medicine 499 187 50 264Poles 357 217 140 286Thatch grass 306 350 62 282Fruits 340 223 97 340Animal fodder 667 312 18 03Agriculturaltools 428 189 13 370
Forest soils 452 218 73 257Buildingstones 412 203 93 292
Mushrooms 493 144 81 282Fibres 548 193 106 153Meat 471 36 23 470
medicinal herbs from public forest In the study area 570357 and 548 of households reportedly obtained con-struction materials (timber poles and fibers resp) from thepublic forest (Table 2)
342 Quantities and Value of Forest Products The extentof use and monetary value of various products is shown inTable 3
Most households in the study area collected firewood(903) herbal medicine (833) poles (348) and honey(274) and the least collected product was building stones(57) (Figure 2)
Firewood is the most collected product by householdsand each household collect an average of 12200 back-loads (410000 kg) of firewood per year worth about KES2500000 (US$ 28000) accounting for 57 of forest income(Table 4) Another popular product collected by householdsis medicine (833) with an average of about 50 kg per yearHowever in terms ofmonetary value per household charcoalhoney and poles score high The values of these products areKES 14415600 (US$ 160100) 6942400 (US$ 77100) and3295900 (US$ 36600) respectively (Table 3) Householdwho graze their livestock in public forest ranged from 571(Kapsimbeiywo) and the highest of 779 of households inMariashoni Overall 668 of the households reported usingthe forest as a source of fodder for their livestock The mone-tary value of this use ranged from KES 1198300 (US$ 13300)to 1797400 (US$ 20000) per household per year Wood fuel(firewood and charcoal) is the dominant source of forestincome with a mean of 491 of forest income per householdand thiswas followedby foodproducts (265) and structural
903833
348273271
249224
209208199193
9978
57
0 20 40 60 80 100Households ()
FirewoodHerbal medicine
PolesHoney
Agricultural toolsMeat
FruitsTimber
MurramFibre
MushroomCharcoal
Thatch grassBuilding stones
Prod
uct
Figure 2 Proportion of households () collecting various forestproducts from East Mau forest
and fibre products (174) Though charcoal is not the mostcollected products (99) of households yet its contribu-tion was significant contributing 434 to household forestincome due its high valueOther products whichmade signif-icant contribution to household forest incomewere poles andhoney each contributing 130 and 124 respectively Thetotal forest income ranged from 288 to 365 with overallmean of 325 (Table 4)
343 Forest Dependence The households in East Mau aredependent on East Mau forest for various products andservices
The net forest income and relative forest income aresummarized in Table 5The forest dependence was calculatedas the ratio of total forest environmental income to the totalhousehold income and expressed as a percentageThe level ofdependence was greater than 25 in all study locations rang-ing from 288 to 365with overallmean of 337 (Table 5)The absolute forest income and relative forest income werenot significantly different between households in the fivestudy locations
Absolute forest income and relative forest income() were not significantly different across study locations(119865(4309)= 176 119901 gt 005) and between ethnic groups
(119865(1245)= 0307 119901 gt 005) However absolute forest income
and relative forest income () were significantly differentamongwealth classes (119901 lt 001) meaning there is substantialdifference in absolute forest income (Poor = 4627590 plusmn282240 Moderate household = 6727730 plusmn 393240 andRich household = 8146380 plusmn 379770) and relative forestincome () (Poor = 4140 plusmn 213Moderate household = 3560plusmn 203 and Rich household = 2630 plusmn 130) The Poor house-holds benefit less in absolute terms from the forest resourcesthan theModerate and the Rich (Table 5) (PoorltModerateltRich) However in relative terms ( forest income) the poorderive more than the two categories (Poor gt Moderate gtRich) (Table 5)
International Journal of Forestry Research 7
Table 3 Quantities and monetary value of forest products collected by households per year
Product Units Quantities Value(KES) (US$)
Firewood kg 407045 plusmn 16767 2544747 plusmn 110460 28275 plusmn 1227Herbal Medicine kg 4878 plusmn 269 767709 plusmn 178122 8530 plusmn 1979Poles Number 34322 plusmn 1762 3295922 plusmn 185549 36621 plusmn 2062Honey kg 10239 plusmn 1695 6942433 plusmn 530133 77138 plusmn 5890Agricultural tools Number 10473 plusmn 1750 105382 plusmn 17460 1171 plusmn 194Meat kg 12524 plusmn 1284 1291920 plusmn 150218 14355 plusmn 1669Fruits Kg 25668 plusmn 2344 957334 plusmn 55213 10637 plusmn 613Timber Running feet 17138 plusmn 1846 1829206 plusmn 196306 20325 plusmn 2181Murram Tons 12022 plusmn 3821 10218 plusmn 3248 114 plusmn 036Fibre kg 25177 plusmn 3898 422720 plusmn 38312 4697 plusmn 426Mushroom kg 25792 plusmn 4598 302128 plusmn 46780 3357 plusmn 520Charcoal kg 450555 plusmn 110320 14415677 plusmn 2237553 160174 plusmn 24862Thatch grass kg 17908 plusmn 2780 453072 plusmn 714299 5034 plusmn 7937Building stones Running feet 3450 plusmn 420 100000 plusmn 65605 28275 plusmn 729Values are arranged as means followed by standard error of means
Table 4 Contribution of forest products category to forest income
Product LocationKapsimbeiywo Silibwet Kapkembu Nessuit Mariashoni Mean
Fuel 1720 5980 5030 5140 6690 4910Firewood 1080 390 510 440 410 570Charcoal 640 5590 4510 4700 6290 4340
Food 2660 2830 2870 2900 1970 2650Fruits 100 310 280 190 190 210Honey 940 1550 1340 1390 1000 1240Mushroom 1410 760 1000 840 550 910Meat 200 200 260 480 230 270
Structural and fibre 4600 710 1440 1180 740 1740Timber 640 270 540 400 210 410Poles 3940 430 850 760 500 1300Agricultural tools 020 010 060 030 020 030
Grass 760 380 460 510 460 510Thatch grass 110 110 080 200 280 160Fodder 650 270 370 310 180 360
Herbal medicine 260 090 200 260 120 190Others 000 010 000 000 020 010Total 10000 10000 10000 10000 10000 10000
of total household income 2880 3070 3290 3650 3340 3250Absolute value (KES) 4766200 6342700 6521800 6658000 7164200 6290600Absolute value (US$) 53000 70500 72500 74000 79600 69900
35 Discussions
351 Socioeconomic and Demographic Characteristics Theaverage family size in the study areas of (88 plusmn 32) is higherthan national average of 53 persons per households [12]However households in Mariashoni showed lower familysize Male headed households were dominant in the studylocations and this is consistent with customs of the local
people where males are expected to be the heads of house-holds and only females attain this role through bereavementIt was established that there was significant variation in assetendowment (land physical assets and livestock) betweenmale and female headed households Because crop farmingand livestock are main livelihood activities in the study areaownership and access to land is one of the key determinants oflivelihoodoptions of the local peopleOn average households
8 International Journal of Forestry Research
Table 5 Absolute forest income relative forest income () by study location wealth status and ethnicity
Variable Absolute forest income (KES) Relative forest income ()Location
Kapsimbeiywo 4766210 plusmn 623681a 2885 plusmn 370a
Silibwet 6342711 plusmn 647064a 3071 plusmn 334a
Kapkembu 6521756 plusmn 480103a 3289 plusmn 218a
Nessuit 6657973 plusmn 376237a 3646 plusmn 184a
Mariashoni 7164151 plusmn 471157a 3342 plusmn 240a
Overall mean 6583628 plusmn 223206 3373 plusmn 110(119865(4309) = 176 119901 gt 005) (119865(4294) = 118 119901 gt 005)
Wealth statusPoor 4627590 plusmn 282240a 4140 plusmn 213a
Moderate 6727730 plusmn 393240b 3560 plusmn 203b
Rich 8146380 plusmn 379770c 2630 plusmn 130c
(119865(2309) = 2387 119901 lt 001) (119865(2296) = 1835 119901 lt 001)
EthnicityIndigenous 6353612 plusmn 396122a 3193 plusmn 175a
Nonindigenous 6265847 plusmn 219654a 3315 plusmn 125a
(119865(1241) = 074 119901 gt 005) (119865(1245) = 0307 119901 gt 005)Note Means (column) with a common (letters) superscript imply the mean difference is not significant different at 119901 le 5 level
in Nessuit and Mariashoni have less land compared tohouseholds in other locations
Most of the study areas (Mariashoni Nessuit and Kap-kembu) were once part of East Mau forest However theywere excised in 1990s and early 2000 for human settlement[7] Each household in the settlement scheme was allocated25 ha The results showed that households in Nessuit andMariashoni currently have smaller land size than originallyallocated This is most likely due to land transactions whichmight have occurred in the two locations This finding wascorroborated by key informants who reported increasednumber of new settlers due to high productivity of the landfor food and cash cropsThis fact was also reflected in the het-erogeneity of the local population showed by household datawhich showed thatmost of the household heads (648)werenot indigenous to current place of residence Householdsin Kapsimbeiywo have the highest access to land and thisis reflected in the fact that about 78 of households havealternative access to land This phenomenon of emigrationfrom other areas in search of land and livelihood opportu-nities conforms to what has been established in other Africansocieties where migration is influenced by demographictrends and the search for livelihood opportunities [16]
Households in the study area have adapted a diverseportfolio of livelihood activities such as farming livestockkeeping forest product small trade and remittanceThemostcommon livelihood activity is farming and livestock keeping
The local indigenous communities theOgiek have largelydepended on livestock and forest resources This is howeverchanging due to the growing influence of immigrants fromother countiesThere is evidence of increasing diversificationof income opportunities by the indigenous community Thisis consistent with other studies on rural communities wherelivelihood diversification strategies is predominant [17ndash19]
because single livelihood strategy is insufficient for the needsof most rural households [20]There was a strong associationbetween educational attainment and ethnicity (1205942 = 349df = 2 119901 lt 005)
The household heads of nonindigenous group had higherpostsecondary qualifications compared to indigenous house-holds Mariashoni and Nessuit dominated by Ogiek commu-nity had fewer schools Livestock size (TLU) in the study areashowed significant results pointing to the fact that the own-ership of large herds is associated with access to alternativelandThe households which had alternative land also showedlarge livestock size and lowest forest grazing incidence Forestgrazing is dependent on seasonal availability of fodder onthe farms and forest grazing is an alternative resource Theimplication is that alternative land ownership accounts for theadditional livestock units owned
352 Forest Dependence The result from this study hasshown that local people depend primarily on forest resourcesfor subsistence needs and occasionally for sale The highestcontribution to household forest income is fuel wood (50)and food products (27) The high market value from fuelwood use category could be explained by the significantlyhigh level of firewood collection by majority of households(903) and the relatively high value of charcoal
The study has revealed that forest income contributesbetween 25 and 365 of household income in the studyareaThis could be explained by low level of investment in treegrowing and less retention of natural forests on individualfarms and ease of access to public resources The findings onforest reliance confirm what others have concluded in otherparts of Africa for example Cavendish [21] found out that35 of rural household income is derived from environmen-tal products in Zimbabwe Another study in Malawi showed
International Journal of Forestry Research 9
that forest income contributes to 30 of household income[22] Forest income contributes about 39 of the householdincome in Ethiopia highlands and nearly equaled combinedlivestock and agricultural incomes [23]
Another study byKalaba et al [24] inMiombowoodlandsof Zambia showed that forest income contributed 439 tothe average household income In a compressive compara-tive analysis of environmental income Angelsen et al [25]revealed that environmental income accounted for 28 ofhousehold income in 24 developing countries Therefore thefindings of this study are in agreement with similar findingselsewhere and corroborate the importance of forest resourcesto households In terms of who benefits more from forestresources the moderately poor and higher income house-holds derive higher absolute forest income than poor house-holds This is probably because the rich households extracthigh value products such as timber poles which require largecapital investments such as equipment which are inaccessibleby poor households and therefore primarily engaged in lowvalue and often labour intensive forest extractive activities[26] Limited access to financial and social capital has beenadvanced by various authors [25 27] to explain the inabilityof the poor households to benefit substantially from environ-mental resources However in relative forest income poorhouseholds showed higher reliance on forest resourcesThesefindings on the higher dependency on forest resources bypoor households are consistentwith findings of [16 19 23 28ndash32]
4 Conclusion and Recommendations
The study has revealed the important role of forest resourcesin household income It was found out that forest incomeshare are higher for poor households However in abso-lute terms the better off households are advantaged Poorhouseholds showed high dependence on the forest resourcesdespitemost collectionusage being illegal On average 33ofannual household income is generated by consumption andsale of forest productsWith the increasing population in EastMau and surrounding areas the demand on forest resourcesare likely to rise and this will exert pressure on the state of for-est resources in EastMau However reflecting on the findingsof this study it would be imprudent to exclude local commu-nity from accessing forest resources because it may lead toincreased poverty One way of managing the situation wouldbe to allow low level extractive activities such as firewoodcollection and enforcing licensing procedures to allow for lowextraction level essentially for subsistence use anddiscouragecommercial extraction Another way to ease the pressure onEast Mau is to promote intensification of tree growing onfarms through support for agroforestry or farm forestry inter-vention Another strategy is to lower the opportunity cost ofengaging in forest resources by creating robust incomeoppor-tunities independent of forest product extraction or improv-ing the technical efficiency of agricultural and productionsystems in order tominimize illegal forest exploitationThesemeasures may improve rural livelihoods and conserve forestresources and biodiversity
Appendix
Estimation of the Value Forest Grazing
According to the household data livestock data the meanlivestock numbers 49 livestock units and 67 of householdsgraze their animals inside the forest and forest fodderbrowsemake up to 40 of the fodder requirements From literaturethe dry fodder requirement for livestock is taken to be about2-3 of the body weight per day [33] and a livestock unit(250 kg) requires a minimum quantity of fodder for mainte-nance of between 50 and 75 kg per day
Step 1 Calculate the number of households who graze theiranimals = (43527 lowast 67)100 = 2916300
Step 2 Calculate the total number of livestock units grazinginside the forest = 29163 lowast 49 = 14289800
Step 3 Calculate the total dry matter requirements for thetotal livestock units for the whole year from the forest
One TLU requires between 50 and 75 kg per day there-fore 365 days = 142898 lowast (50ndash75) lowast 365
The total dry matter requirements per year is between26078885 and 39118328 kg
40 of the total fodder requirements are obtained fromthe forest and therefore forest contributes between 10431554and 15647331 kg
Step 4 Convert the estimate quantities of drymatter intoHayequivalent
One bale of hay weighs 30 kgs the number of equivalenthay is between 347720 and 521580 bales
Step 5 Calculate the monetary value of hay using the currentmarket price The current market price of 1 bale is KES 150
The total value of forest grazing is KES 52157775 and78236655 per year This is equivalent to between KES1198300 and 1797400 per household per year
Ethical Approval
Ethical issues (including plagiarism informed consent mis-conduct data fabrication andor falsification double publica-tion and redundancy) have been completely observed by theauthors
Conflict of Interests
The authors declare that there is no conflict of interestsregarding the publication of this paper
Acknowledgments
The authors express their gratitude to East Mau communityfor their willingness to share with us their information onforest use Special thanks are due to research assistants andlocal administrative officials in the study areas for theirsupport during data collection Special thanks are due to MrFrank Mairura for assisting in data analysis The authors are
10 International Journal of Forestry Research
grateful to the Director Kenya Forestry Research Institute forfinancially supporting this study
References
[1] S Chao Forest People Numbers across theWorld Forest PeoplesProgram Moreton-in-Marsh UK 2012
[2] World Bank Global Issues for Global Citizens An Introductionto Key Development Challenges Edited by V K Bhargava TheWorld Bank Report Washington DC USA 2006
[3] P Vedeld A Angelsen J Bojo E Sjaastad andG K Berg ldquoFor-est environmental incomes and the rural poorrdquoForest Policy andEconomics vol 9 no 7 pp 869ndash879 2007
[4] C Shackleton and S Shackleton ldquoThe importance of non-timber forest products in rural livelihood security and as safetynets a review of evidence from South Africardquo South AfricanJournal of Science vol 100 no 11-12 pp 658ndash664 2004
[5] C M Shackleton and S E Shackleton ldquoHousehold wealthstatus and natural resource use in the Kat River valley SouthAfricardquo Ecological Economics vol 57 no 2 pp 306ndash317 2006
[6] J K Sang ldquoThe Ogiek in Mau Forest Case Study 3mdashKenyamdashForest Peoples Program 2001rdquo httpwwwforestpeoplesorgsitesfppfilespublication201010kenyaengpdf
[7] UNEP KFWG DRSRS and EU-BCP Eastern and South West-ern Mau Forests Reserves Assessment and Way Forward UNEPNairobi Kenya 2006
[8] W G Sombroek H M Braun and B J Van der Pouw ldquoTheExploratory soil map and agro-climatic map of Kenyardquo ReportE 1 Kenya Soil Survey Nairobi Kenya 1980
[9] S S China Land use planning using GIS [PhD thesis] Univer-sity of Southampton Southampton UK 1993
[10] R Jaetzold and H Schmidt Farm Management Handbook forKenya Ministry of Agriculture Nairobi Kenya 1982
[11] P M Kundu Application of remote sensing and GIS techniquesto evaluate the impact of land use cover change on stream flowsthe case of River Njoro in Eastern Mau-Kenya [PhD thesis]Faculty of Environment and Resources Development EgertonUniversity Njoro Kenya 2007
[12] KNBS Kenya Population and Housing Census vol 1A Ministryof Planning and National Development Nairobi Kenya 2010
[13] O Mugenda and A Mugenda Research Methods Quantitativeand Qualitative Approaches African Center for TechnologyStudies (ACTS) Nairobi Kenya 1999
[14] B M Campbell and M Luckert ldquoTowards understanding therole of forests in rural livelihoodsrdquo in Uncovering the HiddenHarvest Valuation Methods for Woodland and Forest ResourcesB M Campbell and M K Luckert Eds People and PlantsConservation Series pp 1ndash10 Earthscan London UK 2002
[15] Y H Chan ldquoBiostatistics 102 quantitative data-parametric andnon-parametric testsrdquo Singapore Medical Journal vol 44 no 8pp 391ndash396 2005
[16] K HeubachThe socio-economic importance of non-timber forestproducts for rural livelihoods inWestAfrican savanna ecosystemscurrent status and future trends [PhD thesis] Goethe Univer-sitat Frankfurt Frankfurt Germany 2011
[17] B Belcher M Ruız-Perez and R Achdiawan ldquoGlobal patternsand trends in the use and management of commercial NTFPsimplications for livelihoods and conservationrdquoWorld Develop-ment vol 33 no 9 pp 1435ndash1452 2005
[18] F Ellis Rural Livelihoods and Diversity in Developing CountriesOxford University Press Oxford UK 2000
[19] P Kamanga P Vedeld and E Sjaastad ldquoForest incomes andrural livelihoods in Chiradzulu District Malawirdquo EcologicalEconomics vol 68 no 3 pp 613ndash624 2009
[20] W D Sunderlin A Angelsen B Belcher et al ldquoLivelihoodsforests and conservation in developing countries an overviewrdquoWorld Development vol 33 no 9 pp 1383ndash1402 2005
[21] W Cavendish ldquoPoverty inequality and environmental resour-ces quantitative analysis of rural householdsrdquo Centre for theStudy of African Economies (CSAE) Paper Series Paper 931999
[22] M Fisher ldquoHousehold welfare and forest dependencerdquo Envi-ronment and Development Economics vol 9 no 2 pp 135ndash1542004
[23] G Mamo E Sjaastad and P Vedeld ldquoEconomic dependenceon forest resources a case fromDendi District Ethiopiardquo ForestPolicy and Economics vol 9 no 8 pp 916ndash927 2007
[24] F K Kalaba C H Quinn and A J Dougill ldquoContribution offorest provisioning ecosystem services to rural livelihoods in theMiombo woodlands of Zambiardquo Population and Environmentvol 35 no 2 pp 159ndash182 2013
[25] A Angelsen P Jagger R Babigumira et al ldquoEnvironmentalincome and rural livelihoods a global-comparative analysisrdquoWorld Development vol 64 no 1 pp S12ndashS28 2014
[26] M Arnold and I Townson ldquoAssessing the potential of forestproduct activities to contribute to rural incomes in AfricardquoNatural Resources Perspectives 37 Overseas DevelopmentInstitute London UK 1998
[27] S Dewi B Belcher and A Puntodewo ldquoVillage economicopportunity forest dependence and rural livelihoods in EastKalimantan Indonesiardquo World Development vol 33 no 9 pp1419ndash1434 2005
[28] A Angelsen and S Wunder ldquoExploring the forestry-povertylinkage key concepts issues and research implicationsrdquo CIFOROccasional Paper 40 CIFOR Bogor Indonesia 2003
[29] B Babulo Economic Valuation and Management of Common-Pool ResourcesThe Case of Enclosures in the Highlands of TigrayNorthern Ethiopia vol 762 of Doctoraatsproefschrift FaculteitBio-Ingenieurswetenschappen Van de KU Leuven 2007
[30] W Cavendish ldquoEmpirical regularities in the poverty-environment relationship of rural households evidencefrom Zimbabwerdquo World Development vol 28 no 11 pp1979ndash2003 2000
[31] P Illukpitiya and J F Yanagida ldquoFarming vs forests trade-offbetween agriculture and the extraction of non-timber forestproductsrdquo Ecological Economics vol 69 no 10 pp 1952ndash19632010
[32] J K Mariara and C Gachoki ldquoForest dependence and house-hold welfare empirical evidence from Kenyardquo CEEPA Discus-sion Paper 41 CEEPA 2008
[33] B Ganesan ldquoExtraction of non-timber forest products includ-ing fodder and fuelwood in Mudumalai Indiardquo EconomicBotany vol 47 no 3 pp 268ndash274 1993
Submit your manuscripts athttpwwwhindawicom
Forestry ResearchInternational Journal of
Hindawi Publishing Corporationhttpwwwhindawicom Volume 2014
Environmental and Public Health
Journal of
Hindawi Publishing Corporationhttpwwwhindawicom Volume 2014
Hindawi Publishing Corporationhttpwwwhindawicom Volume 2014
EcosystemsJournal of
Hindawi Publishing Corporationhttpwwwhindawicom Volume 2014
MeteorologyAdvances in
EcologyInternational Journal of
Hindawi Publishing Corporationhttpwwwhindawicom Volume 2014
Marine BiologyJournal of
Hindawi Publishing Corporationhttpwwwhindawicom Volume 2014
Hindawi Publishing Corporationhttpwwwhindawicom
Applied ampEnvironmentalSoil Science
Volume 2014
Advances in
Hindawi Publishing Corporationhttpwwwhindawicom Volume 2014
Environmental Chemistry
Atmospheric SciencesInternational Journal of
Hindawi Publishing Corporationhttpwwwhindawicom Volume 2014
Hindawi Publishing Corporationhttpwwwhindawicom Volume 2014
Waste ManagementJournal of
Hindawi Publishing Corporation httpwwwhindawicom Volume 2014
International Journal of
Geophysics
Hindawi Publishing Corporationhttpwwwhindawicom Volume 2014
Geological ResearchJournal of
EarthquakesJournal of
Hindawi Publishing Corporationhttpwwwhindawicom Volume 2014
BiodiversityInternational Journal of
Hindawi Publishing Corporationhttpwwwhindawicom Volume 2014
ScientificaHindawi Publishing Corporationhttpwwwhindawicom Volume 2014
OceanographyInternational Journal of
Hindawi Publishing Corporationhttpwwwhindawicom Volume 2014
The Scientific World JournalHindawi Publishing Corporation httpwwwhindawicom Volume 2014
Journal of Computational Environmental SciencesHindawi Publishing Corporationhttpwwwhindawicom Volume 2014
Hindawi Publishing Corporationhttpwwwhindawicom Volume 2014
ClimatologyJournal of
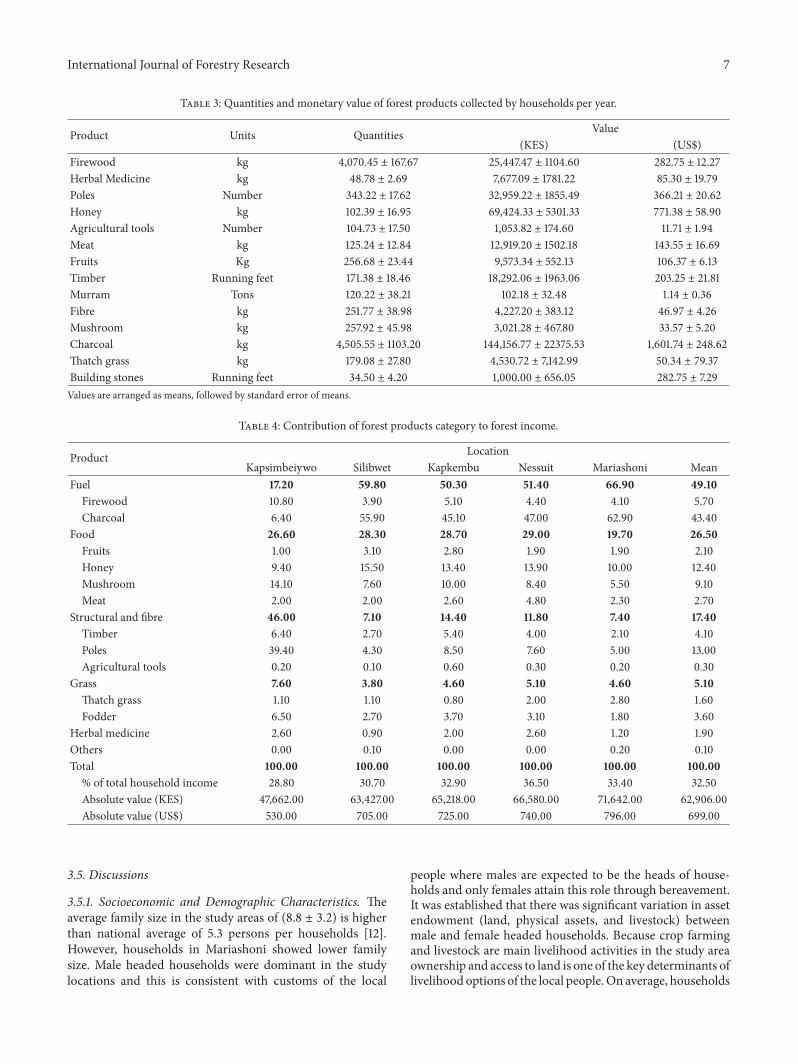