Embed Size (px)
Citation preview

Research ArticleResponse Surface Methodology for the Optimization ofPreparation of Biocomposites Based on Poly(lactic acid) andDurian Peel Cellulose
Patpen Penjumras,1,2 Russly Abdul Rahman,1,3 Rosnita A. Talib,1 and Khalina Abdan4
1Department of Process and Food Engineering, Faculty of Engineering, Universiti Putra Malaysia (UPM),43400 Serdang, Selangor, Malaysia2Department of Food Science and Technology, Maejo University, Phrae Campus, Phrae 54140, Thailand3Department of Food Technology, Faculty of Food Science and Technology, Universiti Putra Malaysia (UPM),43400 Serdang, Selangor, Malaysia4Department of Biological and Agricultural Engineering, Faculty of Engineering, Universiti Putra Malaysia (UPM),43400 Serdang, Selangor, Malaysia
Correspondence should be addressed to Patpen Penjumras; p [email protected] and Russly Abdul Rahman; [email protected]
Received 8 April 2015; Accepted 2 June 2015
Academic Editor: Runcang Sun
Copyright © 2015 Patpen Penjumras et al. This is an open access article distributed under the Creative Commons AttributionLicense, which permits unrestricted use, distribution, and reproduction in any medium, provided the original work is properlycited.
Response surface methodology was used to optimize preparation of biocomposites based on poly(lactic acid) and durian peelcellulose. The effects of cellulose loading, mixing temperature, and mixing time on tensile strength and impact strength wereinvestigated. A central composite design was employed to determine the optimum preparation condition of the biocompositesto obtain the highest tensile strength and impact strength. A second-order polynomial model was developed for predicting thetensile strength and impact strength based on the composite design. It was found that composites were best fit by a quadraticregression model with high coefficient of determination (𝑅2) value. The selected optimum condition was 35wt.% cellulose loadingat 165∘C and 15min of mixing, leading to a desirability of 94.6%. Under the optimum condition, the tensile strength and impactstrength of the biocomposites were 46.207MPa and 2.931 kJ/m2, respectively.
1. Introduction
The agricultural and agrofood industries produce greatamounts of wastes, which exhibit a tremendous threat to theenvironment [1]. These agricultural wastes and by-productscause negative impacts in terms of environmental concerndue to the increasing amount of pollutant disposal and interms of industrial sustainability due to the high costs relatedto their management [2]. Recovering, recycling, and con-verting of by-products and wastes into value-added productsare the policy to control the stream of organic wastes [3].Therefore, the development of bio-based material has beenstudied by many researchers. In recent years, the use ofnatural plant fibers as a reinforcement material in fiber-reinforced plastics (FRP) has been gaining attention due to
its advantages such as renewability, low density, and highspecific strength [4, 5]. Several plants, such as kenaf, cotton,wood, bamboo, flax, hemp, sisal, jute, and ramie, are richin cellulose and have been used to reinforce polymers toproduce biocomposite materials [6–9]. In the last decade,however, research focusing on the use of cellulosic waste asfiller has grown rapidly. Agrowaste materials such as bananarachis, mulberry bark, soybean, soy hulls [10], wheat straw[10, 11], pineapple leaf fiber [12], barley husk and coconutshell [13], rice husk [14], and sugarcane bagasse [15] have beenstudied as a resource in the production of cellulose fiber.
Cellulose is an important structural component of allplant materials which confers strength and stability tothe plant cell walls [16] and is constantly replenished byphotosynthesis [17, 18]. It is organized into microfibrils in
Hindawi Publishing Corporatione Scientific World JournalVolume 2015, Article ID 293609, 12 pageshttp://dx.doi.org/10.1155/2015/293609

2 The Scientific World Journal
the cell wall, interrupted by hemicellulose and surrounded bya ligninmatrix. Alkali treatment ormercerization is normallyused for preparation of cellulose [19]. The alkali treatmentis a process of subjecting natural fibers in an interactionwith a strong basic aqueous solution to remove noncellulosiccomponents as waxy materials, lignin, hemicellulose, andimpurities [20]. The fiber cell walls swell and become round,thus increasing the strength [19].
Using nano- and microcellulose as reinforcements forepoxy or phenol-formaldehyde resins, polymethylmethacry-late, polypropylene, polystyrene, and styrene copolymershas been extensively studied in the past years [21]. Themajor advantage of cellulose is that it is a good source ofbiodegradable material. The biodegradability of blends ofthermoplastics, low density polyethylene (LDPE), and highdensity polyethylene (HDPE) with kenaf cellulose has beenstudied, showing that cellulose content greater than 30wt.%led to higher degradation [22]. Generally, commodity plasticsare widely used for many applications such as packagingmaterial; however, the plastic materials take very long timefor environment decomposition, which represent a seriousproblem with disposal of plastic waste. Substituting non-biodegradable polymers with biodegradable ones leads tofully renewable and degradable composites [21]. Among themany biodegradable polymers, poly(lactic acid) (PLA) is con-sidered to be one of the most promising renewable resource-based biopolymer matrices due to its high mechanical prop-erties and easy processability compared to other biopolymers[23]. Moreover, its packaging performance characteristics areclosely similar to those of polyethylene terephthalate (PET)[24]. Various studies of PLA reinforced with natural fiberhave been reported [4, 21, 25–33]. Although a variety ofnatural fibers were investigated in detail, the use of durianrind cellulose as reinforcing material in PLA has not yet beenexplored.
Durian (Durio zibethinus Murray) is the most popularfruit in Southeast Asia [34]. The consumption of durian andits products has been phenomenal in the global trade market.The total world harvest of durian is 1.4Mt, dominated bymajor producers: Thailand (781 kt), Malaysia (376 kt), andIndonesia (265 kt) [35]. It has been vigorously expandedand entrenched into a multidisciplinary of food processingindustries, but only one-third of durian is edible, whereasthe seeds and the shell become wastes which generate a largeamount of biological waste [34]. In common practice, durianresidues are burned or sent to landfills, without regard to thesurrounding environment [35]. Suitable methods have to beadopted to utilize the waste for the conversion into upgradedproducts. Durian rind was found to have a good source ofcellulose [36]. In our previous paper [37], we reported thatthe cellulose obtained from durian peel was 33.12 ± 0.108%which is similarwithwheat and barley that consist of celluloseapproximately 28–48, 29–51, and 31–45%, respectively, and26–43% in bamboo cane fiber [38]. Therefore, the use ofcellulose from durian rind as the reinforcing material in PLAwas investigated in this study.
The effects of input variables (cellulose loading, mixingtemperature, and mixing time) on the mechanical properties(tensile strength and impact strength)were studied on surface
plots and contour plots. In addition, the optimized conditionsof the independent variables to maximize tensile strengthand impact strength of composites were also reported in thisresearch.
2. Experimental
2.1. Materials. Poly(lactic acid) (PLA) (Ingeo biopolymer2003D food packaging-grade with melting flow index of6 g/10min at 210∘C; specific gravity of 1.24; >98% purity)was purchased in pellets from Natureworks (USA). Durianpeel was collected from Phatthalung Province, Thailand.Reagent-grade sodium hydroxide (NaOH) and acetic acid(CH3COOH) and technical-grade sodium chlorite (NaClO
2)
of 80% purity were purchased from Fisher Chemicals Sdn.Bhd. (Malaysia).
2.2. Extraction of Cellulose from Durian Peel. The durianpeel was first sun-dried and was then ground as in Figures1(a) and 1(b). Delignification and mercerization were used toextract cellulose according to Tawakkal et al. [30] with slightmodifications. Firstly, delignification was used to produceholocellulose; 20 g of sample was rinsed with tap water toremove dust and was subsequently soaked in a 1,000 mLbeaker with 640mL of distilled water. The beaker was thentransferred to a 70∘C water bath. Next, 4mL of CH
3COOH
and 8 g of NaClO2were added to the beaker. Every subse-
quent hour for total of 5 h, the same amount of CH3COOH
and NaClO2was added in which lignin was completely
separated from the sample. The delignification process wasindicated by the color change of samples frombrown towhite.After that, the sample was left in the water bath overnight.Finally, holocellulose was then filtered, washed, and rinsedwith tap water until the yellow color with an odor of chlorinedioxide was removed and the wash water was clear. Secondly,holocellulose was converted to cellulose by mercerizationor alkali treatment at room temperature. The holocellulosewas added with 80mL of 17.5%w/v NaOH and the mixturewas stirred with a glass rod. Another 40mL of 17.5%w/vNaOH was added to the mixture every 5min, three times.The mixture was allowed to sit for 30min, making the totalduration 45min.Then, 240mLof distilledwater was added tothemixture and allowed to stand for 1 h before filtering. Next,800mL of 8.3%w/v NaOH was added to the cellulose for5min followed by rinsing with water. The alkaline cellulosewas then neutralized by adding 120mL of 10% v/v aceticacid. The cellulose was subjected to acid treatment for 5min.Finally, the cellulose was filtered, washed, and rinsed withdistilled water until the cellulose residue was free from acidand then dried overnight in a vacuum oven at 80∘C. Thecellulose obtained is shown as in Figure 1(c). The cellulosewas kept in an air tight container at room temperature untilanalysis.
2.3. Characterization of Morphological Feature. The SEM [S-3400N, Hitachi, Japan] images were taken to elucidate themorphologies of the untreated durian peel and cellulose.

The Scientific World Journal 3
(a) (b)
(c)
Figure 1: Macroscopic image of (a) durian peel, (b) ground durian peel, and (c) cellulose.
Samples were mounted on aluminum studs and coated withgold in a vacuum before being observed using a SEM.
2.4. Preparation of Biocomposites. The cellulose was groundusing grinder and then passed through a sieve (Retsch, AS200 digit, Germany). The cellulose of sizes 250 to 125 𝜇mwas collected. The PLA and cellulose were mixed using aninternal mixer (Brabender Plastograph EC, Germany) at a50 rpm screw speed. Various biocomposites were createdat different cellulose loadings, mixing temperatures, andmixing times. To prevent pores’ formation, the biocompositeswere dried in a convection oven at 80∘C for 16 h beforefurther processing. The test specimens were then transferredinto a rectangular mould with dimensions of 150mm ×150mm.Moulded biocomposites sheets were produced usinga hot press machine at 160∘C. This process involved 5minof preheating and 5min of pressing, followed by 2min ofcooling for tensile testing specimens with 1 mm thickness.Eight minutes of preheating, 7min of pressing, and 3minof cooling were used to produce samples for impact testingwith 3 mm thicknesses. All biocomposites were packaged
in air tight containers and stored at room temperature untilanalysis.
2.5. Mechanical Testing. The tensile strengths were deter-mined using an Instron Universal Testing Machine (Model5566; USA) at a cross speed of 5mm/min on specimenswith dimensions of 12.7mm × 63mm × 1mm according toASTM 1882L [39], until tensile failure was detected. Fivesamples of each biocomposites were tested. The impact testwas performed using an Impact Pendulum Tester (CeastModel 9050) on 2.5mm notched rectangular specimens withdimensions of 12.7mm × 63mm × 3mm according to ASTMD256 [40]. The Izod method was conducted with a 0.5 Jhammer. Seven samples of each biocomposites were tested.
2.6. Experimental Design and Statistical Analysis. Responsesurface methodology (RSM) was used to optimize the con-ditions for thepreparation of composites. The design ofexperiment was done using Design Expert 9 (Stat-Ease Inc,USA).Three independent variables were employed by centralcomposite design (CCD). The variables used were cellulose

4 The Scientific World Journal
(a) (b)
Figure 2: Scanning electron micrograph of (a) untreated durian peel and (b) cellulose.
Table 1: Coded levels of variables.
Variables Coded levels−𝛼 −1 0a +1 +𝛼
𝑋1: cellulose loading (wt. %) 21.6 25 30 35 38.4𝑋2: temperature (∘C) 161.6 165 170 175 178.4𝑋3: time (min) 11.6 15 20 25 28.4
aCenter point; 𝑘 = 3 (three independent variables).𝛼 = 1.6818.
loading (𝑋1), mixing temperature (𝑋
2), and mixing time
(𝑋3). The design consisted of 20 runs including six axial
experiments (levels ± 𝛼), eight factorial experiments (levels± 1), and six replicates in center point. The level of factorsand their coding are presented in Table 1. The design matrixis presented in Table 2. The response functions measuredwere tensile strength and impact strength. A second-orderpolynomial equation, as a function of 𝑋, was fitted for eachfactor as follows:
𝑌 = 𝛽0+
3
∑
𝑖=1
𝛽𝑖𝑋𝑖+
3
∑
𝑖=1
𝛽𝑖𝑖𝑋2
𝑖+
3
∑
𝑖=1
𝑖<𝑗
𝛽𝑖𝑗𝑋𝑖𝑋𝑗, (1)
where 𝑌 is the estimated response; 𝛽0, 𝛽𝑖, 𝛽𝑖𝑖, and 𝛽
𝑖𝑗are
constant coefficients (𝛽0a constant, 𝛽
𝑖the coefficients for
linear terms, 𝛽𝑖𝑖the coefficients for quadratic terms, and 𝛽
𝑖𝑗
the coefficients for interactive terms); and 𝑋1, 𝑋2, and 𝑋
3
are the coded values of the independent variables of cellu-lose loading (wt.%), mixing temperature (∘C), and mixingtime (min), respectively. The variance for each factor waspartitioned into linear, quadratic, and interactive terms. Thelack-of-fit and error components were used in determiningthe significance of these variables and the suitability of thesecond-order polynomial function.
2.7. Fourier Transform Infrared Spectroscopy (FTIR). Thechange in chemical compositions of untreated durian peel,cellulose, and optimal biocomposites was examined by FTIR(Perkin Elmer, SpectrumOne FT-IR Spectrometer, USA). Allthe spectra were recorded in the transmittance mode with
Table 2: The arrangement of the central composite design.
Trial Coded variables Actual variables𝑋1𝑋2𝑋3𝑋1(%) 𝑋
2(∘C) 𝑋
3(min)
1 −1 −1 −1 25 165 152 −1 −1 +1 25 165 253 −1 +1 −1 25 175 154 −1 +1 +1 25 175 255 +1 −1 −1 35 165 156 +1 −1 +1 35 165 257 +1 +1 −1 35 175 158 +1 +1 +1 35 175 259 −𝛼 0 0 21.6 170 2010 +𝛼 0 0 38.4 170 2011 0 −𝛼 0 30 161.6 2012 0 +𝛼 0 30 178.4 2013 0 0 −𝛼 30 170 11.614 0 0 +𝛼 30 170 28.415 0 0 0 30 170 2016 0 0 0 30 170 2017 0 0 0 30 170 2018 0 0 0 30 170 2019 0 0 0 30 170 2020 0 0 0 30 170 20
a resolution of 4 cm−1 in the range of 4000 to 650 cm−1. Tenscans were averaged for each sample.
3. Results and Discussion
3.1.MorphologyAnalysis. Figure 2 compares themicrographsof untreated durian peel and cellulose. The micrograph ofuntreated durian peel shows the amount of noncellulosiccomponents; pectin, lignin, and hemicellulose scattered overthe surface [18], which provide the bigger diameter thancellulose. These components were then removed after delig-nification and alkali treatment. The important consequenceof diameter reduction was higher reinforcing ability of thecellulose for composite application because the increasing

The Scientific World Journal 5
Table 3: The responses of the parameters used in central composite design.
Trial Independent variables ResponsesCellulose loading (%) Temperature (∘C) Time (min) Tensile strength (MPa) Impact strength (kJ/m2)
1 25 165 15 40.735 ± 1.184 2.519 ± 0.5102 25 165 25 33.318 ± 0.817 2.010 ± 0.1223 25 175 15 39.762 ± 1.092 2.290 ± 0.3104 25 175 25 28.707 ± 1.231 2.025 ± 0.2485 35 165 15 48.010 ± 1.208 2.876 ± 0.3566 35 165 25 47.556 ± 1.669 2.851 ± 0.2277 35 175 15 40.174 ± 0.663 2.445 ± 0.1318 35 175 25 36.800 ± 1.380 2.019 ± 0.5389 21.6 170 20 33.615 ± 1.461 1.922 ± 0.17110 38.4 170 20 46.114 ± 0.956 2.944 ± 0.34111 30 161.6 20 41.067 ± 1.901 2.464 ± 0.29712 30 178.4 20 31.662 ± 1.146 2.241 ± 0.54013 30 170 11.6 35.793 ± 1.076 2.493 ± 0.19614 30 170 28.4 31.984 ± 1.048 2.250 ± 0.28915 30 170 20 29.920 ± 2.051 2.053 ± 0.21016 30 170 20 30.658 ± 1.483 1.952 ± 0.25217 30 170 20 31.150 ± 1.286 1.930 ± 0.25018 30 170 20 30.549 ± 0.845 1.993 ± 0.16519 30 170 20 29.666 ± 1.615 2.028 ± 0.15320 30 170 20 31.192 ± 1.501 2.094 ± 0.203
of aspect ratio (𝐿/𝑑, 𝐿 is the length and 𝑑 is diameter)[10]. Generally, the minimum aspect ratio for good strengthtransmission for any reinforcement material is considered at10 [41]. In our previous paper [37], diameter distribution andaspect ratio of 70 samples of cellulose were investigated andfound that the most cellulose presented diameter and aspectratio in the range of 100–150 𝜇mand 20–25, respectively.Thuscellulose from durian peel had an aspect ratio superior to thisvalue.
3.2. Tensile Strength and Impact Strength. The results ofthe 20 runs to determine the tensile strength and impactstrength of composites using the internal mixer are tabulatedin Table 3.The three factors tested in this study were celluloseloading, mixing temperature, and mixing time. The tensilestrength of the composites ranged from 28.707 to 48.010MPaand impact strength ranged from 1.922 to 2.944 kJ/m2. Thehighest tensile strength value was 48.010MPa under testconditions of 35 wt.% cellulose loading, 165∘C, and 15min ofmixing. The highest impact strength value was 2.944 kJ/m2at 38.4 wt.% cellulose loading, 170∘C, and 20min of mixing;meanwhile, the lowest tensile strength value was 28.707MPaunder 25wt.% cellulose loading, 165∘C, and 15min of mix-ing test conditions and the lowest impact strength valuewas 1.922 kJ/m2 under 21.6 wt.% cellulose loading, 170∘C,and 20min of mixing. When natural fibers are used asa reinforcing material in semicrystalline polymer matricessuch as PLA, they can act as nucleating sites for crystalgrowth and commonly a transcrystalline layer grows fromthe crystalline cellulose surface [28, 42–44], which influences
the mechanical properties of the composite. The statisticalcomparative study on tensile strength and impact strength ofthese composites was examined using RSM and the effects ofthe independent variables to the responses are discussed inthe next section.
3.3. Model Selection and Verification of Tensile Strength andImpact Strength. The collected data was analyzed usingsoftware Design Expert 9. All the responses were analyzedusing analysis of variance (ANOVA) and regression analysisfor model fitting to evaluate the significance of the coefficientterms. The results are tabulated in Tables 4 through 6. Theanalysis of variance (ANOVA) for the quadratic model oftensile strength and impact strength are presented in Tables4 and 5, respectively. The ANOVA demonstrated that thequadratic regression model of tensile strength was highlysignificant as the 𝐹-test had a very low probability value(𝑝 < 0.0001). This probability value means that there wasonly 0.01% chance that a “Model 𝐹 value” of this magnitudecould occur due to noise [45]. The model of impact strengthwas 0.0006 (𝑝 < 0.05) which also indicated that the modelwas significant; however, the lack of fit 𝐹 value of 13.41 fortensile strength and 9.49 for impact strength implied thatthe lack of fits was also significant. The model, therefore,required further analysis. The goodness-of-fit of the modelswas further inspected using the 𝑅2 value. The results showedthat 𝑅2 of the model for tensile strength and impact strengthwere 0.9621 and 0.9012, respectively. In addition, the adequateprecision values for both tensile strength and impact strengthwere well above 4; therefore, all the response surface models

6 The Scientific World Journal
Table 4: Analysis of variance for the quadratic model of tensile strength.
Source Sum of squares DF Mean squares 𝐹 value Prob > 𝐹Model 715.11 9 79.46 28.18 <0.0001 significantResidual 28.20 10 2.82Lack-of-fit 26.24 5 5.25 13.41 0.0064 significantPure error 1.96 5 0.39Total 743.31 19Std. dev. = 1.68, mean = 35.92, 𝑅-square = 0.9621, and adeq. precision = 15.814.
Table 5: Analysis of variance for the quadratic model of impact strength.
Source Sum of squares DF Mean squares 𝐹 value Prob > 𝐹Model 1.84 9 0.20 10.13 0.0006 significantResidual 0.20 10 0.020Lack-of-fit 0.18 5 0.037 9.49 0.0137 significantPure error 0.019 5 3.850𝐸 − 003
Total 2.04 19Std. dev. = 0.14, mean = 2.27, 𝑅-square = 0.9012, adeq. precision = 9.415.
Table 6: Regression coefficients and probability values of approxi-mate polynomials for response variables in experimental design.
Term Tensile strength Impact strengthCoefficient Probability Coefficient Probability
Constant 30.45 — 2.01 —𝑋1: cellulose 3.74 <0.0001 0.22 0.0002𝑋2: temperature −2.93 <0.0001 −0.14 0.0041𝑋3: time −2.10 0.0009 −0.11 0.0148𝑋1
2 3.79 <0.0001 0.15 0.0029𝑋2
2 2.55 0.0002 0.12 0.0103𝑋3
2 1.68 0.0036 0.12 0.0076𝑋1𝑋2
−1.63 0.0209 −0.12 0.0382𝑋1𝑋3
1.83 0.0116 0.029 0.5752𝑋2𝑋3
−0.82 0.1975 −0.031 0.5538
had the satisfactory values. From the above analysis, it can beconcluded that these models are suitable for predicting themechanical properties-tensile strength and impact strengthof cellulose from durian rind-reinforced PLA compositeswithin the limits of the experiment.
The𝑝 values for each response are summarized in Table 6.It was found that the terms in the model had a significanteffect on the responses. For the tensile strength of the com-posites, the mixing temperature and mixing time interaction(𝑋2𝑋3) was not significant, while the other model terms
were concluded to be significant. For impact strength of thecomposites, the cellulose loading (𝑋
1), mixing temperature
(𝑋2), mixing time (𝑋
3), two-level interaction of cellulose
loading (𝑋1
2), mixing temperature (𝑋2
2), mixing time (𝑋3
2),and interaction of cellulose loading and mixing temperature(𝑋1𝑋2) were all significant (𝑝 < 0.05). The other model
termswere determined to not be significant. A higher value ofregression coefficients can be directly translated to a greatereffect of the independent variables on the responses [46].
Cellulose loading showed the highest regression coefficientvalue for both tensile strength and impact strength; therefore,it can be said that cellulose loading, compared to the othervariables, had the greatest effect on tensile strength andimpact strength. Moreover, the positive coefficients for theindependent variables indicated a favorable effect on themechanical properties [47]. The negative coefficients amongthe three independent variables indicated a partitioningfavorable effect on the mechanical properties. Table 6 showsthat only the main effect of cellulose loading representedfavorable results on tensile strength and impact strength.Theresults demonstrated that the composites were best fit by thequadratic regression model for tensile strength and impactstrength. The estimated models built for the tensile strengthand impact strength methods are represented by (2) and (3)in terms of the coded values. It should be noted, however,that the following equations are only valid within the rangeof tested conditions: 15 wt.% < cellulose loading < 35wt.%,165∘C < mixing temperature < 175∘C, and 15min < mixingtime < 25min.
For tensile strength, the model equation is as follows:
𝑌 = 30.45− 3.74𝑋1 − 2.93𝑋2 − 2.10𝑋3 + 3.79𝑋12
+ 2.55𝑋22+ 1.68𝑋3
2− 1.63𝑋1𝑋2 + 1.83𝑋1𝑋3
− 0.82𝑋2𝑋3.
(2)
For impact strength, the model equation is as follows:
𝑌 = 2.01+ 0.22𝑋1 − 0.14𝑋2 − 0.11𝑋3 + 0.15𝑋12
+ 0.12𝑋22+ 0.12𝑋3
2− 0.12𝑋1𝑋2 + 0.029𝑋1𝑋3
− 0.031𝑋2𝑋3,
(3)
where 𝑌 is the predicted response;𝑋1is cellulose loading;𝑋
2
is mixing temperature; and𝑋3is mixing time.
A graphical representation of themodels’ quality is shownin Figure 3. The predicted (𝑌) versus experimental (𝑋)

The Scientific World Journal 7
504540353025
50
45
40
35
30
25
R2= 0.96
Y: p
redi
cted
X: experimental
(a)
32.82.62.42.221.8
3
2.8
2.6
2.4
2.2
2
1.8
R2= 0.90
Y: p
redi
cted
X: experimental
(b)
Figure 3: Correlation of predicted response versus experimental response: (a) tensile strength and (b) impact strength.
values for tensile strength (Figure 3(a)) and impact strength(Figure 3(b)) show that the quadratic model fits are suitable,with 𝑅2 values for tensile strength and impact strength of0.9612 and 0.9012, respectively. These 𝑅2 values indicate thatonly 3.79% of the tensile strength variation and 9.88% of theimpact strength variation were not explained by the models.
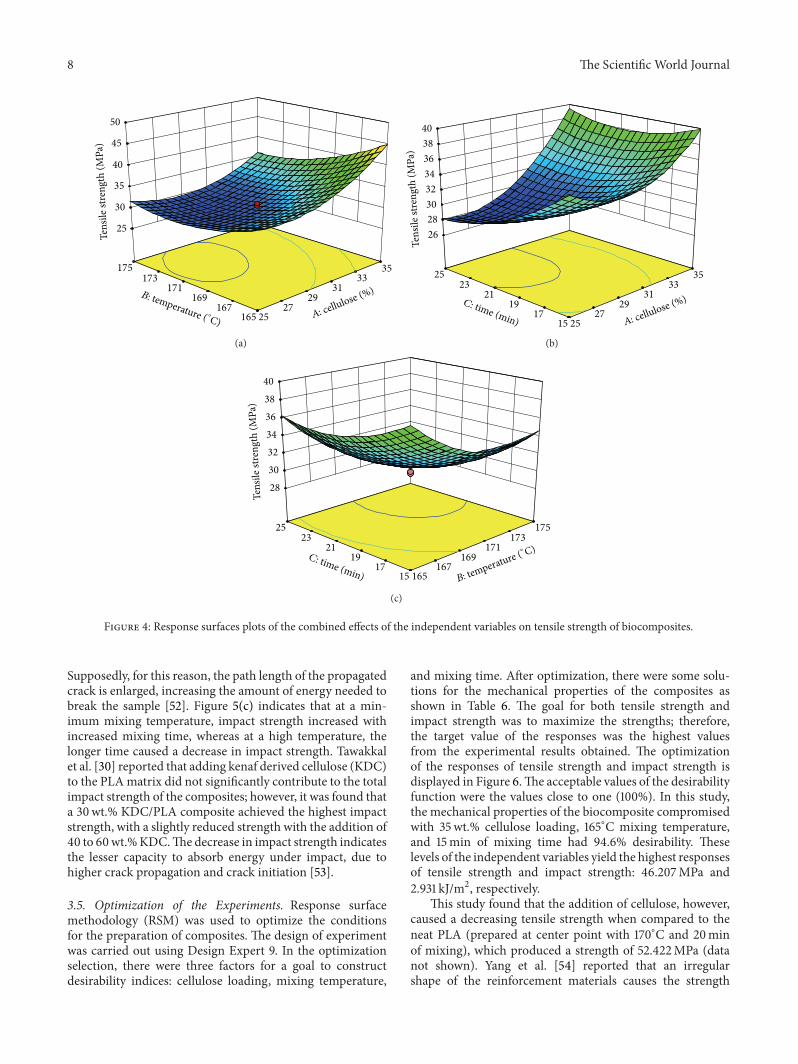
3.4. Analysis of Response Surfaces. The 3D response surfaceplots and contour plots of the combined effects of the inde-pendent variables of cellulose loading, mixing temperature,and mixing time on tensile strength and impact strengthare shown in Figures 4 and 5, according to (2) and (3),respectively. In this study, 3D response surfaceswere obtainedby keeping one of the variables constant at a zero level whilevarying the other two variables. It is observed from Figure 4that there was a quadratic effect of cellulose loading, mixingtemperature, and mixing time on tensile strength.
Figures 4(a) and 4(b) demonstrate that the celluloseloading had themost significant effect on the tensile strength,followed bymixing temperature andmixing time.The tensilestrength increased with increase in cellulose loading. Thisresult was similar to the findings of Tawakkal et al. [27].Theystudied the effect of kenaf derived cellulose (KDC) loadingon tensile properties and reported that both the tensilestrength and tensile modulus were improved with increasingKDC; the addition of KDC loading from 30 to 60wt.%enhanced the strength of composites. In contrast, Sawpanet al. [29] investigated the mechanical properties of hempfiber-reinforced (range 0 to 40wt.%) PLA biocomposites andfound that the relationship between tensile strength and fibercontent was not linear. This indicated that at a higher fibercontent, the addition somewhat decreased the strength of thecomposite.
Figure 4(c) illustrates that tensile strength slightlydecreased with an increase in mixing temperature at aconstant cellulose loading of 30wt.%. As shown in Table 2,the highest tensile strength was obtained when the cellulose
loading was at its highest level, lowest mixing temperature,and lowestmixing timewithin the ranges tested.The decreasein tensile strength at the higher mixing temperature andlonger mixing time can be due to the thermal degradationof cellulose [48]. It is known that fiber shortening inevitablyoccurs during mixing of composites with both natural fiber[49, 50] and synthetic fiber [51], related to the strong shearstress endured by the viscous molten polymer [29]. As thefiber content increased, the possibility of this phenomenaoccurring during mixing with interaction between the fiberand equipment wall increased, resulting in fibers shorterthan the critical length and reduced aspect ratio, whichdirectly affected the performance of the composites [48] anddecreased the tensile strength. Generally, the aspect ratio hasto be superior to 10, which is considered to be the minimumaspect ratio for good strength transmission for any reinforce-ment [41]. In addition, Kannappan and Dhurai [5] reportedthat time did not make a significant difference in tensilestrength; hence, an increase in temperature increased thetensile strength. Melting occurs when the polymer chains fallout of their crystal structures and become a disorder liquid tocause good binding results between the reinforcement fibers,which in turn increase the tensile strength.
Figures 5(a) and 5(b) present that cellulose loading hadthe most significant effect on the impact strength. It is clearthat when cellulose loading increased, impact strength alsoincreased rapidly at a minimum temperature as shown inFigure 5(a). According to Bledzki and Jaszkiewicz [25], themassive increase in impact performance for all man-madecellulose composites is due to smaller diameter and smoothersurface, which affects the fiber/matrix interaction and, there-fore, allowing for pullout to occur. The cellulose used in thisstudy was extracted using a chlorination method to removelignin followed by mercerization to convert holocelluloseto alpha cellulose. After these two steps the noncellulosiccomponents scattered over the surface were removed andresulted in a decreased diameter and smoother surface.
8 The Scientific World Journal
50
45
40
35
30
25
175173
171169
167165 25
2729
3133
35
Tens
ile st
reng
th (M
Pa)
B: temperature ( ∘C) A: cellulose (%)
(a)
40
38
36
34
32
30
28
26
2523
2119
1715 25
2729
3133
35
Tens
ile st
reng
th (M
Pa)
C: time (min) A: cellulose (%)
(b)
40
38
36
34
32
30
28
2523
2119
1715 165
167169
171173
175
Tens
ile st
reng
th (M
Pa)
C: time (min) B: temperature (∘ C)
(c)
Figure 4: Response surfaces plots of the combined effects of the independent variables on tensile strength of biocomposites.
Supposedly, for this reason, the path length of the propagatedcrack is enlarged, increasing the amount of energy needed tobreak the sample [52]. Figure 5(c) indicates that at a min-imum mixing temperature, impact strength increased withincreased mixing time, whereas at a high temperature, thelonger time caused a decrease in impact strength. Tawakkalet al. [30] reported that adding kenaf derived cellulose (KDC)to the PLAmatrix did not significantly contribute to the totalimpact strength of the composites; however, it was found thata 30wt.% KDC/PLA composite achieved the highest impactstrength, with a slightly reduced strength with the addition of40 to 60wt.%KDC.Thedecrease in impact strength indicatesthe lesser capacity to absorb energy under impact, due tohigher crack propagation and crack initiation [53].
3.5. Optimization of the Experiments. Response surfacemethodology (RSM) was used to optimize the conditionsfor the preparation of composites. The design of experimentwas carried out using Design Expert 9. In the optimizationselection, there were three factors for a goal to constructdesirability indices: cellulose loading, mixing temperature,
and mixing time. After optimization, there were some solu-tions for the mechanical properties of the composites asshown in Table 6. The goal for both tensile strength andimpact strength was to maximize the strengths; therefore,the target value of the responses was the highest valuesfrom the experimental results obtained. The optimizationof the responses of tensile strength and impact strength isdisplayed in Figure 6.The acceptable values of the desirabilityfunction were the values close to one (100%). In this study,the mechanical properties of the biocomposite compromisedwith 35wt.% cellulose loading, 165∘C mixing temperature,and 15min of mixing time had 94.6% desirability. Theselevels of the independent variables yield the highest responsesof tensile strength and impact strength: 46.207MPa and2.931 kJ/m2, respectively.
This study found that the addition of cellulose, however,caused a decreasing tensile strength when compared to theneat PLA (prepared at center point with 170∘C and 20minof mixing), which produced a strength of 52.422MPa (datanot shown). Yang et al. [54] reported that an irregularshape of the reinforcement materials causes the strength

The Scientific World Journal 9
2.8
2.6
2.4
2.2
2
1.8
175173
171169
167165 25
2729
3133
35
Impa
ct st
reng
th (k
J/m2)
B: temperature ( ∘C) A: cellulose (%)
(a)
2.6
2.4
2.2
2
1.8
25
2123
1917
15 2527
2931
3335
Impa
ct st
reng
th (k
J/m2)
C: time (min) A: cellulose (%)
(b)
2.5
2.4
2.3
2.2
2.1
2
1.9
2523
2119
1715 165
167169
171173
175
Impa
ct st
reng
th (k
J/m2)
C: time (min)B: temperature (∘ C)
(c)
Figure 5: Response surface plots of the combined effects of the independent variables on impact strength of biocomposites.
25 35
15 25
1.922 2.944
Impact strength = 2.931
165 175
28.707 48.010
Desirability = 0.946
Tensile strength = 46.207
A: cellulose = 35 B: temperature = 165
C: time = 15
Figure 6: Optimum condition of the independent variables and theresponses of the biocomposites.
of the composites to decrease due to the inability of thereinforcement to support stress transfer from the polymermatrix. A weak interfacial region will reduce the efficiency
of the stress transfer from the matrix to the reinforcingcomponent, lowering its strength [55]. The result was similarto Wang et al. [33], where they found that the strength ofcomposites decreased with increasing amount of rice hull.A major limitation of using plant fiber and cellulose forreinforcement is that adhesion between the two materialsis expected to be rather poor because of the polar natureof fiber and the nonpolar groups of thermoplastics such aspoly(lactic acid) [56–58]. The quality of interfacial bondingis determined by several factors, such as the nature of thefiber and polymer components, the fiber aspect ratio, theprocessing procedure, and the treatment of the polymer orfiber [59–62]. To obtain materials with improved mechanicalproperties, the efficient dispersion of one phase into the otheris required.
3.6. Spectroscopy Analysis. The structure of polymer compos-ites can be identified using FTIR. If two components formcompletely immiscible blend, then there should be no con-siderable changes in the IR spectra of composites compared

10 The Scientific World Journal
4000 3600 3200 2800 2400 2000 1800 1600 1400 1200 1000 800 650
(a)
(b)
(c)
3297
3299
3300
2920
2918
2918
2851
2850
2850
1753 1086
1090
1453
14691770
Wavelength (cm−1)
T(%
)
Figure 7: FTIR spectra for (a) poly(lactic acid), (b) cellulose, and(c) biocomposites.
with each component spectra [63]. However, if two polymersare compatible, a distinct chemical interaction (hydrogen-bonding or dipolar interaction) exists between the chains ofpolymer and those of additional component, affecting theIR spectra of composites to change (e.g., band shifting andbroadening) [64]. Figure 7 shows the spectra of PLA, celluloseand biocomposites (PLA/cellulose blends). Peaks near 3400–3200 cm−1 and 3000–2850 cm−1 were observed in all spectrawhich are attributed to O-H stretching group [37] and C-H stretching [65], respectively. For neat PLA, the strongabsorption peak at 1753 cm−1 is assigned to stretching of C=Ogroup [27, 63, 66] and peak at 1080 and 1453 cm−1 representsC-O group of ester bonds and asymmetrical stretching of-CH3group [66]. It was seen that there were shifts of C=O
peak at 1753 cm−1 and C-O peak at 1086 cm−1 (neat PLA)to peak at 1770 cm−1 and 1090 cm−1 in biocomposites. Theseshiftsmight be because of the formation of hydrogen bondingbetween -OH in cellulose and C=O and C-O in PLA [27,30, 67]. The peak at 1453 cm−1 (neat PLA) moved towardhigher wavenumber of 1469 cm−1 in biocomposites. Theobservations further indicated the presence of interactionsbetween the PLA matrix and cellulose surfaces.
4. Conclusion
The biocomposites showed that tensile strength ranged from28.707 to 48.010MPa and impact strength ranged from1.922 to 2.944 kJ/m2. The highest tensile strength value was48.010MPa with conditions of 35 wt.% cellulose loading,165∘C, and 15min of mixing, while the highest impactstrength value was 2.944 kJ/m2 under 38.4 wt.% cellulose,170∘C, and 20min of mixing.The quadratic regression modelwas selected for modeling the tensile strength and impactstrength due to its high significance level. The 𝑅2 valuesof the model for tensile strength and impact strength were0.9621 and 0.9012, respectively. Both tensile strength andimpact strength had adequate precision values above 4;thus, these models can be used to predict the mechanicalproperties of biocomposites composed of poly(lactic acid)and cellulose from durian rind. Cellulose loading, mixing
temperature, and mixing time were significant variables inaffecting tensile strength and impact strength. The orderof independent variables according to the significance wascellulose loading followed bymixing temperature andmixingtime. The optimal conditions considering the mechanicalproperties was found to be at cellulose loading, mixingtemperature, and mixing time of 35wt.%, 165∘C, and 15minwith a desirability of 94.16%. At this optimal condition,the tensile strength and impact strength were found to be46.207MPa and 2.931 kJ/m2, respectively.
Conflict of Interests
The authors declare that there is no conflict of interestsregarding the publication of this paper.
Acknowledgments
The authors would like to thank the German AcademicExchange Service (DAAD) and Southeast Asian RegionalCenter for Graduate Study and Research in Agriculture(SEARCA) for their financial support. All the technical staffin Department of Process and Food Engineering, Facultyof Engineering and Institute of Tropical Forestry and ForestProducts, Universiti Putra Malaysia, are greatly acknowl-edged for their assistance.
References
[1] A. T. Seadi and J. B. Holm-Nielsen, “Utilization of waste fromfood and agriculture,” in SolidWaste: Assesment,Monitoring andRemediation, J. Twardowskai, H. E. Allen, A. F. Kettrup, andW.J. Lacy, Eds., Elsevier B.V., Philadelphia, Pa, USA, 2004.
[2] E. Schettini, G. Santagata, M. Malinconico, B. Immirzi, G.S. Mugnozza, and G. Vox, “Recycled wastes of tomato andhemp fibres for biodegradable pots: physico-chemical charac-terization and field performance,” Resources, Conservation andRecycling, vol. 70, pp. 9–19, 2013.
[3] F. Federici, F. Fava, N. Kalogerakis, and D. Mantzavinos, “Val-orisation of agro-industrial by-products, effluents and waste:concept, opportunities and the case of olive mill wastewaters,”Journal of Chemical Technology and Biotechnology, vol. 84, no.6, pp. 895–900, 2009.
[4] S. Ochi, “Mechanical properties of kenaf fibers and kenaf/PLAcomposites,” Mechanics of Materials, vol. 40, no. 4-5, pp. 446–452, 2008.
[5] S. Kannappan and B. Dhurai, “Investigating and optimizing theprocess variables related to the tensile properties of short jutefiber reinforced with polypropylene composite board,” Journalof Engineered Fibers and Fabrics, vol. 7, no. 4, pp. 28–34, 2012.
[6] N. Canigueral, F. Vilaseca, J. A. Mendez et al., “Behavior ofbiocomposite materials from flax strands and starch-basedbiopolymer,” Chemical Engineering Science, vol. 64, no. 11, pp.2651–2658, 2009.
[7] K. Okubo, T. Fujii, and E. T. Thostenson, “Multi-scale hybridbiocomposite: processing and mechanical characterization ofbamboo fiber reinforced PLA with microfibrillated cellulose,”Composites Part A: Applied Science and Manufacturing, vol. 40,no. 4, pp. 469–475, 2009.
The Scientific World Journal 11
[8] T. Yu, J. Ren, S. Li, H. Yuan, and Y. Li, “Effect of fiber surface-treatments on the properties of poly(lactic acid)/ramie compos-ites,”Composites Part A: Applied Science andManufacturing, vol.41, no. 4, pp. 499–505, 2010.
[9] M. Li, L.-J. Wang, D. Li, Y.-L. Cheng, and B. Adhikari, “Prepa-ration and characterization of cellulose nanofibers from de-pectinated sugar beet pulp,”Carbohydrate Polymers, vol. 102, no.1, pp. 136–143, 2014.
[10] N. Johar, I. Ahmad, and A. Dufresne, “Extraction, preparationand characterization of cellulose fibres and nanocrystals fromrice husk,” Industrial Crops and Products, vol. 37, no. 1, pp. 93–99, 2012.
[11] L. Averous and F. Le Digabel, “Properties of biocompositesbased on lignocellulosic fillers,” Carbohydrate Polymers, vol. 66,no. 4, pp. 480–493, 2006.
[12] R. M. N. Arib, S. M. Sapuan, M. M. H. M. Ahmad, M. T.Paridah, and H. M. D. Khairul Zaman, “Mechanical propertiesof pineapple leaf fibre reinforced polypropylene composites,”Materials and Design, vol. 27, no. 5, pp. 391–396, 2006.
[13] A. K. Bledzki, A. A. Mamun, and J. Volk, “Barley husk andcoconut shell reinforced polypropylene composites: the effectof fibre physical, chemical and surface properties,” CompositesScience and Technology, vol. 70, no. 5, pp. 840–846, 2010.
[14] A. Nourbakhsh, F. F. Baghlani, and A. Ashori, “Nano-SiO2
filled rice husk/polypropylene composites: physico-mechanicalproperties,” Industrial Crops and Products, vol. 33, no. 1, pp. 183–187, 2011.
[15] J. O. Agunsoye and V. S. Aigbodion, “Bagasse filled recycledpolyethylene bio-composites: morphological and mechanicalproperties study,” Results in Physics, vol. 3, pp. 187–194, 2013.
[16] A. Dufresne, “Comparing the mechanical properties ofhigh performance polymer nanocomposites from biologicalsources,” Journal of Nanoscience and Nanotechnology, vol. 6, no.2, pp. 322–330, 2006.
[17] J. X. Sun, X. F. Sun, H. Zhao, and R. C. Sun, “Isolation andcharacterization of cellulose from sugarcane bagasse,” PolymerDegradation and Stability, vol. 84, no. 2, pp. 331–339, 2004.
[18] A. Mandal and D. Chakrabarty, “Isolation of nanocellulosefrom waste sugarcane bagasse (SCB) and its characterization,”Carbohydrate Polymers, vol. 86, no. 3, pp. 1291–1299, 2011.
[19] K. Goda, M. S. Sreekala, A. Gomes, T. Kaji, and J. Ohgi,“Improvement of plant based natural fibers for tougheninggreen composites-effect of load application during merceriza-tion of ramie fibers,” Composites Part A: Applied Science andManufacturing, vol. 37, no. 12, pp. 2213–2220, 2006.
[20] A. K. Bledzki and J. Gassan, “Composites reinforced withcellulose based fibres,” Progress in Polymer Science, vol. 24, no.2, pp. 221–274, 1999.
[21] A. N. Frone, S. Berlioz, J.-F. Chailan, D. M. Panaitescu, and D.Donescu, “Cellulose fiber-reinforced polylactic acid,” PolymerComposites, vol. 32, no. 6, pp. 976–985, 2011.
[22] B. Tajeddin, R. A. Rahman, L. C. Abdulah, Y. A. Yusof, and N.A. Ibrahim, “Effect of PEG on the biodegradability studies ofKenaf cellulose -polyethylene composites,” International FoodResearch Journal, vol. 16, pp. 243–247, 2009.
[23] L. Suryanegara, A. N. Nakagaito, and H. Yano, “The effect ofcrystallization of PLA on the thermal and mechanical prop-erties of microfibrillated cellulose-reinforced PLA composites,”Composites Science and Technology, vol. 69, no. 7-8, pp. 1187–1192, 2009.
[24] J. Ahmed, S. K. Varshney, and R. Auras, “Rheological and ther-mal properties of polylactide/silicate nanocomposites films,”Journal of Food Science, vol. 75, no. 2, pp. N17–N24, 2010.
[25] A. K. Bledzki and A. Jaszkiewicz, “Mechanical performanceof biocomposites based on PLA and PHBV reinforced withnatural fibres—a comparative study to PP,” Composites Scienceand Technology, vol. 70, no. 12, pp. 1687–1696, 2010.
[26] P. Qu, Y. Gao, G.-F. Wu, and L.-P. Zhang, “Nanocomposites ofpoly(lactic acid) reinforced with cellulose nanofibrils,” BioRe-sources, vol. 5, no. 3, pp. 1811–1823, 2010.
[27] I. S. M. A. Tawakkal, R. A. Talib, K. Abdan, and N. L. Chin,“Optimisation of processing variables of kenaf derived cellulosereinforced polylactic acid,” Asian Journal of Chemistry, vol. 22,no. 9, pp. 6652–6662, 2010.
[28] K. L. Pickering, M. A. Sawpan, J. Jayaraman, and A. Ferny-hough, “Influence of loading rate, alkali fibre treatment andcrystallinity on fracture toughness of random short hempfibre reinforced polylactide bio-composites,”Composites Part A:Applied Science andManufacturing, vol. 42, no. 9, pp. 1148–1156,2011.
[29] M. A. Sawpan, K. L. Pickering, and A. Fernyhough, “Improve-ment of mechanical performance of industrial hemp fibre rein-forced polylactide biocomposites,” Composites Part A: AppliedScience and Manufacturing, vol. 42, no. 3, pp. 310–319, 2011.
[30] I. S. M. A. Tawakkal, R. A. Talib, K. Abdan, and C. N. Ling,“Mechanical and physical properties of kenaf-derived cellulose(KDC)-filled polylactic acid (PLA) composites,” BioResources,vol. 7, no. 2, pp. 1643–1655, 2012.
[31] K. Halasz and L. Csoka, “Plasticized biodegradable poly(lacticacid) based composites containing cellulose inmicro- and nanosize,” Journal of Engineering, vol. 2013, Article ID 329379, 9pages, 2013.
[32] A. Jiang, X. Xu, and H. Wu, “Preparation and properties of L-lactide grafted sisal fiber reinforced poly(lactic acid) compos-ites,” Polymer Composites, 2014.
[33] X. Wang, H. Sun, H. Bai, and L.-P. Zhang, “Thermal, mechan-ical, and degradation properties of nanocomposites preparedusing lignin-cellulose nanofibers and poly (lactic acid),” BioRe-sources, vol. 9, no. 2, pp. 3211–3244, 2014.
[34] B. T. Amid and H. Mirhosseini, “Optimisation of aqueousextraction of gum from durian (Durio zibethinus) seed: apotential, low cost source of hydrocolloid,” Food Chemistry, vol.132, no. 3, pp. 1258–1268, 2012.
[35] K. Y. Foo and B. H. Hameed, “Transformation of durianbiomass into a highly valuable end commodity: trends andopportunities,” Biomass and Bioenergy, vol. 35, no. 7, pp. 2470–2478, 2011.
[36] P. Rachtanapun, S. Luangkamin, K. Tanprasert, and R. Suriy-atem, “Carboxymethyl cellulose film from durian rind,” LWT—Food Science and Technology, vol. 48, no. 1, pp. 52–58, 2012.
[37] P. Penjumras, R. B. Rahman, R. A. Talib, and K. Abdan,“Extraction and characterization of cellulose from durian rind,”Agriculture and Agricultural Science Procedia, vol. 2, pp. 237–243, 2014.
[38] J. S. Han and J. S. Rowell, “Chemical composition of fibers,” inPaper and Composites from Agro-Based Resources, R. M. Rowelland J. Rowell, Eds., pp. 83–130, CRC Press, London, UK, 1996.
[39] ASTM, “Standard test methods for tensile-impact energy tobreak plastics and electrical insulating materials,” ASTM D1882L, ASTM International, West Conshohocken, Pa, USA,2002.

12 The Scientific World Journal
[40] ASTM International, “Standard test methods for determiningthe izod pendulum impact resistance of plastics,” ASTMD 256,ASTM International, West Conshohocken, Pa, USA, 2004.
[41] A. Bourmaud and S. Pimbert, “Investigations on mechanicalproperties of poly(propylene) and poly(lactic acid) reinforcedby miscanthus fibers,” Composites Part A: Applied Science andManufacturing, vol. 39, no. 9, pp. 1444–1454, 2008.
[42] A. P. Mathew, K. Oksman, andM. Sain, “The effect of morphol-ogy and chemical characteristics of cellulose reinforcements onthe crystallinity of polylactic acid,” Journal of Applied PolymerScience, vol. 101, no. 1, pp. 300–310, 2006.
[43] R. Masirek, Z. Kulinski, D. Chionna, E. Piorkowska, and M.Pracella, “Composites of poly(L-lactide) with hemp fibers:morphology and thermal and mechanical properties,” Journalof Applied Polymer Science, vol. 105, no. 1, pp. 255–268, 2007.
[44] S. Pilla, S. Gong, E. O’Neill, R. M. Rowell, and A. M. Krzysik,“Polylactide-pine wood flour composites,” Polymer Engineeringand Science, vol. 48, no. 3, pp. 578–587, 2008.
[45] C. Lv, Y. Wang, L.-J. Wang, D. Li, and B. Adhikari, “Optimiza-tion of production yield and functional properties of pectinextracted from sugar beet pulp,”Carbohydrate Polymers, vol. 95,no. 1, pp. 233–240, 2013.
[46] B. P. Chang, H. M. Akil, M. G. Affendy, A. Khan, and R.B. Nasir, “Comparative study of wear performance of par-ticulate and fiber-reinforced nano-ZnO/ultra-high molecularweight polyethylene hybrid composites using response surfacemethodology,”Materials & Design, vol. 63, pp. 805–819, 2014.
[47] A. E. Hadi, Characterisation and optimisation of mechanical,physical and thermal properties of short Abaca (Musa TextileNee) fibre reinforced high impact polystyrene composites [Ph.D.thesis], Universiti Putra Malaysia, 2011.
[48] P. V. Joseph, K. Joseph, and S. Thomas, “Effect of processingvariables on the mechanical properties of sisal-fiber-reinforcedpolypropylene composites,”Composites Science and Technology,vol. 59, no. 11, pp. 1625–1640, 1999.
[49] H. L. Bos, J. Mussig, and M. J. A. van den Oever, “Mechanicalproperties of short-flax-fibre reinforced compounds,” Compos-ites Part A: Applied Science and Manufacturing, vol. 37, no. 10,pp. 1591–1604, 2006.
[50] R. Tokoro, D. M. Vu, K. Okubo, T. Tanaka, T. Fujii, and T.Fujiura, “How to improve mechanical properties of polylacticacid with bamboo fibers,” Journal of Materials Science, vol. 43,no. 2, pp. 775–787, 2008.
[51] S.-Y. Fu, B. Lauke, E.Mader, C.-Y. Yue, andX.Hu, “Tensile prop-erties of short-glass-fiber- and short-carbon-fiber-reinforcedpolypropylene composites,” Composites Part A: Applied Scienceand Manufacturing, vol. 31, no. 10, pp. 1117–1125, 2000.
[52] A. K. Bledzki, A. Jaszkiewicz, and D. Scherzer, “Mechanicalproperties of PLA composites with man-made cellulose andabaca fibres,” Composites Part A: Applied Science and Manufac-turing, vol. 40, no. 4, pp. 404–412, 2009.
[53] M. S. Huda, L. T. Drzal, M. Misra, and A. K. Mohanty, “Wood-fiber-reinforced poly(lactic acid) composites: evaluation of thephysicomechanical and morphological properties,” Journal ofApplied Polymer Science, vol. 102, no. 5, pp. 4856–4869, 2006.
[54] H.-S. Yang, H.-J. Kim, J. Son, H.-J. Park, B.-J. Lee, and T.-S. Hwang, “Rice-husk flour filled polypropylene composites;mechanical and morphological study,” Composite Structures,vol. 63, no. 3-4, pp. 305–312, 2004.
[55] J. C. Miguez Suarez, F. M. B. Coutinho, and T. H. Sydenstricker,“SEM studies of tensile fracture surfaces of polypropylene-sawdust composites,” Polymer Testing, vol. 22, no. 7, pp. 819–824,2003.
[56] M. Abdelmouleh, S. Boufi, M. N. Belgacem, and A. Dufresne,“Short natural-fibre reinforced polyethylene and natural rubbercomposites: effect of silane coupling agents and fibres loading,”Composites Science and Technology, vol. 67, no. 7-8, pp. 1627–1639, 2007.
[57] J. Lu, P. Askeland, and L. T. Drzal, “Surface modification ofmicrofibrillated cellulose for epoxy composite applications,”Polymer, vol. 49, no. 5, pp. 1285–1296, 2008.
[58] Y. Xie, C. A. S. Hill, Z. Xiao, H. Militz, and C. Mai, “Silanecoupling agents used for natural fiber/polymer composites: areview,” Composites Part A: Applied Science and Manufacturing,vol. 41, no. 7, pp. 806–819, 2010.
[59] C.-H. Hsueh, “Interfacial debonding and fiber pull-out stressesof fiber-reinforced composites IV: sliding due to residualstresses,”Materials Science and Engineering A, vol. 145, no. 2, pp.143–150, 1991.
[60] J.M. Felix, P. Gatenholm, andH. P. Schreiber, “Controlled inter-actions in cellulose-polymer composites 1: effect on mechanicalproperties,” Polymer Composites, vol. 14, no. 6, pp. 449–457,1993.
[61] A. Valadez-Gonzalez, J. M. Cervantes-Uc, R. Olayo, and P. J.Herrera-Franco, “Effect of fiber surface treatment on the fiber-matrix bond strength of natural fiber reinforced composites,”Composites Part B: Engineering, vol. 30, no. 3, pp. 309–320, 1999.
[62] K. V. Pochiraju, G. P. Tandon, and N. J. Pagano, “Analysesof single fiber pushout considering interfacial friction andadhesion,” Journal of the Mechanics and Physics of Solids, vol.49, no. 10, pp. 2307–2338, 2001.
[63] G. Zhang, J. Zhang, X. Zhou, and D. Shen, “Miscibilityand phase structure of binary blends of polylactide andpoly(vinylpyrrolidone),” Journal of Applied Polymer Science, vol.88, no. 4, pp. 973–979, 2003.
[64] S. Peng, X. Wang, and L. Dong, “Special interaction betweenpoly (propylene carbonate) and corn starch,” Polymer Compos-ites, vol. 26, no. 1, pp. 37–41, 2005.
[65] B. W. Chieng, N. A. Ibrahim, Y. Y. Then, and Y. Y. Loo, “Epoxi-dized vegetable oils plasticized poly(lactic acid) biocomposites:mechanical, thermal and morphology properties,” Molecules,vol. 19, no. 10, pp. 16024–16038, 2014.
[66] K. M. Z. Hossain, I. Ahmed, A. J. Parsons et al., “Physico-chemical and mechanical properties of nanocomposites pre-pared using cellulose nanowhiskers and poly(lactic acid),”Journal of Materials Science, vol. 47, no. 6, pp. 2675–2686, 2012.
[67] D. Garlotta, W. Doane, R. Shogren, J. Lawton, and J. L. Willett,“Mechanical and thermal properties of starch-filled poly(D,L-lactic acid)/poly(hydroxy ester ether) biodegradable blends,”Journal of Applied Polymer Science, vol. 88, no. 7, pp. 1775–1786,2003.

Submit your manuscripts athttp://www.hindawi.com
ScientificaHindawi Publishing Corporationhttp://www.hindawi.com Volume 2014
CorrosionInternational Journal of
Hindawi Publishing Corporationhttp://www.hindawi.com Volume 2014
Polymer ScienceInternational Journal of
Hindawi Publishing Corporationhttp://www.hindawi.com Volume 2014
Hindawi Publishing Corporationhttp://www.hindawi.com Volume 2014
CeramicsJournal of
Hindawi Publishing Corporationhttp://www.hindawi.com Volume 2014
CompositesJournal of
NanoparticlesJournal of
Hindawi Publishing Corporationhttp://www.hindawi.com Volume 2014
Hindawi Publishing Corporationhttp://www.hindawi.com Volume 2014
International Journal of
Biomaterials
Hindawi Publishing Corporationhttp://www.hindawi.com Volume 2014
NanoscienceJournal of
TextilesHindawi Publishing Corporation http://www.hindawi.com Volume 2014
Journal of
NanotechnologyHindawi Publishing Corporationhttp://www.hindawi.com Volume 2014
Journal of
CrystallographyJournal of
Hindawi Publishing Corporationhttp://www.hindawi.com Volume 2014
The Scientific World JournalHindawi Publishing Corporation http://www.hindawi.com Volume 2014
Hindawi Publishing Corporationhttp://www.hindawi.com Volume 2014
CoatingsJournal of
Advances in
Materials Science and EngineeringHindawi Publishing Corporationhttp://www.hindawi.com Volume 2014
Smart Materials Research
Hindawi Publishing Corporationhttp://www.hindawi.com Volume 2014
Hindawi Publishing Corporationhttp://www.hindawi.com Volume 2014
MetallurgyJournal of
Hindawi Publishing Corporationhttp://www.hindawi.com Volume 2014
BioMed Research International
MaterialsJournal of
Hindawi Publishing Corporationhttp://www.hindawi.com Volume 2014
Nano
materials
Hindawi Publishing Corporationhttp://www.hindawi.com Volume 2014
Journal ofNanomaterials


![Research Article Analysis of Resonance Response ...downloads.hindawi.com/journals/tswj/2014/131374.pdfA planar monopulse array antenna for C-band is shownin[ ]. eantennahasahigharraygain.Nonetheless,](https://img.pdfslide.us/doc/110x75/60573fc8c0e1ea4ed50af52d/research-article-analysis-of-resonance-response-a-planar-monopulse-array-antenna.jpg)


![Brochure2 - MagicBricks€¦ · Location Map School B sc Delhi Pub licSçh001 To 20 min 13 12 min 10 min 08 m] n 02 Temple AFMC 20 min 12 min IS min 10 min min IS min min 07 min](https://img.pdfslide.us/doc/110x75/6034384eb5808f20db6ba851/brochure2-magicbricks-location-map-school-b-sc-delhi-pub-licsh001-to-20-min.jpg)