Embed Size (px)
Citation preview
Research ArticleReducing the Social Gradient in Uptake of the NHS ColorectalCancer Screening Programme Using a Narrative-BasedInformation Leaflet: A Cluster-Randomised Trial
Lesley M. McGregor,1 Christian von Wagner,1 Wendy Atkin,2 Ines Kralj-Hans,3
Stephen P. Halloran,4,5 Graham Handley,6 Richard F. Logan,7 Sandra Rainbow,8
Steve Smith,9 Julia Snowball,4 Mary C. Thomas,10 Samuel G. Smith,1,11 Gemma Vart,1
Rosemary Howe,2 Nicholas Counsell,12 Allan Hackshaw,12 Stephen Morris,10
Stephen W. Duffy,11 Rosalind Raine,10 and Jane Wardle1
1 Department of Epidemiology and Public Health, University College London, London WC1E 7HB, UK2 Department of Surgery & Cancer, Imperial College London, London SW7 2AZ, UK3 Department of Biostatistics, King’s Clinical Trials Unit, Institute of Psychiatry, Psychology and Neuroscience,King’s College London, London SE5 8AF, UK
4 NHS Bowel Cancer Screening Southern Programme Hub, Surrey Research Park, Guildford, Surrey GU2 7YS, UK5 Faculty of Health and Medical Sciences, University of Surrey, Guildford, Surrey GU2 7TE, UK6 NHS Bowel Cancer Screening North East Programme Hub, Gateshead Health NHS Foundation Trust,Queen Elizabeth Hospital, Gateshead NE9 6SX, UK
7 NHS Bowel Cancer Screening Eastern Programme Hub, Nottingham University Hospitals, Nottingham NG7 2UH, UK8 NHS Bowel Cancer Screening London Programme Hub, Northwick Park and St Mark’s Hospitals, Harrow, Middlesex HA1 3UJ, UK9 NHS Bowel Cancer Screening Midlands and North West Programme Hub, Hospital of St Cross, Barby Road, Rugby CV22 5PX, UK10Department of Applied Health Research, University College London, London WC1E 7HB, UK11Wolfson Institute of Preventive Medicine, Queen Mary University of London, London EC1M 6BQ, UK12Cancer Research UK & UCL Cancer Trials Centre, Cancer Institute, University College London, London W1T 4TJ, UK
Correspondence should be addressed to Christian von Wagner; [email protected]
Received 29 September 2015; Revised 24 November 2015; Accepted 9 December 2015
Academic Editor: Carlene Wilson
Copyright © 2016 Lesley M. McGregor et al. This is an open access article distributed under the Creative Commons AttributionLicense, which permits unrestricted use, distribution, and reproduction in any medium, provided the original work is properlycited.
Objective. To test the effectiveness of adding a narrative leaflet to the current information material delivered by the NHS Englishcolorectal cancer (CRC) screening programme on reducing socioeconomic inequalities in uptake. Participants. 150,417 adults (59–74 years) routinely invited to complete the guaiac Faecal Occult Blood test (gFOBt) in March 2013. Design. A cluster randomisedcontrolled trial (ISRCTN74121020) to compare uptake between two arms. The control arm received the standard NHS CRCscreening information material (SI) and the intervention arm received the standard information plus a supplementary narrativeleaflet, which had previously been shown to increase screening intentions (SI + N). Between group comparisons were made foruptake overall and across socioeconomic status (SES). Results. Uptake was 57.7% and did not differ significantly between the twotrial arms (SI: 58.5%; SI + N: 56.7%; odds ratio = 0.93; 95% confidence interval: 0.81–1.06; 𝑝 = 0.27). There was no interactionbetween group and SES quintile (𝑝 = 0.44). Conclusions. Adding a narrative leaflet to existing information materials does notreduce the SES gradient in uptake. Despite the benefits of using a pragmatic trial design, the need to add to, rather than replace,existing information may have limited the true value of an evidence-based intervention on behaviour.
We dedicate this paper in memory of Professor Jane Wardle (1950–2015)
Hindawi Publishing CorporationGastroenterology Research and PracticeVolume 2016, Article ID 3670150, 10 pageshttp://dx.doi.org/10.1155/2016/3670150
2 Gastroenterology Research and Practice
1. Introduction
The English Bowel (colorectal cancer, CRC) Screening Pro-gramme involves sending a guaiac Faecal Occult Blood test(gFOBt) to the homes of men and women aged 60–74 everytwo years. It is now widely accepted that gFOBt screeningreduces cancer-specific mortality [1–3], but uptake of only54% greatly undermines the potential public health benefitsof the programme [4]. Importantly, there are also inequalitiesin screening uptake by socioeconomic status (SES) which arelikely to exacerbate existing inequalities in CRC outcomes.
Recently, there has been interest in the extent to whichsocioeconomic inequalities are modified or maintained bythe information sent with invitation materials. Health com-munication is often didactic (factsheets, charts, etc.), target-ing a more “rational” thinking process. However, this presen-tation may contradict preexisting beliefs and behaviours andsubsequently elicit defensive processing, such as counterar-guing or disengagement, allowing the individual to preservetheir positive self-image, while undermining the effectivenessof the health message [5, 6].
Narrative information is thought to target amore “heuris-tic/affective” thinking process and, therefore, may be consid-ered a less direct confrontation of a person’s health beliefs,thereby reducing initial defensive processing [7, 8]. By addi-tionally promoting mental imagery and providing role mod-els of desired behaviours, narratives are thought to be moreengaging [7, 9].
In a recent qualitative study exploring people’s responsesto narrative information about colorectal cancer screeninginformation, respondents described narrative information ashelpful, making the information more vivid, relevant, andsubsequently reassuring [10]. Several US-based studies havefound narrative information to be associated with strongerintention to take part in cancer screening than nonnarrativeinformation (e.g., [11, 12]), and there is some evidence ofhigher uptake of cancer screening tests, particularly amongmore socioeconomically deprived and ethnically diversegroups [13, 14]. However, there is currently no researchwithinthe UKCRC screening programme exploring the potential ofnarrative information on reducing the socioeconomic gradi-ent in uptake of the English CRC screening programme.
We developed a narrative leaflet, containing quotes andstories of theCRC screening experience fromprevious partic-ipants, as part of a wider project to test four separate, theoret-ically driven interventions to reduce socioeconomic inequal-ities in CRC screening uptake [15]. The other interventionsincluded a “gist” based leaflet, which simplified the informa-tion contained in the standard informationmaterials in a for-mat suitable for thosewith low literacy skills; both the gist andnarrative leaflets were designed as a supplement to the stan-dard information provided to patients. In addition, amend-ments to the standard information materials were made fortwo further interventions: a GP endorsed invitation letter[16] and an enhanced reminder letter. The impact of each ofthe four interventions on CRC screening uptake overall andacross socioeconomic status (SES) groups is published else-where [15]. In this paper we describe inmore detail the resultsof the narrative leaflet specifically, considering its influence
on uptake by various population characteristics (e.g., age,gender) and if this changes across SES.
In the initial evaluation of the leaflet, we conducted aquestionnaire study with over 1200 individuals approachingthe age of screening and observed that adding the narrativeleaflet to standard screening information enhanced intentionto screen, particularly by strengthening anticipated peaceof mind from screening, enhancing feelings of vulnerabilityto colorectal cancer without screening, reducing perceiveddisgust with the screening procedure, and strengthening thebelief that screening can reduce the chance of dying fromthe disease [17]. Here, we report the results of a nationalrandomised controlled trial to test the effectiveness of thissupplementary narrative leaflet on reducing socioeconomicinequalities in uptake of the CRC screening programme.
2. Methods
A two-arm cluster randomised controlled trial(ISRCTN74121020) based on the day of the week thatmaterials were mailed compared uptake between those whowere sent the standard NHS CRC screening informationmaterial (SI) and those who were sent the standard materialplus the narrative-based information leaflet (SI + N). Ethicalapproval for this study was awarded by the National ResearchEthics Service Committee London-Harrow in September2012 (REC ref: 12/LO/1396) and an Independent DataMonitoring & Ethics Committee (IDMEC) monitored theprogress of the trial.
2.1. Settings and Participants. In England, the CRC screeningprogramme invites men and women who are registered witha GP to complete a gFOBt every two years from the age of60 (up to 74 years). The programme is coordinated through5 hubs (Midlands and NorthWest, Southern, London, NorthEast, and Eastern), where each mails screening invitations toapproximately 60,000 eligible people per month (prevalentand incident screening rounds combined; “prevalent” relatesto individuals who are being invited for the first time or havenot accepted previous invitations to take part in the CRCscreening programme and “incident” relates to individualswho have participated in screening at least once before).The invitation letter is mailed with an information booklet(“Bowel Cancer Screening: the Facts”; online version isavailable at http://www.cancerscreening.nhs.uk/bowel/pub-lications/information-leaflets.html) (standard informationSI). The gFOBt test kit and instruction leaflet is mailed 8–10days later (see Figure 1).
Completing the gFOBt involves taking two small samplesfrom three separate bowel motions over a 10-day period.The CRC screening programme in England does not imposeany dietary restrictions for completion of the test [18]. Thesamples are collected using provided cardboard sticks andapplied to a specific section of guaiac paper on the test kit.Thetest kit is then mailed in a hygienic, prepaid envelope back tothe hub for processing. Within 2 weeks, result letters are sentby the hub to the individual and their General Practitioner(GP). For those with a “normal” result, no further action istaken and they are invited to participate again 2 years later. If
Gastroenterology Research and Practice 3
18 w
eeks
Invitation letter
Kit letter
Reminder letter (if necessary)
Intervention groupgiven narrative
Screening episodeclosed
(beginning of trial)
Data extracted fromBowel Cancer
Screening System
leaflet
March 4–10, 2013
July 8–14, 2013
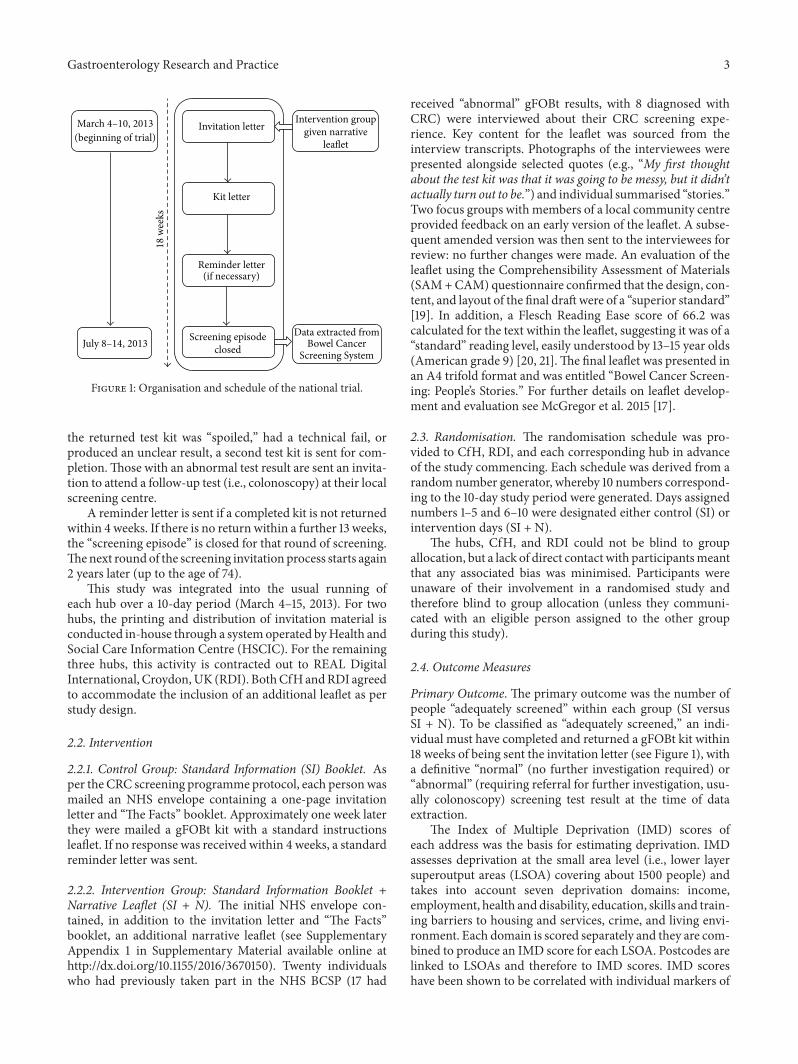
Figure 1: Organisation and schedule of the national trial.
the returned test kit was “spoiled,” had a technical fail, orproduced an unclear result, a second test kit is sent for com-pletion.Those with an abnormal test result are sent an invita-tion to attend a follow-up test (i.e., colonoscopy) at their localscreening centre.
A reminder letter is sent if a completed kit is not returnedwithin 4 weeks. If there is no return within a further 13 weeks,the “screening episode” is closed for that round of screening.Thenext roundof the screening invitation process starts again2 years later (up to the age of 74).
This study was integrated into the usual running ofeach hub over a 10-day period (March 4–15, 2013). For twohubs, the printing and distribution of invitation material isconducted in-house through a systemoperated byHealth andSocial Care Information Centre (HSCIC). For the remainingthree hubs, this activity is contracted out to REAL DigitalInternational, Croydon,UK (RDI). BothCfHandRDI agreedto accommodate the inclusion of an additional leaflet as perstudy design.
2.2. Intervention
2.2.1. Control Group: Standard Information (SI) Booklet. Asper the CRC screening programme protocol, each personwasmailed an NHS envelope containing a one-page invitationletter and “The Facts” booklet. Approximately one week laterthey were mailed a gFOBt kit with a standard instructionsleaflet. If no response was received within 4 weeks, a standardreminder letter was sent.
2.2.2. Intervention Group: Standard Information Booklet +Narrative Leaflet (SI + N). The initial NHS envelope con-tained, in addition to the invitation letter and “The Facts”booklet, an additional narrative leaflet (see SupplementaryAppendix 1 in Supplementary Material available online athttp://dx.doi.org/10.1155/2016/3670150). Twenty individualswho had previously taken part in the NHS BCSP (17 had
received “abnormal” gFOBt results, with 8 diagnosed withCRC) were interviewed about their CRC screening expe-rience. Key content for the leaflet was sourced from theinterview transcripts. Photographs of the interviewees werepresented alongside selected quotes (e.g., “My first thoughtabout the test kit was that it was going to be messy, but it didn’tactually turn out to be.”) and individual summarised “stories.”Two focus groups with members of a local community centreprovided feedback on an early version of the leaflet. A subse-quent amended version was then sent to the interviewees forreview: no further changes were made. An evaluation of theleaflet using the Comprehensibility Assessment of Materials(SAM+CAM) questionnaire confirmed that the design, con-tent, and layout of the final draftwere of a “superior standard”[19]. In addition, a Flesch Reading Ease score of 66.2 wascalculated for the text within the leaflet, suggesting it was of a“standard” reading level, easily understood by 13–15 year olds(American grade 9) [20, 21].The final leaflet was presented inan A4 trifold format and was entitled “Bowel Cancer Screen-ing: People’s Stories.” For further details on leaflet develop-ment and evaluation see McGregor et al. 2015 [17].
2.3. Randomisation. The randomisation schedule was pro-vided to CfH, RDI, and each corresponding hub in advanceof the study commencing. Each schedule was derived from arandom number generator, whereby 10 numbers correspond-ing to the 10-day study period were generated. Days assignednumbers 1–5 and 6–10 were designated either control (SI) orintervention days (SI + N).
The hubs, CfH, and RDI could not be blind to groupallocation, but a lack of direct contact with participantsmeantthat any associated bias was minimised. Participants wereunaware of their involvement in a randomised study andtherefore blind to group allocation (unless they communi-cated with an eligible person assigned to the other groupduring this study).
2.4. Outcome Measures
Primary Outcome. The primary outcome was the number ofpeople “adequately screened” within each group (SI versusSI + N). To be classified as “adequately screened,” an indi-vidual must have completed and returned a gFOBt kit within18 weeks of being sent the invitation letter (see Figure 1), witha definitive “normal” (no further investigation required) or“abnormal” (requiring referral for further investigation, usu-ally colonoscopy) screening test result at the time of dataextraction.
The Index of Multiple Deprivation (IMD) scores ofeach address was the basis for estimating deprivation. IMDassesses deprivation at the small area level (i.e., lower layersuperoutput areas (LSOA) covering about 1500 people) andtakes into account seven deprivation domains: income,employment, health and disability, education, skills and train-ing barriers to housing and services, crime, and living envi-ronment. Each domain is scored separately and they are com-bined to produce an IMD score for each LSOA. Postcodes arelinked to LSOAs and therefore to IMD scores. IMD scoreshave been shown to be correlated with individual markers of
4 Gastroenterology Research and Practice
SES [22]. Within this study, national data for IMD quintileswere applied to the obtained scores, with postcodes falling inthe first quintile denoting themost socially advantaged group(higher SES) and those in the fifth quintile the most sociallydisadvantaged group (lower SES).
The effect of screening round was investigated withindividuals classified as either prevalent first time invitees,prevalent previous nonresponders, or incident episodes (par-ticipated at least once previously). Age, gender, and hub wereadditionally considered potential moderators. An additionaloutcome was the time taken to return a completed gFOBt kit.
2.5. Statistical Considerations. The target sample size wasbased on achieving a reduction in the SES gradient associatedwith screening uptake. We assumed a fixed proportionaleffect in each hub and estimated an average increase of 3 per-centage points, based on increasing uptake by 5 percentagepoints in the lowest (fifth) IMD quintile (most socially disad-vantaged group) and 1 percentage point in the highest (first)quintile, giving an overall 1-2-3-4-5 percentage point differ-ence by quintile using themethod of Brentnall and colleagues[23]. This estimate was drawn from the outcomes that wereconsidered feasible in research aiming to increase screeninguptake [24].
The final calculation assumed the composition of the hubthat required the largest sample (North West) to ensure asufficiently large number of people. Because the study ran-domised by day and there is variation in the number of invita-tions sent per day, an inflation factor of 1.7 was included.With90% power and 5% statistical significance, 46,000 individuals(23,000 per arm) were required to detect a 1-2-3-4-5 percent-age point difference in uptake in the least to most deprivedIMD quintile, respectively. Due to the volume of invitationssent out by each hub during aworkingweek (70,000–80,000),this sample would have been achieved within only 5 days,but such small number of clusters would have a high risk ofbias. The intervention therefore ran for 10 days, providing asample of approximately 140,000–160,000, to achieve enoughclusters to avoid bias [25].
The primary outcome was analysed by logistic regressionin a univariablemodel and then amultivariablemodel adjust-ing for age, gender, hub and screening round. 𝑝 values and95% confidence intervals calculated using conservative vari-ance estimation to allow for the potential clustering effects inrandomisation [26]. The association between the proportionof people adequately screened and SES was assessed byincluding an interaction term between trial arm and IMDquintile in models. The association was also investigated bystratifying according to age, gender, screening round, andhub. Analysis was performed on an intention-to-treat basis,using SAS v9.3 (SAS Institute Inc., Cary, NC, USA) and Statav12.1 (StataCorp LP, College Station, TX, USA).
HSCIC organised for the relevant pseudoanonymiseddata to be extracted from the Bowel Cancer Screening Systemand transferred to one coordinating hub (Southern). At thishub, the data were cleaned and further anonymised beforebeing securely transferred to the research team for analysis.
SI: standard information
Allocated to SI group
Randomised
Adequately screened Adequately screened
Missing IMD data (n = 272)(n = 73,722)
(n = 41,822)(n = 44,904)
(n = 150,417)
Missing IMD data (n = 274)(n = 76,695)
SI+N: standard information plus narrative leaflet
Allocated to SI+N
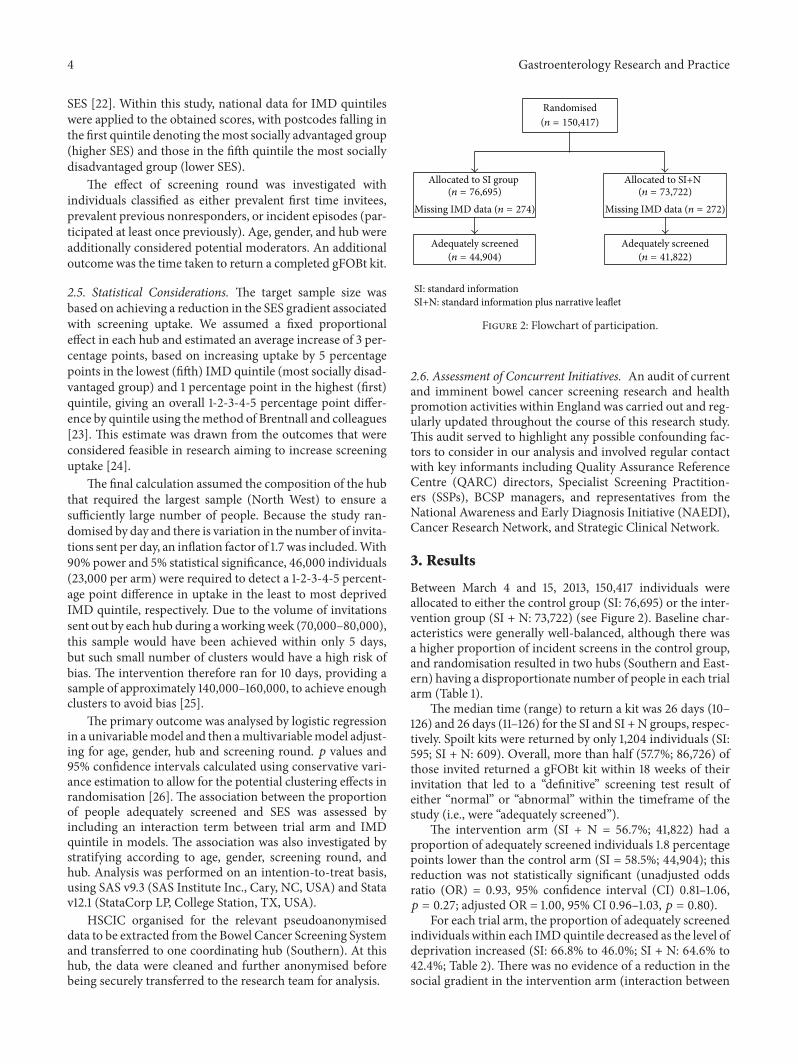
Figure 2: Flowchart of participation.
2.6. Assessment of Concurrent Initiatives. An audit of currentand imminent bowel cancer screening research and healthpromotion activities within England was carried out and reg-ularly updated throughout the course of this research study.This audit served to highlight any possible confounding fac-tors to consider in our analysis and involved regular contactwith key informants including Quality Assurance ReferenceCentre (QARC) directors, Specialist Screening Practition-ers (SSPs), BCSP managers, and representatives from theNational Awareness and Early Diagnosis Initiative (NAEDI),Cancer Research Network, and Strategic Clinical Network.
3. Results
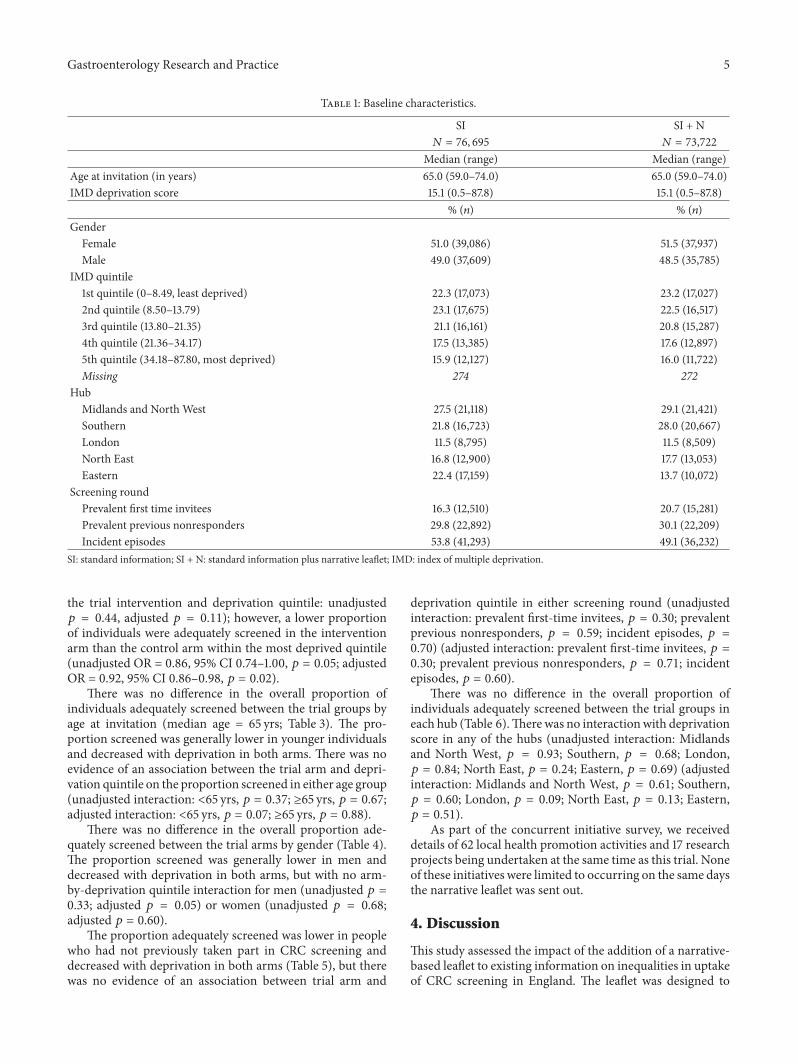
Between March 4 and 15, 2013, 150,417 individuals wereallocated to either the control group (SI: 76,695) or the inter-vention group (SI + N: 73,722) (see Figure 2). Baseline char-acteristics were generally well-balanced, although there wasa higher proportion of incident screens in the control group,and randomisation resulted in two hubs (Southern and East-ern) having a disproportionate number of people in each trialarm (Table 1).
The median time (range) to return a kit was 26 days (10–126) and 26 days (11–126) for the SI and SI +N groups, respec-tively. Spoilt kits were returned by only 1,204 individuals (SI:595; SI + N: 609). Overall, more than half (57.7%; 86,726) ofthose invited returned a gFOBt kit within 18 weeks of theirinvitation that led to a “definitive” screening test result ofeither “normal” or “abnormal” within the timeframe of thestudy (i.e., were “adequately screened”).
The intervention arm (SI + N = 56.7%; 41,822) had aproportion of adequately screened individuals 1.8 percentagepoints lower than the control arm (SI = 58.5%; 44,904); thisreduction was not statistically significant (unadjusted oddsratio (OR) = 0.93, 95% confidence interval (CI) 0.81–1.06,𝑝 = 0.27; adjusted OR = 1.00, 95% CI 0.96–1.03, 𝑝 = 0.80).
For each trial arm, the proportion of adequately screenedindividuals within each IMDquintile decreased as the level ofdeprivation increased (SI: 66.8% to 46.0%; SI + N: 64.6% to42.4%; Table 2). There was no evidence of a reduction in thesocial gradient in the intervention arm (interaction between
Gastroenterology Research and Practice 5
Table 1: Baseline characteristics.
SI SI + N𝑁 = 76, 695 𝑁 = 73,722
Median (range) Median (range)Age at invitation (in years) 65.0 (59.0–74.0) 65.0 (59.0–74.0)IMD deprivation score 15.1 (0.5–87.8) 15.1 (0.5–87.8)
% (𝑛) % (𝑛)Gender
Female 51.0 (39,086) 51.5 (37,937)Male 49.0 (37,609) 48.5 (35,785)
IMD quintile1st quintile (0–8.49, least deprived) 22.3 (17,073) 23.2 (17,027)2nd quintile (8.50–13.79) 23.1 (17,675) 22.5 (16,517)3rd quintile (13.80–21.35) 21.1 (16,161) 20.8 (15,287)4th quintile (21.36–34.17) 17.5 (13,385) 17.6 (12,897)5th quintile (34.18–87.80, most deprived) 15.9 (12,127) 16.0 (11,722)Missing 274 272
HubMidlands and North West 27.5 (21,118) 29.1 (21,421)Southern 21.8 (16,723) 28.0 (20,667)London 11.5 (8,795) 11.5 (8,509)North East 16.8 (12,900) 17.7 (13,053)Eastern 22.4 (17,159) 13.7 (10,072)
Screening roundPrevalent first time invitees 16.3 (12,510) 20.7 (15,281)Prevalent previous nonresponders 29.8 (22,892) 30.1 (22,209)Incident episodes 53.8 (41,293) 49.1 (36,232)
SI: standard information; SI + N: standard information plus narrative leaflet; IMD: index of multiple deprivation.
the trial intervention and deprivation quintile: unadjusted𝑝 = 0.44, adjusted 𝑝 = 0.11); however, a lower proportionof individuals were adequately screened in the interventionarm than the control arm within the most deprived quintile(unadjusted OR = 0.86, 95% CI 0.74–1.00, 𝑝 = 0.05; adjustedOR = 0.92, 95% CI 0.86–0.98, 𝑝 = 0.02).
There was no difference in the overall proportion ofindividuals adequately screened between the trial groups byage at invitation (median age = 65 yrs; Table 3). The pro-portion screened was generally lower in younger individualsand decreased with deprivation in both arms. There was noevidence of an association between the trial arm and depri-vation quintile on the proportion screened in either age group(unadjusted interaction: <65 yrs, 𝑝 = 0.37; ≥65 yrs, 𝑝 = 0.67;adjusted interaction: <65 yrs, 𝑝 = 0.07; ≥65 yrs, 𝑝 = 0.88).
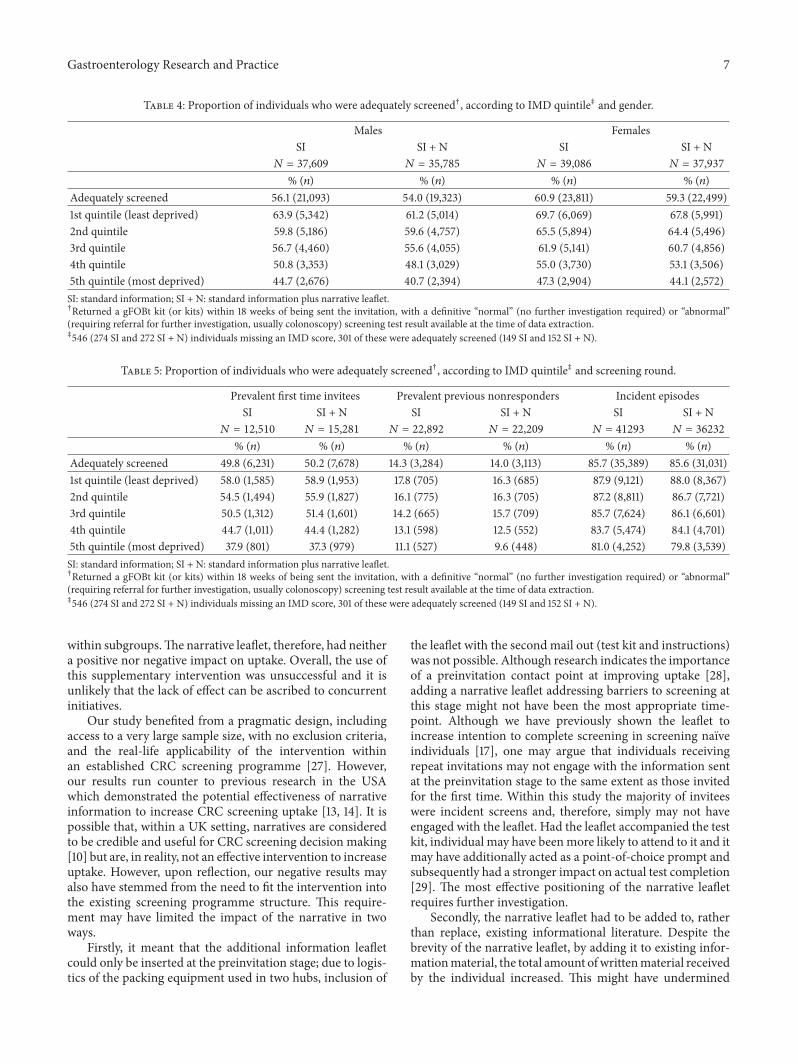
There was no difference in the overall proportion ade-quately screened between the trial arms by gender (Table 4).The proportion screened was generally lower in men anddecreased with deprivation in both arms, but with no arm-by-deprivation quintile interaction for men (unadjusted 𝑝 =0.33; adjusted 𝑝 = 0.05) or women (unadjusted 𝑝 = 0.68;adjusted 𝑝 = 0.60).
The proportion adequately screened was lower in peoplewho had not previously taken part in CRC screening anddecreased with deprivation in both arms (Table 5), but therewas no evidence of an association between trial arm and
deprivation quintile in either screening round (unadjustedinteraction: prevalent first-time invitees, 𝑝 = 0.30; prevalentprevious nonresponders, 𝑝 = 0.59; incident episodes, 𝑝 =0.70) (adjusted interaction: prevalent first-time invitees, 𝑝 =0.30; prevalent previous nonresponders, 𝑝 = 0.71; incidentepisodes, 𝑝 = 0.60).
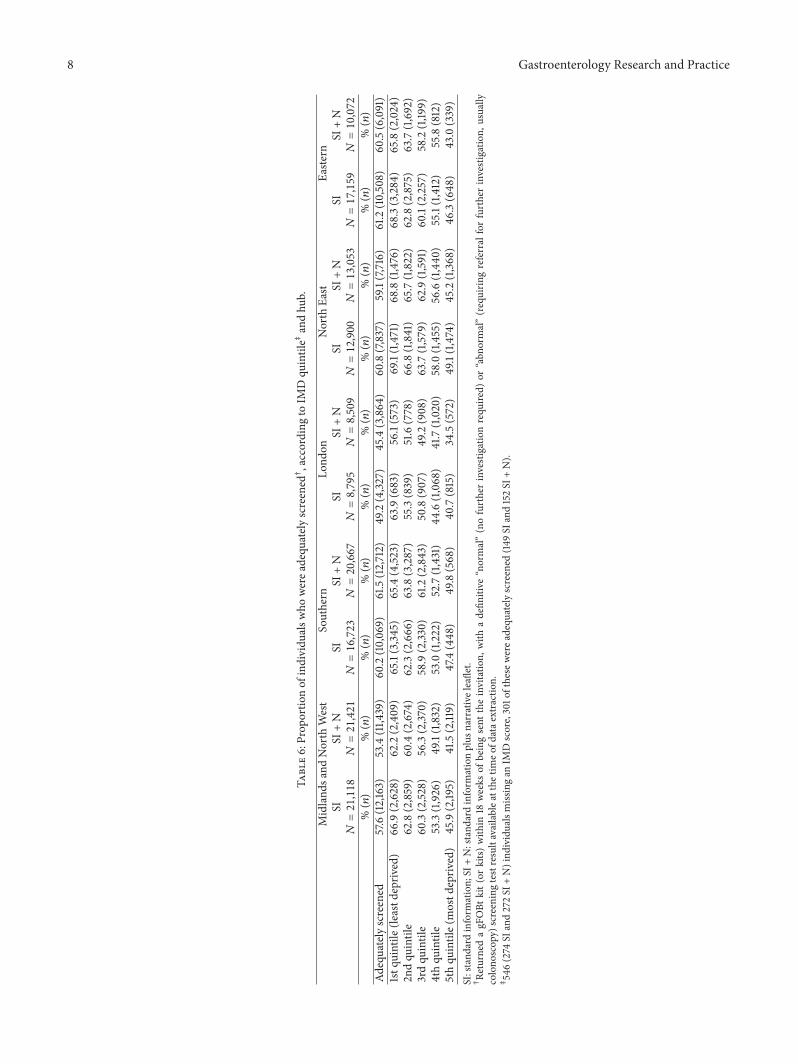
There was no difference in the overall proportion ofindividuals adequately screened between the trial groups ineach hub (Table 6).Therewas no interactionwith deprivationscore in any of the hubs (unadjusted interaction: Midlandsand North West, 𝑝 = 0.93; Southern, 𝑝 = 0.68; London,𝑝 = 0.84; North East, 𝑝 = 0.24; Eastern, 𝑝 = 0.69) (adjustedinteraction: Midlands and North West, 𝑝 = 0.61; Southern,𝑝 = 0.60; London, 𝑝 = 0.09; North East, 𝑝 = 0.13; Eastern,𝑝 = 0.51).
As part of the concurrent initiative survey, we receiveddetails of 62 local health promotion activities and 17 researchprojects being undertaken at the same time as this trial. Noneof these initiatives were limited to occurring on the same daysthe narrative leaflet was sent out.
4. Discussion
This study assessed the impact of the addition of a narrative-based leaflet to existing information on inequalities in uptakeof CRC screening in England. The leaflet was designed to
6 Gastroenterology Research and Practice
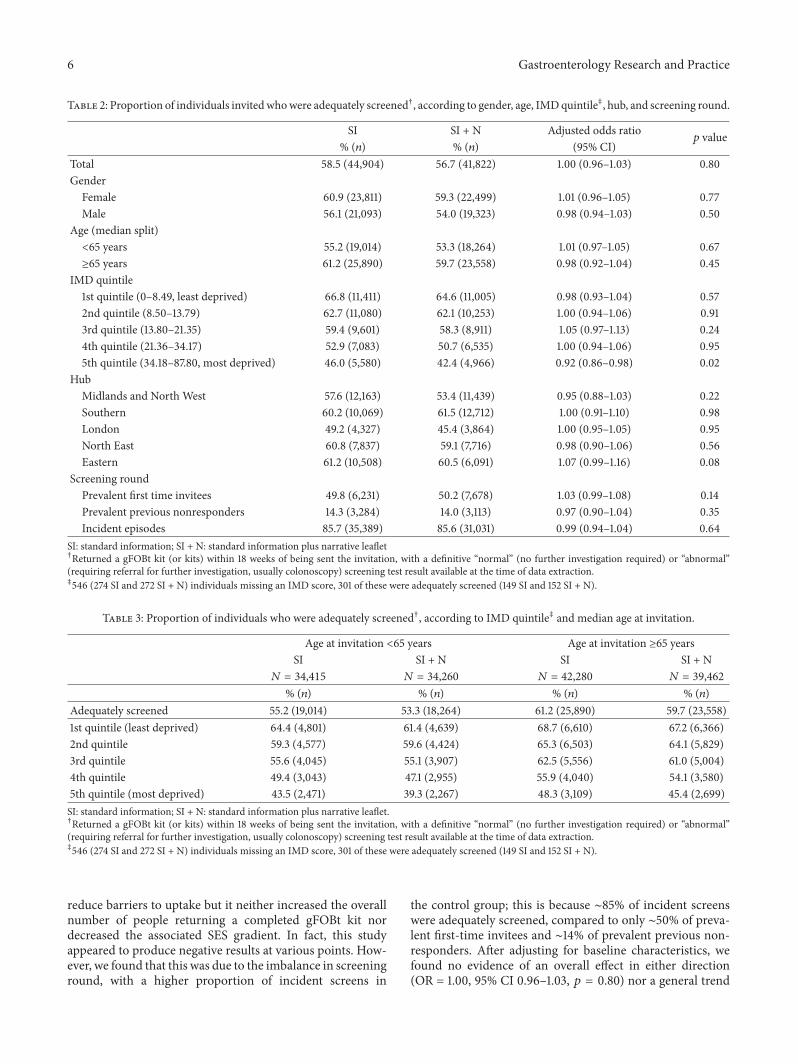
Table 2: Proportion of individuals invitedwhowere adequately screened†, according to gender, age, IMDquintile‡, hub, and screening round.
SI SI + N Adjusted odds ratio𝑝 value
% (𝑛) % (𝑛) (95% CI)Total 58.5 (44,904) 56.7 (41,822) 1.00 (0.96–1.03) 0.80Gender
Female 60.9 (23,811) 59.3 (22,499) 1.01 (0.96–1.05) 0.77Male 56.1 (21,093) 54.0 (19,323) 0.98 (0.94–1.03) 0.50
Age (median split)<65 years 55.2 (19,014) 53.3 (18,264) 1.01 (0.97–1.05) 0.67≥65 years 61.2 (25,890) 59.7 (23,558) 0.98 (0.92–1.04) 0.45
IMD quintile1st quintile (0–8.49, least deprived) 66.8 (11,411) 64.6 (11,005) 0.98 (0.93–1.04) 0.572nd quintile (8.50–13.79) 62.7 (11,080) 62.1 (10,253) 1.00 (0.94–1.06) 0.913rd quintile (13.80–21.35) 59.4 (9,601) 58.3 (8,911) 1.05 (0.97–1.13) 0.244th quintile (21.36–34.17) 52.9 (7,083) 50.7 (6,535) 1.00 (0.94–1.06) 0.955th quintile (34.18–87.80, most deprived) 46.0 (5,580) 42.4 (4,966) 0.92 (0.86–0.98) 0.02
HubMidlands and North West 57.6 (12,163) 53.4 (11,439) 0.95 (0.88–1.03) 0.22Southern 60.2 (10,069) 61.5 (12,712) 1.00 (0.91–1.10) 0.98London 49.2 (4,327) 45.4 (3,864) 1.00 (0.95–1.05) 0.95North East 60.8 (7,837) 59.1 (7,716) 0.98 (0.90–1.06) 0.56Eastern 61.2 (10,508) 60.5 (6,091) 1.07 (0.99–1.16) 0.08
Screening roundPrevalent first time invitees 49.8 (6,231) 50.2 (7,678) 1.03 (0.99–1.08) 0.14Prevalent previous nonresponders 14.3 (3,284) 14.0 (3,113) 0.97 (0.90–1.04) 0.35Incident episodes 85.7 (35,389) 85.6 (31,031) 0.99 (0.94–1.04) 0.64
SI: standard information; SI + N: standard information plus narrative leaflet†Returned a gFOBt kit (or kits) within 18 weeks of being sent the invitation, with a definitive “normal” (no further investigation required) or “abnormal”(requiring referral for further investigation, usually colonoscopy) screening test result available at the time of data extraction.‡546 (274 SI and 272 SI + N) individuals missing an IMD score, 301 of these were adequately screened (149 SI and 152 SI + N).
Table 3: Proportion of individuals who were adequately screened†, according to IMD quintile‡ and median age at invitation.
Age at invitation <65 years Age at invitation ≥65 yearsSI SI + N SI SI + N
𝑁 = 34,415 𝑁 = 34,260 𝑁 = 42,280 𝑁 = 39,462% (𝑛) % (𝑛) % (𝑛) % (𝑛)
Adequately screened 55.2 (19,014) 53.3 (18,264) 61.2 (25,890) 59.7 (23,558)1st quintile (least deprived) 64.4 (4,801) 61.4 (4,639) 68.7 (6,610) 67.2 (6,366)2nd quintile 59.3 (4,577) 59.6 (4,424) 65.3 (6,503) 64.1 (5,829)3rd quintile 55.6 (4,045) 55.1 (3,907) 62.5 (5,556) 61.0 (5,004)4th quintile 49.4 (3,043) 47.1 (2,955) 55.9 (4,040) 54.1 (3,580)5th quintile (most deprived) 43.5 (2,471) 39.3 (2,267) 48.3 (3,109) 45.4 (2,699)SI: standard information; SI + N: standard information plus narrative leaflet.†Returned a gFOBt kit (or kits) within 18 weeks of being sent the invitation, with a definitive “normal” (no further investigation required) or “abnormal”(requiring referral for further investigation, usually colonoscopy) screening test result available at the time of data extraction.‡546 (274 SI and 272 SI + N) individuals missing an IMD score, 301 of these were adequately screened (149 SI and 152 SI + N).
reduce barriers to uptake but it neither increased the overallnumber of people returning a completed gFOBt kit nordecreased the associated SES gradient. In fact, this studyappeared to produce negative results at various points. How-ever, we found that this was due to the imbalance in screeninground, with a higher proportion of incident screens in
the control group; this is because ∼85% of incident screenswere adequately screened, compared to only ∼50% of preva-lent first-time invitees and ∼14% of prevalent previous non-responders. After adjusting for baseline characteristics, wefound no evidence of an overall effect in either direction(OR = 1.00, 95% CI 0.96–1.03, 𝑝 = 0.80) nor a general trend
Gastroenterology Research and Practice 7
Table 4: Proportion of individuals who were adequately screened†, according to IMD quintile‡ and gender.
Males FemalesSI SI + N SI SI + N
𝑁 = 37,609 𝑁 = 35,785 𝑁 = 39,086 𝑁 = 37,937% (𝑛) % (𝑛) % (𝑛) % (𝑛)
Adequately screened 56.1 (21,093) 54.0 (19,323) 60.9 (23,811) 59.3 (22,499)1st quintile (least deprived) 63.9 (5,342) 61.2 (5,014) 69.7 (6,069) 67.8 (5,991)2nd quintile 59.8 (5,186) 59.6 (4,757) 65.5 (5,894) 64.4 (5,496)3rd quintile 56.7 (4,460) 55.6 (4,055) 61.9 (5,141) 60.7 (4,856)4th quintile 50.8 (3,353) 48.1 (3,029) 55.0 (3,730) 53.1 (3,506)5th quintile (most deprived) 44.7 (2,676) 40.7 (2,394) 47.3 (2,904) 44.1 (2,572)SI: standard information; SI + N: standard information plus narrative leaflet.†Returned a gFOBt kit (or kits) within 18 weeks of being sent the invitation, with a definitive “normal” (no further investigation required) or “abnormal”(requiring referral for further investigation, usually colonoscopy) screening test result available at the time of data extraction.‡546 (274 SI and 272 SI + N) individuals missing an IMD score, 301 of these were adequately screened (149 SI and 152 SI + N).
Table 5: Proportion of individuals who were adequately screened†, according to IMD quintile‡ and screening round.
Prevalent first time invitees Prevalent previous nonresponders Incident episodesSI SI + N SI SI + N SI SI + N
𝑁 = 12,510 𝑁 = 15,281 𝑁 = 22,892 𝑁 = 22,209 𝑁 = 41293 𝑁 = 36232
% (𝑛) % (𝑛) % (𝑛) % (𝑛) % (𝑛) % (𝑛)Adequately screened 49.8 (6,231) 50.2 (7,678) 14.3 (3,284) 14.0 (3,113) 85.7 (35,389) 85.6 (31,031)1st quintile (least deprived) 58.0 (1,585) 58.9 (1,953) 17.8 (705) 16.3 (685) 87.9 (9,121) 88.0 (8,367)2nd quintile 54.5 (1,494) 55.9 (1,827) 16.1 (775) 16.3 (705) 87.2 (8,811) 86.7 (7,721)3rd quintile 50.5 (1,312) 51.4 (1,601) 14.2 (665) 15.7 (709) 85.7 (7,624) 86.1 (6,601)4th quintile 44.7 (1,011) 44.4 (1,282) 13.1 (598) 12.5 (552) 83.7 (5,474) 84.1 (4,701)5th quintile (most deprived) 37.9 (801) 37.3 (979) 11.1 (527) 9.6 (448) 81.0 (4,252) 79.8 (3,539)SI: standard information; SI + N: standard information plus narrative leaflet.†Returned a gFOBt kit (or kits) within 18 weeks of being sent the invitation, with a definitive “normal” (no further investigation required) or “abnormal”(requiring referral for further investigation, usually colonoscopy) screening test result available at the time of data extraction.‡546 (274 SI and 272 SI + N) individuals missing an IMD score, 301 of these were adequately screened (149 SI and 152 SI + N).
within subgroups.The narrative leaflet, therefore, had neithera positive nor negative impact on uptake. Overall, the use ofthis supplementary intervention was unsuccessful and it isunlikely that the lack of effect can be ascribed to concurrentinitiatives.
Our study benefited from a pragmatic design, includingaccess to a very large sample size, with no exclusion criteria,and the real-life applicability of the intervention withinan established CRC screening programme [27]. However,our results run counter to previous research in the USAwhich demonstrated the potential effectiveness of narrativeinformation to increase CRC screening uptake [13, 14]. It ispossible that, within a UK setting, narratives are consideredto be credible and useful for CRC screening decision making[10] but are, in reality, not an effective intervention to increaseuptake. However, upon reflection, our negative results mayalso have stemmed from the need to fit the intervention intothe existing screening programme structure. This require-ment may have limited the impact of the narrative in twoways.
Firstly, it meant that the additional information leafletcould only be inserted at the preinvitation stage; due to logis-tics of the packing equipment used in two hubs, inclusion of
the leaflet with the second mail out (test kit and instructions)was not possible. Although research indicates the importanceof a preinvitation contact point at improving uptake [28],adding a narrative leaflet addressing barriers to screening atthis stage might not have been the most appropriate time-point. Although we have previously shown the leaflet toincrease intention to complete screening in screening naıveindividuals [17], one may argue that individuals receivingrepeat invitations may not engage with the information sentat the preinvitation stage to the same extent as those invitedfor the first time. Within this study the majority of inviteeswere incident screens and, therefore, simply may not haveengaged with the leaflet. Had the leaflet accompanied the testkit, individual may have beenmore likely to attend to it and itmay have additionally acted as a point-of-choice prompt andsubsequently had a stronger impact on actual test completion[29]. The most effective positioning of the narrative leafletrequires further investigation.
Secondly, the narrative leaflet had to be added to, ratherthan replace, existing informational literature. Despite thebrevity of the narrative leaflet, by adding it to existing infor-mationmaterial, the total amount ofwrittenmaterial receivedby the individual increased. This might have undermined
8 Gastroenterology Research and Practice
Table6:Prop
ortio
nof
individu
alsw
howerea
dequ
ately
screened†,according
toIM
Dqu
intile‡
andhu
b.
Midland
sand
North
West
Southern
Lond
onNorth
East
Easte
rnSI
SI+N
SISI
+N
SISI
+N
SISI
+N
SISI
+N
𝑁=21,118𝑁=21,421𝑁=16,723𝑁=20,667𝑁=8,795𝑁=8,509𝑁=12,900𝑁=13,053𝑁=17,159𝑁=10,072
%(𝑛)
%(𝑛)
%(𝑛)
%(𝑛)
%(𝑛)
%(𝑛)
%(𝑛)
%(𝑛)
%(𝑛)
%(𝑛)
Adequatelyscreened
57.6(12,163)
53.4(11,4
39)
60.2(10,069)
61.5(12,712)
49.2(4,32
7)45.4(3,864
)60.8(7,837)
59.1(7,716)
61.2(10,508)
60.5(6,091)
1stq
uintile
(leastd
epriv
ed)
66.9(2,628)
62.2(2,409)
65.1(3,345)
65.4(4,52
3)63.9(683)
56.1(573)
69.1(1,471)
68.8(1,476)
68.3(3,284)
65.8(2,024)
2ndqu
intile
62.8(2,859)
60.4(2,674)
62.3(2,666)
63.8(3,287)
55.3(839)
51.6(778)
66.8(1,841)
65.7(1,822)
62.8(2,875)
63.7(1,692)
3rdqu
intile
60.3(2,52
8)56.3(2,37
0)58.9(2,33
0)61.2(2,843)
50.8(907)
49.2(908)
63.7(1,579)
62.9(1,591)
60.1(2,257)
58.2(1,19
9)4thqu
intile
53.3(1,926)
49.1(1,832)
53.0(1,222)
52.7(1,431)
44.6(1,068)
41.7(1,020)
58.0(1,455)
56.6(1,440
)55.1(1,412)
55.8(812)
5thqu
intile(mostd
epriv
ed)
45.9(2,19
5)41.5(2,119)
47.4(448)
49.8(568)
40.7(815)
34.5(572)
49.1(1,474)
45.2(1,368)
46.3(648)
43.0(339)
SI:stand
ardinform
ation;
SI+N:stand
ardinform
ationplus
narrativeleaflet.
†Re
turned
agFOBt
kit(or
kits)
with
in18
weeks
ofbeingsent
theinvitatio
n,with
adefin
itive
“normal”
(nofurtherinvestigatio
nrequ
ired)
or“abn
ormal”(requirin
greferral
forfurtherinvestigatio
n,usually
colono
scop
y)screeningtestresultavailablea
tthe
timeo
fdatae
xtraction.
‡546(274
SIand272SI
+N)ind
ividualsmiss
ingan
IMDscore,301o
fthese
werea
dequ
ately
screened
(149SI
and152SI
+N).
Gastroenterology Research and Practice 9
the goal of making the screening offer more visible to lower-literacy individuals. The impact of a “stand-alone” narrativeleaflet at different points in the invitation pathway andin comparison to existing materials therefore needs to beexamined.
In addition, the provision of narrative information in dif-ferent formats (e.g., web, video)which integrate oral and non-verbal communication methods, thus allowing more narra-tive information to be communicated, and perhaps in a moreengagingmanner, should also be tested. Previous research hasalso suggested a benefit of using either a targeted or tailoredapproach in health communication materials (e.g., [30, 31]).Had multiple variations of the leaflet been developed tospecifically target, for example, those who were being invitedfor the first time and previous nonresponders separately,the results may have been more positive. However, within anational programme, the application of targeted and tailoredmaterials is complex. Future research is needed to investigateways to implement such interventions on a national scale.
Further limitations of the study include the marker ofSES used to depict the gradient. While the Index of MultipleDeprivation (IMD) is a comprehensivemeasure of area depri-vation, it does not include personal circumstances and there-fore individuals may not be as affluent or as disadvantagedas their postcode suggests.
The current study does not support the inclusion of a nar-rative leaflet at the preinvitation stage of the CRC ScreeningProgramme, but further research could be developed to elu-cidate if narratives, in another format and/or position, couldpositively impact uptake of the CRC screening programmeoverall and reduce inequalities.
Specifically, there is evidence that creating additionalreminder letters is associated with increasing uptake [32, 33].One potential advantage of using the narrative leaflet as partof an additional reminder would be that the leaflet could beused on its own rather than in combination with the standardinformed choice leaflet. ARCTcomparing the effectiveness ofsuch a reminder with the narrative versus the standard leafletwould offer additional insights into the potential impact ofour leaflet and circumvent the aforementioned limitations.
5. Conclusion
This pragmatic cluster randomised-trial found that providinga supplementary information leaflet, which presents a narra-tive account of the gFOBt-based, organisedNHSCRC screen-ing programme in England, neither increased overall uptakenor reduced inequalities, when delivered with the standardinformation material. This is despite the leaflet previouslybeing found to significantly increase intentions to participatein CRC screening. The results do not support a change inpolicy at this time, but future research could investigate theimpact of a stand-alone narrative leaflet at other points in thecommunication pathway.
Disclosure
Lesley M. McGregor and Christian vonWagner are joint firstauthors.
Disclaimer
Theviews expressed in this paper are those of the authors andnot necessarily those of the NHS, the National Institute forHealth Research, or the Department of Health.
Conflict of Interests
The authors declare that there is no conflict of interestsregarding the publication of this paper.
Acknowledgments
This paper describes independent research funded by theNational Institute for Health Research under its ProgrammeGrants for Applied Research Programme (Grant referenceno. RP-PG-0609-10106) and partly supported by the NIHRCollaboration for Leadership in AppliedHealth Research andCare (CLAHRC) NorthThames (MCT and RR). The authorsthank the managers of the screening hubs and staff at RealDigital International, Croydon, UK, for their oversight andmanagement of the narrative intervention. They thank PaulGreliak, Imperial College London, and Cecily Palmer, Uni-versityCollege London, for their contributions to the trial andproject management, respectively. They also thank HannahChalkley, University College London, for her help in thecollection of narratives, and Beating Bowel Cancer, CamdenCarers Association, PublicHealth Partnerships, London, and,additionally, their patient representatives for their help andadvice during the development of the narrative leaflet.
References
[1] S. A. Suttie, I. A. Shaikh, A. I. Amin, T. Daniel, and S. Yala-marthi, “The effect of a screening programmeon the outcome ofcolorectal cancer,” Colorectal Disease, vol. 14, no. 8, pp. 937–942,2012.
[2] E. D. Courtney, D. Chong, R. Tighe, J. R. Easterbrook, W. S. L.Stebbings, and J. Hernon, “Screen-detected colorectal cancersshow improved cancer-specific survival when compared withcancers diagnosed via the 2-week suspected colorectal cancerreferral guidelines,”Colorectal Disease, vol. 15, no. 2, pp. 177–182,2013.
[3] S. R. Cole, G. R. Tucker, J. M. Osborne et al., “Shift to earlierstage at diagnosis as a consequence of the National Bowel Can-cer Screening Program,” Medical Journal of Australia, vol. 198,no. 6, pp. 327–330, 2013.
[4] C. von Wagner, G. Baio, R. Raine et al., “Inequalities in par-ticipation in an organized national colorectal cancer screeningprogramme: results from the first 2.6 million invitations inEngland,” International Journal of Epidemiology, vol. 40, no. 3,pp. 712–718, 2011.
[5] L. Festinger, A Theory of Cognitive Dissonance, Row, Petersonand Company, Evanston, Ill, USA, 1957.
[6] A. McQueen, P. R. Swank, and S. W. Vernon, “Examiningpatterns of association with defensive information processingabout colorectal cancer screening,” Journal ofHealth Psychology,vol. 19, no. 11, pp. 1443–1458, 2014.
[7] L. J. Hinyard and M. W. Kreuter, “Using narrative commu-nication as a tool for health behavior change: a conceptual,
10 Gastroenterology Research and Practice
theoretical, and empirical overview,” Health Education andBehavior, vol. 34, no. 5, pp. 777–792, 2007.
[8] J. B. F. de Wit, E. Das, and R. Vet, “What works best: objectivestatistics or a personal testimonial? An assessment of thepersuasive effects of different types of message evidence on riskperception,” Health Psychology, vol. 27, no. 1, pp. 110–115, 2008.
[9] M. C. Green, “Narratives and cancer communication,” Journalof Communication, vol. 56, pp. S163–S183, 2006.
[10] K. F. Bennett, C. von Wagner, and K. A. Robb, “Supplementingfactual informationwith patient narratives in the cancer screen-ing context: a qualitative study of acceptability and preferences,”Health Expectations, vol. 18, no. 6, pp. 2032–2041, 2015.
[11] A. J. Dillard, A. Fagerlin, S. D. Cin, B. J. Zikmund-Fisher, andP. A. Ubel, “Narratives that address affective forecasting errorsreduce perceived barriers to colorectal cancer screening,” SocialScience and Medicine, vol. 71, no. 1, pp. 45–52, 2010.
[12] S. T. Murphy, L. B. Frank, J. S. Chatterjee, and L. Baezconde-Garbanati, “Narrative versus nonnarrative: the role of identifi-cation, transportation, and emotion in reducing health dispari-ties,” Journal of Communication, vol. 63, no. 1, pp. 116–137, 2013.
[13] M. W. Kreuter, K. Holmes, K. Alcaraz et al., “Comparingnarrative and informational videos to increase mammographyin low-income African American women,” Patient Educationand Counseling, vol. 81, supplement 1, pp. S6–S14, 2010.
[14] J. D. Jensen, A. J. King, N. Carcioppolo,M. Krakow,N. J. Samad-der, and S.Morgan, “Comparing tailored and narrative worksiteinterventions at increasing colonoscopy adherence in adults 50–75: a randomized controlled trial,” Social Science and Medicine,vol. 104, pp. 31–40, 2014.
[15] J. W. Wardle, C. von Wagner, I. Kralj Hans et al., “Effects ofevidence-based strategies to reduce the socioeconomic gradientof uptake in the English NHS Bowel Cancer Screening Pro-gramme (ASCEND): four cluster-randomised controlled trials,”The Lancet, 2015.
[16] R. Raine, S.W.Duffy, J.Wardle et al., “Impact of general practiceendorsement on the social gradient in uptake in bowel cancerscreening,” British Journal of Cancer, In press.
[17] L. M. McGregor, C. von Wagner, G. Vart et al., “The impactof supplementary narrative-based information on colorectalcancer screening beliefs and intention,” BMC Cancer, vol. 15,article 162, 2015.
[18] C. J. Rees and R. Bevan, “The National Health Service BowelCancer Screening Program: the early years,” Expert Review ofGastroenterology & Hepatology, vol. 7, no. 5, pp. 421–437, 2013.
[19] D. Helitzer, C. Hollis, J. Cotner, and N. Oestreicher, “Healthliteracy demands of written health information materials: anassessment of cervical cancer prevention materials,” CancerControl, vol. 16, no. 1, pp. 70–78, 2009.
[20] R. Flesch, “A new readability yardstick,” Journal of AppliedPsychology, vol. 32, no. 3, pp. 221–233, 1948.
[21] J. P. Kincaid, R. P. Fishburne Jr., R. L. Rogers, and B. S. Chissom,“Derivation of new readability formulas (automated readabilityindex, fog count and Flesch Reading Ease Formula) for navyenlisted personnel,” Research Branch Report, Naval TechnicalTraining Command, Millington, Tenn, USA, 1975.
[22] Department for Communities and Local Government, TheEnglish Indices of Deprivation 2010, 2011, https://www.gov.uk/government/uploads/system/uploads/attachment data/file/6871/1871208.pdf.
[23] A. R. Brentnall, S. W. Duffy, G. Baio, and R. Raine, “Strategyfor power calculation for interactions: application to a trial of
interventions to improve uptake of bowel cancer screening,”Contemporary Clinical Trials, vol. 33, no. 1, pp. 213–217, 2012.
[24] S. Halloran, G. Launoy, andM. Zappa, “Faecal occult blood test-ing,” in European Guidelines for Quality Assurance in ColorectalCancer Screening andDiagnosis, N. P. J. Segnan andL. vonKarsa,Eds., chapter 4, pp. 103–144, European Comission, PublicationsOffice of the European Union, Luxembourg City, Luxembourg,1st edition, 2010.
[25] M. J. Campbell, A. Donner, and N. Klar, “Developments incluster randomized trials and statistics in medicine,” Statisticsin Medicine, vol. 26, no. 1, pp. 2–19, 2007.
[26] S. Puffer, D. J. Torgerson, and J. Watson, “Evidence for risk ofbias in cluster randomised trials: review of recent trials pub-lished in three general medical journals,” British Medical Jour-nal, vol. 327, no. 7418, pp. 785–789, 2003.
[27] N. A. Patsopoulos, “A pragmatic view on pragmatic trials,”Dialogues in Clinical Neuroscience, vol. 13, no. 2, pp. 217–224,2011.
[28] G. Libby, J. Bray, J. Champion et al., “Pre-notification increasesuptake of colorectal cancer screening in all demographicgroups: a randomized controlled trial,” Journal of MedicalScreening, vol. 18, no. 1, pp. 24–29, 2011.
[29] A. Lewis and F. Eves, “Prompt before the choice is made: effectsof a stair-climbing intervention in university buildings,” BritishJournal of Health Psychology, vol. 17, no. 3, pp. 631–643, 2012.
[30] R. E. Myers, R. Sifri, T. Hyslop et al., “A randomized controlledtrial of the impact of targeted and tailored interventions oncolorectal cancer screening,” Cancer, vol. 110, no. 9, pp. 2083–2091, 2007.
[31] M. W. Kreuter, V. J. Strecher, and B. Glassman, “One size doesnot fit all: the case for tailoring print materials,” Annals ofBehavioral Medicine, vol. 21, no. 4, pp. 276–283, 1999.
[32] R. J. C. Steele, I. Kostourou, P. McClements et al., “Effect ofrepeated invitations on uptake of colorectal cancer screeningusing faecal occult blood testing: analysis of prevalence andincidence screening,” British Medical Journal, vol. 341, ArticleID c5531, 2010.
[33] C. Senore, J. Inadomi, N. Segnan, C. Bellisario, and C. Hassan,“Optimising colorectal cancer screening acceptance: a review,”Gut, vol. 64, no. 7, pp. 1158–1177, 2015.

Submit your manuscripts athttp://www.hindawi.com
Stem CellsInternational
Hindawi Publishing Corporationhttp://www.hindawi.com Volume 2014
Hindawi Publishing Corporationhttp://www.hindawi.com Volume 2014
MEDIATORSINFLAMMATION
of
Hindawi Publishing Corporationhttp://www.hindawi.com Volume 2014
Behavioural Neurology
EndocrinologyInternational Journal of
Hindawi Publishing Corporationhttp://www.hindawi.com Volume 2014
Hindawi Publishing Corporationhttp://www.hindawi.com Volume 2014
Disease Markers
Hindawi Publishing Corporationhttp://www.hindawi.com Volume 2014
BioMed Research International
OncologyJournal of
Hindawi Publishing Corporationhttp://www.hindawi.com Volume 2014
Hindawi Publishing Corporationhttp://www.hindawi.com Volume 2014
Oxidative Medicine and Cellular Longevity
Hindawi Publishing Corporationhttp://www.hindawi.com Volume 2014
PPAR Research
The Scientific World JournalHindawi Publishing Corporation http://www.hindawi.com Volume 2014
Immunology ResearchHindawi Publishing Corporationhttp://www.hindawi.com Volume 2014
Journal of
ObesityJournal of
Hindawi Publishing Corporationhttp://www.hindawi.com Volume 2014
Hindawi Publishing Corporationhttp://www.hindawi.com Volume 2014
Computational and Mathematical Methods in Medicine
OphthalmologyJournal of
Hindawi Publishing Corporationhttp://www.hindawi.com Volume 2014
Diabetes ResearchJournal of
Hindawi Publishing Corporationhttp://www.hindawi.com Volume 2014
Hindawi Publishing Corporationhttp://www.hindawi.com Volume 2014
Research and TreatmentAIDS
Hindawi Publishing Corporationhttp://www.hindawi.com Volume 2014
Gastroenterology Research and Practice
Hindawi Publishing Corporationhttp://www.hindawi.com Volume 2014
Parkinson’s Disease
Evidence-Based Complementary and Alternative Medicine
Volume 2014Hindawi Publishing Corporationhttp://www.hindawi.com