Embed Size (px)
Citation preview
RESEARCH ARTICLE
Ramya KUMANAYAKE, Hanbin LUO
Life cycle carbon emission assessment of a multi-purposeuniversity building: A case study of Sri Lanka
© The Author(s) 2017. Published by Higher Education Press. This is an open access article under the CC BY license (http://creativecommons.org/licenses/by/4.0)
Abstract Buildings are known to significantly affect theglobal carbon emissions throughout their life cycle. Tomitigate carbon emissions, investigation of the currentperformance of buildings with regard to energy consump-tion and carbon emissions is necessary. This paper presentsa process-based life cycle assessment methodology forassessing carbon emissions of buildings, using a multi-storey reinforced concrete building in a Sri Lankanuniversity as a case study. The entire cradle-to-gravebuilding life cycle was assessed and the life span of thebuilding was assumed as 50 years. The results provideevidence of the significance of operation and materialproduction stages, which contributed to the total carbonemissions by 63.22% and 31.59% respectively. Betweenthem, the main structural materials, concrete and reinforce-ment steel made up 61.91% of the total carbon emitted atthe material production stage. The life cycle carbonemissions of the building were found to be 31.81 kg$m–2
CO2 per year, which is comparable with the valuesobtained in similar studies found in the literature. Inminimizing the life cycle carbon emissions, the importanceof identifying control measures for both building operationand material production at the early design stage wereemphasized. Although the other life cycle stages onlycontributed to about 5.19% of the life cycle carbonemissions, they should also receive attention whenformulating control strategies. Some of the recommendedstrategies are introducing energy efficiency measures inbuilding design and operation, using renewable energy forbuilding operation and manufacturing of materials,identifying designs that can save mass material quantities,using alternative materials that are locally available in Sri
Lanka and implementing material reuse and recycling.This study is one of the first to undertake a life cycle carbonemissions assessment for a building in the Sri Lankancontext, with the hope of facilitating environmentally-friendly buildings and promoting sustainable constructionpractices in the country.
Keywords carbon emission, life cycle assessment, build-ings, sustainable construction, Sri Lanka
1 Introduction
Climate change is a major environmental concern globallyand the increase in greenhouse gas (GHG) emissions is oneof its main drivers. Global GHG emissions due to humanactivities have grown since the pre-industrial times, withan increase of 70% between 1970 and 2004 (Intergovern-mental Panel on Climate Change, 2007). Annual emissionsof carbon dioxide (CO2), the most prominent GHG, grewby about 80% during the same period, mainly due toextensive fossil fuel usage and land use, both highlycontributed to by the construction industry. Globally,buildings account for 30%–40% of total primary energyuse and about one third of GHG emissions. Thus, thebuilding sector can play a significant role in reducingcarbon emissions and thereby contribute to the mitigationof global climate change (United Nations EnvironmentProgramme, 2010). Energy is used extensively throughoutthe life cycle of a building during material production,transportation, construction, operation, maintenance anddemolition and as a result, a considerable amount of carbonis emitted. There is great potential in improving the energyefficiency of buildings and thereby reducing carbonemissions without significant increases in investmentcosts (Intergovernmental Panel on Climate Change, 2007).As buildings have long lifespans, they should be
planned and designed to have high energy efficiency andlow carbon emissions over their entire life cycle.
Received July 2, 2017; accepted October 31, 2017
Ramya KUMANAYAKE (✉), Hanbin LUODepartment of Construction Management, School of Civil Engineeringand Mechanics, Huazhong University of Science and Technology,Wuhan 430074, ChinaE-mail: [email protected]
Front. Eng. Manag. 2018, 5(3): 381–393https://doi.org/10.15302/J-FEM-2018055
Incorporating energy efficiency and low-carbon measuresare now feasible during the early stages of building design.For any improvements to occur, assessment of currentbuilding performance is essential. In the recent decades,numerous studies have been conducted to analyze energyand carbon impacts of buildings. The full extent of thelifetime emissions of a building can best be understood byusing life cycle assessment (LCA), which considers arange of environmental impacts throughout the life cycleof a building. Life cycle carbon emission assessment is aspecialized form of LCA, which evaluates carbon emis-sions as an output across the building life cycle to facilitatethe selection of low-carbon emitting materials, systems,and processes for buildings. It has become particularlysignificant due to the imminently threatening globalwarming problem caused by GHG emissions. The KyotoProtocol has set binding targets to reduce the GHGemissions by an average of 5% to the 1990 levels between2008 and 2012 (Kim et al., 2013). The ratification of KyotoProtocol has led to many studies which aimed to evaluateimpacts of energy use and carbon emissions of buildings.In previous studies, the possibility of reducing CO2
emissions by up to 30% during the construction phase wasdemonstrated through the selection of low environmentalimpact materials (González and García Navarro, 2006) andthe environmental impacts of CO2 emissions in buildingconstruction phase of single family detached houses inSpain were analyzed (Pacheco-Torres et al., 2014). Manystudies have emphasized the dominance of the operationstage in life cycle carbon emissions assessment irrespectiveof the country in which the study was based (Kofoworolaand Gheewala, 2008; Varun et al., 2012; Atmaca A andAtmaca N, 2015; Zhang et al., 2016). The carbonemissions at the material production stage have also beenfound to be significant by many researchers (Varun et al.,2012; Zhang et al., 2016). By investigating CO2 emissionsof 78 office buildings in China during the pre-use stage, itwas found that material production accounted for 75% ofthe total CO2 emissions and steel, concrete, mortar andwall materials made up over 80% of the emissions ofmaterial production stage (Luo et al., 2015). Most of theprevious studies focused on reinforced concrete structureswhich gave evidence for the prominence of concrete andreinforcement steel in carbon emissions during the materialproduction stage (Jeong et al., 2012; Luo et al., 2015; Simet al., 2016). The life cycle GHG emissions and energyconsumption of pre-fabricated reusable building moduleshave been compared with those of the conventionalconcrete construction methods (Aye et al., 2012). Gus-tavsson et al. (2010) studied the primary energy use andCO2 emissions of a wood-framed apartment building. Theconcept of ‘life cycle carbon efficiency’ was introducedand it was applied to a 5-storey residential building inNanjing, China (Li et al., 2013). Zhang and Wang (2015)established an analytical framework to assess the life cyclecarbon emissions and to identify appropriate control
measures, which emphasized the possibility of carboncontrol during the materialization stage, particularly fordeveloping countries that are experiencing extensiveconstruction works. Many researchers have used LCAmodels, frameworks and methodology to analyze energyconsumption and GHG emissions throughout the buildinglife cycle (Monahan and Powell, 2011; Wu et al., 2012;Biswas, 2014).Most of the past research on building energy and carbon
emissions has focused on developed and temperate climatecountries and only a few examples from developingtropical countries exist (Kofoworola and Gheewala, 2008;Ramesh et al., 2012; Varun et al., 2012; Paulsen andSposto, 2013; Pinky Devi and Palaniappan, 2014; Wenet al., 2015). The linkage between building design, energyuse and carbon emissions is dependent on and sensitive toclimate and the socio-demographic characteristics that aregeographically and culturally variable (Atmaca A andAtmaca N, 2015). Therefore, the results of life cyclestudies can vary extensively for countries in differentregions of the world. There are several characteristics thatdistinguish energy use and carbon emission of developingtropical countries from the rest of the world. In thesecountries energy is extensively used for cooling andelectricity is the main energy source, which usually hashigher carbon emissions than other sources used indeveloped countries (Ramesh et al., 2010). Although thetraditional buildings in the tropical countries are naturallyventilated, with increased access to air conditioning as aresult of increasing disposable income, the energy demandof developing countries are steadily rising (Chiraratananonand Hien, 2011). Despite the extensive use of airconditioning in buildings, a little or no insulation iscurrently used, resulting in inefficiencies in the life cycleenergy performance and increased carbon emissions. Also,inefficient material production technologies result inincreased embodied energy and carbon emission (Chirar-atananon et al., 2012). The parameters to be focused onenergy and carbon emissions studies in the developingtropical countries were identified as; level of operationalenergy use, transition from traditional to modern buildingmaterials, role of insulation, role of advanced buildingsystems, technology of material production, energyproduction methods and energy carriers (Ruuska, 2013).In some studies, the existing data was adjusted to reflect thedifferences in the above parameters for a particular country(González and García Navarro, 2006; Chau et al., 2007;Abeysundara et al., 2009).Most of the building life cycle energy and carbon
emission studies in the existing literature are based ontypical residential or office buildings (González and GarcíaNavarro, 2006; Dimoudi and Tompa, 2008; Kofoworolaand Gheewala, 2009; Ramesh et al., 2012; Pacheco-Torreset al., 2014; Pinky Devi and Palaniappan, 2014; Wen et al.,2015). Only a few studies can be found for universitybuildings which have special characteristics; usually these
382 Front. Eng. Manag. 2018, 5(3): 381–393
are multi-purpose buildings consisting of offices, classrooms, laboratories and in some cases residential facilities.Therefore their energy and carbon emission characteristicsare found to be complex and differ substantially from caseto case (Scheuer et al., 2003; Varun et al., 2012; Wu et al.,2012; Biswas, 2014).Construction is the second largest industry in Sri Lanka.
As buildings contribute to more than 50% of value of workdone and the raw material use in the construction sector ofthe country (Department of Census and Statistics Sri Lanka2013, 2015), assessment of environmental implications ofbuildings should be given priority. At present, there is asignificant lack of country-specific research and relateddata inventories on building energy and carbon emissionsin Sri Lanka. Some authors described a computerizedrelational database management system to determineenergy contents and carbon emission coefficients for avariety of Sri Lankan building materials (Dias andPooliyadda, 2004). In some studies, the environmentalburdens of building elements were analyzed using typicalschool buildings in Sri Lanka as case studies (Abeysundraet al., 2007; Abeysundara et al., 2009).This study aimed at assessing life cycle carbon
emissions of a university building in Ratmalana, a suburbof Colombo in Sri Lanka. Due to unavailability of energyand carbon related data in the context of Sri Lanka,internationally recognized databases, relevant Sri Lankanand international reports and recent research literature,preferably studies based on the developing Asian countrieswere used as data sources. In identifying the most relevantdata for Sri Lanka, current construction practices of thecountry were considered. No previous research on lifecycle carbon emissions of buildings in Sri Lanka is foundin literature and this study can be considered as the first-ever such study for Sri Lankan buildings, which is timelyand highly relevant to the current requirements of thecountry. The proposed methodology can be used bybuilding planners, designers, owners and certificationbodies to assess life cycle carbon emissions of Sri Lankanbuildings, hence facilitating environmentally-friendly con-struction decision making and strategy formulation topromote sustainable construction practices in Sri Lanka.
2 Materials and methods
2.1 Methodological framework for life cycle assessment
This study was based on the LCA approach and the fourstages of the LCA methodological framework as identifiedin ISO 14040 on Environmental Management; goal andscope definition, inventory analysis, impact assessmentand interpretation were followed (International Organiza-tion for Standardization, 1997). The LCA was process-based where input data, in the form of energy and materials
were utilized in assessing life cycle carbon emissions of thebuilding.
2.1.1 Goal and scope of the study
The cradle-to-grave life cycle carbon emissions of a multi-storey university building in Sri Lanka were investigated inthis study. Both spatial and life cycle process boundarieswere included within the system boundary. The spatialboundary was defined as the closed three-dimensionalspace bounded by the foundation, roof and the façade ofthe building. The cradle-to-grave life cycle phases;material production, transportation, construction, opera-tion, maintenance, demolition and waste disposal wereincluded in the life cycle process boundary. The life span ofthe building was taken as 50 years and the functional unitfor the study was considered as one square meter (m2) ofgross floor area of the building per year.
2.1.2 Life cycle inventory analysis
The inputs (materials and energy) and outputs (carbonemissions) during building life cycle were considered inthe life cycle inventory. The inputs were obtained fromdesign drawings, bills of quantities, technical specifica-tions, reports of relevant Sri Lankan and internationalbodies and recent research literature. In selecting theappropriate data, values that best match the currentconstruction practices in Sri Lanka were considered andin the case of insufficient data, suitable assumptions weremade with consultation of experienced constructionprofessionals.
2.1.3 Life cycle impact assessment and interpretation
In this phase, the significance of the potential environ-mental impacts was evaluated using the results of the lifecycle inventory analysis. In the present study, life cyclecarbon emissions were considered as the potentialenvironmental impact and the final results were presentedas annual carbon emissions per unit gross floor area(kg$m–2 CO2) of the case study building. The life cycleinterpretation phase combined the findings of inventoryanalysis and the impact assessment in order to drawconclusions and suggest recommendations within thedefined goal and scope of the study.
2.2 Methodology followed for life cycle carbon emissionsassessment
2.2.1 Estimation of life cycle carbon emissions
Based on the carbon emission coefficient method and theLCA approach, total lifecycle carbon emissions of a
Ramya KUMANAYAKE et al. Life cycle carbon emission assessment of a Sri Lankan building 383
building were calculated as given in Eq. (1) (Chau et al.,2015).
CLC ¼ CM þ CT þ CC þ CO&M þ CD (1)
where CLC represents the total lifecycle carbon emissionsof a building and CM, CT, CC, CO&M and CD representcarbon emissions at the material production, transporta-tion, construction, operation and maintenance and demoli-tion stages (kg CO2) respectively. The carbon emissionsattributable to each life cycle stage are presented byEqs. (2)–(6).
2.2.2 Carbon emissions at the material production stage
The carbon emissions at the material production stage (CM)includes the raw materials extraction and building materialproduction and can be estimated as given in Eq. (2) (Liet al., 2016).
CM ¼ Σni¼1ðmi � fm,iÞ (2)
where n is the total number of material types, mi is quantityof material type i (kg or m3) and fm,i is the embodied carbonemission coefficient (kg$kg–1 or kg$m–3 CO2) of type imaterial. Due to current unavailability of carbon emissiondata inventories for Sri Lanka, appropriate values of fm,iwere taken from existing literature and globally recognizeddatabases such as Inventory of Carbon and Energy (ICE)(University of Bath UK, 2011) and Korea LCI DBInformation Network (Korea LCI DB Information Net-work, 2017).
2.2.3 Carbon emissions at the material transportation stage
The carbon emissions during the material transportation(CT) stage was computed based on the amount of carbonemitted by the type of vehicles used to deliver materials tothe construction site. CT is given by Eq. (3) which wasdeveloped using the methodology suggested in literature(Pinky Devi and Palaniappan, 2014).
CT ¼ Σni¼1ðTi � Di � ft,iÞ (3)
where Ti is number of trips of trucks required fortransporting type i material, Di is the average two-waytravel distance (km) for transporting type i material to theconstruction site and ft,i is the carbon emission coefficientfor transporting type i material (kg$km–1 CO2). The meansof material transportation that are commonly used in SriLanka were investigated and transit-mixer trucks (6 m3) forready-mixed concrete, 20-ton trailers for reinforcementsteel and 20-ton and 8-ton trucks for other buildingmaterials were identified. The carbon emission coefficientsfor various types of transportation were calculated usingthe data obtained from research literature and local andinternational reports such as Common Carbon Metric(United Nations Environment Programme, 2010), IEA
Statistics (International Energy Agency, 2015) and SriLanka Energy Balance (Sri Lanka Sustainable EnergyAuthority, 2015).
2.2.4 Carbon emissions at the building construction stage
The carbon emissions at the construction stage wereestimated by using fuel/electricity usage rates for typicalconstruction activities at site such as earthworks, pouringand lifting of ready-mixed concrete, concrete compaction,rebar and reinforcing, lifting of materials by tower craneand material hoist and site lighting. The energy sourcesused were taken as diesel and electricity. Carbon emissionsduring building construction (CC) are given by Eq. (4)which was developed using the methodology suggested inthe literature (Pinky Devi and Palaniappan, 2014).
CC ¼ Σji¼1ðQi � Ri � fc,iÞ (4)
where j is total number of on-site construction activities,Qi
is the quantity of on-site construction activity i (m3, m2 orkg), Ri is fuel/electricity usage rate for construction activityi (L$m–3, kWh$kg–1 or kWh$m–2) and fc,i is carbonemission coefficient for the energy source used for theconstruction activity i (kg$L–1 or kg$kWh–1 CO2). The datarelated to typical construction activities of a reinforcedconcrete building were obtained from research literature,technical specifications and consultation with constructionprofessionals in Sri Lanka.
2.2.5 Carbon emissions at the operation and maintenancestage
In assessing carbon emissions during building operation,the energy consumption due to air conditioning, ventila-tion, lighting and equipment use (mainly computers) wasconsidered. Electricity from the national grid was taken asthe energy source for building operation. Electricitygeneration in Sri Lanka is the result of a unique mix ofenergy sources; hydro (37.5%), coal (33.9%), fuel oil(17.4%), and non-conventional renewable energy (11.2%).The carbon emission factor for grid electricity wascomputed based on emission factors of the relevantprimary energy sources and their contribution to theelectricity generation mix. According to Sri Lanka EnergyBalance 2015 (Sri Lanka Sustainable Energy Authority,2015), current carbon emission factor for electricity in SriLanka is about 0.6896 kg$kWh–1 CO2. The carbonemissions for building maintenance were computed usingrepair cycle and rate of repair for each material type i (Rohet al., 2016). The carbon emissions in the operation andmaintenance stage (CO&M) were estimated as given inEq. (5).
CO&M ¼ Qe � fe � Yð Þ þ Σki¼1mi � ri � fm,i �
Y
R
��(5)
384 Front. Eng. Manag. 2018, 5(3): 381–393
where Qe is the average annual electricity consumption ofthe building (kWh$yr–1), fe the carbon emission coefficientof electricity (kg$kWh–1 CO2) and Y lifespan of thebuilding (years). The average annual electricity consump-tion was calculated based on monthly electricity bills and itwas assumed to be uniform throughout the building lifecycle. For the maintenance stage, k is the total number ofmaterial types required for repairs and replacement, mi isthe amount of the original building material i which isneeded for repair or replacement (kg or m3), ri is the rate ofrepair for the construction material i, fm,i is the carbonemission coefficient of type i material (kg$kg–1 or kg$m–3
CO2), Y is the lifespan of the building (years) and R is therepair interval (years) of material i. The value (Y/R) is therepair cycle for the material i (Chau et al., 2007). Onlystandard maintenance activities such as painting andreplacement of ceramic tiles were considered in the study.
2.2.6 Carbon emissions at the demolition stage
The carbon emissions at the demolition stage (CD) can beregarded as the summation of carbon emissions ofdemolition activities, transportation of demolished wasteand disposal as given by Eq. (6).
CD ¼ Σpi¼1ðQd,i � fd,iÞ þ ½ðT � D� ft,iÞ þ ðM � flÞ� (6)
where p is the total number of demolition procedures, Qd,i
is the engineering quantity of p type demolition procedureand fd,i is the carbon emission factor of demolitionprocedure p. T is the number of trips of 20-ton trucksrequired to transport the demolition waste to the landfillsite, D the two-way distance between demolition site tolandfill site (km) and ft,i is the carbon emission coefficientof trucks transporting waste (kg$km–1 CO2). M is the totalquantity of demolished materials (kg) and fl is the carbonemission factor of machinery used for landfill operation(kg$kg–1 CO2).The carbon emissions during building demolition were
computed considering three main demolition activities;removal of individual elements, ground levelling and cranehandling, for which carbon emission factors were obtainedfrom literature (Zhang andWang, 2015) as 7.8 kg$m–2 CO2
(gross floor area), 0.62 kg$m–2 CO2 (site area) and 2.85 �10–3 kg$kg–1 CO2, respectively. The weight of constructionwaste was taken as approximately the same as the totalweight of building materials. The carbon emissionsattributable to transporting waste to the landfill site werecomputed using the same method as for materialtransportation in Eq. (3). It was assumed that a 20-tontruck is used to transport the waste for a distance of 15 kmfrom the building site to the landfill site. As the relevantdata for recycling of construction waste is not currentlyavailable for Sri Lanka, recycling was not considered in thestudy. The total amount of demolished material wasassumed to be land filled using bulldozers and compactors
for which a standard fuel usage rate of 0.15 � 10–3 L$kg–1
was obtained from the literature (Roh and Tae, 2016).
2.3 Case study building
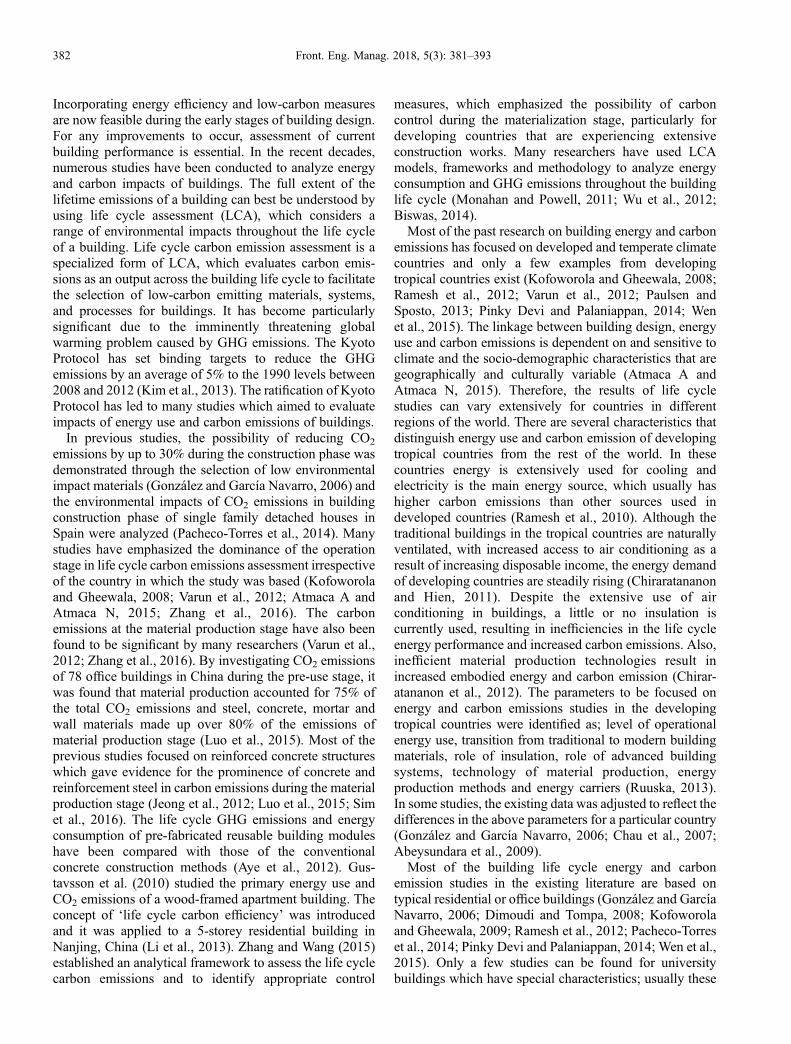
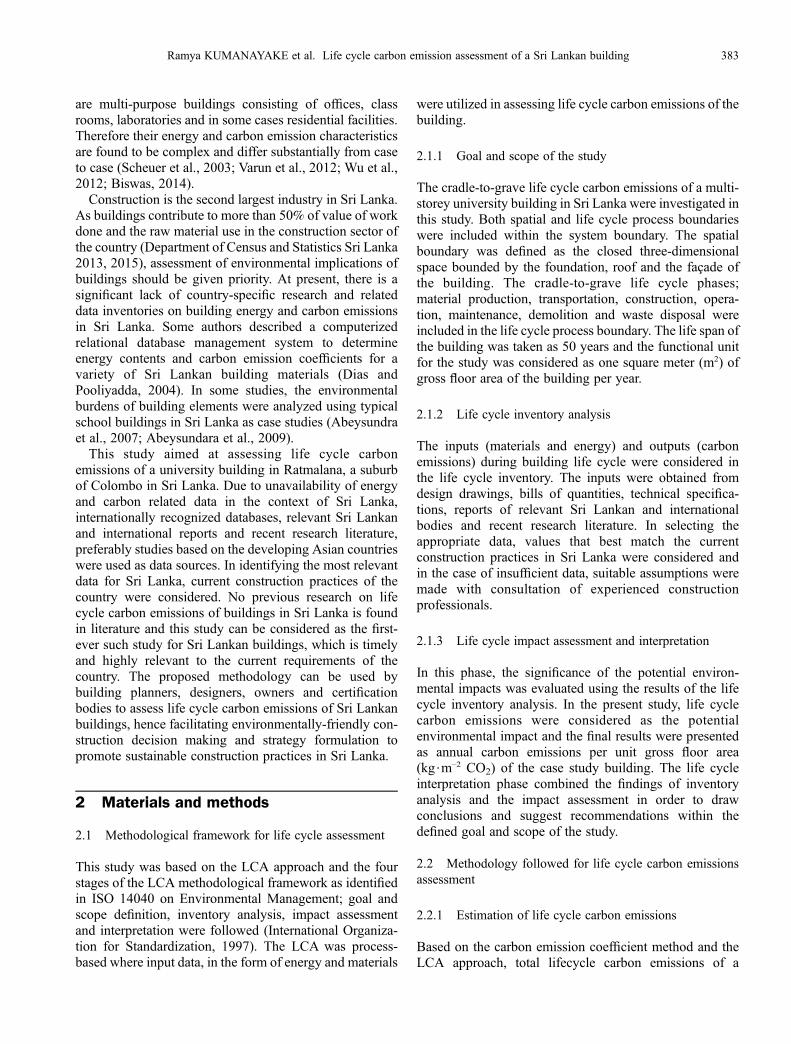
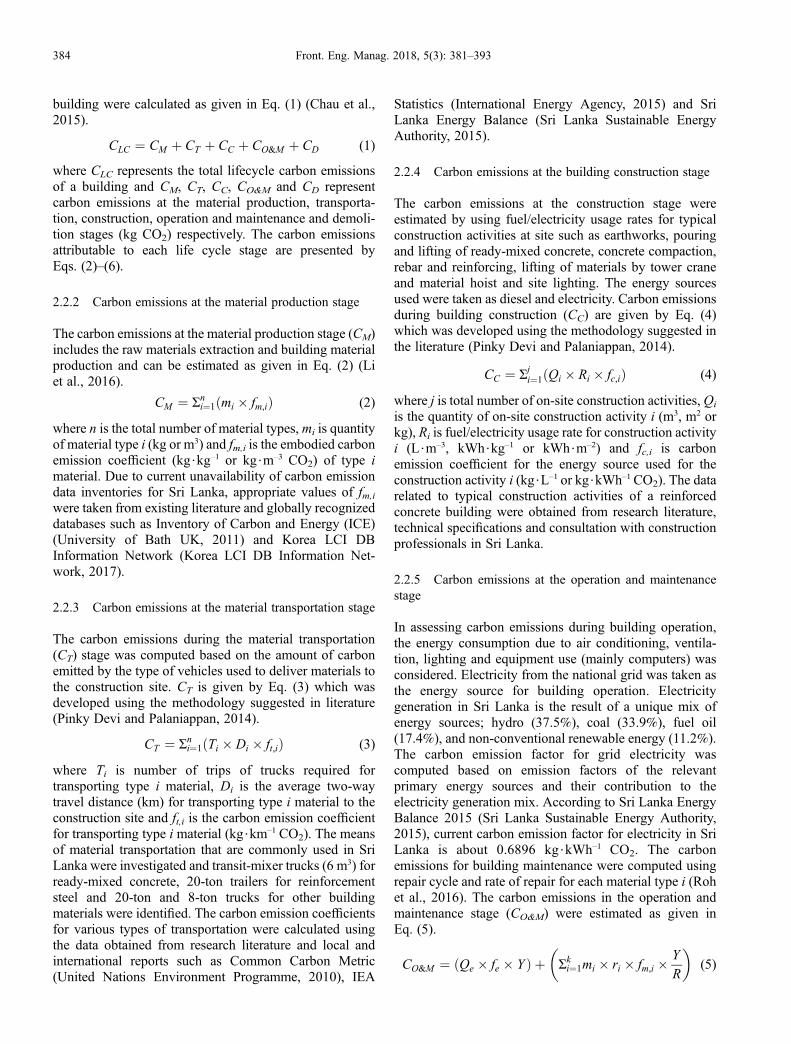
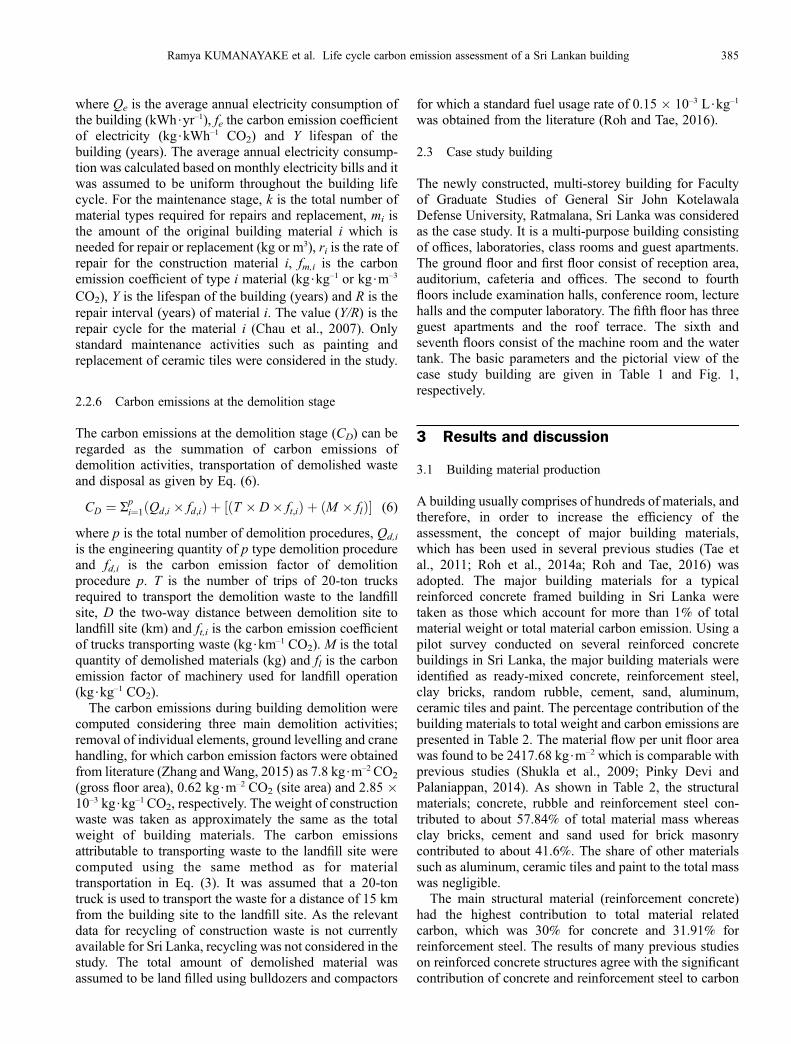
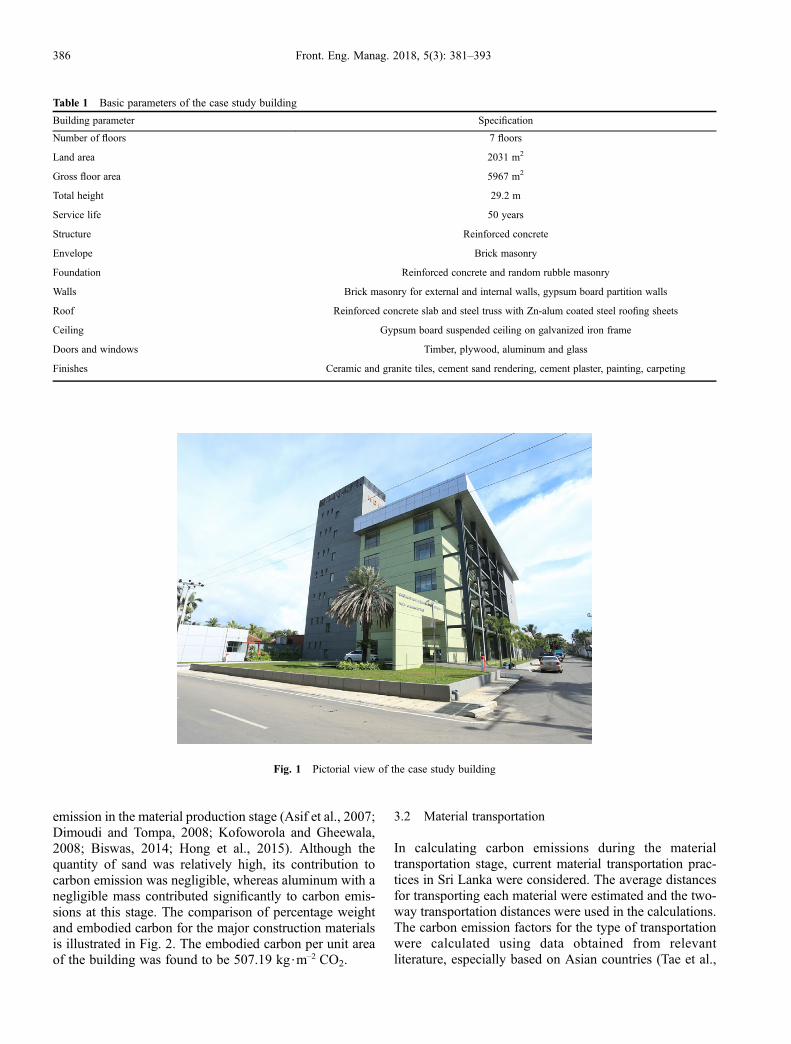
The newly constructed, multi-storey building for Facultyof Graduate Studies of General Sir John KotelawalaDefense University, Ratmalana, Sri Lanka was consideredas the case study. It is a multi-purpose building consistingof offices, laboratories, class rooms and guest apartments.The ground floor and first floor consist of reception area,auditorium, cafeteria and offices. The second to fourthfloors include examination halls, conference room, lecturehalls and the computer laboratory. The fifth floor has threeguest apartments and the roof terrace. The sixth andseventh floors consist of the machine room and the watertank. The basic parameters and the pictorial view of thecase study building are given in Table 1 and Fig. 1,respectively.
3 Results and discussion
3.1 Building material production
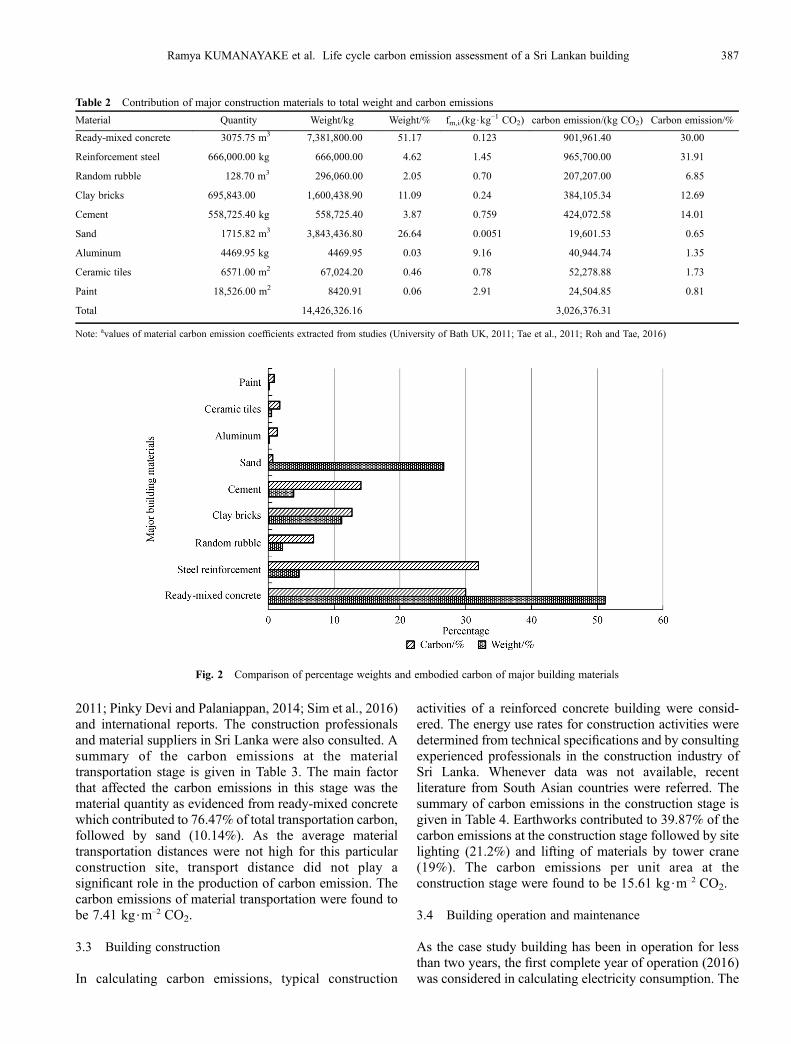
A building usually comprises of hundreds of materials, andtherefore, in order to increase the efficiency of theassessment, the concept of major building materials,which has been used in several previous studies (Tae etal., 2011; Roh et al., 2014a; Roh and Tae, 2016) wasadopted. The major building materials for a typicalreinforced concrete framed building in Sri Lanka weretaken as those which account for more than 1% of totalmaterial weight or total material carbon emission. Using apilot survey conducted on several reinforced concretebuildings in Sri Lanka, the major building materials wereidentified as ready-mixed concrete, reinforcement steel,clay bricks, random rubble, cement, sand, aluminum,ceramic tiles and paint. The percentage contribution of thebuilding materials to total weight and carbon emissions arepresented in Table 2. The material flow per unit floor areawas found to be 2417.68 kg$m–2 which is comparable withprevious studies (Shukla et al., 2009; Pinky Devi andPalaniappan, 2014). As shown in Table 2, the structuralmaterials; concrete, rubble and reinforcement steel con-tributed to about 57.84% of total material mass whereasclay bricks, cement and sand used for brick masonrycontributed to about 41.6%. The share of other materialssuch as aluminum, ceramic tiles and paint to the total masswas negligible.The main structural material (reinforcement concrete)
had the highest contribution to total material relatedcarbon, which was 30% for concrete and 31.91% forreinforcement steel. The results of many previous studieson reinforced concrete structures agree with the significantcontribution of concrete and reinforcement steel to carbon
Ramya KUMANAYAKE et al. Life cycle carbon emission assessment of a Sri Lankan building 385
emission in the material production stage (Asif et al., 2007;Dimoudi and Tompa, 2008; Kofoworola and Gheewala,2008; Biswas, 2014; Hong et al., 2015). Although thequantity of sand was relatively high, its contribution tocarbon emission was negligible, whereas aluminum with anegligible mass contributed significantly to carbon emis-sions at this stage. The comparison of percentage weightand embodied carbon for the major construction materialsis illustrated in Fig. 2. The embodied carbon per unit areaof the building was found to be 507.19 kg$m–2 CO2.
3.2 Material transportation
In calculating carbon emissions during the materialtransportation stage, current material transportation prac-tices in Sri Lanka were considered. The average distancesfor transporting each material were estimated and the two-way transportation distances were used in the calculations.The carbon emission factors for the type of transportationwere calculated using data obtained from relevantliterature, especially based on Asian countries (Tae et al.,
Fig. 1 Pictorial view of the case study building
Table 1 Basic parameters of the case study building
Building parameter Specification
Number of floors 7 floors
Land area 2031 m2
Gross floor area 5967 m2
Total height 29.2 m
Service life 50 years
Structure Reinforced concrete
Envelope Brick masonry
Foundation Reinforced concrete and random rubble masonry
Walls Brick masonry for external and internal walls, gypsum board partition walls
Roof Reinforced concrete slab and steel truss with Zn-alum coated steel roofing sheets
Ceiling Gypsum board suspended ceiling on galvanized iron frame
Doors and windows Timber, plywood, aluminum and glass
Finishes Ceramic and granite tiles, cement sand rendering, cement plaster, painting, carpeting
386 Front. Eng. Manag. 2018, 5(3): 381–393
2011; Pinky Devi and Palaniappan, 2014; Sim et al., 2016)and international reports. The construction professionalsand material suppliers in Sri Lanka were also consulted. Asummary of the carbon emissions at the materialtransportation stage is given in Table 3. The main factorthat affected the carbon emissions in this stage was thematerial quantity as evidenced from ready-mixed concretewhich contributed to 76.47% of total transportation carbon,followed by sand (10.14%). As the average materialtransportation distances were not high for this particularconstruction site, transport distance did not play asignificant role in the production of carbon emission. Thecarbon emissions of material transportation were found tobe 7.41 kg$m–2 CO2.
3.3 Building construction
In calculating carbon emissions, typical construction
activities of a reinforced concrete building were consid-ered. The energy use rates for construction activities weredetermined from technical specifications and by consultingexperienced professionals in the construction industry ofSri Lanka. Whenever data was not available, recentliterature from South Asian countries were referred. Thesummary of carbon emissions in the construction stage isgiven in Table 4. Earthworks contributed to 39.87% of thecarbon emissions at the construction stage followed by sitelighting (21.2%) and lifting of materials by tower crane(19%). The carbon emissions per unit area at theconstruction stage were found to be 15.61 kg$m–2 CO2.
3.4 Building operation and maintenance
As the case study building has been in operation for lessthan two years, the first complete year of operation (2016)was considered in calculating electricity consumption. The
Table 2 Contribution of major construction materials to total weight and carbon emissions
Material Quantity Weight/kg Weight/% fm,i/(kg$kg–1 CO2) carbon emission/(kg CO2) Carbon emission/%
Ready-mixed concrete 3075.75 m3 7,381,800.00 51.17 0.123 901,961.40 30.00
Reinforcement steel 666,000.00 kg 666,000.00 4.62 1.45 965,700.00 31.91
Random rubble 128.70 m3 296,060.00 2.05 0.70 207,207.00 6.85
Clay bricks 695,843.00 1,600,438.90 11.09 0.24 384,105.34 12.69
Cement 558,725.40 kg 558,725.40 3.87 0.759 424,072.58 14.01
Sand 1715.82 m3 3,843,436.80 26.64 0.0051 19,601.53 0.65
Aluminum 4469.95 kg 4469.95 0.03 9.16 40,944.74 1.35
Ceramic tiles 6571.00 m2 67,024.20 0.46 0.78 52,278.88 1.73
Paint 18,526.00 m2 8420.91 0.06 2.91 24,504.85 0.81
Total 14,426,326.16 3,026,376.31
Note: avalues of material carbon emission coefficients extracted from studies (University of Bath UK, 2011; Tae et al., 2011; Roh and Tae, 2016)
Fig. 2 Comparison of percentage weights and embodied carbon of major building materials
Ramya KUMANAYAKE et al. Life cycle carbon emission assessment of a Sri Lankan building 387
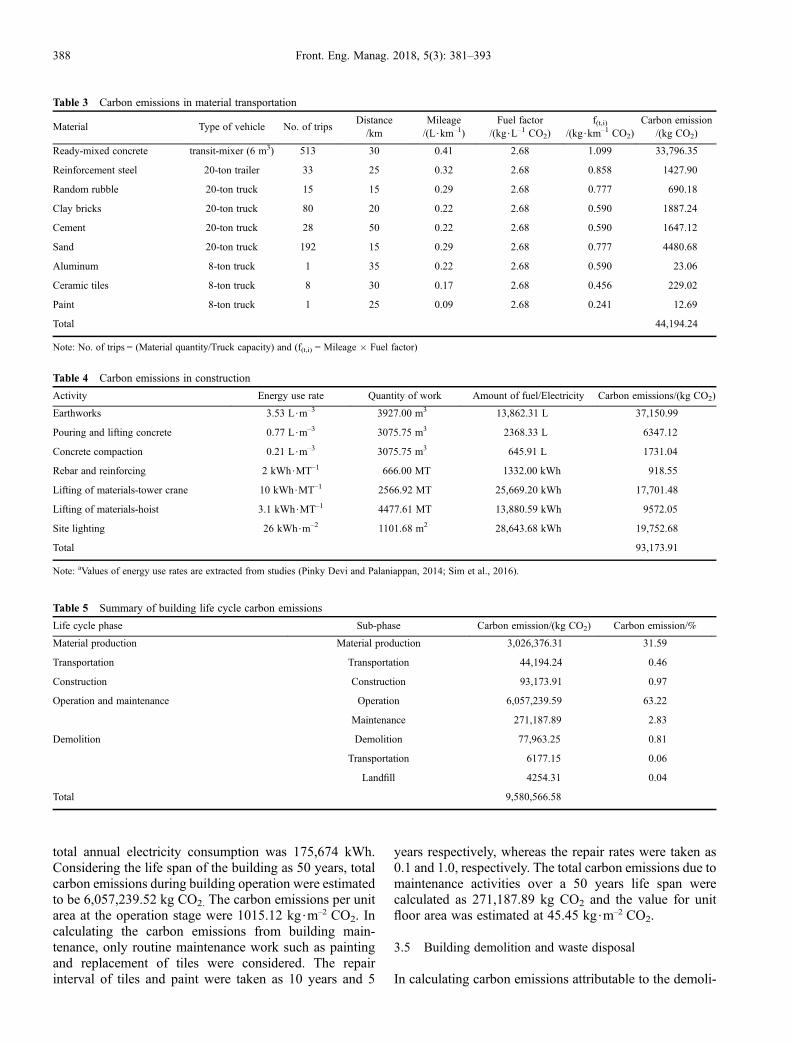
total annual electricity consumption was 175,674 kWh.Considering the life span of the building as 50 years, totalcarbon emissions during building operation were estimatedto be 6,057,239.52 kg CO2. The carbon emissions per unitarea at the operation stage were 1015.12 kg$m–2 CO2. Incalculating the carbon emissions from building main-tenance, only routine maintenance work such as paintingand replacement of tiles were considered. The repairinterval of tiles and paint were taken as 10 years and 5
years respectively, whereas the repair rates were taken as0.1 and 1.0, respectively. The total carbon emissions due tomaintenance activities over a 50 years life span werecalculated as 271,187.89 kg CO2 and the value for unitfloor area was estimated at 45.45 kg$m–2 CO2.
3.5 Building demolition and waste disposal
In calculating carbon emissions attributable to the demoli-
Table 3 Carbon emissions in material transportation
Material Type of vehicle No. of tripsDistance/km
Mileage/(L$km–1)
Fuel factor/(kg$L–1 CO2)
f(t,i)/(kg$km–1 CO2)
Carbon emission/(kg CO2)
Ready-mixed concrete transit-mixer (6 m3) 513 30 0.41 2.68 1.099 33,796.35
Reinforcement steel 20-ton trailer 33 25 0.32 2.68 0.858 1427.90
Random rubble 20-ton truck 15 15 0.29 2.68 0.777 690.18
Clay bricks 20-ton truck 80 20 0.22 2.68 0.590 1887.24
Cement 20-ton truck 28 50 0.22 2.68 0.590 1647.12
Sand 20-ton truck 192 15 0.29 2.68 0.777 4480.68
Aluminum 8-ton truck 1 35 0.22 2.68 0.590 23.06
Ceramic tiles 8-ton truck 8 30 0.17 2.68 0.456 229.02
Paint 8-ton truck 1 25 0.09 2.68 0.241 12.69
Total 44,194.24
Note: No. of trips = (Material quantity/Truck capacity) and (f(t,i) = Mileage � Fuel factor)
Table 4 Carbon emissions in construction
Activity Energy use rate Quantity of work Amount of fuel/Electricity Carbon emissions/(kg CO2)
Earthworks 3.53 L$m–3 3927.00 m3 13,862.31 L 37,150.99
Pouring and lifting concrete 0.77 L$m–3 3075.75 m3 2368.33 L 6347.12
Concrete compaction 0.21 L$m–3 3075.75 m3 645.91 L 1731.04
Rebar and reinforcing 2 kWh$MT–1 666.00 MT 1332.00 kWh 918.55
Lifting of materials-tower crane 10 kWh$MT–1 2566.92 MT 25,669.20 kWh 17,701.48
Lifting of materials-hoist 3.1 kWh$MT–1 4477.61 MT 13,880.59 kWh 9572.05
Site lighting 26 kWh$m–2 1101.68 m2 28,643.68 kWh 19,752.68
Total 93,173.91
Note: aValues of energy use rates are extracted from studies (Pinky Devi and Palaniappan, 2014; Sim et al., 2016).
Table 5 Summary of building life cycle carbon emissions
Life cycle phase Sub-phase Carbon emission/(kg CO2) Carbon emission/%
Material production Material production 3,026,376.31 31.59
Transportation Transportation 44,194.24 0.46
Construction Construction 93,173.91 0.97
Operation and maintenance Operation 6,057,239.59 63.22
Maintenance 271,187.89 2.83
Demolition Demolition 77,963.25 0.81
Transportation 6177.15 0.06
Landfill 4254.31 0.04
Total 9,580,566.58
388 Front. Eng. Manag. 2018, 5(3): 381–393
tion stage, previous literature was referred (Roh et al.,2014b; Zhang and Wang, 2015) due to the lack ofdemolition data of Sri Lankan buildings. Only buildingdemolition, transportation of the demolished material anddisposal to landfill were considered in determining carbonemissions in the demolition phase. Recycling of construc-tion waste was excluded from the study due to the lack ofreliable data. The total carbon emissions from thedemolition phase were estimated to be 88394.71 kg CO2.The carbon emission per unit floor area was 14.81 kg$m–2
CO2. Of the total carbon emissions of this phase, buildingdemolition, transportation and landfill contributed 88.2%,7% and 4.8%, respectively.
3.6 Building Life cycle carbon emissions
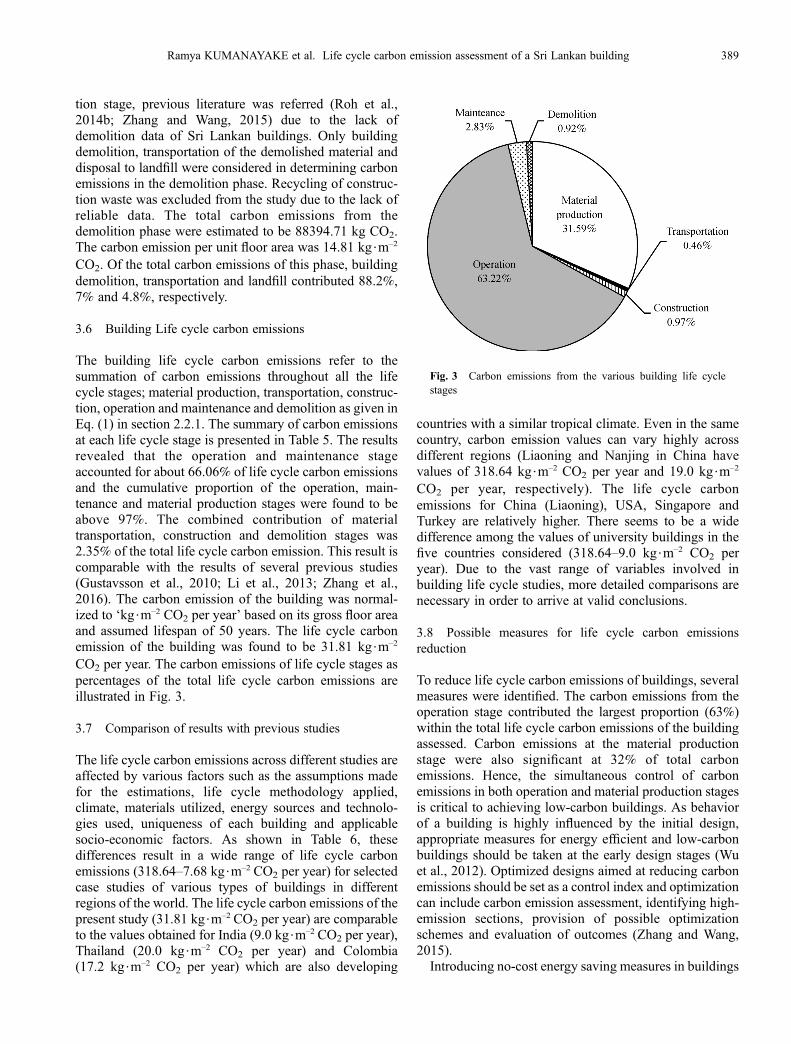
The building life cycle carbon emissions refer to thesummation of carbon emissions throughout all the lifecycle stages; material production, transportation, construc-tion, operation and maintenance and demolition as given inEq. (1) in section 2.2.1. The summary of carbon emissionsat each life cycle stage is presented in Table 5. The resultsrevealed that the operation and maintenance stageaccounted for about 66.06% of life cycle carbon emissionsand the cumulative proportion of the operation, main-tenance and material production stages were found to beabove 97%. The combined contribution of materialtransportation, construction and demolition stages was2.35% of the total life cycle carbon emission. This result iscomparable with the results of several previous studies(Gustavsson et al., 2010; Li et al., 2013; Zhang et al.,2016). The carbon emission of the building was normal-ized to ‘kg$m–2 CO2 per year’ based on its gross floor areaand assumed lifespan of 50 years. The life cycle carbonemission of the building was found to be 31.81 kg$m–2
CO2 per year. The carbon emissions of life cycle stages aspercentages of the total life cycle carbon emissions areillustrated in Fig. 3.
3.7 Comparison of results with previous studies
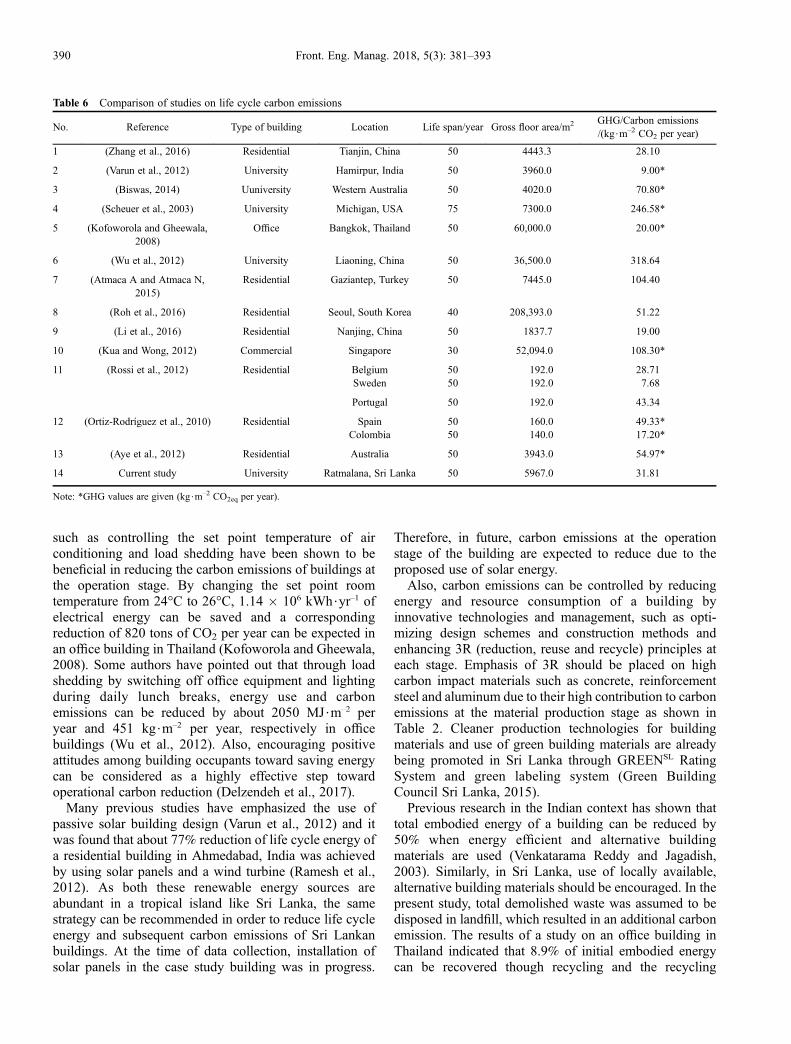
The life cycle carbon emissions across different studies areaffected by various factors such as the assumptions madefor the estimations, life cycle methodology applied,climate, materials utilized, energy sources and technolo-gies used, uniqueness of each building and applicablesocio-economic factors. As shown in Table 6, thesedifferences result in a wide range of life cycle carbonemissions (318.64–7.68 kg$m–2 CO2 per year) for selectedcase studies of various types of buildings in differentregions of the world. The life cycle carbon emissions of thepresent study (31.81 kg$m–2 CO2 per year) are comparableto the values obtained for India (9.0 kg$m–2 CO2 per year),Thailand (20.0 kg$m–2 CO2 per year) and Colombia(17.2 kg$m–2 CO2 per year) which are also developing
countries with a similar tropical climate. Even in the samecountry, carbon emission values can vary highly acrossdifferent regions (Liaoning and Nanjing in China havevalues of 318.64 kg$m–2 CO2 per year and 19.0 kg$m–2
CO2 per year, respectively). The life cycle carbonemissions for China (Liaoning), USA, Singapore andTurkey are relatively higher. There seems to be a widedifference among the values of university buildings in thefive countries considered (318.64–9.0 kg$m–2 CO2 peryear). Due to the vast range of variables involved inbuilding life cycle studies, more detailed comparisons arenecessary in order to arrive at valid conclusions.
3.8 Possible measures for life cycle carbon emissionsreduction
To reduce life cycle carbon emissions of buildings, severalmeasures were identified. The carbon emissions from theoperation stage contributed the largest proportion (63%)within the total life cycle carbon emissions of the buildingassessed. Carbon emissions at the material productionstage were also significant at 32% of total carbonemissions. Hence, the simultaneous control of carbonemissions in both operation and material production stagesis critical to achieving low-carbon buildings. As behaviorof a building is highly influenced by the initial design,appropriate measures for energy efficient and low-carbonbuildings should be taken at the early design stages (Wuet al., 2012). Optimized designs aimed at reducing carbonemissions should be set as a control index and optimizationcan include carbon emission assessment, identifying high-emission sections, provision of possible optimizationschemes and evaluation of outcomes (Zhang and Wang,2015).Introducing no-cost energy saving measures in buildings
Fig. 3 Carbon emissions from the various building life cyclestages
Ramya KUMANAYAKE et al. Life cycle carbon emission assessment of a Sri Lankan building 389
such as controlling the set point temperature of airconditioning and load shedding have been shown to bebeneficial in reducing the carbon emissions of buildings atthe operation stage. By changing the set point roomtemperature from 24°C to 26°C, 1.14 � 106 kWh$yr–1 ofelectrical energy can be saved and a correspondingreduction of 820 tons of CO2 per year can be expected inan office building in Thailand (Kofoworola and Gheewala,2008). Some authors have pointed out that through loadshedding by switching off office equipment and lightingduring daily lunch breaks, energy use and carbonemissions can be reduced by about 2050 MJ$m–2 peryear and 451 kg$m–2 per year, respectively in officebuildings (Wu et al., 2012). Also, encouraging positiveattitudes among building occupants toward saving energycan be considered as a highly effective step towardoperational carbon reduction (Delzendeh et al., 2017).Many previous studies have emphasized the use of
passive solar building design (Varun et al., 2012) and itwas found that about 77% reduction of life cycle energy ofa residential building in Ahmedabad, India was achievedby using solar panels and a wind turbine (Ramesh et al.,2012). As both these renewable energy sources areabundant in a tropical island like Sri Lanka, the samestrategy can be recommended in order to reduce life cycleenergy and subsequent carbon emissions of Sri Lankanbuildings. At the time of data collection, installation ofsolar panels in the case study building was in progress.
Therefore, in future, carbon emissions at the operationstage of the building are expected to reduce due to theproposed use of solar energy.Also, carbon emissions can be controlled by reducing
energy and resource consumption of a building byinnovative technologies and management, such as opti-mizing design schemes and construction methods andenhancing 3R (reduction, reuse and recycle) principles ateach stage. Emphasis of 3R should be placed on highcarbon impact materials such as concrete, reinforcementsteel and aluminum due to their high contribution to carbonemissions at the material production stage as shown inTable 2. Cleaner production technologies for buildingmaterials and use of green building materials are alreadybeing promoted in Sri Lanka through GREENSL RatingSystem and green labeling system (Green BuildingCouncil Sri Lanka, 2015).Previous research in the Indian context has shown that
total embodied energy of a building can be reduced by50% when energy efficient and alternative buildingmaterials are used (Venkatarama Reddy and Jagadish,2003). Similarly, in Sri Lanka, use of locally available,alternative building materials should be encouraged. In thepresent study, total demolished waste was assumed to bedisposed in landfill, which resulted in an additional carbonemission. The results of a study on an office building inThailand indicated that 8.9% of initial embodied energycan be recovered though recycling and the recycling
Table 6 Comparison of studies on life cycle carbon emissions
No. Reference Type of building Location Life span/year Gross floor area/m2 GHG/Carbon emissions/(kg$m–2 CO2 per year)
1 (Zhang et al., 2016) Residential Tianjin, China 50 4443.3 28.10
2 (Varun et al., 2012) University Hamirpur, India 50 3960.0 9.00*
3 (Biswas, 2014) Uuniversity Western Australia 50 4020.0 70.80*
4 (Scheuer et al., 2003) University Michigan, USA 75 7300.0 246.58*
5 (Kofoworola and Gheewala,2008)
Office Bangkok, Thailand 50 60,000.0 20.00*
6 (Wu et al., 2012) University Liaoning, China 50 36,500.0 318.64
7 (Atmaca A and Atmaca N,2015)
Residential Gaziantep, Turkey 50 7445.0 104.40
8 (Roh et al., 2016) Residential Seoul, South Korea 40 208,393.0 51.22
9 (Li et al., 2016) Residential Nanjing, China 50 1837.7 19.00
10 (Kua and Wong, 2012) Commercial Singapore 30 52,094.0 108.30*
11 (Rossi et al., 2012) Residential BelgiumSweden
5050
192.0192.0
28.717.68
Portugal 50 192.0 43.34
12 (Ortiz-Rodríguez et al., 2010) Residential SpainColombia
5050
160.0140.0
49.33*17.20*
13 (Aye et al., 2012) Residential Australia 50 3943.0 54.97*
14 Current study University Ratmalana, Sri Lanka 50 5967.0 31.81
Note: *GHG values are given (kg$m–2 CO2eq per year).
390 Front. Eng. Manag. 2018, 5(3): 381–393
potential is about 1.5% of the total energy use of thebuilding (Kofoworola and Gheewala, 2009). The analysisof a residential building in Italy provided further evidenceof recycling potential of 29% and 18% in terms of lifecycle energy and GHG emissions respectively (Blengini,2009). Sri Lanka can also benefit by introducing recyclingprocesses in the construction waste disposal.
4 Conclusions
The building life cycle carbon emission study presentedwas based on a university building in the suburbs ofColombo, Sri Lanka. The entire life cycle of a building;material production, transportation, construction, opera-tion, maintenance and demolition was considered in aprocess-based study in which the existing LCA methodol-ogy for estimation of building life cycle carbon emissionswas modified for the Sri Lankan context. The proposedmethodology was applied to a multi-storey reinforcedconcrete university building located in Ratmalana, SriLanka. With an assumed building life span of 50 years, lifecycle carbon emissions per unit gross floor area wereestimated to be 31.81 kg$m–2 CO2 per year. The results ofthis study were compared with previous studies based indifferent regions of the world as well as referring todifferent types of buildings. The values for life cyclecarbon emissions obtained in the present study arecomparable with those of other developing and tropicalcountries such as India, Thailand and Colombia. Due to awide range of diverse factors, building life cycle carbonemissions vary highly between different studies.Carbon emissions were found to be the highest in the
operation phase, contributing to 63.22% of the total carbonemissions. Concrete and steel reinforcement were found tobe the most significant materials contributing to 62% of thetotal carbon emissions at the material production stage.Clay bricks and cement used for brick masonry sharedabout 27% of the carbon emissions. In reducing embodiedcarbon emissions, two types of materials were identified assignificant; materials used in mass quantity such asconcrete and materials with high embodied carboncoefficient value such as aluminum. Both types areimportant in identifying carbon emissions reductionstrategies for the material production stage. Reduction,reuse and recycling of materials, use of alternativematerials which are available locally as well as introducingclean manufacturing technologies are expected to enhancethe possibility of carbon emission reduction at the materialproduction stage.As evidenced by the study, life cycle carbon emissions
are mainly attributable to the operation stage of thebuilding. This strongly correlates with the operationalenergy requirement of the building. Significant reductionof carbon emissions can be achieved by the practice ofsimple, no-cost energy conservation measures such as
using the building’s air conditioning system at anappropriate set point temperature and the practice of loadshedding. Also, encouraging positive attitudes towardenergy saving among the building users is important inreducing building carbon emissions. The use of renewableenergy sources such as solar and wind power to produceenergy for building operation was also proved to have abeneficial effect in reducing building carbon emission.Incorporation of environmental LCA into the currentbuilding code and building certification systems is alsoproposed. Although material transportation, constructionand demolition only contributed to 2.35% of the total lifecycle carbon emission they also present possibilities ofcarbon emission reduction. As recycling of constructionwaste is currently not practiced much in Sri Lanka andthere is a lack of reliable data on recycling, the presentstudy assumed that all demolished materials were disposedto landfill. By increasing the share of recycling as a methodof construction waste disposal, carbon emission at thedemolition stage can be reduced significantly.As no previous building life cycle carbon emission
studies exist in the literature for Sri Lanka, or life cycledata inventories in the specific context of the country, themain challenge in conducting the study was the difficultyin accessing appropriate data for some life cycle stagessuch as material production, maintenance, demolition andrecycling. Due to the unavailability of country-specificdata inventories at present, international databases andprevious literature were referred in identifying appropriatedata for the study. The development of country-specificdata inventories is necessary for ensuring the reliability andaccuracy of building life cycle carbon emission studies inthe future. To have a better understanding of the life cyclecarbon emissions of Sri Lankan buildings, future studiesshould extend to different areas of the country andencompass different types of buildings. This study laidthe much needed groundwork for future building life cyclecarbon emission assessments and presented a methodologythat can be used by building planners, designers, ownersand certification bodies to assess life cycle carbonemissions of Sri Lankan buildings, which is essential inorder to form strategies for carbon mitigation and topromote low-carbon buildings in Sri Lanka.
Acknowledgements The authors gratefully acknowledge the authorities ofthe General Sir John Kotelawala Defense University, Sri Lanka and theCentral Engineering Consultancy Bureau (CECB), Sri Lanka for providingthe valuable information needed for this research work.
References
Abeysundara U G Y, Babel S, Gheewala S H (2009). A matrix in life
cycle perspective for selecting sustainable materials for buildings in
Sri Lanka. Building and Environment, 44(5): 997–1004
Abeysundra U G Y, Babel S, Gheewala S (2007). A decision making
Ramya KUMANAYAKE et al. Life cycle carbon emission assessment of a Sri Lankan building 391
matrix with life cycle perspective of materials for roofs in Sri Lanka.
Materials & Design, 28(9): 2478–2487
Asif M, Muneer T, Kelley R (2007). Life cycle assessment: A case study
of a dwelling home in Scotland. Building and Environment, 42(3):
1391–1394
Atmaca A, Atmaca N (2015). Life cycle energy (LCEA) and carbon
dioxide emissions (LCCO2A) assessment of two residential build-
ings in Gaziantep, Turkey. Energy and Building, 102: 417–431
Aye L, Ngo T, Crawford R H, Gammampila R, Mendis P (2012). Life
cycle greenhouse gas emissions and energy analysis of prefabricated
reusable building modules. Energy and Building, 47: 159–168
Biswas W K (2014). Carbon footprint and embodied energy assessment
of building construction works in Western Australia. International
Journal of Sustainable Built Environment, 3(2): 179–186
Blengini G A (2009). Life cycle of buildings, demolition and recycling
potential: A case study in Turin, Italy. Building and Environment, 44
(2): 319–330
Chau C K, Leung T M, Ng W Y (2015). A review on life cycle
assessment, life cycle energy assessment and life cycle carbon
emissions assessment on buildings. Applied Energy, 143(1): 395–
413
Chau C K, Yik F W H, Hui W K, Liu H C, Yu H K (2007).
Environmental impacts of building materials and building services
components for commercial buildings in Hong Kong. Journal of
Cleaner Production, 15(18): 1840–1851
Chiraratananon S, Hien V D (2011). Thermal performance and cost
effectiveness of massive walls under thai climate. Energy and
Building, 43(7): 1655–1662
Chiraratananon S, Hien V D, Tummu P (2012). Thermal performance
and cost effectiveness of wall insulation under Thai climate. Energy
and Building, 45: 82–90
Delzendeh E, Wu S, Lee A, Zhou Y (2017). The impact of occupants’
behaviours on building energy analysis: A research review. Renew-
able & Sustainable Energy Reviews, 80: 1061–1071
Department of Census and Statistics Sri Lanka 2013 (2015). Survey of
Construction Industries
Dias W P S, Pooliyadda S P (2004). Quality based energy contents and
carbon coefficients for building materials: A systems approach.
Energy, 29(4): 561–580
Dimoudi A, Tompa C (2008). Energy and environmental indicators
related to construction of office buildings. Resources, Conservation
and Recycling, 53(1–2): 86–95
González M J, García Navarro J (2006). Assessment of the decrease of
CO2 emissions in the construction field through the selection of
materials: Practical case study of three houses of low environmental
impact. Building and Environment, 41(7): 902–909
Green Building Council Sri Lanka (2015). Green labelling. Sri Lanka
website, Accessed September 20, 2017
Gustavsson L, Joelsson A, Sathre R (2010). Life cycle primary energy
use and carbon emission of an eight-storey wood-framed apartment
building. Energy and Building, 42(2): 230–242
Hong J, Shen G Q, Feng Y, Lau W S, Mao C (2015). Greenhouse gas
emissions during the construction phase of a building: A case study in
China. Journal of Cleaner Production, 103: 249–59
Intergovernmental Panel on Climate Change (2007). Climate Change
2007: Synthesis Report. Contribution of Working Groups I, II and III
to the Forth Assessment Report of the Intergovernmental Panel on
Climate Change, Core Writing Team, Pachauri, R K and Reisinger, A
(eds.). IPCC, Geneva, Switzerland
International Energy Agency (2015). IEA Statistics: CO2 Emissions
from Fuel Combustion
International Organization for Standardization (1997). ISO 14040-
Environmental management- Life Cycle Assessment- Principles and
Framework
Jeong Y S, Lee S E, Huh J H (2012). Estimation of CO2 emission of
apartment buildings due to major construction materials in the
Republic of Korea. Energy and Building, 49: 437–442
Kim S, Lee S, Na Y J, Kim J T (2013). Conceptual model for LCC-based
LCCO2 analysis of apartment buildings. Energy and Building, 64:
285–291
Kofoworola O F, Gheewala S H (2008). Environmental life cycle
assessment of a commercial office building in Thailand. International
Journal of Life Cycle Assessment, 13(6): 498–511
Kofoworola O F, Gheewala S H (2009). Life cycle energy assessment of
a typical office building in Thailand. Energy and Building, 41(10):
1076–1083
Korea LCI DB Information Network (2017). CFP/EPD website,
Accessed May 29, 2017
Kua H W, Wong C L (2012). Analysing the life cycle greenhouse gas
emission and energy consumption of a multi-storied commercial
building in Singapore from an extended system boundary perspec-
tive. Energy and Building, 51: 6–14
Li D, Cui P, Lu Y (2016). Development of an automated estimator of
life-cycle carbon emissions for residential buildings: A case study in
Nanjing, China. Habitat International, 57: 154–163
Li D Z, Chen H X, Hui E C M, Zhang J B, Li Q M (2013). A
methodology for estimating the life-cycle carbon efficiency of a
residential building. Building and Environment, 59: 448–455
Luo Z, Yang L, Liu J (2015). Embodied carbon emissions of office
building: A case study of China’s 78 office buildings. Building and
Environment, 95: 365–371
Monahan J, Powell J C (2011). An embodied carbon and energy analysis
of modern methods of construction in housing: A case study using a
lifecycle assessment framework. Energy and Building, 43(1): 179–
188
Ortiz-Rodríguez O, Castells F, Sonnemann G (2010). Life cycle
assessment of two dwellings: One in Spain, a developed country,
and one in Colombia, a country under development. Science of the
Total Environment, 408(12): 2435–2443
Pacheco-Torres R, Jadraque E, Roldán-Fontana J, Ordóñez J (2014).
Analysis of CO2 emissions in the construction phase of single-family
detached houses. Sustainable Cities and Society, 12: 63–68
Paulsen J S, Sposto R M (2013). A life cycle energy analysis of social
housing in Brazil: Case study for the program “MY HOUSE MY
LIFE”. Energy and Building, 57: 95–102
Pinky Devi L, Palaniappan S (2014). A case study on life cycle energy
use of residential building in Southern India. Energy and Building,
80: 247–259
Ramesh T, Prakash R, Shukla K K (2010). Life cycle energy analysis
of buildings: An overview. Energy and Building, 42(10): 1592–
1600
Ramesh T, Prakash R, Shukla K K (2012). Life cycle approach in
392 Front. Eng. Manag. 2018, 5(3): 381–393
evaluating energy performance of residential buildings in Indian
context. Energy and Building, 54: 259–265
Roh S, Tae S (2016). Building simplified life cycle CO2 emissions
assessment tool (B-SCAT) to support low-carbon building design in
South Korea. Sustainability, 8(6): 567
Roh S, Tae S, Shin S (2014a). Development of building materials
embodied greenhouse gases assessment criteria and system (BEGAS)
in the newly revised Korea Green Building Certification System (G-
SEED). Renewable & Sustainable Energy Reviews, 35: 410–421
Roh S, Tae S, Shin S, Woo J (2014b). Development of an optimum
design program (SUSB-OPTIMUM) for the life cycle CO2 assess-
ment of an apartment house in Korea. Building and Environment, 73:
40–54
Roh S, Tae S, Suk S J, Ford G, Shin S (2016). Development of a building
life cycle carbon emissions assessment program (BEGAS 2.0) for
Korea’s green building index certification system. Renewable &
Sustainable Energy Reviews, 53: 954–965
Rossi B, Marique A F, Reiter S (2012). Life-cycle assessment of
residential buildings in three different European locations, case study.
Building and Environment, 51: 402–407
Ruuska A (2013). Role of embodied energy, operational energy and
related greenhouse gas emission of buildings in the context of
developing tropical countries. In SB13 Singapore-Realising Sustain-
ability in Tropics, 205–11
Scheuer C, Keoleian G A, Reppe P (2003). Life cycle energy and
environmental performance of a new university building: Modeling
challenges and design implications. Energy and Building, 35(10):
1049–1064
Shukla A, Tiwari G N, Sodha M S (2009). Embodied energy analysis of
adobe house. Renewable Energy, 34(3): 755–761
Sim J, Sim J, Park C (2016). The air emission assessment of a South
Korean apartment building’s life cycle, along with environmental
impact. Building and Environment, 95: 104–115
Sri Lanka Sustainable Energy Authority (2015). Sri Lanka Energy
Balance 2015—An analysis of energy sector performance
Tae S, Shin S, Woo J, Roh S (2011). The development of apartment
house life cycle CO2 simple assessment system using standard
apartment houses of South Korea. Renewable & Sustainable Energy
Reviews, 15(3): 1454–1467
United Nations Environment Programme (2010). Common Carbon
Metric: Protocol for Measuring Energy Use and Reporting Green-
house Gas Emissions from Building Operations
University of Bath UK (2011). Inventory of Carbon and Energy (ICE)
Version 2
Varun S A, Sharma A, Shree V, Nautiyal H (2012). Life cycle
environmental assessment of an educational building in Northern
India: A case study. Sustainable Cities and Society, 4(1): 22–28
Venkatarama Reddy B V, Jagadish K S (2003). Embodied energy of
common and alternative building materials and technologies. Energy
and Building, 35(2): 129–137
Wen T J, Siong H C, Noor Z Z (2015). Assessment of embodied energy
and global warming potential of building construction using life cycle
analysis approach: Case studies of residential buildings in Iskandar
Malaysia. Energy and Building, 93: 295–302
Wu H J, Yuan ZW, Zhang L, Bi J (2012). Life cycle energy consumption
and CO2 emission of an office building in China. International
Journal of Life Cycle Assessment, 17(2): 105–118
Zhang X, Wang F (2015). Life-cycle assessment and control measures
for carbon emissions of typical buildings in China. Building and
Environment, 86: 89–97
Zhang Y, Zheng X, Zhang H, Chen G, Wang X (2016). Carbon emission
analysis of a residential building in China through life cycle
assessment. Frontiers of Environmental Science & Engineering, 10
(1): 150–158
Ramya KUMANAYAKE et al. Life cycle carbon emission assessment of a Sri Lankan building 393