Embed Size (px)
Citation preview
Research ArticleQuantitative Analysis and Fingerprint Profilesfor Quality Control of Fructus Schisandrae by GasChromatography: Mass Spectrometry
Yong-Gang Xia, Bing-You Yang, Jun Liang, Qi Yang, Di Wang, and Hai-Xue Kuang
Key Laboratory of ChineseMateriaMedica, HeilongjiangUniversity of ChineseMedicine,Ministry of Education, Harbin 150040, China
Correspondence should be addressed to Hai-Xue Kuang; [email protected]
Received 12 August 2013; Accepted 27 October 2013; Published 12 January 2014
Academic Editors: A. D’Ulivo, V. C. Filho, and A. Khedr
Copyright © 2014 Yong-Gang Xia et al.This is an open access article distributed under the Creative Commons Attribution License,which permits unrestricted use, distribution, and reproduction in any medium, provided the original work is properly cited.
This paper describes a simple, rapid, and effective quality assessment method for Fructus Schisandrae by gas chromatography-massspectrum (GC-MS). The method was established by using specific lignan fingerprint profiles and quantitation of characteristiccompounds in this herbal medicine. The GC-MS fingerprints of 15 batches of Schisandra samples from different regions of Chinashowed similar lignan profiles. Five peaks were selected as characteristic peaks, and all of these were identified by using GC-MStechniques. The relative retention times of these characteristic peaks in the GC-MS fingerprint were established as an importantparameter for identification of Schisandra samples. Meanwhile, relative peak areas may be a feasible approach to discriminate theS. chinensis and S. sphenanthera. Finally, these pharmacologically active constituents in the titled plant, schisandrins A–C andschizandrols A and B, were quantitatively determined using a validated GC-MS method.
1. Introduction
Traditional Chinese Medicines (TCMs) have made greatcontribution to the health of Chinese people for thousandsof years due to its special clinical efficacy [1]. Gradually,TCMs have been attracting interest and acceptance in manywestern countries. This may be primarily because of thegeneral belief that herbal drugs are without any side effectbesides being cheap and locally available [2]. However, thequality of TCMs had an important influence on its clinicalefficacy due to their different species, harvest season, storage,and geographic origins [3]. Therefore, quality control ofTCMs is becoming extremely urgent. There is no denyingthe fact that multicomponents of TCMs are responsible forthe therapeutic effects by the multipath-assisted multitargetapproach. Therefore, in recent years, there is an increasingtrend to establish multicomponents analysis for the effectivequality control of TCMs [4–6].
Fructus Schisandrae, the ripe fruits of Schisandrasphenanthera Rehd. et Wils and S. chinensis (Turcz.)(Schisandraceae), is one of the most famous TCMs and hasbeen widely used for thousands of years in China. Since
the 2000 edition of Chinese Pharmacopoeia, the fruits ofS. sphenanthera and S. chinensis have been accepted as twodifferent crude drugs, “Nan-wuweizi” (Fructus SchisandraeSphenanthera) and “Bei-wuweizi” (Fructus SchisandraeChinensis) [7], which distributed in the southern provinces(Shanxi, Shaanxi, Gansu, Shandong, Jiangsu, etc.) andnorthern provinces of China (Heilongjiang, Jilin, Liaoning,Neimenggu, etc.), respectively. Wuweizi has been utilized asa sedative and tonic to treat various diseases such as chroniccough and dyspnea, nocturnal emission, spermatorrhea,enuresis, and frequent urination and could also be usedas flavouring agent of foods [8]. Moreover, many Chinesemedicinal preparations containing Wuweizi or its extractare widely used in China, such as “Hugan tablet,” “Jiangtangpills,” “Compound Schisandra Syrup,” “Shenqi Wuweizitablet,” and “Shengmaiyin,” [9, 10].
Modern pharmacological research has demonstrated thatmost of the biological actions and the pharmacological effectsof Wuweizi can be attributed to its dibenzocyclooctadiene-type lignans, which have been elucidated to play an impor-tant role in antioxidant, anti-inflammatory, anxiolytic effect,protective hepatic injury, acetylcholinesterase inhibitory
Hindawi Publishing Corporatione Scientific World JournalVolume 2014, Article ID 806759, 8 pageshttp://dx.doi.org/10.1155/2014/806759
2 The Scientific World Journal
O
O
O
O
O
O1
O
O
O
O
OO
2
OO
O
O
OO
3
O
O
O
O
O
O
OH
4
O
O
O
O
OO
OH
5
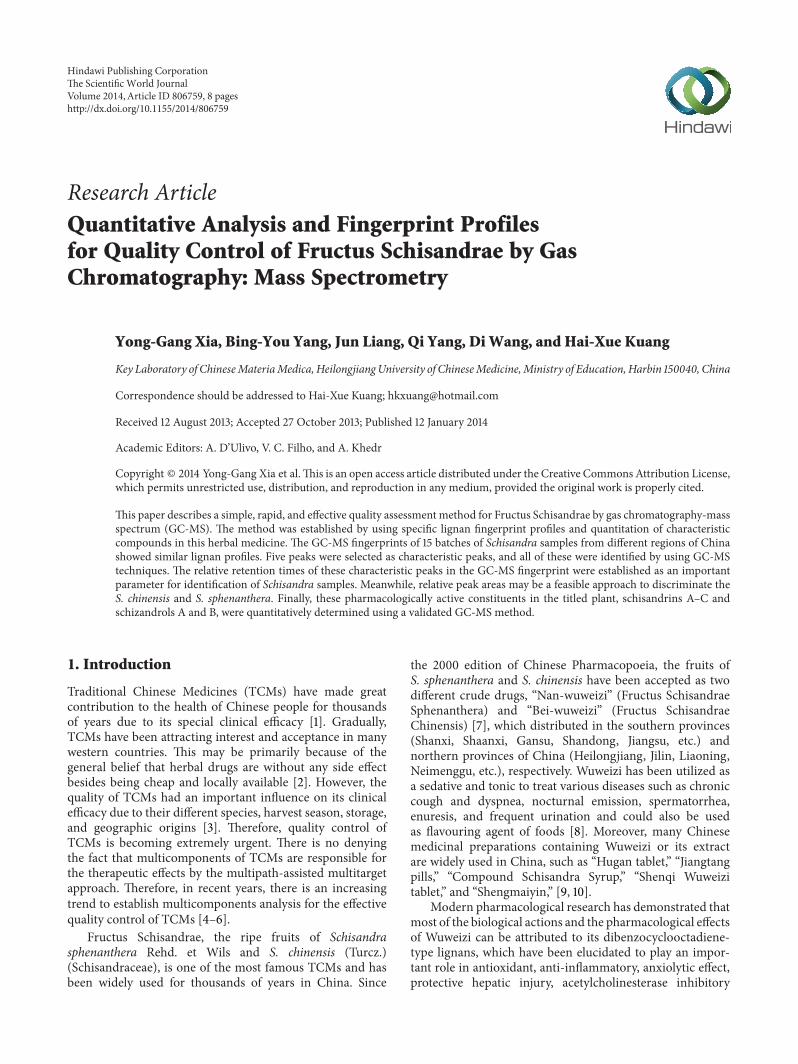
Figure 1: Structures of schisandrin A (1), schisandrin B (2), schisandrin C (3), schisandrol A (4), and schisandrol B (5).
effect, and stimulation of the carbohydrate-phosphorusmetabolism, and so forth [8, 11–14]. Thus, quantitative analy-sis ofmultiple-lignans in Fructus Schisandrae is very essentialto control its quality. In terms of quantitative analysis ofS. sphenanthera and S. chinensis, many analytical methodshave been reported for the determinations of lignans, includ-ing HPLC with UV detection, HPLC with mass spectrum(HPLC-MS), and capillary electrophoresis (CE) [9, 15–20].Despite the fact that HPLC and CE coupled with UV detectorare very useful for the determination of lignans in Schisan-dra sample, they are powerless to be used for identifyingconstituents. Additionally, HPLC-MS instruments are stillinaccessible for most of laboratories worldwide.
Though gas chromatography-mass spectrometry (GC-MS) is commonly used to determine the volatile componentsof herb medicines, it has been successfully applied to detectsome thermally stable lignans in essential oil fractions of S.chinensis with supercritical fluid extraction [21–23]. More-over, as far as our knowledge, there are no reports of the appli-cation of GC-MS in assays dedicated to study quality controlof S. chinensis and S. sphenanthera by lignan chromatographyprofiles. To establish an improved quality assessment methodfor Fructus Schisandrae, such a fundamental truth promotesour interests and encourages us to consider applying GC-MSfingerprint profiles combined with quantification of multi-ingredients for quality evaluation of Fructus Schisandrae.Due to the powerful separation efficiency and the sensitivedetection,GC-MShas become a popular and useful analyticaltool in the research field of herbal medicines [24].
In the present study, GC-MS fingerprint profiles can pro-vide sufficient qualitative information for the identificationand authentication of Fructus Schisandrae by ultrasound-assisted extraction (UAE). Five active components, namely,
schisandrins A–C (1–3) and schizandrols A and B (4 and5), which were the major chemical constituents in thefingerprint with known biological activities, were selected forsimultaneous quantification. The newly established methodwas utilized to analyze 15 samples collected from differentregions of China. The development of this new simple andfast methodology for Schisandra lignan analysis providesa valuable tool to evaluate quality of traditional Chinesemedicine Wuweizi.
2. Experimental
2.1. Chemicals and Materials. Standards of schisandrin A (1),schisandrin B (2), schisandrin C (3), schisandrol A (4), andschisandrol B (5) were purchased from the Chengdu JSMTBiotechnology Co. Ltd. (Chengdu, China). Their structurescan be seen in Figure 1. Samples 1–4 were collected onSeptember 2010 as rawmaterials fromDaxinganling District,Heilongjiang, China. Sample 5 was collected on October2011 from medical botany park of Heilongjiang University ofChineseMedicine. Samples 6–8 were collected on September2010 as raw materials from Fangzhen, Raohe, and Qitaihedistricts, Heilongjiang province, China. Samples 9–15 werecollected as decoction pieces on December 2010 formHarbinmedical market. Detailed description of samples was listed inTable 4. HPLC grade methanol (MeOH) was purchased fromDikama Technology Corporation (Richmond Hill, USA). Allother reagents were of analytical grade.
2.2. GC-MS Apparatus and Conditions. The analyses wereperformed using an Agilent 7890A–5975C instrumentequipped with a DB-17 fused-silica capillary column (60m ×0.25mm × 0.25 um) and an Agilent 5975C MS detector. One
The Scientific World Journal 3
microlitre of the sample was injected into GC-MS using splitmode (5 : 1). The purge flow was 1.2mL/min. The injectortemperature was 250∘C. The operation was performed ata column temperature program from 120∘C to 250∘C at10∘C/min, then increasing to 280∘C at 5∘C/min and finallyholding for 30min at 280∘C. All data were obtained bycollecting the full-scan mass spectra within the scan range of40–600 amu.
2.3. Preparation of Sample Solutions. The dried powdersof Schisandra samples (0.25 g, 60mesh) were accuratelyweighed and extracted by ultrasonic with 10mL methanolsolution for 40min at 60∘C and 70 kHz under ultrasonicirradiation. Then, the resultant mixture was adjusted to theoriginal weight with methanol and the supernatant wasfiltered through 0.22 𝜇mmembrane before GC-MS analysis.
2.4. Method Validation. A methanol stock solution contain-ing all 5 reference standards was prepared by dissolving thereference standards in methanol to a final concentrationof 0.40mg/mL for each reference standard, then dilutedthe mixture stock solution to appropriate concentration toestablish calibration curves. Each calibration curve concen-tration was performed in triplicate. All calibration curveswere constructed from one ten thousandth of peak areas ofreference standards (𝐴 × 10−4) versus their concentrations(𝑐, mg/mL). The lowest concentration of working solutionwas diluted with methanol to yield a series of appropriateconcentrations, and the LOD and LOQ under the chromato-graphic conditions were separately determined at an 𝑆/𝑁of 3 and 10, respectively. The measurement of intra- andinterday variability was utilized to determine the precisionof this newly developed method. The intraday variation wasdetermined by analyzing the same mixed standard methanolsolution for six times within 1 day. While for interdayvariability test, the solution was examined in triplicate for 3consecutive days.
3. Results and Discussion
3.1. Optimization of Sample Extraction Conditions. In orderto obtain quantitative extraction, UAE was optimized withmethanol as an extract solvent. Ultrasonic technique is beingused widely in analytical chemistry, facilitating different stepsin the analytical process, particularly in sample preparation.UAE is an expeditious, inexpensive, and efficient alterna-tive to traditional extraction techniques [25]. The variablesinvolved in the procedure such as volume of methanol,extraction time, sonication frequency, and extraction temper-ature were investigated by using 0.25 g plant sample. Effects ofthe solvent volume (10; 20; 30; 40; 50mL) on the extractingyield were tested with different volumes of methanol andthe extraction for 15min at 40∘C and 60 kHz. The maximumyield was obtained at 10mL. Normally, the usage of largervolumeof solvent for extraction is able to obtain higher yields.However, this result was special, and the same circumstancewas found for ultrasound-assisted extraction of phillyrinfrom Forsythia suspensa [26].
Extraction time had a close relationship with extractionefficiency. In the assay, extraction efficiency in samples wascompared by sonication with 10mL of methanol at 40∘C and60 kHz for 10, 15, 20, 30, 40, and 50min, respectively. Theresults indicated that the highest extraction efficiency wasobtained by sonication for 40min in pure methanol. In thisstudy, effects of different temperatures (30, 40, 50, 60, and70∘C) and sonication frequencies (40, 50, 60, 70, and 80 kHz)on the extracting yield were also investigated. By comparingpeak areas of the five investigated components, it was foundthat, when 60∘C and 70 kHz was employed, the peak areas ofthe five investigated components reached the highest values.
From the above experiments, it was demonstrated thatthe most suitable UAE condition for lignans from FructusSchisandrae was 0.25 g plant sample with 10mL of methanoland the extraction for 40min at 60∘C and 70 kHz underultrasonic irradiation.
3.2. Optimization of GC-MS Conditions. Optimization ofGC-MS parameters was done through investigating theinfluence of the column, temperature program, and split ratioon the information content. Capillary columns OV-17, DB-17, and DB-5 were screened. DB-17 column showed higherresolution and shorter analysis time than those obtained onthe other two columns. Temperature program and split ratiowere also studies. Finally, the optimized GC-MS analysiscondition was developed for specific analysis of lignansin Fructus Schisandrae, as stated in instrumentation andconditions section above.
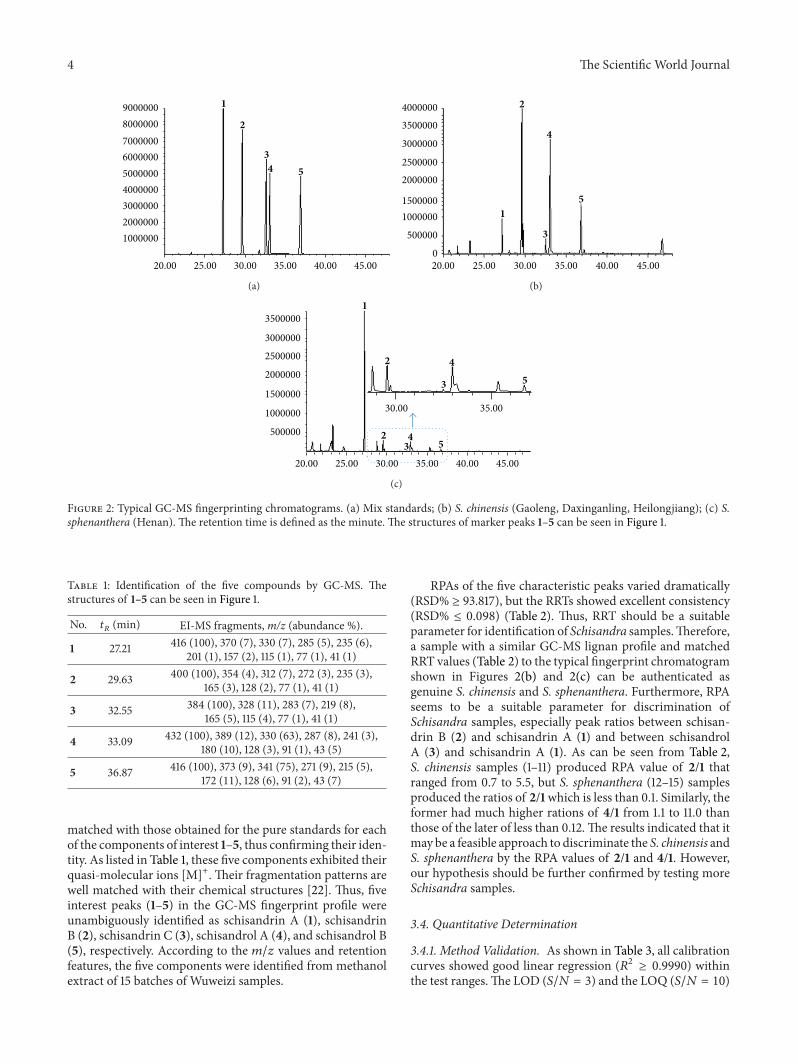
3.3. GC-MS Fingerprint Identification and Discrimination.Though a number of lignan constituents have to be deriva-tization for detection by GC-MS [27, 28], some specificdibenzocyclooctadiene-type lignans in Fructus Schisandraewere directly detected by GC-MS without derivatization.Figure 2 showed three typical fingerprint profiles of standardsS. chinensis and S. sphenanthera under the optimized UAEand GC-MS conditions. There are many terpenes and fattyacid derivatives inWuweizi samples before 20minutes, whichwere in agreement with previous studies [21]. However,at present study, we focused on lignan components forseparation and detection.
The GC-MS fingerprint profiles of 15 batches of sam-ples were obtained from different regions of China. Thesesamples showed similar lignan profiles after 20 minutes. Bycarefully analyzing the fingerprint profiles of these samples,five interest peaks were selected as characteristic peaks for theidentification of the crude drugs originating from S. chinensisand S. sphenanthera. Peak 1 was selected as the markerpeak due to acceptable heights and good resolution. Relativeretention times (RRTs) and relative peak areas (RPAs) of thefive characteristic peaks were calculated as follows: RRT =retention time of characteristic peak/retention time ofmarkerpeak, and RPA= peak area of characteristic peak/peak area ofmarker peak.
GC-MS was further used to identify the chemical con-stituents of the Schisandra lignans. Table 1 lists the retentiontimes (𝑡
𝑅) andMSdata of five interest peaks.Themass spectra
4 The Scientific World Journal
900000080000007000000600000050000004000000300000020000001000000
1
2
34 5
20.00 25.00 30.00 35.00 40.00 45.00
(a)
40000003500000
3000000
25000002000000
15000001000000
500000
0
1
2
3
4
5
20.00 25.00 30.00 35.00 40.00 45.00
(b)
3500000
3000000
2500000
2000000
1500000
1000000
500000
1
2
2
3
3
4
4
5
5
30.00 35.00
20.00 25.00 30.00 35.00 40.00 45.00
(c)
Figure 2: Typical GC-MS fingerprinting chromatograms. (a) Mix standards; (b) S. chinensis (Gaoleng, Daxinganling, Heilongjiang); (c) S.sphenanthera (Henan). The retention time is defined as the minute. The structures of marker peaks 1–5 can be seen in Figure 1.
Table 1: Identification of the five compounds by GC-MS. Thestructures of 1–5 can be seen in Figure 1.
No. 𝑡𝑅
(min) EI-MS fragments,m/z (abundance %).
1 27.21 416 (100), 370 (7), 330 (7), 285 (5), 235 (6),201 (1), 157 (2), 115 (1), 77 (1), 41 (1)
2 29.63 400 (100), 354 (4), 312 (7), 272 (3), 235 (3),165 (3), 128 (2), 77 (1), 41 (1)
3 32.55 384 (100), 328 (11), 283 (7), 219 (8),165 (5), 115 (4), 77 (1), 41 (1)
4 33.09 432 (100), 389 (12), 330 (63), 287 (8), 241 (3),180 (10), 128 (3), 91 (1), 43 (5)
5 36.87 416 (100), 373 (9), 341 (75), 271 (9), 215 (5),172 (11), 128 (6), 91 (2), 43 (7)
matched with those obtained for the pure standards for eachof the components of interest 1–5, thus confirming their iden-tity. As listed in Table 1, these five components exhibited theirquasi-molecular ions [M]+. Their fragmentation patterns arewell matched with their chemical structures [22]. Thus, fiveinterest peaks (1–5) in the GC-MS fingerprint profile wereunambiguously identified as schisandrin A (1), schisandrinB (2), schisandrin C (3), schisandrol A (4), and schisandrol B(5), respectively. According to the 𝑚/𝑧 values and retentionfeatures, the five components were identified from methanolextract of 15 batches of Wuweizi samples.
RPAs of the five characteristic peaks varied dramatically(RSD% ≥ 93.817), but the RRTs showed excellent consistency(RSD% ≤ 0.098) (Table 2). Thus, RRT should be a suitableparameter for identification of Schisandra samples.Therefore,a sample with a similar GC-MS lignan profile and matchedRRT values (Table 2) to the typical fingerprint chromatogramshown in Figures 2(b) and 2(c) can be authenticated asgenuine S. chinensis and S. sphenanthera. Furthermore, RPAseems to be a suitable parameter for discrimination ofSchisandra samples, especially peak ratios between schisan-drin B (2) and schisandrin A (1) and between schisandrolA (3) and schisandrin A (1). As can be seen from Table 2,S. chinensis samples (1–11) produced RPA value of 2/1 thatranged from 0.7 to 5.5, but S. sphenanthera (12–15) samplesproduced the ratios of 2/1which is less than 0.1. Similarly, theformer had much higher rations of 4/1 from 1.1 to 11.0 thanthose of the later of less than 0.12.The results indicated that itmay be a feasible approach to discriminate the S. chinensis andS. sphenanthera by the RPA values of 2/1 and 4/1. However,our hypothesis should be further confirmed by testing moreSchisandra samples.
3.4. Quantitative Determination
3.4.1. Method Validation. As shown in Table 3, all calibrationcurves showed good linear regression (𝑅2 ≥ 0.9990) withinthe test ranges.The LOD (𝑆/𝑁 = 3) and the LOQ (𝑆/𝑁 = 10)

The Scientific World Journal 5
Table 2: Relative retention times (RRTs) and relative peak areas (RPAs) of five characteristic peaks in GC-MS fingerprints of 15 batches ofSchisandra samples.
No. 1 2 3 4 5RRT RPA RRT RPA RRT RPA RRT RPA RRT RPA
1 1.000 1.000 1.089 5.488 1.196 0.548 1.216 5.584 1.355 2.5462 1.000 1.000 1.088 2.956 1.196 0.783 1.215 3.895 1.354 1.4073 1.000 1.000 1.087 3.078 1.196 0.938 1.216 10.368 1.355 4.8764 1.000 1.000 1.087 1.315 1.196 0.137 1.215 3.417 1.353 0.7255 1.000 1.000 1.087 0.956 1.195 0.059 1.215 1.711 1.352 0.2776 1.000 1.000 1.087 1.035 1.195 0.061 1.215 1.815 1.352 0.3427 1.000 1.000 1.088 3.716 1.196 0.653 1.215 3.995 1.354 1.8868 1.000 1.000 1.088 3.225 1.196 0.627 1.216 5.756 1.354 1.8599 1.000 1.000 1.088 3.704 1.196 0.447 1.216 11.037 1.355 5.04810 1.000 1.000 1.087 1.059 1.195 0.058 1.215 1.856 1.352 0.33211 1.000 1.000 1.087 0.721 1.195 0.087 1.214 1.135 1.352 0.32112 1.000 1.000 1.087 0.033 1.198 0.000 1.216 0.003 1.353 0.00013 1.000 1.000 1.086 0.065 1.197 0.027 1.216 0.105 1.357 0.02714 1.000 1.000 1.086 0.080 1.196 0.031 1.212 0.083 1.352 0.04615 1.000 1.000 1.085 0.038 1.196 0.007 1.214 0.039 1.353 0.003RSD% 0.00 0.00 0.092 93.817 0.063 110.860 0.098 104.506 0.098 128.425Note: numbers 1–11 are samples of S. chinensis and numbers 11–15 are samples of S. sphenanthera.The structures of 1–5 can be seen in Figure 1.
Table 3: Calibration parameters of GC-MS analysis for the 5 compounds. The structures of 1–5 can be seen in Figure 1.
No. Regression equations Linear range (𝜇g/mL) 𝑅2 LODs (𝜇g/mL) LOQs (𝜇g/mL)
1 𝑦 = 123574𝑥 + 1644.7 6.25–400.0 0.9990 0.05 0.152 𝑦 = 137292𝑥 + 879.15 6.25–400.0 0.9995 0.05 0.153 𝑦 = 110898𝑥 + 454.5 6.25–400.0 0.9997 0.063 0.1854 𝑦 = 90690𝑥 + 63.81 6.25–400.0 0.9994 0.063 0.1855 𝑦 = 110631𝑥 + 172.72 6.25–400.0 0.9991 0.063 0.185
were less than 0.063 and 0.185 𝜇g/mL for all analytes. Inmanycases of GC/MS analysis, the LOD could be greatly decreasedby adjusting the sample volume, the detection mode, such asscan or selected ionmonitoring, and the injectionmode [29].The intraday and interday precisions were less than 1.29%.A recovery study was performed to validate the accuracyof the developed method. Sample 2 (0.25 g) was spikedwith different levels (50, 100, and 150%) of known amountsof the compounds 1–5. The spiked samples were extractedwith 10mL methanol following the procedure for samplepreparation as described above.The recoverywas determinedby comparing the amount of analyte added to the sample andthe amount of analyte detected during GC-MS analysis. Asshown in Table 4, the developed analytical method providedgood accuracy with the recoveries from 96.36 to 105.42%,with RSDs of less than 2.14% for the analytes. Hence, thisverified GC-MS method was precise, accurate, and sensitivefor the quantitative evaluation of major active components inS. chinensis and S. sphenanthera.
3.4.2. Sample Analysis. A number of pharmacological activ-ities of these five components were previously reported[12–14, 30]. Qualitative and quantitative analysis of thesecharacteristic constituents could play an important role in
Table 4: Recovery experiment of analytical method for five compo-nents.
No. Original(mg)
Spiked(mg)
Found(mg)
Meanrecovery(%)
RSD (%)(𝑛 = 3)
1 0.1860.110 0.292 96.36 1.720.220 0.413 103.18 1.530.330 0.505 96.67 1.47
2 0.2250.173 0.407 105.20 2.140.346 0.573 100.58 1.630.519 0.755 102.12 1.27
3 0.1740.220 0.388 97.27 1.390.240 0.427 105.42 1.520.460 0.623 97.61 2.08
4 2.3262.320 4.756 104.74 1.584.640 6.916 98.92 1.336.960 9.176 98.42 1.79
5 0.8930.490 1.413 106.12 1.650.980 1.855 98.16 1.341.470 2.406 102.93 1.27
evaluating and controlling the quality of Schisandra sam-ples. The developed GC-MS method was then successfully

6 The Scientific World Journal
Table 5: The measurement results of marker compounds in S. chinensis and S. sphenanthera (mg/g). The structures of 1–5 can be seen inFigure 1.
No. Source Geographical regions 1 2 3 4 51 S. chinensis Tahe, Heilongjiang 0.709 0.626 0.971 6.270 1.9052 S. chinensis Gaoheng, Heilongjiang 0.744 0.899 0.695 9.305 3.5733 S. chinensis Huma, Heilongjiang 0.191 0.508 0.587 9.677 3.7184 S. chinensis Jiagedaqi, Heilongjiang 0.723 0.269 0.043 5.735 1.0005 S. chinensis Harbin, Heilongjiang 2.921 0.648 0.098 7.957 1.2956 S. chinensis Fangzhen, Heilongjiang 2.564 0.619 0.049 7.676 1.1397 S. chinensis Raohe, Heilongjiang 0.636 0.772 0.693 5.756 2.3358 S. chinensis Qitaihe, Heilongjiang 0.450 0.532 0.587 7.773 2.0829 S. chinensis Liaoning 0.213 0.520 0.229 10.589 3.96210 S. chinensis Neimeng 2.814 0.706 0.063 8.444 1.22911 S. chinensis Neimeng 1.576 0.081 0.058 3.347 0.74712 S. sphenanthera Shanxi 0.274 tr. 0.000 tr. 0.00013 S. sphenanthera Hubei 4.935 0.064 0.002 0.754 0.10314 S. sphenanthera Henan 4.319 0.099 0.001 0.423 0.18915 S. sphenanthera Sichuan 5.610 tr. tr. 0.799 0.170Note: tr. means trace amount with less than 0.001.
applied to simultaneously determine the five componentsin 15 batches of Schisandra samples obtained from differentspecies, geographic origin, and source.
The results showed that there were remarkable differencesin the contents of the five compounds in 15 batches ofSchisandra samples (Table 5). The total content of the fivelignans changed from 7.77 to 15.513mg/g which was foundin S. chinensis. However, the contents of these lignans wereless than 6.6mg/g in S. sphenanthera. Among the five lignans,the contents of schisandrol A and schisandrin B were higherin S. chinensis than those from S. sphenanthera. However,the contents of schisandrin A were higher in S. sphenantherathan those from S. chinensis, which were in agreement withprevious studies [31]. These variations might be on accountof the different species, plant origins, harvesting time, storageconditions, and so forth. The variation in contents of activecomponents may cause changes in clinical efficacy. So, ourresults further confirmed that it is reasonable to classify fruitsof S. sphenanthera and S. chinensis as two different crudedrugs since the 2000 edition of Chinese Pharmacopoeia [7].
This recognition can be further confirmed by principal-components projection analysis (PCA) using the contentsof the 5 characteristic compounds that were performed onthe analytical data of all 15 samples. Obviously, except forsample 12, other tested samples apparently form into twobig clusters according to different species, the S. chinensiscluster and S. sphenanthera cluster (Figure 3), indicating thata global chemical difference was present between the twospecies. However, within the same species, the clusteringwas not very closely packed and some individual sampleswere sparsely distributed.This also implies that plant origins,harvesting time, processing, and storage conditions will havean important influence on their qualities.
4. Conclusions
There is to date no reports for combining characteristic GC-MS fingerprint profiles with quantitation of multiple-lignans
REGR factor score 1 for analysis 12.000001.000000.00000−1.00000−2.00000
REG
R fa
ctor
scor
e 2 fo
r ana
lysis
12.00000
1.00000
0.00000
−1.00000
−2.00000
11
1413
15
12
4
1
105
6
27
8
39
Figure 3: Score plots from PCA. Numbers 1–11 are samples of S.chinensis and numbers 11–15 are samples of S. sphenanthera.
for quality control of Fructus Schisandrae. GC-MS is usedto construct characteristic fingerprint profiles for recognitionfor specific lignans in Fructus Schisandrae. This methodcan not only give an overview of all the specific lignansdetected in Fructus Schisandrae, but also quantitate someactive constituents. Thus, this approach can be applied tocontrol the quality of Fructus Schisandrae effectively. Weexpected thatGC-MSfingerprint profileswith quantitation ofmultiple-lignans can be used as an effective alternative qualityassessment model for Fructus Schisandrae.
Conflict of Interests
The authors declare that they have no conflict of interests.
Authors’ Contribution
Yong-Gang Xia, Bing-You Yang, and Jun Liang equallycontributed to this work.
The Scientific World Journal 7
Acknowledgments
The authors work was financially supported by the ProgramforNewCentury Excellent Talents inHeilongjiang ProvincialUniversity, Heilongjiang province postdoctoral special fund-ing, Innovative Talents Funding ofHeilongjiangUniversity ofChinese Medicine, Pharmacopoeia Commission of the Peo-ple’s Republic of China, and the State Key Creative NewDrugProject of China, Standard research platform construction ofTraditional Chinese Medicine extract (2009ZX09308-004).
References
[1] M. Jiang, C. Zhang, H. Cao, K. Chan, and A. Lu, “The roleof Chinese medicine in the treatment of chronic diseases inChina,” Planta Medica, vol. 77, no. 9, pp. 873–881, 2011.
[2] S. P. Li, J. Zhao, and B. Yang, “Strategies for quality control ofChinese medicines,” Journal of Pharmaceutical and BiomedicalAnalysis, vol. 55, no. 4, pp. 802–809, 2011.
[3] Y. G. Xia, B. Y. Yang, Q. H. Wang, J. Liang, D. Wang, andH. X. Kuang, “Species classification and quality assessment ofCangzhu (Atractylodis Rhizoma) by high-performance liquidchromatography and chemometricmethods,” Journal of Analyt-ical Methods in Chemistry, vol. 2013, Article ID 497532, 7 pages,2013.
[4] E.-H. Liu, L.-W. Qi, K. Li, C. Chu, and P. Li, “Recent advancesin quality control of traditional Chinese medicines,” Combina-torial Chemistry and High Throughput Screening, vol. 13, no. 10,pp. 869–884, 2010.
[5] P.-S. Xie and A. Y. Leung, “Understanding the traditional aspectof Chinese medicine in order to achieve meaningful qualitycontrol of Chinese materia medica,” Journal of ChromatographyA, vol. 1216, no. 11, pp. 1933–1940, 2009.
[6] Y. Jiang, B. David, P. Tu, and Y. Barbin, “Recent analyticalapproaches in quality control of traditional Chinese medicines-a review,” Analytica Chimica Acta, vol. 657, no. 1, pp. 9–18, 2010.
[7] State-Pharmacopoeia-Committee, Pharmacopoeia of People’sRepublic of China, 2010.
[8] A. Panossian and G. Wikman, “Pharmacology of Schisandrachinensis Bail.: an overview of Russian research and uses inmedicine,” Journal of Ethnopharmacology, vol. 118, no. 2, pp.183–212, 2008.
[9] H. Zhang, G. Zhang, Z. Zhu et al., “Determination of sixlignans in Schisandra chinensis (Turcz.) Baill. Fruits and relatedChinese multiherb remedies by HPLC,” Food Chemistry, vol.115, no. 2, pp. 735–739, 2009.
[10] L.-Q. Yang, X.-Y. Wu, Z.-Q. Xu, H.-R. Hou, and H.-Z. Fu,“Research progress on determination of lignans from Schisan-dra chinensis and its preparations,” China Journal of ChineseMateria Medica, vol. 30, no. 9, pp. 650–653, 2005.
[11] W.-W. Chen, R.-R. He, Y.-F. Li, S.-B. Li, B. Tsoi, and H.Kurihara, “Pharmacological studies on the anxiolytic effect ofstandardized Schisandra lignans extract on restraint-stressedmice,” Phytomedicine, vol. 18, no. 13, pp. 1144–1147, 2011.
[12] X. Ci, R. Ren, K. Xu et al., “Schisantherin a exhibitsanti-inflammatory properties by down-regulating NF-𝜅B andMAPK signaling pathways in lipopolysaccharide-treated RAW264.7 cells,” Inflammation, vol. 33, no. 2, pp. 126–136, 2010.
[13] M. H. Tran, M. Na, S. M. Byung et al., “Acetylcholinesteraseinhibitory effect of lignans isolated from Schizandra chinensis,”Archives of Pharmacal Research, vol. 30, no. 6, pp. 685–690, 2007.
[14] T. T. Pao, K. F. Hsu, K. T. Liu, L. G. Chang, C. H. Chuang, and C.Y. Sung, “Protective action of schisandrin B on hepatic injury inmice,” Chinese Medical Journal, vol. 3, no. 3, pp. 173–179, 1977.
[15] H. J. Lee and C. Y. Kim, “Simultaneous determination of ninelignans using pressurized liquid extraction and HPLC-DAD inthe fruits of Schisandra chinensis,” Food Chemistry, vol. 120, no.4, pp. 1224–1228, 2010.
[16] S. Gao, J. You, Y. Wang, R. Zhang, and H. Zhang, “On-line continuous sampling dynamic microwave-assisted extrac-tion coupled with high performance liquid chromatographicseparation for the determination of lignans in Wuweizi andnaphthoquinones in Zicao,” Journal of Chromatography B, vol.887-888, pp. 35–42, 2012.
[17] C. W. Halstead, S. Lee, C. S. Khoo, J. R. Hennell, and A.Bensoussan, “Validation of a method for the simultaneousdetermination of four schisandra lignans in the raw herb andcommercial dried aqueous extracts of Schisandra chinensis (WuWei Zi) by RP-LC with DAD,” Journal of Pharmaceutical andBiomedical Analysis, vol. 45, no. 1, pp. 30–37, 2007.
[18] L. Kvasnickova, Z. Glatz, H. Sterbova, V. Kahle, J. Slanina,and P. Musil, “Application of capillary electrochromatographyusing macroporous polyacrylamide columns for the analysisof lignans from seeds of Schisandra chinensis,” Journal ofChromatography A, vol. 916, no. 1-2, pp. 265–271, 2001.
[19] X.-G. He, L.-Z. Lian, and L.-Z. Lin, “Analysis of lignan con-stituents from Schisandra chinensis by liquid chromatography-electrospray mass spectrometry,” Journal of Chromatography A,vol. 757, no. 1-2, pp. 81–87, 1997.
[20] X. Huang, F. Song, Z. Liu, and S. Liu, “Studies on lignanconstituents from Schisandra chinensis (Turcz.) Baill. fruitsusing high-performance liquid chromatography/electrosprayionization multiple-stage tandem mass spectrometry,” Journalof Mass Spectrometry, vol. 42, no. 9, pp. 1148–1161, 2007.
[21] C. Schwarzinger and H. Kranawetter, “Analysis of the activecompounds in different parts of the Schisandra chinensis plantby means of pyrolysis-GC/MS,” Monatshefte fur Chemie, vol.135, no. 9, pp. 1201–1208, 2004.
[22] Z. Xiang, H. Li, and L. Zhang, “Study on supercriticalcarbon dioxide extract from schisandra chinensis by gaschromatography-mass spectrometry,” Chinese Journal of Chro-matography, vol. 21, no. 6, pp. 568–571, 2003.
[23] L. Wang, Y. Chen, Y. Song, Y. Chen, and X. Liu, “GC-MSof volatile components of Schisandra chinensis obtained bysupercritical fluid and conventional extraction,” Journal ofSeparation Science, vol. 31, no. 18, pp. 3238–3245, 2008.
[24] G.-H. Ruan and G.-K. Li, “The study on the chromatographicfingerprint of Fructus xanthii by microwave assisted extractioncoupled with GC-MS,” Journal of Chromatography B, vol. 850,no. 1-2, pp. 241–248, 2007.
[25] Z. Lianfu and L. Zelong, “Optimization and comparison ofultrasound/microwave assisted extraction (UMAE) and ultra-sonic assisted extraction (UAE) of lycopene from tomatoes,”Ultrasonics Sonochemistry, vol. 15, no. 5, pp. 731–737, 2008.
[26] E.-Q. Xia, X.-X. Ai, S.-Y. Zang, T.-T. Guan, X.-R. Xu, and H.-B.Li, “Ultrasound-assisted extraction of phillyrin from Forsythiasuspensa,”Ultrasonics Sonochemistry, vol. 18, no. 2, pp. 549–552,2011.
[27] F. Bonzanini, R. Bruni, G. Palla, N. Serlataite, and A. Caligiani,“Identification and distribution of lignans in Punica granatumL. fruit endocarp, pulp, seeds, wood knots and commercialjuices by GC-MS,” Food Chemistry, vol. 117, no. 4, pp. 745–749,2009.

8 The Scientific World Journal
[28] E. Sedlak, I. Boldizsar, L. Borsodi et al., “Identification andquantification of lignans, carboxylic acids and sugars in theleaves of Forsythia species and cultivars,”Chromatographia, vol.68, no. 1, pp. S35–S41, 2008.
[29] M.-H. Chun, E. K. Kim, S. M. Yu et al., “GC/MS combinedwith chemometricsmethods for quality control of Schizonepetatenuifolia Briq: determination of essential oils,” MicrochemicalJournal, vol. 97, no. 2, pp. 274–281, 2011.
[30] W.-F. Fong, C.-K. Wan, C.-Y. Zhu et al., “Schisandrol A fromSchisandra chinensis reverses P-glycoprotein-mediated mul-tidrug resistance by affecting Pgp-substrate complexes,” PlantaMedica, vol. 73, no. 3, pp. 212–220, 2007.
[31] Y. Zhou, S.-X. Huang, J.-X. Pu et al., “Ultra performance liquidchromatography coupled with quadrupole time-of-flight massspectrometric procedure for qualitative and quantitative anal-yses of nortriterpenoids and lignans in the genus Schisandra,”Journal of Pharmaceutical and Biomedical Analysis, vol. 56, no.5, pp. 916–927, 2011.

Submit your manuscripts athttp://www.hindawi.com
Hindawi Publishing Corporationhttp://www.hindawi.com Volume 2014
Inorganic ChemistryInternational Journal of
Hindawi Publishing Corporation http://www.hindawi.com Volume 2014
International Journal ofPhotoenergy
Hindawi Publishing Corporationhttp://www.hindawi.com Volume 2014
Carbohydrate Chemistry
International Journal of
Hindawi Publishing Corporationhttp://www.hindawi.com Volume 2014
Journal of
Chemistry
Hindawi Publishing Corporationhttp://www.hindawi.com Volume 2014
Advances in
Physical Chemistry
Hindawi Publishing Corporationhttp://www.hindawi.com
Analytical Methods in Chemistry
Journal of
Volume 2014
Bioinorganic Chemistry and ApplicationsHindawi Publishing Corporationhttp://www.hindawi.com Volume 2014
SpectroscopyInternational Journal of
Hindawi Publishing Corporationhttp://www.hindawi.com Volume 2014
The Scientific World JournalHindawi Publishing Corporation http://www.hindawi.com Volume 2014
Medicinal ChemistryInternational Journal of
Hindawi Publishing Corporationhttp://www.hindawi.com Volume 2014
Chromatography Research International
Hindawi Publishing Corporationhttp://www.hindawi.com Volume 2014
Applied ChemistryJournal of
Hindawi Publishing Corporationhttp://www.hindawi.com Volume 2014
Hindawi Publishing Corporationhttp://www.hindawi.com Volume 2014
Theoretical ChemistryJournal of
Hindawi Publishing Corporationhttp://www.hindawi.com Volume 2014
Journal of
Spectroscopy
Analytical ChemistryInternational Journal of
Hindawi Publishing Corporationhttp://www.hindawi.com Volume 2014
Journal of
Hindawi Publishing Corporationhttp://www.hindawi.com Volume 2014
Quantum Chemistry
Hindawi Publishing Corporationhttp://www.hindawi.com Volume 2014
Organic Chemistry International
ElectrochemistryInternational Journal of
Hindawi Publishing Corporation http://www.hindawi.com Volume 2014
Hindawi Publishing Corporationhttp://www.hindawi.com Volume 2014
CatalystsJournal of
![Quantitative Finance - Rutgers Universityeconweb.rutgers.edu/mizrach/pubs/[30]-2008_QF.pdfTo cite this Article: Mizrach, Bruce (2008) 'The next tick on Nasdaq', Quantitative Finance,](https://img.pdfslide.us/doc/110x75/5f0c2c287e708231d43418c4/quantitative-finance-rutgers-30-2008qfpdf-to-cite-this-article-mizrach-bruce.jpg)


![Thinning methodologies-a comprehensive survey - …read.pudn.com/downloads166/doc/760699/IEEEpapers/getPDF.pdfautomaton [43], fingerprint classification [74], quantitative metallography](https://img.pdfslide.us/doc/110x75/5edb1c62aa8629317168b205/thinning-methodologies-a-comprehensive-survey-readpudncomdownloads166doc760699ieeepapers.jpg)