Embed Size (px)
Citation preview

Hindawi Publishing CorporationJournal of SensorsVolume 2011, Article ID 106482, 8 pagesdoi:10.1155/2011/106482
Research Article
Model Design of Piezoelectric Micromachined Modal Gyroscope
Xiaojun Hu, Xiaosheng Wu, Zheng Wang, Wenyuan Chen, and Weiping Zhang
National Key Laboratory of Micro/Nano Fabrication Technology, Research Institute of Micro/Nano Science and Technology,Shanghai Jiao Tong University, Shanghai 200240, China
Correspondence should be addressed to Xiaosheng Wu, [email protected]
Received 30 May 2011; Revised 30 August 2011; Accepted 30 August 2011
Academic Editor: Andrea Cusano
Copyright © 2011 Xiaojun Hu et al. This is an open access article distributed under the Creative Commons Attribution License,which permits unrestricted use, distribution, and reproduction in any medium, provided the original work is properly cited.
This paper reports a novel kind of solid-state microgyroscope, which is called piezoelectric micromachined modal gyroscope(PMMG). PMMG has large stiffness and robust resistance to shake and strike because there is no evident mass-spring componentin its structure. This work focused on quantitative optimization of the gyroscope, which is still blank for such gyroscope. The modalanalysis by the finite element method (FEM) was firstly conducted. A set of quantitative indicators were developed to optimize theoperation mode. By FEM, the harmonic analysis was conducted to find the way to efficiently actuate the operational mode needed.The optimal configuration of driving electrodes was obtained. At last, the Coriolis analysis was conducted to show the relationbetween angular velocity and differential output voltage by the Coriolis force under working condition. The results obtained inthis paper provide theoretical basis for realizing this novel kind of micromachined gyroscope.
1. Introduction
Different from the micromachined vibratory gyroscope,which has the structure of suspending springs and proofmasses, some kinds of solid-state gyroscopes have no partwhich moves as a whole. According to their workingprinciple, these kinds of gyroscopes can be classified into twocategories: one that has no vibration unit at all such as opticalgyroscopes [1] and atom gyroscope [2, 3], the other that hasonly local vibration such as HRG (Hemispherical ResonantGyro) [4] and surface acoustic wave gyroscope [5, 6]. Becausethere is no moving part and suspending structure in a solid-state gyroscope, it is robust and has higher resistance toshock and shake. As the development of MEMS technology,MEMS microgyroscopes attracted increasing attention dueto their unique advantage (low price, small size, low energyconsumption, and easy integration) and it sees more andmore research on miniaturization of solid-state gyroscopes.Solid-state microgyroscopes combine the merits of bothsolid-state gyroscopes and micro-MEMS gyroscopes. Atpresent, there are four major solid-state microgyroscopes:micro-HRG (Hemispherical Resonator Gyro), micro-opticalgyroscopes [7, 8], microsurface acoustic wave gyroscopes [6,9], and piezoelectric solid-state microgyroscopes researchedin the paper.
Piezoelectric gyroscopes make use of two vibrationmodes of a vibratory piezoelectric body in which materialparticles move in two perpendicular directions, respectively.When a piezoelectric gyroscope is excited into vibration inone of the two modes (the primary mode) by an appliedalternating voltage and attached to a rotating body, Coriolisforce will excite the other mode (the secondary mode)through which the rotation rate of the body can be detected.These piezoelectric gyroscopes include flexural vibrationsin two perpendicular directions of beams and tuning forks[10–13], thickness-shear vibrations in two perpendiculardirections of plates [14, 15], radial and torsion vibrationsof circular cylindrical shells [16], and degenerate modes ofcircular disks, shells, and rings [17–19].
In January of 2006, Japanese researchers Maenaka et al.proposed a novel piezoelectric solid-state microgyroscope[20], which is named the piezoelectric micromachinedmodal gyroscope (PMMG) in this paper. It was found thatin a higher-order resonance mode, the movements of themass elements are almost in one direction and differentialon the sides of the prism, and this modal vibration can beused to detect the rotation rate of the body, which will bedetailed below. This kind of novel gyroscope has attractedmany attention, and large amount of both theoretical andexperimental researches have been done [21–23]. However,

2 Journal of Sensors
x
y
z
Polarization
(a)
Coriolisforce
Tens. Tens.
Comp.
−
(b)
++
++
(c)
Comp.
−
−−
Figure 1: Operation principle of the gyroscope.
these works mainly focused on qualitative researches, andquantitative analysis and optimization of such gyroscope isstill blank.
In this paper, quantitative indicators were introduced toevaluate the modes and thus determine the best operationalmode. Besides, the same indicators were used to determinethe size and configuration of the driving electrodes withwhich the operational mode can be efficiently actuated. Atlast, the Coriolis analysis was conducted to show the relationbetween angular velocity and differential output voltage bythe Coriolis force under working condition.
2. Operation Principle
The basic operation principle of the device we applied isshown in Figure 1. At first, assume that the rectangular prismis made of PZT (a piezoelectric ceramics made of PbO2,PbZrO3 and PbTiO3), and it has polarization along z-axis.With excitation of the PZT prism at the operation modementioned before, the differential vibration to x-axis (in oursimulation, we use y-axis) in the prism appears as shownin Figure 1(a). When the angular velocity along y-axis (inour simulation we use x-axis) is applied, the Coriolis forceis generated according to movement of the mass elements,resulting in compressive and tensile stresses dependingon the position. These stresses differentially generate thepiezoelectric voltage at the surface of the device as shownin Figure 1(b). This voltage is proportional to the appliedangular rate and is an output signal of the device.
The detail structure of the piezoelectric solid-state micro-gyroscope is introduced as shown in Figure 2, which was firstproposed by Maenaka et al. Piezoelectric ceramic materialPZT is selected as the substrate block. On the top and bottomsurfaces of the PZT block, a lot of driving electrodes andsensing electrodes are distributed. As shown in the figure, D+and D− are the driving electrodes, and the exciting voltagesare applied on the D+ and D− electrodes. R1 and R2 arethe reference electrodes, which can be used for searching andtracking the working resonance mode. S1, S2, S3, and S4 arethe sensing electrodes. When there is no angular input, thevoltages of two adjacent electrodes, such as S1 and S2, orS3 and S4, are the same because of the symmetric structure
S1
S2 S3
R1 D+ D−
PZTsubstrate
R1
S4
Figure 2: Detail structure of the piezoelectric solid-state microgy-roscope.
of the piezoelectric block. If the rotation in any directionperpendicular to the modal vibration is input, the voltageof sensing electrodes is changed because of the coupling ofthe Coriolis effect, and then the voltages of two adjacentelectrodes are not the same. Through detecting the voltagedifference of two adjacent sensing electrodes, the rotationinput can be quantized. On the bottom surface, the sensingand driving electrodes are distributed in the correspondingpositions as on the top surface.
3. Design and Simulation
3.1. Material Selection. Piezoelectric material is commonlyused for electromechanical transducers, and the require-ments for the performance of piezoelectric ceramic varyfor different regions of applications. As for the solid-statemicrogyroscope we used, the piezoelectric material serves asthe excitation source and sensing element simultaneously,so the piezoelectric material should have larger piezoelectricconstant d33 and electromechanical coupling constants k33
and k15. Based on these conditions, we selected PZT-5 duringfollowing simulation. The PZT-5 material constants usedin this paper are listed as follows: the dielectric constant(εr): ε11 = 1700, ε33 = 1470, material mass density (ρ):7500 kg/m3, the piezoelectric constant (e): e31 = −6.5 C/m2,e33 = 23.3 C/m2, e15 = 17.0 C/m2, the elastic constant

Journal of Sensors 3
matrix (c): c11 = 12.6 × 10¹⁰ N/m2, c12 = 7.95 × 10¹⁰ N/m2,c13 = 8.41 × 10¹⁰ N/m2, c33 = 11.7 × 10¹⁰ N/m2, c44 =2.30× 10¹⁰ N/m2, c66 = 2.325× 10¹⁰ N/m2.
3.2. Modal Analysis. In this section, the finite elementanalysis of the piezoelectric body of the PMMG was firstconducted to find the operation mode, and then quantitativeindicators were introduced to evaluate these modes and atlast the best operation mode and the corresponding size ofthe device was given.
From the operation principle of the PMMG, it can beconcluded that the working resonance mode should havethe following characteristics. (1) The movement of points inthe piezoelectric block should be almost in one direction,y-axis in this paper. (2) The moving direction of pointsshould be perpendicular to the polarization direction of thepiezoelectric block. (3) The moving direction of a point onone edge is the same as that of the corresponding point on thediagonal edge and is opposite to that of the correspondingpoint on the adjacent edge. (4) Moving edges should bein the state of tension or compression. To get this specialmodal shape, we used ANSYS to perform modal analysisand list corresponding frequencies under which the modalshapes meet these characteristics. The corresponding resultsare listed at Table 1.
As can be seen from Table 1, 9 results were obtained, andit raises a question that which one is the best. For the idealworking resonance mode, the points vibrate only in y-axisdirection and there is no vibration in other two orthogonaldirections. Actually, that is impossible and we hope theoscillation amplitude is much bigger at y-axis direction thanat x-axis and z-axis directions. For that reason, we establisheda set of quantitative indicators to evaluate various modes andthus determine the best operation mode.
Before we introduce these quantitative indicators, itis necessary to clarify that the device was meshed beforesimulation was conducted; therefore, it is reasonable to thinkthe device was composed of many small units and nodes.
The quantitative indicators are shown as follows:
A =∑EYi∑EXi
,
B =∑EYi∑EZi
,
(1)
where EYi, EXi, and EZi stand for the kinetic energy ofelement i at Y , X , and Z directions, respectively, A and B areour quantitative indicators and they are the ratio of EY to EXand EZ , respectively. When the value of A and B gets bigger,that means the movements of the mass elements are moreobvious at Y direction than at X and Z directions, whichleads to higher sensitivity and lower deviation.
To calculate A and B, we need to get EYi, EXi, andEZi. We started from calculating displacement of element i.Displacement of element i at X direction is shown in (2):
UXi = AXi sin(wt + ϕ
). (2)
2 0.75D+ D−
0.5
Figure 3: The configuration of the driving electrodes.
Through derivation, we can calculate velocity of elementi at X direction:
VXi = AXiw cos(wt + ϕ
). (3)
Using Kinetic Energy Theory, we got the kinetic energyof element i at X direction:
EXi = 12mV 2
Xi =12mA2
Xiw2cos2(wt + ϕ
). (4)
In the same way, we got EYi and EZi:
EYi = 12mV 2
Yi =12mA2
Yiw2cos2(wt + ϕ
),
EZi = 12mV 2
Zi =12mA2
Ziw2cos2(wt + ϕ
).
(5)
Using (1)–(5), we got A and B as shown below:
A =∑EYi∑EXi
=∑A2Yi∑
A2Xi
,
B =∑EYi∑EZi
=∑A2Yi∑
A2Zi
.
(6)
AXi, AYi, and AZi can be got from ANSYS, and theyare relative values because modal analysis does not give usabsolute values generally.
Table 2 shows the calculating results of quantitativeindicators.
In order to get the best performance, we hope the valueof A and B as well as AY reaches its maximum valuesimultaneously, but in real applications that is impossibleand unnecessary. A practical way is to make an overallcomparison of these indicators among all the modes listedin Table 2 and choose the relatively biggest one. As can beseen from Table 2, the device with the size 3 × 4 × 4 has themaximum value of A and AY , and its value of B is smallerthan only that of the device with the size 3 × 6 × 5. Besides,the device with the size 3× 5× 4 also has relatively big valueof A, B, and AY . Another factor to consider is that becauseof symmetry, the device with the size 3 × 4 × 4 will havetwo mode shapes at the same frequency. As a result, we candetermine that the device with the size 3× 5× 4 has the bestoperation mode.

4 Journal of Sensors
Table 1: Particular mode shapes meeting our needs.
Size∗
(mm)Mode shape (x-y plate)
Size∗
(mm)Mode shape (x-y plate)
Size∗
(mm)Mode shape (x-y plate)
3×4×3 MN
MX
Y
X
z 3×4×4MN
MX
Y
X
3×5×3MN
MX
Y
X
3×5×4MN
MX
Y
X3×5×5
MN
MX
Y
X
z3×6×3
MN
MX
Y
X
z
3×6×4 MN
MX
Y
X
z3×6×5 MN
MX
Y
X
z3×6×6
MN
Y
X
z
(∗The first number of the size refers to the size in the polarization direction).
Table 2: Calculating results of quantitative indicators.
Size∗ F(Hz) Ax Ay Az A(Ey/Ex) B(Ey/Ez)
3× 4× 3 388045 4.5464e + 006 8.8189e + 005 2.9196e + 006 0.1940 0.3021
3× 4× 4 357044 2.1886e + 006 4.0152e + 006 2.1341e + 006 1.8346 1.8814
3× 5× 3 348154 4.7358e + 006 7.3201e + 005 2.8966e + 006 0.1546 0.2527
3× 5× 4 326550 2.6398e + 006 3.0201e + 006 2.7044e + 006 1.1441 1.1167
3× 5× 5 372396 4.7605e + 006 4.2082e + 005 3.1742e + 006 0.0884 0.1326
3× 6× 3 428269 4.7268e + 006 1.4384e + 006 2.1160e + 006 0.3043 0.6798
3× 6× 4 370765 2.7430e + 006 2.4641e + 006 3.1312e + 006 0.8983 0.7870
3× 6× 5 427822 3.9516e + 006 2.8394e + 006 1.4470e + 006 0.7185 1.9623
3× 6× 6 389186 3.7984e + 006 2.2963e + 006 2.2245e + 006 0.6045 1.0323
(∗The first number of the size refers to the size in the polarization direction).

Journal of Sensors 5
Working resonance mode
20
18
16
14
12
10
8
6
4
2
03000 3100 3200 3300 3400 3500 3600 3700 3800 3900
Vol
tage
Frequency (×102)
(a)
MX
Y
X
MN
(b)
Figure 4: Harmonic excitation analysis result of the PMMG.
3.3. Harmonic Analysis. In real applications, we need toapply a driving voltage to actuate the device. To make surethe mode shape we activate is the same as the one we getin modal analysis, we used ANSYS to perform harmonicanalysis. The configuration of the driving electrodes is shownin Figure 3. The amplitude of driving voltage is 10 V, and thephase difference of the voltages on D+ and D− is 180◦. Thedamping constant of the piezoelectric material was intro-duced with the value of 0.02. The frequency of the drivingvoltage was scanned from 300 kHz to 500 kHz. Figure 4 givesthe harmonic analysis results of the PMMG. In Figure 4(a),the x-coordinate refers to the frequency of the driving voltageand the y-coordinate refers to the piezoelectric voltageamplitude on the reference electrode, R1 or R2. From thefigure, we can see that there are two peaks of the voltage of thereference electrode. The peak corresponding to the workingresonance mode is in the position of around 325 kHz. Thefrequency of the working resonance mode is 326550 Hz.Figure 4(b) shows the mode shape at the exciting frequencyof the working resonance mode. It is concluded that theexciting vibration of the piezoelectric block is the same as thevibrating shape of the working resonance mode. That is tosay that through applying driving voltage with the frequencyof the working resonance mode on the driving electrodes,the vibration of the working resonance mode can beactuate.
Then, we need to optimize the size and configuration ofthe driving electrode to actuate the device more efficiently.Similar to modal analysis, we used A and B to serveas evaluation indicators. When A and B get bigger, thatmeans the movements of the mass elements are moreobvious at Y direction than at X and Z directions, andwe can say the device is actuated more efficiently. Theoriginal configuration of the driving electrodes is shown in
Ld
D+ D−
W
Figure 5: The original configuration and optimizing variables ofthe driving electrodes.
Figure 5. To optimize the size of the driving electrodes, weintroduced three variables that can be changed: the lengthand width of the driving electrodes and the distance betweentwo adjacent electrodes, which is shown schematically inFigure 5.
We changed one variable at a time and keet the other twovariables unchanged; Table 3 shows the calculating results ofquantitative indicators.
From Table 3 we can see that the maximum value of Ais around 0.68, which means the movements of the masselements are more obvious at X direction than at Y directionand may impact the performance of the device. So we needto increase the value of A as well as B. To do this, we shouldfind a way to diminish the movements of the mass elementsin the X direction. A simple solution is to add two additionaldriving electrodes (D3 and D4) distributed perpendicular tothe previous electrodes (D1 and D2) as shown in Figure 6.The phase of voltage applied on electrode D3 is same as thatof D1, and the phase of voltage applied on D4 is same as that

6 Journal of Sensors
Table 3: Relation between the quantitative indicators and the optimizing variables.
Variable Value (mm) Ax Ay AZ A(EY /EX) B(EY /EZ)
d (W = 0.75 mm, L = 1 mm)0.5 6.8325e − 015 3.8273e − 015 1.3724e − 014 0.5602 0.2789
1 6.7979e − 015 4.0901e − 015 1.3562e − 014 0.6017 0.3016
1.5 6.1609e − 015 4.1988e − 015 1.2567e − 014 0.6815 0.3341
W (d = 0.5 mm, L = 1 mm)
0.45 3.1305e − 015 1.9173e − 015 6.4646e − 015 0.6125 0.2966
0.75 6.8325e − 015 3.8273e − 015 1.3724e − 014 0.5602 0.2789
1.05 7.3949e − 015 4.4588e − 015 1.4731e − 014 0.6030 0.3027
1.35 7.3145e − 015 5.0010e − 015 1.4777e − 014 0.6837 0.3384
L (d = 0.5 mm, W = 0.75 mm)
0.5 3.8474e − 015 2.2331e − 015 7.8047e − 015 0.5804 0.2861
1 6.8325e − 015 3.8273e − 015 1.3724e − 014 0.5602 0.2789
1.5 8.8826e − 015 5.1518e − 015 1.7828e − 014 0.5800 0.2890
2 1.0169e − 014 6.4411e − 015 2.0583e − 014 0.6334 0.3129
d
L
D1 D2
D3
D4
Figure 6: The new configuration and optimizing variables of thedriving electrodes.
2
2D1 D2
D3
D4
0.50.5
2
Figure 7: The configuration of the driving electrodes at Coriolisanalysis.
of D2. To further optimize the size of the additional drivingelectrodes, we introduced three variables which should bechanged: the length of the driving electrodes, the voltageapplied on the driving electrodes, and the distance betweentwo adjacent electrodes.
We changed one variable at a time and keep the other twovariables unchanged; Table 4 shows the calculating results ofquantitative indicators.
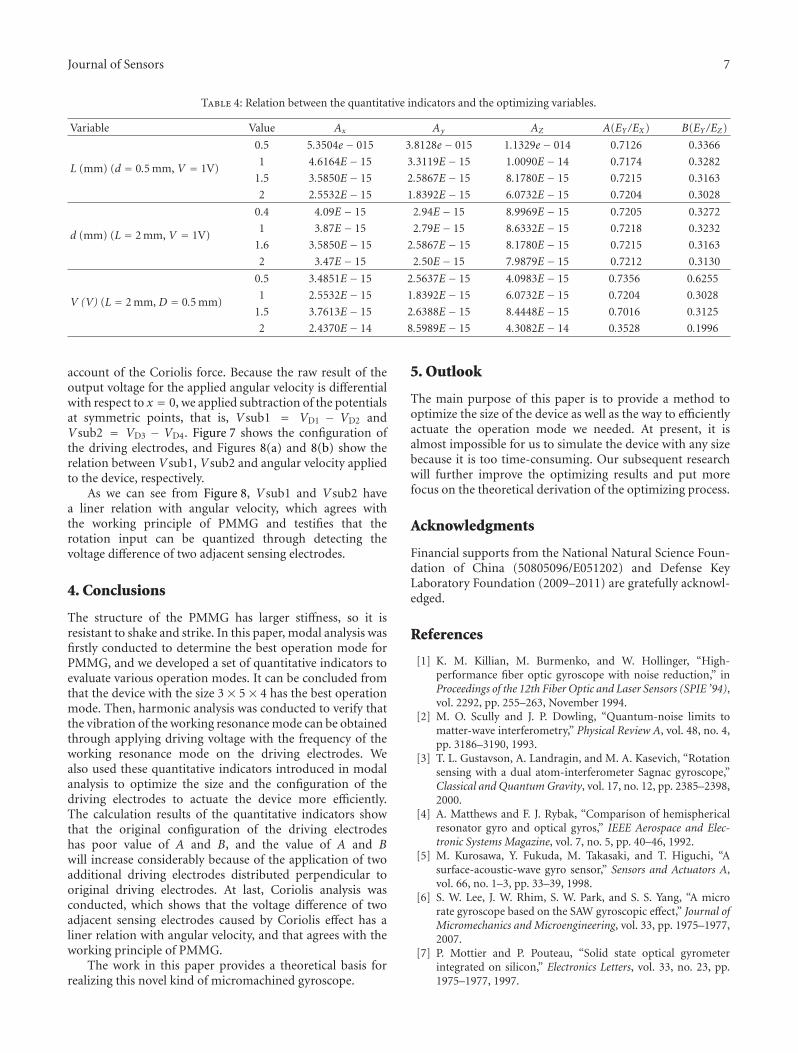
It can be concluded from Table 4 that the values of Aand B increase to 0.73 and 0.62, respectively, because of theapplication of these two additional driving electrodes.
0
0.5
1
1.5
2
2.5
0 10 20 30 40 50 60
ω (rad/s)
Vsu
b1(μ
V)
(a)
0
0.5
1
1.5
2
2.5
0 10 20 30 40 50 60
ω (rad/s)
Vsu
b2(μ
V)
(b)
Figure 8: Relation between Vsub and angular velocity applied to thedevice.
3.4. Coriolis Analysis. As mentioned before, when the angu-lar velocity along x-axis is applied, the Coriolis force isgenerated according to movement of the mass elements,resulting in compressive and tensile stresses dependingon the position. These stresses differentially generate thepiezoelectric voltage at the surface of the device as shownin Figure 1(b). This voltage is proportional to the appliedangular rate and is an output signal of the device.
With excitation at operation mode, we changed theangular velocity applied to the device, and surface potentialat the detecting electrodes was calculated by ANSYS taking
Journal of Sensors 7
Table 4: Relation between the quantitative indicators and the optimizing variables.
Variable Value Ax Ay AZ A(EY /EX) B(EY /EZ)
L (mm) (d = 0.5 mm, V = 1V)
0.5 5.3504e − 015 3.8128e − 015 1.1329e − 014 0.7126 0.3366
1 4.6164E − 15 3.3119E − 15 1.0090E − 14 0.7174 0.3282
1.5 3.5850E − 15 2.5867E − 15 8.1780E − 15 0.7215 0.3163
2 2.5532E − 15 1.8392E − 15 6.0732E − 15 0.7204 0.3028
d (mm) (L = 2 mm, V = 1V)
0.4 4.09E − 15 2.94E − 15 8.9969E − 15 0.7205 0.3272
1 3.87E − 15 2.79E − 15 8.6332E − 15 0.7218 0.3232
1.6 3.5850E − 15 2.5867E − 15 8.1780E − 15 0.7215 0.3163
2 3.47E − 15 2.50E − 15 7.9879E − 15 0.7212 0.3130
V (V) (L = 2 mm, D = 0.5 mm)
0.5 3.4851E − 15 2.5637E − 15 4.0983E − 15 0.7356 0.6255
1 2.5532E − 15 1.8392E − 15 6.0732E − 15 0.7204 0.3028
1.5 3.7613E − 15 2.6388E − 15 8.4448E − 15 0.7016 0.3125
2 2.4370E − 14 8.5989E − 15 4.3082E − 14 0.3528 0.1996
account of the Coriolis force. Because the raw result of theoutput voltage for the applied angular velocity is differentialwith respect to x = 0, we applied subtraction of the potentialsat symmetric points, that is, Vsub1 = VD1 − VD2 andVsub2 = VD3 − VD4. Figure 7 shows the configuration ofthe driving electrodes, and Figures 8(a) and 8(b) show therelation between Vsub1, Vsub2 and angular velocity appliedto the device, respectively.
As we can see from Figure 8, Vsub1 and Vsub2 havea liner relation with angular velocity, which agrees withthe working principle of PMMG and testifies that therotation input can be quantized through detecting thevoltage difference of two adjacent sensing electrodes.
4. Conclusions
The structure of the PMMG has larger stiffness, so it isresistant to shake and strike. In this paper, modal analysis wasfirstly conducted to determine the best operation mode forPMMG, and we developed a set of quantitative indicators toevaluate various operation modes. It can be concluded fromthat the device with the size 3× 5× 4 has the best operationmode. Then, harmonic analysis was conducted to verify thatthe vibration of the working resonance mode can be obtainedthrough applying driving voltage with the frequency of theworking resonance mode on the driving electrodes. Wealso used these quantitative indicators introduced in modalanalysis to optimize the size and the configuration of thedriving electrodes to actuate the device more efficiently.The calculation results of the quantitative indicators showthat the original configuration of the driving electrodeshas poor value of A and B, and the value of A and Bwill increase considerably because of the application of twoadditional driving electrodes distributed perpendicular tooriginal driving electrodes. At last, Coriolis analysis wasconducted, which shows that the voltage difference of twoadjacent sensing electrodes caused by Coriolis effect has aliner relation with angular velocity, and that agrees with theworking principle of PMMG.
The work in this paper provides a theoretical basis forrealizing this novel kind of micromachined gyroscope.
5. Outlook
The main purpose of this paper is to provide a method tooptimize the size of the device as well as the way to efficientlyactuate the operation mode we needed. At present, it isalmost impossible for us to simulate the device with any sizebecause it is too time-consuming. Our subsequent researchwill further improve the optimizing results and put morefocus on the theoretical derivation of the optimizing process.
Acknowledgments
Financial supports from the National Natural Science Foun-dation of China (50805096/E051202) and Defense KeyLaboratory Foundation (2009–2011) are gratefully acknowl-edged.
References
[1] K. M. Killian, M. Burmenko, and W. Hollinger, “High-performance fiber optic gyroscope with noise reduction,” inProceedings of the 12th Fiber Optic and Laser Sensors (SPIE ’94),vol. 2292, pp. 255–263, November 1994.
[2] M. O. Scully and J. P. Dowling, “Quantum-noise limits tomatter-wave interferometry,” Physical Review A, vol. 48, no. 4,pp. 3186–3190, 1993.
[3] T. L. Gustavson, A. Landragin, and M. A. Kasevich, “Rotationsensing with a dual atom-interferometer Sagnac gyroscope,”Classical and Quantum Gravity, vol. 17, no. 12, pp. 2385–2398,2000.
[4] A. Matthews and F. J. Rybak, “Comparison of hemisphericalresonator gyro and optical gyros,” IEEE Aerospace and Elec-tronic Systems Magazine, vol. 7, no. 5, pp. 40–46, 1992.
[5] M. Kurosawa, Y. Fukuda, M. Takasaki, and T. Higuchi, “Asurface-acoustic-wave gyro sensor,” Sensors and Actuators A,vol. 66, no. 1–3, pp. 33–39, 1998.
[6] S. W. Lee, J. W. Rhim, S. W. Park, and S. S. Yang, “A microrate gyroscope based on the SAW gyroscopic effect,” Journal ofMicromechanics and Microengineering, vol. 33, pp. 1975–1977,2007.
[7] P. Mottier and P. Pouteau, “Solid state optical gyrometerintegrated on silicon,” Electronics Letters, vol. 33, no. 23, pp.1975–1977, 1997.

8 Journal of Sensors
[8] W. Guo, H. Ma, Z. Jin, Y. Z. Tang, and Y. L. Wang, “Anovel structure of passive ring waveguide resonator on siliconsubstrate,” in Proceedings of the SPIE, vol. 4928, pp. 297–300,October 2002.
[9] J. N. Sharma, V. Walia, and S. K. Gupta, “Effect of rotation andthermal relaxation on Rayleigh waves in piezothermoelastichalf space,” International Journal of Mechanical Sciences, vol.50, no. 3, pp. 433–444, 2008.
[10] J. Soderkvist, “Piezoelectric beams and vibrating angular ratesensors,” IEEE Transactions on Ultrasonics, Ferroelectrics, andFrequency Control, vol. 38, no. 3, pp. 271–280, 1991.
[11] C. S. Chou, J. W. Yang, Y. C. Hwang, and H. J. Yang, “Analysison vibrating piezoelectric beam gyroscope,” InternationalJournal of Applied Electromagnetics in Materials, vol. 2, no. 3,pp. 227–241, 1991.
[12] I. A. Ulitko, “Mathematical theory of the fork-type wave gyro-scope,” in Proceedings of the 49th Annual IEEE InternationalFrequency Control Symposium, pp. 786–793, June 1995.
[13] S. Fujishima, T. Nakamura, and K. Fujimoto, “Piezoelectricvibratory gyroscope using flexural vibration of a triangularbar,” in Proceedings of the 45th Annual Symposium on Fre-quency Control, pp. 261–265, May 1991.
[14] G. M. Reese, E. L. Marek, and D. W. Lobitz, “Three-dimensional finite element calculations of an experimentalquartz rotation sensor,” in Proceedings of the IEEE UltrasonicsSymposium, pp. 419–422, October 1989.
[15] H. Abe, T. Yoshida, T. Ishikawa, N. Miyazaki, and H.Watanabe, “Trapped-energy vibratory gyroscopes using apartially polarized piezoelectric ceramic plate,” Electronics andCommunications in Japan, vol. 284, pp. 798–805, 2001.
[16] J. S. Yang, H. Y. Fang, and Q. Jiang, “A vibrating piezoelectricceramic shell as a rotation sensor,” Smart Materials andStructures, vol. 9, no. 4, pp. 445–451, 2000.
[17] J. S. Burdess and T. Wren, “Theory of a piezoelectric discgyroscope,” IEEE Transactions on Aerospace and ElectronicSystems, vol. 22, no. 4, pp. 410–418, 1986.
[18] J. S. Burdess, “The dynamics of a thin piezoelectric cylindergyroscope,” Proceedings of the Institution of Mechanical Engi-neers, vol. 200, pp. 271–280, 1986.
[19] P. W. Loveday, “A coupled electromechanical model of animperfect piezoelectric vibrating cylinder gyroscope,” Journalof Intelligent Material Systems and Structures, vol. 7, no. 1, pp.44–53, 1996.
[20] K. Maenaka, H. Kohara, M. Nishimura, T. Fujita, and Y.Takayama, “Novel solid micro-gyroscope,” in Proceedingsof the 19th IEEE International Conference on Micro ElectroMechanical Systems, pp. 634–637, Istanbul, Turkey, January2006.
[21] X. Wu, W. Chen, Y. Lu et al., “Vibratin analysis of a pie-zoelectric micromachined modal gyroscope,” Journal of Micro-mechanics and Microengineering, vol. 19, no. 12, Article ID125008, 2009.
[22] W. K. Sung, M. Dalal, and F. Ayazi, “mode-matched 0.9 MHzsingle proof-mass dual-axis gyroscope,” in Proceedings of the16th International Solid-State Sensors, Actuators and Microsys-tems (TRANSDUCERS ’11), pp. 2821–2824, Beijing, China,June 2011.
[23] B. J. Gallacher, J. S. Burdess, A. J. Harris, and M. E.McNie, “Principles of a three-axis vibrating gyroscope,” IEEETransactions on Aerospace and Electronic Systems, vol. 37, no. 4,pp. 1333–1343, 2001.

International Journal of
AerospaceEngineeringHindawi Publishing Corporationhttp://www.hindawi.com Volume 2010
RoboticsJournal of
Hindawi Publishing Corporationhttp://www.hindawi.com Volume 2014
Hindawi Publishing Corporationhttp://www.hindawi.com Volume 2014
Active and Passive Electronic Components
Control Scienceand Engineering
Journal of
Hindawi Publishing Corporationhttp://www.hindawi.com Volume 2014
International Journal of
RotatingMachinery
Hindawi Publishing Corporationhttp://www.hindawi.com Volume 2014
Hindawi Publishing Corporation http://www.hindawi.com
Journal ofEngineeringVolume 2014
Submit your manuscripts athttp://www.hindawi.com
VLSI Design
Hindawi Publishing Corporationhttp://www.hindawi.com Volume 2014
Hindawi Publishing Corporationhttp://www.hindawi.com Volume 2014
Shock and Vibration
Hindawi Publishing Corporationhttp://www.hindawi.com Volume 2014
Civil EngineeringAdvances in
Acoustics and VibrationAdvances in
Hindawi Publishing Corporationhttp://www.hindawi.com Volume 2014
Hindawi Publishing Corporationhttp://www.hindawi.com Volume 2014
Electrical and Computer Engineering
Journal of
Advances inOptoElectronics
Hindawi Publishing Corporation http://www.hindawi.com
Volume 2014
The Scientific World JournalHindawi Publishing Corporation http://www.hindawi.com Volume 2014
SensorsJournal of
Hindawi Publishing Corporationhttp://www.hindawi.com Volume 2014
Modelling & Simulation in EngineeringHindawi Publishing Corporation http://www.hindawi.com Volume 2014
Hindawi Publishing Corporationhttp://www.hindawi.com Volume 2014
Chemical EngineeringInternational Journal of Antennas and
Propagation
International Journal of
Hindawi Publishing Corporationhttp://www.hindawi.com Volume 2014
Hindawi Publishing Corporationhttp://www.hindawi.com Volume 2014
Navigation and Observation
International Journal of
Hindawi Publishing Corporationhttp://www.hindawi.com Volume 2014
DistributedSensor Networks
International Journal of