Embed Size (px)
Citation preview

Hindawi Publishing CorporationThe Scientific World JournalVolume 2013, Article ID 810547, 10 pageshttp://dx.doi.org/10.1155/2013/810547
Research ArticleOptimization of Extraction Parameters by Using ResponseSurface Methodology, Purification, and Identification ofAnthocyanin Pigments in Melastoma malabathricum Fruit
Nordiyanah Anuar,1 Ahmad Faris Mohd Adnan,1,2 Naziz Saat,1
Norkasmani Aziz,1,2 and Rosna Mat Taha1,2
1 Institute of Biological Sciences, Faculty of Science, University of Malaya, 50603 Kuala Lumpur, Malaysia2 Centre for Ionics, Department of Physics, University of Malaya, 50603 Kuala Lumpur, Malaysia
Correspondence should be addressed to Ahmad Faris Mohd Adnan; ahmad [email protected]
Received 29 July 2013; Accepted 21 August 2013
Academic Editors: R.-C. Sun and M. Talat
Copyright © 2013 Nordiyanah Anuar et al. This is an open access article distributed under the Creative Commons AttributionLicense, which permits unrestricted use, distribution, and reproduction in any medium, provided the original work is properlycited.
Anthocyanins not just have various benefits in food industry but also have been used as natural colourants in cosmetic, coatingproducts and as potential natural photosensitizers in solar cell. Thus, the main purpose of this study was to obtain informationon the maximum yield of anthocyanin that can be recovered from Melastoma malabathricum fruit. Factors such as extractiontemperature, extraction time, and solid to liquid ratio were identified to be significantly affecting anthocyanin extraction efficiency.By using three-level three-factor Box-Behnken design, the optimized conditions for anthocyanin extraction by acidified methanol(𝑅2 = 0.972) were temperature of 60∘C, time of 86.82 min, and 0.5 : 35 (g/mL) solid to liquid ratio while the optimum extractionconditions by acidified ethanol (𝑅2 = 0.954) were temperature of 60∘C, time of 120min, and 0.5 : 23.06 (g/mL) solid to liquid ratio.The crude anthocyanin extract was further purified by using Amberlite XAD-7 and Sephadex LH-20 column chromatography.Identification of anthocyanins revealed the presence of cyanidin dihexoside, cyanidin hexoside, and delphinidin hexoside as themain anthocyanins inM. malabathricum fruit.
1. Introduction
Anthocyanins are identified as water soluble compoundshaving molecular structure based on a C
6-C3-C6skele-
ton. Anthocyanins are the most conspicuous subset underflavonoid group, due to the wide range of colours resultingfrom their synthesis [1]. They are responsible for the red,purple, and blue colours in many parts of the plants. Today,the interest in anthocyanins has arised due to their uniquestructure and beneficial health claims food and pharmaceu-tical industry have greatly benefited from. They have beenused for various food preparations such as jelly dessert,milk dessert, soft ice-cream, hard ice-cream, and yogurt [2].Besides being important in food and pharmaceutical indus-try, various natural dye extracts which include anthocyaninshave also been actively explored by researchers to be used assensitizer in dye-sensitized solar cells [3, 4] and coating [5].
These valuable bioactive compounds also have beenreported to have biological effects on the physiologicalfunctions of cells such as reducing oxidative cell damageand increasing high density lipoprotein (HDL) cholesterollevel [6, 7]. Anthocyanins with an ortho-dihydroxyphenylstructure on the B-ring (e.g., delphinidin) may contribute tothe induction of apoptosis on which its chemo preventiveaction against cancer is based [8]. Recently, researchers havefound that cyanidin-3-glucoside could improve functionalrecovery of neurological dysfunction in a rat model havingtraumatic spinal cord injury while delphinidin-3-glucosidewas found to have significant roles against thrombosis andcardiovascular diseases [9, 10].
Melastoma malabathricum, which belongs to the familyMelastomataceae, is described as a flowering shrub that isdistributed widely in South and Southeast Asia [11].The fruitsare considered as a rich source of anthocyanins as the fruits

2 The Scientific World Journal
turned to dark purple when ripe. Previous works done onM.malabathricumwere primarily on thephytochemical contentsandmedicinal properties obtained from the leaves, stems, androots [12–14]. This shrub has the potential as a steady supplyof feedstock for pigment production.
Extraction of the bioactive compound is influenced byvarious process parameters such as solvent composition, pH,temperature, extraction time, and solid to liquid ratio [15, 16].Extracts rich in anthocyanins were usually extracted usingmethanol, ethanol, acetone, water, or mixtures and with theaddition of small amount of acid which is recommendedto prevent the degradation of the nonacylated compounds.Response surface methodology (RSM) is an economicallyefficient experimental procedure for optimizing this complexprocess. Compared to using “one to one factor” method,RSM is far better since in RSM the several process variablessimultaneously interact with each other.Thismethod is basedonmultivariate nonlinear model that has been widely used inchemical, biological, and agricultural applications to predictthe optimal conditions of the systems.
To the best of our knowledge, there were no studiesfocusing on optimizing the parameters for anthocyaninextraction fromM. malabathricum fruit. Thus, the objectivesof this study were to obtain maximum yield of anthocyaninrecovery fromM.malabathricum fruit and also to identify themajor anthocyanin components in M. malabathricum fruitusing UPLC-ESI-MS/MS.
2. Materials and Methods
2.1. Materials. The chemical reagents (potassium chloride,sodium acetate) used in this study were of analytical gradeand obtained from Sigma Aldrich. Methanol (99.8%) andundenatured ethanol (99.8%) from Systerm were used asextraction solvents. Ethyl acetate (Systerm) was used inthe separation process. Formic acid, ammonium formate,and acetonitrile were of HPLC grade obtained from Merck.Sephadex LH-20 and Amberlite XAD-7 from GE Healthcarewere used as chromatography resin. Deionized water usedin this study was purified at 18.2MΩ.cm−1 (Barnstead RO &Deionized Systems).
2.2. Methods
2.2.1. Sample Preparation. Fresh mature fruits of M. mala-bathricum were used as raw material and were peeled priorto freeze-drying. The freeze-dried fruits were turned intopowder by using a commercial grinder. The powder wassieved using sieve number 60 (250𝜇m) to achieve constantparticle size. All samples were kept at −20∘C in amber bottleand kept until further analysis.
2.2.2. Extraction of Pigments. In the extraction procedure,0.5 g of the fruit powder was mixed with various volumes ofmethanol acidified with 0.5% acetic acid or ethanol acidifiedwith 0.5% acetic acid to give a solid to liquid ratio rangingfrom 0.5 : 5 to 0.5 : 35 (g/mL). Conical flask was used andcovered with aluminium foil to prevent the evaporation
Table 1: Independent variables and their levels used for Box-Behnken design.
Variables Factors Levels𝑋 −1 0 1
Extraction temperature, (∘C) 𝑋1
30 45 60Extraction time, (min) 𝑋
260 90 120
Solid to liquid ratio, (g/mL) 𝑋3
0.5 : 5 0.5 : 20 0.5 : 35
of solvent. The flask containing sample powder along withsolvent was incubated in thermostatic water bath at varioustemperatures (30–60∘C) and various time intervals (60–120min). After extraction for a period of selected time,the mixture was centrifuged for 10min. The supernatantwas then filtered and evaluated for the total anthocyanincontent. Experiments were performed in randomized orderto minimize the variability caused by nuisance factors. Allthe experiments were performed in triplicate and the averagevalue was used for the determination of total anthocyanincontent fromM. malabathricum fruit.
2.2.3. Experimental Design. RSM was used to optimize themethanolic extraction and ethanolic extraction of antho-cyanins fromM.malabathricum fruit. ABox-Behnken design(BBD) was used in the optimization of process variableswith three factors at three levels with 17 runs, including 5central points (Table 1). The responses function (𝑌) was par-titioned into linear, quadratic, and interactive components.Experimental data were fitted to the second-order regressionequation:
𝑌 = 𝑏0+ 𝑏1𝑋1+ 𝑏2𝑋2+ 𝑏3𝑋3+ 𝑏11𝑋2
1
+ 𝑏22𝑋2
2+ 𝑏33𝑋2
3+ 𝑏12𝑋1𝑋2+ 𝑏13𝑋1𝑋3
+ 𝑏23𝑋2𝑋3,
(1)
where 𝑏0is the intercept; 𝑏
1, 𝑏2, and 𝑏
3are linear coefficients;
𝑏11, 𝑏22, and 𝑏
33are squared coefficients; 𝑏
12, 𝑏13, and 𝑏
23are
interaction coefficients.The experimental design and statistical analysis were
performed using Design-Expert software (version 8.0.7.1, StatEase Inc., Minneapolis, MN, USA). The model adequacieswere checked in terms of the values of 𝑅2 and adjusted 𝑅2.Analysis of variance (ANOVA) was employed to determinethe significance of the models. Verification of optimizedconditions and predicted values were done in triplicate toconfirm the validity of the models.
2.2.4. Total Anthocyanin Content Measurement. The totalanthocyanin content was determined according to the spec-trophotometric pH differential method [17]. Samples werediluted separately with 0.025M potassium chloride buffer(pH 1) and 0.4M sodium acetate buffer (pH 4.5). Absorbanceof the mixture was measured at 511 (𝜆vis-max) and 700 nmusing a UV-Vis spectrophotometer. Absorbance was calcu-lated as 𝐴 = [(𝐴
511− 𝐴700) pH 1.0 − (𝐴
511− 𝐴700) pH 4.5].

The Scientific World Journal 3
The total anthocyanin content was calculated as cyanidin-3-glucoside equivalents as in the following equation:
Anthocyanin content (mg/100 g)
=𝐴 ×MW × DF × 𝑉 × 100𝜀 × 𝑙 × 𝑚sample
,
(2)
where 𝐴 is the absorbance, MW is the molecular weightof (449.2 g/mol of cyanidin-3-glucoside), DF is the dilutionfactor, 𝑉 is the solvent volume (mL) that was brought assample stock solution, 𝜀 is the molar absorptivity (26900), 𝑙 isthe cell path length (1 cm), and 𝑚 is the freeze-dried sampleweight (g).
2.2.5. Purification of Anthocyanin. The crude anthocyaninextract was concentrated by using a rotary evaporator (40∘C).The aqueous concentrates were then placed in a separatingfunnel and an equal volume of ethyl acetate was added toremove lipids, chlorophylls, and other nonpolar compoundsfrom the mixture. The partitioned aqueous extract wasfurther purified by using ion exchange chromatography (IEC)and size exclusion chromatography (SEC) using AmberliteXAD-7 resin and Sephadex LH-20 as separation matrixces,respectively. Anthocyanin content in the fractions collectedusing size exclusion chromatography was determined by pHdifferential method and fractions containing the highest con-tent of anthocyanin were chosen for identification analyses.
2.2.6. Identification of Anthocyanin Using UPLC-ESI-MS/MS.Analytical ultra performance liquid chromatography (PerkinElmer FX15) was used in this study. The anthocyaninfractions were then analyzed using AB Sciex 3200Q Trap,equipped with Phenomenex Aqua C18 reverse-phase column(50mm × 2.0mm × 5 𝜇M). Solvents were (A) water with0.1% formic acid and 5mM ammonium formate and (B)acetonitrile with 0.1% formic acid and 5mM ammoniumformate, establishing the following gradient: from 10% B to90% B from 0.01min to 8min, held for 3min and back to10% A in 0.1min and reequilibrated for 5min. Samples werefiltered with nylon 0.22𝜇M.The electrospray ionization (ESI)was operated in negative and positive ion modes under thefollowing conditions:mass range between 100 and 1200; capil-lary voltages +5500V and−4500V; nebulizer purifiedN
2gas,
40 psi, and source temperature 400∘C. Mass fragmentationswere based on journal references and ACD/Labs advancedchemometricsmass fragmentation predictive software [6, 18].
3. Results and Discussion
3.1. Box-Behnken Analysis. In this study, BBD was used forresponse surface optimization with three process variables(extraction temperature, extraction time, and solid to liquidratio) at three levels. Designs using BBD are usually veryefficient in terms of the number of required runs and there-fore are less expensive to run compared to central compositedesign (CCD). The design points fall within a safe operatinglimit, within the nominal high and low levels, as BBD does
not contain any points at the vertices of the cubic region.Thiscould be advantageous when the factor-level combinationsare prohibitively expensive or impossible to test because ofthe physical process constraints [19].
Two different tests, namely, sequential model sum ofsquares and model summary statistic were performed tocheck the adequacy of the models generated from theobtained data and the results are given in Table 2.Model sum-mary statistics output (Table 2) showed that, for methanolicextraction and ethanolic extraction, the values for the 𝑅2 andadjusted 𝑅2 were the highest compared the other modelswhile the cubic model was disregarded as it is aliased.For quadratic versus 2FI (2 factor interaction), the 𝑃 valueobtained was less than 0.0001 which shows strength ofsignificance. The addition of the quadratic (squared) termto the mean, linear, and the two-factor interaction termswould only strengthen the model. With the exclusion of thecubic model, the Box-Behnken matrix has sufficient data tointerpret the outcome of the present system [20].
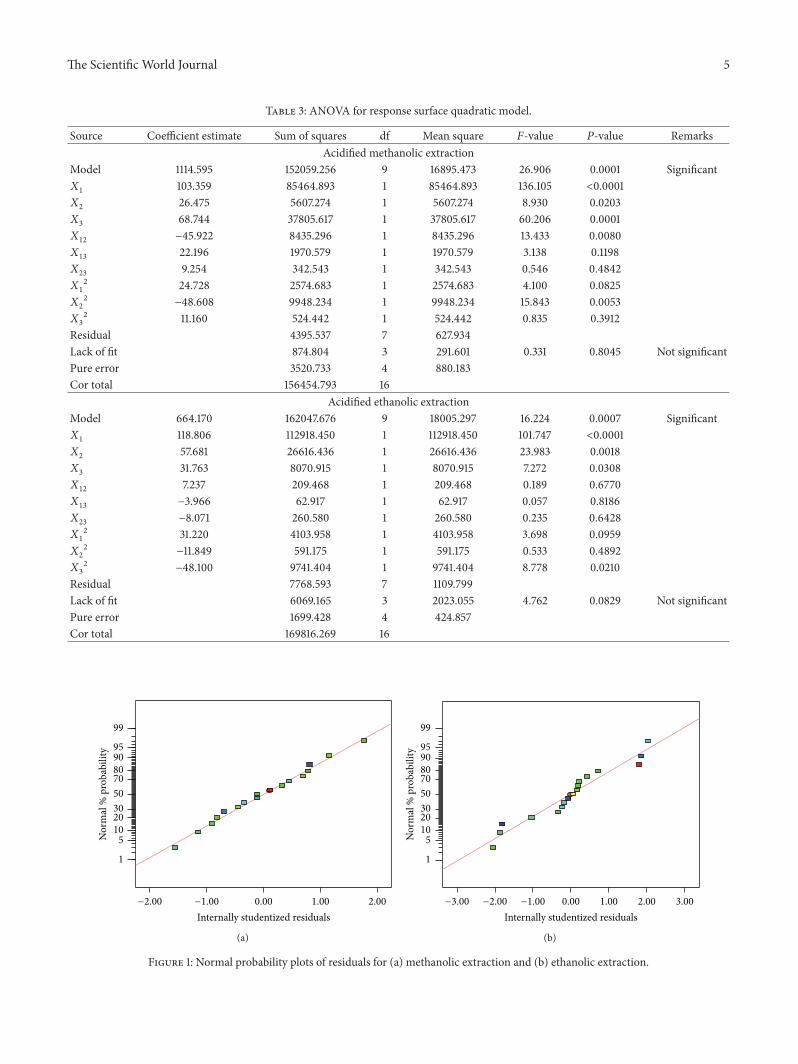
3.2. Statistical Analysis for Selected Models. Summary ofanalysis of variance (ANOVA) for the selected quadraticpolynomial model for methanolic extraction and ethanolicextraction was listed in Table 3. The ANOVA of quadraticregressionmodel demonstrated that bothmodels were highlysignificant, evident from Fisher’s F-test with high F value andlow 𝑃 value. Lack-of-Fit is the variation due to the modelinadequacy.The lack of fit was not significant for bothmodels(Table 3). Therefore, there is no evidence to indicate thatthe models do not adequately explain the variation in theresponses.
The coefficient of determination (𝑅2) is defined as ratioof sum of squares due to regression to the total sum ofsquares and is interpreted as the proportion of the variabilityin the data explained by the ANOVA. The values of R2were 0.972 and 0.954 for methanolic extraction and ethanolicextraction, respectively (Table 2), which relatively high valueswhich imply that more than 95% of experimental data canbe explained by the model. The adjusted 𝑅2 value correctsthe 𝑅2 value for the sample size and for the number of termsin the model [21]. The values of adjusted 𝑅2 for methanolicand ethanolic extraction were 0.936 and 0.895, respectively,which are also high and indicate a high correlation betweenthe observed and the predicted values. Table 4 presents aBox-Behnken design with 17 experiments as well as theexperimental (𝑌exp) and predicted response functions (𝑌pre)for both methanolic and ethanolic extractions.
As both models showed a satisfactory fit, normal prob-ability plot of the residuals were generated to check thenormality of the residuals (Figure 1). Studentized residual isthe residual divided by an estimate of its standard deviation.The residuals were studentized and values which were greaterthan+2 and less than−2were considered as large.Obtaining asmaller residual value is preferred as this shows the degree ofdeviancy from predicted model. It is clear from Figure 1 thatthe residuals followed normal distribution well as majority ofthe data points followed the fitted line fairly closely with noreasonable outliers.

4 The Scientific World Journal
Table 2: Adequecy of model tested.
Source Sum of squares df Mean square 𝐹 Value Prob > 𝐹 RemarksSequential model sum of squares for acidified methanolic extraction
Mean versus Total 20893255.04 1 20893255.04Linear versus Mean 128877.78 3 42959.26 20.25 <0.00012FI versus Linear 10748.42 3 3582.81 2.13 0.1600Quadratic versus 2FI 12433.06 3 4144.35 6.60 0.0189 SuggestedCubic versus Quadratic 874.80 3 291.60 0.33 0.8045 AliasedResidual 3520.73 4 880.18Total 21049709.83 17 1238218.23
Sequential model sum of squares for acidified ethanolic extractionMean versus Total 7196887.80 1 7196887.80Linear versus Mean 147605.80 3 49201.93 28.80 <0.0001 Suggested2FI versus Linear 532.96 3 177.65 0.08 0.9683Quadratic versus 2FI 13908.91 3 4636.30 4.18 0.0544 SuggestedCubic versus Quadratic 6069.16 3 2023.05 4.76 0.0829 AliasedResidual 1699.43 4 424.86Total 7366704.07 17 433335.53Source Std. Dev. 𝑅
2 Adjusted 𝑅2 Predicted 𝑅2 PRESS RemarksModel summary statistics for acidified methanolic extraction
Linear 46.058 0.824 0.783 0.654 54157.7572FI 41.023 0.892 0.828 0.542 71629.308Quadratic 25.059 0.972 0.936 0.875 19498.004 SuggestedCubic 29.668 0.977 0.910 + Aliased
Model summary statistics for acidified ethanolic extractionLinear 41.334 0.869 0.839 0.741 43972.027 Suggested2FI 46.559 0.872 0.796 0.406 100897.766Quadratic 33.314 0.954 0.895 0.413 99761.992 SuggestedCubic 20.612 0.990 0.960 + Aliased+ Case(s) with leverage of 1.0000: PRESS statistic not defined.
3.3. Effect of Extraction Temperature, Time, and Solid toLiquid Ratio on Anthocyanin Yield. The significance of eachcoefficient was determined by Fisher’s 𝐹-test and 𝑃 value,and the larger the magnitude of 𝐹-value and the smallerthe 𝑃-value, the more significant are the correspondingcoefficient is. Data in Table 3 showed that, for methanolicextraction, all linear components in the experimental modelwere significant (𝑃 < 0.05) with temperature having thestrongest effect on anthocyanin yield followed by solid toliquid ratio and extraction time. Positive coefficient indicateda linear effect to increase 𝑌 whereas negative coefficientindicated a linear effect to decrease 𝑌.
For methanolic extraction, the anthocyanin yield canbe increased with the increase of extraction temperature asshown in Figure 2(a). The positive linear effect (𝑃 < 0.01)and significant negative quadratic effect (𝑃 < 0.05) of timehave resulted in a curvilinear increase in anthocyanin yieldfor all the extraction time. It could be seen in Figures 2(a)and 2(c) that an increase of time beyond a certain limit of thetested range has resulted in the increase of the anthocyaninyield. As temperature and solid to liquid ratio have a strongereffect compared to time for methanolic extraction, excessiveextraction time might not be effective for the extraction
process. Long exposure at high temperatures would bedetrimental to the desired compound as it would undergo theprocess of oxidation and polymerization. In addition, from anindustrial point of view, longer extraction time means lowerefficiency of equipment utilization [2]. Figure 2(b) showedthat the increase of anthocyanin yield caused by temperatureand solid to liquid ratio was almost linear.Therefore, at a fixedextraction time and by increasing the extraction temperaturethe result was as good as increasing the solid to liquid ratio.
Table 3 showed that, for ethanolic extraction, theextraction temperature and time play an important role indetermining anthocyanin yield. The effects of extractiontemperature and time on anthocyanin yield are shown inFigure 2(d). Because both of the variables playedmore promi-nent role in the extraction efficiency for ethanolic extraction,by increasing temperature and time, the total anthocyanincontent increases significantly. By heating, it gives energyto the molecules in the system to vibrate thus weakeningthe bond between compounds, disrupting cell membrane,and causing the compound in the cell compartment to spillout into the solvent. Figures 2(e) and 2(f) showed that theincreasing of time and temperature increase anthocyaninyield with the increasing of the solid to liquid ratio up to
The Scientific World Journal 5
Table 3: ANOVA for response surface quadratic model.
Source Coefficient estimate Sum of squares df Mean square 𝐹-value 𝑃-value RemarksAcidified methanolic extraction
Model 1114.595 152059.256 9 16895.473 26.906 0.0001 Significant𝑋1
103.359 85464.893 1 85464.893 136.105 <0.0001𝑋2
26.475 5607.274 1 5607.274 8.930 0.0203𝑋3
68.744 37805.617 1 37805.617 60.206 0.0001𝑋12
−45.922 8435.296 1 8435.296 13.433 0.0080𝑋13
22.196 1970.579 1 1970.579 3.138 0.1198𝑋23
9.254 342.543 1 342.543 0.546 0.4842𝑋1
2 24.728 2574.683 1 2574.683 4.100 0.0825𝑋2
2−48.608 9948.234 1 9948.234 15.843 0.0053
𝑋3
2 11.160 524.442 1 524.442 0.835 0.3912Residual 4395.537 7 627.934Lack of fit 874.804 3 291.601 0.331 0.8045 Not significantPure error 3520.733 4 880.183Cor total 156454.793 16
Acidified ethanolic extractionModel 664.170 162047.676 9 18005.297 16.224 0.0007 Significant𝑋1
118.806 112918.450 1 112918.450 101.747 <0.0001𝑋2
57.681 26616.436 1 26616.436 23.983 0.0018𝑋3
31.763 8070.915 1 8070.915 7.272 0.0308𝑋12
7.237 209.468 1 209.468 0.189 0.6770𝑋13
−3.966 62.917 1 62.917 0.057 0.8186𝑋23
−8.071 260.580 1 260.580 0.235 0.6428𝑋1
2 31.220 4103.958 1 4103.958 3.698 0.0959𝑋2
2−11.849 591.175 1 591.175 0.533 0.4892
𝑋3
2−48.100 9741.404 1 9741.404 8.778 0.0210
Residual 7768.593 7 1109.799Lack of fit 6069.165 3 2023.055 4.762 0.0829 Not significantPure error 1699.428 4 424.857Cor total 169816.269 16
Internally studentized residuals
Nor
mal
% p
roba
bilit
y
0.00 1.00 2.00
1
51020305070809095
99
−2.00 −1.00
(a)
Internally studentized residuals
Nor
mal
% p
roba
bilit
y
0.00 1.00 2.00 3.00
1
51020305070809095
99
−2.00−3.00 −1.00
(b)
Figure 1: Normal probability plots of residuals for (a) methanolic extraction and (b) ethanolic extraction.

6 The Scientific World Journal
30.00 36.00 42.00 48.00 54.00 60.0060.0066.0072.0078.0084.0090.0096.00
102.00108.00114.00120.00
Tim
e (m
in)
1000
1100 12005
Temperature (∘C)
Anthocyanin yield (mg/100 g)
(a)
30.00 36.00 42.00 48.00 54.00 60.005.00
11.00
17.00
23.00
29.00
35.00
Solid
-liqu
id ra
tio (g
/mL)
11001200
1300
5
Temperature (∘C)
Anthocyanin yield (mg/100 g)
(b)
60.00 72.00 84.00 96.00 108.00 120.005.00
11.00
17.00
23.00
29.00
35.00
Time (min)
Solid
-liqu
id ra
tio (g
/mL)
1000
1050
1050
1100
1150
5
(c)
30.00 36.00 42.00 48.00 54.00 60.0060.0066.0072.0078.0084.0090.0096.00
102.00108.00114.00120.00
Tim
e (m
in)
600700
800
5
Temperature (∘C)
(d)
30.00 36.00 42.00 48.00 54.00 60.005.00
11.00
17.00
23.00
29.00
35.00
solid
-liqu
id ra
tio (g
/mL)
500
600 700
800
5
Temperature (∘C)
(e)
60.00 72.00 84.00 96.00 108.00 120.005.00
11.00
17.00
23.00
29.00
35.00
Time (min)
solid
-liqu
id ra
tio (g
/mL)
550
600
600
650
700
5
(f)
Figure 2: Contour plot showing the effects of variables for (a–c) methanolic extraction and (d-f) ethanolic extraction.
a certain limit of the tested range. However, further increasesof solid to liquid ratio did not translate into significantimprovement in the yield. This can be seen in Table 3; thevalues of positive linear effect and negative quadratic effect ofsolid to liquid ratio are significant (𝑃 < 0.05). This observa-tion can be explained by the fact that the system has becomesaturated as the solute has entirely dissolved in the fluid.
3.4. Perturbation Plot. Pertubation plot shows howa functionof a certain factor responded as the level of that factorchanges, when the other factors are fixed at their optimum
levels [22]. A steep slope or curvature in the plots indicatesthe sensitivity of the response factor [23]. Pertubation plotfor methanolic and ethanolic (Figures 3(a) and 3(b), resp.)extractions were used to assess the effect of each factor on theyield. For the methanolic extraction, identical anthocyaninyield increment was observed as the temperature and solid toliquid ratio factors were increased while the yield decreasesas the extraction time factor was increased. This shows that,for methanolic extraction, factors such temperature and solidto liquid ratio would influence the amount of anthocyaninextracted. For ethanolic extraction, by comparing the slope

The Scientific World Journal 7
Table 4: Box-Behnken design arrangement and responses.
Run 𝑋1
𝑋2
𝑋3
Anthocyanin yield∗ (mg/100 g) Anthocyanin yield∗ (mg/100 g)(acidified methanolic extraction) (acidified ethanolic extraction)
𝑌exp 𝑌pre % sd 𝑌exp 𝑌pre % sd1 45 90 20 1132.18 1114.60 3.40 654.60 664.17 2.652 60 120 20 1164.47 1110.16 1.32 897.29 867.26 3.463 30 60 20 925.12 1114.60 1.10 484.27 514.29 8.364 45 90 20 1154.45 1114.60 2.84 633.44 664.17 1.855 45 60 5 982.45 1114.60 2.75 537.70 506.71 2.196 45 90 20 1094.33 1000.58 1.74 685.77 664.17 3.137 30 120 20 1065.39 1213.52 4.05 612.29 615.18 4.418 45 120 5 1021.42 1025.63 3.10 642.07 638.21 2.089 45 90 20 1079.86 1162.90 4.65 676.86 664.17 4.2510 60 90 5 1177.27 914.96 2.87 704.42 738.30 3.9511 45 120 35 1190.35 1181.62 4.29 654.60 685.59 1.7912 45 60 35 1114.37 991.18 4.28 582.51 586.38 7.7913 30 90 5 999.15 1344.78 2.65 491.78 492.76 1.1814 60 60 20 1207.89 1114.60 3.10 740.32 737.43 9.9015 30 90 35 1079.31 1093.67 7.93 598.10 564.21 8.3116 60 90 35 1346.21 1059.75 5.70 794.87 793.89 0.0017 45 90 20 1112.15 1174.63 3.16 670.18 664.17 3.32∗Data are presented as mean of triplicate analyses.𝑋1: temperature;𝑋2: time;𝑋3: solid-liquid ratio.% sd < 10 is considered significant.
Table 5: Experiment confirmation of predicted value at optimal extraction condition.
Optimal levelsAnthocyanin yield (mg/100 g)
𝑌predictedExperimental value Mean∗ Relative errora (%)
1 2 3Acidified methanolic extraction 1345.320 1297.503 1437.774 1303.348 1346.208 0.066𝑋1= 60∘C𝑋2= 120min𝑋3= 0.5 g : 23.1mL
Acidified ethanolic extraction 869.290 878.355 886.060 878.355 880.923 1.321𝑋1= 60∘C𝑋2= 86.89min𝑋3= 0.5 g : 35mL
aRelative error (%) = [(experimental value − predicted value)/experimental value] × 100%.Mean is average value from triplicate of experimental run.
of every factor, it was seen that temperature is dominantcompared to time in terms of the influence it had onanthocyanin yield. For solid to liquid ratio, it plays a minimalinfluence on anthocyanin yield.
3.5. Verification of Optimized Condition and Predictive Model.Optimization of anthocyanin extraction from M. mala-bathricum fruit was performed by using numerical optimiza-tion. The Design-Expert software used searches for a combi-nation of factor levels that simultaneously satisfy the require-ments placed on each of the responses and factors. Opti-mization requires that goals (i.e., none,maximum,minimum,target, or in range) are set for the variables and response
where all goals then get combined into one desirabilityfunction. To find a good set of conditions that willmeet all thegoals, the three variables (i) extraction temperature (30∘C–60∘C), (ii) extraction time (60–120min), and (iii) solid toliquid ratio (g/mL) were set within range while anthocyaninyield was set at maximum.The “importance” of goals (option1–5) for all variables was considered to be equally importantin a setting of 3. For response, the “importance” was set at 5 inorder to meet the objective of getting maximum anthocyaninyield. By applying the desirability function approach, theoptimum level of various parameters was obtained as showedin Table 5. Figure 4 showed desirability ramps that weredeveloped from optimum points via numerical optimization.

8 The Scientific World Journal
Deviation from reference point (coded units)
Ant
hocy
anin
yie
ld
0.000 0.500 1.000
1000
1100
1200
1300
1400
−1.000 −0.500
A
A
B
B
C
C
(a)
500
600
700
800
900
Deviation from reference point (coded units)
Ant
hocy
anin
yie
ld
0.000 0.500 1.000−1.000 −0.500
A
A
B
B
CC
(b)
Figure 3: Perturbation plots for (a) methanolic extraction at temperature 60∘C; time 120min; solid to liquid ratio 23.1 g/mL and (b) ethanolicextraction at temperature 60∘C; time 86.89min; solid to liquid ratio 35 g/mL.
30.00 60.00 60.00 120.00
5.00 35.00 925.118 1346.21
A: temperature = 60.00 B: time = 86.85
C: solid-liquid ratio = 35.00 Anthocyanin yield = 1345.32
Desirability = 0.998
(a)
30.00 60.00 60.00 120.00
5.00 35.00 484.268 897.287
A: temperature = 60.00
C: solvent = 23.08 Anthocyanin yield = 869.286
Desirability = 0.932
B: time = 120.00
(b)
Figure 4: Desirability ramp of optimization for (a) methanolicextraction and (b) ethanolic extraction.
A triplicate experiment was set up to validate theoptimized condition. As shown in Table 5, the experi-mental data were in good agreement with the predictedvalues for methanolic and ethanolic extractions. Relativeerror between predicted and experimental values fell at0.066% (1346.208mg/100 g) and 1.321% (880.923mg/100 g)for methanolic and ethanolic extractions, respectively. Theverification value for anthocyanin yield obtained is within99% of predicted values which clearly showed that the modelfitted the experimental data verywell and therefore optimized
the anthocyanin extraction efficiently within the specifiedrange of process parameters.
3.6. Identification of Anthocyanin. Figure 5 showed the massspectra for (Figures 5(a)–5(c)) positive mode and (Figures5(d)-5(e)) negative mode of anthocyanin-rich extract of M.malabathricum by UPLC-ESI-MS/MS. Figure 5(a) (retentiontime 𝑡
𝑅= 0.763min), with M+ at m/z 611.3, was identified
as cyanidin dihexoside and fragments ions at m/z 449.1and m/z 287.2 corresponded to cyanidin. Figure 5(b) (𝑡
𝑅=
2.841min), with M+ at m/z 449.1, was identified as cyanidinhexoside and fragment ions at m/z 287.2. Figure 5(c) (𝑡
𝑅=
2.950min), with M+ at m/z 287.2, was identified as cyanidinaglycone. Figure 5(d) (𝑡
𝑅= 0.762min), with M− at m/z
627.2, was identified as delphinidin dihexoside and fragmentsions atm/z 465.1 andm/z 303.1 corresponded to delphinidin.Figure 5(e) (𝑡
𝑅= 2.510min), with M− at m/z 465.1, was
identified as delphinidin hexoside and fragment ions at m/z303.1.
4. Conclusion
The experimental design approach using RSM was success-fully applied in the optimization of anthocyanins from M.malabathricum fruit. Under optimum condition, methanolicextraction showed the highest anthocyanin yield whichwas 1345.32mg/100 g compared to ethanolic extraction,869.29mg/100 g. By using the optimum condition estab-lished, anthocyanin pigments from methanolic extractioncan be applied as natural colourants in coating products,textiles, and solar cell industry whereas anthocyanin pig-ments from ethanolic extraction are recommended for foodapplications due to thier GRAS (generally recognized assafe) qualification. In this study, among three parameterstested, temperature was found to be the most prominentfactor affecting the efficiency of anthocyanin extraction. M.malabathricum fruit was tentatively identified to contain

The Scientific World Journal 9
+EPI (611.33) charge (+1) CE (35) CES (15) FT (50): exp 2, 0.763min from sample 1(10-1) of 10.wiff (turbo spray), centroided
1.2e8
1e8
8e7
6e7
4e7
2e7
0.00In
tens
ity (c
ps)
m/z (Da)50 150 250 350 450 550 650 750 850 950 1050 1150
Max. 1.2e8 cps.
(a)
+EPI (449.20) charge (+1) CE (35) CES (15) FT (50): exp 2, 2.841min from sample 1(10-1) of 10.wiff (turbo spray), centroided
Inte
nsity
(cps
)
m/z (Da)50 150 250 350 450 550 650 750 850 950 1050 1150
Max. 9.7e7 cps.
9.7e7
8e7
6e7
4e7
2e7
0.0
(b)
Inte
nsity
(cps
)
m/z (Da)50 150 250 350 450 550 650 750 850 950 1050 1150
+EPI (287.37) charge (+1) CE (35) CES (15) FT (50): exp 2, 2.950min from sample 1(10-1) of 10.wiff (turbo spray), centroided
Max. 1.7e7 cps.
0.0
5e6
1e7
1.5e7
1.7e7
(c)
Inte
nsity
(cps
)
m/z (Da)50
0.0150 250 350 450 550 650 750 850 950 1050 1150
Max. 3.1e7 cps.
5e6
1e7
1.5e7
2e7
2.5e7
3e7
−EPI (627.42) charge (+1) FT (50): exp 2, 0.762min from sample 4(Neg 10-1) of 10.wiff (turbo spray), centroided
(d)
Inte
nsity
(cps
)
m/z (Da)50
0.0150 250 350 450 550 650 750 850 950 1050 1150
−EPI (465.22) charge (+1) FT (50): exp 2, 2.510min from sample 4
5e6
1e7
1.5e7
1.8e7
Max. 1.8e7 cps.
(Neg 10-1) of 10.wiff (turbo spray), centroided
(e)
Figure 5: Mass spectra of anthocyanin-rich extract after gel filtration using Sephadex LH-20: (a–c) positive mode and (d-e) negative mode.

10 The Scientific World Journal
cyanidin dihexoside, cyanidin hexoside, cyanidin, delphini-din dihexoside, and delphinidin hexoside.
Abbreviations
RSM: Response surface methodologyUPLC-ESI-MS/MS: Ultra performance liquid
chromatography electrospray tandemmass spectrometry
BBD: Box-Behnken design.
Acknowledgments
The authors gratefully acknowledge The Institute ofResearch Management and Monitoring (IPPP), Universityof Malaya, Kuala Lumpur, Malaysia, for the research GrantsPV082/2012A, BK024-2011A, and RP003B-13AFR and TheInstitute of Biological Sciences, Faculty of Science, Universityof Malaya, Kuala Lumpur, Malaysia, for providing thefacilities to carry out this research.
References
[1] T. A. Holton and E. C. Cornish, “Genetics and biochemistry ofanthocyanin biosynthesis,” Plant Cell, vol. 7, no. 7, pp. 1071–1083,1995.
[2] J. Shi, J. Yu, J. Pohorly, J. C. Young, M. Bryan, and Y. Wu,“Optimization of the extraction of polyphenols from grapeseed meal by aqueous ethanol solution,” Food, Agriculture &Environment, vol. 1, no. 2, pp. 42–47, 2003.
[3] K. A. Aduloju, M. B. Shitta, and S. Justus, “Effect of extractingsolvents on the stability and performances of dye-sensitizedsolar cell prepared using extract from Lawsonia Inermis,”Fundamental Journal Modern Physics, vol. 1, no. 2, pp. 261–268,2011.
[4] N. M. Gomez-Ortız, I. A. Vazquez-Maldonado, A. R. Perez-Espadas, G. J. Mena-Rejon, J. A. Azamar-Barrios, and G.Oskam, “Dye-sensitized solar cells with natural dyes extractedfrom achiote seeds,” Solar Energy Materials and Solar Cells, vol.94, no. 1, pp. 40–44, 2010.
[5] N. Aziz, N. A. Mat Nor, A. F. Mohd-Adnan, R. M. Taha, and A.K. Arof, “Study of anthocyanin stability derived from the fruitpulp ofMelastomamalabathricum in a coating system,” Pigment& Resin Technology, vol. 41, no. 4, pp. 223–2229, 2012.
[6] E. E. Nicoue, S. Savard, and K. Belkacemi, “Anthocyaninsin wild blueberries of Quebec: extraction and identification,”Journal of Agricultural and Food Chemistry, vol. 55, no. 14, pp.5626–5635, 2007.
[7] H. M. Sirat, D. Susanti, F. Ahmad, H. Takayama, and M.Kitajima, “Amides, triterpene and flavonoids from the leaves ofMelastomamalabathricum L,” Journal of Natural Medicines, vol.64, no. 4, pp. 492–495, 2010.
[8] D. X. Hou, T. Ose, S. Lin et al., “Anthocyanidins induceapoptosis in human promyelocytic leukemia cells: structure-activity relationship and mechanisms involved,” InternationalJournal of Oncology, vol. 23, no. 3, pp. 705–712, 2003.
[9] K.-T. Kim, T.-K. Nam, Y.-S. Park, Y.-B. Kim, and S.-W. Park,“Neuroprotective effect of anthocyanin on experimental trau-matic spinal cord injury,” Journal of Korean NeurosurgicalSociety, vol. 49, no. 4, pp. 205–211, 2011.
[10] Y. Yang, Z. Shi, A. Reheman, J. W. Jin, and C. Li, “Plant fooddelphinidin-3-glucoside significantly inhibits platelet activationand thrombosis: novel protective roles against cardiovasculardiseases,” PLoS ONE, vol. 7, no. 5, 2012.
[11] W. Wong, Melastoma malabathricum: Too Beautiful To BeCalled A Weed, Green Culture, 2008, http://www.greencul-turesg.com/articles/july08/july08 melastomam.pdf.
[12] S. M. Joffry, N. J. Yob, M. S. Rofiee et al., “Melastoma mal-abathricum (L.) smith ethnomedicinal uses, chemical con-stituents, and pharmacological properties: a review,” Evidence-based Complementary and Alternative Medicine, vol. 2012,Article ID 258434, 48 pages, 2012.
[13] C. L. Ringmichon, S. N. Shimpi, and B. Gopalkrishnan, “Eth-nomedicinal investigation on Melastoma malabathricum Linn.from Manipur,” Journal of Herbal Medicine and Toxicology, vol.4, no. 2, pp. 141–144, 2010.
[14] H. M. Sirat, D. Susanti, F. Ahmad, H. Takayama, and M.Kitajima, “Amides, triterpene and flavonoids from the leaves ofMelastomamalabathricum L,” Journal of Natural Medicines, vol.64, no. 4, pp. 492–495, 2010.
[15] G. D. S. C. Borges, F. G. K. Vieira, C. Copetti, L. V. Gonzaga,and R. Fett, “Optimization of the extraction of flavanols andanthocyanins from the fruit pulp of Euterpe edulis using theresponse surface methodology,” Food Research International,vol. 44, no. 3, pp. 708–715, 2011.
[16] H. H. Wijngaard and N. Brunton, “The optimisation ofsolid-liquid extraction of antioxidants from apple pomace byresponse surface methodology,” Journal of Food Engineering,vol. 96, no. 1, pp. 134–140, 2010.
[17] J. Lee, R. W. Durst, and R. E. Wrolstad, “Determination oftotal monomeric anthocyanin pigment content of fruit juices,beverages, natural colorants, and wines by the pH differentialmethod: collaborative study,” Journal of AOAC International,vol. 88, no. 5, pp. 1269–1278, 2005.
[18] F. Lopes-Da-Silva, S. De Pascual-Teresa, J. Rivas-Gonzalo, andC. Santos-Buelga, “Identification of anthocyanin pigments instrawberry (cv Camarosa) by LC using DAD and ESI-MSdetection,” European Food Research and Technology, vol. 214, no.3, pp. 248–253, 2002.
[19] D. C. Montgomery, Design and Analysis of Experiments, JonWiley & Sons, New York, NY, USA, 2009.
[20] A. Kumar, B. Prasad, and I.M.Mishra, “Optimization of processparameters for acrylonitrile removal by a low-cost adsorbentusing Box-Behnken design,” Journal of Hazardous Materials,vol. 150, no. 1, pp. 174–182, 2008.
[21] J. P. Maran and S. Manikandan, “Response surface modelingand optimization of process parameters for aqueous extractionof pigments fromprickly pear (Opuntia ficus-indica) fruit,”Dyesand Pigments, vol. 95, no. 3, pp. 465–472, 2012.
[22] S. Oh, S. Rheem, J. Sim, S. Kim, and Y. Baek, “Optimizingconditions for the growth of Lactobacillus casei YIT 9018 intryptone-yeast extract-glucose medium by using response sur-face methodology,” Applied and Environmental Microbiology,vol. 61, no. 11, pp. 3809–3814, 1995.
[23] M. J. Anderson and P. J. Whitcomb, RSM Simplified: OptimizingProcesses Using Response Surface Methods For Design of Experi-ments, Productivity Press, 2005.

Submit your manuscripts athttp://www.hindawi.com
Hindawi Publishing Corporationhttp://www.hindawi.com Volume 2014
Anatomy Research International
PeptidesInternational Journal of
Hindawi Publishing Corporationhttp://www.hindawi.com Volume 2014
Hindawi Publishing Corporation http://www.hindawi.com
International Journal of
Volume 2014
Zoology
Hindawi Publishing Corporationhttp://www.hindawi.com Volume 2014
Molecular Biology International
GenomicsInternational Journal of
Hindawi Publishing Corporationhttp://www.hindawi.com Volume 2014
The Scientific World JournalHindawi Publishing Corporation http://www.hindawi.com Volume 2014
Hindawi Publishing Corporationhttp://www.hindawi.com Volume 2014
BioinformaticsAdvances in
Marine BiologyJournal of
Hindawi Publishing Corporationhttp://www.hindawi.com Volume 2014
Hindawi Publishing Corporationhttp://www.hindawi.com Volume 2014
Signal TransductionJournal of
Hindawi Publishing Corporationhttp://www.hindawi.com Volume 2014
BioMed Research International
Evolutionary BiologyInternational Journal of
Hindawi Publishing Corporationhttp://www.hindawi.com Volume 2014
Hindawi Publishing Corporationhttp://www.hindawi.com Volume 2014
Biochemistry Research International
ArchaeaHindawi Publishing Corporationhttp://www.hindawi.com Volume 2014
Hindawi Publishing Corporationhttp://www.hindawi.com Volume 2014
Genetics Research International
Hindawi Publishing Corporationhttp://www.hindawi.com Volume 2014
Advances in
Virolog y
Hindawi Publishing Corporationhttp://www.hindawi.com
Nucleic AcidsJournal of
Volume 2014
Stem CellsInternational
Hindawi Publishing Corporationhttp://www.hindawi.com Volume 2014
Hindawi Publishing Corporationhttp://www.hindawi.com Volume 2014
Enzyme Research
Hindawi Publishing Corporationhttp://www.hindawi.com Volume 2014
International Journal of
Microbiology