Embed Size (px)
Citation preview
RESEARCH ARTICLE Open Access
The evolutionary history of the SAL1 genefamily in eutherian mammalsCamille Meslin1,2,3,4, Fanny Brimau5, Patricia Nagnan-Le Meillour5, Isabelle Callebaut6, Géraldine Pascal1,2,3,4 andPhilippe Monget1,2,3,4*
Abstract
Background: SAL1 (salivary lipocalin) is a member of the OBP (Odorant Binding Protein) family and is involved inchemical sexual communication in pig. SAL1 and its relatives may be involved in pheromone and olfactoryreceptor binding and in pre-mating behaviour. The evolutionary history and the selective pressures acting on SAL1and its orthologous genes have not yet been exhaustively described. The aim of the present work was to studythe evolution of these genes, to elucidate the role of selective pressures in their evolution and the consequencesfor their functions.
Results: Here, we present the evolutionary history of SAL1 gene and its orthologous genes in mammals. We foundthat (1) SAL1 and its related genes arose in eutherian mammals with lineage-specific duplications in rodents, horseand cow and are lost in human, mouse lemur, bushbaby and orangutan, (2) the evolution of duplicated genes ofhorse, rat, mouse and guinea pig is driven by concerted evolution with extensive gene conversion events inmouse and guinea pig and by positive selection mainly acting on paralogous genes in horse and guinea pig,(3) positive selection was detected for amino acids involved in pheromone binding and amino acids putativelyinvolved in olfactory receptor binding, (4) positive selection was also found for lineage, indicating a species-specificstrategy for amino acid selection.
Conclusions: This work provides new insights into the evolutionary history of SAL1 and its orthologs. On onehand, some genes are subject to concerted evolution and to an increase in dosage, suggesting the need forhomogeneity of sequence and function in certain species. On the other hand, positive selection plays a role in thediversification of the functions of the family and in lineage, suggesting adaptive evolution, with possibleconsequences for speciation and for the reinforcement of prezygotic barriers.
BackgroundThe barriers that lead to divergence of species duringthe course of evolution were classified by Dobzhansky intwo categories: prezygotic and postzygotic reproductivebarriers [1]. Postzygotic reproductive barriers concernall the events that occur after fertilization, such asreduced hybrid viability and fertility, while prezygoticreproductive barriers concern isolation of sexual part-ners via ecological, temporal or behavioral isolation.Pheromones play a key role in pre-mating recognitionof sexual partners [2]. These compounds are defined assubstances released by an animal that are able to induce
specific behavioral and/or endocrinological reactions ina sexual partner of the same species [3]. Through thesereactions, they could be involved in mate choice andsexual selection.Odorant binding proteins (OBP) are small soluble pro-
teins that are present in the olfactory apparatus as well asin biological fluids such as saliva, urine or vaginal dis-charge, and are able to bind pheromones (for review see[4]). OBP are assumed to be directly involved in chemicalcommunication and in the pre-mating recognition pro-cess. Three hypotheses are proposed concerning theirmechanism of action. The first is that olfactory receptorscan recognize the OBP/pheromone complex, not just thepheromone alone. The second hypothesis is that the pher-omone can be transferred to olfactory receptors only ifassisted by the OBP. The third hypothesis is that the
* Correspondence: [email protected] Physiologie de la Reproduction et des Comportements, INRA,Nouzilly, F-37380, FranceFull list of author information is available at the end of the article
Meslin et al. BMC Evolutionary Biology 2011, 11:148http://www.biomedcentral.com/1471-2148/11/148
© 2011 Meslin et al; licensee BioMed Central Ltd. This is an Open Access article distributed under the terms of the Creative CommonsAttribution License (http://creativecommons.org/licenses/by/2.0), which permits unrestricted use, distribution, and reproduction inany medium, provided the original work is properly cited.
ligand can spontaneously dissociate from the complexwith OBP and bind to the receptor as a “free pheromone”[5].The role of saliva in chemical communication between
males and females is well established in pig [6], like therole of urine in mouse [7]. In pig, saliva contains thepheromonal steroids 5a-androst-16-en-3-one and 5a-androst-16-en-3a-ol, as well as abundant quantities ofsalivary lipocalin (SAL1), the most abundant OBP iso-lated from submaxillary glands of mature males. Whenextracted from its source, this protein is associated withboth pheromonal steroids [8], and appears to play a keyrole in the standing reflex in the sow [6] and also in theboar’s libido [9]. SAL1 is also expressed in the nasal andvomeronasal area, but devoid of ligand [10,11]. SAL1exhibits a classical structure of lipocalins characterizedby a fully conserved N-terminal -G-X-W- motif and thetypical folding pattern of a nine-stranded antiparallelb-barrel forming an internal ligand binding site forsmall hydrophobic molecules [12], despite relatively lowsequence similarity [13]. SAL1 also possesses a glycosy-lation site on Asn53. Two natural variants have beenidentified in which in three residues differ (Val61, Ile64and Ala89 of isoform A are respectively Ala, Val andVal in isoform B). Two residues (Val61 and Ala89) arelocated inside the b-barrel while the third residue(Ile64) is located next to the b-barrel, suggesting thatthese minor structural differences lead to ligand bindingspecificities [14].Olfactory receptors are located on the olfactory sen-
sory neurons of the main olfactory system in mammalsand on the vomeronasal organ in rodents and othernon-primate species [15]. Several authors examined theevolution of olfactory receptors, but few studies of lipo-calins and OBP have been performed. Ganfornina et al.[16] undertook phylogenetic analysis of prokaryotic andeukaryotic lipocalins and showed that this familyappeared early and is composed of 13 monophyleticclades. These authors also showed that ancestral lipoca-lin clades in the phylogenetic tree are able to bind largeligands while more recent lipocalin clades, such asclades composed of OBP and MUP (Mouse UrinaryProtein), bind smaller ligands. They also found that laterclades had higher rates of amino acid substitution, moreflexible protein structures and greater ligand-bindingefficiency than more ancestral lipocalins.Logan et al. [17] undertook an extensive study of the
Mup cluster in the mouse genome. They identified 21Mup genes and 21 Mup pseudogenes on chromosome4. They also identified Mup gene expansion in rat (9genes and 13 pseudogenes), in horse (3 genes) and inmouse lemur (2 genes and 1 pseudogene) in the samesyntenic region. Orangutan, chimpanzee, dog, pig (withSAL1), bushbaby and rhesus monkey have only one
Mup gene in the syntenic region. The inferred phylo-geny, the accumulation of synonymous substitutions,and the genomic organization of the Mup loci suggestthat gene expansion occurred independently in severalspecies [17].In the light of previous analyses, the aim of the pre-
sent work was to study the evolution of SAL1 which isinvolved in pre-mating recognition in pig. We wanted todetermine if selective pressures act on these proteinsand to check if positive selection may play a role inbinding specificity toward ligands or olfactory receptors.
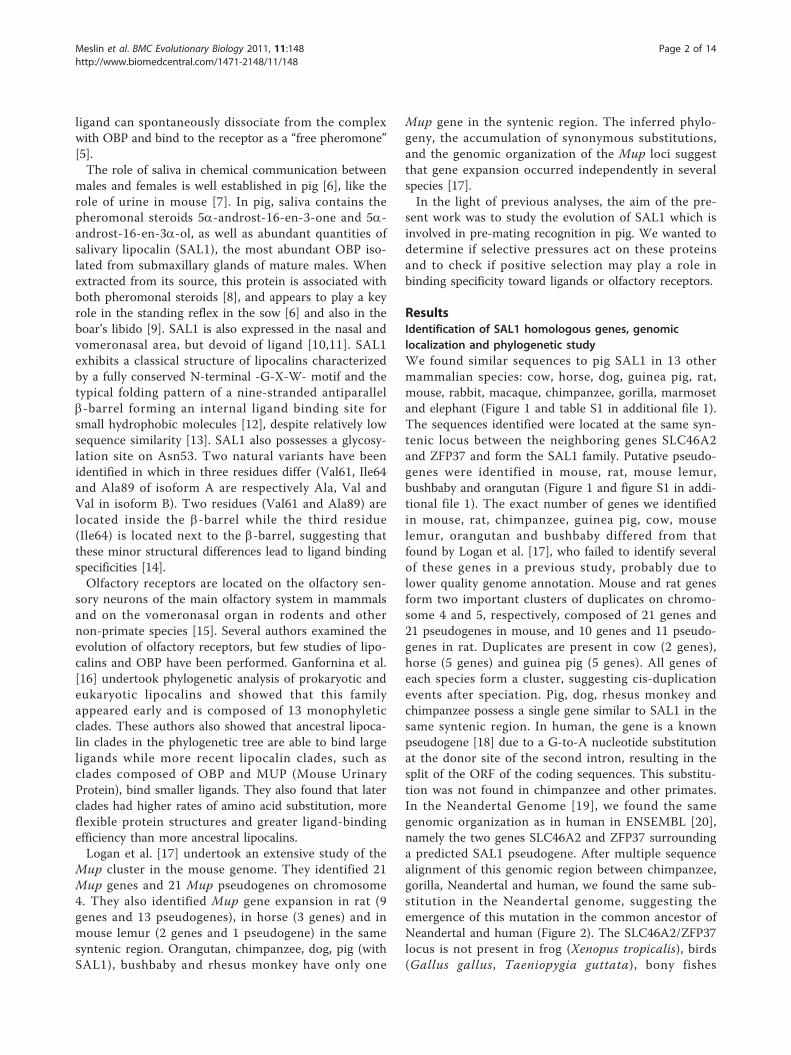
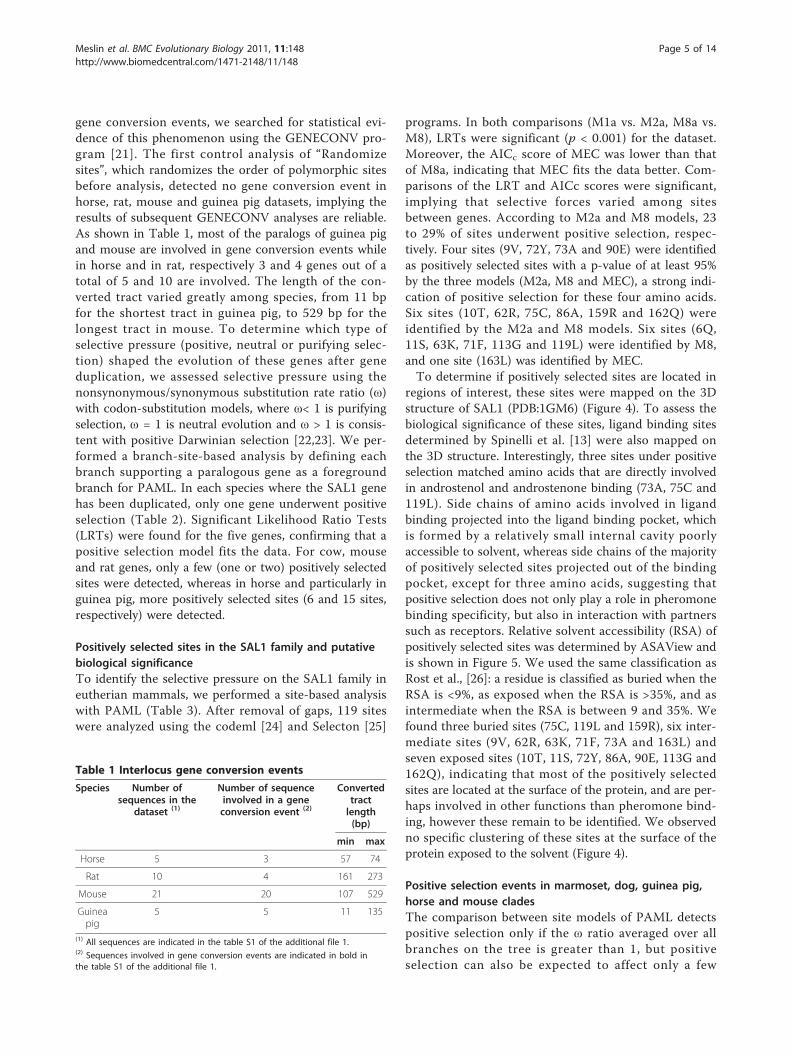
ResultsIdentification of SAL1 homologous genes, genomiclocalization and phylogenetic studyWe found similar sequences to pig SAL1 in 13 othermammalian species: cow, horse, dog, guinea pig, rat,mouse, rabbit, macaque, chimpanzee, gorilla, marmosetand elephant (Figure 1 and table S1 in additional file 1).The sequences identified were located at the same syn-tenic locus between the neighboring genes SLC46A2and ZFP37 and form the SAL1 family. Putative pseudo-genes were identified in mouse, rat, mouse lemur,bushbaby and orangutan (Figure 1 and figure S1 in addi-tional file 1). The exact number of genes we identifiedin mouse, rat, chimpanzee, guinea pig, cow, mouselemur, orangutan and bushbaby differed from thatfound by Logan et al. [17], who failed to identify severalof these genes in a previous study, probably due tolower quality genome annotation. Mouse and rat genesform two important clusters of duplicates on chromo-some 4 and 5, respectively, composed of 21 genes and21 pseudogenes in mouse, and 10 genes and 11 pseudo-genes in rat. Duplicates are present in cow (2 genes),horse (5 genes) and guinea pig (5 genes). All genes ofeach species form a cluster, suggesting cis-duplicationevents after speciation. Pig, dog, rhesus monkey andchimpanzee possess a single gene similar to SAL1 in thesame syntenic region. In human, the gene is a knownpseudogene [18] due to a G-to-A nucleotide substitutionat the donor site of the second intron, resulting in thesplit of the ORF of the coding sequences. This substitu-tion was not found in chimpanzee and other primates.In the Neandertal Genome [19], we found the samegenomic organization as in human in ENSEMBL [20],namely the two genes SLC46A2 and ZFP37 surroundinga predicted SAL1 pseudogene. After multiple sequencealignment of this genomic region between chimpanzee,gorilla, Neandertal and human, we found the same sub-stitution in the Neandertal genome, suggesting theemergence of this mutation in the common ancestor ofNeandertal and human (Figure 2). The SLC46A2/ZFP37locus is not present in frog (Xenopus tropicalis), birds(Gallus gallus, Taeniopygia guttata), bony fishes
Meslin et al. BMC Evolutionary Biology 2011, 11:148http://www.biomedcentral.com/1471-2148/11/148
Page 2 of 14
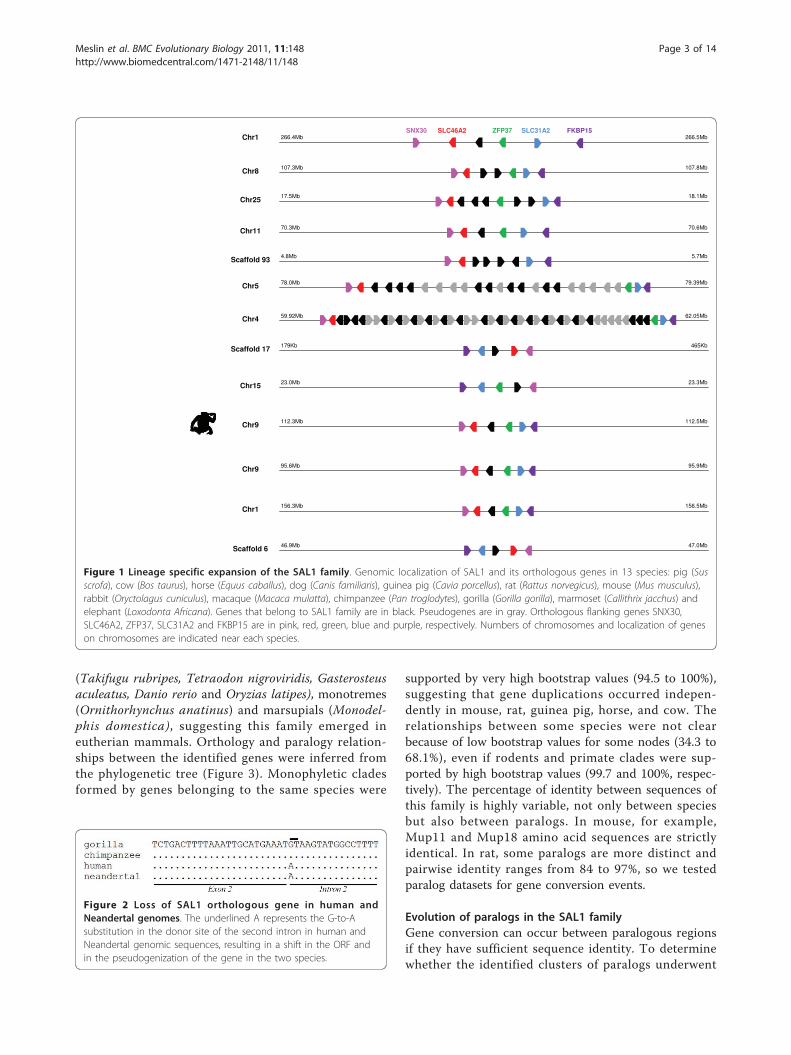
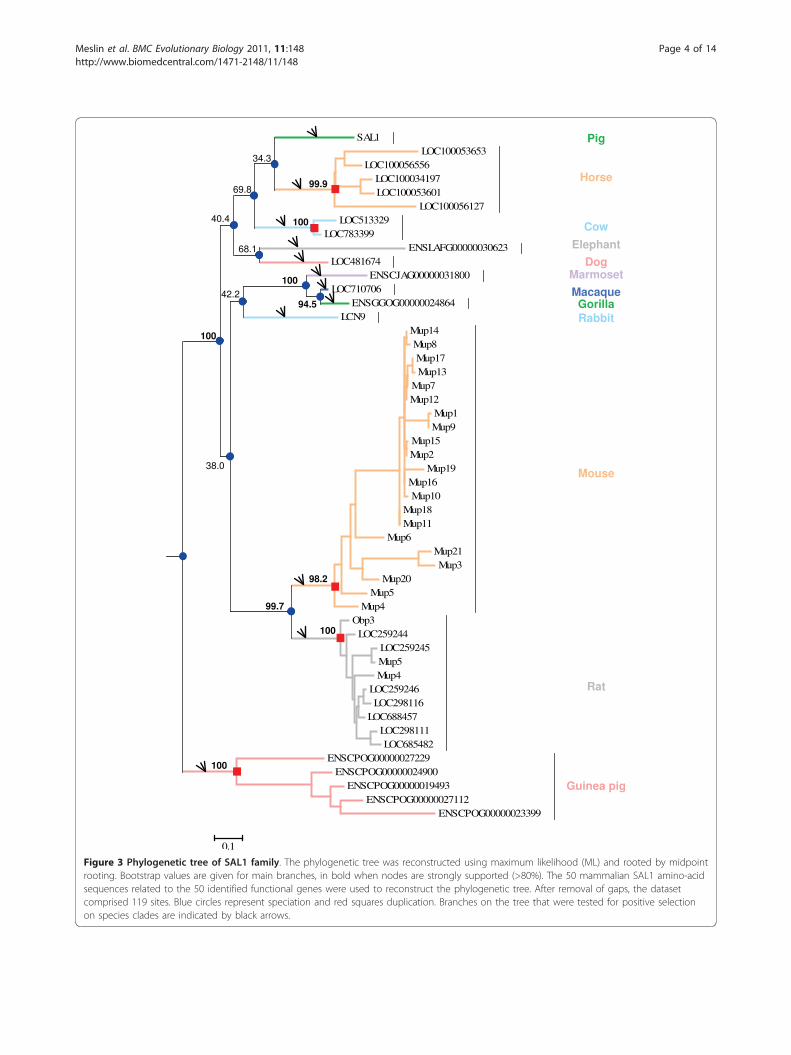
(Takifugu rubripes, Tetraodon nigroviridis, Gasterosteusaculeatus, Danio rerio and Oryzias latipes), monotremes(Ornithorhynchus anatinus) and marsupials (Monodel-phis domestica), suggesting this family emerged ineutherian mammals. Orthology and paralogy relation-ships between the identified genes were inferred fromthe phylogenetic tree (Figure 3). Monophyletic cladesformed by genes belonging to the same species were
supported by very high bootstrap values (94.5 to 100%),suggesting that gene duplications occurred indepen-dently in mouse, rat, guinea pig, horse, and cow. Therelationships between some species were not clearbecause of low bootstrap values for some nodes (34.3 to68.1%), even if rodents and primate clades were sup-ported by high bootstrap values (99.7 and 100%, respec-tively). The percentage of identity between sequences ofthis family is highly variable, not only between speciesbut also between paralogs. In mouse, for example,Mup11 and Mup18 amino acid sequences are strictlyidentical. In rat, some paralogs are more distinct andpairwise identity ranges from 84 to 97%, so we testedparalog datasets for gene conversion events.
Evolution of paralogs in the SAL1 familyGene conversion can occur between paralogous regionsif they have sufficient sequence identity. To determinewhether the identified clusters of paralogs underwent
Scaffold 6
Chr1
Chr8
Chr25
Chr11
Scaffold 93
Chr5
Chr4
Scaffold 17
Chr9
Chr1
Chr15
Chr9
23.0Mb 23.3Mb
59.92Mb 62.05Mb
107.3Mb 107.8Mb
17.5Mb 18.1Mb
70.3Mb 70.6Mb
4.8Mb 5.7Mb
78.0Mb 79.39Mb
179Kb 465Kb
112.3Mb 112.5Mb
95.6Mb 95.9Mb
156.3Mb 156.5Mb
46.9Mb 47.0Mb
266.4Mb 266.5MbZFP37SLC46A2 SLC31A2 FKBP15SNX30
Figure 1 Lineage specific expansion of the SAL1 family. Genomic localization of SAL1 and its orthologous genes in 13 species: pig (Susscrofa), cow (Bos taurus), horse (Equus caballus), dog (Canis familiaris), guinea pig (Cavia porcellus), rat (Rattus norvegicus), mouse (Mus musculus),rabbit (Oryctolagus cuniculus), macaque (Macaca mulatta), chimpanzee (Pan troglodytes), gorilla (Gorilla gorilla), marmoset (Callithrix jacchus) andelephant (Loxodonta Africana). Genes that belong to SAL1 family are in black. Pseudogenes are in gray. Orthologous flanking genes SNX30,SLC46A2, ZFP37, SLC31A2 and FKBP15 are in pink, red, green, blue and purple, respectively. Numbers of chromosomes and localization of geneson chromosomes are indicated near each species.
Figure 2 Loss of SAL1 orthologous gene in human andNeandertal genomes. The underlined A represents the G-to-Asubstitution in the donor site of the second intron in human andNeandertal genomic sequences, resulting in a shift in the ORF andin the pseudogenization of the gene in the two species.
Meslin et al. BMC Evolutionary Biology 2011, 11:148http://www.biomedcentral.com/1471-2148/11/148
Page 3 of 14
SAL1 LOC100053653
LOC100056556 LOC100034197 LOC100053601
LOC100056127 LOC513329
LOC783399 ENSLAFG00000030623
LOC481674 ENSCJAG00000031800
LOC710706 ENSGGOG00000024864
LCN9 Mup14 Mup8 Mup17 Mup13
Mup7 Mup12
Mup1 Mup9
Mup15 Mup2
Mup19 Mup16 Mup10
Mup18 Mup11
Mup6 Mup21 Mup3
Mup20 Mup5
Mup4 Obp3
LOC259244 LOC259245 Mup5 Mup4
LOC259246 LOC298116
LOC688457 LOC298111 LOC685482
ENSCPOG00000027229 ENSCPOG00000024900
ENSCPOG00000019493 ENSCPOG00000027112
ENSCPOG00000023399
0.1
Pig
Cow
Horse
Elephant
DogMarmoset
MacaqueGorillaRabbit
Mouse
Rat
Guinea pig
34.3
99.969.8
40.4 100
68.1
100
94.542.2
100
38.0
98.2
100
99.7
100
Figure 3 Phylogenetic tree of SAL1 family. The phylogenetic tree was reconstructed using maximum likelihood (ML) and rooted by midpointrooting. Bootstrap values are given for main branches, in bold when nodes are strongly supported (>80%). The 50 mammalian SAL1 amino-acidsequences related to the 50 identified functional genes were used to reconstruct the phylogenetic tree. After removal of gaps, the datasetcomprised 119 sites. Blue circles represent speciation and red squares duplication. Branches on the tree that were tested for positive selectionon species clades are indicated by black arrows.
Meslin et al. BMC Evolutionary Biology 2011, 11:148http://www.biomedcentral.com/1471-2148/11/148
Page 4 of 14
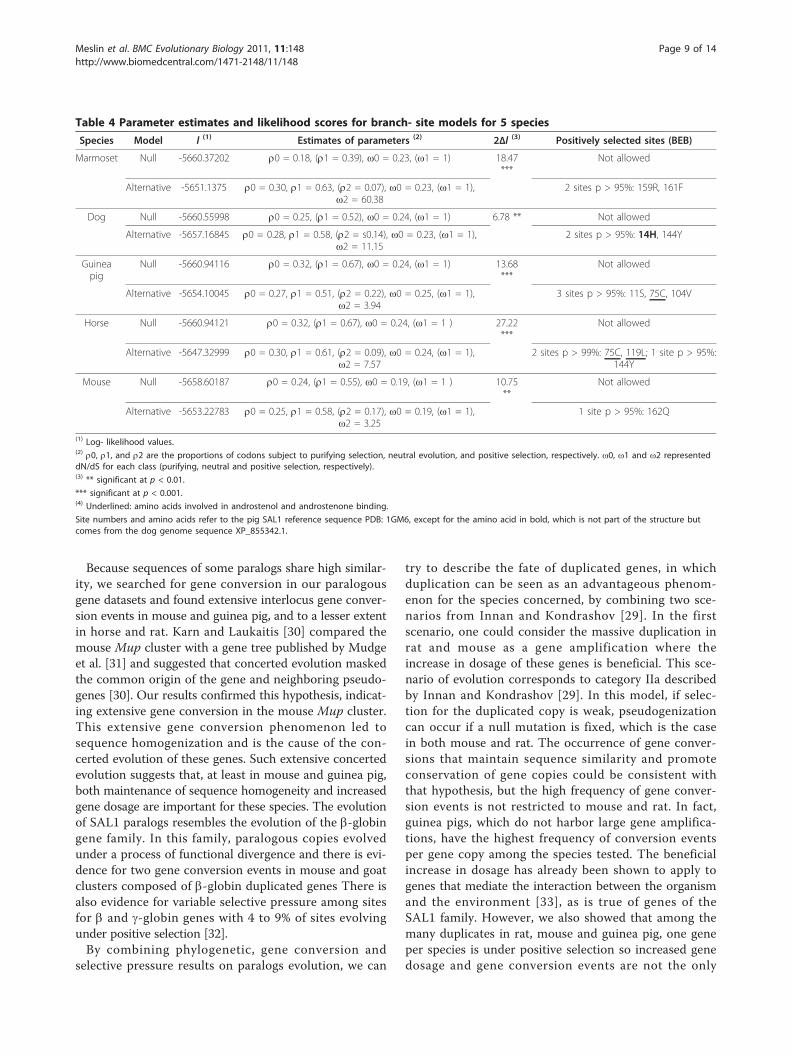
gene conversion events, we searched for statistical evi-dence of this phenomenon using the GENECONV pro-gram [21]. The first control analysis of “Randomizesites”, which randomizes the order of polymorphic sitesbefore analysis, detected no gene conversion event inhorse, rat, mouse and guinea pig datasets, implying theresults of subsequent GENECONV analyses are reliable.As shown in Table 1, most of the paralogs of guinea pigand mouse are involved in gene conversion events whilein horse and in rat, respectively 3 and 4 genes out of atotal of 5 and 10 are involved. The length of the con-verted tract varied greatly among species, from 11 bpfor the shortest tract in guinea pig, to 529 bp for thelongest tract in mouse. To determine which type ofselective pressure (positive, neutral or purifying selec-tion) shaped the evolution of these genes after geneduplication, we assessed selective pressure using thenonsynonymous/synonymous substitution rate ratio (ω)with codon-substitution models, where ω< 1 is purifyingselection, ω = 1 is neutral evolution and ω > 1 is consis-tent with positive Darwinian selection [22,23]. We per-formed a branch-site-based analysis by defining eachbranch supporting a paralogous gene as a foregroundbranch for PAML. In each species where the SAL1 genehas been duplicated, only one gene underwent positiveselection (Table 2). Significant Likelihood Ratio Tests(LRTs) were found for the five genes, confirming that apositive selection model fits the data. For cow, mouseand rat genes, only a few (one or two) positively selectedsites were detected, whereas in horse and particularly inguinea pig, more positively selected sites (6 and 15 sites,respectively) were detected.
Positively selected sites in the SAL1 family and putativebiological significanceTo identify the selective pressure on the SAL1 family ineutherian mammals, we performed a site-based analysiswith PAML (Table 3). After removal of gaps, 119 siteswere analyzed using the codeml [24] and Selecton [25]
programs. In both comparisons (M1a vs. M2a, M8a vs.M8), LRTs were significant (p < 0.001) for the dataset.Moreover, the AICc score of MEC was lower than thatof M8a, indicating that MEC fits the data better. Com-parisons of the LRT and AICc scores were significant,implying that selective forces varied among sitesbetween genes. According to M2a and M8 models, 23to 29% of sites underwent positive selection, respec-tively. Four sites (9V, 72Y, 73A and 90E) were identifiedas positively selected sites with a p-value of at least 95%by the three models (M2a, M8 and MEC), a strong indi-cation of positive selection for these four amino acids.Six sites (10T, 62R, 75C, 86A, 159R and 162Q) wereidentified by the M2a and M8 models. Six sites (6Q,11S, 63K, 71F, 113G and 119L) were identified by M8,and one site (163L) was identified by MEC.To determine if positively selected sites are located in
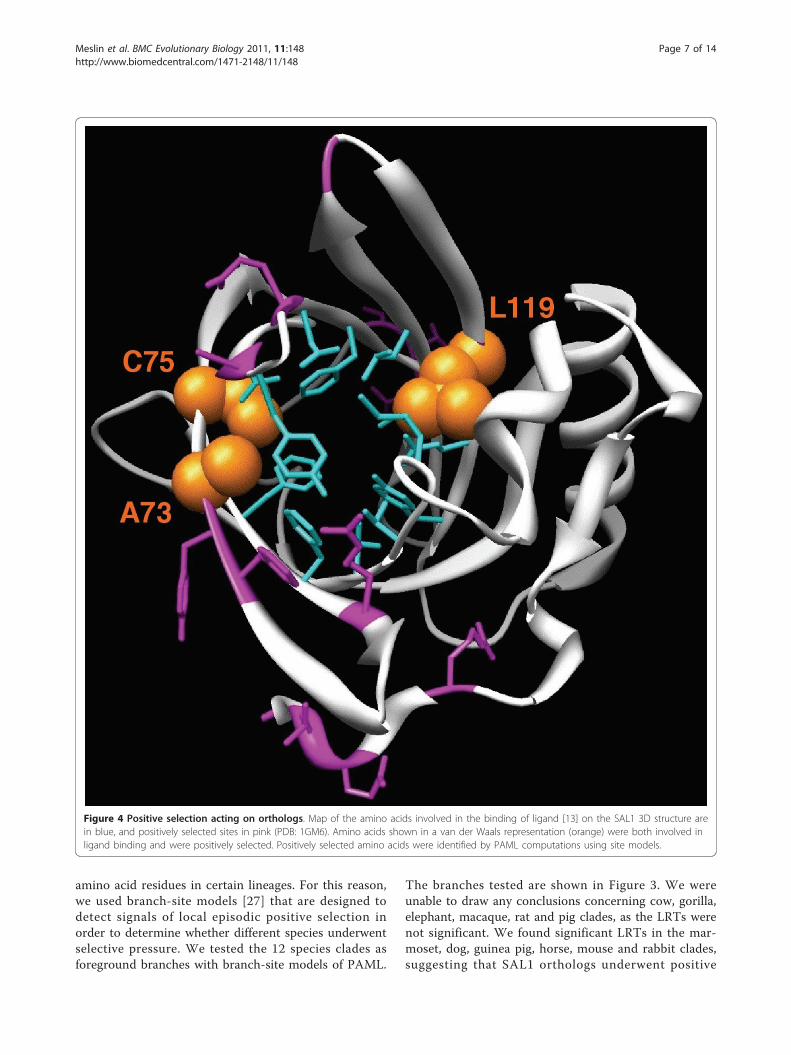
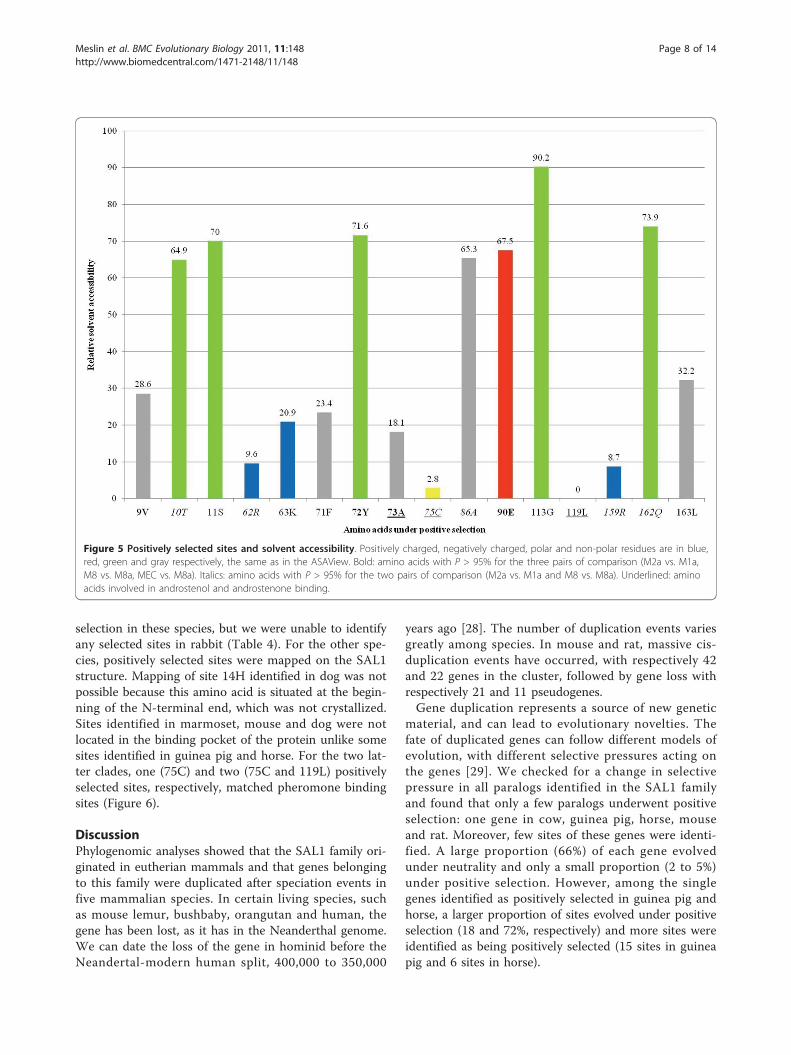
regions of interest, these sites were mapped on the 3Dstructure of SAL1 (PDB:1GM6) (Figure 4). To assess thebiological significance of these sites, ligand binding sitesdetermined by Spinelli et al. [13] were also mapped onthe 3D structure. Interestingly, three sites under positiveselection matched amino acids that are directly involvedin androstenol and androstenone binding (73A, 75C and119L). Side chains of amino acids involved in ligandbinding projected into the ligand binding pocket, whichis formed by a relatively small internal cavity poorlyaccessible to solvent, whereas side chains of the majorityof positively selected sites projected out of the bindingpocket, except for three amino acids, suggesting thatpositive selection does not only play a role in pheromonebinding specificity, but also in interaction with partnerssuch as receptors. Relative solvent accessibility (RSA) ofpositively selected sites was determined by ASAView andis shown in Figure 5. We used the same classification asRost et al., [26]: a residue is classified as buried when theRSA is <9%, as exposed when the RSA is >35%, and asintermediate when the RSA is between 9 and 35%. Wefound three buried sites (75C, 119L and 159R), six inter-mediate sites (9V, 62R, 63K, 71F, 73A and 163L) andseven exposed sites (10T, 11S, 72Y, 86A, 90E, 113G and162Q), indicating that most of the positively selectedsites are located at the surface of the protein, and are per-haps involved in other functions than pheromone bind-ing, however these remain to be identified. We observedno specific clustering of these sites at the surface of theprotein exposed to the solvent (Figure 4).
Positive selection events in marmoset, dog, guinea pig,horse and mouse cladesThe comparison between site models of PAML detectspositive selection only if the ω ratio averaged over allbranches on the tree is greater than 1, but positiveselection can also be expected to affect only a few
Table 1 Interlocus gene conversion events
Species Number ofsequences in the
dataset (1)
Number of sequenceinvolved in a geneconversion event (2)
Convertedtractlength(bp)
min max
Horse 5 3 57 74
Rat 10 4 161 273
Mouse 21 20 107 529
Guineapig
5 5 11 135
(1) All sequences are indicated in the table S1 of the additional file 1.(2) Sequences involved in gene conversion events are indicated in bold inthe table S1 of the additional file 1.
Meslin et al. BMC Evolutionary Biology 2011, 11:148http://www.biomedcentral.com/1471-2148/11/148
Page 5 of 14
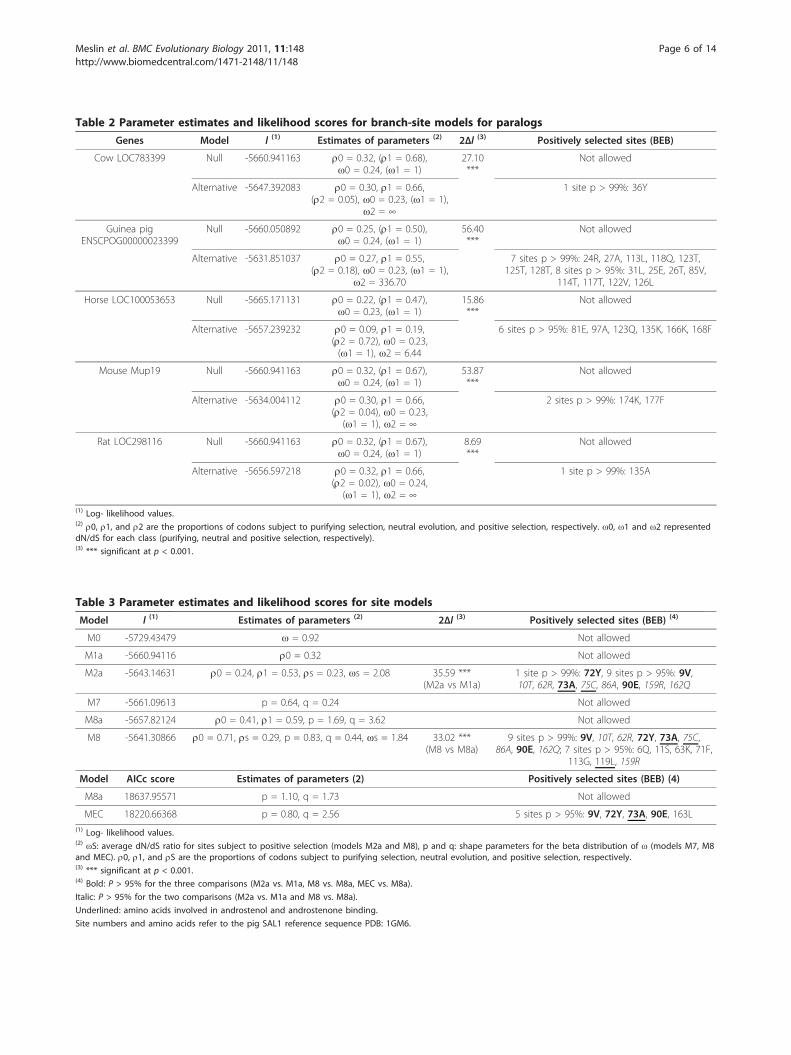
Table 2 Parameter estimates and likelihood scores for branch-site models for paralogs
Genes Model l (1) Estimates of parameters (2) 2Δl (3) Positively selected sites (BEB)
Cow LOC783399 Null -5660.941163 r0 = 0.32, (r1 = 0.68),ω0 = 0.24, (ω1 = 1)
27.10***
Not allowed
Alternative -5647.392083 r0 = 0.30, r1 = 0.66,(r2 = 0.05), ω0 = 0.23, (ω1 = 1),
ω2 = ∞
1 site p > 99%: 36Y
Guinea pigENSCPOG00000023399
Null -5660.050892 r0 = 0.25, (r1 = 0.50),ω0 = 0.24, (ω1 = 1)
56.40***
Not allowed
Alternative -5631.851037 r0 = 0.27, r1 = 0.55,(r2 = 0.18), ω0 = 0.23, (ω1 = 1),
ω2 = 336.70
7 sites p > 99%: 24R, 27A, 113L, 118Q, 123T,125T, 128T, 8 sites p > 95%: 31L, 25E, 26T, 85V,
114T, 117T, 122V, 126L
Horse LOC100053653 Null -5665.171131 r0 = 0.22, (r1 = 0.47),ω0 = 0.23, (ω1 = 1)
15.86***
Not allowed
Alternative -5657.239232 r0 = 0.09, r1 = 0.19,(r2 = 0.72), ω0 = 0.23,(ω1 = 1), ω2 = 6.44
6 sites p > 95%: 81E, 97A, 123Q, 135K, 166K, 168F
Mouse Mup19 Null -5660.941163 r0 = 0.32, (r1 = 0.67),ω0 = 0.24, (ω1 = 1)
53.87***
Not allowed
Alternative -5634.004112 r0 = 0.30, r1 = 0.66,(r2 = 0.04), ω0 = 0.23,
(ω1 = 1), ω2 = ∞
2 sites p > 99%: 174K, 177F
Rat LOC298116 Null -5660.941163 r0 = 0.32, (r1 = 0.67),ω0 = 0.24, (ω1 = 1)
8.69***
Not allowed
Alternative -5656.597218 r0 = 0.32, r1 = 0.66,(r2 = 0.02), ω0 = 0.24,
(ω1 = 1), ω2 = ∞
1 site p > 99%: 135A
(1) Log- likelihood values.(2) r0, r1, and r2 are the proportions of codons subject to purifying selection, neutral evolution, and positive selection, respectively. ω0, ω1 and ω2 representeddN/dS for each class (purifying, neutral and positive selection, respectively).(3) *** significant at p < 0.001.
Table 3 Parameter estimates and likelihood scores for site models
Model l (1) Estimates of parameters (2) 2Δl (3) Positively selected sites (BEB) (4)
M0 -5729.43479 ω = 0.92 Not allowed
M1a -5660.94116 r0 = 0.32 Not allowed
M2a -5643.14631 r0 = 0.24, r1 = 0.53, rs = 0.23, ωs = 2.08 35.59 ***(M2a vs M1a)
1 site p > 99%: 72Y, 9 sites p > 95%: 9V,10T, 62R, 73A, 75C, 86A, 90E, 159R, 162Q
M7 -5661.09613 p = 0.64, q = 0.24 Not allowed
M8a -5657.82124 r0 = 0.41, r1 = 0.59, p = 1.69, q = 3.62 Not allowed
M8 -5641.30866 r0 = 0.71, rs = 0.29, p = 0.83, q = 0.44, ωs = 1.84 33.02 ***(M8 vs M8a)
9 sites p > 99%: 9V, 10T, 62R, 72Y, 73A, 75C,86A, 90E, 162Q; 7 sites p > 95%: 6Q, 11S, 63K, 71F,
113G, 119L, 159R
Model AICc score Estimates of parameters (2) Positively selected sites (BEB) (4)
M8a 18637.95571 p = 1.10, q = 1.73 Not allowed
MEC 18220.66368 p = 0.80, q = 2.56 5 sites p > 95%: 9V, 72Y, 73A, 90E, 163L(1) Log- likelihood values.(2) ωS: average dN/dS ratio for sites subject to positive selection (models M2a and M8), p and q: shape parameters for the beta distribution of ω (models M7, M8and MEC). r0, r1, and rS are the proportions of codons subject to purifying selection, neutral evolution, and positive selection, respectively.(3) *** significant at p < 0.001.(4) Bold: P > 95% for the three comparisons (M2a vs. M1a, M8 vs. M8a, MEC vs. M8a).
Italic: P > 95% for the two comparisons (M2a vs. M1a and M8 vs. M8a).
Underlined: amino acids involved in androstenol and androstenone binding.
Site numbers and amino acids refer to the pig SAL1 reference sequence PDB: 1GM6.
Meslin et al. BMC Evolutionary Biology 2011, 11:148http://www.biomedcentral.com/1471-2148/11/148
Page 6 of 14
amino acid residues in certain lineages. For this reason,we used branch-site models [27] that are designed todetect signals of local episodic positive selection inorder to determine whether different species underwentselective pressure. We tested the 12 species clades asforeground branches with branch-site models of PAML.
The branches tested are shown in Figure 3. We wereunable to draw any conclusions concerning cow, gorilla,elephant, macaque, rat and pig clades, as the LRTs werenot significant. We found significant LRTs in the mar-moset, dog, guinea pig, horse, mouse and rabbit clades,suggesting that SAL1 orthologs underwent positive
Figure 4 Positive selection acting on orthologs. Map of the amino acids involved in the binding of ligand [13] on the SAL1 3D structure arein blue, and positively selected sites in pink (PDB: 1GM6). Amino acids shown in a van der Waals representation (orange) were both involved inligand binding and were positively selected. Positively selected amino acids were identified by PAML computations using site models.
Meslin et al. BMC Evolutionary Biology 2011, 11:148http://www.biomedcentral.com/1471-2148/11/148
Page 7 of 14
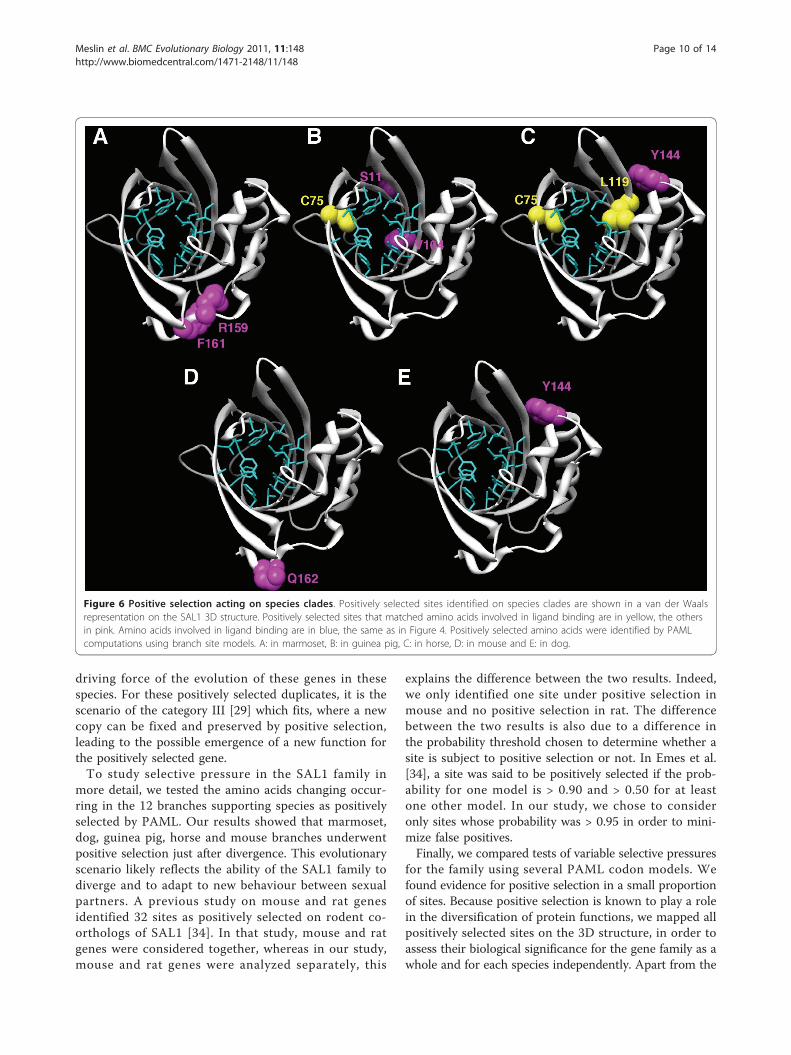
selection in these species, but we were unable to identifyany selected sites in rabbit (Table 4). For the other spe-cies, positively selected sites were mapped on the SAL1structure. Mapping of site 14H identified in dog was notpossible because this amino acid is situated at the begin-ning of the N-terminal end, which was not crystallized.Sites identified in marmoset, mouse and dog were notlocated in the binding pocket of the protein unlike somesites identified in guinea pig and horse. For the two lat-ter clades, one (75C) and two (75C and 119L) positivelyselected sites, respectively, matched pheromone bindingsites (Figure 6).
DiscussionPhylogenomic analyses showed that the SAL1 family ori-ginated in eutherian mammals and that genes belongingto this family were duplicated after speciation events infive mammalian species. In certain living species, suchas mouse lemur, bushbaby, orangutan and human, thegene has been lost, as it has in the Neanderthal genome.We can date the loss of the gene in hominid before theNeandertal-modern human split, 400,000 to 350,000
years ago [28]. The number of duplication events variesgreatly among species. In mouse and rat, massive cis-duplication events have occurred, with respectively 42and 22 genes in the cluster, followed by gene loss withrespectively 21 and 11 pseudogenes.Gene duplication represents a source of new genetic
material, and can lead to evolutionary novelties. Thefate of duplicated genes can follow different models ofevolution, with different selective pressures acting onthe genes [29]. We checked for a change in selectivepressure in all paralogs identified in the SAL1 familyand found that only a few paralogs underwent positiveselection: one gene in cow, guinea pig, horse, mouseand rat. Moreover, few sites of these genes were identi-fied. A large proportion (66%) of each gene evolvedunder neutrality and only a small proportion (2 to 5%)under positive selection. However, among the singlegenes identified as positively selected in guinea pig andhorse, a larger proportion of sites evolved under positiveselection (18 and 72%, respectively) and more sites wereidentified as being positively selected (15 sites in guineapig and 6 sites in horse).
Figure 5 Positively selected sites and solvent accessibility. Positively charged, negatively charged, polar and non-polar residues are in blue,red, green and gray respectively, the same as in the ASAView. Bold: amino acids with P > 95% for the three pairs of comparison (M2a vs. M1a,M8 vs. M8a, MEC vs. M8a). Italics: amino acids with P > 95% for the two pairs of comparison (M2a vs. M1a and M8 vs. M8a). Underlined: aminoacids involved in androstenol and androstenone binding.
Meslin et al. BMC Evolutionary Biology 2011, 11:148http://www.biomedcentral.com/1471-2148/11/148
Page 8 of 14
Because sequences of some paralogs share high similar-ity, we searched for gene conversion in our paralogousgene datasets and found extensive interlocus gene conver-sion events in mouse and guinea pig, and to a lesser extentin horse and rat. Karn and Laukaitis [30] compared themouse Mup cluster with a gene tree published by Mudgeet al. [31] and suggested that concerted evolution maskedthe common origin of the gene and neighboring pseudo-genes [30]. Our results confirmed this hypothesis, indicat-ing extensive gene conversion in the mouse Mup cluster.This extensive gene conversion phenomenon led tosequence homogenization and is the cause of the con-certed evolution of these genes. Such extensive concertedevolution suggests that, at least in mouse and guinea pig,both maintenance of sequence homogeneity and increasedgene dosage are important for these species. The evolutionof SAL1 paralogs resembles the evolution of the b-globingene family. In this family, paralogous copies evolvedunder a process of functional divergence and there is evi-dence for two gene conversion events in mouse and goatclusters composed of b-globin duplicated genes There isalso evidence for variable selective pressure among sitesfor b and g-globin genes with 4 to 9% of sites evolvingunder positive selection [32].By combining phylogenetic, gene conversion and
selective pressure results on paralogs evolution, we can
try to describe the fate of duplicated genes, in whichduplication can be seen as an advantageous phenom-enon for the species concerned, by combining two sce-narios from Innan and Kondrashov [29]. In the firstscenario, one could consider the massive duplication inrat and mouse as a gene amplification where theincrease in dosage of these genes is beneficial. This sce-nario of evolution corresponds to category IIa describedby Innan and Kondrashov [29]. In this model, if selec-tion for the duplicated copy is weak, pseudogenizationcan occur if a null mutation is fixed, which is the casein both mouse and rat. The occurrence of gene conver-sions that maintain sequence similarity and promoteconservation of gene copies could be consistent withthat hypothesis, but the high frequency of gene conver-sion events is not restricted to mouse and rat. In fact,guinea pigs, which do not harbor large gene amplifica-tions, have the highest frequency of conversion eventsper gene copy among the species tested. The beneficialincrease in dosage has already been shown to apply togenes that mediate the interaction between the organismand the environment [33], as is true of genes of theSAL1 family. However, we also showed that among themany duplicates in rat, mouse and guinea pig, one geneper species is under positive selection so increased genedosage and gene conversion events are not the only
Table 4 Parameter estimates and likelihood scores for branch- site models for 5 species
Species Model l (1) Estimates of parameters (2) 2Δl (3) Positively selected sites (BEB)
Marmoset Null -5660.37202 r0 = 0.18, (r1 = 0.39), ω0 = 0.23, (ω1 = 1) 18.47***
Not allowed
Alternative -5651.1375 r0 = 0.30, r1 = 0.63, (r2 = 0.07), ω0 = 0.23, (ω1 = 1),ω2 = 60.38
2 sites p > 95%: 159R, 161F
Dog Null -5660.55998 r0 = 0.25, (r1 = 0.52), ω0 = 0.24, (ω1 = 1) 6.78 ** Not allowed
Alternative -5657.16845 r0 = 0.28, r1 = 0.58, (r2 = s0.14), ω0 = 0.23, (ω1 = 1),ω2 = 11.15
2 sites p > 95%: 14H, 144Y
Guineapig
Null -5660.94116 r0 = 0.32, (r1 = 0.67), ω0 = 0.24, (ω1 = 1) 13.68***
Not allowed
Alternative -5654.10045 r0 = 0.27, r1 = 0.51, (r2 = 0.22), ω0 = 0.25, (ω1 = 1),ω2 = 3.94
3 sites p > 95%: 11S, 75C, 104V
Horse Null -5660.94121 r0 = 0.32, (r1 = 0.67), ω0 = 0.24, (ω1 = 1 ) 27.22***
Not allowed
Alternative -5647.32999 r0 = 0.30, r1 = 0.61, (r2 = 0.09), ω0 = 0.24, (ω1 = 1),ω2 = 7.57
2 sites p > 99%: 75C, 119L; 1 site p > 95%:144Y
Mouse Null -5658.60187 r0 = 0.24, (r1 = 0.55), ω0 = 0.19, (ω1 = 1 ) 10.75**
Not allowed
Alternative -5653.22783 r0 = 0.25, r1 = 0.58, (r2 = 0.17), ω0 = 0.19, (ω1 = 1),ω2 = 3.25
1 site p > 95%: 162Q
(1) Log- likelihood values.(2) r0, r1, and r2 are the proportions of codons subject to purifying selection, neutral evolution, and positive selection, respectively. ω0, ω1 and ω2 representeddN/dS for each class (purifying, neutral and positive selection, respectively).(3) ** significant at p < 0.01.
*** significant at p < 0.001.(4) Underlined: amino acids involved in androstenol and androstenone binding.
Site numbers and amino acids refer to the pig SAL1 reference sequence PDB: 1GM6, except for the amino acid in bold, which is not part of the structure butcomes from the dog genome sequence XP_855342.1.
Meslin et al. BMC Evolutionary Biology 2011, 11:148http://www.biomedcentral.com/1471-2148/11/148
Page 9 of 14
driving force of the evolution of these genes in thesespecies. For these positively selected duplicates, it is thescenario of the category III [29] which fits, where a newcopy can be fixed and preserved by positive selection,leading to the possible emergence of a new function forthe positively selected gene.To study selective pressure in the SAL1 family in
more detail, we tested the amino acids changing occur-ring in the 12 branches supporting species as positivelyselected by PAML. Our results showed that marmoset,dog, guinea pig, horse and mouse branches underwentpositive selection just after divergence. This evolutionaryscenario likely reflects the ability of the SAL1 family todiverge and to adapt to new behaviour between sexualpartners. A previous study on mouse and rat genesidentified 32 sites as positively selected on rodent co-orthologs of SAL1 [34]. In that study, mouse and ratgenes were considered together, whereas in our study,mouse and rat genes were analyzed separately, this
explains the difference between the two results. Indeed,we only identified one site under positive selection inmouse and no positive selection in rat. The differencebetween the two results is also due to a difference inthe probability threshold chosen to determine whether asite is subject to positive selection or not. In Emes et al.[34], a site was said to be positively selected if the prob-ability for one model is > 0.90 and > 0.50 for at leastone other model. In our study, we chose to consideronly sites whose probability was > 0.95 in order to mini-mize false positives.Finally, we compared tests of variable selective pressures
for the family using several PAML codon models. Wefound evidence for positive selection in a small proportionof sites. Because positive selection is known to play a rolein the diversification of protein functions, we mapped allpositively selected sites on the 3D structure, in order toassess their biological significance for the gene family as awhole and for each species independently. Apart from the
Figure 6 Positive selection acting on species clades. Positively selected sites identified on species clades are shown in a van der Waalsrepresentation on the SAL1 3D structure. Positively selected sites that matched amino acids involved in ligand binding are in yellow, the othersin pink. Amino acids involved in ligand binding are in blue, the same as in Figure 4. Positively selected amino acids were identified by PAMLcomputations using branch site models. A: in marmoset, B: in guinea pig, C: in horse, D: in mouse and E: in dog.
Meslin et al. BMC Evolutionary Biology 2011, 11:148http://www.biomedcentral.com/1471-2148/11/148
Page 10 of 14
three amino acids that were under positive selection andinvolved in ligand binding, the other amino acids identi-fied by site models of PAML analyses projected out of thebinding pocket. Moreover, the majority of these sites wereexposed to solvent. If these sites were involved in theinteraction with pheromones, they would be found prefer-entially in the hydrophobic core and would be buried. Wethus propose that positive selection plays a role not onlyin the binding specificity but also in the interactionbetween the protein and its environment. We were notable to draw any conclusions concerning selective pres-sures on each site involved in ligand binding, because gapsin the multiple sequence alignment made these calcula-tions impossible. Nevertheless, for the 16 amino acidsinvolved in pheromone binding, we identified three sitesthat probably evolved under purifying constraints (87Y,91N and 93F) and four sites that probably evolved underrelaxed constraints (60F, 85V, 121E and 123Y). The threesites that evolved under purifying constraints may beessential for protein function, because they were well con-served during the evolution of the family. In rodent popu-lations, Emes et al. [34] found that MUPs, which are co-orthologs of SAL1, exhibited amino acids under positiveselection, and that these positively selected sites werelocated at the interface between MUPs and their receptors,probably V2R receptors on the vomeronasal organ. Theyalso found evidence that olfactory receptors, such as V2Rs,underwent positive selection. The hypothesis theyproposed is that this adaptation phenomenon is due toconspecific competition, resulting in well adapted phero-mones, pheromone binding proteins such as MUP, andolfactory receptors [34]. Our results allow us to extend thishypothesis because positive selection also drives the evolu-tion of pheromone binding proteins in other eutherianmammals. So for all the family, and not just for rodents,there is an adaptive evolution of these proteins to theirligands and maybe their receptors, too. It would be inter-esting to test if V2R receptors are subject to positive selec-tion, not only in rodents but also in other mammals.Several authors reported evidence for positive selection onother OR genes in mammals [35-39], with possible invol-vement of positively selected sites in the binding propertyof proteins. Moreno-Estrada [36] suggested that positiveselection could be at the origin of a new ligand bindingcapability or the modification of odorant perception andcould improve the overall degenerated OR gene repertoire,at least in human. In insects, co-evolution of the twoenzymes involved in the pheromone biosynthetic pathwayand in the pheromone receptor has been suggested to playa role in the speciation process [40]. It would be interest-ing to test co-evolution of enzyme/receptor, pheromone/receptor and OBP/receptor in mammals.In mice, MUPs are important for the delivery, via
urine, of chemical signals conveying information about
the sex and hormonal status of the animal who releasethe scent mark [41]. In pig, SAL1 may be involved in pre-mating recognition by binding pig specific sex phero-mones in saliva [8]. In both species, these proteins areinvolved in conspecific recognition in the context ofreproduction. When the genomes of marine mammalsare completed, it will be interesting to search for SAL1orthologs. Indeed, in such a different environment, che-mical communication between sexual partners is prob-ably not mediated by the same olfactory cues as interrestrial mammals. If a SAL1 ortholog is found in mar-ine mammal genomes, it will be interesting to discover ifit evolved under relaxed constraints or positive selection.It is well established that reproduction is a very competi-
tive process, and that selective pressures on genes involvedin the process are not rare (for a review, see [42]). PositiveDarwinian selection is not atypical, especially for genesinvolved in sensory perception and mate choice [43]. Ourresults demonstrated that (i) positively selected sites differbetween genes and (ii) positively selected sites are involvedin ligand binding and are putatively involved in receptorbinding. Such a selective pressure on these proteins couldbe at the origin of a divergence process between speciesand thus contribute to the speciation phenomenon byreinforcing prezygotic barriers. To test this hypothesis, weperformed in vitro mutagenesis experiments on SAL1, butthe poor folding of the resulting proteins prevented furtherexperimentation.
ConclusionsThe SAL1 gene family originated in eutherian mammalsand duplicated after speciation in cow, horse, guinea pigand rodents. Some duplicated genes underwent con-certed evolution with extensive gene conversion. Otherswere subject to positive selection at different sites, andour knowledge of the 3D structure of this protein sug-gests that the selected sites are involved in pheromonebinding and possibly in olfactory receptor binding. Thisresult suggests a functional divergence between speciesbecause positively selected sites differ between species.All these data suggest that the evolution of the SAL1family allows a species-specific strategy to transducepheromonal signals in mammals, reinforcing speciesdivergence through species-specific sexual behaviour.
MethodsPhylogenetic and syntenic analysesThe protein sequence of the pig salivary lipocalin(SAL1) was retrieved from GenBank (http://www.ncbi.nlm.nih.gov/genbank/) [44] (NP_998979.1). Proteinsfrom other species were searched by using TBLASTNwith porcine protein sequence as the query against allmammalian genomes available on the NCBI (http://www.ncbi.nlm.nih.gov/mapview/) [45] and ENSEMBL
Meslin et al. BMC Evolutionary Biology 2011, 11:148http://www.biomedcentral.com/1471-2148/11/148
Page 11 of 14
databases (http://www.ensembl.org/index.html) [46].Identified proteins were then located on genomes forsyntenic analyses of the most recent genome sequenceassemblies: pig (Sus scrofa: ENSEMBL Sscrofa9), cow(Bos Taurus: NCBI Btau5.2), horse (Equus caballus:NCBI EquCab2.0), dog (Canis familiaris: ENSEMBLCanFam2.0), guinea pig (Cavia porcellus: ENSEMBLcavPor3), rat (Rattus norvegicus: NCBI RGSC 3.4),mouse (Mus musculus: NCBIM37), rabbit (Oryctolaguscuniculus: ENSEMBL OryCun2), rhesus monkey(Macaca mulatta: NCBI Build 1.2), chimpanzee (Pantroglodytes: NCBI Build 2.1), gorilla (Gorilla gorilla:ENSEMBL gorGor3), marmoset (Callithrix jacchus:ENSEMBL C_jacchus3.2.1) and elephant (LoxodontaAfricana: ENSEMBL loxAfr3). To improve homologyassignment, we only included genes from the same syn-tenic region in the final dataset. Sequences with no syn-tenic information were discarded. No genes wereidentified in other available mammalian genomes, andexisting genome assemblies did not allow us to identifythe syntenic region. Multiple sequence alignments wereperformed using the Clustal W algorithm [47]. Thechimpanzee sequence was removed from the dataset inorder to have the most possible informative sites. Allalignment gap sites were removed before phylogeneticanalyses. Phylogenetic trees were reconstructed usingmaximum likelihood (ML) in PhyML 3.0 [48] in orderto establish orthologous and paralogous relationshipsamong the gene datasets. Bootstrap values [49] wereestimated with 1000 replications and the tree was rootedusing the midpoint rooting method. Orthology andparalogy relationships were inferred from the resultingphylogenetic tree.
Gene conversionThe four clusters of paralogs identified for the guineapig, horse, rat and mouse were tested for interlocusgene conversion, i.e. nonreciprocal transfer of geneticinformation between genes of the same locus, usingGENECONV version 1.81 [21], which is a widely usedmethod for detecting partial gene conversion [50].Each subset alignment was analyzed using the ClustalW algorithm [47] to search for pairs of sequences suf-ficiently similar to suggest gene conversion events.Three p-values were calculated and compared toassess the significance of the results. Evidence forgene conversion was strong when a fragment had a p-value < 0.05 for at least two different types of statisti-cal tests. In each alignment, indels and missing datawere treated as a single polymorphism. All poly-morphic sites were tested for evidence of gene conver-sion using adjusted mismatch penalties of 0, 1 or 2, toenable detection of both ancient and recent gene con-version events.
Evolutionary analysesTo investigate selective pressure, we used the CODEMLapplication in the PAML package version 4.4 [24],which allows the ratio dN/dS to vary across codons andestimates the probability for each codon to be underpositive selection. The alignments resulted from ClustalW [47] and PAL2NAL [51].Study of selective pressure in the SAL1 familyTo determine if selective pressure varied among sites inthe SAL1 family, we used site models implemented inPAML [52], which allows the ω ratio to vary amongsites [52,53]. Like for reconstruction of the phylogenetictree, the chimpanzee sequence (the shortest sequence)was removed in order to have the most possible infor-mative sites. We used three pairs of models includingM1a (nearly neutral: 0 <ω0 <1 and ω1 = 1) versus M2a(positive selection: 0 <ω0 < 1, ω1 = 1 and ω2 >1) [52],M8a (beta &ωs = 1: 0 <ω < 1 and ωs = 1) versus M8[54] and MEC (a combined mechanistic-empiricalmodel implemented in the Selecton server, http://selec-ton.tau.ac.il/index.html) [25,55] versus M8a and thePhyML generated tree for the analysis. Likelihood ratiotests were used to compare log likelihood values forM1a vs. M2a and M8a vs. M8 [52]. The Akaike infor-mation criterion (AICc score) was used to compare M8aand MEC [55]. Bayes Empirical Bayes (BEB) method[56] implemented in PAML was used to estimate pos-terior probabilities of selection on each codon, probabil-ities > 0.95 were considered significant.Study of selective pressure on species and paralogsTo determine whether different species underwent selec-tive pressure, we used the branch-site models of PAML[27,57], which estimate different dN/dS values amongbranches and among sites. These models can detect ashort episode of positive selection if it occurs in a smallfraction of amino acids. We tested 13 branches as theforeground branch (i.e. the branch for which positiveselection is allowed), eight branches leading to a species(pig, dog, rabbit, macaque, human, gorilla, marmoset andelephant) and five internal branches situated after specia-tion and before duplication events (in cow, horse, guineapig, rat and mouse). Figure 3 shows which branches onthe phylogenetic tree were tested for positive speciesselection. We tested each individual branch that led to aparalog in order to detect selective pressures followingduplication events. We also used the PhyML generatedtree for the analysis. Two models were used to test forpositive selection, one model called ‘alternative’ in whichthe foreground branch may have some sites under posi-tive selection, and one model called ‘null’ in which theforeground branch may have different proportions ofsites under neutral evolution than the backgroundbranch. For the ‘alternative’ model, three classes weredefined: ω0: dN/dS < 1, ω1: dN/dS = 1 and ω2: dN/dS≥1,
Meslin et al. BMC Evolutionary Biology 2011, 11:148http://www.biomedcentral.com/1471-2148/11/148
Page 12 of 14
while in the ‘null’ model, ω2 was fixed to 1. Like for thesite model, LRT [52] and BEB [56] were used.
Putative function of positively selected sitesTo assess the functionality of positively selected sites, thesites were positioned on the SAL1 structure (PDB: 1GM6[13]) and their positions evaluated against the accessiblesurface area (ASA) of amino acids in SAL1 as determinedby ASAView [58]. SAL1 androstenol and androstenonebinding sites were previously determined by Spinelli et al.[13]. These amino acids were positioned on the SAL1structure. Molecular graphics images were producedusing the UCSF Chimera package [59].
Additional material
Additional file 1: Table S1 - Identification of SAL orthologs and co-orthologs. This table summarizes access numbers of SAL orthologs andco-orthologs, and gene locations in genomes. Genes involved in geneconversion events are also indicated. Figure S1 - Putativepseudogenes Evidence for putative pseudogenes in mouse lemur,bushbaby and orangutan are indicated.
AcknowledgementsCM is funded by a MENRT PhD fellowship. This work was supported byINRA.
Author details1UMR85 Physiologie de la Reproduction et des Comportements, INRA,Nouzilly, F-37380, France. 2UMR6175, CNRS, Nouzilly, F-37380, France.3Université François Rabelais de Tours, Tours, F-37041, France. 4HarasNationaux, Nouzilly, F-37380, France. 5Unité de Glycobiologie Structurale etFonctionnelle, INRA, UMR 8576 CNRS/Université Lille1, Villeneuve d’AscqCedex, F-59655, France. 6IMPMC, UMR7590, CNRS, Université Pierre et MarieCurie, Paris, 75005, France.
Authors’ contributionsCM performed the main data collection and analyses. GP provided adviceon bioinformatic analyses. IC performed protein structural analyses. CM, FBand PNLM performed mutagenesis experiments and protein production. PMdesigned the study and helped guide the general analyses. All authors readand approved the final manuscript.
Received: 4 March 2011 Accepted: 28 May 2011 Published: 28 May 2011
References1. Dobzhansky T: Genetics and the origin of species/by Theodosius
Dobzhansky. New York: Columbia University Press; 1964.2. Smadja C, Butlin RK: On the scent of speciation: the chemosensory
system and its role in premating isolation. Heredity 2008, 102(1):77-97.3. Karlson P, Luscher M: Pheromones’: a new term for a class of biologically
active substances. Nature 1959, 183(4653):55-56.4. Tegoni M, Pelosi P, Vincent F, Spinelli S, Campanacci V, Grolli S, Ramoni R,
Cambillau C: Mammalian odorant binding proteins. Biochimica etBiophysica Acta (BBA). Protein Structure and Molecular Enzymology 2000,1482(1-2):229-240.
5. Pelosi P: The role of perireceptor events in vertebrate olfaction. Cell MolLife Sci 2001, 58(4):503-509.
6. Signoret JP: Reproductive behaviour of pigs. J Reprod Fertil Suppl 1970,11(11), Suppl 11:105+..
7. Beynon RJ, Hurst JL: Multiple roles of major urinary proteins in the housemouse, Mus domesticus. Biochem Soc Trans 2003, 31(Pt 1):142-146.
8. Marchese S, Pes D, Scaloni A, Carbone V, Pelosi P: Lipocalins of boarsalivary glands binding odours and pheromones. Eur J Biochem 1998,252(3):563-568.
9. Perry GC, Patterson RLS, Macfie HJH, Stinson CG: PIG COURTSHIPBEHAVIOR - PHEROMONAL PROPERTY OF ANDROSTENE STEROIDS INMALE SUB-MAXILLARY SECRETION. Animal Production 1980,31(OCT):191-199.
10. Guiraudie G, Pageat P, Cain AH, Madec I, Meillour PN-L: FunctionalCharacterization of Olfactory Binding Proteins for AppeasingCompounds and Molecular Cloning in the Vomeronasal Organ of Pre-pubertal Pigs. Chem Senses 2003, 28(7):609-619.
11. Scaloni A, Paolini S, Brandazza A, Fantacci M, Bottiglieri C, Marchese S,Navarrini A, Fini C, Ferrara L, Pelosi P: Purification, cloning andcharacterisation of odorant- and pheromone-binding proteins from pignasal epithelium. Cell Mol Life Sci 2001, 58(5-6):823-834.
12. Flower DR: The lipocalin protein family: structure and function. Biochem J1996, 318(Pt 1):1-14.
13. Spinelli S, Vincent F, Pelosi P, Tegoni M, Cambillau C: Boar salivarylipocalin. Three-dimensional X-ray structure and androsterol/androstenone docking simulations. Eur J Biochem 2002,269(10):2449-2456.
14. Loebel D, Scaloni A, Paolini S, Fini C, Ferrara L, Breer H, Pelosi P: Cloning,post-translational modifications, heterologous expression and ligand-binding of boar salivary lipocalin. Biochem J 2000, 350(Pt 2):369-379.
15. Touhara K, Vosshall LB: Sensing Odorants and Pheromones withChemosensory Receptors. Annual Review of Physiology 2009, 71(1):307-332.
16. Ganfornina MD, Gutierrez G, Bastiani MSD: A Phylogenetic Analysis of theLipocalin Protein Family. Mol Biol Evol 2000, 17(1):114-126.
17. Logan DW, Marton TF, Stowers L: Species Specificity in Major UrinaryProteins by Parallel Evolution. PLoS ONE 2008, 3(9):e3280.
18. Zhang ZD, Frankish A, Hunt T, Harrow J, Gerstein M: Identification andanalysis of unitary pseudogenes: historic and contemporary gene lossesin humans and other primates. Genome Biol 2010, 11(3):R26.
19. Green RE, Krause J, Briggs AW, Maricic T, Stenzel U, Kircher M, Patterson N,Li H, Zhai W, Fritz MH, et al: A draft sequence of the Neandertal genome.Science 2010, 328(5979):710-722.
20. Flicek P, Aken BL, Ballester B, Beal K, Bragin E, Brent S, Chen Y, Clapham P,Coates G, Fairley S, et al: Ensembl’s 10th year. Nucleic Acids Res 2009,38(Database issue):D557-562.
21. Sawyer S: Statistical tests for detecting gene conversion. Mol Biol Evol1989, 6(5):526-538.
22. Yang Z, Bielawski JP: Statistical methods for detecting molecularadaptation. Trends Ecol Evol 2000, 15(12):496-503.
23. Yang Z, Swanson WJ: Codon-substitution models to detect adaptiveevolution that account for heterogeneous selective pressures amongsite classes. Mol Biol Evol 2002, 19(1):49-57.
24. Yang Z: PAML 4: phylogenetic analysis by maximum likelihood. Mol BiolEvol 2007, 24(8):1586-1591.
25. Doron-Faigenboim A, Stern A, Mayrose I, Bacharach E, Pupko T: Selecton: aserver for detecting evolutionary forces at a single amino-acid site.Bioinformatics 2005, 21(9):2101-2103.
26. Rost B, Sander C: Conservation and prediction of solvent accessibility inprotein families. Proteins 1994, 20(3):216-226.
27. Yang Z, Nielsen R: Codon-substitution models for detecting molecularadaptation at individual sites along specific lineages. Mol Biol Evol 2002,19(6):908-917.
28. Weaver TD, Roseman CC, Stringer CB: Close correspondence betweenquantitative- and molecular-genetic divergence times for Neandertalsand modern humans. Proc Natl Acad Sci USA 2008, 105(12):4645-4649.
29. Innan H, Kondrashov F: The evolution of gene duplications: classifyingand distinguishing between models. Nat Rev Genet 2010, 11(2):97-108.
30. Karn RC, Laukaitis CM: The mechanism of expansion and the volatility itcreated in three pheromone gene clusters in the mouse (Mus musculus)genome. Genome Biol Evol 2009, 1:494-503.
31. Mudge JM, Armstrong SD, McLaren K, Beynon RJ, Hurst JL, Nicholson C,Robertson DH, Wilming LG, Harrow JL: Dynamic instability of the majorurinary protein gene family revealed by genomic and phenotypiccomparisons between C57 and 129 strain mice. Genome Biol 2008, 9(5):R91.
32. Aguileta G, Bielawski JP, Yang Z: Gene conversion and functionaldivergence in the beta-globin gene family. J Mol Evol 2004, 59(2):177-189.
Meslin et al. BMC Evolutionary Biology 2011, 11:148http://www.biomedcentral.com/1471-2148/11/148
Page 13 of 14
33. Kondrashov FA, Rogozin IB, Wolf YI, Koonin EV: Selection in the evolutionof gene duplications. Genome Biol 2002, 3(2):RESEARCH0008.
34. Emes RD, Beatson SA, Ponting CP, Goodstadt L: Evolution andcomparative genomics of odorant- and pheromone-associated genes inrodents. Genome Res 2004, 14(4):591-602.
35. Gilad Y, Man O, Glusman G: A comparison of the human and chimpanzeeolfactory receptor gene repertoires. Genome Res 2005, 15(2):224-230.
36. Moreno-Estrada A, Casals F, Ramirez-Soriano A, Oliva B, Calafell F,Bertranpetit J, Bosch E: Signatures of selection in the human olfactoryreceptor OR5I1 gene. Mol Biol Evol 2008, 25(1):144-154.
37. Nielsen R, Bustamante C, Clark AG, Glanowski S, Sackton TB, Hubisz MJ,Fledel-Alon A, Tanenbaum DM, Civello D, White TJ, et al: A scan forpositively selected genes in the genomes of humans and chimpanzees.PLoS Biol 2005, 3(6):e170.
38. Zhuang H, Chien MS, Matsunami H: Dynamic functional evolution of anodorant receptor for sex-steroid-derived odors in primates. Proceedingsof the National Academy of Sciences 2009, 106(50):21247-21251.
39. Shi P, Bielawski JP, Yang H, Zhang YP: Adaptive diversification ofvomeronasal receptor 1 genes in rodents. J Mol Evol 2005, 60(5):566-576.
40. Roelofs WL, Rooney AP: Molecular genetics and evolution of pheromonebiosynthesis in Lepidoptera. Proc Natl Acad Sci USA 2003,100(16):9179-9184.
41. Cavaggioni A, Mucignat-Caretta C: Major urinary proteins, alpha(2U)-globulins and aphrodisin. Biochim Biophys Acta 2000, 1482(1-2):218-228.
42. Clark NL, Aagaard JE, Swanson WJ: Evolution of reproductive proteinsfrom animals and plants. Reproduction 2006, 131(1):11-22.
43. Horth L: Sensory genes and mate choice: evidence that duplications,mutations, and adaptive evolution alter variation in mating cue genesand their receptors. Genomics 2007, 90(2):159-175.
44. Dorus S, Evans PD, Wyckoff GJ, Choi SS, Lahn BT: Rate of molecularevolution of the seminal protein gene SEMG2 correlates with levels offemale promiscuity. Nat Genet 2004, 36(12):1326-1329.
45. Schwalie PC, Schultz J: Positive selection in tick saliva proteins of theSalp15 family. J Mol Evol 2009, 68(2):186-191.
46. Carson AR, Scherer SW: Identifying concerted evolution and geneconversion in mammalian gene pairs lasting over 100 million years. BMCEvol Biol 2009, 9(156):156.
47. Thompson JD, Higgins DG, Gibson TJ: CLUSTAL W: improving thesensitivity of progressive multiple sequence alignment throughsequence weighting, position-specific gap penalties and weight matrixchoice. Nucleic Acids Res 1994, 22(22):4673-4680.
48. Guindon S, Gascuel O: A simple, fast, and accurate algorithm to estimatelarge phylogenies by maximum likelihood. Syst Biol 2003, 52(5):696-704.
49. Felsenstein J: Confidence Limits on Phylogenies: An Approach Using theBootstrap. Evolution 1985, 39(4):783-791.
50. Posada D: Evaluation of methods for detecting recombination from DNAsequences: empirical data. Molecular biology and evolution 2002,19(5):708-717.
51. Suyama M, Torrents D, Bork P: PAL2NAL: robust conversion of proteinsequence alignments into the corresponding codon alignments. NucleicAcids Res 2006, 34(Web Server issue):W609-612.
52. Nielsen R, Yang Z: Likelihood models for detecting positively selectedamino acid sites and applications to the HIV-1 envelope gene. Genetics1998, 148(3):929-936.
53. Yang Z: Maximum likelihood estimation on large phylogenies andanalysis of adaptive evolution in human influenza virus A. J Mol Evol2000, 51(5):423-432.
54. Swanson WJ, Nielsen R, Yang Q: Pervasive adaptive evolution inmammalian fertilization proteins. Mol Biol Evol 2003, 20(1):18-20.
55. Doron-Faigenboim A, Pupko T: A combined empirical and mechanisticcodon model. Mol Biol Evol 2007, 24(2):388-397.
56. Yang Z, Wong WS, Nielsen R: Bayes empirical bayes inference of aminoacid sites under positive selection. Molecular biology and evolution 2005,22(4):1107-1118.
57. Zhang J, Nielsen R, Yang Z: Evaluation of an improved branch-sitelikelihood method for detecting positive selection at the molecularlevel. Mol Biol Evol 2005, 22(12):2472-2479.
58. Ahmad S, Gromiha M, Fawareh H, Sarai A: ASAView: database and tool forsolvent accessibility representation in proteins. BMC Bioinformatics 2004,5(51):51.
59. Pettersen EF, Goddard TD, Huang CC, Couch GS, Greenblatt DM, Meng EC,Ferrin TE: UCSF Chimera–a visualization system for exploratory researchand analysis. J Comput Chem 2004, 25(13):1605-1612.
doi:10.1186/1471-2148-11-148Cite this article as: Meslin et al.: The evolutionary history of the SAL1gene family in eutherian mammals. BMC Evolutionary Biology 2011 11:148.
Submit your next manuscript to BioMed Centraland take full advantage of:
• Convenient online submission
• Thorough peer review
• No space constraints or color figure charges
• Immediate publication on acceptance
• Inclusion in PubMed, CAS, Scopus and Google Scholar
• Research which is freely available for redistribution
Submit your manuscript at www.biomedcentral.com/submit
Meslin et al. BMC Evolutionary Biology 2011, 11:148http://www.biomedcentral.com/1471-2148/11/148
Page 14 of 14