Embed Size (px)
Citation preview
Evans et al. BMC Complementary and Alternative Medicine 2014, 14:475http://www.biomedcentral.com/1472-6882/14/475
RESEARCH ARTICLE Open Access
An open label pilot study to evaluate the efficacyof Spanish black radish on the induction of phaseI and phase II enzymes in healthy male subjectsMalkanthi Evans1*, Elaine Paterson2 and David M Barnes2
Abstract
Background: Humans are exposed to toxins which accumulate in the body, and are detoxified primarily in theliver. Studies have shown that cruciferous vegetables (such as radishes) may be beneficial to health by aidingdetoxification of toxins in the liver.
Methods: This single-centre, open-label, pilot study investigated the effect of a dietary supplement containing SpanishBlack Radish on hepatic function in healthy males by monitoring the profiles of plasma and urine acetaminophenmetabolites and serum hormone concentrations at baseline and after 4 weeks of supplementation. A paired t-test wasused to compare pre- and post-treatment of plasma and urine acetaminophen metabolite profiles, serum hormoneconcentrations and safety end points.
Results: Area under the curve (AUC) from 0 to 8 hours for the acetaminophen glucuronide metabolite and unchangedacetaminophen in plasma decreased from baseline to week 4 by 9% (P = 0.004) and 40% (P = 0.010), respectively. TheAUC from 0 to 8 hours for acetaminophen sulfate and mercapturate metabolites in the urine increased by 11%(P = 0.010) and 37% (P = 0.024), respectively, from baseline to week 4. The AUC from 0 to 8 hours of serum estradiol-17βdecreased by 10% from baseline to week 4 (P = 0.005). All measures of clinical safety remained within acceptablelaboratory ranges, however a significant reduction in plasma γ-glutamyl transferase levels was noted after 4 weeks ofSpanish Black Radish treatment (P = 0.002).
Conclusions: These changes in metabolite and hormone levels indicate that Spanish Black Radish supplements have apositive influence on the detoxification of acetaminophen suggesting up-regulation of phase I and phase II liverenzymes. This study was sponsored by Standard Process Inc.
Trial registration: ClinicalTrials.gov registration number NCT02137590 (Date of registration: May 12, 2014)
Keywords: Spanish black radish, Detoxification, Hepatic function
BackgroundHumans are exposed to numerous environmental, en-dogenous and man-made toxins. Many of these com-pounds are lipophilic and accumulate in the body [1],requiring detoxification to avoid negative impacts onmetabolism. The role of diet in modifying toxin metab-olism has been suggested, but whether this action mightinfluence health status remains uncertain. Cruciferousvegetables have been investigated for their ability to
* Correspondence: [email protected] Synergize, Inc., 255 Queens Ave., London, ON N6A 5R8, CanadaFull list of author information is available at the end of the article
© 2014 Evans et al.; licensee BioMed Central LCommons Attribution License (http://creativecreproduction in any medium, provided the orDedication waiver (http://creativecommons.orunless otherwise stated.
induce detoxification enzymes when consumed both asa fresh food and as a supplement [1-3].Detoxification takes place primarily in the liver [4],
which performs the crucial task of converting lipophilictoxins to more hydrophilic metabolites that can be elim-inated from the body via urine [1]. The detoxificationprocess happens in two phases [5]. During the phase Idetoxification process, a toxic compound is made morepolar through enzymatic action in a process called bio-transformation, a selective process by which drugs, hor-mones and toxins are deactivated by enzyme catalysis[5]. Cytochrome P450 (CYP) is a family of more than 25enzymes involved in the critical phase I system whose
td. This is an Open Access article distributed under the terms of the Creativeommons.org/licenses/by/4.0), which permits unrestricted use, distribution, andiginal work is properly credited. The Creative Commons Public Domaing/publicdomain/zero/1.0/) applies to the data made available in this article,
Evans et al. BMC Complementary and Alternative Medicine 2014, 14:475 Page 2 of 12http://www.biomedcentral.com/1472-6882/14/475
actions generate free radicals and reactive oxygen spe-cies. Phase I reactions may also expose functional groupsin drugs and toxic compounds for more effective phaseII detoxification. In the phase II detoxification process,free radicals and reactive oxygen species are deactivatedby conjugation. Balance between phase I and phase II re-actions is important to prevent accumulation of toxicintermediates.Metabolism of acetaminophen by the liver occurs
through three detoxification pathways: glucuronidation,sulfation and glutathione (GSH) conjugation. This makesacetaminophen metabolism a good model to study the de-toxification pathways involved in protection against expos-ure to a wide range of exogenous and endogenous toxins.Acetaminophen metabolism occurs in the liver predo-minantly by sulfation and glucoronidation, both phase IIconjugation reactions. Acetaminophen glucuronide andacetaminophen sulfate are non-toxic and excreted in urine.A small proportion (5-10%) of the acetaminophen isoxidized through phase I reactions by CYP enzymes. Theoxidation of acetaminophen leads to the formation ofN-acetyl-p-benzoquinone imine (NAPQI). UnconjugatedNAPQI is a toxic compound that requires further metab-olism with GSH to form acetaminophen mercapturate andacetaminophen cysteine, two non-toxic metabolites [6,7].Two key components in toxin metabolism are enzymatic
activity and availability of metabolic cofactors. Cofactorslike GSH are necessary in the metabolism of NAPQI toform non-toxic conjugates, such as mercapturic acid,which are targeted for excretion. When GSH is deficient,NAPQI binds to sulfhydryl proteins in the liver, leading tolipid peroxidation and subsequent hepatic cell damage.Impaired metabolic function of the liver can be assessedindirectly by acetaminophen conjugates.Spanish Black Radish (SBR, Raphinoussativus L. Var.
niger) is a cruciferous vegetable which contains high con-centrations of glucosinolates, as well as sulfates andcysteine-rich proteins which are precursors for GSH syn-thesis [8,9]. In vitro and in vivo models have demonstratedthat SBR induces both phase I and II enzymes [8,10]. Adiet consisting of 20% freeze-dried radish has been shownin vivo to stimulate CYP isoenzymes, CYP 1A1 and CYP1A2, phase I detoxification enzymes, and glutathione S-transferase, quinone reductase and microsomal epoxidehydrolase, phase II detoxification enzymes [10] in vivo. Inaddition, recent evidence showed that a 20% radish dietprotected mice following exposure to the model carcino-gen, 7,12-dimethylbenz(a)anthracene (DMBA) throughboth phase I and II enzymes in DMBA clearance [11]. In-gestion of radishes induces detoxification enzymes in mice[10] and although many human studies investigating theeffects of fresh crucifers [12-14] have been published, fewstudies have investigated the supplement form of crucifers[15,16].
Therefore, the purpose of this study was to investigatethe effect of an SBR supplement on hepatic function byexamining acetaminophen and steroid hormone metab-olism dependent on phase I and phase II enzyme activ-ities. Phase I and II enzyme activity was evaluated viavarious serum hormones, as well as plasma and urineacetaminophen metabolite concentrations following ad-ministration of 1000 mg acetaminophen prior to andafter a 28 day supplementation period. The study alsoevaluated the safety of SBR by monitoring completeblood count, kidney function (creatinine), liver function(aspartate aminotransferase [AST], alanine aminotrans-ferase [ALT], gamma-glutamyltransferase [GGT]), elec-trolytes (sodium, potassium, and chloride), vital signs(heart rate and blood pressure) and adverse events.
MethodsStudy participantsThis single-center, open-label, pilot study was conductedat KGK Synergize Inc, in London, ON, Canada, fromSeptember 2011 to November 2011. The study wasreviewed by the Natural Health Products Directorate(NHPD) (Health Canada, Ottawa, ON). Notice of autho-rization was granted on August 16, 2011 by the NHPDand ethics approval was received from Institutional ReviewBoard Services (Aurora, ON) on September 02, 2011. Thestudy was conducted in accordance with the ethical princi-ples that have their origins in the Declaration of Helsinkiand its subsequent amendments. Written informed con-sent was obtained from subjects prior to any studyprocedures.Study participants were recruited from a research sub-
ject database and by newspaper advertisements. Twentyhealthy male subjects, age 25–35 years, with a bodymass index (BMI) between 18 and 25 kg/m2 were en-rolled after screening and passing eligibility criteria. Par-ticipants were required to avoid the consumption ofcruciferous vegetables for 14 days prior to and duringthe study treatment period. Participants were excluded ifthey had: any chronic diseases or medical conditions, in-cluding gall bladder disorders and/or bowel obstructionor were on prescription or over the counter medicationsfor the treatment of any acute or chronic conditions.Subjects who were taking muscle building supplements,products containing ingredients derived from the Cruci-ferae (or Brassicaceae) plant family, or natural healthproducts other than vitamins or minerals within 14 daysof baseline were ineligible to participate. Subjects withclinically-significant abnormal laboratory values, allergiesor sensitivities to test product ingredients, Cruciferaeplant family (including mustard, cabbage, radish), acet-aminophen, or the food and beverages provided duringthe study, or who had used acetaminophen within48 hrs of baseline were also excluded.
Evans et al. BMC Complementary and Alternative Medicine 2014, 14:475 Page 3 of 12http://www.biomedcentral.com/1472-6882/14/475
Study design and investigational productAt screening, participant’s medical history and concomi-tant therapies were reviewed and heart rate and bloodpressure measured and BMI calculated. Blood sampleswere obtained to determine complete blood count, elec-trolytes (sodium, potassium and chloride), creatinine,aspartate aminotransferase, alanine aminotransferase, γ-glutamyl transferase and bilirubin. Participants wereinstructed to avoid cruciferous vegetables for 14 daysprior to enrollment and for the duration of the study.Subjects were provided with a list of meal items, devoidof cruciferous vegetables, for the two 8-hour test daysand selected their food preferences. Participants wereinstructed to avoid alcohol consumption for 24 hoursand to fast for 12 hours prior to their baseline and theirfinal visit on Day 28.Participants returned to the clinic for their 8-hour in-
clinic baseline visit (week 0) at which time their heart rateand blood pressure were measured and BMI calculated.Acetaminophen was administered at a dose of 1000 mg(Tylenol Extra Strength 500 mg caplets DIN 00723908,McNeil Consumer Healthcare, Markham, ON). Blood andurine samples were collected at pre-acetaminophen dose(0 hours) and at 2, 4, 6 and 8 hours post-acetaminophendose for the analysis of plasma acetaminophen metabolites(glucuronide, sulfate, and NAPQI-GSH), urine metabolites(glucuronide, mercapturate and sulfate), unchanged acet-aminophen concentrations in plasma and urine, serumtotal testosterone, free testosterone and estradiol-17β.Meals were provided after the pre-dose and 4-hour bloodcollection. After the 8-hour test period, participants re-ceived 3-day food records and paper diaries for recordingtheir study product use, changes in concomitant therapies,and any side effects/changes in health conditions.The investigational product, SBR (One tablet: 370 mg of
SBR, 15.33 mg camu camu (Myrciaria dubia), 18.61 mgacerola (Malpighia emarginata), honey, manoic root (tapi-oca) and calcium stearate; Standard Process Inc., Palmyra,WI), was dispensed to the participants during their base-line visit and at every week thereafter for up to 3 weeks.Participants were instructed to begin consuming 6 tabletsdaily (2 tablets at breakfast, lunch and supper) the day fol-lowing their baseline visit. Participants returned to theclinic on day 7, 14, 21 and 28 post-baseline at which timethe remaining product and packaging was returned to de-termine compliance with the treatment regimen.Participants returned to the clinic in a fasting state at
28 days post-baseline (week 4) for an 8-hour in-clinic testat which time heart rate and blood pressure were mea-sured and BMI was calculated. Participants were adminis-tered 1000 mg of acetaminophen (2 Tylenol Extra Strength500 mg caplets, McNeil Consumer Healthcare). Blood andurine samples were collected pre-acetaminophen dosageand at 2, 4, 6 and 8 hours post-acetaminophen dosage for
analysis of plasma and urine acetaminophen metabolites(glucuronide, sulfate and NAPQI-GSH), urine metabolites(glucuronide, sulfate and mercapturate), unchanged acet-aminophen concentrations in plasma and urine, and serumtotal testosterone, free testosterone and estradiol-17β.Meals were provided after the pre-dose and the 4-hourblood collection. Subjects were required to consume thesame meal items on each of the 8-hour test days.
Food record and diaryA three-day food record was dispensed at screening andat each subsequent visit. Participants were instructed tocomplete it weekly on two weekdays and one weekendday, for the two weeks prior to the baseline visit andevery week thereafter up to day 28. Food records wereused to ensure that participants were compliant to thefood regimen and did not consume cruciferous vegeta-bles as instructed. A paper diary was dispensed to sub-jects at baseline and on Day 7, 14 and 21 for subjects torecord product use, changes in concomitant therapies,and any side-effects/changes in health conditions. Thediaries were reviewed weekly.
Treatment complianceCompliance was assessed by counting the returned tab-lets at each visit. The compliance rate was calculated bydividing the number of tablets consumed divided by thenumber expected to have been taken multiplied by 100.Participants were counseled on product use at a compli-ance of <80% or >120% at any visit. Participants with acompliance rate of <75% or >130%, for two consecutivevisits, were considered non-compliant and withdrawnfrom the study.
Analysis of plasma and urine acetaminophen metabolitesSample collection and preparationWhole blood was collected in 6 ml heparin tubes at 0(pre-acetaminophen dose), 2, 4, 6 and 8 hours post-acetaminophen dose during baseline and on Day 28. Theplasma was separated and aliquoted into 1.0 mL volumesamples. These samples were stored below −40°C untilhigh-performance lipid chromatography (HPLC) analysiswas performed. Plasma samples were prepared for HPLCanalysis by adding 25 μl of 30% w/v aqueous perchloricacid (311413, Sigma-Aldrich, Toronto, Canada) to 250 μlof plasma in a 1.5 ml Eppendorf tube and then vortexedfor 30 seconds and centrifuged at 1800 g for 10 min and20 μl of clear supernatant was injected into the HPLCsystem.At baseline and week 4, urine was collected in separate
containers at 2 hour intervals between 0 and 8 hours,aliquoted into 1.0 mL volumes and stored below −40°Cuntil HPLC analysis. Urine samples were prepared forHPLC analysis by adding 750 μl of Milli Q water to
Evans et al. BMC Complementary and Alternative Medicine 2014, 14:475 Page 4 of 12http://www.biomedcentral.com/1472-6882/14/475
250 μl of urine and vortexed. The preparation was cen-trifuged at 1800 g for 10 min and 20 μl of the prepar-ation was injected into the HPLC system.
Preparation of standards for plasma analysisParacetamol (50 μg, A5000, Sigma-Aldrich, Toronto,Canada), paracetamol glucuronide (50 μg, A4438, Sigma-Aldrich, Toronto, Canada), or paracetamol sulfate (50 μg,A161230, Toronto Research Chemical Inc., Toronto,Canada) was added to 1 ml of Milli Q water/methanolmixture (50:50 v/v). NAPQI (50 μg, A170000, TorontoResearch Chemical) was added to 1 ml acetonitrile. Eightstandard solutions were prepared in plasma devoid ofparacetamol (blank) at the following concentrations:25 μg/ml, 12.5 μg/ml, 6.25 μg/ml, 3.125 μg/ml, 1.56 μg/ml,0.78 μg/ml and 0.39 μg/ml by serial dilution.
Preparation of standards for urine analysisParacetamol (5000 μg, A5000, Sigma-Aldrich), paraceta-mol glucuronide (5000 μg, A4438, Sigma-Aldrich), para-cetamol sulfate (5000 μg, A161230, Toronto ResearchChemical) or paracetamol mercapturate (5000 μg, A172100,Toronto Research Chemical) were added to 1 ml of a MilliQ water/methanol mixture (50:50 v/v). Serial dilutions ofeach stock solution were prepared in urine devoid ofparacetamol (blank) to give the following concentrations:2500 μg/ml, 1250 μg/ml, 625 μg/ml, 312.5 μg/ml,156.25 μg/ml, 78.15 μg/ml, 39.0625 μg/ml, 19.531 μg/ml, 9.766 μg/ml and 4.883 μg/ml by serial dilution.
Chromatographic conditionsThe chromatography system comprised of a Varian Solv-ent Delivery module 210, injector Varian Auto Samplermodel 410, Varian 335 Photo Diode Array Detector fordetection and MS workstation software 6.4.1 for data ac-quisition. Reverse phase isocratic HPLC analysis was per-formed with a C18 column with particle size 4 μm(4.6x150 mm). The flow rate was 0.65-0.75 ml/minute andthe detection was at 240–245 nm. A 0.1 M sodium phos-phate buffer containing acetonitrile at a ratio of 10:90(v/v) was used as the mobile phase for plasma analysis. A1 M sodium phosphate buffer containing acetonitrile at aratio of 5:95 (v/v) was used as mobile phase for urineanalysis.
Analysis of serum hormonesTwo 5 ml serum separating tubes of blood were col-lected for serum total/free testosterone and estradiol-17β at each time-point (0, 2, 4, 6, 8 h). The samples wereallowed to clot at room temperature for 30 minutes andthen centrifuged for 10 minutes at 3200 rpm at 25°Cand shipped refrigerated to a Central Laboratory for ana-lysis (LifeLabs Medical Laboratory Services, London,ON, Canada).
Statistical analysisA paired t-test was used to compare pre- and post-treatment efficacy measurements of serum and urine acet-aminophen metabolite levels, and for plasma testosteroneand estradiol-17β. Statistical comparisons of maximumconcentrations (Cmax) and area under the concentrationtime curve (AUC) were performed on log transformeddata. A paired t-test was used to compare pre- and post-treatment measurements of safety end points: biometrics,vital signs, hematology and blood clinical chemistry pa-rameters. SAS Version 9.1 was used to perform the statis-tical analysis, with probability values ≤0.05 consideredstatistically significant.
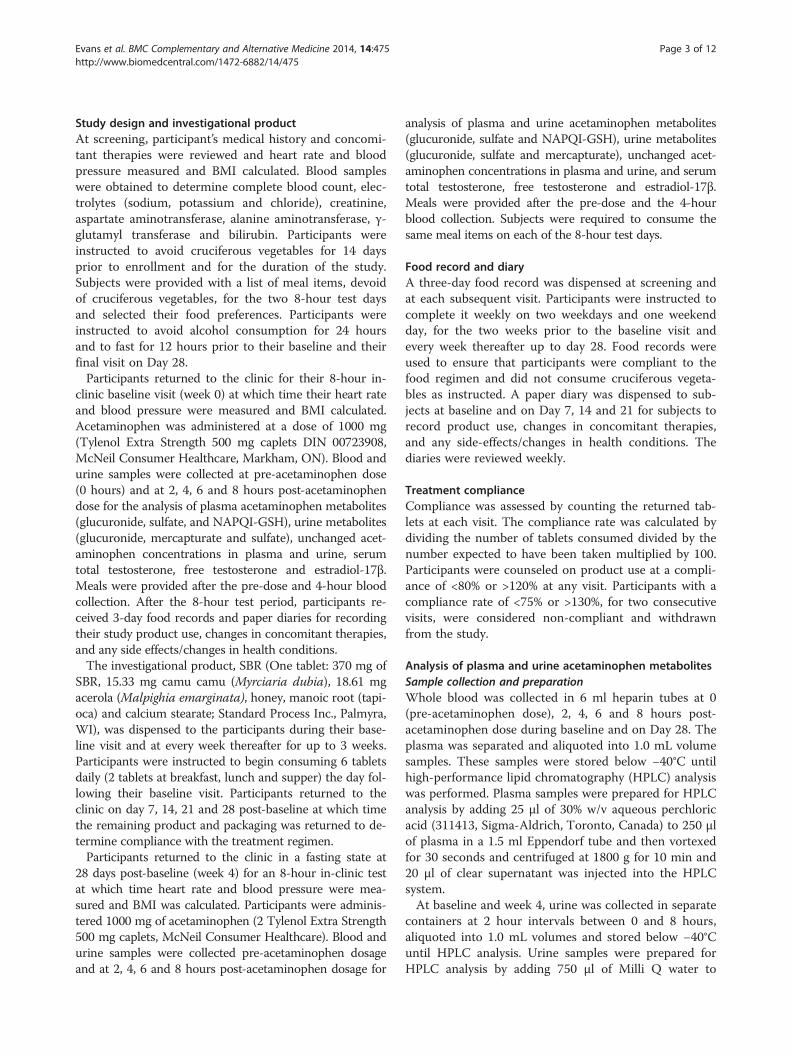
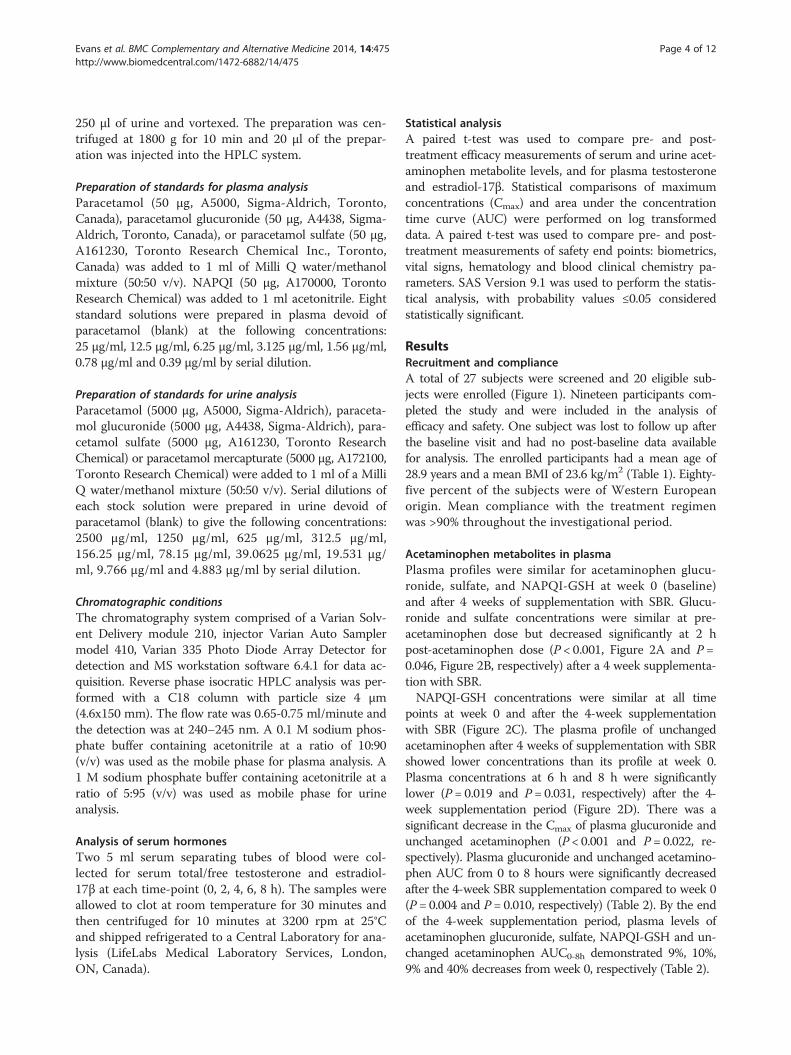
ResultsRecruitment and complianceA total of 27 subjects were screened and 20 eligible sub-jects were enrolled (Figure 1). Nineteen participants com-pleted the study and were included in the analysis ofefficacy and safety. One subject was lost to follow up afterthe baseline visit and had no post-baseline data availablefor analysis. The enrolled participants had a mean age of28.9 years and a mean BMI of 23.6 kg/m2 (Table 1). Eighty-five percent of the subjects were of Western Europeanorigin. Mean compliance with the treatment regimenwas >90% throughout the investigational period.
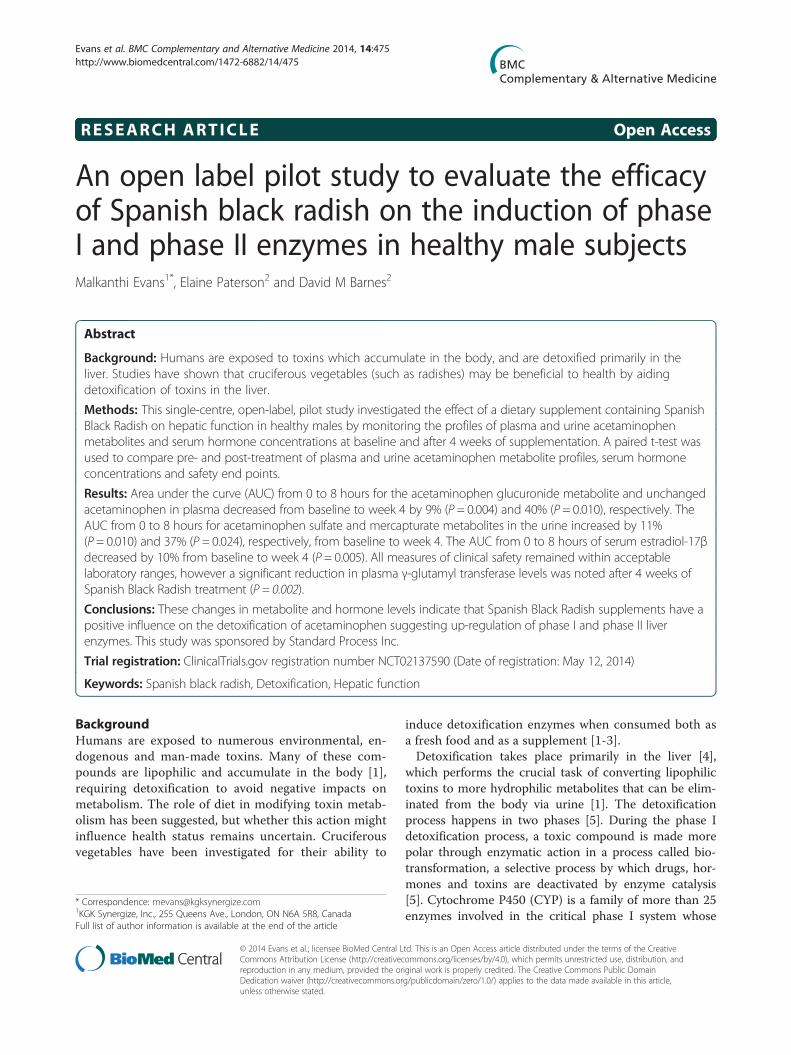
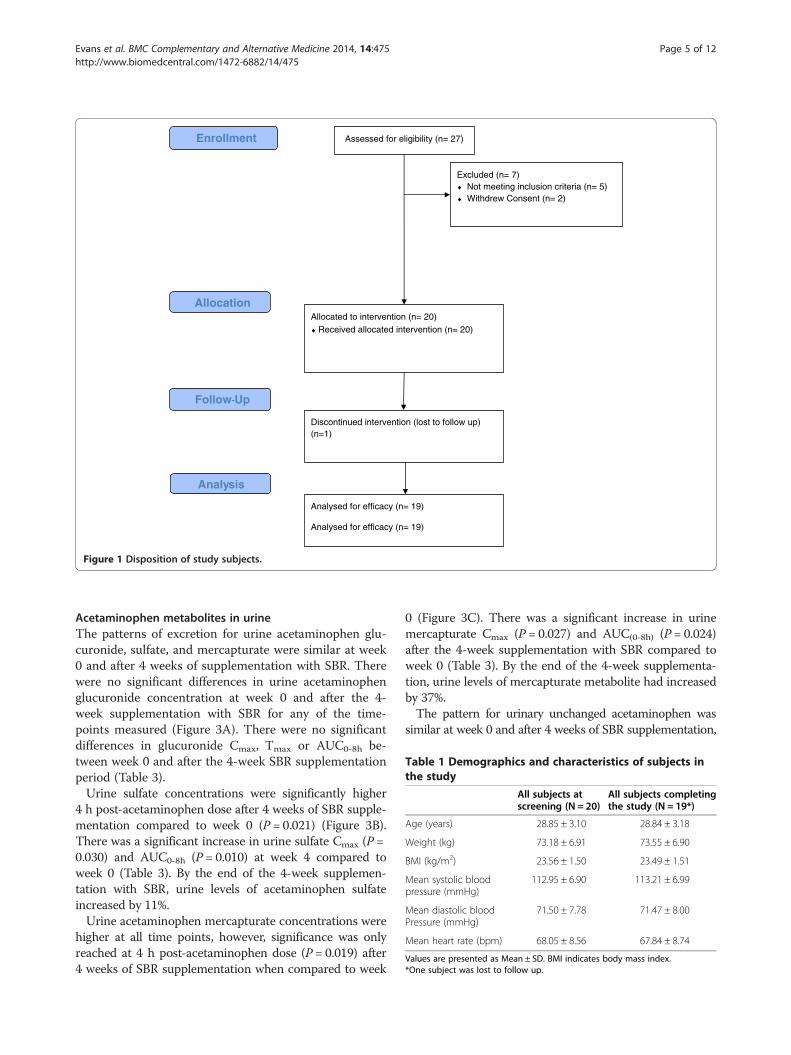
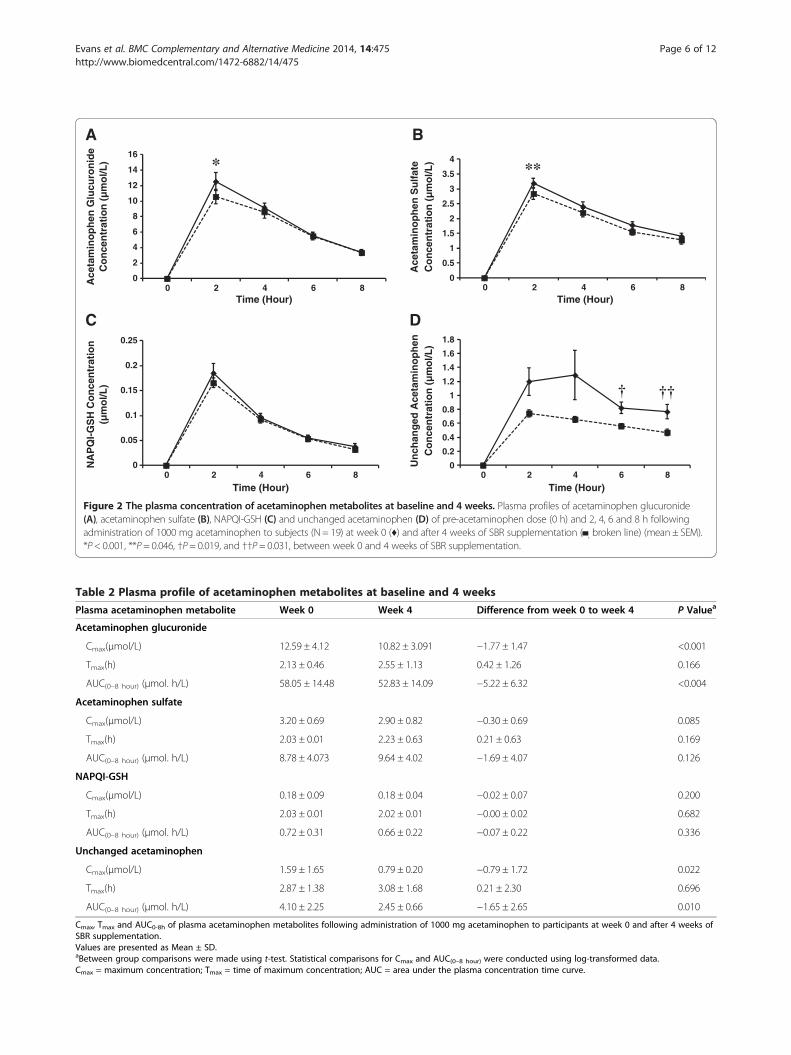
Acetaminophen metabolites in plasmaPlasma profiles were similar for acetaminophen glucu-ronide, sulfate, and NAPQI-GSH at week 0 (baseline)and after 4 weeks of supplementation with SBR. Glucu-ronide and sulfate concentrations were similar at pre-acetaminophen dose but decreased significantly at 2 hpost-acetaminophen dose (P < 0.001, Figure 2A and P =0.046, Figure 2B, respectively) after a 4 week supplementa-tion with SBR.NAPQI-GSH concentrations were similar at all time
points at week 0 and after the 4-week supplementationwith SBR (Figure 2C). The plasma profile of unchangedacetaminophen after 4 weeks of supplementation with SBRshowed lower concentrations than its profile at week 0.Plasma concentrations at 6 h and 8 h were significantlylower (P = 0.019 and P = 0.031, respectively) after the 4-week supplementation period (Figure 2D). There was asignificant decrease in the Cmax of plasma glucuronide andunchanged acetaminophen (P < 0.001 and P = 0.022, re-spectively). Plasma glucuronide and unchanged acetamino-phen AUC from 0 to 8 hours were significantly decreasedafter the 4-week SBR supplementation compared to week 0(P = 0.004 and P = 0.010, respectively) (Table 2). By the endof the 4-week supplementation period, plasma levels ofacetaminophen glucuronide, sulfate, NAPQI-GSH and un-changed acetaminophen AUC0-8h demonstrated 9%, 10%,9% and 40% decreases from week 0, respectively (Table 2).
Assessed for eligibility (n= 27)
Excluded (n= 7) ♦ Not meeting inclusion criteria (n= 5) ♦ Withdrew Consent (n= 2)
Discontinued intervention (lost to follow up) (n=1)
Allocated to intervention (n= 20) ♦ Received allocated intervention (n= 20)
Analysed for efficacy (n= 19)
Analysed for efficacy (n= 19)
Allocation
Analysis
Enrollment
Figure 1 Disposition of study subjects.
Table 1 Demographics and characteristics of subjects inthe study
All subjects atscreening (N = 20)
All subjects completingthe study (N = 19*)
Age (years) 28.85 ± 3.10 28.84 ± 3.18
Weight (kg) 73.18 ± 6.91 73.55 ± 6.90
BMI (kg/m2) 23.56 ± 1.50 23.49 ± 1.51
Mean systolic bloodpressure (mmHg)
112.95 ± 6.90 113.21 ± 6.99
Mean diastolic bloodPressure (mmHg)
71.50 ± 7.78 71.47 ± 8.00
Mean heart rate (bpm) 68.05 ± 8.56 67.84 ± 8.74
Values are presented as Mean ± SD. BMI indicates body mass index.*One subject was lost to follow up.
Evans et al. BMC Complementary and Alternative Medicine 2014, 14:475 Page 5 of 12http://www.biomedcentral.com/1472-6882/14/475
Acetaminophen metabolites in urineThe patterns of excretion for urine acetaminophen glu-curonide, sulfate, and mercapturate were similar at week0 and after 4 weeks of supplementation with SBR. Therewere no significant differences in urine acetaminophenglucuronide concentration at week 0 and after the 4-week supplementation with SBR for any of the time-points measured (Figure 3A). There were no significantdifferences in glucuronide Cmax, Tmax or AUC0-8h be-tween week 0 and after the 4-week SBR supplementationperiod (Table 3).Urine sulfate concentrations were significantly higher
4 h post-acetaminophen dose after 4 weeks of SBR supple-mentation compared to week 0 (P = 0.021) (Figure 3B).There was a significant increase in urine sulfate Cmax (P =0.030) and AUC0-8h (P = 0.010) at week 4 compared toweek 0 (Table 3). By the end of the 4-week supplemen-tation with SBR, urine levels of acetaminophen sulfateincreased by 11%.Urine acetaminophen mercapturate concentrations were
higher at all time points, however, significance was onlyreached at 4 h post-acetaminophen dose (P = 0.019) after4 weeks of SBR supplementation when compared to week
0 (Figure 3C). There was a significant increase in urinemercapturate Cmax (P = 0.027) and AUC(0-8h) (P = 0.024)after the 4-week supplementation with SBR compared toweek 0 (Table 3). By the end of the 4-week supplementa-tion, urine levels of mercapturate metabolite had increasedby 37%.The pattern for urinary unchanged acetaminophen was
similar at week 0 and after 4 weeks of SBR supplementation,
0
2
4
6
8
10
12
14
16
Time (Hour)
A
0
0.5
1
1.5
2
2.5
3
3.5
4
Time (Hour)
B
0
0.05
0.1
0.15
0.2
0.25
(µm
ol/L
)
Time (Hour)
C
0
0.2
0.4
0.6
0.8
1
1.2
1.4
1.6
1.8
0 2 4 6 8 0 2 4 6 8
0 2 4 6 8 0 2 4 6 8
Time (Hour)
D
NA
PQ
I-G
SH
Co
nce
ntr
atio
nA
ceta
min
op
hen
Glu
curo
nid
eC
on
cen
trat
ion
(µ
mo
l/L)
Ace
tam
ino
ph
en S
ulf
ate
Co
nce
ntr
atio
n (
µm
ol/L
)U
nch
ang
ed A
ceta
min
op
hen
Co
nce
ntr
atio
n (
µm
ol/L
)
Figure 2 The plasma concentration of acetaminophen metabolites at baseline and 4 weeks. Plasma profiles of acetaminophen glucuronide(A), acetaminophen sulfate (B), NAPQI-GSH (C) and unchanged acetaminophen (D) of pre-acetaminophen dose (0 h) and 2, 4, 6 and 8 h followingadministration of 1000 mg acetaminophen to subjects (N = 19) at week 0 (♦) and after 4 weeks of SBR supplementation (▀, broken line) (mean ± SEM).*P < 0.001, **P = 0.046, †P = 0.019, and ††P = 0.031, between week 0 and 4 weeks of SBR supplementation.
Table 2 Plasma profile of acetaminophen metabolites at baseline and 4 weeks
Plasma acetaminophen metabolite Week 0 Week 4 Difference from week 0 to week 4 P Valuea
Acetaminophen glucuronide
Cmax(μmol/L) 12.59 ± 4.12 10.82 ± 3.091 −1.77 ± 1.47 <0.001
Tmax(h) 2.13 ± 0.46 2.55 ± 1.13 0.42 ± 1.26 0.166
AUC(0–8 hour) (μmol. h/L) 58.05 ± 14.48 52.83 ± 14.09 −5.22 ± 6.32 <0.004
Acetaminophen sulfate
Cmax(μmol/L) 3.20 ± 0.69 2.90 ± 0.82 −0.30 ± 0.69 0.085
Tmax(h) 2.03 ± 0.01 2.23 ± 0.63 0.21 ± 0.63 0.169
AUC(0–8 hour) (μmol. h/L) 8.78 ± 4.073 9.64 ± 4.02 −1.69 ± 4.07 0.126
NAPQI-GSH
Cmax(μmol/L) 0.18 ± 0.09 0.18 ± 0.04 −0.02 ± 0.07 0.200
Tmax(h) 2.03 ± 0.01 2.02 ± 0.01 −0.00 ± 0.02 0.682
AUC(0–8 hour) (μmol. h/L) 0.72 ± 0.31 0.66 ± 0.22 −0.07 ± 0.22 0.336
Unchanged acetaminophen
Cmax(μmol/L) 1.59 ± 1.65 0.79 ± 0.20 −0.79 ± 1.72 0.022
Tmax(h) 2.87 ± 1.38 3.08 ± 1.68 0.21 ± 2.30 0.696
AUC(0–8 hour) (μmol. h/L) 4.10 ± 2.25 2.45 ± 0.66 −1.65 ± 2.65 0.010
Cmax, Tmax and AUC0-8h of plasma acetaminophen metabolites following administration of 1000 mg acetaminophen to participants at week 0 and after 4 weeks ofSBR supplementation.Values are presented as Mean ± SD.aBetween group comparisons were made using t-test. Statistical comparisons for Cmax and AUC(0–8 hour) were conducted using log-transformed data.Cmax = maximum concentration; Tmax = time of maximum concentration; AUC = area under the plasma concentration time curve.
Evans et al. BMC Complementary and Alternative Medicine 2014, 14:475 Page 6 of 12http://www.biomedcentral.com/1472-6882/14/475
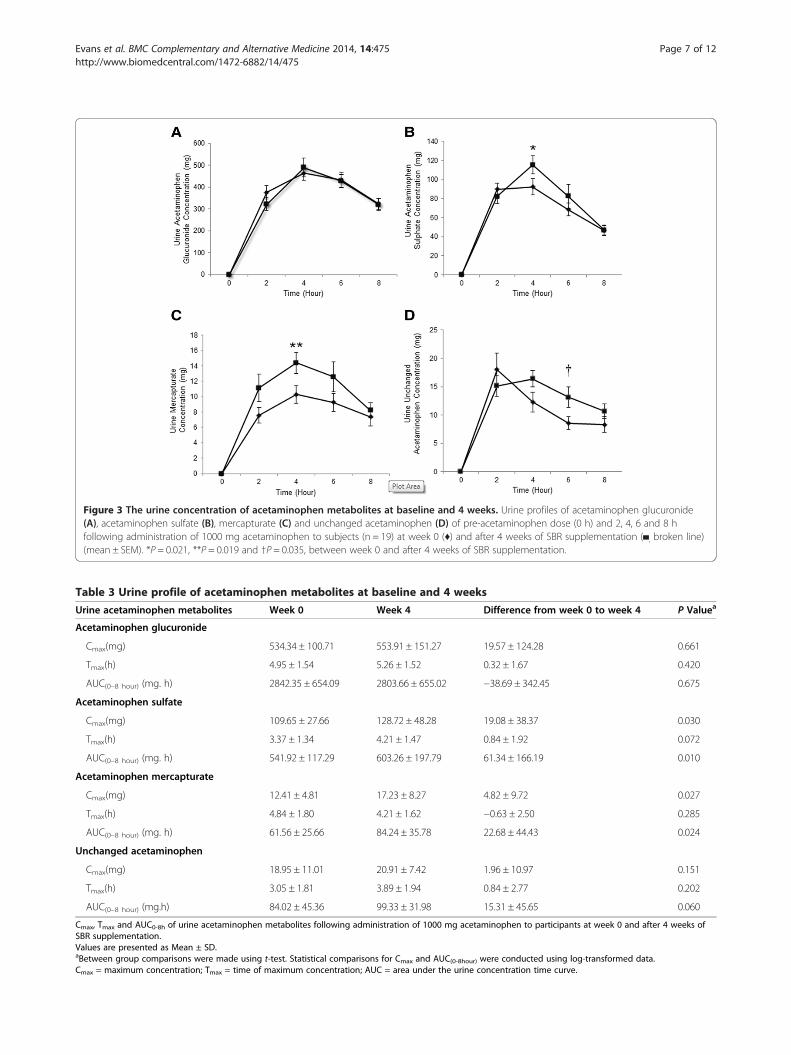
Figure 3 The urine concentration of acetaminophen metabolites at baseline and 4 weeks. Urine profiles of acetaminophen glucuronide(A), acetaminophen sulfate (B), mercapturate (C) and unchanged acetaminophen (D) of pre-acetaminophen dose (0 h) and 2, 4, 6 and 8 hfollowing administration of 1000 mg acetaminophen to subjects (n = 19) at week 0 (♦) and after 4 weeks of SBR supplementation (▀, broken line)(mean ± SEM). *P = 0.021, **P = 0.019 and †P = 0.035, between week 0 and after 4 weeks of SBR supplementation.
Table 3 Urine profile of acetaminophen metabolites at baseline and 4 weeks
Urine acetaminophen metabolites Week 0 Week 4 Difference from week 0 to week 4 P Valuea
Acetaminophen glucuronide
Cmax(mg) 534.34 ± 100.71 553.91 ± 151.27 19.57 ± 124.28 0.661
Tmax(h) 4.95 ± 1.54 5.26 ± 1.52 0.32 ± 1.67 0.420
AUC(0–8 hour) (mg. h) 2842.35 ± 654.09 2803.66 ± 655.02 −38.69 ± 342.45 0.675
Acetaminophen sulfate
Cmax(mg) 109.65 ± 27.66 128.72 ± 48.28 19.08 ± 38.37 0.030
Tmax(h) 3.37 ± 1.34 4.21 ± 1.47 0.84 ± 1.92 0.072
AUC(0–8 hour) (mg. h) 541.92 ± 117.29 603.26 ± 197.79 61.34 ± 166.19 0.010
Acetaminophen mercapturate
Cmax(mg) 12.41 ± 4.81 17.23 ± 8.27 4.82 ± 9.72 0.027
Tmax(h) 4.84 ± 1.80 4.21 ± 1.62 −0.63 ± 2.50 0.285
AUC(0–8 hour) (mg. h) 61.56 ± 25.66 84.24 ± 35.78 22.68 ± 44.43 0.024
Unchanged acetaminophen
Cmax(mg) 18.95 ± 11.01 20.91 ± 7.42 1.96 ± 10.97 0.151
Tmax(h) 3.05 ± 1.81 3.89 ± 1.94 0.84 ± 2.77 0.202
AUC(0–8 hour) (mg.h) 84.02 ± 45.36 99.33 ± 31.98 15.31 ± 45.65 0.060
Cmax, Tmax and AUC0-8h of urine acetaminophen metabolites following administration of 1000 mg acetaminophen to participants at week 0 and after 4 weeks ofSBR supplementation.Values are presented as Mean ± SD.aBetween group comparisons were made using t-test. Statistical comparisons for Cmax and AUC(0-8hour) were conducted using log-transformed data.Cmax = maximum concentration; Tmax = time of maximum concentration; AUC = area under the urine concentration time curve.
Evans et al. BMC Complementary and Alternative Medicine 2014, 14:475 Page 7 of 12http://www.biomedcentral.com/1472-6882/14/475
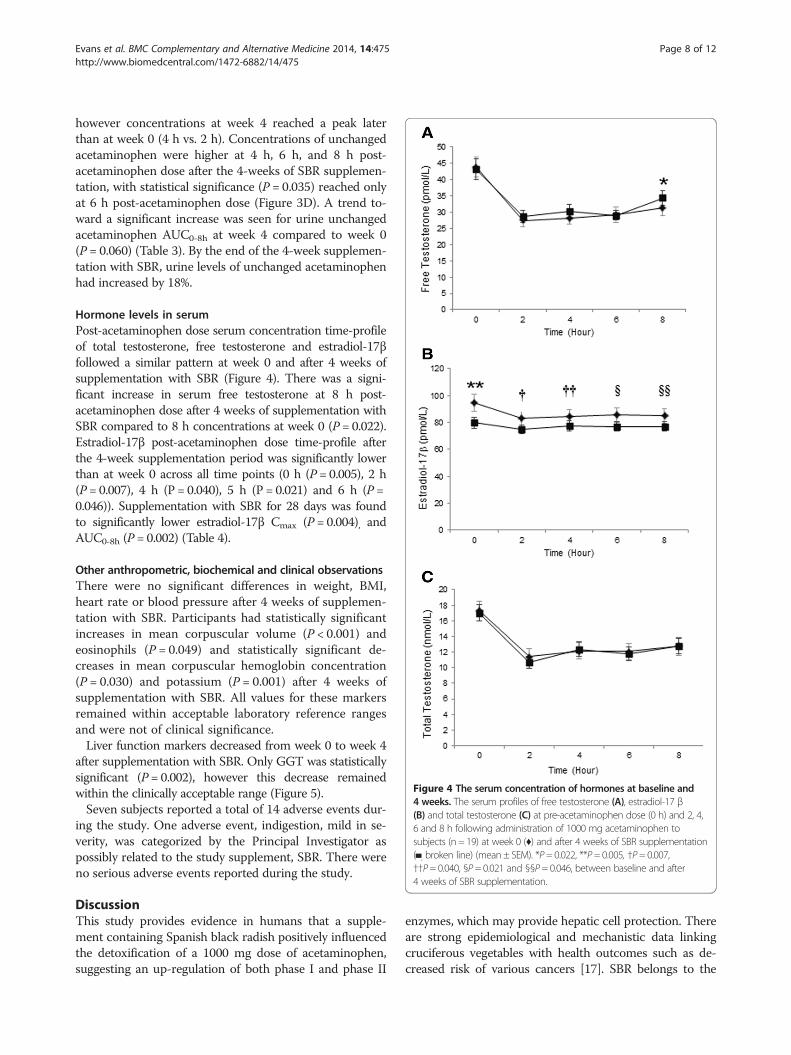
Figure 4 The serum concentration of hormones at baseline and4 weeks. The serum profiles of free testosterone (A), estradiol-17 β(B) and total testosterone (C) at pre-acetaminophen dose (0 h) and 2, 4,6 and 8 h following administration of 1000 mg acetaminophen tosubjects (n = 19) at week 0 (♦) and after 4 weeks of SBR supplementation(▀, broken line) (mean ± SEM). *P= 0.022, **P= 0.005, †P= 0.007,††P= 0.040, §P= 0.021 and §§P= 0.046, between baseline and after4 weeks of SBR supplementation.
Evans et al. BMC Complementary and Alternative Medicine 2014, 14:475 Page 8 of 12http://www.biomedcentral.com/1472-6882/14/475
however concentrations at week 4 reached a peak laterthan at week 0 (4 h vs. 2 h). Concentrations of unchangedacetaminophen were higher at 4 h, 6 h, and 8 h post-acetaminophen dose after the 4-weeks of SBR supplemen-tation, with statistical significance (P = 0.035) reached onlyat 6 h post-acetaminophen dose (Figure 3D). A trend to-ward a significant increase was seen for urine unchangedacetaminophen AUC0-8h at week 4 compared to week 0(P = 0.060) (Table 3). By the end of the 4-week supplemen-tation with SBR, urine levels of unchanged acetaminophenhad increased by 18%.
Hormone levels in serumPost-acetaminophen dose serum concentration time-profileof total testosterone, free testosterone and estradiol-17βfollowed a similar pattern at week 0 and after 4 weeks ofsupplementation with SBR (Figure 4). There was a signi-ficant increase in serum free testosterone at 8 h post-acetaminophen dose after 4 weeks of supplementation withSBR compared to 8 h concentrations at week 0 (P = 0.022).Estradiol-17β post-acetaminophen dose time-profile afterthe 4-week supplementation period was significantly lowerthan at week 0 across all time points (0 h (P = 0.005), 2 h(P = 0.007), 4 h (P = 0.040), 5 h (P = 0.021) and 6 h (P =0.046)). Supplementation with SBR for 28 days was foundto significantly lower estradiol-17β Cmax (P = 0.004), andAUC0-8h (P = 0.002) (Table 4).
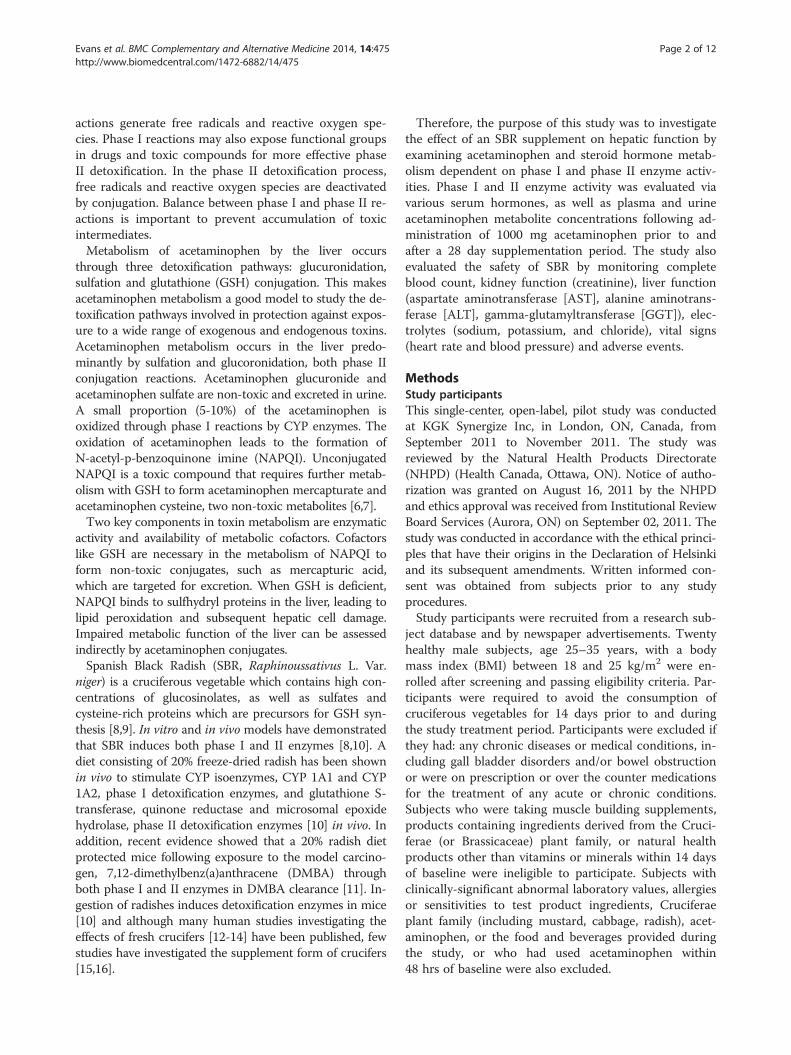
Other anthropometric, biochemical and clinical observationsThere were no significant differences in weight, BMI,heart rate or blood pressure after 4 weeks of supplemen-tation with SBR. Participants had statistically significantincreases in mean corpuscular volume (P < 0.001) andeosinophils (P = 0.049) and statistically significant de-creases in mean corpuscular hemoglobin concentration(P = 0.030) and potassium (P = 0.001) after 4 weeks ofsupplementation with SBR. All values for these markersremained within acceptable laboratory reference rangesand were not of clinical significance.Liver function markers decreased from week 0 to week 4
after supplementation with SBR. Only GGT was statisticallysignificant (P = 0.002), however this decrease remainedwithin the clinically acceptable range (Figure 5).Seven subjects reported a total of 14 adverse events dur-
ing the study. One adverse event, indigestion, mild in se-verity, was categorized by the Principal Investigator aspossibly related to the study supplement, SBR. There wereno serious adverse events reported during the study.
DiscussionThis study provides evidence in humans that a supple-ment containing Spanish black radish positively influencedthe detoxification of a 1000 mg dose of acetaminophen,suggesting an up-regulation of both phase I and phase II
enzymes, which may provide hepatic cell protection. Thereare strong epidemiological and mechanistic data linkingcruciferous vegetables with health outcomes such as de-creased risk of various cancers [17]. SBR belongs to the
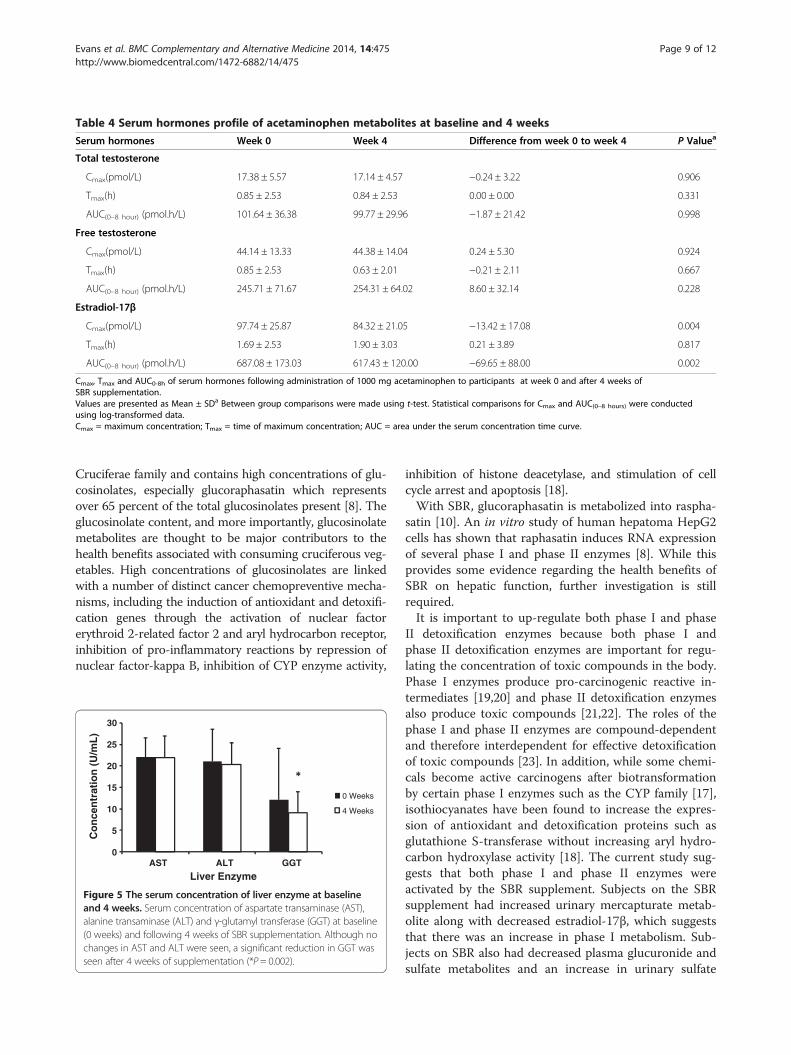
Table 4 Serum hormones profile of acetaminophen metabolites at baseline and 4 weeks
Serum hormones Week 0 Week 4 Difference from week 0 to week 4 P Valuea
Total testosterone
Cmax(pmol/L) 17.38 ± 5.57 17.14 ± 4.57 −0.24 ± 3.22 0.906
Tmax(h) 0.85 ± 2.53 0.84 ± 2.53 0.00 ± 0.00 0.331
AUC(0–8 hour) (pmol.h/L) 101.64 ± 36.38 99.77 ± 29.96 −1.87 ± 21.42 0.998
Free testosterone
Cmax(pmol/L) 44.14 ± 13.33 44.38 ± 14.04 0.24 ± 5.30 0.924
Tmax(h) 0.85 ± 2.53 0.63 ± 2.01 −0.21 ± 2.11 0.667
AUC(0–8 hour) (pmol.h/L) 245.71 ± 71.67 254.31 ± 64.02 8.60 ± 32.14 0.228
Estradiol-17β
Cmax(pmol/L) 97.74 ± 25.87 84.32 ± 21.05 −13.42 ± 17.08 0.004
Tmax(h) 1.69 ± 2.53 1.90 ± 3.03 0.21 ± 3.89 0.817
AUC(0–8 hour) (pmol.h/L) 687.08 ± 173.03 617.43 ± 120.00 −69.65 ± 88.00 0.002
Cmax, Tmax and AUC0-8h of serum hormones following administration of 1000 mg acetaminophen to participants at week 0 and after 4 weeks ofSBR supplementation.Values are presented as Mean ± SDa Between group comparisons were made using t-test. Statistical comparisons for Cmax and AUC(0–8 hours) were conductedusing log-transformed data.Cmax = maximum concentration; Tmax = time of maximum concentration; AUC = area under the serum concentration time curve.
Evans et al. BMC Complementary and Alternative Medicine 2014, 14:475 Page 9 of 12http://www.biomedcentral.com/1472-6882/14/475
Cruciferae family and contains high concentrations of glu-cosinolates, especially glucoraphasatin which representsover 65 percent of the total glucosinolates present [8]. Theglucosinolate content, and more importantly, glucosinolatemetabolites are thought to be major contributors to thehealth benefits associated with consuming cruciferous veg-etables. High concentrations of glucosinolates are linkedwith a number of distinct cancer chemopreventive mecha-nisms, including the induction of antioxidant and detoxifi-cation genes through the activation of nuclear factorerythroid 2-related factor 2 and aryl hydrocarbon receptor,inhibition of pro-inflammatory reactions by repression ofnuclear factor-kappa B, inhibition of CYP enzyme activity,
0
5
10
15
20
25
30
Liver Enzyme
0 Weeks
4 Weeks
Co
nce
ntr
atio
n (
U/m
L)
GGTALTAST
Figure 5 The serum concentration of liver enzyme at baselineand 4 weeks. Serum concentration of aspartate transaminase (AST),alanine transaminase (ALT) and γ-glutamyl transferase (GGT) at baseline(0 weeks) and following 4 weeks of SBR supplementation. Although nochanges in AST and ALT were seen, a significant reduction in GGT wasseen after 4 weeks of supplementation (*P = 0.002).
inhibition of histone deacetylase, and stimulation of cellcycle arrest and apoptosis [18].With SBR, glucoraphasatin is metabolized into raspha-
satin [10]. An in vitro study of human hepatoma HepG2cells has shown that raphasatin induces RNA expressionof several phase I and phase II enzymes [8]. While thisprovides some evidence regarding the health benefits ofSBR on hepatic function, further investigation is stillrequired.It is important to up-regulate both phase I and phase
II detoxification enzymes because both phase I andphase II detoxification enzymes are important for regu-lating the concentration of toxic compounds in the body.Phase I enzymes produce pro-carcinogenic reactive in-termediates [19,20] and phase II detoxification enzymesalso produce toxic compounds [21,22]. The roles of thephase I and phase II enzymes are compound-dependentand therefore interdependent for effective detoxificationof toxic compounds [23]. In addition, while some chemi-cals become active carcinogens after biotransformationby certain phase I enzymes such as the CYP family [17],isothiocyanates have been found to increase the expres-sion of antioxidant and detoxification proteins such asglutathione S-transferase without increasing aryl hydro-carbon hydroxylase activity [18]. The current study sug-gests that both phase I and phase II enzymes wereactivated by the SBR supplement. Subjects on the SBRsupplement had increased urinary mercapturate metab-olite along with decreased estradiol-17β, which suggeststhat there was an increase in phase I metabolism. Sub-jects on SBR also had decreased plasma glucuronide andsulfate metabolites and an increase in urinary sulfate
Evans et al. BMC Complementary and Alternative Medicine 2014, 14:475 Page 10 of 12http://www.biomedcentral.com/1472-6882/14/475
metabolite, suggesting an alteration of phase II metabol-ism. In addition, the decrease of unchanged acetamino-phen in plasma and its increase in urine shows that SBRenhanced the clearance of unchanged acetaminophen.A few human Brassica feeding studies have also re-
ported an up-regulation in phase I [24-26] and phase IIenzymes [26-29]. Mice supplemented with phenylbutylisoselenocyanate, a derivative of isothiocyanate that ispresent in cruciferous vegetables as a glucosinolate pre-cursor [30-32] showed a transient increase in expressionof two phase I genes while phase II genes remained up-regulated [33]. The animal studies suggest that the nega-tive effects of phase I CYP activity may be overcome byphase II enzyme activity, thus demonstrating the inter-dependence between phase I and phase II detoxificationenzymes.Rodent models to evaluate the protective effects
of pharmaceutical and nutraceutical interventions onacetaminophen-induced liver injury are widely used andaccepted as clinically relevant in determining the mechan-ism of action of products [34-36]. The mouse model isconsidered to have close similarities to mechanisms ofacetaminophen toxicity in human hepatocytes and to themechanisms that occur in human overdose patients [36].Therefore, we have extended this model and assessed theeffect of SBR supplementation on human phase I and IImetabolism of acetaminophen in the liver, as has previ-ously been done for garlic extract [34]. Phase II assess-ment methods may be used to measure the clearance ofacetaminophen which is metabolized through three phaseII pathways: GSH conjugation, sulfation and glucuroni-dation. These pathways form urinary acetaminophenmercapturates, acetaminophen sulfate and acetaminophenglucuronide, respectively [7]. Low clearance of theseacetaminophen metabolites is an indication that phase IIreactions are impaired, and the measurement of thesemetabolites is a non-invasive method to determine thehealth of the liver.The baseline profile of acetaminophen metabolites in
this study was consistent with previous studies [37-39].After 4 weeks of supplementation, urine acetaminophenglucuronide, acetaminophen sulfate, mercapturate and un-changed acetaminophen increased by 1%, 11%, 37% and18%, respectively. Plasma acetaminophen glucuronide,acetaminophen sulfate, and unchanged acetaminophendecreased by 9%, 10%, and 40%, respectively. Decreasedacetaminophen sulfate and unchanged acetaminophen inplasma corresponded to an increase in the urine, suggest-ing that subjects had more efficient metabolism and clear-ance of acetaminophen.The serum total and free testosterone profiles post-
acetaminophen dose after 4 weeks of supplementationwere similar to baseline, but while post-acetaminophendose serum estradiol-17β profiles followed similar
patterns to baseline, the concentrations of the serumestradiol-17β at all time points, at maximum con-centration, and over the course of absorption were sig-nificantly lower. Given that the more widely studiedglucosinolate metabolite, indole-3-carbinol induces li-ver CYP1A1, 1A2 and 2B1/2 expression and increasesestradiol-17β metabolism [40,41], and a 20% freeze-dried radish diet stimulates CYP 1A1 and CYP 1A2expression [10], the 16% decrease in fasting serumestradiol-17β concentrations suggests that phase I en-zymes were induced by SBR from baseline to week 4providing evidence that the glucosinolate metabolitesand other potential actives remained functional despitethe manufacturing process. The changes in plasmaGGT and estradiol-17β levels and changes in acet-aminophen metabolism with 4 weeks of SBR supple-mentation support the hypothesis that SBR may have aprotective liver function.
LimitationsAs this was an open label study, the absence of a placebogroup for comparison was certainly a limitation. Thus, arandomized, placebo-controlled clinical trial is clearlyneeded to establish the role of SBR in hepatic function.As well, the bioavailability profiles were measured foronly 8 h. Measurement of the profiles over 24 h mayhave allowed for full documentation of acetaminophenclearance and established the time for plasma values toreturn to baseline. Furthermore, inclusion of both malesand females would have provided information on genderspecific effects of SBR.
ConclusionsThis study demonstrated that the supplement contain-ing SBR positively altered the metabolism of acet-aminophen, suggesting an effective increase in liverdetoxification capacity in humans in the same manneras previous reports with whole food crucifers. Despitethe large body of existing literature supporting thehealth benefits of cruciferous vegetables [17] and ef-forts to promote their consumption along with otherfruits and vegetables, intake of these healthy foods hasnot increased [42]. The intake of cruciferous food sup-plements could provide an important alternative routeto attain the same health benefits.
AbbreviationsALT: Alanine aminotransferase; AST: Aspartate aminotransferase;AUC: Concentration time curve; BMI: Body mass index; AUC: Area under theconcentration time curve; Cmax: Maximum concentration; CYP: CytochromeP450; GGT: Glutamyl transferase; GSH: Glutathione; HPLC: High performanceliquid chromatography; NAPQI: N-acetyl-p-benzoquinone; SBR: Spanish blackradish; Tmax: Time of maximum concentration.
Competing interestsME has no competing interests to report. EP and DB were employees ofStandard Process Inc. at the time of the study. This project was sponsored

Evans et al. BMC Complementary and Alternative Medicine 2014, 14:475 Page 11 of 12http://www.biomedcentral.com/1472-6882/14/475
by Standard Process Inc. EP and DB contributed to the design of the study,but not the conduct the study nor the statistical analysis and interpretationof data.
Authors’ contributionsEP, DB and ME contributed to the objectives and design of the study. Allauthors contributed to the writing, read and approved the final manuscript.
AcknowledgementsWe wish to thank the volunteers who took part in this study for theirwillingness and diligence in complying with the study protocol. This studywas sponsored by Standard Process Inc. (Palmyra, WI, USA), conducted atKGK Synergize Inc. (London, ON, Canada) and overseen by Dale Wilson, MD.The authors wish to thank Sonya Barss for overseeing the conduct of thestudy, Larry Stitt, Biostatistician, University of Western Ontario (London,Ontario) for statistical analysis and Eh-Sanus Fahim for overseeing datamanagement. We thank Joshua Baisley for regulatory and quality activitiesand for his technical support. We thank Sara Arscott, PhD, for her assistancewith manuscript preparation and review.
Author details1KGK Synergize, Inc., 255 Queens Ave., London, ON N6A 5R8, Canada.2Standard Process, Inc., 1200 Royal Lee Drive, Palmyra, WI 53156, USA.
Received: 14 July 2014 Accepted: 27 November 2014Published: 9 December 2014
References1. Grant DM: Detoxification pathways in the liver. J Inherit Metab Dis 1991,
14:421–430.2. Clapper ML, Szarka CE, Pfeiffer GR, Graham TA, Balshem AM, Litwin S,
Goosenberg EB, Frucht H, Engstrom PF: Preclinical and clinical evaluationof broccoli supplements as inducers of glutathione S-transferase activity.Clin Cancer Res 1997, 3:25–30.
3. Robbins MG, Hauder J, Somoza V, Eshelman BD, Barnes DM, Hanlon PR:Induction of detoxification enzymes by feeding unblanched Brusselssprouts containing active myrosinase to mice for 2 wk. J Food Sci 2010,75:H190–H199.
4. Stanca CM, Babar J, Singal V, Ozdenerol E, Odin JA: Pathogenic role ofenvironmental toxins in immune-mediated liver diseases. JImmunotoxicol 2008, 5:59–68.
5. Caldecott T, Tierra: Ayurveda: the divine science of life. Edinburgh (Scotland):Mosby Elsevier; 2006.
6. Tujios S, Fontana RJ: Mechanisms of drug-induced liver injury: frombedside to bench. Nat Rev Gastroenterol Hepatol 2011, 8:202–211.
7. Pizzorno J, Murray M: Textbook of natural medicine. St Louis, MO: ChurchillLivingstone Elsevier; 2005.
8. Hanlon PR, Webber DM, Barnes DM: Aqueous extract from Spanish blackradish (Raphanus sativus L. Var. niger) induces detoxification enzymes inthe HepG2 human hepatoma cell line. J Agric Food Chem 2007, 55:6439–6446.
9. Chaturvedi P, Machacha CN: Efficacy of Raphanus sativus in the treatmentof paracetamol-induced hepatotoxicity in albino rats. Br J Biomed Sci2007, 64:105–108.
10. Scholl C, Eshelman BD, Barnes DM, Hanlon PR: Raphasatin is a morepotent inducer of the detoxification enzymes than its degradationproducts. J Food Sci 2011, 76:C504–C511.
11. N'jai AU, Kemp MQ, Metzger BT, Hanlon PR, Robbins M, Czuyprynski C,Barnes DM: Spanish black radish (Raphanus sativus L. Var. niger) dietenhances clearance of DMBA and diminishes toxic effects on bonemarrow progenitor cells. Nutr Cancer 2012, 64:1038–1048.
12. Brauer HA, Libby TE, Mitchell BL, Li L, Chen C, Randolph TW, Yasui YY,Lampe JW, Lampe PD: Cruciferous vegetable supplementation in acontrolled diet study alters the serum peptidome in a GSTM1-genotypedependent manner. Nutr J 2011, 10:11.
13. Navarro SL, Chang JL, Peterson S, Chen C, King IB, Schwarz Y, Li SS, Li L,Potter JD, Lampe JW: Modulation of human serum glutathione S-transferase A1/2 concentration by cruciferous vegetables in a controlledfeeding study is influenced by GSTM1 and GSTT1 genotypes. CancerEpidemiol Biomarkers Prev 2009, 18:2974–2978.
14. Rouzaud G, Young SA, Duncan AJ: Hydrolysis of glucosinolates toisothiocyanates after ingestion of raw or microwaved cabbage byhuman volunteers. Cancer Epidemiol Biomarkers Prev 2004, 13:125–131.
15. Twiner EM, Liu Z, Gimble J, Yu Y, Greenway F: Pharmacokinetic pilot studyof the antiangiogenic activity of standardized platycodi radix. Adv Ther2011, 28:857–865.
16. Dalessandri KM, Firestone GL, Fitch MD, Bradlow HL, Bjeldanes LF: Pilotstudy: effect of 3,3'-diindolylmethane supplements on urinary hormonemetabolites in postmenopausal women with a history of early-stagebreast cancer. Nutr Cancer 2004, 50:161–167.
17. Higdon JV, Delage B, Williams DE, Dashwood RH: Cruciferous vegetablesand human cancer risk: epidemiologic evidence and mechanistic basis.Pharmacol Res 2007, 55:224–236.
18. Hayes JD, Kelleher MO, Eggleston IM: The cancer chemopreventive actionsof phytochemicals derived from glucosinolates. Eur J Nutr 2008,47(Suppl 2):73–88.
19. Talalay P, Fahey JW: Phytochemicals from cruciferous plants protectagainst cancer by modulating carcinogen metabolism. J Nutr 2001,131:3027S–3033S.
20. Johnson WW: Many drugs and phytochemicals can be activated tobiological reactive intermediates. Curr Drug Metab 2008, 9:344–351.
21. Lash LH, Parker JC, Scott CS: Modes of action of trichloroethylene forkidney tumorigenesis. Environ Health Perspect 2000, 108(Suppl 2):225–240.
22. Guengerich FP, Thier R, Persmark M, Taylor JB, Pemble SE, Ketterer B:Conjugation of carcinogens by theta class glutathione s-transferases:mechanisms and relevance to variations in human risk. Pharmacogenetics1995, 5 Spec No:S103–S107.
23. Robbins MG, Andersen G, Somoza V, Eshelman BD, Barnes DM, Hanlon PR: Heattreatment of Brussels sprouts retains their ability to induce detoxificationenzyme expression in vitro and in vivo. J Food Sci 2011, 76:C454–C461.
24. Vistisen K, Poulsen HE, Loft S: Foreign compound metabolism capacity inman measured from metabolites of dietary caffeine. Carcinogenesis 1992,13:1561–1568.
25. Kall MA, Vang O, Clausen J: Effects of dietary broccoli on human in vivodrug metabolizing enzymes: evaluation of caffeine, oestrone andchlorzoxazone metabolism. Carcinogenesis 1996, 17:793–799.
26. Lampe JW, King IB, Li S, Grate MT, Barale KV, Chen C, Feng Z, Potter JD:Brassica vegetables increase and apiaceous vegetables decreasecytochrome P450 1A2 activity in humans: changes in caffeinemetabolite ratios in response to controlled vegetable diets.Carcinogenesis 2000, 21:1157–1162.
27. Bogaards JJ, Verhagen H, Willems MI, van PG, van Bladeren PJ:Consumption of Brussels sprouts results in elevated alpha-classglutathione S-transferase levels in human blood plasma. Carcinogenesis1994, 15:1073–1075.
28. Sreerama L, Hedge MW, Sladek NE: Identification of a class 3 aldehydedehydrogenase in human saliva and increased levels of this enzyme,glutathione S-transferases, and DT-diaphorase in the saliva of subjectswho continually ingest large quantities of coffee or broccoli. Clin CancerRes 1995, 1:1153–1163.
29. Lampe JW, Chen C, Li S, Prunty J, Grate MT, Meehan DE, Barale KV,Dightman DA, Feng Z, Potter JD: Modulation of human glutathioneS-transferases by botanically defined vegetable diets. Cancer EpidemiolBiomarkers Prev 2000, 9:787–793.
30. Fahey JW, Zalcmann AT, Talalay P: The chemical diversity and distributionof glucosinolates and isothiocyanates among plants. Phytochemistry 2001,56:5–51.
31. Drewnowski A, Gomez-Carneros C: Bitter taste, phytonutrients, and theconsumer: a review. Am J Clin Nutr 2000, 72:1424–1435.
32. Cinciripini PM, Hecht SS, Henningfield JE, Manley MW, Kramer BS: Tobaccoaddiction: implications for treatment and cancer prevention. J NatlCancer Inst 1997, 89:1852–1867.
33. Crampsie MA, Jones N, Das A, Aliaga C, Desai D, Lazarus P, Amin S, Sharma AK:Phenylbutyl isoselenocyanate modulates phase I and II enzymes andinhibits 4-(methylnitrosamino)-1-(3-pyridyl)- 1-butanone-induced DNAadducts in mice. Cancer Prev Res (Phila) 2011, 4:1884–1894.
34. Gwilt PR, Lear CL, Tempero MA, Birt DD, Grandjean AC, Ruddon RW, Nagel DL:The effect of garlic extract on human metabolism of acetaminophen.Cancer Epidemiol Biomarkers Prev 1994, 3:155–160.
35. Moon A, Kim SH: Effect of Glycyrrhiza glabra roots and glycyrrhizin onthe glucuronidation in rats. Planta Med 1997, 63:115–119.

Evans et al. BMC Complementary and Alternative Medicine 2014, 14:475 Page 12 of 12http://www.biomedcentral.com/1472-6882/14/475
36. Jaeschke H, Williams CD, McGill MR, Xie Y, Ramachandran A: Models ofdrug-induced liver injury for evaluation of phytotherapeutics and othernatural products. Food Chem Toxicol 2013, 55:279–289.
37. Levy G, Yamada H: Drug biotransformation interactions in man. 3.Acetaminophen and salicylamide. J Pharm Sci 1971, 60:215–221.
38. Slattery JT, Levy G: Acetaminophen kinetics in acutely poisoned patients.Clin Pharmacol Ther 1979, 25:184–195.
39. Clements JA, Critchley JA, Prescott LF: The role of sulphate conjugation inthe metabolism and disposition of oral and intravenous paracetamol inman. Br J Clin Pharmacol 1984, 18:481–485.
40. Jellinck PH, Michnovicz JJ, Bradlow HL: Influence of indole-3-carbinol onthe hepatic microsomal formation of catechol estrogens. Steroids 1991,56:446–450.
41. Horn TL, Reichert MA, Bliss RL, Malejka-Giganti D: Modulations of P450mRNA in liver and mammary gland and P450 activities and metabolismof estrogen in liver by treatment of rats with indole-3-carbinol. BiochemPharmacol 2002, 64:393–404.
42. Centers for Disease Control and Prevention: Fruit and vegetableconsumption among adults–United States, 2005. MMWR Morb MortalWkly Rep 2007, 56:213–217.
doi:10.1186/1472-6882-14-475Cite this article as: Evans et al.: An open label pilot study to evaluatethe efficacy of Spanish black radish on the induction of phase I andphase II enzymes in healthy male subjects. BMC Complementary andAlternative Medicine 2014 14:475.
Submit your next manuscript to BioMed Centraland take full advantage of:
• Convenient online submission
• Thorough peer review
• No space constraints or color figure charges
• Immediate publication on acceptance
• Inclusion in PubMed, CAS, Scopus and Google Scholar
• Research which is freely available for redistribution
Submit your manuscript at www.biomedcentral.com/submit