Embed Size (px)
Citation preview
Human Journals
Research Article
October 2015 Vol.:4, Issue:3
© All rights are reserved by Omprakash G. Bhusnure et al.
Formulation and Evaluation of Fast Disintegrating Tables of
Nifedipine by QbD Approach
www.ijppr.humanjournals.com
Keywords: Nifedipine, Solid dispersion, Superdisintegrants,
Variables, 23 full factorial design, DOE, Fast Dissolving Tablets
(FDT‟s)
ABSTRACT
Fast dissolving tablet format is designed to allow administration
of an oral solid dose form in the absence of water or fluid
intake. Such tablets readily dissolve or disintegrate in the saliva.
Nifedipine is a calcium channel blocker which is used as an
antianginal and antihypertensive drug. The aim of this study
was to improve the solubility of Nifedipine by solid dispersion
technique and increasing its disintegration time by formulation
of fast dissolving tablets by Direct Compression method using
QbD approach, and various ratios of Cross povidone and Cross
Carmellose Sodium as superdisintegrants. The solid dispersions
of Nifedipine were formulated with five different polymers as
Polyvinylpyrrolidone K 30(PVP k30), Polyethyleneglycol
(PEG) 4000, Polyethyleneglycol (PEG) 6000, Urea and
Mannitol. The solid dispersions were prepared in five different
ratios by solvent evaporation method. The solid dispersion
giving the maximum solubility was formulated into fast
dissolving tablets using various ratios of cross povidone and
cross carmellose sodium (ccs) as superdisintegrants. Tablets pre
compression parameters e.g. angle of repose, bulk density,
tapped density, Carr‟s compressibility index and Hauser‟s ratio
and post compression parameters like drug content uniformity,
hardness, wetting time, friability, thickness, disintegration time
& In vitro dissolution were evaluated for each formulation and
found satisfactory. A 23 full factorial design was applied to
investigate the combine effect of 3 formulation variables:
concentration of cross povidone, concentration of cross
carmellose sodium and concentration of microcrystalline
cellulose. Here the concentration of cross povidone,
concentration of cross carmellose sodium and concentration of
microcrystalline cellulose were taken as independent variable
X1, X2 & X3 respectively; with their effect of disintegration
time was studied as dependent parameter. To represent the data
Design Expert software 9 was used.
Omprakash G. Bhusnure a,*
, Parvez Kazi b, Sachin B.
Gholve, Sanjay S. Thonte , Jaiprakash N. Sangshetti
a. Channabasweshwar Pharmacy College(Degree),
Department of Quality Assurance, Maharashtra,
India.
b. Department of Quality Assurance, Y. B. Chavan
College of Pharmacy, Aurangabad (MS), India.
Submission: 5 October 2015
Accepted: 11 October 2015
Published: 25 October 2015
www.ijppr.humanjournals.com
Citation: Omprakash G. Bhusnure et al. Ijppr.Human, 2015; Vol. 4 (3): 198-229.
199
1. INTRODUCTION
Quality should be built in by design, it cannot be tested in a product, is the main motto of „Total
Quality Management‟. To achieve this goal of optimized quality product, the knowledge gained
from pharmaceutical development studies and manufacturing provides the scientific background.
Although it is based on risks, but it has its fruits that it minimizes the end product testing and
increases the chances of regulatory acceptance. Quality by design (QbD) was first proposed by a
well known researcher Joseph Moses Juran. Later it has been accepted by ICH, US-FDA and
other regulatory bodies. The principles of QbD is best explained by ICH Q8, ICH Q9 & ICH
Q10, which gives the guidelines on Science & Risk-based assessment, product‟s life cycle and its
approach, and the various method designs. The method optimization was earlier based on One
Factor at a Time (OFAT) approach/ Traditional quality by testing (QbT) approach (Bhoop
Bhupinder Singh et al., 2013) where a single component was varied with time and its effect
studied. The traditional quality by testing (QbT) approach tests product quality by checking it
against the approved regulatory specifications at the end of manufacturing stream at great effort
and cost. There is a great deal of unpredictability in scaling up a product from research and
development to production scale, and reasons for failure are generally not understood. QbD is a
major shift from the traditional approach of QbT in ensuring quality control of products across
the manufacturing stream. QbD principles promote innovation and continuous improvement of
the product. Knowledge-based commercial manufacturing ensures enough regulatory flexibility
for setting specifications and post-approval changes. Product and process are designed using
innovative risk-based techniques to meet predefined quality objectives thereby satisfying the
most critical patient needs and regulatory requirements at low cost (Peter Devies et al. 2009,
Debjit Bhowmik et al. 2009,Velmurugan S.et al 2010).
Formal Experimental Design or DOE is defined as “a structured analysis wherein inputs are
changed and differences or variations in outputs are measured to determine the magnitude of the
effect of each of the inputs or combination of inputs.” Factorial designs allow for the
simultaneous study of the effects that several factors like concentration of super disintegrants and
diluents concentration may have on the physical characteristics of the tablets. There are several
advantages to statistically designed experiments, and when compared with other test methods,
the results are striking4. (Bharat Parashar et al 2012, Sangshetti Jaiprakash et al., 2014)
www.ijppr.humanjournals.com
Citation: Omprakash G. Bhusnure et al. Ijppr.Human, 2015; Vol. 4 (3): 198-229.
200
This approach was not much helpful as it neglected the effect caused due to interaction of more
than one factors. Now a day, the approach followed is Quality by Design (QbD) which employs
Design of Experiments (DoE) as important concept. DoE approach is a systematic, scientifically
analysed better understandable approach. (ICH, 2009 and Sangshetti Jaiprakash et al., 2014).
The aim and objective of the present study is to develop and evaluate FDT of Nifedipine and
enhance the onset of action of Nifedipine and also to study the influence of excipients on the
physical characteristics of the tablets by applying two level three factor factorial designs taking
Nifedipine as model drug which is used in the treatment of the hypertension. The study was
intended to select the best possible diluents, combination of semi synthetic & natural
superdisintegrants to formulate the dispersible tablets among all the diluents and disintegrants
used. Finally the impact of the diluents ratio and superdisintegrants on various properties of the
tablet were also determined.
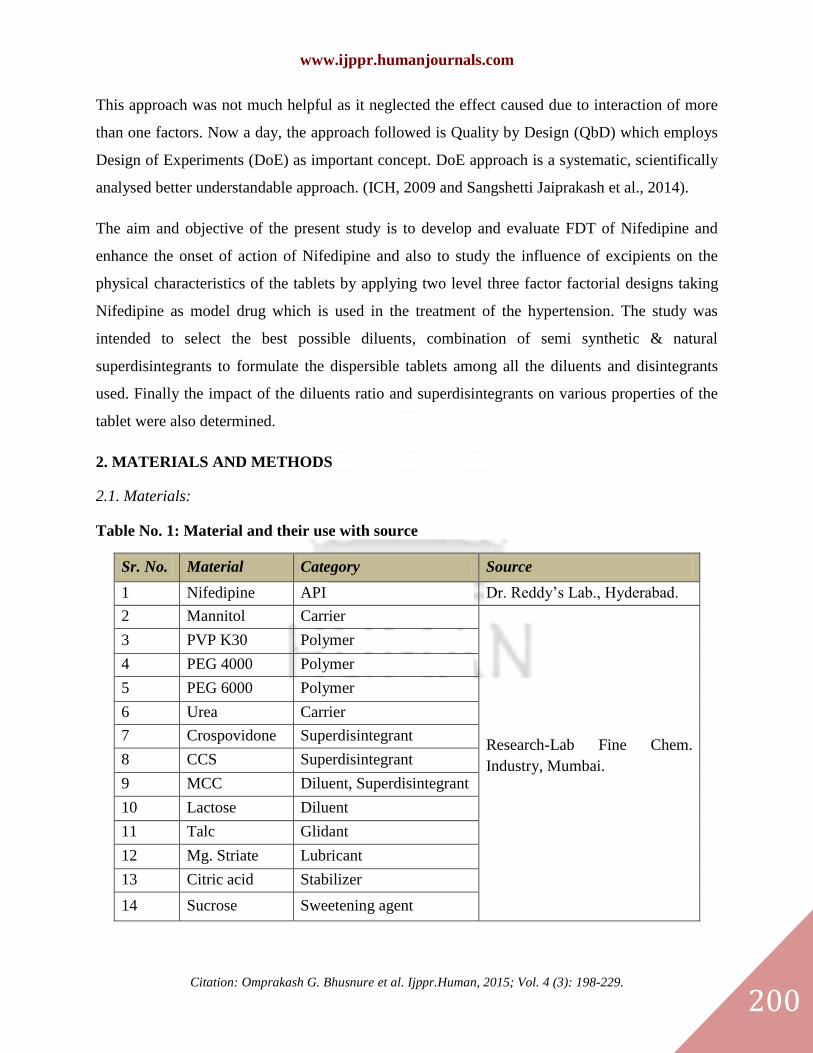
2. MATERIALS AND METHODS
2.1. Materials:
Table No. 1: Material and their use with source
Sr. No. Material Category Source
1 Nifedipine API Dr. Reddy‟s Lab., Hyderabad.
2 Mannitol Carrier
Research-Lab Fine Chem.
Industry, Mumbai.
3 PVP K30 Polymer
4 PEG 4000 Polymer
5 PEG 6000 Polymer
6 Urea Carrier
7 Crospovidone Superdisintegrant
8 CCS Superdisintegrant
9 MCC Diluent, Superdisintegrant
10 Lactose Diluent
11 Talc Glidant
12 Mg. Striate Lubricant
13 Citric acid Stabilizer
14 Sucrose Sweetening agent
www.ijppr.humanjournals.com
Citation: Omprakash G. Bhusnure et al. Ijppr.Human, 2015; Vol. 4 (3): 198-229.
201
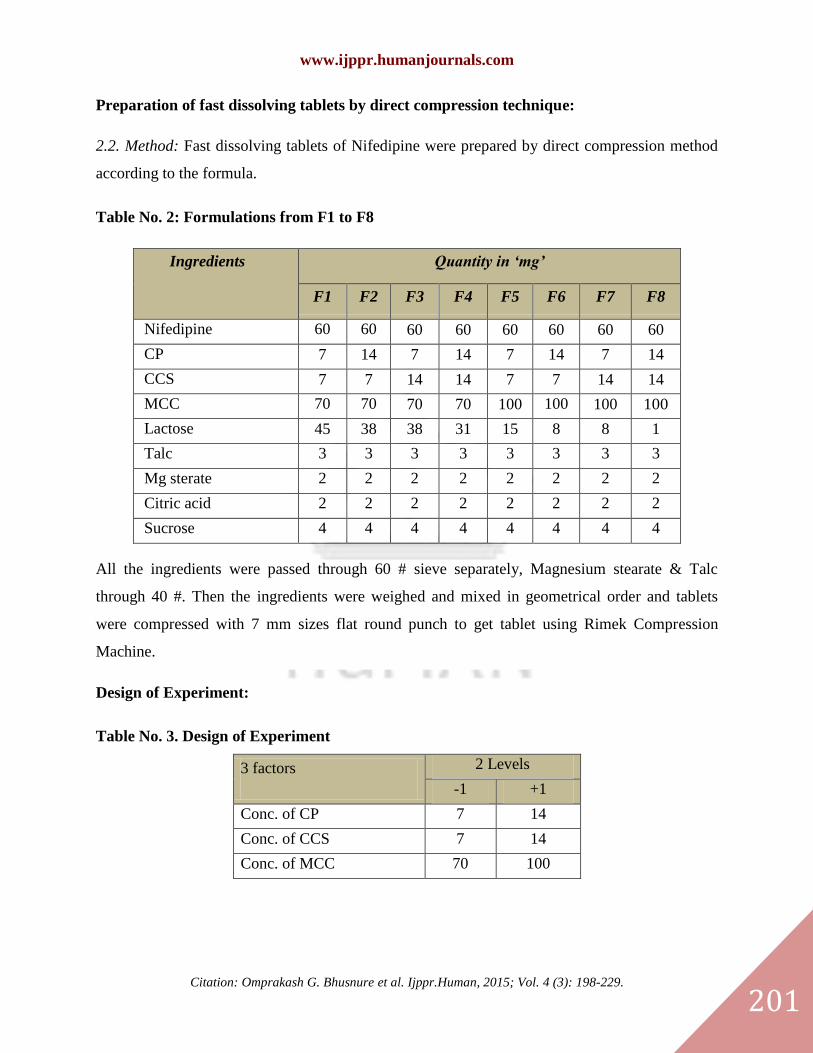
Preparation of fast dissolving tablets by direct compression technique:
2.2. Method: Fast dissolving tablets of Nifedipine were prepared by direct compression method
according to the formula.
Table No. 2: Formulations from F1 to F8
Ingredients Quantity in ‘mg’
F1
F1
F2
F2
F3
F3
F4
F4
F5
F5
F6
F6
F7
F7
F8
F8 Nifedipine 60 60 60 60 60 60 60 60
CP 7 14 7 14 7 14 7 14
CCS 7 7 14 14 7 7 14 14
MCC 70 70 70 70 100 100 100 100
Lactose
45 38 38 31 15 8 8 1
Talc 3 3 3 3 3 3 3 3
Mg sterate
2 2 2 2 2 2 2 2
Citric acid 2 2 2 2 2 2 2 2
Sucrose 4 4 4 4 4 4 4 4
All the ingredients were passed through 60 # sieve separately, Magnesium stearate & Talc
through 40 #. Then the ingredients were weighed and mixed in geometrical order and tablets
were compressed with 7 mm sizes flat round punch to get tablet using Rimek Compression
Machine.
Design of Experiment:
Table No. 3. Design of Experiment
3 factors 2 Levels
-1 +1
Conc. of CP 7 14
Conc. of CCS 7 14
Conc. of MCC 70 100
www.ijppr.humanjournals.com
Citation: Omprakash G. Bhusnure et al. Ijppr.Human, 2015; Vol. 4 (3): 198-229.
202
3. RESULTS AND DISCUSSION
3.1. API Characterization:
3.1.1. Melting Point:
Melting point of Nifedipine by capillary method was found to be 223-226˚C
3.1.2. Solubility:
The solubility of Nifedipine was checked in different solvents which are shown in following
table.
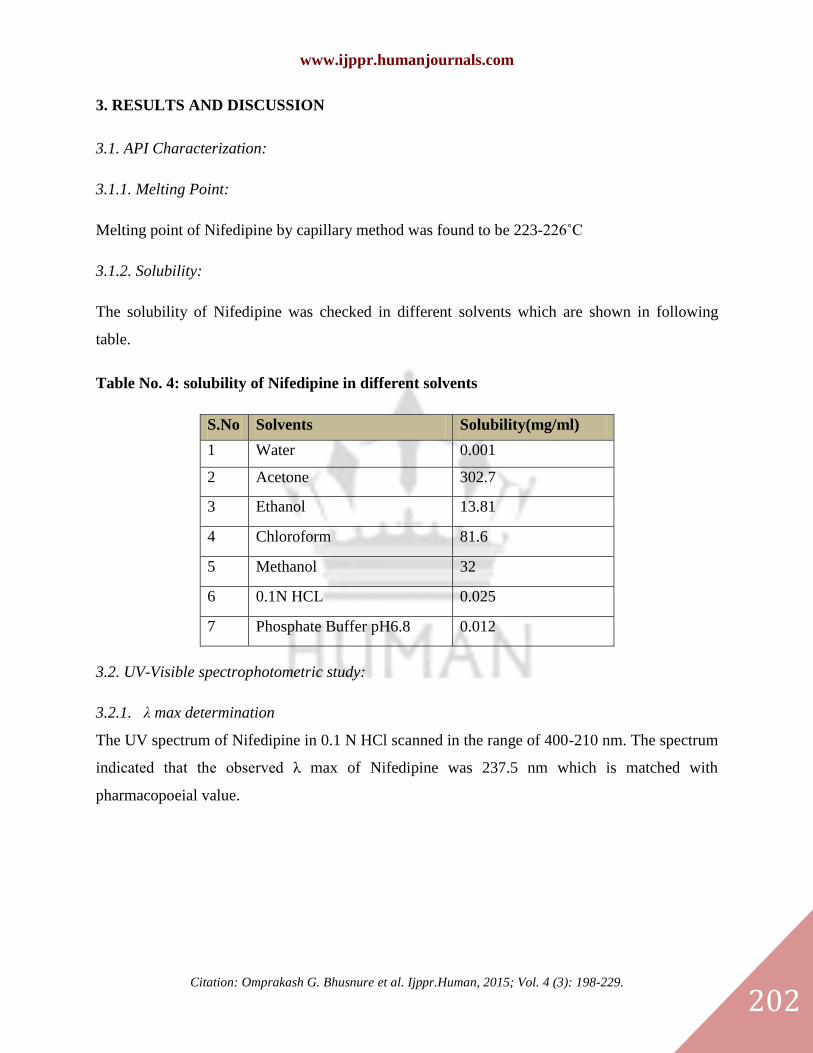
Table No. 4: solubility of Nifedipine in different solvents
S.No Solvents Solubility(mg/ml)
1 Water 0.001
2 Acetone 302.7
3 Ethanol 13.81
4 Chloroform 81.6
5 Methanol 32
6 0.1N HCL 0.025
7 Phosphate Buffer pH6.8 0.012
3.2. UV-Visible spectrophotometric study:
3.2.1. λ max determination
The UV spectrum of Nifedipine in 0.1 N HCl scanned in the range of 400-210 nm. The spectrum
indicated that the observed λ max of Nifedipine was 237.5 nm which is matched with
pharmacopoeial value.
www.ijppr.humanjournals.com
Citation: Omprakash G. Bhusnure et al. Ijppr.Human, 2015; Vol. 4 (3): 198-229.
203
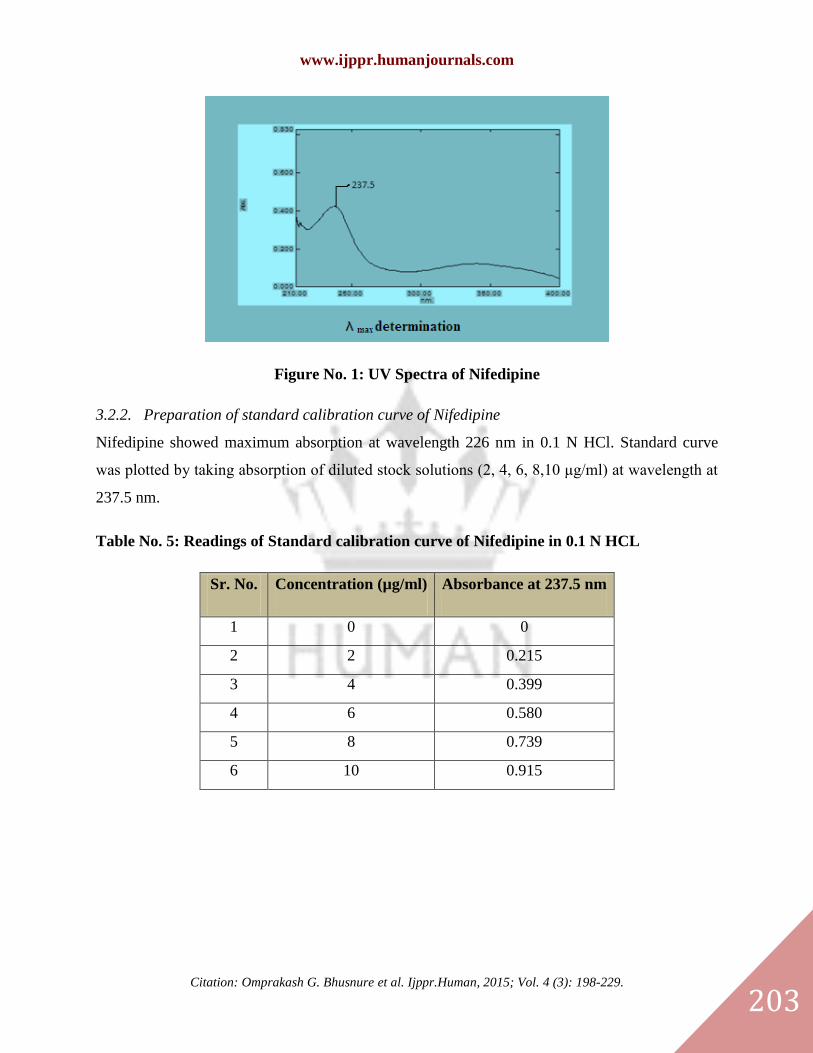
Figure No. 1: UV Spectra of Nifedipine
3.2.2. Preparation of standard calibration curve of Nifedipine
Nifedipine showed maximum absorption at wavelength 226 nm in 0.1 N HCl. Standard curve
was plotted by taking absorption of diluted stock solutions (2, 4, 6, 8,10 μg/ml) at wavelength at
237.5 nm.
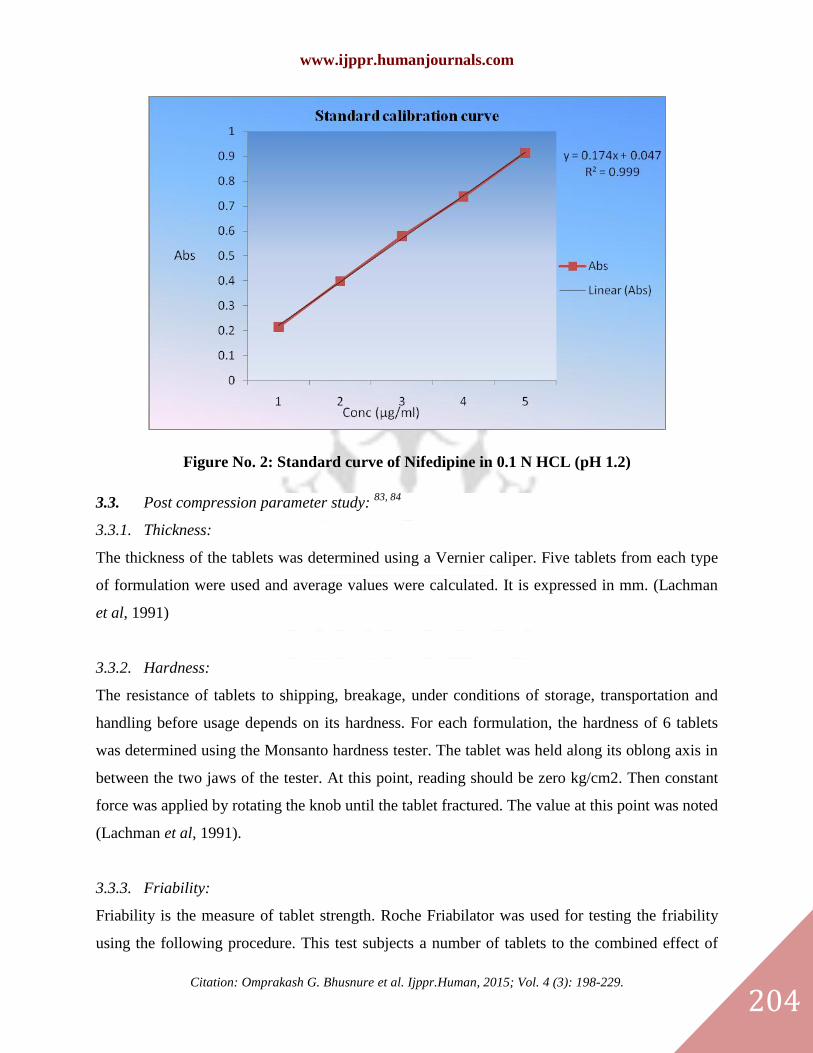
Table No. 5: Readings of Standard calibration curve of Nifedipine in 0.1 N HCL
Sr. No. Concentration (µg/ml) Absorbance at 237.5 nm
1 0 0
2 2 0.215
3 4 0.399
4 6 0.580
5 8 0.739
6 10 0.915
www.ijppr.humanjournals.com
Citation: Omprakash G. Bhusnure et al. Ijppr.Human, 2015; Vol. 4 (3): 198-229.
204
Figure No. 2: Standard curve of Nifedipine in 0.1 N HCL (pH 1.2)
3.3. Post compression parameter study: 83, 84
3.3.1. Thickness:
The thickness of the tablets was determined using a Vernier caliper. Five tablets from each type
of formulation were used and average values were calculated. It is expressed in mm. (Lachman
et al, 1991)
3.3.2. Hardness:
The resistance of tablets to shipping, breakage, under conditions of storage, transportation and
handling before usage depends on its hardness. For each formulation, the hardness of 6 tablets
was determined using the Monsanto hardness tester. The tablet was held along its oblong axis in
between the two jaws of the tester. At this point, reading should be zero kg/cm2. Then constant
force was applied by rotating the knob until the tablet fractured. The value at this point was noted
(Lachman et al, 1991).
3.3.3. Friability:
Friability is the measure of tablet strength. Roche Friabilator was used for testing the friability
using the following procedure. This test subjects a number of tablets to the combined effect of
www.ijppr.humanjournals.com
Citation: Omprakash G. Bhusnure et al. Ijppr.Human, 2015; Vol. 4 (3): 198-229.
205
shock abrasion by utilizing a plastic chamber which revolves at a speed of 25 rpm, dropping the
tablets to a distance of 6 inches in each revolution. A sample of pre weighed 6 tablets was placed
in Roche friabilator which was then operated for 100 revolutions i.e. 4 minutes. The tablets were
then dusted and reweighed. A loss of less than 1 % in weight in generally considered acceptable.
Percent friability (% F) was calculated as follows (Lachman et al, 1991).
% F = ×100
3.3.4. Weight variation test:
To find out weight variation, 20 tablets of each type of formulation were weighed individually
using an electronic balance, average weight was calculated and individual tablet weight was then
compared with average value to find the deviation in weight. (Indian pharmacopoeia, 1996)
Table No. 6: Specifications for tablets as per Pharmacopoeia of India
Sr. No.
Average Weight of Tablet
% Deviation
1
80 mg or less
10
2
More than 80 mg but less that 250 mg
7.5
3
250 or more
5
3.3.5. Uniformity of drug content:
Five tablets of each type of formulation were weighed and crushed in mortar and powder
equivalent to 50 mg of Nifedipine was weighed and dissolved in 100 ml of 0.1N HCl (pH 1.2).
This was the stock solution from which 0.2 ml sample was withdrawn and diluted to 10 ml with
0.1N HCl. The absorbance was measured at wavelength 237.5 nm using double beam UV-
Visible spectrophotometer. Content uniformity was calculated using formula.
% Purity = 10 C (Au / As) -------Equation VII
Where, C - Concentration,
Au and As - Absorbance‟s obtained from unknown preparation and standard Preparation
respectively.
www.ijppr.humanjournals.com
Citation: Omprakash G. Bhusnure et al. Ijppr.Human, 2015; Vol. 4 (3): 198-229.
206
3.3.6. Wetting time:
The method was applied to measure tablet wetting time. A piece of tissue paper folded twice was
placed in a small Petri dish (i.d. = 6.5 cm) containing 10 ml of water, a tablet was placed on the
paper, and the time for complete wetting was measured. Three trials for each batch were
performed and standard deviation was also determined.
3.3.7. In vitro disintegration time:
The process of breakdown of a tablet into smaller particles is called as disintegration. The in-
vitro disintegration time of a tablet was determined using disintegration test apparatus as per I.P.
specifications. I.P. Specifications: Place one tablet in each of the 6 tubes of the basket. Add a
disc to each tube and run the apparatus using distilled water maintained at 37° ± 2°C as the
immersion liquid. The assembly should be raised and lowered between 30 cycles per minute in
the 0.1 N HCL maintained at 37° ± 2°C. The time in seconds taken for complete disintegration of
the tablet with no palpable mass remaining in the apparatus was measured and recorded.
3.3.8. In vitro dissolution studies:
Dissolution rate was studied by using USP type-II apparatus (50 rpm) using 900ml of 0.1 N HCL
as dissolution medium. Temperature of the dissolution medium was maintained at 37 ± 0.5°C,
aliquot of dissolution medium was withdrawn at every 5 min interval and filtered. The
absorbance of filtered solution was measured by UV spectrophotometric method at 237.5 nm and
concentration of the drug was determined from standard calibration curve.
In vitro drug release studies details:
Apparatus used : USP XXIII dissolution test apparatus
Dissolution medium : 0.1 N HCL
Dissolution medium volume : 900 ml
Temperature : 37 ± 0.5°C
Speed of basket paddle : 50 rpm
Sampling intervals : 5 min
Sample withdraw : 10 ml
Absorbance measured : 237.5 nm
www.ijppr.humanjournals.com
Citation: Omprakash G. Bhusnure et al. Ijppr.Human, 2015; Vol. 4 (3): 198-229.
207
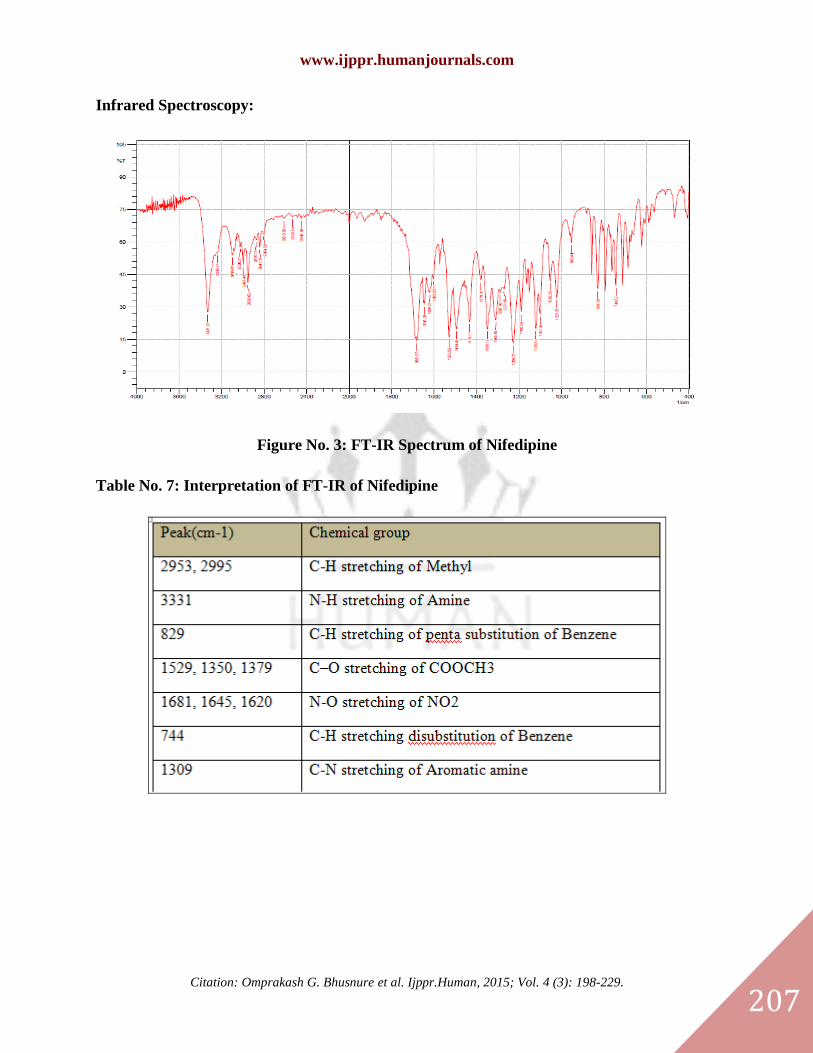
Infrared Spectroscopy:
Figure No. 3: FT-IR Spectrum of Nifedipine
Table No. 7: Interpretation of FT-IR of Nifedipine
www.ijppr.humanjournals.com
Citation: Omprakash G. Bhusnure et al. Ijppr.Human, 2015; Vol. 4 (3): 198-229.
208
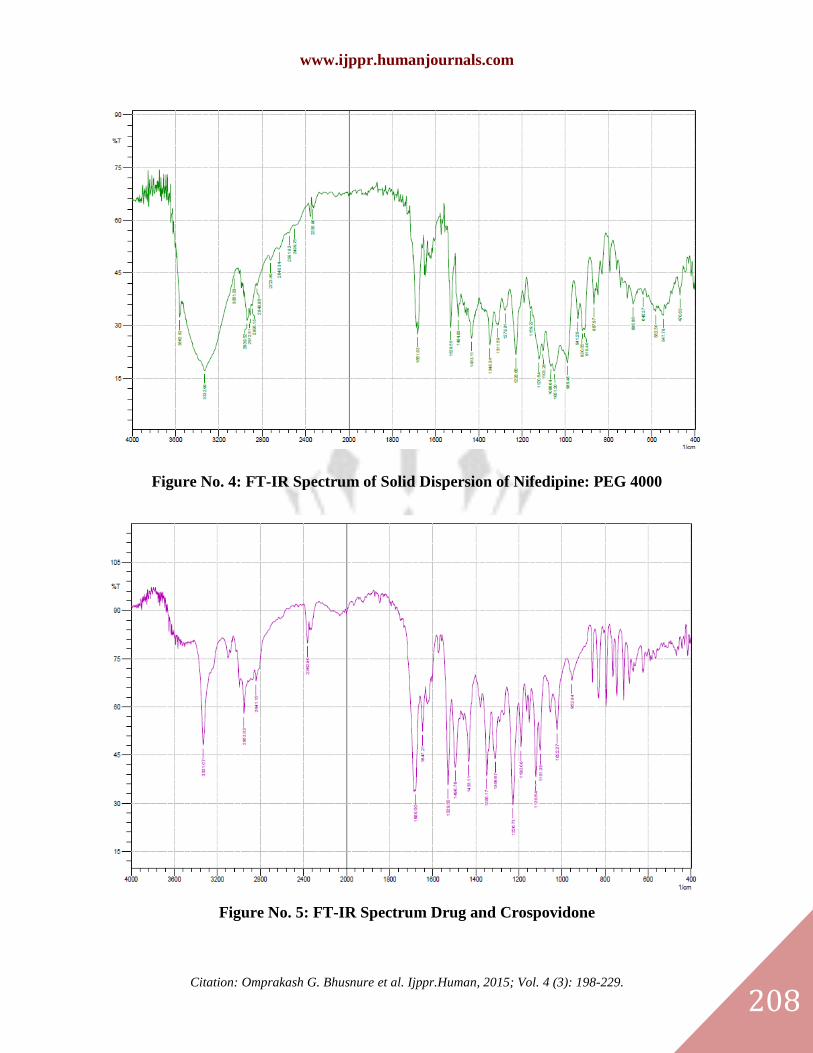
Figure No. 4: FT-IR Spectrum of Solid Dispersion of Nifedipine: PEG 4000
Figure No. 5: FT-IR Spectrum Drug and Crospovidone
www.ijppr.humanjournals.com
Citation: Omprakash G. Bhusnure et al. Ijppr.Human, 2015; Vol. 4 (3): 198-229.
209
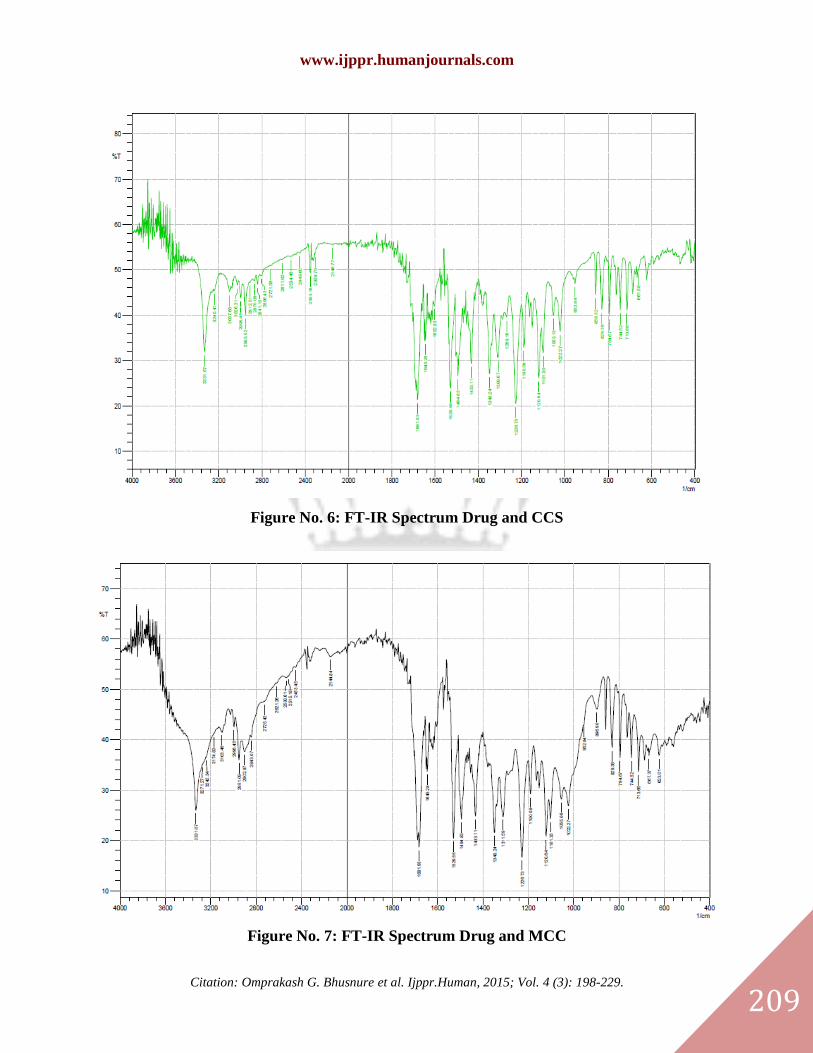
Figure No. 6: FT-IR Spectrum Drug and CCS
Figure No. 7: FT-IR Spectrum Drug and MCC
www.ijppr.humanjournals.com
Citation: Omprakash G. Bhusnure et al. Ijppr.Human, 2015; Vol. 4 (3): 198-229.
210
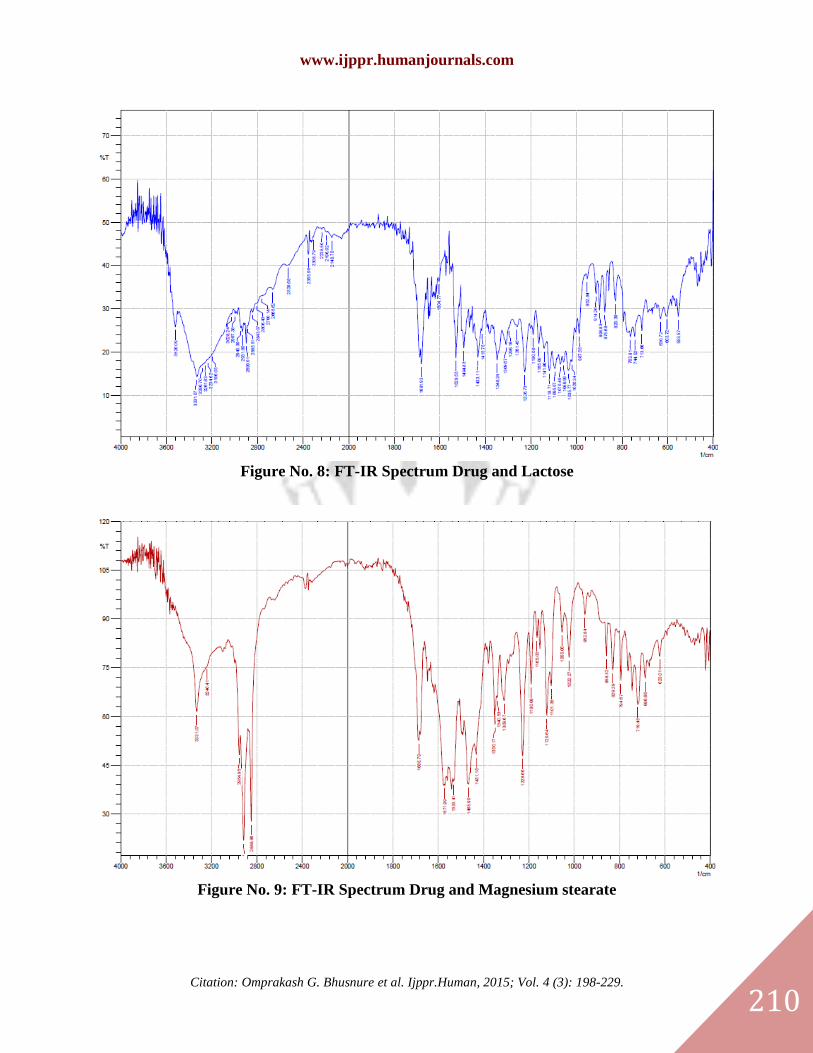
Figure No. 8: FT-IR Spectrum Drug and Lactose
Figure No. 9: FT-IR Spectrum Drug and Magnesium stearate
www.ijppr.humanjournals.com
Citation: Omprakash G. Bhusnure et al. Ijppr.Human, 2015; Vol. 4 (3): 198-229.
211
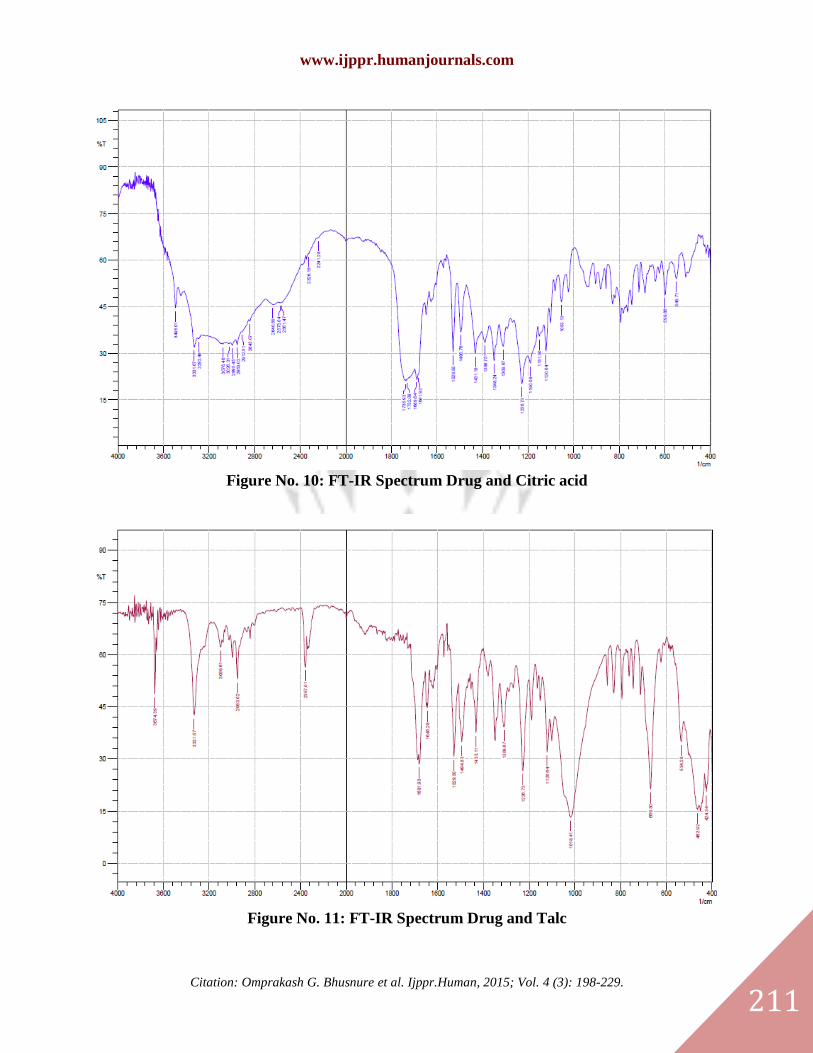
Figure No. 10: FT-IR Spectrum Drug and Citric acid
Figure No. 11: FT-IR Spectrum Drug and Talc
www.ijppr.humanjournals.com
Citation: Omprakash G. Bhusnure et al. Ijppr.Human, 2015; Vol. 4 (3): 198-229.
212
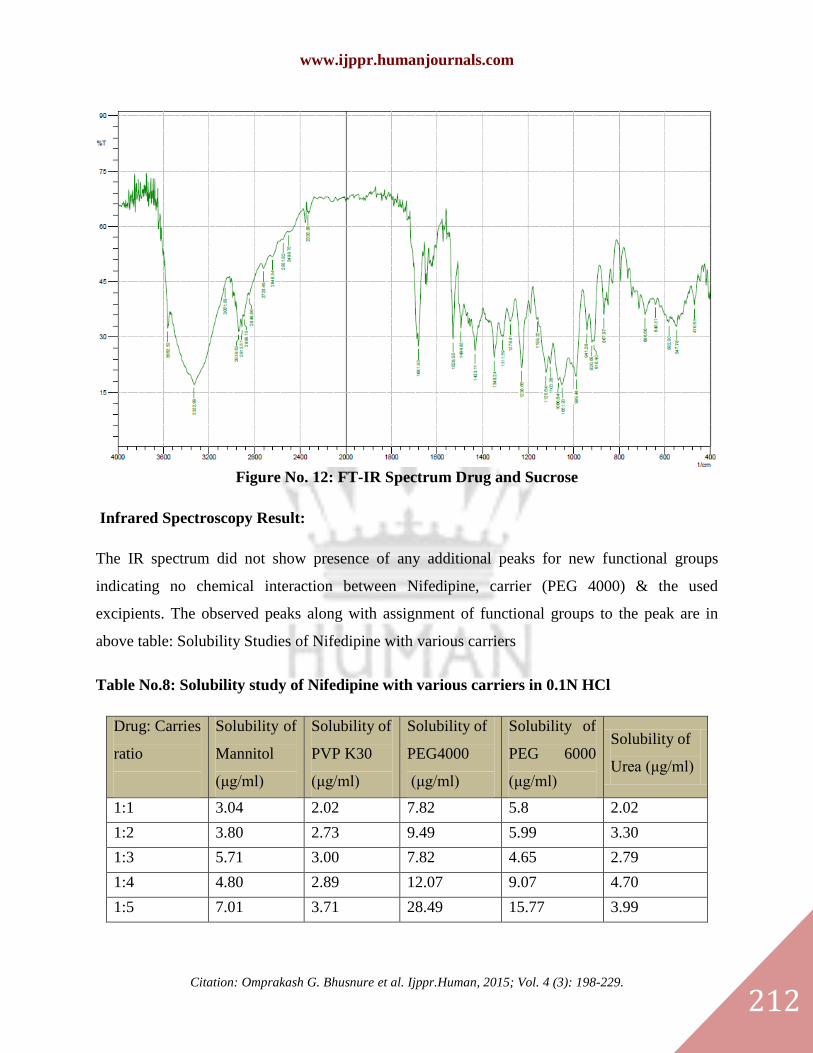
Figure No. 12: FT-IR Spectrum Drug and Sucrose
Infrared Spectroscopy Result:
The IR spectrum did not show presence of any additional peaks for new functional groups
indicating no chemical interaction between Nifedipine, carrier (PEG 4000) & the used
excipients. The observed peaks along with assignment of functional groups to the peak are in
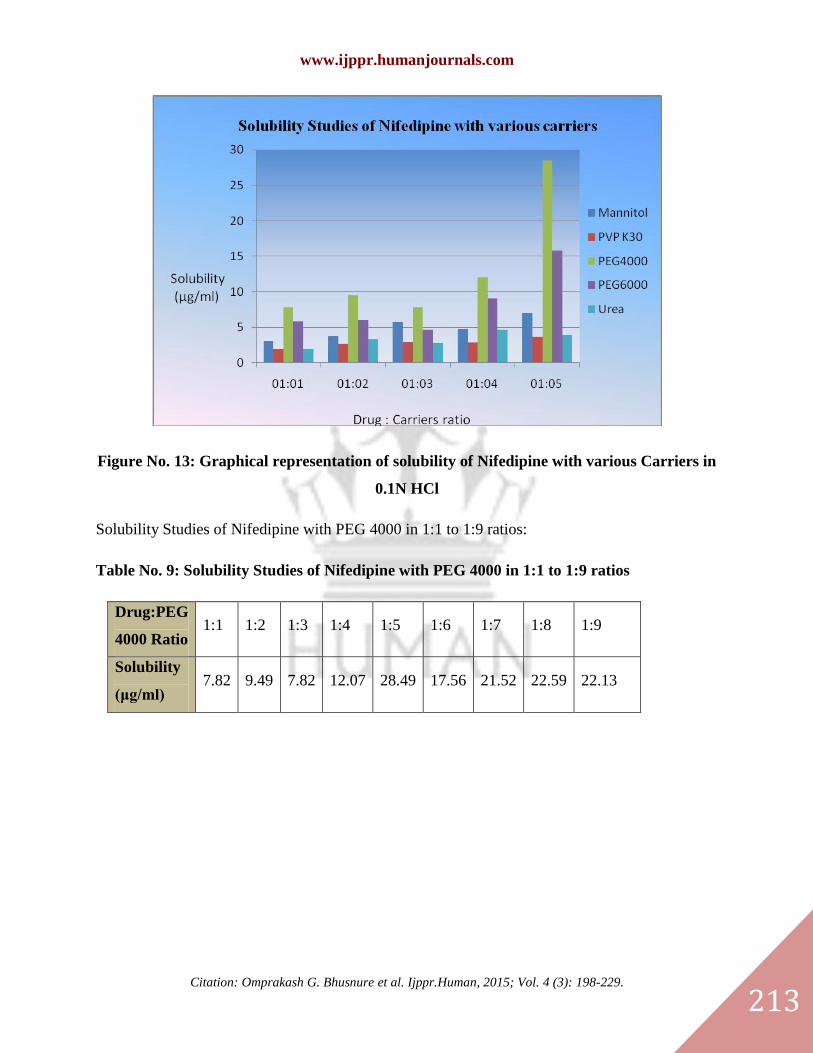
above table: Solubility Studies of Nifedipine with various carriers
Table No.8: Solubility study of Nifedipine with various carriers in 0.1N HCl
Drug: Carries
ratio
Solubility of
Mannitol
(μg/ml)
Solubility of
PVP K30
(μg/ml)
Solubility of
PEG4000
(μg/ml)
Solubility of
PEG 6000
(μg/ml)
Solubility of
Urea (μg/ml)
1:1 3.04 2.02 7.82 5.8 2.02
1:2 3.80 2.73 9.49 5.99 3.30
1:3 5.71 3.00 7.82 4.65 2.79
1:4 4.80 2.89 12.07 9.07 4.70
1:5 7.01 3.71 28.49 15.77 3.99
www.ijppr.humanjournals.com
Citation: Omprakash G. Bhusnure et al. Ijppr.Human, 2015; Vol. 4 (3): 198-229.
213
Figure No. 13: Graphical representation of solubility of Nifedipine with various Carriers in
0.1N HCl
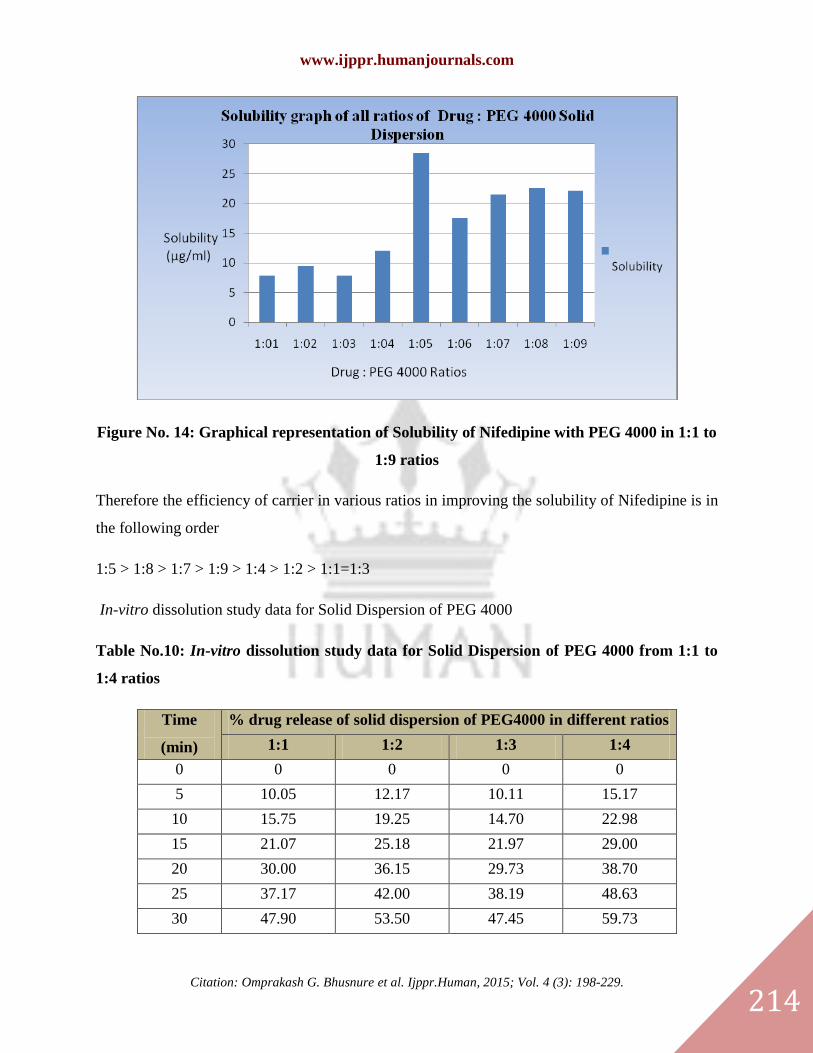
Solubility Studies of Nifedipine with PEG 4000 in 1:1 to 1:9 ratios:
Table No. 9: Solubility Studies of Nifedipine with PEG 4000 in 1:1 to 1:9 ratios
Drug:PEG
4000 Ratio 1:1 1:2 1:3 1:4 1:5 1:6 1:7 1:8 1:9
Solubility
(μg/ml) 7.82 9.49 7.82 12.07 28.49 17.56 21.52 22.59 22.13
www.ijppr.humanjournals.com
Citation: Omprakash G. Bhusnure et al. Ijppr.Human, 2015; Vol. 4 (3): 198-229.
214
Figure No. 14: Graphical representation of Solubility of Nifedipine with PEG 4000 in 1:1 to
1:9 ratios
Therefore the efficiency of carrier in various ratios in improving the solubility of Nifedipine is in
the following order
1:5 > 1:8 > 1:7 > 1:9 > 1:4 > 1:2 > 1:1=1:3
In-vitro dissolution study data for Solid Dispersion of PEG 4000
Table No.10: In-vitro dissolution study data for Solid Dispersion of PEG 4000 from 1:1 to
1:4 ratios
Time
(min)
% drug release of solid dispersion of PEG4000 in different ratios
1:1 1:2 1:3 1:4
0 0 0 0 0
5 10.05 12.17 10.11 15.17
10 15.75 19.25 14.70 22.98
15 21.07 25.18 21.97 29.00
20 30.00 36.15 29.73 38.70
25 37.17 42.00 38.19 48.63
30 47.90 53.50 47.45 59.73
www.ijppr.humanjournals.com
Citation: Omprakash G. Bhusnure et al. Ijppr.Human, 2015; Vol. 4 (3): 198-229.
215
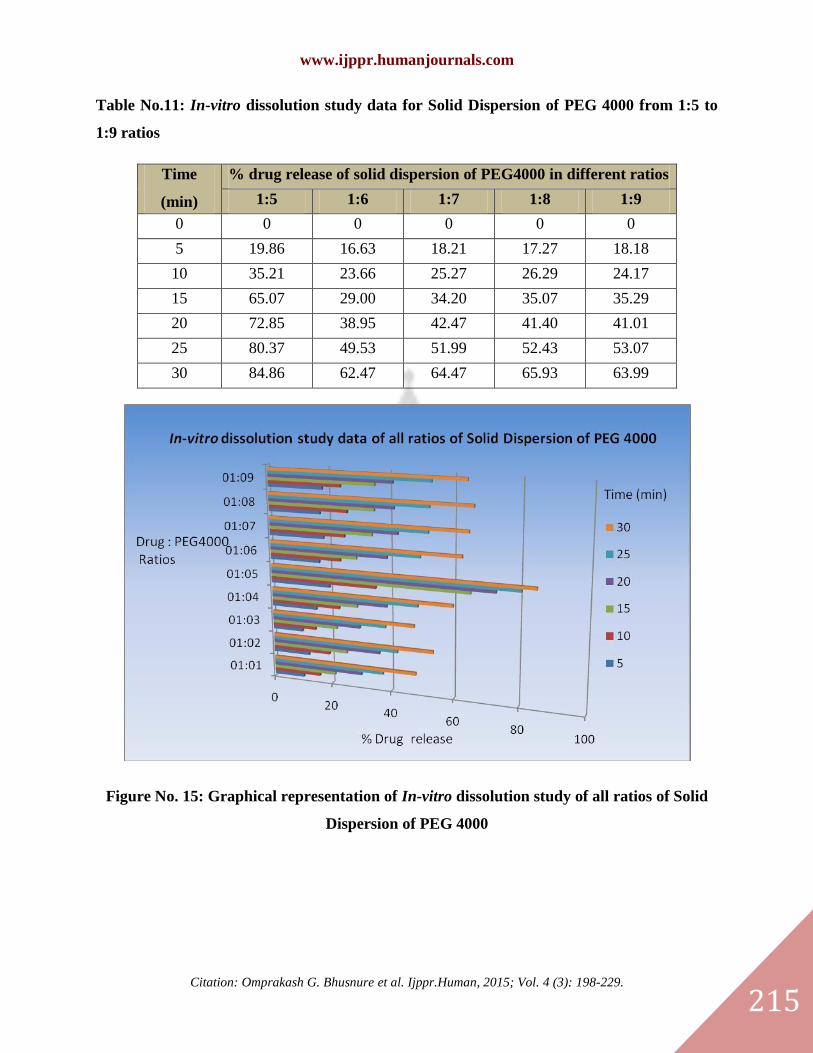
Table No.11: In-vitro dissolution study data for Solid Dispersion of PEG 4000 from 1:5 to
1:9 ratios
Time
(min)
% drug release of solid dispersion of PEG4000 in different ratios
1:5 1:6 1:7 1:8 1:9
0 0 0 0 0 0
5 19.86 16.63 18.21 17.27 18.18
10 35.21 23.66 25.27 26.29 24.17
15 65.07 29.00 34.20 35.07 35.29
20 72.85 38.95 42.47 41.40 41.01
25 80.37 49.53 51.99 52.43 53.07
30 84.86 62.47 64.47 65.93 63.99
Figure No. 15: Graphical representation of In-vitro dissolution study of all ratios of Solid
Dispersion of PEG 4000
www.ijppr.humanjournals.com
Citation: Omprakash G. Bhusnure et al. Ijppr.Human, 2015; Vol. 4 (3): 198-229.
216
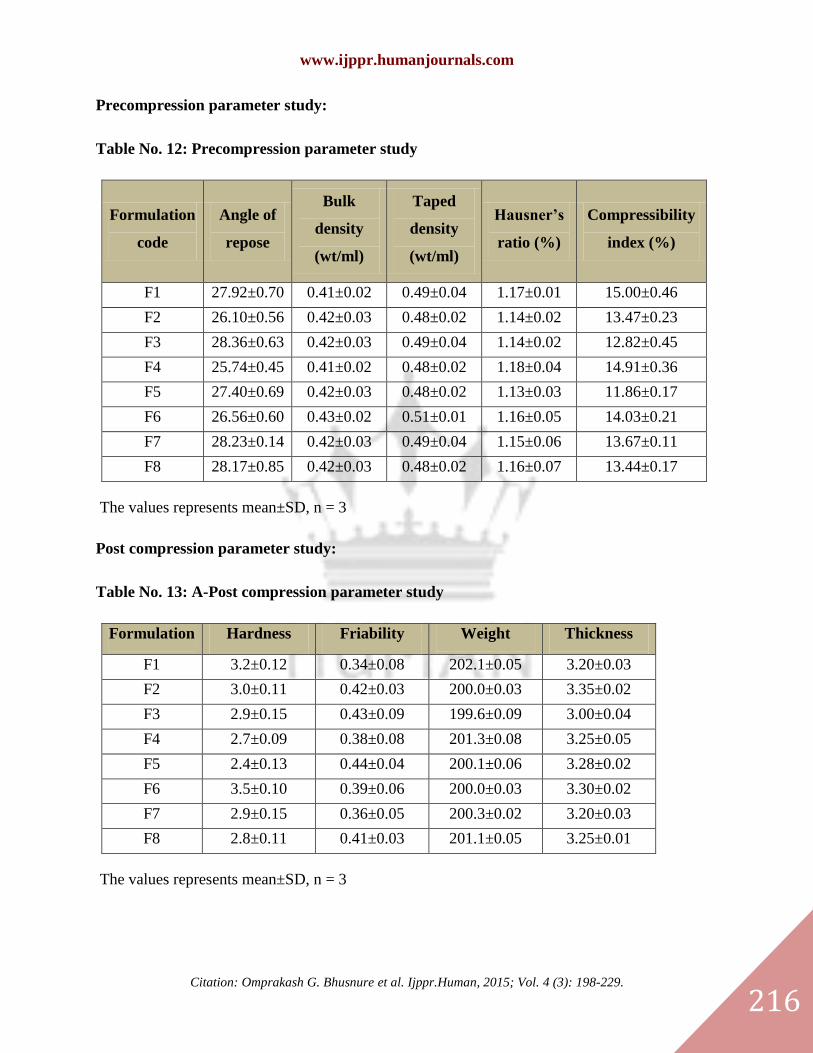
Precompression parameter study:
Table No. 12: Precompression parameter study
Formulation
code
Angle of
repose
Bulk
density
(wt/ml)
Taped
density
(wt/ml)
Hausner’s
ratio (%)
Compressibility
index (%)
F1 27.92±0.70 0.41±0.02 0.49±0.04 1.17±0.01 15.00±0.46
F2 26.10±0.56 0.42±0.03 0.48±0.02 1.14±0.02 13.47±0.23
F3 28.36±0.63 0.42±0.03 0.49±0.04 1.14±0.02 12.82±0.45
F4 25.74±0.45 0.41±0.02 0.48±0.02 1.18±0.04 14.91±0.36
F5 27.40±0.69 0.42±0.03 0.48±0.02 1.13±0.03 11.86±0.17
F6 26.56±0.60 0.43±0.02 0.51±0.01 1.16±0.05 14.03±0.21
F7 28.23±0.14 0.42±0.03 0.49±0.04 1.15±0.06 13.67±0.11
F8 28.17±0.85 0.42±0.03 0.48±0.02 1.16±0.07 13.44±0.17
The values represents mean±SD, n = 3
Post compression parameter study:
Table No. 13: A-Post compression parameter study
Formulation
code
Hardness
(kg/cm2)
Friability
(%)
Weight
variation (mg)
Thickness
(mm) F1 3.2±0.12 0.34±0.08 202.1±0.05 3.20±0.03
F2 3.0±0.11 0.42±0.03 200.0±0.03 3.35±0.02
F3 2.9±0.15 0.43±0.09 199.6±0.09 3.00±0.04
F4 2.7±0.09 0.38±0.08 201.3±0.08 3.25±0.05
F5 2.4±0.13 0.44±0.04 200.1±0.06 3.28±0.02
F6 3.5±0.10 0.39±0.06 200.0±0.03 3.30±0.02
F7 2.9±0.15 0.36±0.05 200.3±0.02 3.20±0.03
F8 2.8±0.11 0.41±0.03 201.1±0.05 3.25±0.01
The values represents mean±SD, n = 3
www.ijppr.humanjournals.com
Citation: Omprakash G. Bhusnure et al. Ijppr.Human, 2015; Vol. 4 (3): 198-229.
217
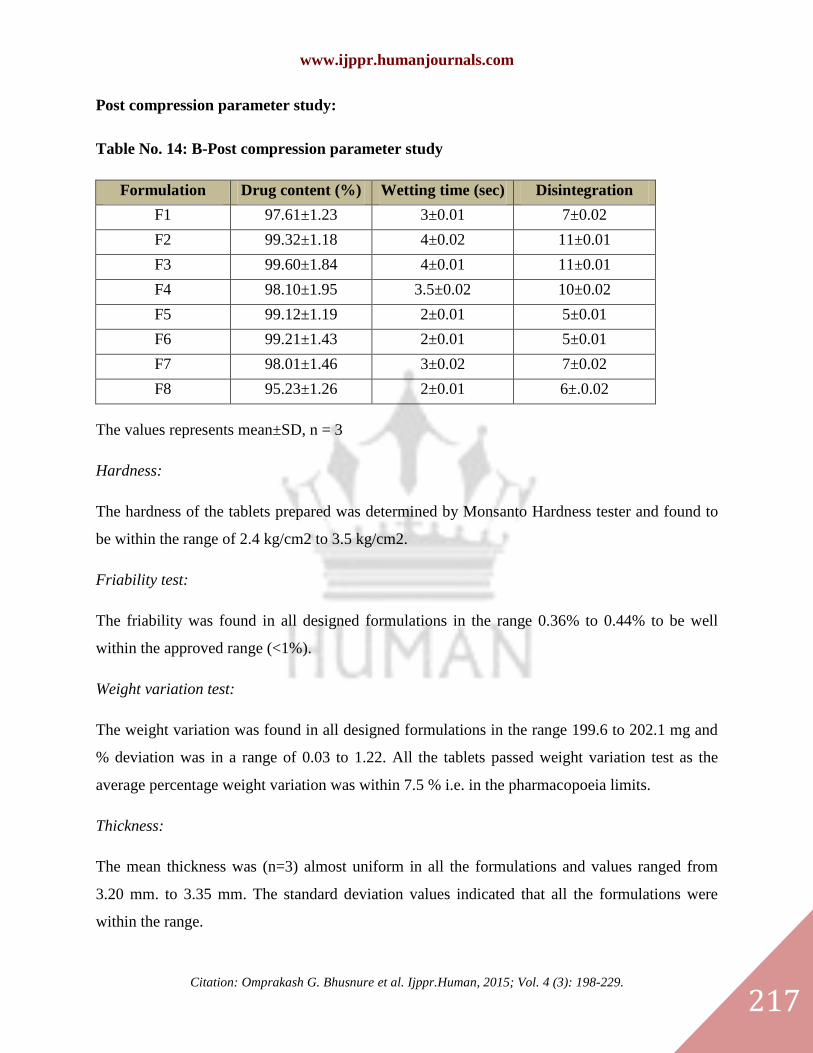
Post compression parameter study:
Table No. 14: B-Post compression parameter study
Formulation
code
Drug content (%) Wetting time (sec) Disintegration
time (sec) F1 97.61±1.23 3±0.01 7±0.02
F2 99.32±1.18 4±0.02 11±0.01
F3 99.60±1.84 4±0.01 11±0.01
F4 98.10±1.95 3.5±0.02 10±0.02
F5 99.12±1.19 2±0.01 5±0.01
F6 99.21±1.43 2±0.01 5±0.01
F7 98.01±1.46 3±0.02 7±0.02
F8 95.23±1.26 2±0.01 6±.0.02
The values represents mean±SD, n = 3
Hardness:
The hardness of the tablets prepared was determined by Monsanto Hardness tester and found to
be within the range of 2.4 kg/cm2 to 3.5 kg/cm2.
Friability test:
The friability was found in all designed formulations in the range 0.36% to 0.44% to be well
within the approved range (<1%).
Weight variation test:
The weight variation was found in all designed formulations in the range 199.6 to 202.1 mg and
% deviation was in a range of 0.03 to 1.22. All the tablets passed weight variation test as the
average percentage weight variation was within 7.5 % i.e. in the pharmacopoeia limits.
Thickness:
The mean thickness was (n=3) almost uniform in all the formulations and values ranged from
3.20 mm. to 3.35 mm. The standard deviation values indicated that all the formulations were
within the range.
www.ijppr.humanjournals.com
Citation: Omprakash G. Bhusnure et al. Ijppr.Human, 2015; Vol. 4 (3): 198-229.
218
In- vitro disintegration time:
The in-vitro disintegration time was measured by the time taken to undergo complete
disintegration. Rapid disintegration within 1 minute was observed in all the formulations. The
disintegration time of all the formulations is checked & is found within the range of 5 sec. – 11
sec.
Wetting time:
Wetting time is closely related to the inner structure of the tablet. The wetting time of Nifedipine
tablets prepared were found to be in the range of 2 to 4 sec.
Drug Content:
The drug content uniformity was performed for all the formulations. The average value and
standard deviations of all the formulations were calculated. The percentage drugs content of the
tablets were found to be between 95.23 ±1.26 to 99.60 ±1.84
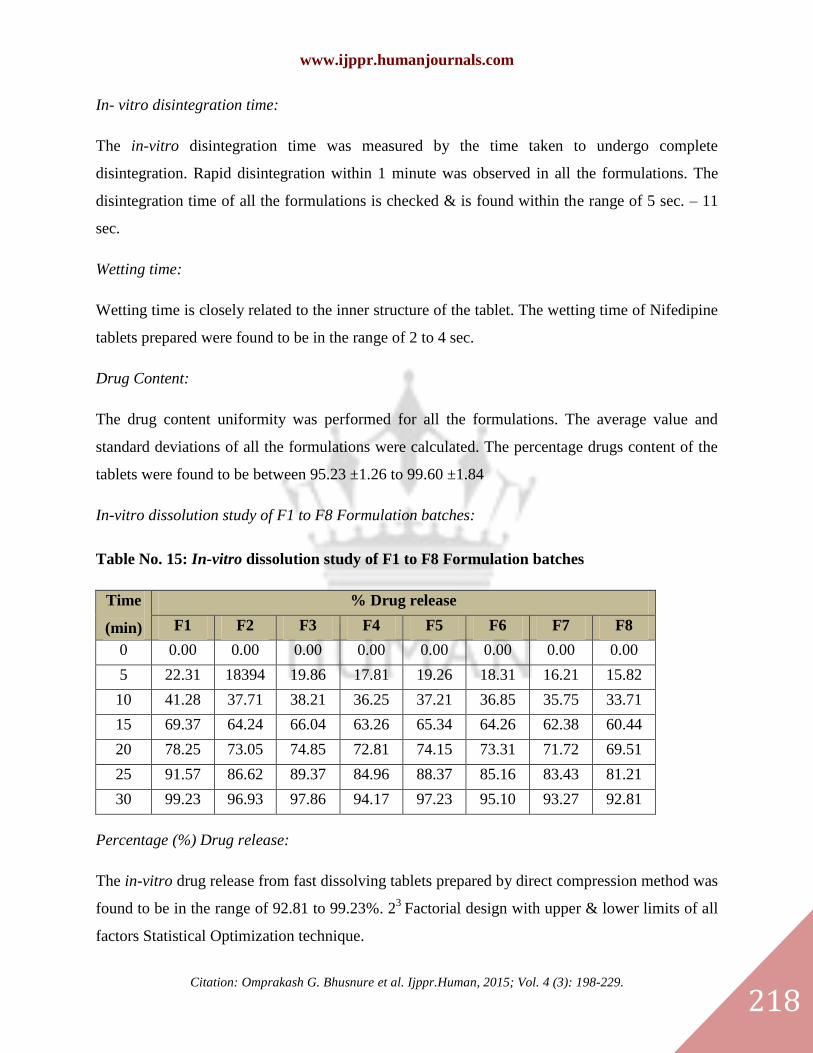
In-vitro dissolution study of F1 to F8 Formulation batches:
Table No. 15: In-vitro dissolution study of F1 to F8 Formulation batches
Time
(min)
% Drug release
F1 F2 F3 F4 F5 F6 F7 F8
0 0.00 0.00 0.00 0.00 0.00 0.00 0.00 0.00
5 22.31 18394 19.86 17.81 19.26 18.31 16.21 15.82
10 41.28 37.71 38.21 36.25 37.21 36.85 35.75 33.71
15 69.37 64.24 66.04 63.26 65.34 64.26 62.38 60.44
20 78.25 73.05 74.85 72.81 74.15 73.31 71.72 69.51
25 91.57 86.62 89.37 84.96 88.37 85.16 83.43 81.21
30 99.23 96.93 97.86 94.17 97.23 95.10 93.27 92.81
Percentage (%) Drug release:
The in-vitro drug release from fast dissolving tablets prepared by direct compression method was
found to be in the range of 92.81 to 99.23%. 23
Factorial design with upper & lower limits of all
factors Statistical Optimization technique.
www.ijppr.humanjournals.com
Citation: Omprakash G. Bhusnure et al. Ijppr.Human, 2015; Vol. 4 (3): 198-229.
219
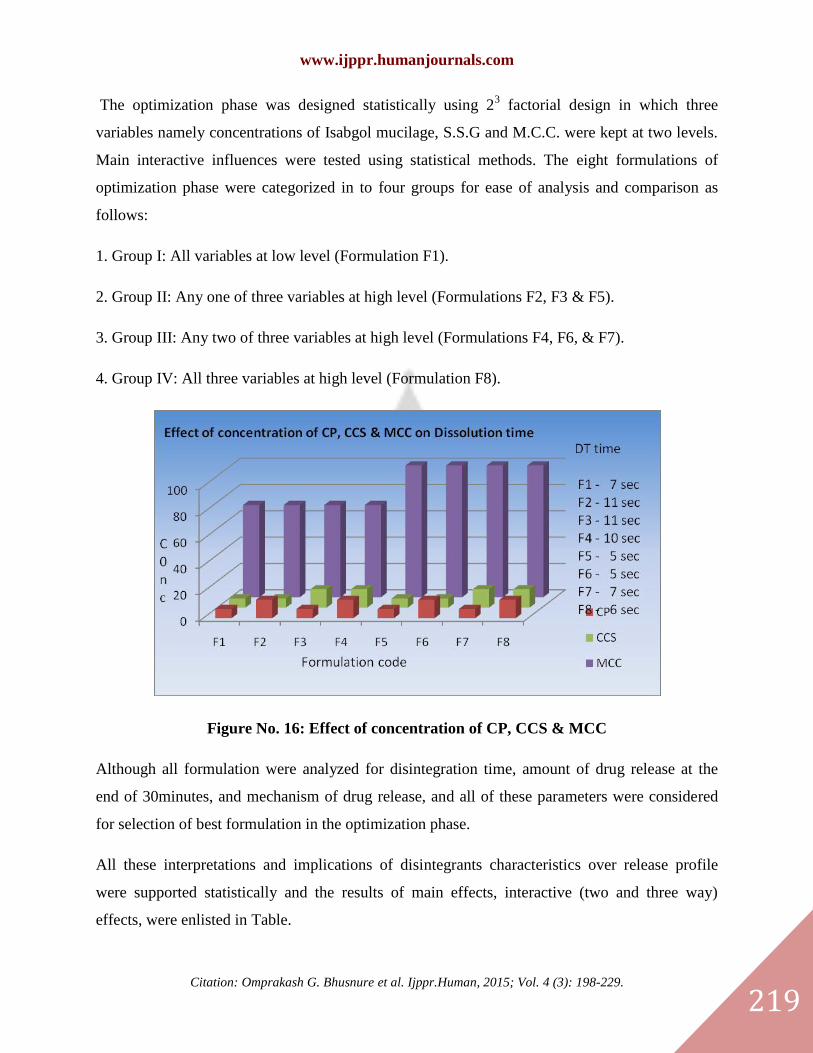
The optimization phase was designed statistically using 23 factorial design in which three
variables namely concentrations of Isabgol mucilage, S.S.G and M.C.C. were kept at two levels.
Main interactive influences were tested using statistical methods. The eight formulations of
optimization phase were categorized in to four groups for ease of analysis and comparison as
follows:
1. Group I: All variables at low level (Formulation F1).
2. Group II: Any one of three variables at high level (Formulations F2, F3 & F5).
3. Group III: Any two of three variables at high level (Formulations F4, F6, & F7).
4. Group IV: All three variables at high level (Formulation F8).
Figure No. 16: Effect of concentration of CP, CCS & MCC
Although all formulation were analyzed for disintegration time, amount of drug release at the
end of 30minutes, and mechanism of drug release, and all of these parameters were considered
for selection of best formulation in the optimization phase.
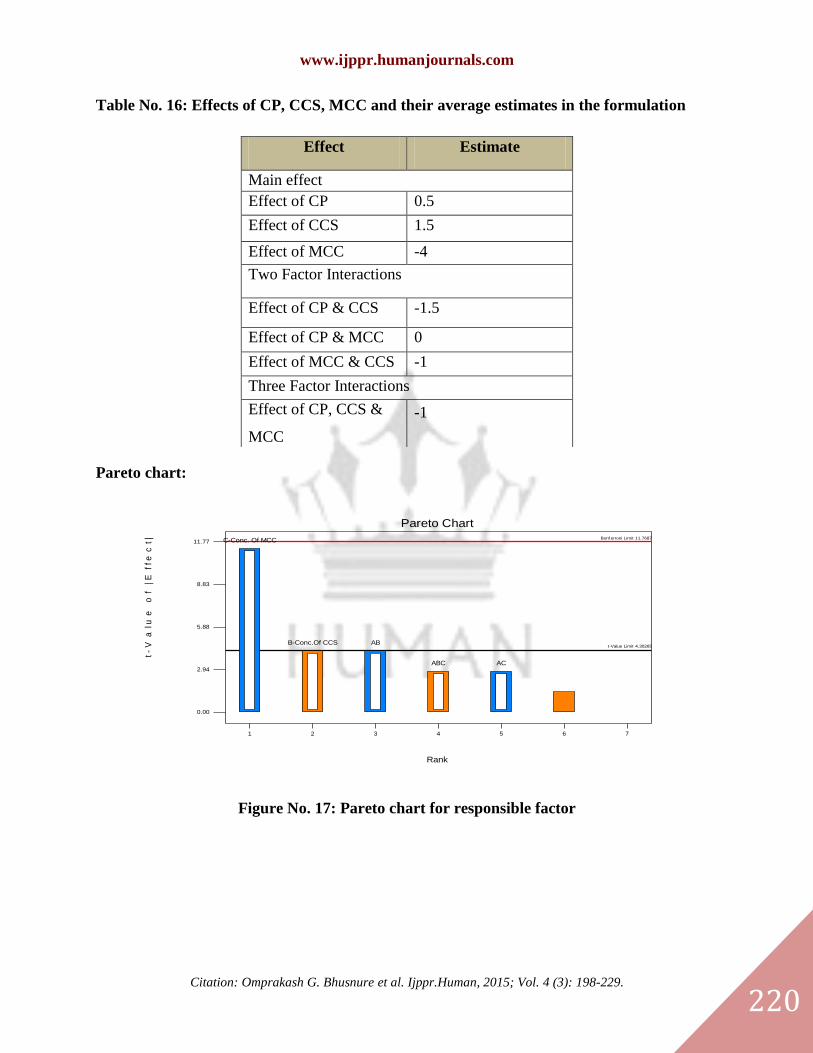
All these interpretations and implications of disintegrants characteristics over release profile
were supported statistically and the results of main effects, interactive (two and three way)
effects, were enlisted in Table.
www.ijppr.humanjournals.com
Citation: Omprakash G. Bhusnure et al. Ijppr.Human, 2015; Vol. 4 (3): 198-229.
220
Table No. 16: Effects of CP, CCS, MCC and their average estimates in the formulation
Pareto chart:
0.00
2.94
5.88
8.83
11.77
1 2 3 4 5 6 7
Pareto Chart
Rank
t-
Va
lue
o
f |E
ffe
ct| Bonf erroni Limit 11.7687
t-Value Limit 4.30265
C-Conc. Of MCC
B-Conc.Of CCS AB
ABC AC
Figure No. 17: Pareto chart for responsible factor
Effect Estimate
Main effect
Effect of CP 0.5
Effect of CCS 1.5
Effect of MCC -4
Two Factor Interactions
Effect of CP & CCS -1.5
Effect of CP & MCC 0
Effect of MCC & CCS -1
Three Factor Interactions
Effect of CP, CCS &
MCC
-1
www.ijppr.humanjournals.com
Citation: Omprakash G. Bhusnure et al. Ijppr.Human, 2015; Vol. 4 (3): 198-229.
221
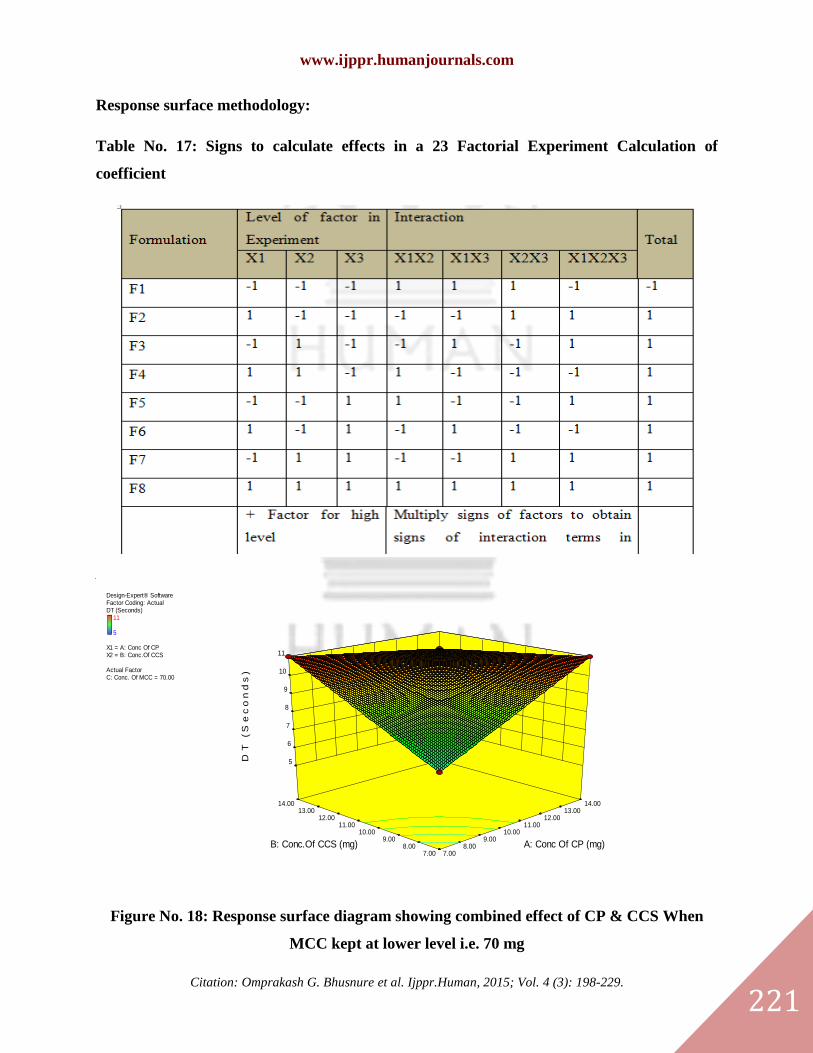
Response surface methodology:
Table No. 17: Signs to calculate effects in a 23 Factorial Experiment Calculation of
coefficient
Design-Expert® SoftwareFactor Coding: ActualDT (Seconds)
11
5
X1 = A: Conc Of CPX2 = B: Conc.Of CCS
Actual FactorC: Conc. Of MCC = 70.00
7.00 8.00
9.00 10.00
11.00 12.00
13.00 14.00
7.00 8.00
9.00 10.00
11.00 12.00
13.00 14.00
5
6
7
8
9
10
11
DT
(S
ec
on
ds
)
A: Conc Of CP (mg)B: Conc.Of CCS (mg)
Figure No. 18: Response surface diagram showing combined effect of CP & CCS When
MCC kept at lower level i.e. 70 mg
www.ijppr.humanjournals.com
Citation: Omprakash G. Bhusnure et al. Ijppr.Human, 2015; Vol. 4 (3): 198-229.
222
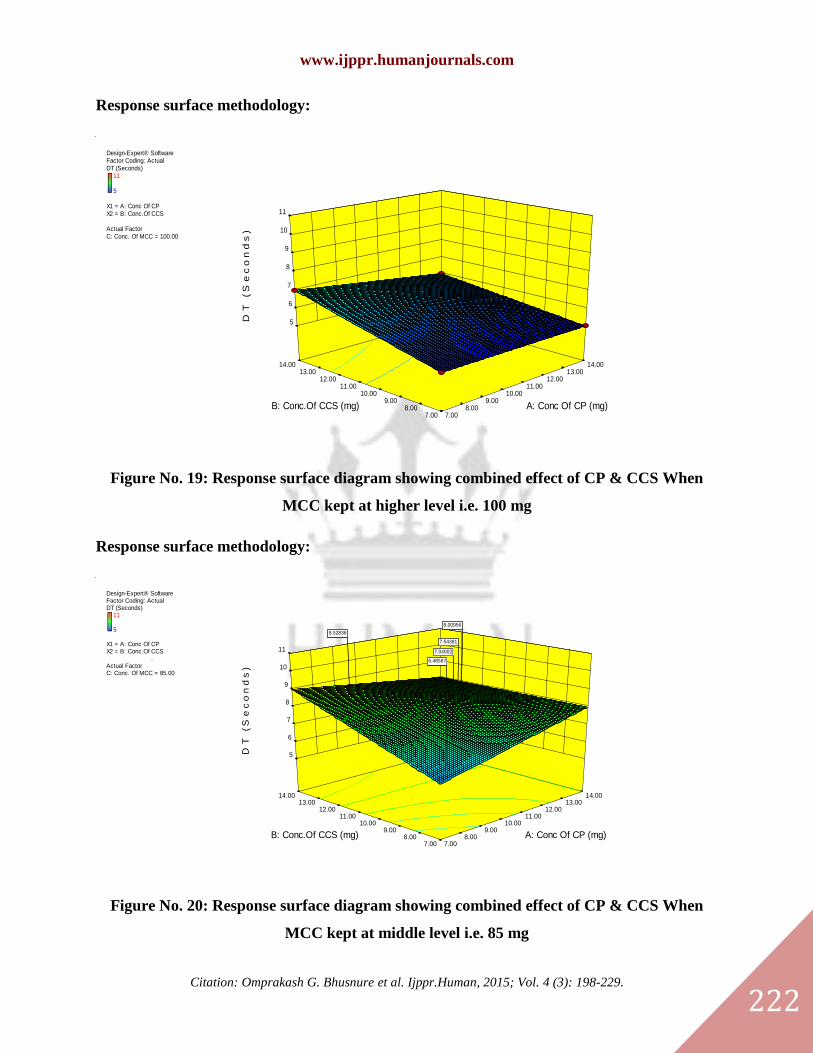
Response surface methodology:
Design-Expert® SoftwareFactor Coding: ActualDT (Seconds)
11
5
X1 = A: Conc Of CPX2 = B: Conc.Of CCS
Actual FactorC: Conc. Of MCC = 100.00
7.00 8.00
9.00 10.00
11.00 12.00
13.00 14.00
7.00 8.00
9.00 10.00
11.00 12.00
13.00 14.00
5
6
7
8
9
10
11
DT
(S
ec
on
ds
)
A: Conc Of CP (mg)B: Conc.Of CCS (mg)
Figure No. 19: Response surface diagram showing combined effect of CP & CCS When
MCC kept at higher level i.e. 100 mg
Response surface methodology:
Design-Expert® SoftwareFactor Coding: ActualDT (Seconds)
11
5
X1 = A: Conc Of CPX2 = B: Conc.Of CCS
Actual FactorC: Conc. Of MCC = 85.00
7.00 8.00
9.00 10.00
11.00 12.00
13.00 14.00
7.00 8.00
9.00 10.00
11.00 12.00
13.00 14.00
5
6
7
8
9
10
11
DT
(S
ec
on
ds
)
A: Conc Of CP (mg)B: Conc.Of CCS (mg)
8.52836
8.00956
7.54381
7.04002
6.48587
8.52836
8.00956
7.54381
7.04002
6.48587
Figure No. 20: Response surface diagram showing combined effect of CP & CCS When
MCC kept at middle level i.e. 85 mg
www.ijppr.humanjournals.com
Citation: Omprakash G. Bhusnure et al. Ijppr.Human, 2015; Vol. 4 (3): 198-229.
223
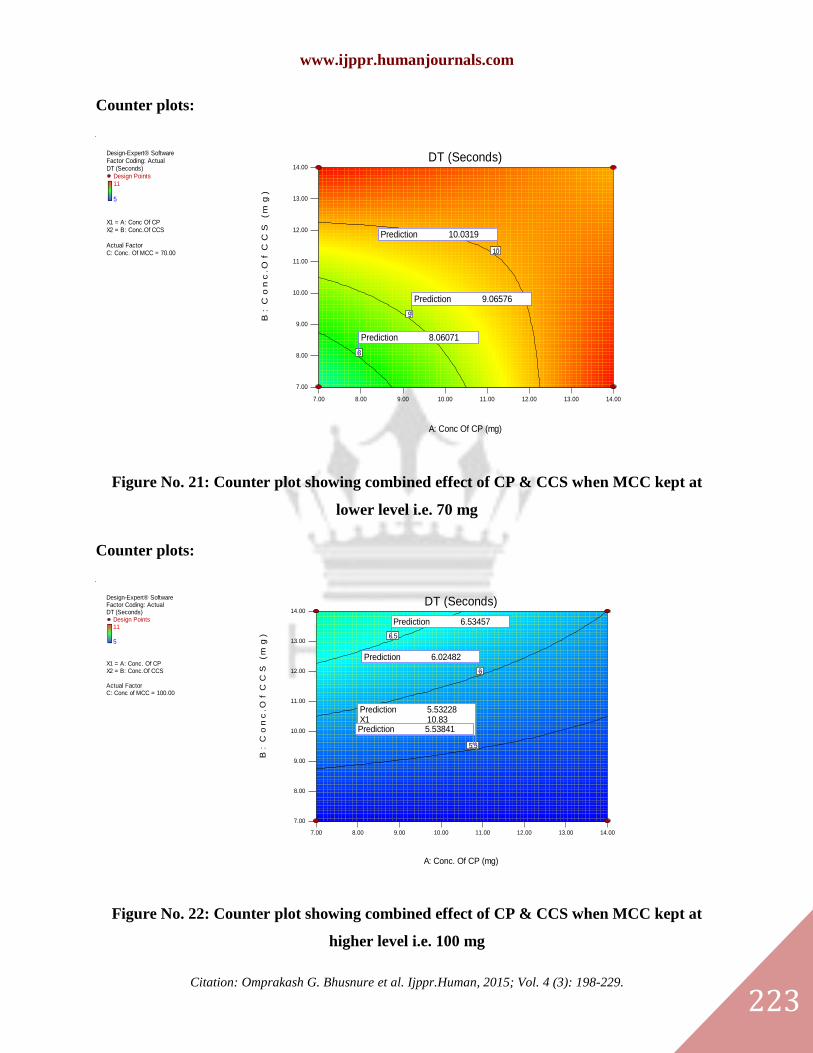
Counter plots:
Design-Expert® SoftwareFactor Coding: ActualDT (Seconds)
Design Points11
5
X1 = A: Conc Of CPX2 = B: Conc.Of CCS
Actual FactorC: Conc. Of MCC = 70.00
7.00 8.00 9.00 10.00 11.00 12.00 13.00 14.00
7.00
8.00
9.00
10.00
11.00
12.00
13.00
14.00
DT (Seconds)
A: Conc Of CP (mg)
B:
Co
nc
.Of
CC
S (
mg
)
8
9
10
Prediction 10.0319
Prediction 9.06576
Prediction 8.06071
Figure No. 21: Counter plot showing combined effect of CP & CCS when MCC kept at
lower level i.e. 70 mg
Counter plots:
Design-Expert® SoftwareFactor Coding: ActualDT (Seconds)
Design Points11
5
X1 = A: Conc. Of CPX2 = B: Conc.Of CCS
Actual FactorC: Conc of MCC = 100.00
7.00 8.00 9.00 10.00 11.00 12.00 13.00 14.00
7.00
8.00
9.00
10.00
11.00
12.00
13.00
14.00
DT (Seconds)
A: Conc. Of CP (mg)
B:
Co
nc
.Of
CC
S (
mg
)
5.5
6
6.5
Prediction 6.53457
Prediction 6.02482
Prediction 5.53228X1 10.83X2 9.56Prediction 5.53841
Figure No. 22: Counter plot showing combined effect of CP & CCS when MCC kept at
higher level i.e. 100 mg
www.ijppr.humanjournals.com
Citation: Omprakash G. Bhusnure et al. Ijppr.Human, 2015; Vol. 4 (3): 198-229.
224
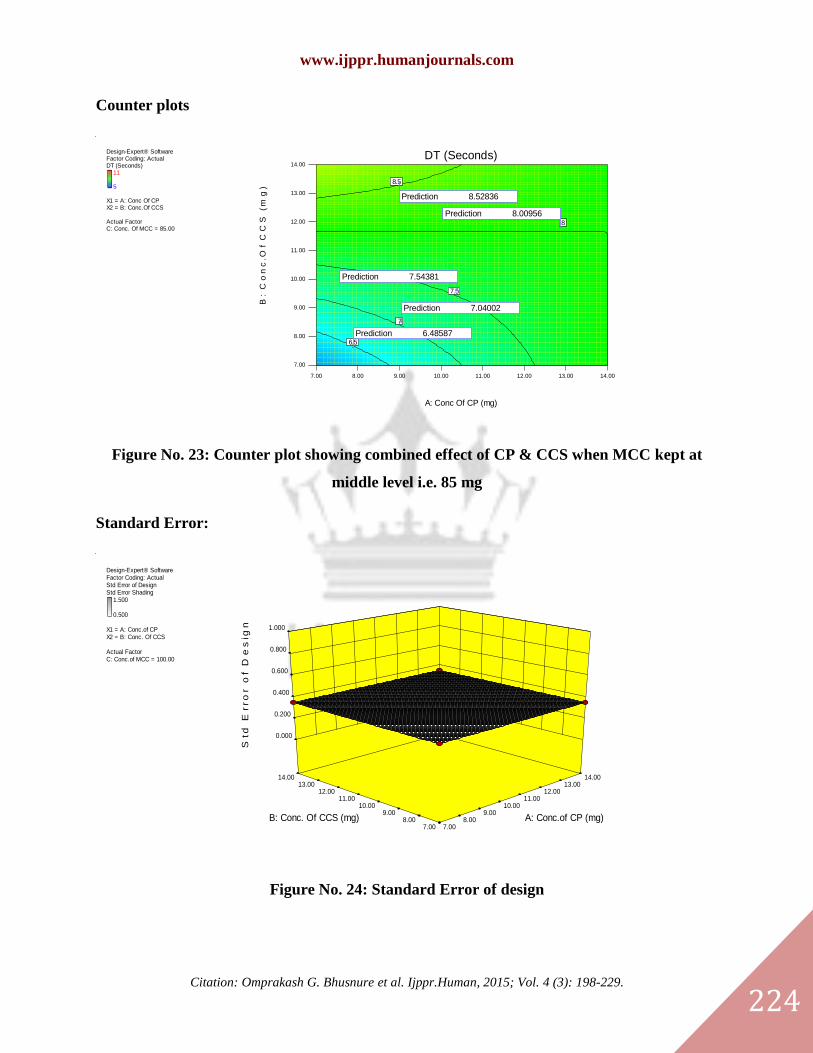
Counter plots
Design-Expert® SoftwareFactor Coding: ActualDT (Seconds)
11
5
X1 = A: Conc Of CPX2 = B: Conc.Of CCS
Actual FactorC: Conc. Of MCC = 85.00
7.00 8.00 9.00 10.00 11.00 12.00 13.00 14.00
7.00
8.00
9.00
10.00
11.00
12.00
13.00
14.00
DT (Seconds)
A: Conc Of CP (mg)
B:
Co
nc
.Of
CC
S (
mg
)
6.5
7
7.5
8
8.5
Prediction 8.52836
Prediction 8.00956
Prediction 7.54381
Prediction 7.04002
Prediction 6.48587
Figure No. 23: Counter plot showing combined effect of CP & CCS when MCC kept at
middle level i.e. 85 mg
Standard Error:
Design-Expert® SoftwareFactor Coding: ActualStd Error of DesignStd Error Shading
1.500
0.500
X1 = A: Conc.of CPX2 = B: Conc. Of CCS
Actual FactorC: Conc.of MCC = 100.00
7.00 8.00
9.00 10.00
11.00 12.00
13.00 14.00
7.00 8.00
9.00 10.00
11.00 12.00
13.00 14.00
0.000
0.200
0.400
0.600
0.800
1.000
Std
E
rro
r o
f D
es
ign
A: Conc.of CP (mg)B: Conc. Of CCS (mg)
Figure No. 24: Standard Error of design
www.ijppr.humanjournals.com
Citation: Omprakash G. Bhusnure et al. Ijppr.Human, 2015; Vol. 4 (3): 198-229.
225
4. CONCLUSION
At the end, from the experiments carried out and results obtained, it can be concluded that the
developed formulations achieved the objective of the investigation. The data obtained from the
study of “Formulation and Evaluation of Fast Disintegrating Tablets of Nifedipine by QbD
Approach” reveals following conclusion:
IR spectroscopy studies indicated that the drug was compatible with the PEG 4000 and all
excipients used.
Fast Disintegrating Nifedipine Tablets were successfully prepared by direct compression
method.
The flow properties and uniformity of all the prepared tablets were good as indicated by good
fluff density, tapped density, low angle of repose ( <30°) , low compressibility index (I<35).
The hardness of the prepared tablets by direct compression, sublimation and effervescent
method was found to be in the range of 2.4 kg/cm2 to 3.5 kg/cm
2
The Thickness of the prepared tablets by all three methods was found between 3.0 mm. to
3.35 mm.
The friability values of the prepared tablets by all three methods were found to be less than
1%.
The in-vitro disintegration time of tablets prepared by direct compression method were found
to be in the range of 5 to 11 sec. Formulation F5 and F6 showed in-vitro disintegration time 5
Sec.
Based on the in-vitro disintegration time, Promising formulations F5and F6, which facilitate
the faster disintegration in the mouth.
The in-vitro percentage drug releases from fast dissolving tablets of Nifedipine prepared by
direct compression method were found to be in the range of 92.81 to 99.23%.
Hence, finally it was concluded that the prepared fast dissolving tablets of Nifedipine may prove
to be potential candidate for effective fast disintegrating tablet dosage form.
5. REFERENCES
1. Bhoop Bhupinder Singh, Raza Kaisar and Beg Sarwar, 2013. “Developing “Optimized” Drug Products
Employing “Designed” Experiments.” Chemical Industry Digest (June 2013): 70-76.
2. Sangshetti, J.N. et al., Quality by design approach: Regulatory need. Arabian Journal of Chemistry (2014),
http://dx.doi.org/10.1016/j.arabjc.2014.01.025
www.ijppr.humanjournals.com
Citation: Omprakash G. Bhusnure et al. Ijppr.Human, 2015; Vol. 4 (3): 198-229.
226
3. Peter Devies, Oral Solid Dosage Forms, shire pharmaceutical development Ltd,Basingtoke, UK 2009.
4. Debjit Bhowmik, Chiranjib.B, Jyoti jaiswal,Vinod dubey, Margret Chandira.Fast dissolving tablet: A review
on revolution of novel drug delivery system and new market opportunities.der pharmacia let 2009;1(2):262-
276.
5. Velmurugan S and Sundar Vinushitha. Oral Disintegrating Tablets: An Overview. International Journal of
Chemical and Pharmaceutical Sciences. 2010, Dec., Vol.1 (2).
6. Bharat Parashar, Virendra Yadav, Brajesh Mayur, Love sharma. Fast Dissolving Tablets: International Journal
of Applied Pharmaceutics, ISSN- 0975-7058 Vol 4, Issue 2, 2012.
7. Sharma Deepak, Kumar Dinesh, Singh Mankaran, Singh Gurmeet, Rathore M.S. Fast Dissolving Tablets: A
New Era in Novel Drug Dilevary System and New market opportunities. Journal of Drug Delivery &
Therapeutics; 2012, 2(3): 74-86.
8. Lachman L, Lieberman H.A., Kanig J.L. The theory and practice of industrial pharmacy 3rd edition Mumbai:
Varghese Publishing House; 1987; 182‐184.
9. Staniforth J.N., Aulton M.E. Powder flow In: Alton‟s Pharmaceutics: the design and manufacturing of
medicines. 3rd ed. Hungary: Harcourt publisher ltd.2007; 175‐79.
10. Ansel H.C., Popovich NG, Allen LV. Pharmaceutical dosage forms and drug delivery system. 8th ed. New
Delhi. B. I. Waverly Pvt. Ltd. 1995;189‐94, 235‐36.
11. Martin A. Diffusion and Dissolution. In: Physical pharmacy.3rd
ed.Philadelphia: Lea and Febiger; 1983;
399‐444.
12. Debjit Bhowmik, Chiranjib.B, Jyoti jaiswal,Vinod dubey, Margret Chandira.Fast dissolving tablet: A review on
revolution of novel drug delivery system and new market opportunities.der pharmacia let 2009;1(2):262-276.
13. V. N. Deshmukh. Mouth Dissolving Drug Delivery System: A Review. Int J Pharm Tech Res 2012;4(1):412-
421.
14. P. Ashish, M.S. Harsoliya, J.K.Pathan, S. Shruti. A Review- Formulation of Mouth Dissolving tablet.Int J
Pharm Clin Sci 2011; 1 (1): 1-8.
15. Vikas Sharma, Vandana Arora, Chandana Ray. Use of Natural Superdisintegrants in Mouth Dissolving Tablets-
An Emerging Trend. International Bulletin of Drug Research. 1(2): 46-54.
16. Mohit Mangal, Sunil Thakral, Manish Goswami, Pankaj Ghai. Superdisintegrants: An Updated Review.
International Journal of Pharmacy and Pharmaceutical Science Research. ISSN: 2249-0337.
17. P.S Mohanachandran1, P.G Sindhumol1, T.S Kiran. Superdisintegrants: An overview. Volume 6, Issue 1,
January – February 2011; Article-022 ISSN 0976 – 044X.
18. Ashish Garg, M.M. Gupta. Mouth dissolving tablets: A Review. Journal of Drug Delivery & Therapeutics;
2013, 3(2), 207-214.
19. Nadia Saffoon, Riaz Uddin, Naz Hasan Huda and Kumar Bishwajit Sutradhar. Enhancement of Oral
Bioavailability and Solid Dispersion: A Review. Journal of Applied Pharmaceutical Science 01 (07); 2011: 13-
20.
20. Brahmankar D.M, Sunil B. Jaiswal, Biopharmaceutics and Pharmacokinetics.
21. Bhavana Kapoor, Ramdeep Kaur, Sukhdeep Kaur, Himani Bhel, Sukhkran Kaur. Solid Dispersion: An
Evolutionary Approach for Solubility Enhancement of Poorly Water Soluble Drugs. International Journal of
Recent Advances in Pharmaceutical Research April 2012; 2(2): 1-16.
22. Ruchi Tiwari1, Gaurav Tiwari, Birendra Srivastava and Awani K. Rai, Solid Dispersions: An Overview To
Modify Bioavailability Of Poorly Water Soluble Drugs. International Journal of PharmTech Research CODEN
(USA): IJPRIF ISSN : 0974-4304 Vol.1, No.4, pp 1338-1349, Oct-Dec 2009.
23. Dr Praveen kumar, Arora Vandana, Solid Dispersion : Review. JPSI.
24. Devesh A. Bhatt , Smita I. Rane “Qbd Approach To Analytical Rphpl Method Development And Its
Validation” International Journal of Pharmacy and Pharmaceutical Sciences ISSN- 0975-1491 Vol 3, Issue 1,
2011.
25. Example QbD IR Tablet Module 3 Quality 3.2.P.2 Pharmaceutical Development April 2012.
www.ijppr.humanjournals.com
Citation: Omprakash G. Bhusnure et al. Ijppr.Human, 2015; Vol. 4 (3): 198-229.
227
26. Using Quality by Design (QbD) in Designing Efficient, FDA Compliant Pharmaceutical Manufacturing
Processes and FacilitiesWhat is the Impact? by Russ Somma, Ph.D.SommaTech, LLC.
27. Donghao (Robert) Lu, CDER, FDA, CQAs, CPPs and Control Strategy –FDA Perspectives, AAPS Annual
Meeting Los Angeles November 9, 2009.
28. Fritz Erni, “Design Space and Control Strategy”, Global Quality Operations, Novartis Basel, 2006.
29. ICH. Draft consensus guideline: pharmaceutical development annex to Q8. Available at
http://www.ich.org/LOB/media/ MEDIA4349.pdf (accessed 11/21/2007).
30. ICH Q8 (R1) Pharmaceutical Development: Quality by Design, May 2006.
31. Biostatistics A Methodology for the Health Sciences Second Edition Gerald Van Belle, Lloyd D. Fisher, Patrick
J. Heagerty, Thomas Lumley. A John Wiley & Sons, Inc., Publication.
32. Design and Analysis of Experiments Volume 2 Advanced Experimental Design by Klaus Hinkelmann, Oscar
Kempthorne . A John Wiley & Sons, Inc., Publication.
33. Research Design and Statistical Analysis Second Edition by Jerome L. Myers, Arnold D. Well. Lawrence
Erlbaum Associates, Publishers 2003 Mahwah, New Jersey London.
34. Pharmaceutical Experimental Design and Interpretation by N. Anthony Armstrong. Second Edition. Published
in 2006 by CRC Press Taylor & Francis Group.
35. Amit S. Patil, Anil M. Pethe, Research Article, Quality by Design (QbD) : A new concept for development
of quality pharmaceuticals, International Journal of Pharmaceutical Quality Assurance; 4(2); 13-19 ISSN 0975
9506.
36. Bhagyesh Trivedi , Review article, Quality by Desing (QbD) In Pharmaceuticals, International Journal of
Pharmacy and Pharmaceutical Sciences, ISSN- 0975-1491 Vol 4, Issue 1, 2012.
37. Robert A. Lionberger, Sau Lawrence Lee, LaiMing Lee, Andre Raw, and Lawrence X. Yu, Review Article,
Quality by Design: Concepts for ANDAs, The AAPS Journal, Vol. 10, No. 2, June 2008.
38. Naseem A. Charooa, Areeg A.A. Shamsherb, Ahmed S. Zidanc, d, Ziyaur Rahmand. Quality by design
approach for formulation development: A case study of dispersible tablets. International Journal of
Pharmaceutics. Volume 423, Issue 2, 28 February 2012, Pages 167–178.
39. Buket Aksu, Marcel De Matas, Erdal Cevher, Yþldþz Ozsoy, Tamer Guneri, Peter York. Quality by design
approach for tablet formulations containing spray coated ramipril by using artificial intelligence techniques.
International Journal of Drug Delivery 4,2012:59-69.
40. Vaibhav Gatade, Ajinath Shirsat , Sanjeevani Deshkar , Vaishali Potnis aPadm. Design and Optimization of
Colon Targeted Microspheres of Prednisolone Sodium Phosphate using Quality by Design Approach. Indo
American Journal of Pharmaceutical Research, 2013;3(5):3618-3635.
41. Petra Petelin Miha Homar, Aleksander Bajc, Janez Ker and Simona Bohanec. Use of Factorial Design for
Evaluation of Factors Affecting the Chemical Stability of Sirolimus (Rapamycin) in Solid Dosage Form, Acta
Chim. Slov 2012;59:156– 162.
42. Chandrakala .V., Mary Saral A. Quality By Design Approach In Formulation Of Bioadhesive Levodopa
Microspheres. Int J Pharm Pharm Sci, 2013; 5(4): 172-178.
43. Sandipan Roy, Review article, Quality by design: A holistic concept of building quality in pharmaceuticals, Int
J Pharm Biomed Res 2012, 3(2), 100-108, ISSN No: 0976-0350.
44. Narendra C, Srinath Ms, Prakash B Rao. Formulation and evaluation of a sublingual tablet containing
terbutaline sulphate: optimisation and in vivo studies. Ars. Pharm 2005; 46 (2): 139-158.
45. Bhupendra G.Prajapati, Dipesh V.Patel. Formulation And Optimization Of Domperidone Fast Dissolving
Tablet By Wet Granulation Techniques Using Factorial Design. International Journal of PharmTech Research
CODEN (USA): IJPRIF ISSN : 0974-4304Vol.2, No.1, pp 292-299, Jan-Mar 2010.
46. Bhupendra G.Prajapati, Dipesh V.Patel. Comparative study of efficiency of different superdisintegrant for fast
dissolve tablet of domperidone. Journal of Pharmacy Research 2010, 3(1),151-155. ISSN: 0974-6943.
47. Nikhil K. Sachan and Seema Pushkar, Research Article, Solid Dispersions: An Industrially Feasible Alternative
Approach to Formulate Brick Dust Molecules, Bulletin of Pharmaceutical Research 2011;1(1):75-87.
www.ijppr.humanjournals.com
Citation: Omprakash G. Bhusnure et al. Ijppr.Human, 2015; Vol. 4 (3): 198-229.
228
48. Sameer Singh1, Raviraj Singh Baghel and Lalit Yadav, a Review on Solid Dispersions, IJPLS, ISSN: 0976-
7126.
49. Santhosh R Iyer, R. Sivakumar, P. Siva and CI. Sajeeth, Research Article on: Formulation and Evaluation of
Fast Disintegrating Tablets of Risperidone by Solid Dispersion, IJPCBS, 2013, 3(2), 388-397. ISSN: 2249-
9504.
50. Y. Lalitha, P. K. Lakshmi, Research Article, Enhancment and Dissolution of Nifedipine by Surface Solid
Dispersion Technique, International Journal of Pharmacy and Pharmaceutical Sciences, ISSN- 0975-1491 Vol
3 Suppl 3, 2011.
51. Abhishek Datta , Nansri Saha Ghoshb, Soumik Ghoshc, Subal Debnathd, Santhosh kumard, Chiranjib
Bhattacharjeed, Research Article,Development, Charecterization and Solubility study of Solid Dispersion of
Nifedipine Hydrochloride by Solvent Evaporation method using Poloxamer 407, IJABPT, Volume: 2: Issue-1:
Jan-Mar -2011, ISSN 0976-4550.
52. Mahesh Kumar Kataria1 and Anil Bhandari, Research Article, Formulation and Evaluation of Solid dispersion
for Dissolution Enhancement of Nifedipine, World Journal of Pharmaceutical Sciences, ISSN (Print): 2321-
3310; ISSN (Online): 2321-3086.
53. K. Nagrajan, M. Gopal Rao, Satyjeet Datta, R. Pavitra, G. Swetha, Research Article, Formulation and
Dissolution Studies of Solid Dispersions of Nifedipine, Indian Journal of Novel Drug delivery 2(3), Jul-Sep,
2010, 96-98.
54. Mogal S. A, Gurjar P. N ,Yamgar D. S and Kamod A.C, Solid dispersion technique for improving solubility of
some poorly soluble Drugs, Scholars Research Library, Der Pharmacia Lettre, 2012, 4 (5):1574-1586, ISSN
0975-5071.
55. Saleh A. Al-Suwayeh1, Jia-You Fang, Ibrahim M. El-Bagory, Ehab I. Taha1 and Mohsen A. Bayomi,
Formulation, Optimization and biopharmaceutical evaluation of the fast release tablets of Nifedipine
cyclodextrin African Journal of Pharmacy and Pharmacology Vol. 5(15), pp. 1757-1764, 22 October, 2011.
56. Sheeba. F. R, Formulation and Evalution of Sublingual Tablets of Nifedipine, Asian Journal of Pharmaceutical
and Clinical Research Vol.2 Issue 3, July-September 2009 SSN 0974-2441.
57. Shinde Anilkumar J, Waghule Arun N, Paithane Amol, More Harinath N, Development and characterisation of
oral fast dissolving tablet of Nifedipine using camphor as a subliming material, Research Journal of
Pharmaceutical, Biological and Chemical Sciences.
58. Rajkumar Goyal1, Satyendra Singh Baghel , Ashish Pathak , Kshamashil Sharma, Gourav Tiwari , Rituraj
Shivhare, A Review on Formulation and Evalution of Orodispersible Tablets (Fast Dissolving Tablets) World
Journal of Pharmaceutical research Volume 1, Issue 3, 576-590. Review Article ISSN 2277 – 7105.
59. Velmurugan S and Sundar Vinushitha, Oral Disintegrating Tablets: An Overview, International Journal of
Chemical and Pharmaceutical Sciences, 2010, Dec., Vol.1 (2).
60. Yourong Fu, Shicheng Yang, Seong Hoon Jeong, Susumu Kimura, & Kinam Park, Orally Fast Disintegrating
Tablets: Developments, Technologies, Taste-Masking and Clinical Studies, Critical Reviews in Th erapeutic
Drug Carrier Systems, 21(6):433–475 (2004),CRT2106(133).
61. Jaydev Patil, Chandrashekhar Kadam, Vishvjet V and Gopal, Formulation, Design and Evalution of Orally
Disintegrating Tablet of Loratadin using Direct compression process, International Journal of Pharma and Bio
Sciences, ISNN 0975-6299,Vol 2/Issue2/Apr-Jan 2011.
62. T.N.V.S Narayana Reddy, S.Divya Teja.Banda, G. Diwaker Srinivas, Research Article, Design and
Development of Fast Dissolving Tablet of Amlodipine Besylate and Atorvastatin Calcium, Int. J. Pharm. Sci.
Rev. Res., 23(1), Nov – Dec 2013; nᵒ 54, 290-294 ISSN 0976 – 044X.
63. M. Swamivelmanickam, K. Valliappan, P.Gangi Reddy, A. Madhukar, R. Manavalan, Preformulation studies
for Amoxicillin trihydrate and Dicloxacillin sodium as Mouth Dissolve tablets, International Journal of
ChemTech Research, CODEN( USA): IJCRGG ISSN : 0974-4290 Vol.1, No.4, pp 1032-1035, Oct-Dec 2009.
64. Inderbir Singh and Pradeep Kumar, Preformulation Study for Direct Compression Sutaibality of Cefuroxim
Axitel and Paracetamol, Graphical representation using SeDeM digram, Acta Poloniae Pharmaceutica n Drug
Research, Vol. 69 No. 1 pp. 87n93, 2012 ISSN 0001-6837.
www.ijppr.humanjournals.com
Citation: Omprakash G. Bhusnure et al. Ijppr.Human, 2015; Vol. 4 (3): 198-229.
229
65. Rajeshree Panigrahi, K.A. Chowdary, Gitanjali Mishra, Manas Bhowmik, Saiprasanna Behera, Resarch
Aarticle, Formulation of fast dissolving tablets of Lisinopril using combination of synthetic superdisintegrants,
Asian J. Pharm. Tech. 2012; Vol. 2: Issue 3, Pg 94-98, ISSN- 2231–5705 (Print) ISSN- 2231–5713 (Online).
66. Prakash Goudanavar, Doddayya Hiremath, Spandana D. and S. R. Reddy, Resarch Aarticle, Development and
Evaluation of Fast Disintegrating Tablets of Granisetron HCl with Natural and Synthetic Polymers, Asian J.
Pharm. Res. 2011; Vol. 1: Issue 3, Pg 72-77, ISSN- 2231–5683, ISSN- 2231–5691.
67. Upendra Kulkarni, Prashant A Borgavkar, Baswraj A. Patil, Prakash G. Korwar, Research Article, Frmulation
and Developmnt of Fast disintegrating tablets containing Fenugreek Seed powder, Asian Journal of
Pharmaceutical and Clinical Research, Vol. 4, Issue 1, 2011 ISSN - 0974-2441.
68. Praveen Khirwadkar1, Kamlesh Dashora, Shyam Bihari Sharma, Formulation and Evalution of Orodispersible
Tablets of Cinnarizine by Superdisintegrating agent additional methode, Indian Journal of Research in
Pharmacy and Biotechnology, ISSN: 2321-5674(Print) ISSN: 2320 – 3471(Online).
69. Amit Modi, Abhishek Pandey, Vandana Singh, Dr. C.G. Bonde, Dheeraj Jain, Sandeep Shinde, Formulation
and Evalution of Fast Dissolving Tablets of Diclofenac Sodium Using different Superdisinterants by Direct
Compression Methode, PHARMACIA Vol. -1 , Issue -3, Year - June 2012 ISSN 0976-9692.
70. Shrivastava Priyanka and Sethi Vandana, A Review article on; Superdisintegrants, International Journal of
Drug Research and Technology.
71. Mohit Mangal, Sunil Thakral, Manish Goswami, Pankaj Ghai. Superdisintegrants: An Updated Review.
International Journal of Pharmacy and Pharmaceutical Science Research. ISSN: 2249-0337.
72. P.S Mohanachandran1, P.G Sindhumol1, T.S Kiran. Superdisintegrants: An overview. Volume 6, Issue 1,
January – February 2011; Article-022 ISSN 0976 – 044X
73. Nifedipine. USP30-NF25 [book on CD ROM] 2007.
74. http://www.chemicalland21.com/lifescience/uh/NIFEDIPINE.htm. (As on 25-11-2008).
75. Goodman & Gilman‟s The Pharmacological basis therapeutics. 3rd ed. New York: McGraw-Hill Companies.
[Book on CD-ROM] 2006.
76. Clarke's Analysis of Drugs and Poisons 3rd ed. London. Pharmaceutical Press. [Book on CD-ROM] 2005.
77. Rowe RC, Sheskey PJ, Weller PJ. Handbook of pharmaceutical excipients.4 th
ed. UK, Science and practice
publishers, 2003; 101, 271-273, 959.
78. Government of India. Ministry of health and welfare Indian Pharmacopoeia. Delhi: Controller of Publications.
1996; Vol II. P. A-80-81, 736.
79. Raymond C Rowe, Paul J Sheskey, Marian E Quinn. Hand book of pharmaceutical excipients. 6th edition
London, Chicago: Pharmaceutical Press, American Pharmaceutical Association; 2003.
80. IP 2007 Volume 2 page no.701-703.
81. Kemp W. Organic spectroscopy. 3rd ed. London: Palgrave 1991: p. 19-96.
82. Dehghan M H G, Saifee M, Hanwate R M, Comparative Dissolution Study of Glipizide by Solid Dispersion
Technique, Journal of Pharmaceutical Science and Technology, Vol. 2 (9), 2010,293-297.
83. Khansili Aparna, Bajpai Meenakshi, Sachdeva Monika, Improvement of Dissolution Rate & Solubility of
Nifedipine by Formulation of Solid Dispersion, The Pharma Research (T. Ph. Res.), (2010), 4; 38-50.
84. Slog DA, Holler FJ, Nieman TA. Principles of Instrumental Analysis. 5th Ed. Singapore: Thomson Asia pvt ltd
1998: p. 380-42.
85. Lachman L, Lieberman H.A., Kanig J.L. The theory and practice of industrial pharmacy 3rd edition Mumbai:
Varghese Publishing House; 1987; 182‐184.
86. Staniforth J.N., Aulton M.E. Powder flow In: Alton‟s Pharmaceutics: the design and manufacturing of
medicines. 3rd ed. Hungary: Harcourt publisher ltd.2007; 175‐79.