Embed Size (px)
Citation preview
Research ArticleNumerical Analysis on Failure Modes and Mechanisms ofMine Pillars under Shear Loading
Tianhui Ma,1,2 Long Wang,1 Fidelis Tawiah Suorineni,2 and Chunan Tang1
1State Key Laboratory of Coastal and Offshore Engineering, Dalian University of Technology, Dalian 116024, China2School of Mining Engineering, Faculty of Engineering, UNSW Australia, Sydney, NSW 2051, Australia
Correspondence should be addressed to Tianhui Ma; [email protected]
Received 13 January 2016; Accepted 11 April 2016
Academic Editor: Marcin A. Lutynski
Copyright © 2016 Tianhui Ma et al. This is an open access article distributed under the Creative Commons Attribution License,which permits unrestricted use, distribution, and reproduction in any medium, provided the original work is properly cited.
Severe damage occurs frequently in mine pillars subjected to shear stresses. The empirical design charts or formulas for minepillars are not applicable to orebodies under shear. In this paper, the failure process of pillars under shear stresses was investigatedby numerical simulations using the rock failure process analysis (RFPA) 2D software. The numerical simulation results indicatethat the strength of mine pillars and the corresponding failure mode vary with different width-to-height ratios and dip angles.With increasing dip angle, stress concentration first occurs at the intersection between the pillar and the roof, leading to formationof microcracks. Damage gradually develops from the surface to the core of the pillar. The damage process is tracked with acousticemission monitoring. The study in this paper can provide an effective means for understanding the failure mechanism, planning,and design of mine pillars.
1. Introduction
Studies on pillar size and stability have been conducted formany years. The main research methods include the safetyfactor, probabilistic analysis, numerical modeling, empiricalmethods, and physical testing methods. Brady et al. [1]developed a pillar strength formula accounting for pillar sizeand geometry based on the existing representative designtheory for pillar spacing. Bieniawski [2] considered that thecompressive strength of coal cubes (short-term strength)decreases with an increase in size and reaches an asymptoticvalue at a cube size of about 1.5m which, according tohim, was the critical size for coal. Lunder and Pakalnis[3] considered the role of confinement in hard rock pillarstrength. Gonzalez-Nicieza et al. [4] proposed a new formulaconsidering Bieniawski’s rock mass quality classification andthe shear-resistance safety factor of pillars. Esterhuizen [5]investigated some of the issues affecting pillar strength at lowwidth-to-height ratios in hard brittle rock and concluded thatthe strength of slender pillars was more variable than that ofwider pillars. Mortazavi et al. [6] suggested that, at high WHratios, pillars behave in a very stiffmanner in the elastic range,
demonstrating a high load-bearing capacity. Esterhuizen et al.[7] developed a pillar strength equation based on stable andfailed pillars observed. Ghasemi and Shahriar [8] proposeda new coal pillar design method. Suorineni et al. [9, 10]developed new knowledge on why pillars in ore bodies inshear are more prone to catastrophic failures than wouldnormally be expected. They introduced the concept of shearloading in orebodies and pillars.
Many scholars in China have carried out in-depth studieson pillar stability. Liu and Xu [11] estimated rock massstrength for the gob area of a phosphate mine accordingto rock mass classification, analyzed stability of pillars inthe gob area using the safety factor and reliability analysismethods, and represented the safety factor of pillars bythe average safety factor. Yang [12] proposed a new designmethod for pillar spacing, which has been applied effectivelyin engineering practice. Wang and Li [13] proposed theconcept of shear-resistance safety factor for mine pillars,considering that pillars generally fail in shear.They suggestedthat pillars were safe and reliable when the shear-resistancesafety factor was greater than 1.2. Wang et al. [14] proposed aformula for pillar width for deep stope mining and suggested
Hindawi Publishing CorporationShock and VibrationVolume 2016, Article ID 6195482, 14 pageshttp://dx.doi.org/10.1155/2016/6195482
2 Shock and Vibration
that the key factors affecting the proper pillar width were thestopping span and depth. The relevant theory was verified byfield tests.
In summary, proper pillar design is the key to preventionof pillar failure and reduction of related accidents [15].Pillar design is mostly based on empirical formulas, limitequilibrium, loading theory, and other analysis methods [12,16] at present. Due to differences in geological conditions invarious regions and complex mining conditions, the above-mentioned methods are not optimized approaches for thedesign of pillars. Small pillar sizes would lead to surfacesubsidence and affect the stability of mines, while too thickpillars lead to waste of resources [17]. In this study, the rockfailure process analysis program, RFPA2D [18–21], was usedto simulate pillars of various sizes and to investigate thefailure mechanisms. The simulation results provide furtherunderstanding of pillar mechanics and can be used for saferdesign and construction of underground mine pillars.
2. Principles of RFPA
When rock is under load, it continuously gets microcracksafter a certain stress level resulting in nonlinear deformation.The development and the accumulation of these microcrackseventually lead to a final macrofailure of the rock. Thenonlinear deformation of rocks can be simulated with FiniteElement Method (FEM), but it only stays on macrodefor-mation of the rocks; it cannot describe the developmentof the microcracking process leading to the formation ofthe macrofailure plane formation. In order to simulate theprocess of rock failure, many numerical modeling methodssuch as Finite Difference Method (FDM), Boundary ElementMethod (BEM), Half Analytical Element Method (HAEM),Discrete ElementMethod (DEM), and Extend Finite ElementMethod (EFEM) have been applied for fully solving somedifficult rock engineering problems.These methods still havemany imperfections, for instance, problems of nonlinearityand discontinuities of rocks, problems relating the effectsof step excavation, and backfill practice on stability of rockmasses. To solve these problems, in 1995, a new numericalmodeling method referred to as rock failure process analysis(RFPA) was developed to conduct stress analysis based onFinite Element Method and nonlinearity, nonhomogeneity,and the anisotropic properties of rocks. The RFPA code hasseveral special features:
(1) Themacrofailure is an accumulation ofmicrodamage.Elastic-brittle constitutive criterion is applied to eachelement. When the stresses of some elements reachpeak strength, failure occurs. By this method, phys-ically discontinuous problems can be resolved withcontinuum mechanics.
(2) Heterogeneity of rock is accounted for in the elementsusingWeibull distribution in the code for modulus ofelasticity, strength, and some other parameters of theelements.
(3) Acoustic emission associated with the progressivefailure process is included in the code by recordingthe event-rate of failed elements.
𝜎
𝜑(𝜎)
m = 6.0
m = 5.0
m = 4.0
m = 3.0
m = 2.0
m = 1.5
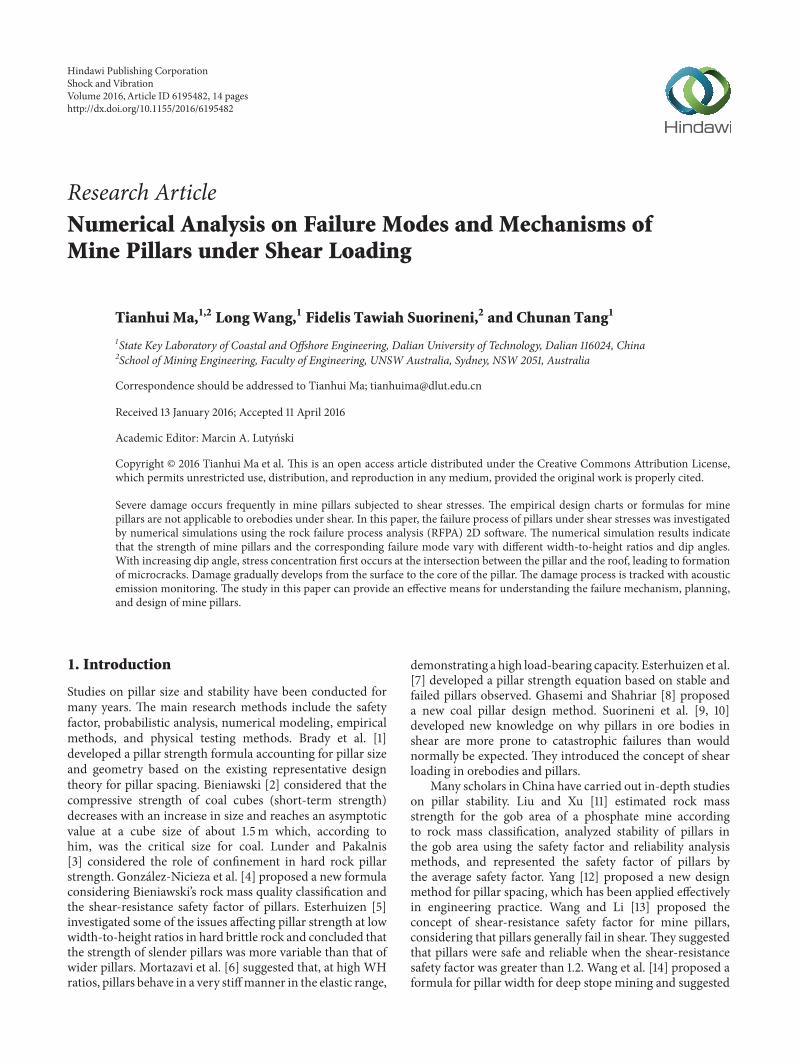
Figure 1: Weibull distribution for mechanical properties of rockmaterials with different homogeneity indices𝑚.
In RFPA2D, Weibull statistical distribution is introducedto describe the discrete physical-mechanical property as inthe following formula:
𝜑 (𝜎) =
𝑚
𝜎0
(
𝜎
𝜎0
)
𝑚−1
exp [−( 𝜎𝜎0
)
𝑚
] . (1)
In the formula, 𝜎 is a parameter for one element, 𝜎0is the
mean value of the same parameter for all the elements in onegrain, and𝑚 is a shape parameter. The shape parameter𝑚 isdefined as the homogeneity index of the rock.
For a practical rock material, the type of the statisticaldistribution needs to be determined in the laboratory. At thistime, we assume the physical-mechanical properties of theelements follow (1). A larger m implies a more homogeneousmaterial and vice versa. Figure 1 shows the shape of theprobability density function for various homogeneity indices.
Once the material fails, the mechanical property andthe ability to bear load will be changed. Usually, thechange is a degradation process, that is, reduction ofthe physical-mechanical property parameter. Based on theabove-mentioned theory, RFPA2D deals with element failureby introducing degradation of the element property. Whenthe stresses in some elements satisfy the Mohr-Coulombshear failure criterion or maximum tensile strain criterion,the element is damaged and becomes weak according to therules specified by the strength criterion.The stress and defor-mation distributions throughout the model are then adjustedinstantaneously after each rupture to reach the equilibriumstate. The stresses in some elements might be increased dueto stress redistribution. These updated stresses may exceedthe critical value specified by the strength criterion. Furtherrupturesmay, therefore, be caused.The process is repeated tillno stable elements are present. By this way, the continuousmedia mechanics method can be used to deal with thediscontinuous problem. And the Finite Element Method canbe used to simulate the whole failure process of rock materialfrom deformation, microfailure to macroscopic failure.
Shock and Vibration 3
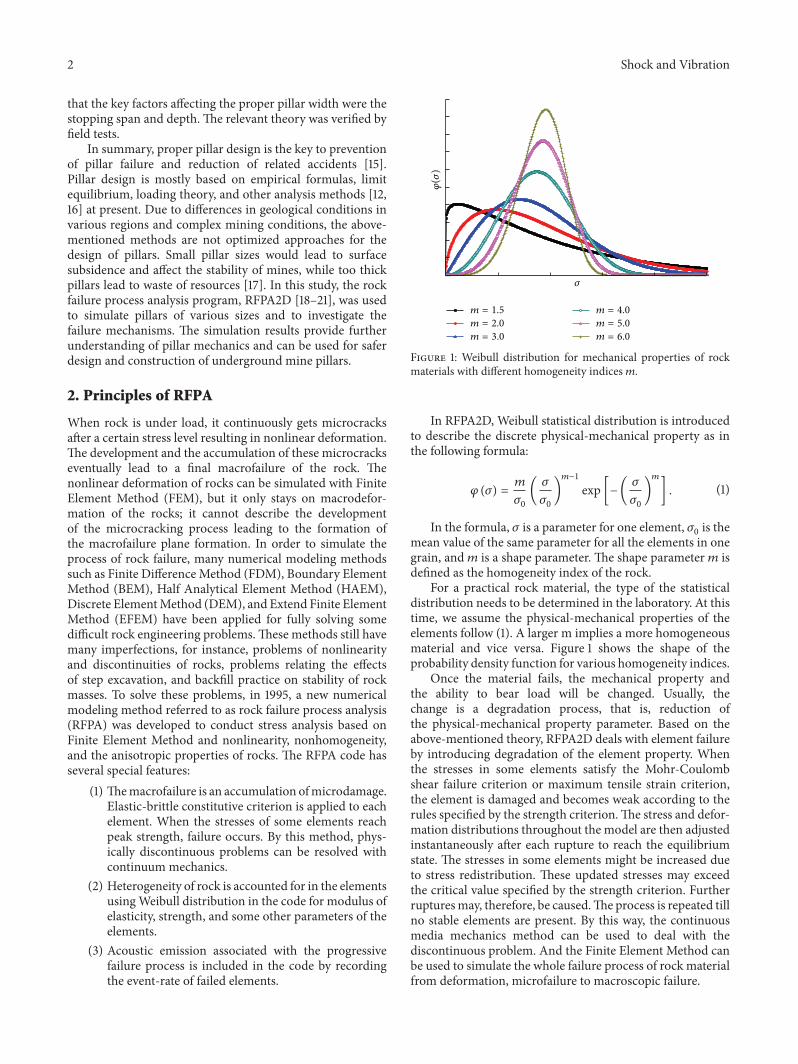
100m
3m60
m
𝜎3
𝜎1
Figure 2: Numerical model and boundary condition.
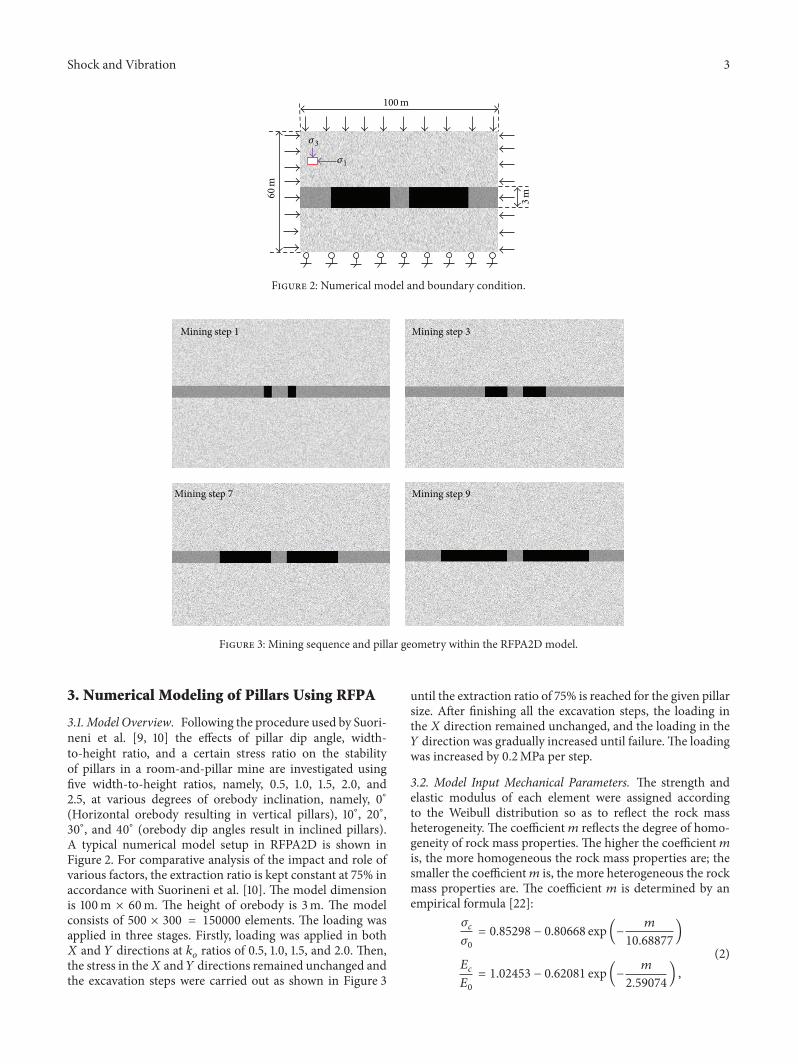
Mining step 1 Mining step 3
Mining step 7 Mining step 9
Figure 3: Mining sequence and pillar geometry within the RFPA2D model.
3. Numerical Modeling of Pillars Using RFPA
3.1. Model Overview. Following the procedure used by Suori-neni et al. [9, 10] the effects of pillar dip angle, width-to-height ratio, and a certain stress ratio on the stabilityof pillars in a room-and-pillar mine are investigated usingfive width-to-height ratios, namely, 0.5, 1.0, 1.5, 2.0, and2.5, at various degrees of orebody inclination, namely, 0∘(Horizontal orebody resulting in vertical pillars), 10∘, 20∘,30∘, and 40∘ (orebody dip angles result in inclined pillars).A typical numerical model setup in RFPA2D is shown inFigure 2. For comparative analysis of the impact and role ofvarious factors, the extraction ratio is kept constant at 75% inaccordance with Suorineni et al. [10]. The model dimensionis 100m × 60m. The height of orebody is 3m. The modelconsists of 500 × 300 = 150000 elements. The loading wasapplied in three stages. Firstly, loading was applied in both𝑋 and 𝑌 directions at 𝑘
𝑜ratios of 0.5, 1.0, 1.5, and 2.0. Then,
the stress in the𝑋 and𝑌 directions remained unchanged andthe excavation steps were carried out as shown in Figure 3
until the extraction ratio of 75% is reached for the given pillarsize. After finishing all the excavation steps, the loading inthe 𝑋 direction remained unchanged, and the loading in the𝑌 direction was gradually increased until failure.The loadingwas increased by 0.2MPa per step.
3.2. Model Input Mechanical Parameters. The strength andelastic modulus of each element were assigned accordingto the Weibull distribution so as to reflect the rock massheterogeneity. The coefficient𝑚 reflects the degree of homo-geneity of rock mass properties. The higher the coefficient𝑚is, the more homogeneous the rock mass properties are; thesmaller the coefficient𝑚 is, the more heterogeneous the rockmass properties are. The coefficient 𝑚 is determined by anempirical formula [22]:
𝜎𝑐
𝜎0
= 0.85298 − 0.80668 exp (− 𝑚10.68877
)
𝐸𝑐
𝐸0
= 1.02453 − 0.62081 exp (− 𝑚2.59074
) ,
(2)
4 Shock and Vibration
Table 1: Mechanical properties of the model.
Parameter Coefficient ofhomogeneity (𝑚)
Uniaxial compressivestrength (𝜎
𝑐)/MPa Elastic modulus (𝐸
𝑐)/MPa Poisson’s ratio (]) Angle of internal
friction (𝜑)/∘
Rock mass 4 170 70000 0.25 40Orebody 7 60 20000 0.22 35
where 𝜎𝑐and 𝐸
𝑐are, respectively, the simulated uniaxial
compressive strength and the elastic modulus and 𝜎0and 𝐸
0
are, respectively, the characteristic compressive strength andthe characteristic elastic modulus of mesoscopic elements.According to the real mechanical parameters of rock massesin a mine, the macroscopic parameters can be convertedto mesoscopic element parameters according to the aboveempirical formulas. The material parameters for the rockmasses and orebody in the model are listed in Table 1.
4. Simulation Results and Analyses
4.1. Failure Characteristics of Vertical Pillars with DifferentWidth-to-Height Ratios. Mine pillars are in situ rock leftafter mining to ensure mine safety. The determination ofpillar sizes dictates the cost of mining and mine safety.Pillar instability refers to the compressional-shear or splittingfailure under uniaxial stresses when external loading reachesa limit value. Upon failure, the pillar loses its bearing capacityand can no longer transfer stresses from the overlying strata[17] to the floor.
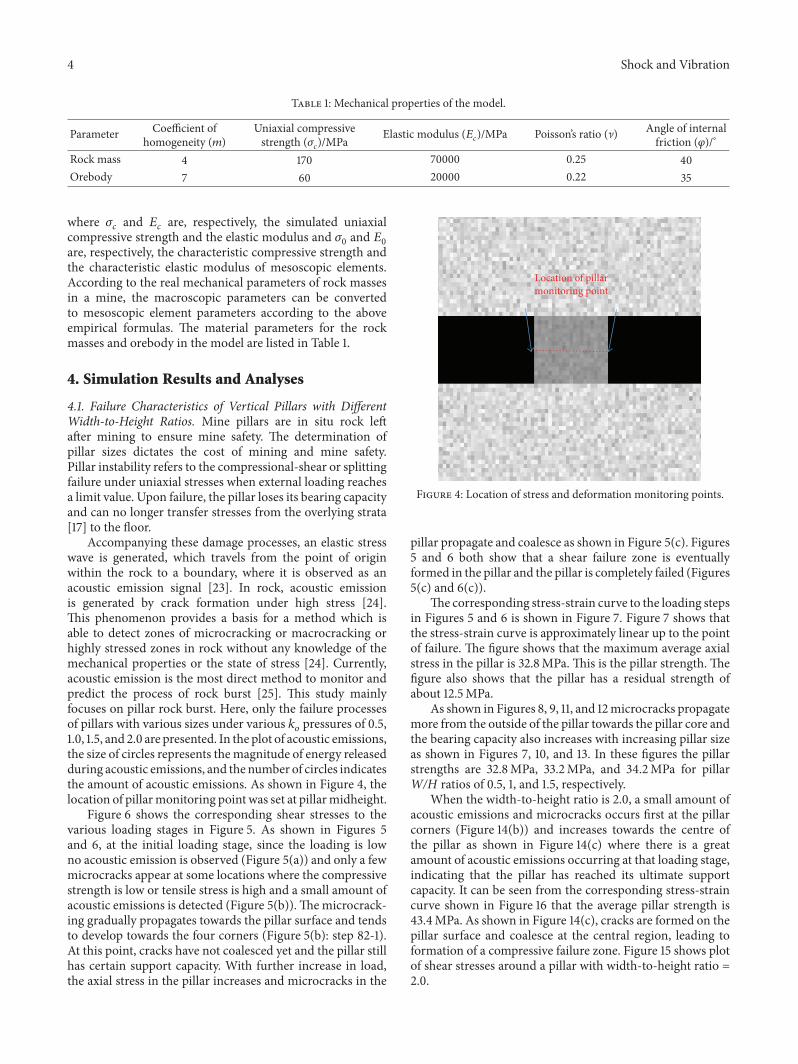
Accompanying these damage processes, an elastic stresswave is generated, which travels from the point of originwithin the rock to a boundary, where it is observed as anacoustic emission signal [23]. In rock, acoustic emissionis generated by crack formation under high stress [24].This phenomenon provides a basis for a method which isable to detect zones of microcracking or macrocracking orhighly stressed zones in rock without any knowledge of themechanical properties or the state of stress [24]. Currently,acoustic emission is the most direct method to monitor andpredict the process of rock burst [25]. This study mainlyfocuses on pillar rock burst. Here, only the failure processesof pillars with various sizes under various 𝑘
𝑜pressures of 0.5,
1.0, 1.5, and 2.0 are presented. In the plot of acoustic emissions,the size of circles represents themagnitude of energy releasedduring acoustic emissions, and the number of circles indicatesthe amount of acoustic emissions. As shown in Figure 4, thelocation of pillarmonitoring point was set at pillarmidheight.
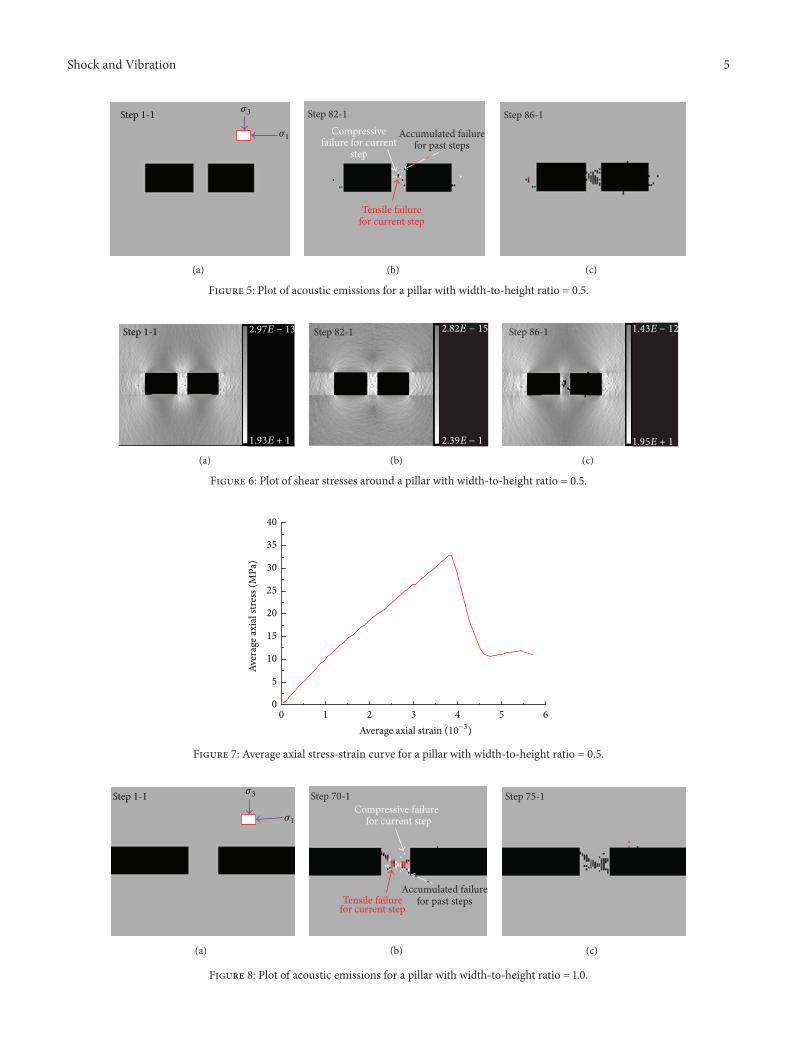
Figure 6 shows the corresponding shear stresses to thevarious loading stages in Figure 5. As shown in Figures 5and 6, at the initial loading stage, since the loading is lowno acoustic emission is observed (Figure 5(a)) and only a fewmicrocracks appear at some locations where the compressivestrength is low or tensile stress is high and a small amount ofacoustic emissions is detected (Figure 5(b)).Themicrocrack-ing gradually propagates towards the pillar surface and tendsto develop towards the four corners (Figure 5(b): step 82-1).At this point, cracks have not coalesced yet and the pillar stillhas certain support capacity. With further increase in load,the axial stress in the pillar increases and microcracks in the
Location of pillarmonitoring point
Figure 4: Location of stress and deformation monitoring points.
pillar propagate and coalesce as shown in Figure 5(c). Figures5 and 6 both show that a shear failure zone is eventuallyformed in the pillar and the pillar is completely failed (Figures5(c) and 6(c)).
The corresponding stress-strain curve to the loading stepsin Figures 5 and 6 is shown in Figure 7. Figure 7 shows thatthe stress-strain curve is approximately linear up to the pointof failure. The figure shows that the maximum average axialstress in the pillar is 32.8MPa. This is the pillar strength. Thefigure also shows that the pillar has a residual strength ofabout 12.5MPa.
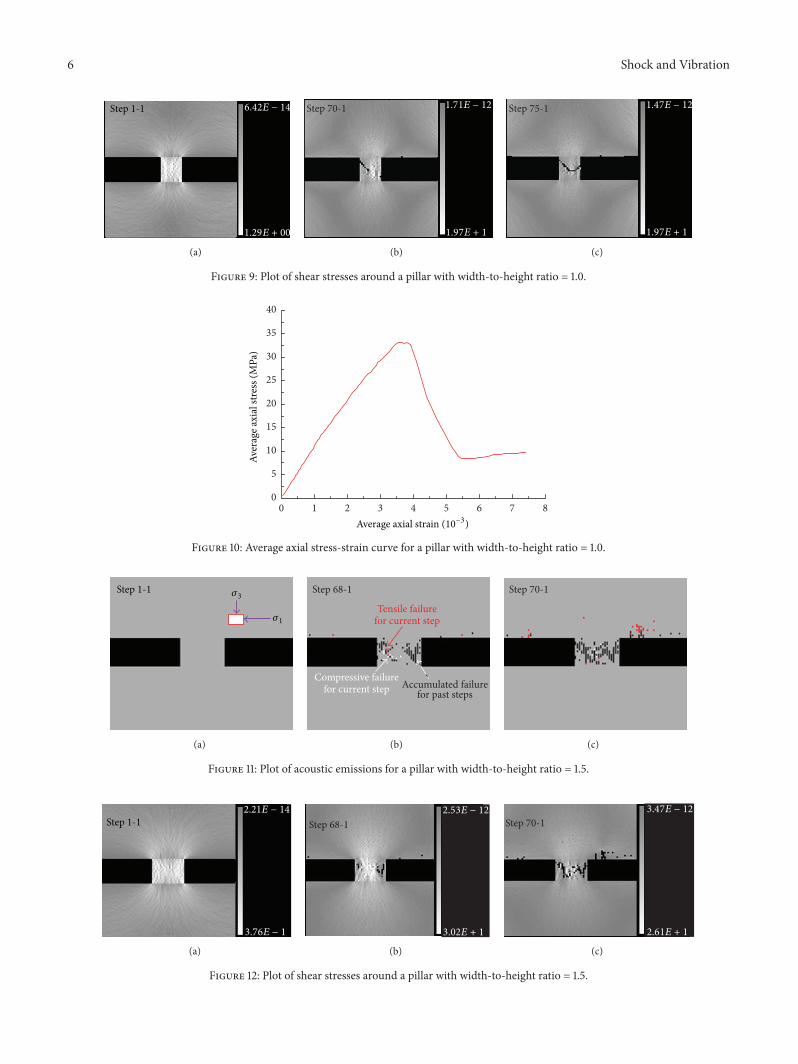
As shown in Figures 8, 9, 11, and 12microcracks propagatemore from the outside of the pillar towards the pillar core andthe bearing capacity also increases with increasing pillar sizeas shown in Figures 7, 10, and 13. In these figures the pillarstrengths are 32.8MPa, 33.2MPa, and 34.2MPa for pillarW/H ratios of 0.5, 1, and 1.5, respectively.
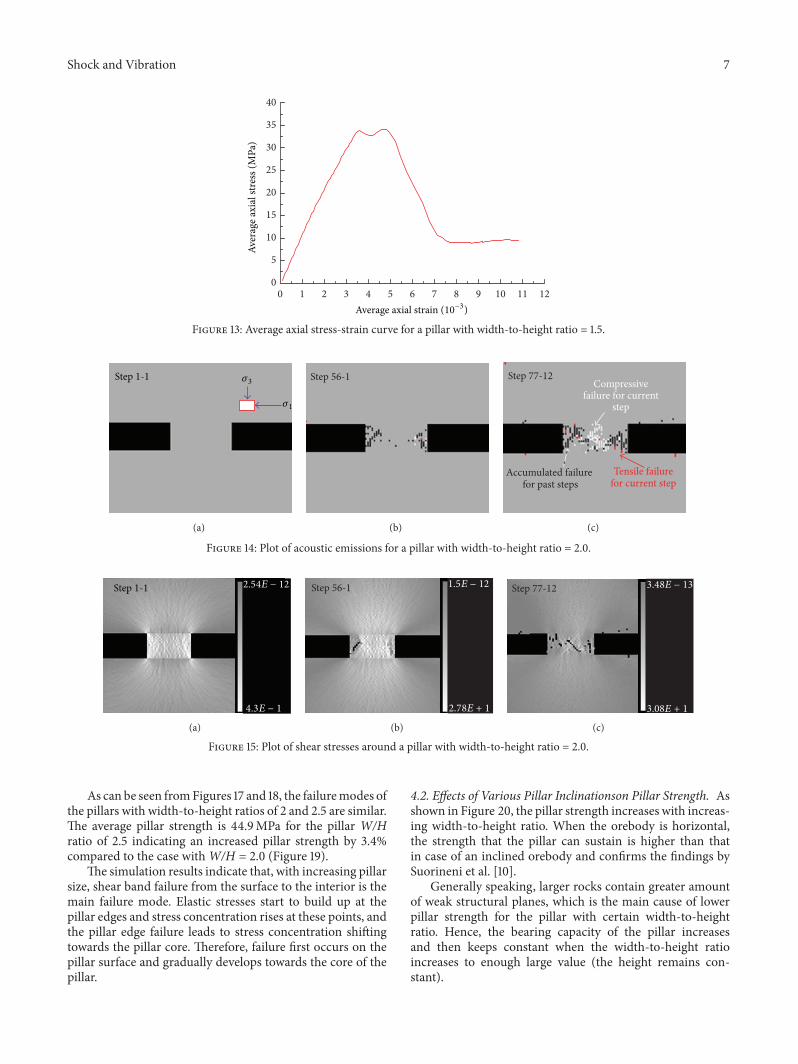
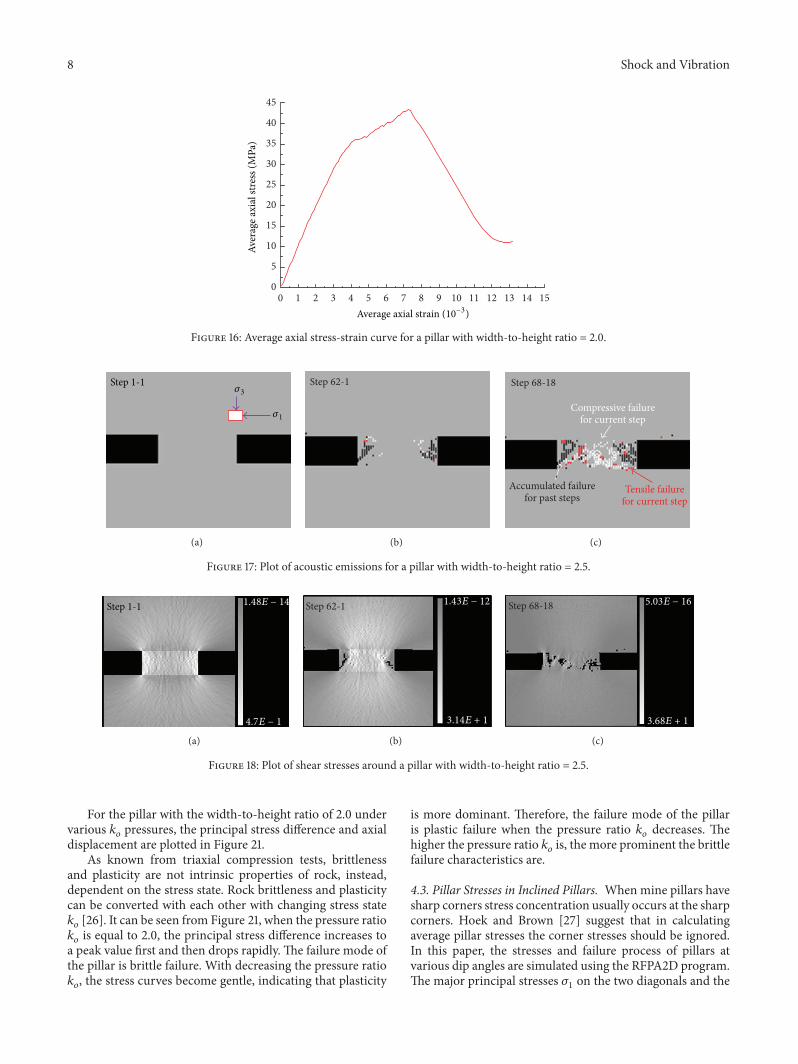
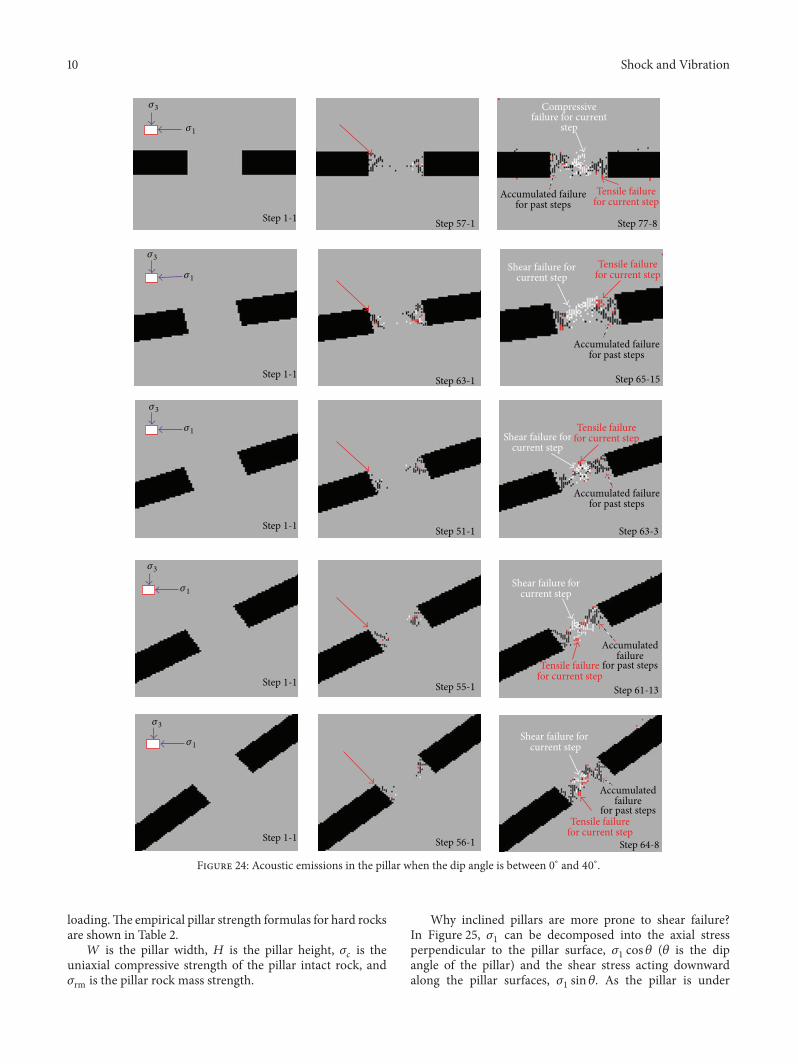
When the width-to-height ratio is 2.0, a small amount ofacoustic emissions and microcracks occurs first at the pillarcorners (Figure 14(b)) and increases towards the centre ofthe pillar as shown in Figure 14(c) where there is a greatamount of acoustic emissions occurring at that loading stage,indicating that the pillar has reached its ultimate supportcapacity. It can be seen from the corresponding stress-straincurve shown in Figure 16 that the average pillar strength is43.4MPa. As shown in Figure 14(c), cracks are formed on thepillar surface and coalesce at the central region, leading toformation of a compressive failure zone. Figure 15 shows plotof shear stresses around a pillar with width-to-height ratio =2.0.
Shock and Vibration 5
Step 1-1 𝜎3
𝜎1
(a)
Step 82-1
Tensile failurefor current step
Compressivefailure for current
step
Accumulated failurefor past steps
(b)
Step 86-1
(c)
Figure 5: Plot of acoustic emissions for a pillar with width-to-height ratio = 0.5.
Step 1-1 2.97E − 13
1.93E + 1
(a)
Step 82-1 2.82E − 15
2.39E − 1
(b)
Step 86-1 1.43E − 12
1.95E + 1
(c)
Figure 6: Plot of shear stresses around a pillar with width-to-height ratio = 0.5.
0 1 2 3 4 5 60
5
10
15
20
25
30
35
40
Aver
age a
xial
stre
ss (M
Pa)
Average axial strain (10−3)
Figure 7: Average axial stress-strain curve for a pillar with width-to-height ratio = 0.5.
Step 1-1 𝜎3
𝜎1
(a)
Step 70-1
Tensile failurefor current step
Compressive failurefor current step
Accumulated failurefor past steps
(b)
Step 75-1
(c)
Figure 8: Plot of acoustic emissions for a pillar with width-to-height ratio = 1.0.
6 Shock and Vibration
Step 1-1 6.42E − 14
1.29E + 00
(a)
Step 70-1 1.71E − 12
1.97E + 1
(b)
Step 75-1 1.47E − 12
1.97E + 1
(c)
Figure 9: Plot of shear stresses around a pillar with width-to-height ratio = 1.0.
0 1 2 3 4 5 6 7 80
5
10
15
20
25
30
35
40
Aver
age a
xial
stre
ss (M
Pa)
Average axial strain (10−3)
Figure 10: Average axial stress-strain curve for a pillar with width-to-height ratio = 1.0.
Step 1-1 𝜎3
𝜎1
(a)
Step 68-1
Tensile failurefor current step
Compressive failurefor current step Accumulated failure
for past steps
(b)
Step 70-1
(c)
Figure 11: Plot of acoustic emissions for a pillar with width-to-height ratio = 1.5.
Step 1-12.21E − 14
3.76E − 1
(a)
Step 68-12.53E − 12
3.02E + 1
(b)
Step 70-13.47E − 12
2.61E + 1
(c)
Figure 12: Plot of shear stresses around a pillar with width-to-height ratio = 1.5.
Shock and Vibration 7
0 1 2 3 4 5 6 7 8 9 10 11 120
5
10
15
20
25
30
35
40
Aver
age a
xial
stre
ss (M
Pa)
Average axial strain (10−3)
Figure 13: Average axial stress-strain curve for a pillar with width-to-height ratio = 1.5.
Step 1-1 𝜎3
𝜎1
(a)
Step 56-1
(b)
Step 77-12
Tensile failurefor current step
Compressivefailure for current
step
Accumulated failure for past steps
(c)
Figure 14: Plot of acoustic emissions for a pillar with width-to-height ratio = 2.0.
Step 1-1 2.54E − 12
4.3E − 1
(a)
Step 56-1 1.5E − 12
2.78E + 1
(b)
Step 77-12 3.48E − 13
3.08E + 1
(c)
Figure 15: Plot of shear stresses around a pillar with width-to-height ratio = 2.0.
As can be seen fromFigures 17 and 18, the failuremodes ofthe pillars with width-to-height ratios of 2 and 2.5 are similar.The average pillar strength is 44.9MPa for the pillar W/Hratio of 2.5 indicating an increased pillar strength by 3.4%compared to the case withW/H = 2.0 (Figure 19).
The simulation results indicate that, with increasing pillarsize, shear band failure from the surface to the interior is themain failure mode. Elastic stresses start to build up at thepillar edges and stress concentration rises at these points, andthe pillar edge failure leads to stress concentration shiftingtowards the pillar core. Therefore, failure first occurs on thepillar surface and gradually develops towards the core of thepillar.
4.2. Effects of Various Pillar Inclinationson Pillar Strength. Asshown in Figure 20, the pillar strength increases with increas-ing width-to-height ratio. When the orebody is horizontal,the strength that the pillar can sustain is higher than thatin case of an inclined orebody and confirms the findings bySuorineni et al. [10].
Generally speaking, larger rocks contain greater amountof weak structural planes, which is the main cause of lowerpillar strength for the pillar with certain width-to-heightratio. Hence, the bearing capacity of the pillar increasesand then keeps constant when the width-to-height ratioincreases to enough large value (the height remains con-stant).
8 Shock and Vibration
0 1 2 3 4 5 6 7 8 9 10 11 12 13 14 150
5
10
15
20
25
30
35
40
45
Aver
age a
xial
stre
ss (M
Pa)
Average axial strain (10−3)
Figure 16: Average axial stress-strain curve for a pillar with width-to-height ratio = 2.0.
Step 1-1𝜎3
𝜎1
(a)
Step 62-1
(b)
Step 68-18
Tensile failurefor current step
Accumulated failurefor past steps
Compressive failurefor current step
(c)
Figure 17: Plot of acoustic emissions for a pillar with width-to-height ratio = 2.5.
Step 1-1 1.48E − 14
4.7E − 1
(a)
Step 62-1 1.43E − 12
3.14E + 1
(b)
Step 68-18 5.03E − 16
3.68E + 1
(c)
Figure 18: Plot of shear stresses around a pillar with width-to-height ratio = 2.5.
For the pillar with the width-to-height ratio of 2.0 undervarious 𝑘
𝑜pressures, the principal stress difference and axial
displacement are plotted in Figure 21.As known from triaxial compression tests, brittleness
and plasticity are not intrinsic properties of rock, instead,dependent on the stress state. Rock brittleness and plasticitycan be converted with each other with changing stress state𝑘𝑜[26]. It can be seen from Figure 21, when the pressure ratio𝑘𝑜is equal to 2.0, the principal stress difference increases to
a peak value first and then drops rapidly. The failure mode ofthe pillar is brittle failure. With decreasing the pressure ratio𝑘𝑜, the stress curves become gentle, indicating that plasticity
is more dominant. Therefore, the failure mode of the pillaris plastic failure when the pressure ratio 𝑘
𝑜decreases. The
higher the pressure ratio 𝑘𝑜is, the more prominent the brittle
failure characteristics are.
4.3. Pillar Stresses in Inclined Pillars. When mine pillars havesharp corners stress concentration usually occurs at the sharpcorners. Hoek and Brown [27] suggest that in calculatingaverage pillar stresses the corner stresses should be ignored.In this paper, the stresses and failure process of pillars atvarious dip angles are simulated using the RFPA2D program.The major principal stresses 𝜎
1on the two diagonals and the

Shock and Vibration 9
0 2 4 6 8 10 12 14 16 18 20 22 240
5
10
15
20
25
30
35
40
45
50
Aver
age a
xial
stre
ss (M
Pa)
Average axial strain (10−3)Figure 19: Average axial stress-strain around a pillar with width-to-height ratio = 2.5.
0.5 1.0 1.5 2.0 2.5 3.020
30
40
50
60
70
80
Pilla
r stre
ngth
(MPa
)
Width to height ratio
Horizontal orebodyOrebody inclined at 10Orebody inclined at 20
Orebody inclined at 30Orebody inclined at 40
Figure 20: Pillar strength at various inclinations for various width-to-height ratios for 𝑘
𝑜of 1.5.
0 5 10 15 20 25 300
4
8
12
16
20
24
28
32
Axial displacement (mm)
𝜎1−𝜎3
(MPa
)
ko = 0.5
ko = 1.0
ko = 1.5
ko = 2.0
Figure 21: Variations of principal stress difference with axialdisplacement for various pressures ratios, 𝑘
𝑜.
0 5 10 15 20 25 30 350
10
20
30
40
50
60
70
80
Distance from first point (m)
Main diagonalHorizontal axisVice diagonal
Pillar
𝜎1
(MPa
)
Figure 22: Variation of 𝜎1 with distance from the first point (dipangle = 0∘).
0 5 10 15 20 25 3010
15
20
25
30
35
40
45
50
Distance from first point (m)
Main diagonalHorizontal axisVice diagonal
Pillar
𝜎1
(MPa
)
𝜃
Figure 23: Variation of 𝜎1 with distance from the first point (dipangle = 10).
horizontal axis at midheight of the pillar are plotted as shownin Figures 22 and 23 for a vertical pillar and an inclined pillar,respectively.
As can be seen from Figures 22 and 23, stress concentra-tion occurs in the four corners of the pillar. In order to betterexplain microcracking initiated at the four corners, acousticemissions in a pillar with a width-to-height ratio of 2.0 underthe pressure ratio 𝑘
𝑜of 1.0 are shown as an example.
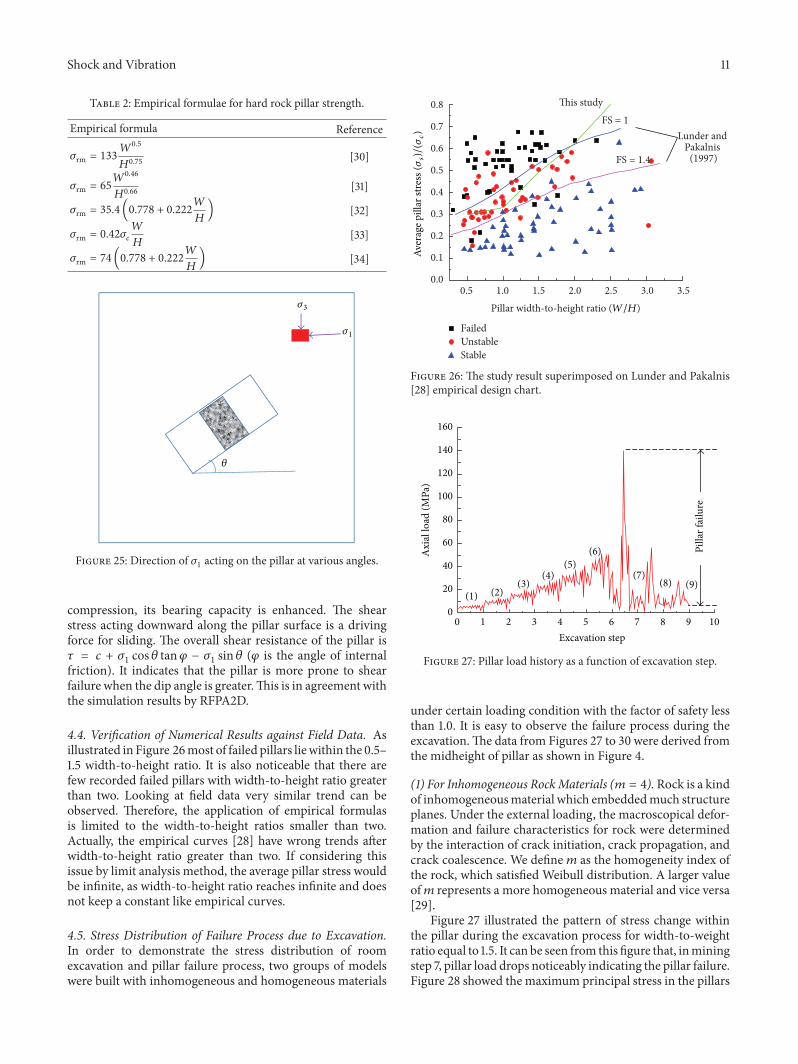
It can be seen from Figure 24 that acoustic emissions ormicrocracking first occurs near the four corners. With theincrease of loading, acoustic emissions propagate across thepillar. At the same time, microcracks lead to the formation ofa shear band across the pillar.
Suorineni et al. [9, 10] asked if the empirical pillar strengthformulas are still applicable to pillars subjected to shear
10 Shock and Vibration
Step 1-1 Step 57-1 Step 77-8
Step 63-1 Step 65-15
Step 51-1 Step 63-3
Step 61-13Step 55-1
Step 1-1
Step 1-1
Step 1-1
Step 1-1 Step 56-1 Step 64-8
Shear failure forcurrent step
Tensile failurefor current step
Accumulated failurefor past steps
Shear failure forcurrent step
Tensile failurefor current step
Accumulated failurefor past steps
Shear failure forcurrent step
Tensile failurefor current step
Accumulatedfailure
for past steps
Accumulatedfailure
for past steps
Compressivefailure for current
step
Accumulated failurefor past steps
Tensile failurefor current step
Shear failure for current step
Tensile failurefor current step
𝜎3
𝜎1
𝜎3
𝜎1
𝜎3
𝜎1
𝜎3
𝜎1
𝜎3
𝜎1
Figure 24: Acoustic emissions in the pillar when the dip angle is between 0∘ and 40∘.
loading.The empirical pillar strength formulas for hard rocksare shown in Table 2.𝑊 is the pillar width, 𝐻 is the pillar height, 𝜎
𝑐is the
uniaxial compressive strength of the pillar intact rock, and𝜎rm is the pillar rock mass strength.
Why inclined pillars are more prone to shear failure?In Figure 25, 𝜎
1can be decomposed into the axial stress
perpendicular to the pillar surface, 𝜎1cos 𝜃 (𝜃 is the dip
angle of the pillar) and the shear stress acting downwardalong the pillar surfaces, 𝜎
1sin 𝜃. As the pillar is under
Shock and Vibration 11
Table 2: Empirical formulae for hard rock pillar strength.
Empirical formula Reference
𝜎rm = 133𝑊0.5
𝐻0.75
[30]
𝜎rm = 65𝑊0.46
𝐻0.66
[31]
𝜎rm = 35.4 (0.778 + 0.222𝑊
𝐻
) [32]
𝜎rm = 0.42𝜎𝑐𝑊
𝐻
[33]
𝜎rm = 74 (0.778 + 0.222𝑊
𝐻
) [34]
𝜎3
𝜎1
𝜃
Figure 25: Direction of 𝜎1acting on the pillar at various angles.
compression, its bearing capacity is enhanced. The shearstress acting downward along the pillar surface is a drivingforce for sliding. The overall shear resistance of the pillar is𝜏 = 𝑐 + 𝜎
1cos 𝜃 tan𝜑 − 𝜎
1sin 𝜃 (𝜑 is the angle of internal
friction). It indicates that the pillar is more prone to shearfailure when the dip angle is greater.This is in agreement withthe simulation results by RFPA2D.
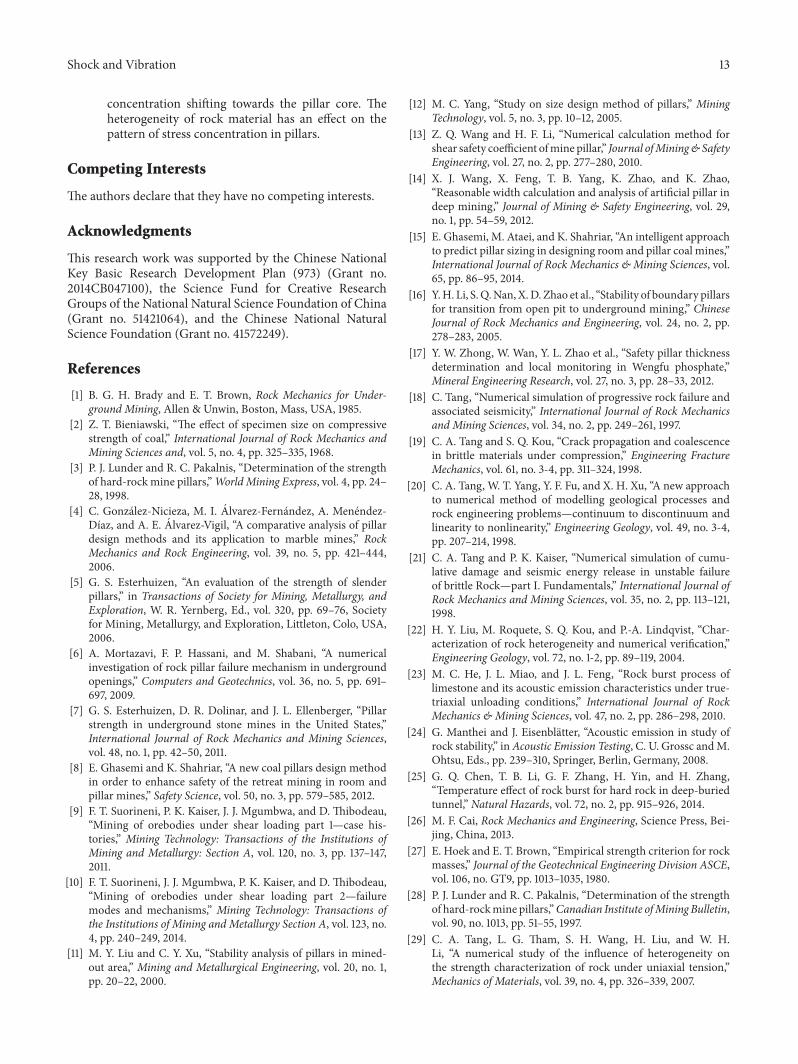
4.4. Verification of Numerical Results against Field Data. Asillustrated in Figure 26most of failed pillars liewithin the 0.5–1.5 width-to-height ratio. It is also noticeable that there arefew recorded failed pillars with width-to-height ratio greaterthan two. Looking at field data very similar trend can beobserved. Therefore, the application of empirical formulasis limited to the width-to-height ratios smaller than two.Actually, the empirical curves [28] have wrong trends afterwidth-to-height ratio greater than two. If considering thisissue by limit analysis method, the average pillar stress wouldbe infinite, as width-to-height ratio reaches infinite and doesnot keep a constant like empirical curves.
4.5. Stress Distribution of Failure Process due to Excavation.In order to demonstrate the stress distribution of roomexcavation and pillar failure process, two groups of modelswere built with inhomogeneous and homogeneous materials
0.5 1.0 1.5 2.0 2.5 3.0 3.50.0
0.1
0.2
0.3
0.4
0.5
0.6
0.7
0.8
FS = 1.4
FS = 1
FailedUnstableStable
This study
Pillar width-to-height ratio (W/H)
Lunder and Pakalnis
(1997)
Aver
age p
illar
stre
ss(𝜎
s)/(𝜎
c)
Figure 26: The study result superimposed on Lunder and Pakalnis[28] empirical design chart.
0 1 2 3 4 5 6 7 8 9 100
20
40
60
80
100
120
140
160
(9)(8)(7)
(6)(5)
(4)(3)
(2)
Axi
al lo
ad (M
Pa)
Excavation step
(1)
Pilla
r fai
lure
Figure 27: Pillar load history as a function of excavation step.
under certain loading condition with the factor of safety lessthan 1.0. It is easy to observe the failure process during theexcavation.The data from Figures 27 to 30 were derived fromthe midheight of pillar as shown in Figure 4.
(1) For Inhomogeneous RockMaterials (𝑚 = 4).Rock is a kindof inhomogeneousmaterial which embeddedmuch structureplanes. Under the external loading, the macroscopical defor-mation and failure characteristics for rock were determinedby the interaction of crack initiation, crack propagation, andcrack coalescence. We define 𝑚 as the homogeneity index ofthe rock, which satisfied Weibull distribution. A larger valueof𝑚 represents a more homogeneous material and vice versa[29].
Figure 27 illustrated the pattern of stress change withinthe pillar during the excavation process for width-to-weightratio equal to 1.5. It can be seen from this figure that, inminingstep 7, pillar load drops noticeably indicating the pillar failure.Figure 28 showed the maximum principal stress in the pillars

12 Shock and Vibration
0 5 10 15 20 250
20
40
60
80
100
120
140
160
Measuring point along pillar
No ExcavationExcavation step 2Excavation step 4
Excavation step 6Excavation step 8Excavation step 9
Location of pillar monitoring point
Max
prin
cipa
l stre
ss in
pill
ar (M
Pa)
Figure 28: Pattern of stress change within the pillar during theexcavation process,𝑊/𝐻 = 1.5.
0 1 2 3 4 5 6 7 8 9 100
10
20
30
40
50
60
70
80
(7)
(6)
(5)
(4)(3)
(2)
Axi
al lo
ad (M
Pa)
Excavation step
(1)
Pilla
r fai
lure
Figure 29: Pillar load history as a function of excavation step.
during excavation process. As can be seen from the figure,before excavation, the magnitude of maximum principalstress is equal to the in situ principal stress. As excavationstarted on both sides of pillar, the maximum principal stressstarted to build up at the edges of pillars. This is followed bythe pillar edge failure leading to stress concentration shiftingtowards the pillar core (shown in Figure 28 step 7). Pillar corefailure implied that the entire pillar lost its support capacityand the stress decreased sharply (shown in Figure 28 step 9).
(2) For Homogenous Rock Materials (𝑚 = 100). Figures29 and 30 have the same trend with Figures 27 and 28,however, which curves keep more smoother. Moreover, sincehomogeneous materials were adopted in this case, stressconcentration is insignificant and peak value of curves is lessthan inhomogeneous materials cases.
0 2 4 6 8 10 12 14 16 18 200
15
30
45
60
75
90
Measuring point along pillar
No ExcavationExcavation step 2Excavation step 4
Excavation step 6Excavation step 8Excavation step 9
Location of pillar monitoring point
Max
prin
cipa
l stre
ss in
pill
ar (M
Pa)
Figure 30: Pattern of stress change within the pillar during theexcavation process,𝑊/𝐻 = 1.5.
5. Conclusions
By simulating the failure process of pillars with different dipangles and the stress ratio 𝑘
𝑜using the rock failure process
analysis program, the following conclusions can be drawn:
(1) Shear failure often occurs in orebody under shearloading. The failure of pillars subject to shear stressesis related to the increase of the pressure ratio 𝑘
𝑜and
the increase of brittleness.(2) The application of empirical formulas is limited to the
width-to-height ratios smaller than two. Actually, theempirical curves [28] have wrong trends after width-to-height ratio greater than two, as most empiricaldesign charts and formulas for pillars only considerthe axial strength and neglect insufficiency in shearstrength. Hence, they are not applicable for orebodyunder shear loading.
(3) In a dipping orebody, 𝜎1acts on the orebody similar
to gravity. It has an obliquely downward component.As a result, the pillar under shear stress is more proneto failure. Therefore, the angle between 𝜎
1and the
orebody is another factor for pillar rock bursts.(4) With increasing dip angle of the pillar, stress con-
centration first appears at the four corners, leadingto microcracking. As the stress in the pillar con-tinuously increases, microcracks gradually coalesce.Subsequently, shear band occurs across the pillar andfailure occurs.Therefore, it is inappropriate to neglectthe corner stresses for determination of average stressin the pillar.
(5) The pattern of stress changes within the pillar asexcavation proceeds. Elastic stresses start to build upat the pillar edges and stress concentration rises atthese points, and the pillar edge failure leads to stress
Shock and Vibration 13
concentration shifting towards the pillar core. Theheterogeneity of rock material has an effect on thepattern of stress concentration in pillars.
Competing Interests
The authors declare that they have no competing interests.
Acknowledgments
This research work was supported by the Chinese NationalKey Basic Research Development Plan (973) (Grant no.2014CB047100), the Science Fund for Creative ResearchGroups of the National Natural Science Foundation of China(Grant no. 51421064), and the Chinese National NaturalScience Foundation (Grant no. 41572249).
References
[1] B. G. H. Brady and E. T. Brown, Rock Mechanics for Under-ground Mining, Allen & Unwin, Boston, Mass, USA, 1985.
[2] Z. T. Bieniawski, “The effect of specimen size on compressivestrength of coal,” International Journal of Rock Mechanics andMining Sciences and, vol. 5, no. 4, pp. 325–335, 1968.
[3] P. J. Lunder and R. C. Pakalnis, “Determination of the strengthof hard-rock mine pillars,”WorldMining Express, vol. 4, pp. 24–28, 1998.
[4] C. Gonzalez-Nicieza, M. I. Alvarez-Fernandez, A. Menendez-Dıaz, and A. E. Alvarez-Vigil, “A comparative analysis of pillardesign methods and its application to marble mines,” RockMechanics and Rock Engineering, vol. 39, no. 5, pp. 421–444,2006.
[5] G. S. Esterhuizen, “An evaluation of the strength of slenderpillars,” in Transactions of Society for Mining, Metallurgy, andExploration, W. R. Yernberg, Ed., vol. 320, pp. 69–76, Societyfor Mining, Metallurgy, and Exploration, Littleton, Colo, USA,2006.
[6] A. Mortazavi, F. P. Hassani, and M. Shabani, “A numericalinvestigation of rock pillar failure mechanism in undergroundopenings,” Computers and Geotechnics, vol. 36, no. 5, pp. 691–697, 2009.
[7] G. S. Esterhuizen, D. R. Dolinar, and J. L. Ellenberger, “Pillarstrength in underground stone mines in the United States,”International Journal of Rock Mechanics and Mining Sciences,vol. 48, no. 1, pp. 42–50, 2011.
[8] E. Ghasemi and K. Shahriar, “A new coal pillars design methodin order to enhance safety of the retreat mining in room andpillar mines,” Safety Science, vol. 50, no. 3, pp. 579–585, 2012.
[9] F. T. Suorineni, P. K. Kaiser, J. J. Mgumbwa, and D. Thibodeau,“Mining of orebodies under shear loading part 1—case his-tories,” Mining Technology: Transactions of the Institutions ofMining and Metallurgy: Section A, vol. 120, no. 3, pp. 137–147,2011.
[10] F. T. Suorineni, J. J. Mgumbwa, P. K. Kaiser, and D. Thibodeau,“Mining of orebodies under shear loading part 2—failuremodes and mechanisms,” Mining Technology: Transactions ofthe Institutions of Mining and Metallurgy Section A, vol. 123, no.4, pp. 240–249, 2014.
[11] M. Y. Liu and C. Y. Xu, “Stability analysis of pillars in mined-out area,” Mining and Metallurgical Engineering, vol. 20, no. 1,pp. 20–22, 2000.
[12] M. C. Yang, “Study on size design method of pillars,” MiningTechnology, vol. 5, no. 3, pp. 10–12, 2005.
[13] Z. Q. Wang and H. F. Li, “Numerical calculation method forshear safety coefficient ofmine pillar,” Journal ofMining&SafetyEngineering, vol. 27, no. 2, pp. 277–280, 2010.
[14] X. J. Wang, X. Feng, T. B. Yang, K. Zhao, and K. Zhao,“Reasonable width calculation and analysis of artificial pillar indeep mining,” Journal of Mining & Safety Engineering, vol. 29,no. 1, pp. 54–59, 2012.
[15] E. Ghasemi, M. Ataei, and K. Shahriar, “An intelligent approachto predict pillar sizing in designing room and pillar coal mines,”International Journal of Rock Mechanics & Mining Sciences, vol.65, pp. 86–95, 2014.
[16] Y.H. Li, S.Q.Nan,X.D. Zhao et al., “Stability of boundary pillarsfor transition from open pit to underground mining,” ChineseJournal of Rock Mechanics and Engineering, vol. 24, no. 2, pp.278–283, 2005.
[17] Y. W. Zhong, W. Wan, Y. L. Zhao et al., “Safety pillar thicknessdetermination and local monitoring in Wengfu phosphate,”Mineral Engineering Research, vol. 27, no. 3, pp. 28–33, 2012.
[18] C. Tang, “Numerical simulation of progressive rock failure andassociated seismicity,” International Journal of Rock Mechanicsand Mining Sciences, vol. 34, no. 2, pp. 249–261, 1997.
[19] C. A. Tang and S. Q. Kou, “Crack propagation and coalescencein brittle materials under compression,” Engineering FractureMechanics, vol. 61, no. 3-4, pp. 311–324, 1998.
[20] C. A. Tang, W. T. Yang, Y. F. Fu, and X. H. Xu, “A new approachto numerical method of modelling geological processes androck engineering problems—continuum to discontinuum andlinearity to nonlinearity,” Engineering Geology, vol. 49, no. 3-4,pp. 207–214, 1998.
[21] C. A. Tang and P. K. Kaiser, “Numerical simulation of cumu-lative damage and seismic energy release in unstable failureof brittle Rock—part I. Fundamentals,” International Journal ofRock Mechanics and Mining Sciences, vol. 35, no. 2, pp. 113–121,1998.
[22] H. Y. Liu, M. Roquete, S. Q. Kou, and P.-A. Lindqvist, “Char-acterization of rock heterogeneity and numerical verification,”Engineering Geology, vol. 72, no. 1-2, pp. 89–119, 2004.
[23] M. C. He, J. L. Miao, and J. L. Feng, “Rock burst process oflimestone and its acoustic emission characteristics under true-triaxial unloading conditions,” International Journal of RockMechanics & Mining Sciences, vol. 47, no. 2, pp. 286–298, 2010.
[24] G. Manthei and J. Eisenblatter, “Acoustic emission in study ofrock stability,” inAcoustic Emission Testing, C. U. Grossc andM.Ohtsu, Eds., pp. 239–310, Springer, Berlin, Germany, 2008.
[25] G. Q. Chen, T. B. Li, G. F. Zhang, H. Yin, and H. Zhang,“Temperature effect of rock burst for hard rock in deep-buriedtunnel,” Natural Hazards, vol. 72, no. 2, pp. 915–926, 2014.
[26] M. F. Cai, Rock Mechanics and Engineering, Science Press, Bei-jing, China, 2013.
[27] E. Hoek and E. T. Brown, “Empirical strength criterion for rockmasses,” Journal of the Geotechnical Engineering Division ASCE,vol. 106, no. GT9, pp. 1013–1035, 1980.
[28] P. J. Lunder and R. C. Pakalnis, “Determination of the strengthof hard-rockmine pillars,”Canadian Institute ofMining Bulletin,vol. 90, no. 1013, pp. 51–55, 1997.
[29] C. A. Tang, L. G. Tham, S. H. Wang, H. Liu, and W. H.Li, “A numerical study of the influence of heterogeneity onthe strength characterization of rock under uniaxial tension,”Mechanics of Materials, vol. 39, no. 4, pp. 326–339, 2007.

14 Shock and Vibration
[30] D. G. F. Hedley and F. Grant, “Stope-and-pillar design for theElliot Lake Uranium mines,” Bulletin of the Canadian Instituteof Mining and Metallurgy, vol. 65, pp. 37–44, 1972.
[31] M. R. Von Kimmelmann, B. Hyde, and R. J. Madgwick, “Theuse of computer applications at BCL limited in planning pillarmextraction and design of mining layouts,” in Proceedings ofthe ISRM Symposium: Design and Performance of UndergroundExcavations, E. T. Brown and J. A. Hudson, Eds., pp. 53–63,British Geotechnical Society, Cambridge, UK, September 1984.
[32] N. Krauland and P. E. Soder, “Determining pillar strength frompillar failure observations,” Engineering & Mining Journal, vol.8, pp. 34–40, 1987.
[33] Y. Potvin,M.R.Hudyma, andH.D. S.Miller, “Design guidelinesfor open stope support,” Bulletin of the Canadian Institute ofMining and Metallurgy, vol. 82, pp. 53–62, 1989.
[34] J. Sjoberg, “Failure modes and pillar behaviour in the Zinkgru-van mine,” in Proceedings of 33rd U.S. Rock Mechanics Sympo-sium, J. A. Tillerson and W. R. Wawersik, Eds., pp. 491–500, A.A. Balkema, Rotterdam, The Netherlands, 1992.

International Journal of
AerospaceEngineeringHindawi Publishing Corporationhttp://www.hindawi.com Volume 2014
RoboticsJournal of
Hindawi Publishing Corporationhttp://www.hindawi.com Volume 2014
Hindawi Publishing Corporationhttp://www.hindawi.com Volume 2014
Active and Passive Electronic Components
Control Scienceand Engineering
Journal of
Hindawi Publishing Corporationhttp://www.hindawi.com Volume 2014
International Journal of
RotatingMachinery
Hindawi Publishing Corporationhttp://www.hindawi.com Volume 2014
Hindawi Publishing Corporation http://www.hindawi.com
Journal ofEngineeringVolume 2014
Submit your manuscripts athttp://www.hindawi.com
VLSI Design
Hindawi Publishing Corporationhttp://www.hindawi.com Volume 2014
Hindawi Publishing Corporationhttp://www.hindawi.com Volume 2014
Shock and Vibration
Hindawi Publishing Corporationhttp://www.hindawi.com Volume 2014
Civil EngineeringAdvances in
Acoustics and VibrationAdvances in
Hindawi Publishing Corporationhttp://www.hindawi.com Volume 2014
Hindawi Publishing Corporationhttp://www.hindawi.com Volume 2014
Electrical and Computer Engineering
Journal of
Advances inOptoElectronics
Hindawi Publishing Corporation http://www.hindawi.com
Volume 2014
The Scientific World JournalHindawi Publishing Corporation http://www.hindawi.com Volume 2014
SensorsJournal of
Hindawi Publishing Corporationhttp://www.hindawi.com Volume 2014
Modelling & Simulation in EngineeringHindawi Publishing Corporation http://www.hindawi.com Volume 2014
Hindawi Publishing Corporationhttp://www.hindawi.com Volume 2014
Chemical EngineeringInternational Journal of Antennas and
Propagation
International Journal of
Hindawi Publishing Corporationhttp://www.hindawi.com Volume 2014
Hindawi Publishing Corporationhttp://www.hindawi.com Volume 2014
Navigation and Observation
International Journal of
Hindawi Publishing Corporationhttp://www.hindawi.com Volume 2014
DistributedSensor Networks
International Journal of