Embed Size (px)
Citation preview
IBIMA Publishing
Journal of Eastern Europe Research in Business and Economics
http://www.ibimapublishing.com/journals/JEERBE/jeerbe.html
Vol. 2013 (2013), Article ID 400361, 9 pages
DOI: 10.5171/2013. 400361
_______________
Cite this Article as: Stoian Elena, Vlad Ionela Mituko, Dinu Toma Adrian, Fintineru Gina and Temocico Georgeta (2013), " Issues Connected to the Trade of Flowers in Romania,” Journal of Eastern Europe Research in Business and Economics, Vol. 2013 (2013), Article ID 400361, DOI: 10.5171/2013. 400361.
Research Article
Issues Connected to the Trade of Flowers
in Romania
Stoian Elena, Vlad Ionela Mituko, Dinu Toma Adrian, Fintineru Gina and Temocico Georgeta
University of Agricultural Sciences and Veterinary Medicine of Bucharest, Romania
Correspondence should be addressed to: Vlad Ionela Mituko; [email protected]
Received date: 15 April 2013; Accepted date: 10 July 2013; Published date: 11 September 2013
Academic Editor: Anca Dunarintu
Copyright © 2013. Stoian Elena, Vlad Ionela Mituko, Dinu Toma Adrian, Fintineru Gina and Temocico Georgeta.
Distributed under Creative Commons CC-BY 3.0
Introduction
In the respect of the main goals of the national economic structure for a country, the approach of international specialization explains connections between international trade and economic growth; so, the common point of these approaches is that the trade extension remains the aim of the economic development. In the following are presented several studies addressing issues related to international
exchanges. Regarding the trade among countries, Houck (1988) said that “…A sizeable
cross section of nations is used to provide
statistical analyses of the link between
agricultural productivity and economic
performance, and the link between economic
performance and agricultural imports…”. Then, Koester (1993) stated that “…Agricultural
development is more than only growth in
agricultural production or productivity. However,
Abstract
The paper has been intended to analyze trade of flowers in Romania. The study was focused on dynamics of the supplier countries for importations and destination countries for exportations. In order to design a framework for the international trade there have been assessed several indicators. Further, highlighting the trade of flowers sector, we have chosen to pay attention on the average rate of growth and links among trade figures from data series of the four main categories of flowers. This was done on destination countries and the countries suppliers for the products come from. The data has been provided by the National Statistics Institute (INS), and the Ministry of Agriculture in Romania, and has spread over a period of 10 years, starting in 2002. The results have shown that among the variables analyzed, it was detected an active trend. According to the correlation coefficients, it was stated that pairs of variables analyzed are relatively strongly correlated. The variables that have showed no significant correlation coefficients were the exchange rates for the two main currencies (Euros and the American dollars). The conclusions were that there are real connections among the considered pairs of variables, except the exchange rates which have had their own dynamics and their influence was not found on the other variables analyzed in this study.
Keywords: flower trade, Romania, average rate of growth, correlations
Journal of Eastern Europe Research in Business and Economics 2
___________________________________________________________________________
____________________ Stoian Elena, Vlad Ionela Mituko, Dinu Toma Adrian, Fintineru Gina and Temocico Georgeta (2013), Journal of Eastern Europe Research in Business and Economics, DOI: 10.5171/2013. 400361.
it is argued that other variables which also
indicate agricultural development are often
closely correlated with growth in production and
productivity...”. In its study Winters (2004) concluded that ... "trade liberalisation induces a
temporary (but possibly long-lived) increase in
growth. A major component of this is an increase
in productivity and argues that many of these
respond positively to trade liberalisation". In the same meaning, Anantharaman (2008) was stated that „the increasing numbers of
organizations involved in exporting intensifies the
competition level...”. In the same sense, Kuppusamy (2012) come to the conclusion that "exporting is the most common and widely used
mode to enter into business at the international
level. Export performance is crucial to identify the
performance level of the organization ....”. On national field, Lădaru and Beciu (2012) said that “…trade has a major proportion in small and medium enterprises activities, in all the Romanian areas”. The European Union acts, on trade issues, as a single entity trough a common trade policy and enforced its actions with trade agreements negotiated by the European Commission, with means of the EU Treaty (TEU), establishing the aims and the objectives of EU´s trade policy. (Source: Europe in figures – Eurostat yearbook 2011, Eurostat). Regarding Romania, as a part of the European Union since 2007, and „in order to meet the requirements of
the Single Market it has been claimed an
economic effort, as the employment of the
European customs tariff assumed both
advantages and disadvantages for the its
economy”. (Neculiţă, Şarpe, and Cristea 2011). Lastly, studies on trade are useful for the businesses which will use trade statistics to carry out research and define strategies to their partners and products. This article examines Romania’s trade framework, explores the links between trade and some other variables and thus, in doing so, it offers sustained analysis and economic information on Romanian exchanges. In Romania, the share in Gross Domestic Products of trade in goods and services, recorded major differences compare to the European average. On the overall, in the last years, Romanian exports and imports for goods are about four times bigger than exports for services. The interest in transnational trade of flowers and ornamental plants allowed the appearance and development of the connected axis exporting those products where there's demand, with a whole regulation mechanism and specific indicators. For sure, there are many methodological challenges and interpretation
about the strengths and the obviousness in international trade. Therefore, the necessity of this study rised from the importance of the knowledge of those factors on the exchanges outflows and the destination countries. For Romanian agricultural trade, the share of the European trade with agricultural products represents some 78.7% for imports and 72.8% for exports (2011 data) Source: Romanian Statistical Yearbooks and Ministry of Agriculture.
Materials and methods
In the present study, we have collected and processed chronological data on the international trade. This analysis consisted in calculating the average growth rate, Pearson correlation coefficients among several figures and shaping them thorough an analysis of Romania's trade with flowers. Thus, in the first part it was emphasized analysis by means of the average rate of growth; this is obtained from the average rate of dynamics and calculated as a geometric mean of dynamics index with base in chain determined for the whole series. At its
turn, the dynamics index formula � ̅ = ���/��
allows highlighting the link between the size and dynamics of the fixed base index for the last term of the series. Average rate of growth is a measure, noted � , and can be calculated with the help of �;̅ this has the following formula:
� ̅ = �∏ �� ���⁄����� , and hence, the average rate
of growth is calculated using the formula : � = � ̅ − 1.
The part two stresses on the correlation between pairs of variables. We have choosen data on Romanian agriculture trade, trade with flowers, monthly salary and exchange rates (U.S. Dollars and Euros rates). We may recall here that the correlation coefficient r, which is related to a theoretical distribution derived from time series analysis with T distribution. For such approach and taking into account the factors that put pressure on a phenomenon and may act differently in time, it appeals to different techniques that will express the coordinates of the analyzed developments. Thus, there were summarized and analyzed data which allowed us to calculate and interpret the correlation coefficient between different data sets. The statistical test T is designed and used to verify statistical assumptions, under observance of a minimum error threshold of 5%.
3
___________________________________________________________________________
____________________ Stoian Elena, Vlad Ionela Mituko, Dinu Toma Adrian, Fintineru Gina and Temocico Georgeta Europe Research in Business and Economics
Results and discussions
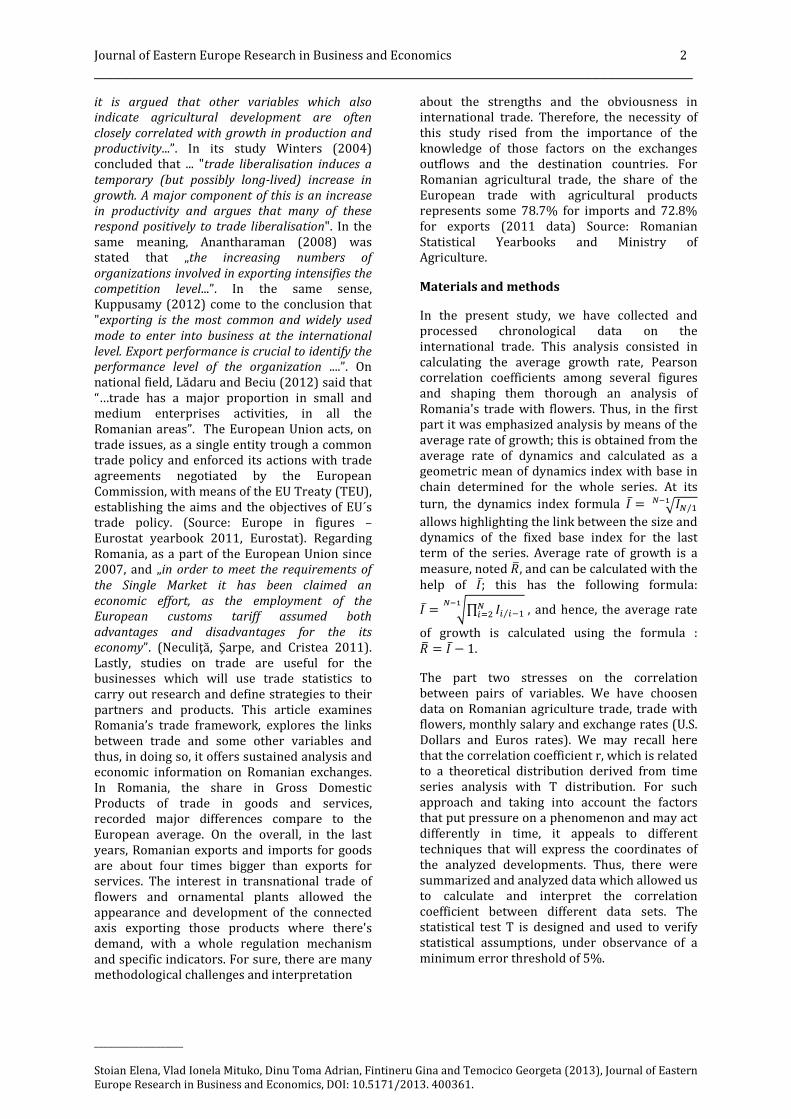
In the first part of the paper there were analyzed seven indicators of a time series average adjustments of the data series
Table 1: Average
No. Variables
1. Romanian food
2. Romanian food
3. Export of Flowers
4. Import of Flowers Volume
5. Net Monthly Salary
6. Euro/Lei exchange rate
7. USD/Lei exchange rate
In the table above, we can observe that the seven datasets analyzed during the period 20022011, the volume of exported flowers and the average USD / Lei exchange rate, had negative growth rates. The other five variables had recorded important average growth rates. The largest increase was registered for the Romanian food export (31.16%), while the lowest average growth was recorded by the
Fig
The items in the database of the international trade were classified according to the Commission Regulation (EC) No 1214/2007 into
-15.00%
0.00%
15.00%
30.00%
45.00%
Ro
ma
nia
n f
oo
d
exp
ort
s v
alu
e
Ro
ma
nia
n f
oo
d
imp
ort
s v
alu
e
Journal of Eastern Europe Research in Business and Economics
___________________________________________________________________________
Dinu Toma Adrian, Fintineru Gina and Temocico Georgeta (2013), Europe Research in Business and Economics, DOI: 10.5171/2013. 400361.
the first part of the paper there were analyzed of a time series (based on
series and the
average rate of growth) for Romanian agricultural trade, the total volume for Romanian trade of flowers, monthly exchange rates of the main currencies in the country (Euros and U.S. dollar2011 periods.
1: Average rates of growth, 2002-2011 periods
Variables Average adjustments of
the data series
Rate of
growth
food exports value 4 541,27 31,16%
food imports value 4 374,27 18,84%
Flowers Volume -458,55 -4,02%
Flowers Volume 51 995,24 21,26%
Salary 369,22 17,35%
exchange rate 1,11 3,43%
exchange rate -0,26 -0,90%
†Lei - is the Romanian national currency
In the table above, we can observe that the seven datasets analyzed during the period 2002-2011, the volume of exported flowers and the average USD / Lei exchange rate, had negative growth rates. The other five variables had
wth rates. The largest increase was registered for the Romanian food export (31.16%), while the lowest average growth was recorded by the
EUR/Lei exchange rate (3.43%). The imported quantities of flowers have also recorded growing volumes (21.26%), but the positive thing is the fact that in Romanian trade with agrproducts, exports have had a much higher growth rate (almost double) thaimports (18.84%). The graphical representation of the average rate of growth among the seven data series is done in the figure below (Fig 1).
Fig. 1: Average rate of growth, 2002-2011
of the international classified according to the
Commission Regulation (EC) No 1214/2007 into
four categories: (1). Bulbs, tubers, tuberous roots, corms, crowns and rhizomes, dormant, in growth or in flower , (2
Exp
ort
of
Flo
we
rs
Vo
lum
e
Imp
ort
of
Flo
we
rs
Vo
lum
e
Ne
t M
on
thly
Sa
lary
Eu
ro/L
ei e
xch
an
ge
rate
Journal of Eastern Europe Research in Business and Economics ___________________________________________________________________________
(2013), Journal of Eastern
rate of growth) for Romanian agricultural trade, the total volume for Romanian trade of flowers, monthly salary and exchange rates of the main currencies in the
and U.S. dollars), during 2002-2011 periods.
Rate of
growth
31,16%
18,84%
4,02%
21,26%
17,35%
3,43%
0,90%
the Romanian national currency
EUR/Lei exchange rate (3.43%). The imported quantities of flowers have also recorded growing volumes (21.26%), but the positive thing is the
Romanian trade with agro-food products, exports have had a much higher growth rate (almost double) than agro-food imports (18.84%). The graphical representation of the average rate of growth among the seven data series is done in the figure below (Fig 1).
. Bulbs, tubers, tuberous roots, corms, crowns and rhizomes, dormant, in
2). Other live plants
US
D/L
ei e
xch
an
ge
rate
Journal of Eastern Europe Research in Business and Economics
___________________________________________________________________________
____________________ Stoian Elena, Vlad Ionela Mituko, Dinu Toma Adrian, Fintineru Gina and Temocico Georgeta Europe Research in Business and Economics
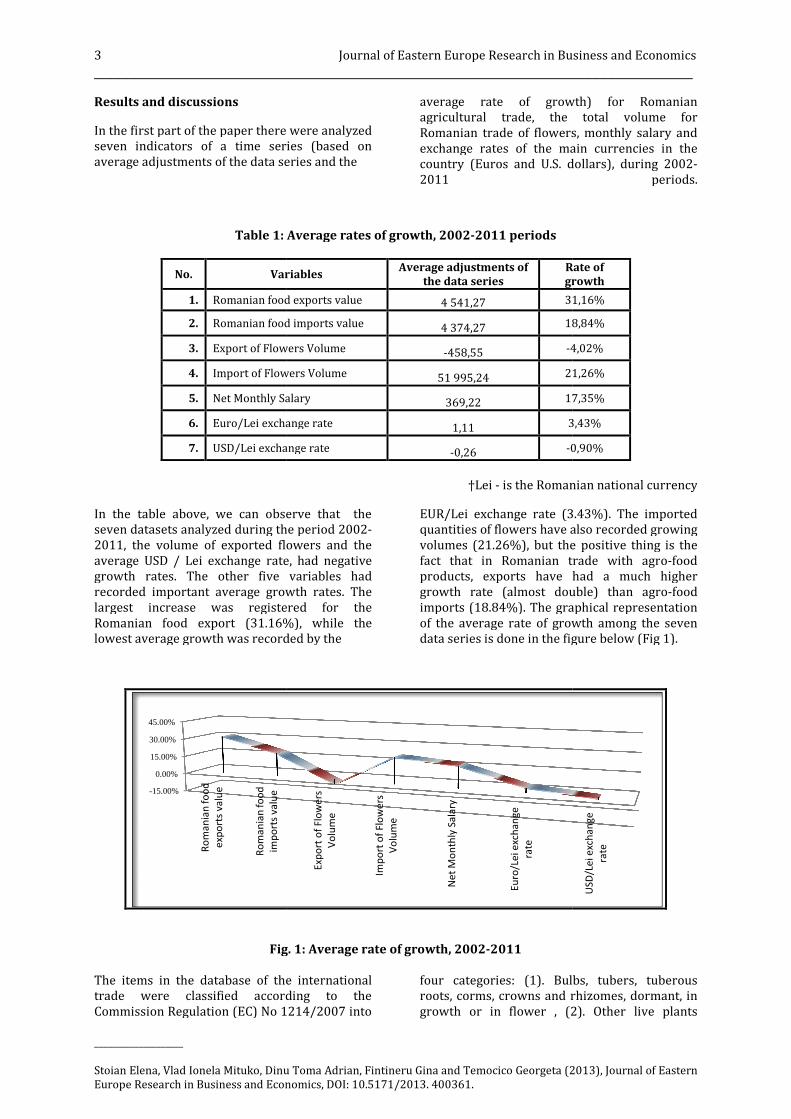
(including their roots), cuttings and slips; mushroom spawn, (3). Cut flowers and flower buds of a kind suitable for bouquets or for ornamental purposes, fresh, dried, dyed, bleached, impregnated or otherwise (4). Foliage, branches and other parts of plants, without flowers or flower buds, and grasses, mosses and lichens, being goods of a kind suitable for bouquets or for ornamental
Fig. 2: The three first
In the graph above there were represented on the leader-board data, exports with flowers of Romania between the countries of destination. Of these, between 2002–2011 period, Hungary stands out in terms of quantity exported flowers (a total volume of 10.536 tonnes worth $ 2.406 thousands), followed by Germany (with a total volume of 2.964 tonnes, worth $ 5.725 thousands), Austria (837 tonnes, amounting to 956 thousand $). The dynamics of total export quantities of flowers and other categories, varied in the period 2002-2011 between 1.484tonnes, with a total value of 742 thousand
0.00%
10.00%
20.00%
30.00%
40.00%
50.00%
60.00%
70.00%
80.00%
Hu
ng
ary
Au
stri
a
Slo
ve
nia
Hu
ng
ary
Slo
ve
nia
Ge
rma
ny
Hu
ng
ary
2002 2003
% from Exports volume
Journal of Eastern Europe Research in Business and Economics
___________________________________________________________________________
Dinu Toma Adrian, Fintineru Gina and Temocico Georgeta (2013), Europe Research in Business and Economics, DOI: 10.5171/2013. 400361.
(including their roots), cuttings and slips; . Cut flowers and flower
buds of a kind suitable for bouquets or for ornamental purposes, fresh, dried, dyed, bleached, impregnated or otherwise prepared
her parts of plants, without flowers or flower buds, and grasses, mosses and lichens, being goods of a kind suitable for bouquets or for ornamental
purposes, fresh, dried, dyed, bleached. Further, we have presented the destination countries for exportation and supplier countries for importation. The main countries where Romania has exported flowers are: HungaryGermany; after the year of our country's EU accession, besides these countries, count Netherlands, Italy figure below are presenteddestination countries
first destinations for the trade of flowers, 2002-2011
represented on exports with flowers of
Romania between the countries of destination. 2011 period, Hungary
stands out in terms of quantity exported flowers s worth $ 2.406
s), followed by Germany (with a total s, worth $ 5.725
es, amounting to The dynamics of total export
quantities of flowers and other categories, 2011 between 1.484
es, with a total value of 742 thousand
dollars (in 2002), and 1.026 tonvalue of $ 2.882 thousand (in the year 2011). The figures that define the total Romanian exports of flowers and other categories, in the period 2002-2011 are as amount exported by 19.204 toncategories existing in the database), 18.476 thousands. In order to analyze the importance of the different groups in terms of quantity and value, we have summarized the following figure (Fig 3).
Hu
ng
ary
Jord
an
Ge
rma
ny
Hu
ng
ary
Ge
rma
ny
Cro
ati
a
Hu
ng
ary
Ge
rma
ny
Cro
ati
a
Hu
ng
ary
Ge
rma
ny
Tu
rcia
Hu
ng
ary
Ge
rma
ny
Au
stri
a
Hu
ng
ary
Ge
rma
ny
Au
stri
a
Hu
ng
ary
Ita
ly
2004 2005 2006 2007 2008 2009 2010
% from Exports volume % from Exports value
4
___________________________________________________________________________
(2013), Journal of Eastern
purposes, fresh, dried, dyed, bleached. Further, the destination countries for
supplier countries for . The main countries where Romania
has exported flowers are: Hungary and after the year of our country's EU
accession, besides these countries, we have been and Austria. In the
are presented the top three export of Romania.
2011 (%)
dollars (in 2002), and 1.026 tonnes, with a total value of $ 2.882 thousand (in the year 2011).
that define the total Romanian exports of flowers and other categories, in the
2011 are as follows: the total amount exported by 19.204 tonnes (the four categories existing in the database), totalling $ 18.476 thousands. In order to analyze the importance of the different groups in terms of quantity and value, we have summarized the
Ita
ly
Ho
lan
de
Hu
ng
ary
Ho
lan
de
Ge
rma
ny
2010 2011
5 Journal of Eastern Europe Research in Business and Economics ___________________________________________________________________________
____________________ Stoian Elena, Vlad Ionela Mituko, Dinu Toma Adrian, Fintineru Gina and Temocico Georgeta (2013), Journal of Eastern Europe Research in Business and Economics, DOI: 10.5171/2013. 400361.
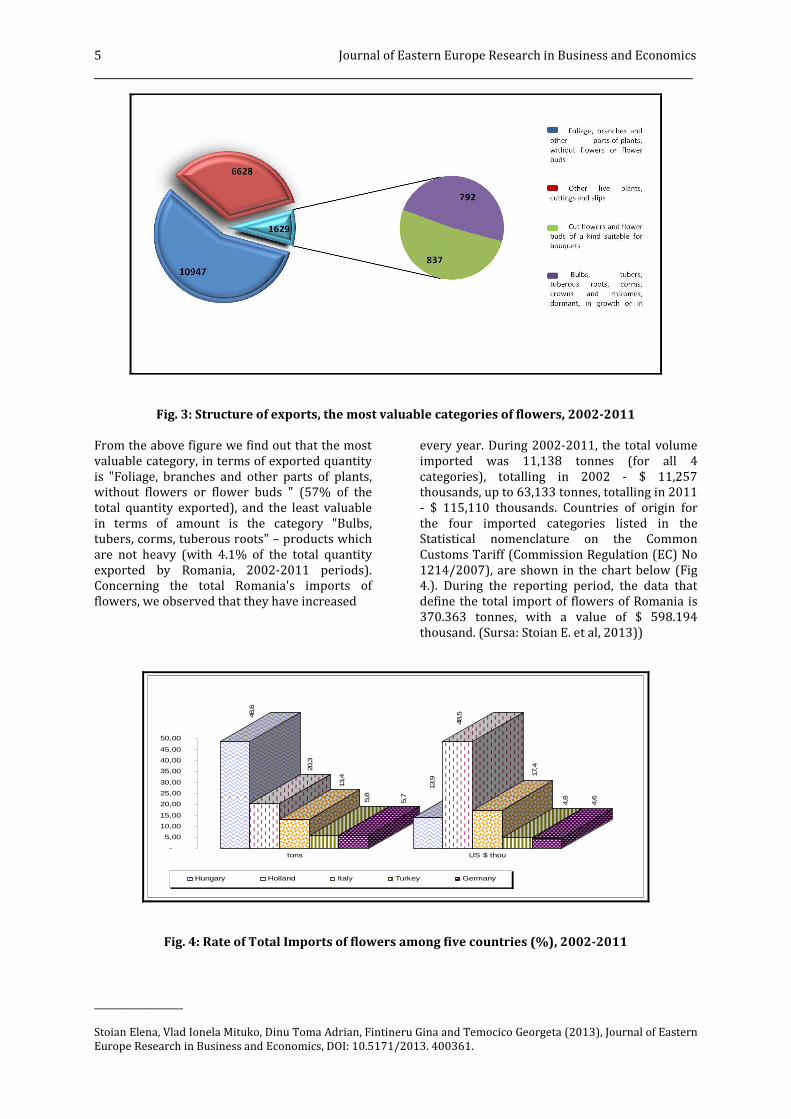
Fig. 3: Structure of exports, the most valuable categories of flowers, 2002-2011
From the above figure we find out that the most valuable category, in terms of exported quantity is "Foliage, branches and other parts of plants, without flowers or flower buds " (57% of the total quantity exported), and the least valuable in terms of amount is the category "Bulbs, tubers, corms, tuberous roots" – products which are not heavy (with 4.1% of the total quantity exported by Romania, 2002-2011 periods). Concerning the total Romania's imports of flowers, we observed that they have increased
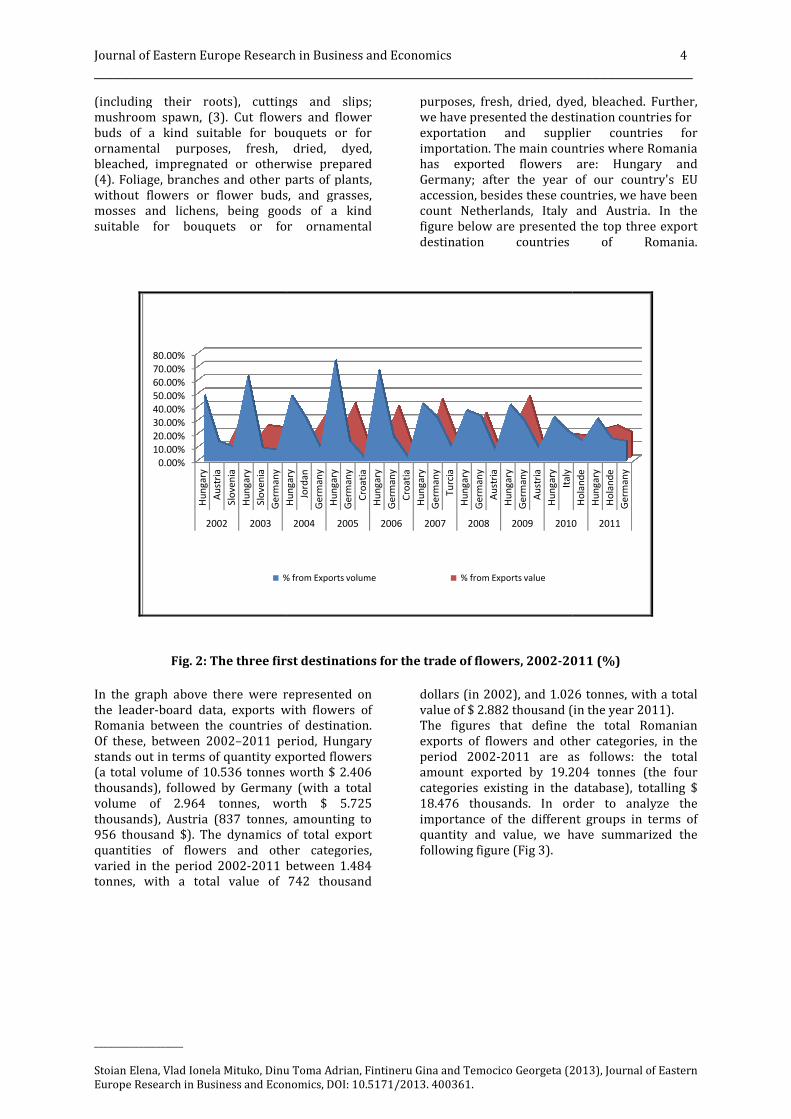
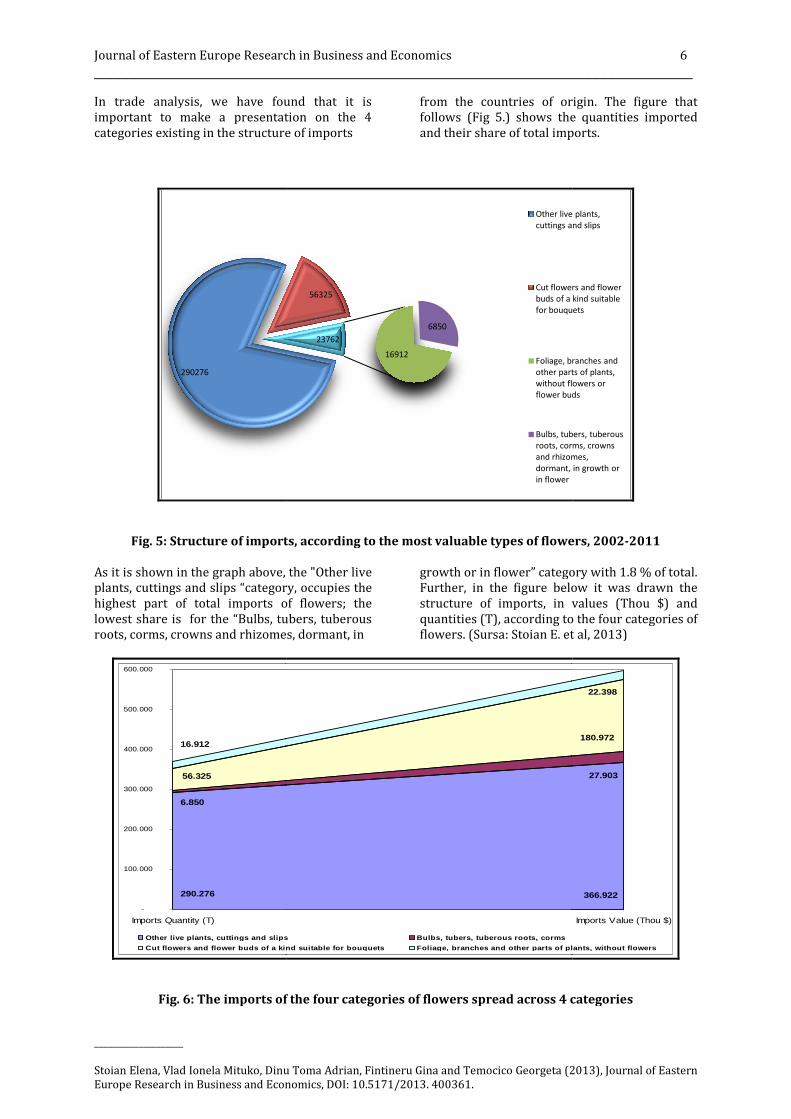
every year. During 2002-2011, the total volume imported was 11,138 tonnes (for all 4 categories), totalling in 2002 - $ 11,257 thousands, up to 63,133 tonnes, totalling in 2011 - $ 115,110 thousands. Countries of origin for the four imported categories listed in the Statistical nomenclature on the Common Customs Tariff (Commission Regulation (EC) No 1214/2007), are shown in the chart below (Fig 4.). During the reporting period, the data that define the total import of flowers of Romania is 370.363 tonnes, with a value of $ 598.194 thousand. (Sursa: Stoian E. et al, 2013))
Fig. 4: Rate of Total Imports of flowers among five countries (%), 2002-2011
48,6
20,3
13,4
5,8
5,7
13,9
48,5
17,4
4,8
4,6
-
5,00
10,00
15,00
20,00
25,00
30,00
35,00
40,00
45,00
50,00
tons US $ thou
Hungary Holland Italy Turkey Germany
Journal of Eastern Europe Research in Business and Economics
___________________________________________________________________________
____________________ Stoian Elena, Vlad Ionela Mituko, Dinu Toma Adrian, Fintineru Gina and Temocico Georgeta Europe Research in Business and Economics
In trade analysis, we have found that it is important to make a presentation on the 4 categories existing in the structure of imports
Fig. 5: Structure of imports, according to the most valuable types of flowers, 2002
As it is shown in the graph above, the plants, cuttings and slips “categoryhighest part of total imports of flowers; the lowest share is for the “Bulbs, tubers, tuberous roots, corms, crowns and rhizomes, dormant, in
Fig. 6: The imports of
290276
290.276
6.850
56.325
16.912
-
100.000
200.000
300.000
400.000
500.000
600.000
Imports Quantity (T)
Other live plants, cuttings and slips
Cut flowers and flower buds of a kind suitable for bouquets
Journal of Eastern Europe Research in Business and Economics
___________________________________________________________________________
Dinu Toma Adrian, Fintineru Gina and Temocico Georgeta (2013), Europe Research in Business and Economics, DOI: 10.5171/2013. 400361.
In trade analysis, we have found that it is make a presentation on the 4 ing in the structure of imports
from the countries of origin. The follows (Fig 5.) shows the quantities imported and their share of total imports.
Structure of imports, according to the most valuable types of flowers, 2002
, the "Other live category, occupies the
total imports of flowers; the for the “Bulbs, tubers, tuberous
roots, corms, crowns and rhizomes, dormant, in
growth or in flower” categoryFurther, in the figure below it wastructure of imports, in valuquantities (T), according to the four categoriesflowers. (Sursa: Stoian E. et al, 2013)
mports of the four categories of flowers spread across 4 categories
56325
16912
6850
23762
Other live plants,
cuttings and slips
Cut flowers and flower
buds of a kind suitable
for bouquets
Foliage, branches and
other parts of plants,
without flowers or
flower buds
Bulbs, tubers, tuberous
roots, corms, crowns
and rhizomes,
dormant, in growth or
in flower
Other live plants, cuttings and slips Bulbs, tubers, tuberous roots, corms
Cut flowers and flower buds of a kind suitable for bouquets Foliage, branches and other parts of plants, without flowers
6
___________________________________________________________________________
(2013), Journal of Eastern
from the countries of origin. The figure that shows the quantities imported
and their share of total imports.
Structure of imports, according to the most valuable types of flowers, 2002-2011
category with 1.8 % of total. e figure below it was drawn the
structure of imports, in values (Thou $) and , according to the four categories of
: Stoian E. et al, 2013)
flowers spread across 4 categories
Other live plants,
cuttings and slips
Cut flowers and flower
buds of a kind suitable
for bouquets
Foliage, branches and
other parts of plants,
without flowers or
flower buds
Bulbs, tubers, tuberous
roots, corms, crowns
and rhizomes,
dormant, in growth or
366.922
27.903
180.972
22.398
Imports Value (Thou $)
Foliage, branches and other parts of plants, without flowers
7 Journal of Eastern Europe Research in Business and Economics ___________________________________________________________________________
____________________ Stoian Elena, Vlad Ionela Mituko, Dinu Toma Adrian, Fintineru Gina and Temocico Georgeta (2013), Journal of Eastern Europe Research in Business and Economics, DOI: 10.5171/2013. 400361.
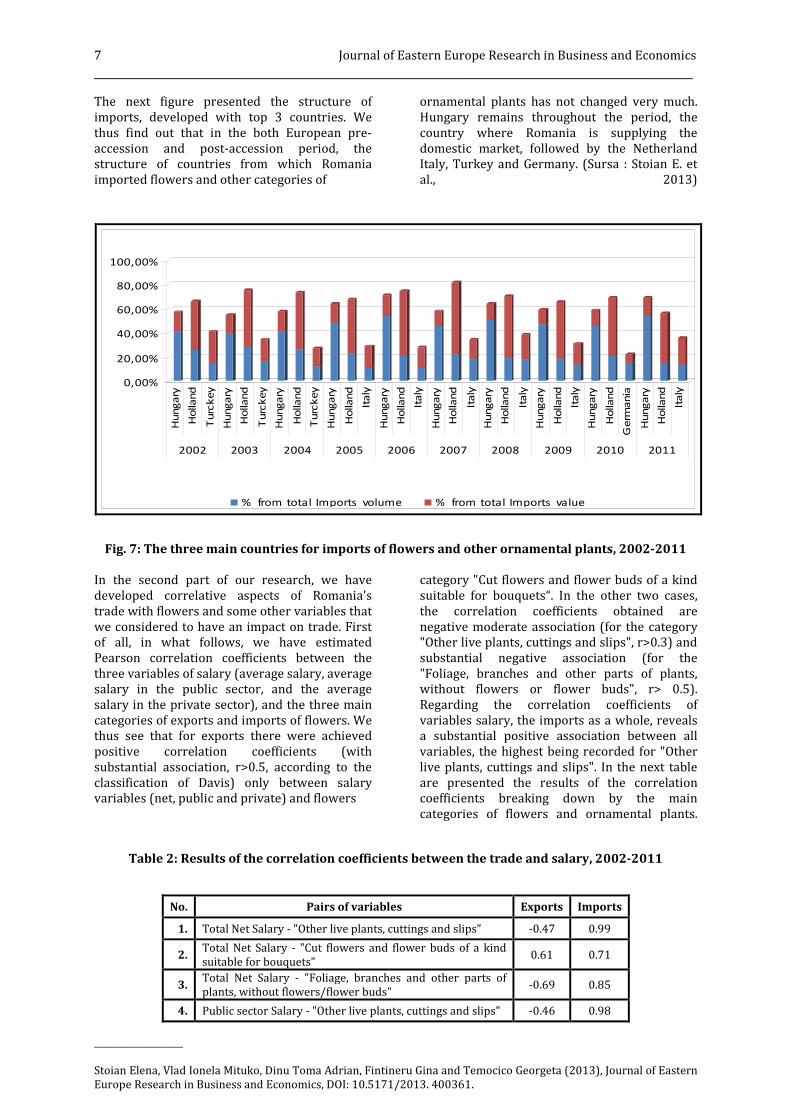
The next figure presented the structure of imports, developed with top 3 countries. We thus find out that in the both European pre-accession and post-accession period, the structure of countries from which Romania imported flowers and other categories of
ornamental plants has not changed very much. Hungary remains throughout the period, the country where Romania is supplying the domestic market, followed by the Netherland Italy, Turkey and Germany. (Sursa : Stoian E. et al., 2013)
Fig. 7: The three main countries for imports of flowers and other ornamental plants, 2002-2011
In the second part of our research, we have developed correlative aspects of Romania's trade with flowers and some other variables that we considered to have an impact on trade. First of all, in what follows, we have estimated Pearson correlation coefficients between the three variables of salary (average salary, average salary in the public sector, and the average salary in the private sector), and the three main categories of exports and imports of flowers. We thus see that for exports there were achieved positive correlation coefficients (with substantial association, r>0.5, according to the classification of Davis) only between salary variables (net, public and private) and flowers
category "Cut flowers and flower buds of a kind suitable for bouquets“. In the other two cases, the correlation coefficients obtained are negative moderate association (for the category "Other live plants, cuttings and slips", r>0.3) and substantial negative association (for the "Foliage, branches and other parts of plants, without flowers or flower buds", r> 0.5). Regarding the correlation coefficients of variables salary, the imports as a whole, reveals a substantial positive association between all variables, the highest being recorded for "Other live plants, cuttings and slips". In the next table are presented the results of the correlation coefficients breaking down by the main categories of flowers and ornamental plants.
Table 2: Results of the correlation coefficients between the trade and salary, 2002-2011
No. Pairs of variables Exports Imports
1. Total Net Salary - "Other live plants, cuttings and slips” -0.47 0.99
2. Total Net Salary - "Cut flowers and flower buds of a kind suitable for bouquets"
0.61 0.71
3. Total Net Salary - "Foliage, branches and other parts of plants, without flowers/flower buds"
-0.69 0.85
4. Public sector Salary - "Other live plants, cuttings and slips" -0.46 0.98
0,00%
20,00%
40,00%
60,00%
80,00%
100,00%
Hu
ng
ary
Ho
lla
nd
Tu
rck
ey
Hu
ng
ary
Ho
lla
nd
Tu
rck
ey
Hu
ng
ary
Ho
lla
nd
Tu
rck
ey
Hu
ng
ary
Ho
lla
nd
Ita
ly
Hu
ng
ary
Ho
lla
nd
Ita
ly
Hu
ng
ary
Ho
lla
nd
Ita
ly
Hu
ng
ary
Ho
lla
nd
Ita
ly
Hu
ng
ary
Ho
lla
nd
Ita
ly
Hu
ng
ary
Ho
lla
nd
Ge
rma
nia
Hu
ng
ary
Ho
lla
nd
Ita
ly
2002 2003 2004 2005 2006 2007 2008 2009 2010 2011
% from total Imports volume % from total Imports value
Journal of Eastern Europe Research in Business and Economics 8
___________________________________________________________________________
____________________ Stoian Elena, Vlad Ionela Mituko, Dinu Toma Adrian, Fintineru Gina and Temocico Georgeta (2013), Journal of Eastern Europe Research in Business and Economics, DOI: 10.5171/2013. 400361.
No. Pairs of variables Exports Imports
5. Public sector Salary - "Cut flowers and flower buds of a kind suitable for bouquets"
0.51 0.73
6. Public sector Salary - "Foliage, branches and other parts of plants, without flowers/flower buds"
-0.67 0.79
7. Private sector Salary - "Other live plants, cuttings and slips" -0.47 0.99
8. Private sector Salary - "Cut flowers and flower buds of a kind suitable for bouquets"
0.65 0.70
9. Private sector Salary - "Foliage, branches and other parts of plants, without flowers or flower buds"
-0.69 0.86
The following table summarizes the Pearson correlation coefficients and the significance level, for 10 observations. The variables that were taken into account are: the value of imports and exports of agricultural products for
Romania, average salary, volume and values of Romanian trade of flowers and the average exchange rates for major currencies used in our country (Euros and U.S. dollars).
Table 3: Paired Samples Correlations
Pair of variables Correlation Sig. Pair 1 Agro-Food Exports Value & Exchange rate
USD/Lei -0.148 0.683
Pair 2 Flowers Export Value & Exchange rate
USD/Lei -0.128 0.724
Pair 3 Agro-Food Imports Value & Exchange rate
USD/Lei -0.555 0.096
Pair 4 Flowers Import Value & Exchange rate
USD/Lei -0.421 0.226
Pair 5 Agro-Food Imports Value & Total Net Salary 0.971 0.000
Pair 6 Flowers Import Value & Total Net Salary 0.990 0.000
Pair 7 Agro-Food Exports Value $ & Total Net
Salary 0.928 0.000
Pair 8 Val Exp Flowers Total & Total Net Salary 0.692 0.027
Pair 9 Flowers Export Value & Exchange rate
Euro/Lei 0.577 0.081
Pair 10 Flowers Import Value & Exchange rate
Euro/Lei 0.556 0.095
Pair 11 Total Net Salary & Exchange rate Euro/Lei 0.612 0.060
Pair 12 Agro-Food Imports Value & Exchange rate
Euro/Lei 0.491 0.150
Pair 13 Agro-Food Exports Value & Exchange rate
Euro/Lei 0.678 0.031
†Lei - is the Romanian national currency
9 Journal of Eastern Europe Research in Business and Economics ___________________________________________________________________________
____________________
Stoian Elena, Vlad Ionela Mituko, Dinu Toma Adrian, Fintineru Gina and Temocico Georgeta (2013), Journal of Eastern
Europe Research in Business and Economics, DOI: 10.5171/2013. 400361.
In terms of analyzing correlative phenomena
between pairs of variables chosen for this study
(13 pairs), we have outlined the following
results in the table previous. The above table has
been revealed significant coefficients at a
threshold of p <0.05 for five pairs of variables.
The two currencies have not considered any
significant correlation coefficient, except for the
pair the agro-food exports and exchange rate
Euro. At first sight it would think that any of the
considered trade variables does not affect the
evolution of the Euros and U.S. Dollars
currencies trend. Otherwise, we have strong
significant correlations between Romania's total
net salary and agro-food trade. Thus, there are
only pairs 5, 6, 7, 8 and 13 with a significance
level (less than 0.05), so the variable in the each
pair are considered to have influence on each
other. In this case, the salary follows the same
trend as the agro-food trade and the flower
trade, along the 2002-2011 periods.
Conclusions
As we have already mentioned at the beginning,
the aim of this paper was to present the main
aspects related to the Romanian international
trade, more specifically to the trade of flowers.
Thus, the findings revealed that international
trade performance with flowers has a direct link
with average salary and the Romanian agro-
foods trade, but no connection has been
identified with the exchange rates for the Euro
currency and the US dollars. Concerning the
average rate of growth, the conclusions were
that, except the volume of flower trade and the
exchange rate of the U.S. dollar, all the variables
have been registered positive dynamics. The
highest dynamics has been showed for the value
of the agro-foods exports time series. The
average rate of the dynamic for the value of the
Romanian agro foods imports and the average
salary, both have been situated around the 17%.
In the results relating to matters correlative
aspects, we have shown significant correlations
between variables, which mean that in the
absence of any other information to support or
contradict these assumptions; we can assume
that these variables had a greater
interdependence.
References
Anantharaman, R.N. and Kuppusamy, J. (2008), ‘An
analysis of competencies and moderating
influence of demographic profiles - evidence from
exporting organizations’, Communications of the
IBIMA, Volume 5.
Eurostat Yearbook 2011, (2012), ‘Europe in
figures’, Chapter 9 “International trade”, Eurostat.
Houck, J.P. (1988), ‘Link between agricultural assistance and international trade’, Agricultural
Economics, Volume 2, Issue 2, Pages 159-166, ISSN 0169-5150, http://www.sciencedirect.com/science/article/pii/016951508890014X. Koester, U. (1993), ‘International trade and agricultural development in developing countries: Significance of the Uruguay round of GATT negotiations’, Agricultural Economics,
Volume 8, Issue 4, Pages 275-294, ISSN 0169-5150, http://www.sciencedirect.com/science/article/pii/016951509390038E. Kuppusamy, J. and Anantharaman, R.N. (2012), ‘The link between export performance and export development: does managements’ motivation play a role?’, IBIMA Publishing, Journal of
organizational management studies, Vol. 2012 (2012), article id 645053, 11 pages, Doi:10.5171/2012.645053,http://www.ibimapublishing.com/journals/joms/joms.html. Lădaru G.R. and Beciu S., (2012) ‘The SMEs sector in Romania: Comparative study by economic sector and regional level’, International symposium „Sustainable agriculture and rural development in terms of the Republic of Serbia strategic goals realization within the Danube Region” – preservation of rural values, Belgrade, Serbia, pg. 1273-1288. Neculiţă, M., Şarpe, D.A., Cristea, V., Xiaoshuan, Z. and Moga, L.M. (2011), ‘Modeling the impact of Romania’s accession to European Union on trade of live animals’, WFL Publisher, Science and Technology. Romanian Statistical Yearbooks, INSSE, Bucharest. Stoian, E., Vlad, I.M., Dinu, T.A., Fintineru, G., Temocico, G. (2013), “The links and correlations in the trade of flowers in Romania", the 21st IBIMA, 27-28 June 2013”, Viena Winters, A.L. (2004), ‘Trade liberalization and economic performance: an overview’, The Economic Journal, 114 (February), Royal Economic Society, Published by Blackwell Publishing, Oxford, USA
![HOME [queeniebridal.com]...BROOCHES LACE BORDERS WREATHS BRIDESMAID FLOWERS DRESS FLOWERS FAMILY FLOWERS GROOM FLOWERS HEAD FLOWERS OTHER ACCESSORIES HOME ABOUT US BRIDAL GOWNS BOUQUETS](https://img.pdfslide.us/doc/110x75/6046947d70039863261e7053/home-brooches-lace-borders-wreaths-bridesmaid-flowers-dress-flowers-family.jpg)