Embed Size (px)
Citation preview
Available online www.jocpr.com
Journal of Chemical and Pharmaceutical Research, 2016, 8(7):127-141
Research Article ISSN : 0975-7384 CODEN(USA) : JCPRC5
127
Adsorption of Fluoride (F-) from aqueous solution by using Ragi seed (Eleusine coracana) powder
N. Gandhi1, D. Sirisha2 and K. B. Chandra Sekhar3
1Centre for Environment and Climate Change, School of Environmental Sciences, Jawaharlal Nehru Institute of
Advanced Studies (JNIAS-JNTUA), Hyderabad, Telangana 2Centre for Environment and Climate Change, School of Environmental Sciences, Jawaharlal Nehru Institute of
Advanced Studies, Hyderabad, Telangana 3Director, Oil Technological & Pharmaceutical Research Institute (OTPRI), Jawaharlal Nehru Technological
University Anantapur, Ananthapuram A.P _____________________________________________________________________________________________
ABSTRACT The removal of fluoride from drinking water is one of the most important environmental issues in the world. The problem of high fluoride in water sources in India and the rest of the developing world has exacerbated in the latest past due to increasing shortage of water. More people are being exposed to high water fluoride resulting in elevated levels of fluorosis in the societies. Fluoride (F) adsorption from solutions using Eleusine coracana seed powder from synthetic wastewater was studied on batch basis and results were tested with adsorption kinetic models to found the order of action. The equilibrium data was correlated to Temkin, Freundlich and Langmuir models and the maximum Freundlich adsorption capacity was found to be 4 mg/0.4 g. Keywords: Eleusine coracana seed powder, Batch Adsorption, Isotherm Studies, Adsorption Kinetics, Thermodynamic Studies _____________________________________________________________________________________________
INTRODUCTION
Water pollution occurs due to the presence of dissolved inorganic materials, organic materials such as proteins, fats, carbohydrates and other substances found in domestic and industrial waste waters. In present days heavy and fast growth of industrialization and urbanization leads so many environmental imbalances taking place. The major problem facing the global environment is water pollution. The present study and the experimental data indicating that the water pollution due to discharging of untreated industrial wastewater into healthy environment. Because of this type of activity the concentration of ground water fluorine is increasing day by day. Fluoride beyond desirable amounts (0.6 to 1.5 mg/l) in ground water is a major problem in many parts of the world. The prominent states, which are severely affected, are Andhra Pradesh, Rajasthan, Gujarat, Uttar Pradesh, Tamil Nadu and Telangana. The effects of fluorine compounds on plants have been summarized by Daines et al. ( 1952) [1], Griffin and Bayles (1952) [2], Miller and associates (1952) [3], and Zimmerman (1952) [4].The principal fluorine bearing minerals which are used in large scale industrial processes are: fluorite or fluorspar (CaF2)' cryolite (N aaA1F 6)' apatite (SCas (PO4) 2CaF2), and sedimentary phosphate rock. Taking all these factors into consideration the present study deals with removal of fluoride by bio sorption method. Adsorption method is easy to perform and it very cheap and it may not produce high quantity of waste disposal.
EXPERIMENTAL SECTION
Selection of Adsorbent: Eleusine coracana commonly known as finger millet, or ragi belongs to the family Gramineae, The grains of Eleusine are unusual in that the outer layer (pericarp) is not fused and can be easily removed from the seed coat
N. Gandhi et al J. Chem. Pharm. Res., 2016, 8(7):127-141 ______________________________________________________________________________
128
(testa) below (Van Wyk & Gericke 2000) [5]. Per 100 g, the straw is reported to contain (ZMB): 3.7 g protein, 0.9 g fat, 87.3 g total carbohydrate, 35.9 g fiber, 8.1 g ash, 1110 mg Ca, 160 mg P, 260 mg Na, and 1500 mg K (C.S.I.R., 1948-1976) [6]. Potassium level in ragi seeds are high this may bind with chromium present in aqueous solution. Taking all these factors into consideration Eleusine coracana seed powder is selected as an adsorbent. Batch adsorption Experiments: Batch adsorption studies were carried out by using pre-weighted amounts of adsorbents to reach equilibrium with fluoride solution of various initial concentrations (1 – 4 mg/L) at 273, 313, 333, and 353 K. At the end of equilibrium period (60 min), the contents of the bottles were filtered, and then the supernatant samples were subsequently analyzed for removal percentage of fluoride bu using UV/Vis Spectrophotometer at wavelength 570 nm. The amount of percentage removal is calculated by using the following equation (7-11) % Removal = initial concentration – Final concentration X 100 Initial concentration Selection of optimum contact time The contact time strongly influences the adsorption process, for this study an 1000 ml of different concentrations of fluoride solutions were taken separately and they were mixed with optimum adsorbent dosage and stirred for different period of contact time i.e. for 1hr and time interval varies as 3,5,10,15……60 min. After completion of 60 mints contact time the samples were filtered through watt man NO.1 filter paper and analyzed for fluoride concentration using spectrophotometer method [12]. Determination of Optimum Dosage of Adsorbent The effect of adsorbent dose on the removal of fluoride, is studied in neutral condition (pH 7), at ambient temperature (25 + 2ºC) and contact time of 60 minutes for initial fluoride concentration of 4 mg/L. The added amount of adsorbent was varied from 0.2 g – 1.2 g. After completion of optimum contact time period the solutions were filtered and analyzed for residual and removal of fluoride concentrations respectively. The dosage which gives minimum residual concentration is chosen as optimum dosage [13]. Effect of Initial Concentration of ion The adsorption of fluoride onto various selected adsorbents was studied by varying initial fluoride concentration using optimum adsorbent dosage, at ambient temperature (25 + 2ºC) and contact time of 60 minutes. The filtered solutions were analyzed for residual and removal of fluoride concentrations respectively [14]. Determination of Optimum pH A series of conical flasks were taken with 1000 ml of 4 mg/L of fluoride solution to determine the optimum pH by adding optimum adsorbent dosage at different pH. The pH of the flasks was adjusted ranging from 3.0 to 10.0. The flasks were kept at room temperature for optimum contact time. After stirring the samples are filtered and analyzed for the chromium and fluoride concentration. The flask which gives minimum and less concentrations (F) is selected as the optimum pH [15]. Effect of Temperature Temperature has an important effect on the process of adsorption. The percentage of fluoride adsorption is studied as a function of temperature. The batch experiments were performed at temperatures of 0ºC, 30ºC, 40ºC, 50ºC, at different initial (1, 2, 3 and 4 mg/L) concentrations of fluoride. Adsorption Isotherm Models The parameters obtained from the different models gives important information on the adsorption mechanisms and the surface properties and affinities of the adsorbent. The most widely accepted surface adsorption isotherm models for single-solute systems are the Langmuir and Freundlich models. The correlation with the amount of adsorption and the liquid phase concentration were tested with the Langmuir, Freundlich and Tempkin isotherm equations [16]. Linear regression is frequently used to determine the best-fitting isotherm, and the applicability of isotherm equations is compared by judging the correlation coefficients. Temkin Adsorption Isotherm Model The purpose of the adsorption isotherms is to relate the adsorbate concentration in the bulk and the adsorbed amount at the interface [17 - 19]. The assumptions made by Temkin are � Heat of adsorption decreases with surface coverage due to the interactions between adsorbent and adsorbate [20].
N. Gandhi et al J. Chem. Pharm. Res., 2016, 8(7):127-141 ______________________________________________________________________________
129
� Bonding energies are uniformly distributed up to certain binding energies. Depending upon these two factors Temkin proposed an empirical equation which is represented as follows [21-22] �
�� =�� ln�� ……(i)
The linear form of temkin equation is as follows (Temkin and Pyzhav)
�� =�� ln� +�� ln � ….(ii)
Where T is absolute temperature (K), R is universal gas constant (8.314 J/mol.k), KT is equilibrium binding constant (L/Mg), bT is Variation of adsorption energy (kJ/mol) BT is Temkin constant (kJ/mol).The Temkin adsorption isotherm model was chosen to evaluate the adsorption potentials of the adsorbent for adsorbates. If the adsorption process follows Temkin adsorption isotherm model the graph between Ce versus qe has to show a linear relationship. Langmuir Adsorption Isotherm Model Langmuir adsorption isotherm explains quantitatively the formation of monolayer adsorbate on outer surface of the adsorbent, and after that no further adsorption takes place. The theoretical Langmuir isotherm is valid for adsorption of solute from a liquid solution as monolayer adsorption on a surface containing a large number of identical sites. Langmuir isotherm model [23] explains uniform energies of adsorption onto the surface without transmigration of adsorbate in the plane of the surface. The Langmuir isotherm has an assumption that the adsorption occurs within adsorbent at specific homogeneous site. The linear form of Langmuir equation is as follows:
�
� =
�
����+
�
��…….(iii)
Where qe is adsorption capacity equilibrium, qm is the maximum adsorption capacity, Ce is the solution concentration at equilibrium kL is Langmuir constant Freundlich Adsorption Isotherm Model The Freundlich equation is basically empirical but is often useful as a mean for data description. The equation generally agrees with the Langmuir equation and experimental data over moderate ranges of concentration [24]. This is commonly used to describe the adsorption characteristics for the heterogeneous surface [25]. The data often fit the empirical equation proposed by Freundlich.
qe = kf Ce1/n …..(iv)
The linear form of Freundlich equation is as follows [26]
log qe = log kf + 1/n (log Ce) …..(v)
Where kf is the Freundlich adsorption capacity and n is the adsorption intensity. A plot of log qe versus log Ce gives a linear line with slope of 1/n and intercept of log kf. Adsorption Kinetic models In order to examine the controlling mechanism of adsorption processes such as mass transfer and chemical reaction, several kinetic models are used to test experimental data. The mechanism of adsorption involves the chemical reaction of functional groups present on the surface of the adsorbent and adsorbate. In present study the experimental data were tested with pseudo first order, pseudo Second order, Elovich model and intra particle diffusion models [27]. Pseudo first order equation: Pseudo-first-order kinetic model, the Lagergren rate equation, has been the most widely used rate equation for assigning the adsorption of an adsorbate from a liquid phase since 1898 [28]. A simple kinetic analysis of adsorption is the pseudo-first-order equation in the form [29 - 30].
dqt/dt = k1 (qe- qt) …..(vi)
Where k1 is the rate constant of pseudo-first-order adsorption and qe denotes the amount of adsorption at equilibrium. After definite integration by applying the initial conditions qt = 0 at t = 0 and qt = qt at t = t, the linear equation is as follows

N. Gandhi et al J. Chem. Pharm. Res., 2016, 8(7):127-141 ______________________________________________________________________________
130
log( �� −��) = log �� −��
�.���� …..(vii)
The plot of log (qe – qt) versus t should give a straight line with slope of –k/2.303 and intercept log qe. Pseudo first-order kinetic equation differs from a true first-order equation in following ways � The parameter, k (qe − qt) does not represent the number of available sites, � The parameter, log (qe) is an adjustable parameter and often it is found that it is not equal to the intercept of the plot of log (qe − qt) versus t, whereas in a true first order model the value of log qe should be equal to the intercept. Hence, pseudo first order kinetic model is used for estimating k alone, which is considered as mass transfer coefficient in the design calculations [31]. Pseudo second-order kinetics As pseudo first-order kinetic model gives only k and as qe cannot be estimated using this model, applicability of the pseudo second-order kinetics has to be tested for the estimation of qe with the rate equation given by Ho 1995, [32]. The pseudo second order kinetic order equation expressed as
�
�!=
�
�"� " +
�
� ……(viii)
Where k2 is the rate constant of pseudo second order adsorption (g/mg/min) and qe is the equilibrium adsorption capacity (mg/gm) [33]. The plot of t/qt versus t should give a linear relationship which allows the computation of a second-order rate constant, k2 and qe. The pseudo-second order model is based on the assumption that the rate limiting step may be chemical adsorption involving valence forces through sharing or exchange of electrons between the adsorbent and adsorbate [34]. Elovich Model Elovich equation is also used successfully to describe second order kinetic assuming that the actual solid surfaces are energetically heterogeneous, but the equation does not propose any definite mechanism for adsorbate–adsorbent [35 - 36]. It has extensively been accepted that the chemisorption process can be described by this semi-empirical equation [37]. The Elovich or Roginsky–Zeldovich equation is generally expressed as follows [38 - 40, 19]
#�!
#!= $ exp(−(��)…….(ix)
Where, α is the initial adsorption rate (mg/g/min), β is the desorption constant (g/mg). If the adsorption fits to the Elovich model, a plot of qt versus ln (t) should give a linear relationship with a slope of (1/β) and an intercept of 1/β In (αβ). Intraparticle Diffusion Model In adsorption studies it is mandatory to find out the rate limiting step. Therefore the results obtained from the batch adsorption experiments were used to study the rate limiting step. The rate limiting step might be film or intraparticle diffusion which was tested by plotting a graph between amount of ion adsorbed and square root of time [41].
�� =)# �/� + +…..(x)
Where qt is the amount of chromium and fluoride adsorbed (mg/g) at time t (min), and I is the intercept (mg/g). kid
and I values are obtained from the slopes and intercept of the linear plot. If the postulated mechanism is correct, then a linear plot passing through the origin is obtained. Additionally, the value of the rate constant for diffusion is obtained from the slope of the line. However, if the data exhibit multi-linear plots, then two or more steps influence the sorption process. In general, a mass transfer process is diffusion controlled and its rate is dependent upon the rate at which components diffuse towards one another. The intra-particle diffusion model has been applied in three different forms: (i) The amount of adsorption at any time, qt is plotted against t1/2 to get a straight line passing through origin. This means that A is equal to zero which implies that the rate is not limited by mass transfer across the boundary layer. This occurs when a system is agitated and mixed to a sufficient extent (high turbulence); (ii) Multi-linearity in qt versus t1/2 plot is considered (that is, two or three steps are involved). In this form, the external surface adsorption or instantaneous adsorption occurs in the first step; the second step is the gradual
N. Gandhi et al J. Chem. Pharm. Res., 2016, 8(7):127-141 ______________________________________________________________________________
131
adsorption step, where intra-particle diffusion is controlling; and the third step is the final equilibrium step, where the solute moves slowly from larger pores to micro pores causing a slow adsorption rate. The time required for the second step usually depends on the variations of the system parameters such as solute concentration, temperature, and adsorbent particle size; (iii) qt is plotted against t1/2 to obtain a straight line but does not necessarily pass through the origin; that is, there is an intercept [42]. This implies that the rate is limited by mass transfer across the boundary layer. This occurs in a slowly stirred batch adsorption process. Thermodynamic parameters Thermodynamic parameters were calculated from the variation of the equilibrium constant, K, at different temperature by using following equation.
, =�
� ……(xi)
K
c (L/g) values were obtained using the Khan and Sing method [43] by plotting ln (q
e/C
e) versus q
e and extrapolating
to zero. The intercept of the straight line with the vertical axis gives the values of Kc. The Gibbs free energy change of the adsorption process is related to Kc as in equation given below [44].
∆Gº = - RT ln Kc ….(xii)
The changes in enthalpy (∆Ho
) and entropy (∆So
) for chromium and fluoride adsorption were calculated from the slope and intercept of the plot of ln Kc against 1/T according to the van’t Hoff equation [45].
ln Kc = ∆Sº - ∆Hº R RT ….. (xiii)
Where ∆Sº is change in entropy, ∆Hº is change in enthalpy ∆Gº is change in free energy. Plotting ln K
c versus 1/T
shows straight lines. From their slope and intercept, ∆Ho
and ∆So
are determined. The negative values of ∆Go
indicate a favourable and spontaneous process [39, 46]. Equilibrium parameter In order to find out the efficiency of adsorption process, the dimensionless equilibrium parameter, RL is calculated by using following equation [16, 47].
RL = 1 . 1+ bCo ….(xiv)
Where Co = Initial concentration (mg/L), b is Langmuir isotherm constant. Values of the dimensionless equilibrium parameter explain the differences in the shapes of the isotherm. The RL values lies between 0 and 1 indicate favourable adsorption. The RL value above 1 indicates unfavourable. Non-linear regression analysis In this experimental study, a non-linear regression analysis was conducted to determine the isotherm and kinetic constants and statistical comparison values such as determination coefficient (R2), standard error of the estimate (SEE) and Absolute sum of squares (ASS). The batch adsorption data was evaluated using Graphpad prism scientific software. As regression models were solved, they were automatically sorted according to the goodness-of-fit system into a graphical interface. To determine the statistical significance of the predicted results 95 % confidence was used in the non-linear regression analysis.
RESULTS AND DISCUSSION
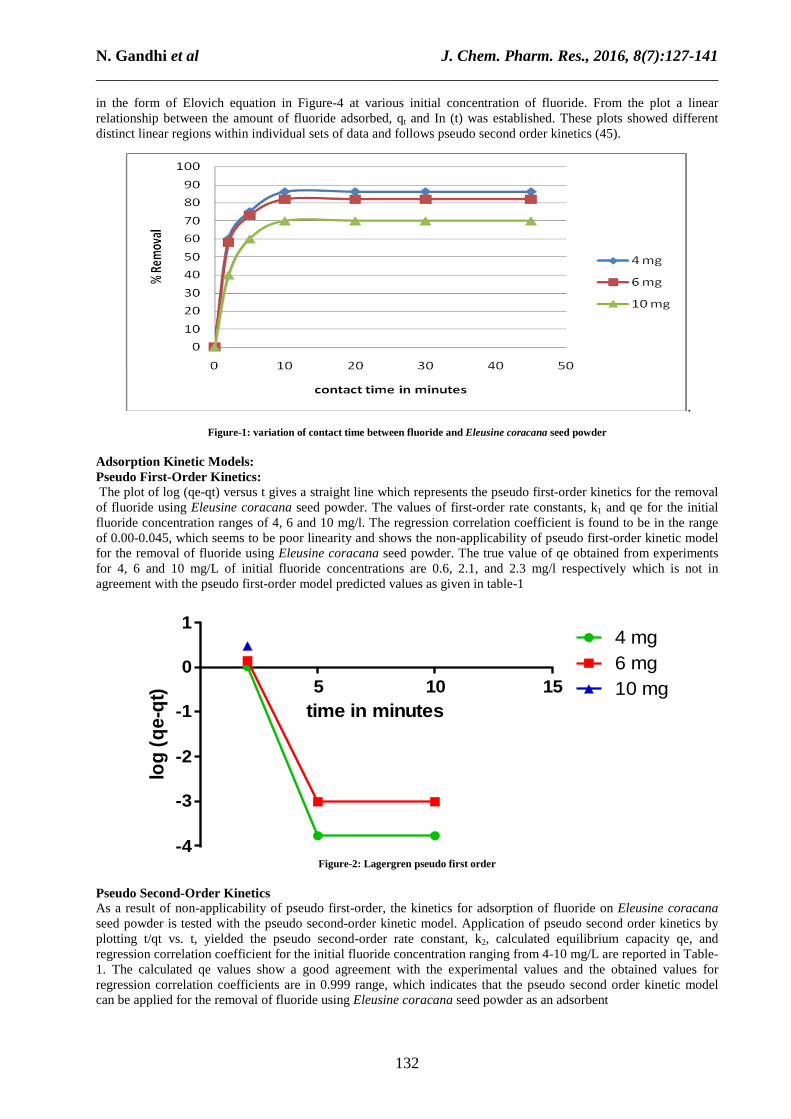
Effect of Contact Time and Kinetics of Adsorption: The adsorption data of fluoride at different initial concentration ranging from 1-4 mg/l. however the experimental data is measured after 60 minutes of contact time to make sure that full equilibrium was attained. The percentage adsorption steadily increased with an increase in the contact time as shown in figure-1. The rates of adsorption were first tested with the Pseudo first order mechanism of Lagergren by plotting log (qe-qt) Vs time (Figure-2). The plots have good linearity but it is deviating from pseudo first order kinetic. In order to find a more reliable description of the kinetics, second order kinetic equation was applied to the adsorption data by plotting t/qt Vs time (Figure-3). The plots are having better linearity. The results of sorption of fluoride by using ragi seed powder has been represented
N. Gandhi et al J. Chem. Pharm. Res., 2016, 8(7):127-141 ______________________________________________________________________________
132
in the form of Elovich equation in Figure-4 at various initial concentration of fluoride. From the plot a linear relationship between the amount of fluoride adsorbed, qt and In (t) was established. These plots showed different distinct linear regions within individual sets of data and follows pseudo second order kinetics (45).
.
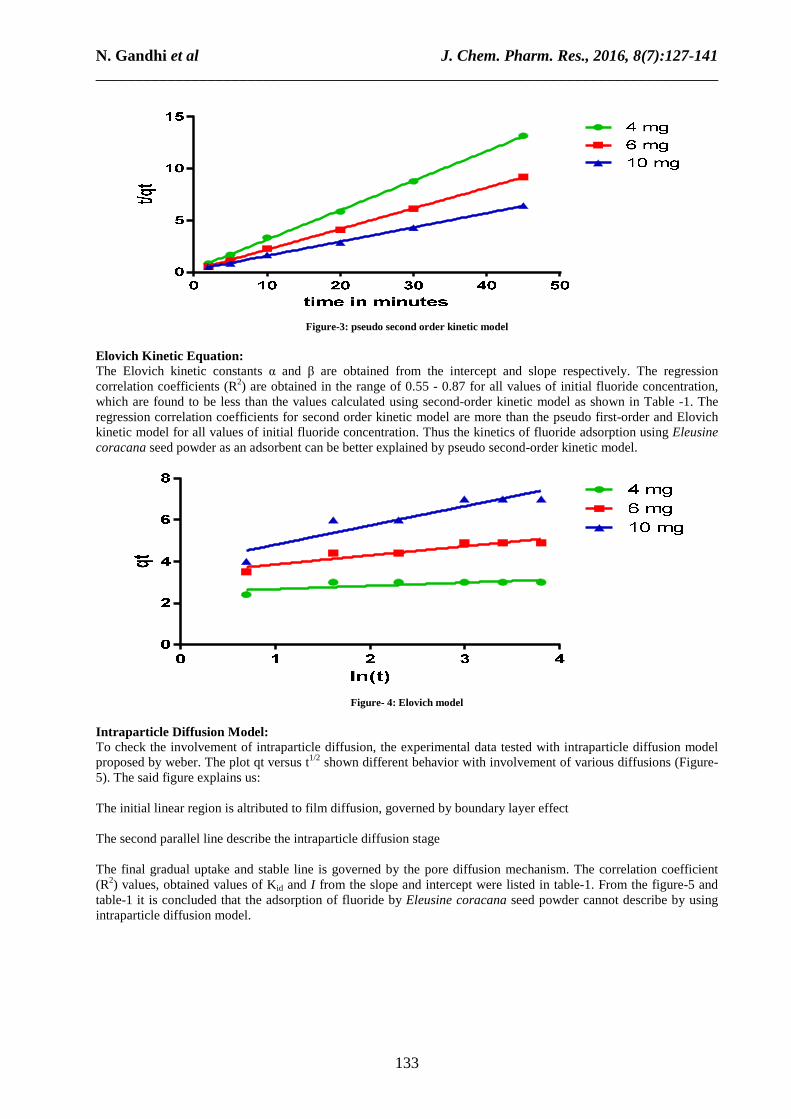
Figure-1: variation of contact time between fluoride and Eleusine coracana seed powder Adsorption Kinetic Models: Pseudo First-Order Kinetics: The plot of log (qe-qt) versus t gives a straight line which represents the pseudo first-order kinetics for the removal of fluoride using Eleusine coracana seed powder. The values of first-order rate constants, k1 and qe for the initial fluoride concentration ranges of 4, 6 and 10 mg/l. The regression correlation coefficient is found to be in the range of 0.00-0.045, which seems to be poor linearity and shows the non-applicability of pseudo first-order kinetic model for the removal of fluoride using Eleusine coracana seed powder. The true value of qe obtained from experiments for 4, 6 and 10 mg/L of initial fluoride concentrations are 0.6, 2.1, and 2.3 mg/l respectively which is not in agreement with the pseudo first-order model predicted values as given in table-1
time in minutes
log
(q
e-q
t) 5 10 15
-4
-3
-2
-1
0
14 mg6 mg10 mg
Figure-2: Lagergren pseudo first order
Pseudo Second-Order Kinetics As a result of non-applicability of pseudo first-order, the kinetics for adsorption of fluoride on Eleusine coracana seed powder is tested with the pseudo second-order kinetic model. Application of pseudo second order kinetics by plotting t/qt vs. t, yielded the pseudo second-order rate constant, k2, calculated equilibrium capacity qe, and regression correlation coefficient for the initial fluoride concentration ranging from 4-10 mg/L are reported in Table-1. The calculated qe values show a good agreement with the experimental values and the obtained values for regression correlation coefficients are in 0.999 range, which indicates that the pseudo second order kinetic model can be applied for the removal of fluoride using Eleusine coracana seed powder as an adsorbent
N. Gandhi et al J. Chem. Pharm. Res., 2016, 8(7):127-141 ______________________________________________________________________________
133
Figure-3: pseudo second order kinetic model
Elovich Kinetic Equation: The Elovich kinetic constants α and β are obtained from the intercept and slope respectively. The regression correlation coefficients (R2) are obtained in the range of 0.55 - 0.87 for all values of initial fluoride concentration, which are found to be less than the values calculated using second-order kinetic model as shown in Table -1. The regression correlation coefficients for second order kinetic model are more than the pseudo first-order and Elovich kinetic model for all values of initial fluoride concentration. Thus the kinetics of fluoride adsorption using Eleusine coracana seed powder as an adsorbent can be better explained by pseudo second-order kinetic model.
Figure- 4: Elovich model
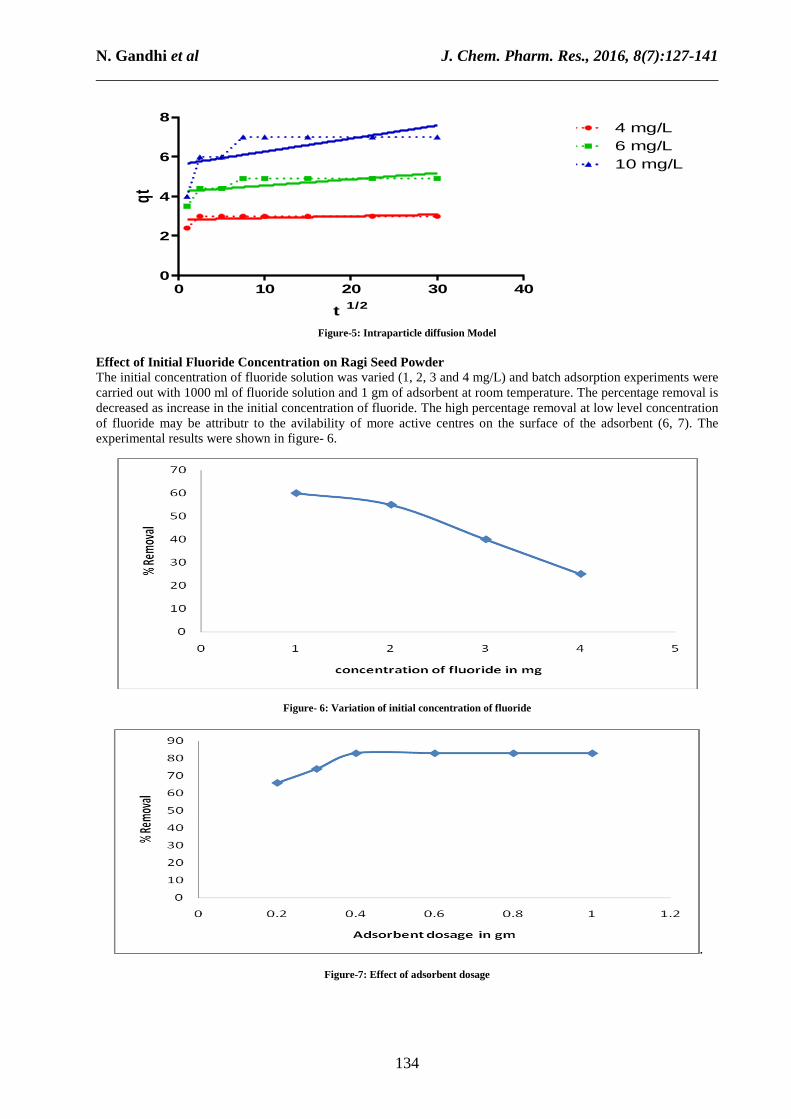
Intraparticle Diffusion Model: To check the involvement of intraparticle diffusion, the experimental data tested with intraparticle diffusion model proposed by weber. The plot qt versus t1/2 shown different behavior with involvement of various diffusions (Figure-5). The said figure explains us: The initial linear region is altributed to film diffusion, governed by boundary layer effect The second parallel line describe the intraparticle diffusion stage The final gradual uptake and stable line is governed by the pore diffusion mechanism. The correlation coefficient (R2) values, obtained values of Kid and I from the slope and intercept were listed in table-1. From the figure-5 and table-1 it is concluded that the adsorption of fluoride by Eleusine coracana seed powder cannot describe by using intraparticle diffusion model.
N. Gandhi et al J. Chem. Pharm. Res., 2016, 8(7):127-141 ______________________________________________________________________________
134
0 10 20 30 400
2
4
6
8
t 1/2
qt4 mg/L6 mg/L10 mg/L
Figure-5: Intraparticle diffusion Model
Effect of Initial Fluoride Concentration on Ragi Seed Powder The initial concentration of fluoride solution was varied (1, 2, 3 and 4 mg/L) and batch adsorption experiments were carried out with 1000 ml of fluoride solution and 1 gm of adsorbent at room temperature. The percentage removal is decreased as increase in the initial concentration of fluoride. The high percentage removal at low level concentration of fluoride may be attributr to the avilability of more active centres on the surface of the adsorbent (6, 7). The experimental results were shown in figure- 6.
Figure- 6: Variation of initial concentration of fluoride
.
Figure-7: Effect of adsorbent dosage
N. Gandhi et al J. Chem. Pharm. Res., 2016, 8(7):127-141 ______________________________________________________________________________
135
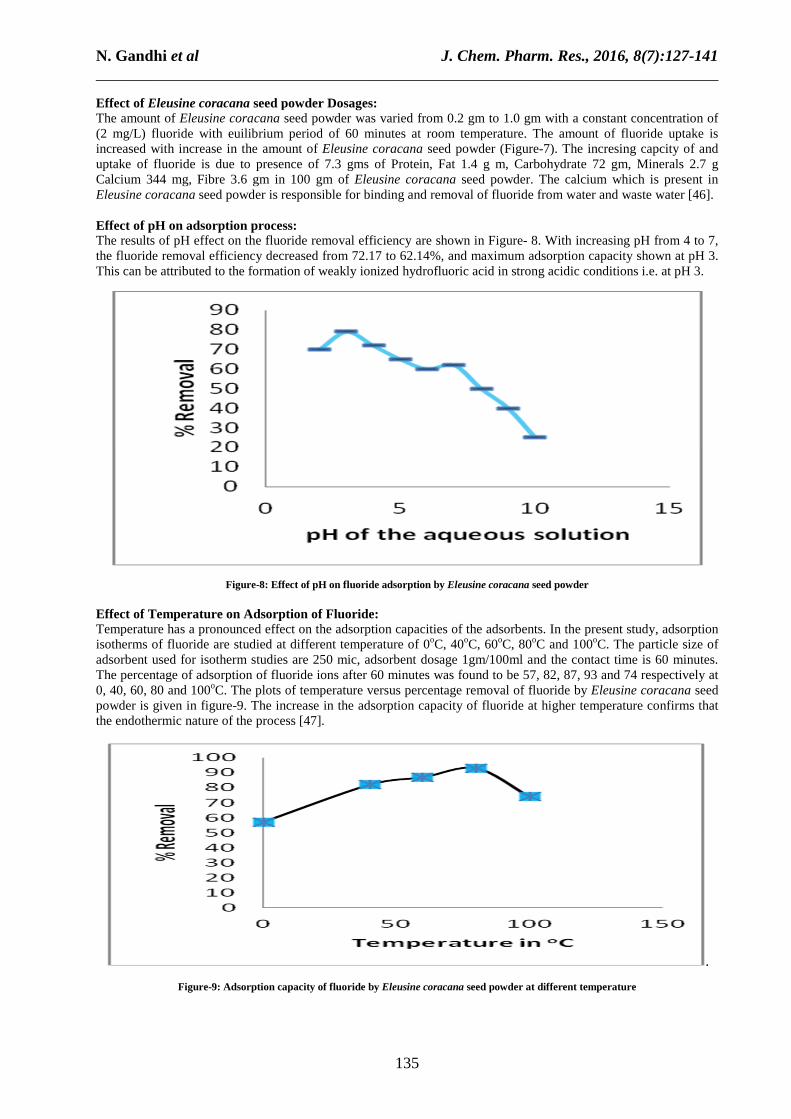
Effect of Eleusine coracana seed powder Dosages: The amount of Eleusine coracana seed powder was varied from 0.2 gm to 1.0 gm with a constant concentration of (2 mg/L) fluoride with euilibrium period of 60 minutes at room temperature. The amount of fluoride uptake is increased with increase in the amount of Eleusine coracana seed powder (Figure-7). The incresing capcity of and uptake of fluoride is due to presence of 7.3 gms of Protein, Fat 1.4 g m, Carbohydrate 72 gm, Minerals 2.7 g Calcium 344 mg, Fibre 3.6 gm in 100 gm of Eleusine coracana seed powder. The calcium which is present in Eleusine coracana seed powder is responsible for binding and removal of fluoride from water and waste water [46]. Effect of pH on adsorption process: The results of pH effect on the fluoride removal efficiency are shown in Figure- 8. With increasing pH from 4 to 7, the fluoride removal efficiency decreased from 72.17 to 62.14%, and maximum adsorption capacity shown at pH 3. This can be attributed to the formation of weakly ionized hydrofluoric acid in strong acidic conditions i.e. at pH 3.
Figure-8: Effect of pH on fluoride adsorption by Eleusine coracana seed powder Effect of Temperature on Adsorption of Fluoride: Temperature has a pronounced effect on the adsorption capacities of the adsorbents. In the present study, adsorption isotherms of fluoride are studied at different temperature of 0oC, 40oC, 60oC, 80oC and 100oC. The particle size of adsorbent used for isotherm studies are 250 mic, adsorbent dosage 1gm/100ml and the contact time is 60 minutes. The percentage of adsorption of fluoride ions after 60 minutes was found to be 57, 82, 87, 93 and 74 respectively at 0, 40, 60, 80 and 100oC. The plots of temperature versus percentage removal of fluoride by Eleusine coracana seed powder is given in figure-9. The increase in the adsorption capacity of fluoride at higher temperature confirms that the endothermic nature of the process [47].
.
Figure-9: Adsorption capacity of fluoride by Eleusine coracana seed powder at different temperature

N. Gandhi et al J. Chem. Pharm. Res., 2016, 8(7):127-141 ______________________________________________________________________________
136
Two-parameter isotherms: Freundlich isotherms: A graph was constructed between log x/m and log Ce and it shown in figure-10. From the figure-10, it was found that the adsorption capacity increases with increase in temperature. Freundlich gave an empirical relationship between the quantity of fluoride adsorbed by the given amount of adsorbent and concentration of fluoride. The 1/n value and log k value at 40oC is indicating high values, it means the adsorption capacity is more at that temperature. In this study, the n values in Freundlich equation are calculated to vary within the range of 0.08-0.2; this indicates favourable adsorption of fluoride onto the studied adsorbents, as reported in other studies (10, 11). On the basis of determination coefficients, RSS, ASS, SEE and SD values the Freundlich model fit the adsorption isotherm data better than other two parameter models (Table-2).
log Ce
log X
/m
0.5 0.6 0.7 0.8 0.9 1.0 1.10.0
0.2
0.4
0.6
0.8
1.00 o C40 o C60 o C80 o C
Figure-10: Freundlich isotherms plots for removal of fluoride by Eleusine coracana seed powder
Langmuir isotherm: The linear plot of specific sorption (Ce/qe) against the equilibrium concentration (Ce), shows that the adsorption of fluoride by Eleusine coracana seed powder obeys the Langmuir model. The Langmuir constants Q0 and b were determined from the slope and intercept of the plot and are presented in Table-2.
Ce
Ce/Qe
5 10 15
-10
-5
0
5
10
0 O C40 O C60 O C80 O C
Figure-5.3.11: Langmuir isotherm adsorption isotherm for removal of fluoride by Eleusine coracana seed powder
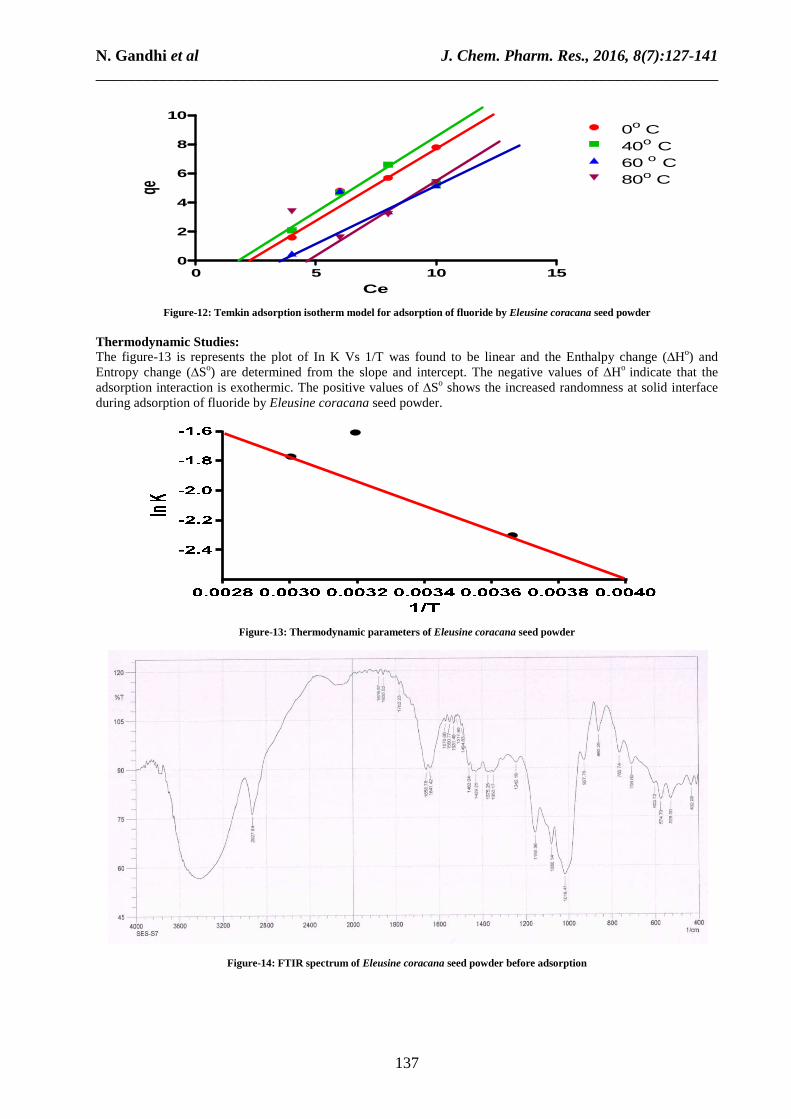
Temkin isotherm: The sorption data were analyzed according to the linear form of the Temkin isotherm and the linear plots are shown in Figure-12. Examination of the data shows that the Temkin isotherm provides a close fit to the fluoride sorption data. From the graph and table-2 it was found that the proposed Temkin isotherm is does not fit for the experimental data as compare to other adsorption isotherm models.
N. Gandhi et al J. Chem. Pharm. Res., 2016, 8(7):127-141 ______________________________________________________________________________
137
Ce
qe
0 5 10 150
2
4
6
8
100o C40o C60 o C80o C
Figure-12: Temkin adsorption isotherm model for adsorption of fluoride by Eleusine coracana seed powder
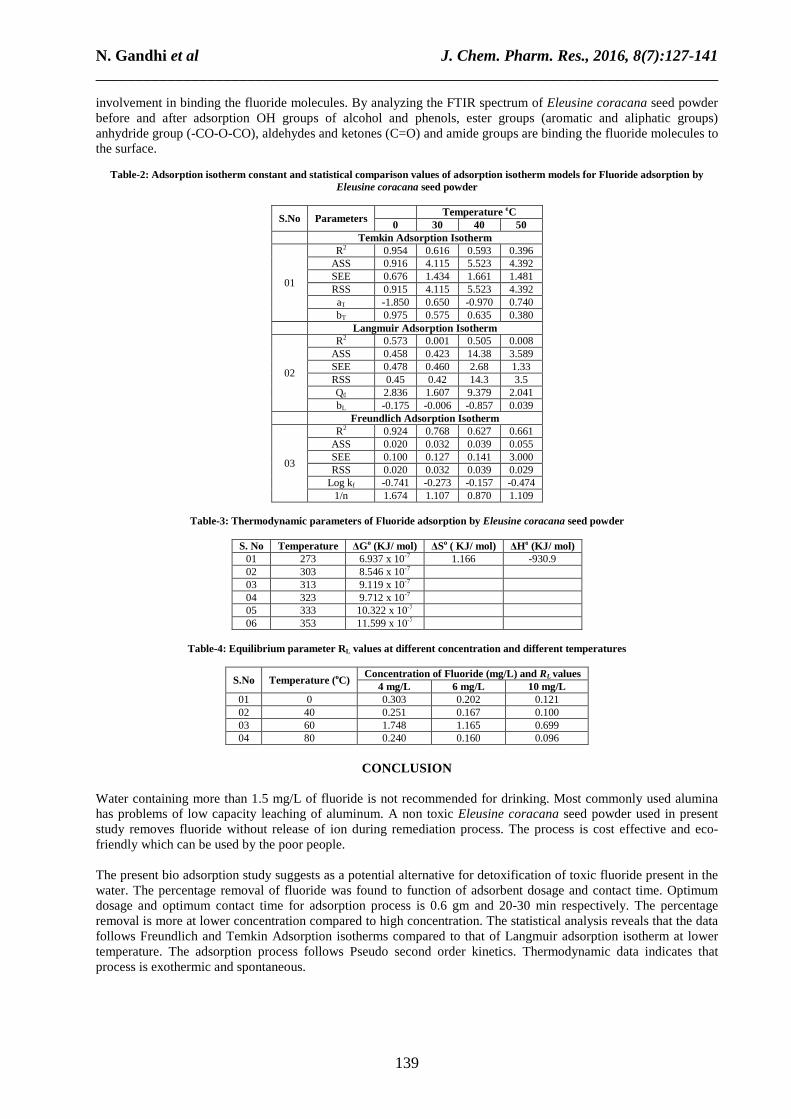
Thermodynamic Studies: The figure-13 is represents the plot of In K Vs 1/T was found to be linear and the Enthalpy change (∆Ho) and Entropy change (∆So) are determined from the slope and intercept. The negative values of ∆Ho indicate that the adsorption interaction is exothermic. The positive values of ∆So shows the increased randomness at solid interface during adsorption of fluoride by Eleusine coracana seed powder.
Figure-13: Thermodynamic parameters of Eleusine coracana seed powder
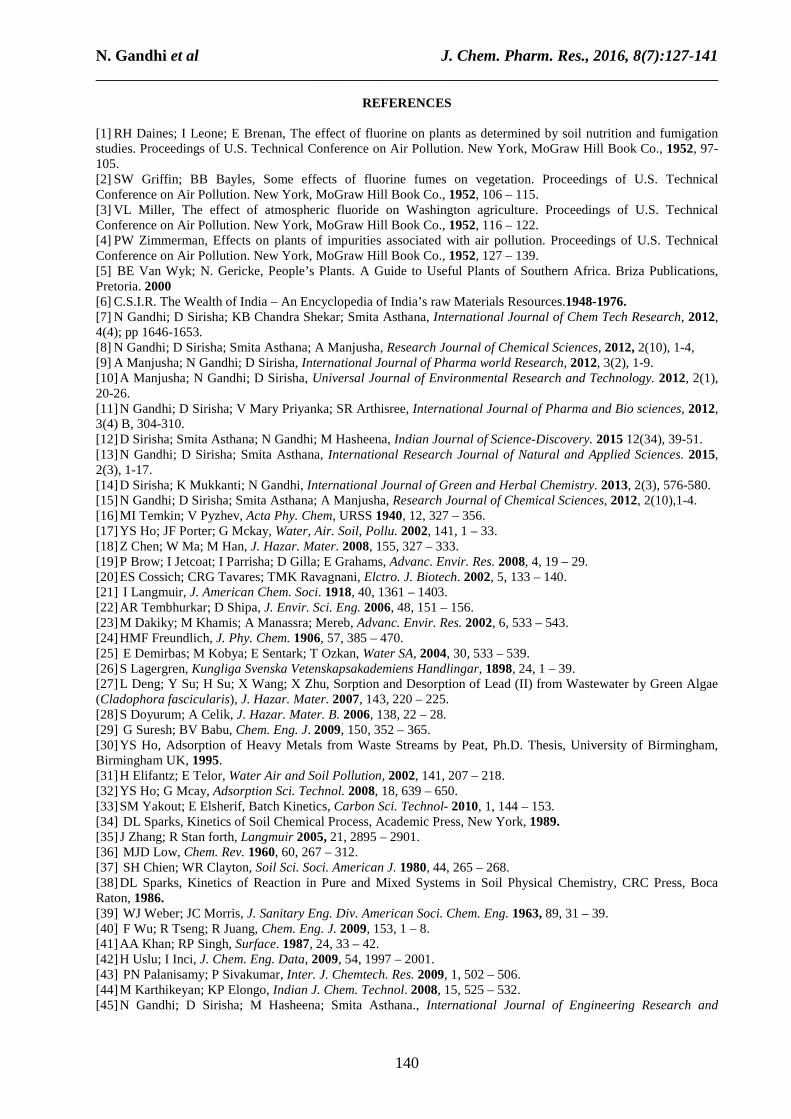
Figure-14: FTIR spectrum of Eleusine coracana seed powder before adsorption

N. Gandhi et al J. Chem. Pharm. Res., 2016, 8(7):127-141 ______________________________________________________________________________
138
Equilibrium parameter: Values of the dimensionless equilibrium parameter, RL, of different temperatures are calculated for the initial concentrations of Fluoride are given in table-4. The parameters explain the differences in the shapes of the isotherm. The observed RL values for Fluoride are between 0 to 1 and it indicative of the favourable adsorption [48 -49].
Figure-15: FTIR spectrum of Eleusine coracana seed powder after adsorption
Table-1: Kinetic parameters for adsorption of Fluoride by Eleusine coracana seed powder
S.No Parameters Fluoride concentration (4mg/L)
Fluoride concentration (6 mg/L)
Fluoride concentration (10 mg/L)
Pseudo first order kinetic model
01
R2 0 0 0 ASS - - - SEE 1.906 1.594 0 RSS 3.63 2.54 0.000 K1 - - -
Pseudo Second order kinetic model
02
R2 0.999 0.999 0.999 ASS 0.066 0.021 0.023 SEE 0.129 0.750 0.760 RSS 0.066 0.021 0.023 K2 0.284 0.199 0.137
Elovich model
03
R2 0.551 0.873 0.860 ASS 0.134 0.189 0.953 SEE 0.183 0.217 0.488 RSS 0.134 0.189 0.953 α 2.517 3.421 3.881 β 6.451 2.288 1.079
Intraparticle diffusion model
04
R2 0.179 0.414 0.401 ASS 0.258 1.019 4.714 kid 0.008 0.031 0.065 I 2.822 4.232 5.604
Fourier Transform Infrared Spectroscopy: The FTIR spectra of Eleusine coracana seed powder before adsorption and after adsorption were shown in figure-14 and figure-15. On comparing IR spectra it was found that there are significant changes were observed before and after adsorption process. The peaks at 3427.51 cm-1 shifts 3379.51 cm-1 indicates the involvement of –OH groups of bio polymeric compounds. The peaks at 1978.97 cm-1 and 1932.67 cm-1 have shown major differences in the region of 1900-2000 cm-1, which is due to asymmetric stretching of C=C bonds. The peaks in the region of 1500 to 1550 cm-1 (1550.77 cm-1, 1531.48 cm-1 and 1517.98 cm-1) have been shifted to great extent indicating the amino groups involvement in adsorption of fluoride from aqueous solution. The peaks in the 1400- 1500 cm-1 region (1494.83 cm-1, 1462.04 cm-1 and 1429.25 cm-1) have been modified to great extent indicating the presence of C-H groups
N. Gandhi et al J. Chem. Pharm. Res., 2016, 8(7):127-141 ______________________________________________________________________________
139
involvement in binding the fluoride molecules. By analyzing the FTIR spectrum of Eleusine coracana seed powder before and after adsorption OH groups of alcohol and phenols, ester groups (aromatic and aliphatic groups) anhydride group (-CO-O-CO), aldehydes and ketones (C=O) and amide groups are binding the fluoride molecules to the surface.
Table-2: Adsorption isotherm constant and statistical comparison values of adsorption isotherm models for Fluoride adsorption by
Eleusine coracana seed powder
S.No Parameters Temperature oC
0 30 40 50 Temkin Adsorption Isotherm
01
R2 0.954 0.616 0.593 0.396 ASS 0.916 4.115 5.523 4.392 SEE 0.676 1.434 1.661 1.481 RSS 0.915 4.115 5.523 4.392 aT -1.850 0.650 -0.970 0.740 bT 0.975 0.575 0.635 0.380
Langmuir Adsorption Isotherm
02
R2 0.573 0.001 0.505 0.008 ASS 0.458 0.423 14.38 3.589 SEE 0.478 0.460 2.68 1.33 RSS 0.45 0.42 14.3 3.5 Q0 2.836 1.607 9.379 2.041 bL -0.175 -0.006 -0.857 0.039
Freundlich Adsorption Isotherm
03
R2 0.924 0.768 0.627 0.661 ASS 0.020 0.032 0.039 0.055 SEE 0.100 0.127 0.141 3.000 RSS 0.020 0.032 0.039 0.029
Log kf -0.741 -0.273 -0.157 -0.474 1/n 1.674 1.107 0.870 1.109
Table-3: Thermodynamic parameters of Fluoride adsorption by Eleusine coracana seed powder
S. No Temperature ∆Go (KJ/ mol) ∆So ( KJ/ mol) ∆Ho (KJ/ mol)
01 273 6.937 x 10⁻⁷ 1.166 -930.9 02 303 8.546 x 10⁻⁷ 03 313 9.119 x 10⁻⁷ 04 323 9.712 x 10⁻⁷ 05 333 10.322 x 10⁻⁷ 06 353 11.599 x 10⁻⁷
Table-4: Equilibrium parameter RL values at different concentration and different temperatures
S.No Temperature (oC) Concentration of Fluoride (mg/L) and RL values
4 mg/L 6 mg/L 10 mg/L 01 0 0.303 0.202 0.121 02 40 0.251 0.167 0.100 03 60 1.748 1.165 0.699 04 80 0.240 0.160 0.096
CONCLUSION
Water containing more than 1.5 mg/L of fluoride is not recommended for drinking. Most commonly used alumina has problems of low capacity leaching of aluminum. A non toxic Eleusine coracana seed powder used in present study removes fluoride without release of ion during remediation process. The process is cost effective and eco-friendly which can be used by the poor people. The present bio adsorption study suggests as a potential alternative for detoxification of toxic fluoride present in the water. The percentage removal of fluoride was found to function of adsorbent dosage and contact time. Optimum dosage and optimum contact time for adsorption process is 0.6 gm and 20-30 min respectively. The percentage removal is more at lower concentration compared to high concentration. The statistical analysis reveals that the data follows Freundlich and Temkin Adsorption isotherms compared to that of Langmuir adsorption isotherm at lower temperature. The adsorption process follows Pseudo second order kinetics. Thermodynamic data indicates that process is exothermic and spontaneous.
N. Gandhi et al J. Chem. Pharm. Res., 2016, 8(7):127-141 ______________________________________________________________________________
140
REFERENCES
[1] RH Daines; I Leone; E Brenan, The effect of fluorine on plants as determined by soil nutrition and fumigation studies. Proceedings of U.S. Technical Conference on Air Pollution. New York, MoGraw Hill Book Co., 1952, 97-105. [2] SW Griffin; BB Bayles, Some effects of fluorine fumes on vegetation. Proceedings of U.S. Technical Conference on Air Pollution. New York, MoGraw Hill Book Co., 1952, 106 – 115. [3] VL Miller, The effect of atmospheric fluoride on Washington agriculture. Proceedings of U.S. Technical Conference on Air Pollution. New York, MoGraw Hill Book Co., 1952, 116 – 122. [4] PW Zimmerman, Effects on plants of impurities associated with air pollution. Proceedings of U.S. Technical Conference on Air Pollution. New York, MoGraw Hill Book Co., 1952, 127 – 139. [5] BE Van Wyk; N. Gericke, People’s Plants. A Guide to Useful Plants of Southern Africa. Briza Publications, Pretoria. 2000 [6] C.S.I.R. The Wealth of India – An Encyclopedia of India’s raw Materials Resources.1948-1976. [7] N Gandhi; D Sirisha; KB Chandra Shekar; Smita Asthana, International Journal of Chem Tech Research, 2012, 4(4); pp 1646-1653. [8] N Gandhi; D Sirisha; Smita Asthana; A Manjusha, Research Journal of Chemical Sciences, 2012, 2(10), 1-4, [9] A Manjusha; N Gandhi; D Sirisha, International Journal of Pharma world Research, 2012, 3(2), 1-9. [10] A Manjusha; N Gandhi; D Sirisha, Universal Journal of Environmental Research and Technology. 2012, 2(1), 20-26. [11] N Gandhi; D Sirisha; V Mary Priyanka; SR Arthisree, International Journal of Pharma and Bio sciences, 2012, 3(4) B, 304-310. [12] D Sirisha; Smita Asthana; N Gandhi; M Hasheena, Indian Journal of Science-Discovery. 2015 12(34), 39-51. [13] N Gandhi; D Sirisha; Smita Asthana, International Research Journal of Natural and Applied Sciences. 2015, 2(3), 1-17. [14] D Sirisha; K Mukkanti; N Gandhi, International Journal of Green and Herbal Chemistry. 2013, 2(3), 576-580. [15] N Gandhi; D Sirisha; Smita Asthana; A Manjusha, Research Journal of Chemical Sciences, 2012, 2(10),1-4. [16] MI Temkin; V Pyzhev, Acta Phy. Chem, URSS 1940, 12, 327 – 356. [17] YS Ho; JF Porter; G Mckay, Water, Air. Soil, Pollu. 2002, 141, 1 – 33. [18] Z Chen; W Ma; M Han, J. Hazar. Mater. 2008, 155, 327 – 333. [19] P Brow; I Jetcoat; I Parrisha; D Gilla; E Grahams, Advanc. Envir. Res. 2008, 4, 19 – 29. [20] ES Cossich; CRG Tavares; TMK Ravagnani, Elctro. J. Biotech. 2002, 5, 133 – 140. [21] I Langmuir, J. American Chem. Soci. 1918, 40, 1361 – 1403. [22] AR Tembhurkar; D Shipa, J. Envir. Sci. Eng. 2006, 48, 151 – 156. [23] M Dakiky; M Khamis; A Manassra; Mereb, Advanc. Envir. Res. 2002, 6, 533 – 543. [24] HMF Freundlich, J. Phy. Chem. 1906, 57, 385 – 470. [25] E Demirbas; M Kobya; E Sentark; T Ozkan, Water SA, 2004, 30, 533 – 539. [26] S Lagergren, Kungliga Svenska Vetenskapsakademiens Handlingar, 1898, 24, 1 – 39. [27] L Deng; Y Su; H Su; X Wang; X Zhu, Sorption and Desorption of Lead (II) from Wastewater by Green Algae (Cladophora fascicularis), J. Hazar. Mater. 2007, 143, 220 – 225. [28] S Doyurum; A Celik, J. Hazar. Mater. B. 2006, 138, 22 – 28. [29] G Suresh; BV Babu, Chem. Eng. J. 2009, 150, 352 – 365. [30] YS Ho, Adsorption of Heavy Metals from Waste Streams by Peat, Ph.D. Thesis, University of Birmingham, Birmingham UK, 1995. [31] H Elifantz; E Telor, Water Air and Soil Pollution, 2002, 141, 207 – 218. [32] YS Ho; G Mcay, Adsorption Sci. Technol. 2008, 18, 639 – 650. [33] SM Yakout; E Elsherif, Batch Kinetics, Carbon Sci. Technol- 2010, 1, 144 – 153. [34] DL Sparks, Kinetics of Soil Chemical Process, Academic Press, New York, 1989. [35] J Zhang; R Stan forth, Langmuir 2005, 21, 2895 – 2901. [36] MJD Low, Chem. Rev. 1960, 60, 267 – 312. [37] SH Chien; WR Clayton, Soil Sci. Soci. American J. 1980, 44, 265 – 268. [38] DL Sparks, Kinetics of Reaction in Pure and Mixed Systems in Soil Physical Chemistry, CRC Press, Boca Raton, 1986. [39] WJ Weber; JC Morris, J. Sanitary Eng. Div. American Soci. Chem. Eng. 1963, 89, 31 – 39. [40] F Wu; R Tseng; R Juang, Chem. Eng. J. 2009, 153, 1 – 8. [41] AA Khan; RP Singh, Surface. 1987, 24, 33 – 42. [42] H Uslu; I Inci, J. Chem. Eng. Data, 2009, 54, 1997 – 2001. [43] PN Palanisamy; P Sivakumar, Inter. J. Chemtech. Res. 2009, 1, 502 – 506. [44] M Karthikeyan; KP Elongo, Indian J. Chem. Technol. 2008, 15, 525 – 532. [45] N Gandhi; D Sirisha; M Hasheena; Smita Asthana., International Journal of Engineering Research and

N. Gandhi et al J. Chem. Pharm. Res., 2016, 8(7):127-141 ______________________________________________________________________________
141
Technology. 2014, 3(11), 1253-1262. [46] N Gandhi; D Sirisha; KB Chandra Shekar, Journal of International Academic Research for Multidisciplinary. 2014, 3(1), 253-272. [47] N Gandhi; D Sirisha; Vikas Chandra Sharma, International Journal of Engineering Research and Applications. 2014, 4(1), 01-12. [48] N Gandhi; D Sirisha; KB Chandra Shekar, World Journal of Pharmacy and Pharmaceutical Sciences, 2013, 2(5), 3897-3914. [49] N Gandhi; D Sirisha; KB Chandra Shekar, Asian Academic Research Journal of Multidisciplinary, 2013, 1(15), 112-137.