Embed Size (px)
Citation preview

Research ArticleIntegrating Apparent Conductance in ResistivitySounding to Constrain 2D Gravity Modeling for SubsurfaceStructure Associated with Uranium Mineralization acrossSouth Purulia Shear Zone West Bengal India
Arkoprovo Biswas Animesh MandalShashi Prakash Sharma and William Kumar Mohanty
Department of Geology and Geophysics Indian Institute of Technology Kharagpur Kharagpur 721302 West Bengal India
Correspondence should be addressed to Shashi Prakash Sharma spsharmaggiitkgpernetin
Received 29 May 2013 Revised 28 October 2013 Accepted 5 November 2013 Published 22 January 2014
Academic Editor Ruey-Juin Rau
Copyright copy 2014 Arkoprovo Biswas et al This is an open access article distributed under the Creative Commons AttributionLicense which permits unrestricted use distribution and reproduction in any medium provided the original work is properlycited
South Purulia Shear Zone (SPSZ) is an important area for the prospect of uranium mineralization and no detailed geophysicalinvestigations have been carried out in this region To delineate the subsurface structure in the present area vertical electricalsoundings using Schlumberger array and gravity survey were carried out along a profile perpendicular to the SPSZ Apparentconductance in the subsurface revealed a possible connection from SPSZ to RaghunathpurThe gravity model reveals the presenceof a northerly dipping low density zone (most likely the shear zone) extending up to Raghunathpur under a thin cover of graniticschist of Chotanagpur Granite Gneissic Complex (CGGC) The gravity model also depicts the depth of the zone of density lowwithin this shear zone at sim400m near Raghunathpur village and this zone truncates with a steep slope Integration of resistivityand gravity study revealed two possible contact zones within this low density zone in the subsurface at depth of 40m and 200mOur study reveals a good correlation with previous studies in Raghunathpur area characterized by medium to high hydro-uraniumanomalyThus the conducting zone coinciding with the low gravity anomaly is inferred to be a possible uraniummineralized zone
1 Introduction
Natural radioactive mineral deposits are found in suitablegeological environment like shear zones [1ndash4] unconformitycontacts veins and so forth [5 6] The mineralization mayoccur in vertical dipping and horizontal sheet-type struc-tures Uranium is highly conducting in nature and its pres-ence in the subsurface provides good conductivity contrastbetween ore deposit and host rock [7 8] making it possible tobe delineated by electrical resistivity methods Further nearsurface structural features such as the shear zones can also beidentified by detailed gravity measurements [9]
South Purulia Shear Zone (SPSZ) (Figure 1 after [10])consists of mainly granite gneiss amphibolites phyllitesschist carbonatite and quartz-magnetite-apatite rocks and isof early mesoproterozoic age Subsurface signature of urani-um has been found in the existing apatite mine at Beldih
but detailed geophysical activities are very limited in thatarea Most of the previous studies deal with regional gravityand magnetic survey over the Eastern Indian Shield [11ndash13] The Bouguer gravity anomaly map and magnetic data[14] suggest that there is a contrasting change from theSinghbhum Granite Craton in the south to the CGGC in thenorth but the detailed subsurface structure is little known inthe present areaThegravity study shows a broad low anomalyzone [14] There is a very good correlation with the nature ofUranium deposit in Beldih mine with the Uranium presentin different locations of Singhbhum Shear Zone [15 16]Chemical analysis of water samples also shows presence ofUranium in the subsurfacewater (sim40m) collected fromdeeptube well [17] All of these studies prompted us for furtherdetailed subsurface investigation
In the present study deep resistivity sounding apparentconductance and gravity measurements were carried out
Hindawi Publishing CorporationInternational Journal of GeophysicsVolume 2014 Article ID 691521 8 pageshttpdxdoiorg1011552014691521
2 International Journal of Geophysics
2308∘
2300∘
2292∘
8633∘
8667∘
2308∘
2300∘
2292∘
Raghunathpur
Beldih
MednitnarBarabazar South Purulia Shear Zone
Kutni
Amphibolite hornblende-schist in SG
Plutons of granitoid gneiss
South Purulia Shear Zone
Delhi
Study area
8633∘
8667∘
Chotanagpur Granite Gneissic Complex (CGGC)
Phyllite with minor schist of Singhbhum group (SG)
Amphibolite hornblende-schist in CGGC
N
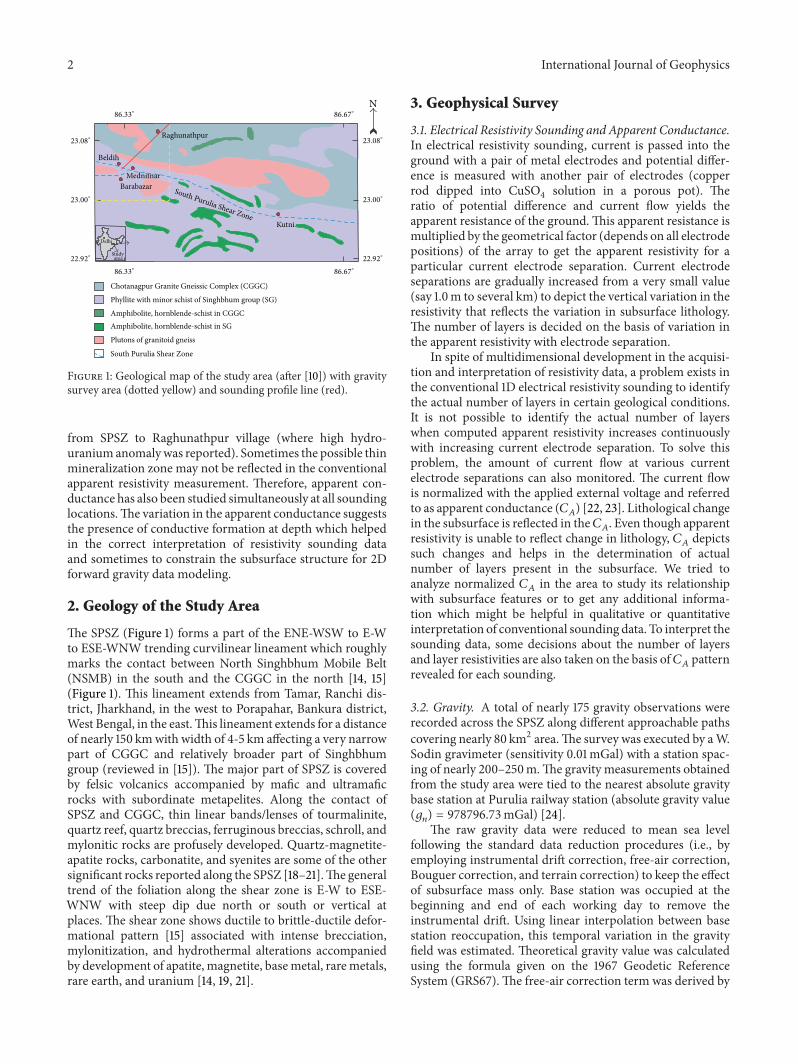
Figure 1 Geological map of the study area (after [10]) with gravitysurvey area (dotted yellow) and sounding profile line (red)
from SPSZ to Raghunathpur village (where high hydro-uraniumanomalywas reported) Sometimes the possible thinmineralization zone may not be reflected in the conventionalapparent resistivity measurement Therefore apparent con-ductance has also been studied simultaneously at all soundinglocationsThe variation in the apparent conductance suggeststhe presence of conductive formation at depth which helpedin the correct interpretation of resistivity sounding dataand sometimes to constrain the subsurface structure for 2Dforward gravity data modeling
2 Geology of the Study Area
The SPSZ (Figure 1) forms a part of the ENE-WSW to E-Wto ESE-WNW trending curvilinear lineament which roughlymarks the contact between North Singhbhum Mobile Belt(NSMB) in the south and the CGGC in the north [14 15](Figure 1) This lineament extends from Tamar Ranchi dis-trict Jharkhand in the west to Porapahar Bankura districtWest Bengal in the eastThis lineament extends for a distanceof nearly 150 kmwith width of 4-5 km affecting a very narrowpart of CGGC and relatively broader part of Singhbhumgroup (reviewed in [15]) The major part of SPSZ is coveredby felsic volcanics accompanied by mafic and ultramaficrocks with subordinate metapelites Along the contact ofSPSZ and CGGC thin linear bandslenses of tourmalinitequartz reef quartz breccias ferruginous breccias schroll andmylonitic rocks are profusely developed Quartz-magnetite-apatite rocks carbonatite and syenites are some of the othersignificant rocks reported along the SPSZ [18ndash21]The generaltrend of the foliation along the shear zone is E-W to ESE-WNW with steep dip due north or south or vertical atplaces The shear zone shows ductile to brittle-ductile defor-mational pattern [15] associated with intense brecciationmylonitization and hydrothermal alterations accompaniedby development of apatite magnetite basemetal raremetalsrare earth and uranium [14 19 21]
3 Geophysical Survey
31 Electrical Resistivity Sounding and Apparent ConductanceIn electrical resistivity sounding current is passed into theground with a pair of metal electrodes and potential differ-ence is measured with another pair of electrodes (copperrod dipped into CuSO
4solution in a porous pot) The
ratio of potential difference and current flow yields theapparent resistance of the groundThis apparent resistance ismultiplied by the geometrical factor (depends on all electrodepositions) of the array to get the apparent resistivity for aparticular current electrode separation Current electrodeseparations are gradually increased from a very small value(say 10m to several km) to depict the vertical variation in theresistivity that reflects the variation in subsurface lithologyThe number of layers is decided on the basis of variation inthe apparent resistivity with electrode separation
In spite of multidimensional development in the acquisi-tion and interpretation of resistivity data a problem exists inthe conventional 1D electrical resistivity sounding to identifythe actual number of layers in certain geological conditionsIt is not possible to identify the actual number of layerswhen computed apparent resistivity increases continuouslywith increasing current electrode separation To solve thisproblem the amount of current flow at various currentelectrode separations can also monitored The current flowis normalized with the applied external voltage and referredto as apparent conductance (119862
119860) [22 23] Lithological change
in the subsurface is reflected in the119862119860 Even though apparent
resistivity is unable to reflect change in lithology 119862119860depicts
such changes and helps in the determination of actualnumber of layers present in the subsurface We tried toanalyze normalized 119862
119860in the area to study its relationship
with subsurface features or to get any additional informa-tion which might be helpful in qualitative or quantitativeinterpretation of conventional sounding data To interpret thesounding data some decisions about the number of layersand layer resistivities are also taken on the basis of119862
119860pattern
revealed for each sounding
32 Gravity A total of nearly 175 gravity observations wererecorded across the SPSZ along different approachable pathscovering nearly 80 km2 areaThe survey was executed by aWSodin gravimeter (sensitivity 001mGal) with a station spac-ing of nearly 200ndash250mThe gravity measurements obtainedfrom the study area were tied to the nearest absolute gravitybase station at Purulia railway station (absolute gravity value(119892
119899) = 97879673mGal) [24]The raw gravity data were reduced to mean sea level
following the standard data reduction procedures (ie byemploying instrumental drift correction free-air correctionBouguer correction and terrain correction) to keep the effectof subsurface mass only Base station was occupied at thebeginning and end of each working day to remove theinstrumental drift Using linear interpolation between basestation reoccupation this temporal variation in the gravityfield was estimated Theoretical gravity value was calculatedusing the formula given on the 1967 Geodetic ReferenceSystem (GRS67)The free-air correction term was derived by
International Journal of Geophysics 3
the standard free-air gradient of 03086 mGalm (neglectinghigher order terms) To compute the Bouguer correction theaverage crustal density was taken as 267 gcm3 Topographi-cally the study area was almost flatThus the terrain effect ascalculated from themass integral method [25] was very smallto affect the Bouguer anomaly significantly Bouguer anomalymap after the data reduction is shown in Figure 2
33 Regional-Residual Separation The separation of theregional component from the Bouguer anomaly is a crucialstep in subsurface gravity study for mineral exploration pointof view as the residual part is contributed solely by thenear surface density distribution In the present study theregional-residual separation was done using trend surfaceanalysis method [26] Third degree polynomial is used as theregional field for gravity anomaly (Figure 3)This polynomialgives the regional values at the analyzed points and theresidual anomaly (Figure 4) values were obtained by directsubtraction of the regional values from the observed Bougueranomaly values The high residual anomaly on the north-east part (east of Raghunathpur village) and south-west (nearBarabazar) are due to the high density metabasic rocksand compact granite intrusion within mica schistphyllitesrespectively The highly altered rocks and brecciated granitein themiddle part of the study area is depicted by a low gravityanomaly zone along the NW-SE trending shear zone Thisalso reveals the width of the shear zone Thus the residualgravity anomaly map shows a good correlation with thesurface geology
4 Results and Interpretations
41 Electrical Resistivity Sounding and Apparent ConductanceSchlumberger resistivity soundings were performed at 5 loca-tions (Figure 1) along a profile perpendicular to the SPSZThespread of current electrodes was kept approximately parallelto the known geological strike (NW-SE direction) for smoothvariation in the apparent resistivity Current electrodes wereexpanded with AB2 = 3 to 1000m to delineate the structuresextending to depth of 250m Since the apparent resistivitydata shows a continuously increasing trend with depth orcurrent electrode spacing (AB2) it was interpreted using 2-3- 4- and 5-layer model However the interpreted resistivityand thickness were erroneous and uncertainties in the modelparameter were very high without considering 119862
119860
We have studied the 119862119860data for each sounding simul-
taneously with apparent resistivity data First the mea-sured current flow at various current electrode spacings isnormalized with the applied voltage to obtain the currentflow for a unit applied voltage Subsequently each value isalso normalized with the 119862
119860computed at the first current
electrode separation Since the local condition varies at eachsounding location we again normalized each data by thecorresponding maximum value of 119862
119860(Figure 5) for unifor-
mity at various soundings This shows a good correlation inthe 119862
119860at each sounding and depicts an increased 119862
119860zone
(Figure 5) Soundings S5 S4 S2 and S1 show a maximum119862
119860(Figure 5) at a deeper depth (current electrode spacing
250m to 400m AB2) 119862119860is also contoured taking all the
Bouguer anomaly map
Longitude (deg)
Latit
ude (
deg)
Raghunathpur
S1S2
S3
S4
S5
2312
231
2308
2306
2304
2302
23
8637 8638 8641 8642 8643 8644
Barabazar
(mGal)
minus2
minus4
minus6
minus8
minus10
minus12
minus14
minus16
8639 864
Figure 2 Bouguer anomaly map of the study area Plus (+) symbolsare the gravity survey locations
Longitude (deg)
Latit
ude (
deg)
2312
231
2308
2306
2304
2302
23
8637 8638 8641 8642 8643 8644(mGal)
minus4
minus6
minus8
minus10
minus12
minus14
8639 864
Regional gravity anomaly map
Figure 3 Regional gravity anomaly map of the study area after 3rddegree trend surface fitting to Bouguer anomaly Plus (+) symbolsare the gravity survey locations
soundings into consideration Figure 6 shows the contourmap of normalized 119862
119860which clearly depicts conducting
layers at depth The green dotted line demarcates (Figure 5)as the probable conducting zones which might be associatedwith uranium mineralized zone Thus such normalized 119862
119860
can be very effective in delineating the subsurface conductorwhere the formation is dipping and cannot be delineatedusing conventional resistivity data interpretation techniqueThis normalized 119862
119860helps us to interpret the different layers
in the sounding data and is very effective in delineating thesubsurface layers accurately
411 Interpretation of Resistivity Sounding Data Resistivitysounding data is interpreted using 1D very fast simulatedannealing global optimization inversion technique [27 28]
4 International Journal of Geophysics
Longitude (deg)
Latit
ude (
deg)
2312
231
2308
2306
2304
2302
23
8637 8638 8641 8642 8643 8644 (mGal)8639 864
Residual gravity anomaly map
A
6
5
4
3
2
1
0
minus1
minus2
minus3
minus4
Raghunathpur
S1S2
S3
S4
S5
Barabazar
A998400
Figure 4 Residual gravity anomaly map of the study area afterseparation of 3rd degree trend surface polynomial from Bougueranomaly Plus (+) symbols are the gravity survey locations
Normalized apparent conductance
App conductance (mS)
AB2
(m)
1
10
100
1000
0 05 1
NE0 05 1 0 05 1 0 05 1 0 05 1
S1S2 S3S4S5
Figure 5 Normalized apparent conductance (119862119860) for five sound-
ings
AB2
(m)
Distance (km)
Raghunathpur NE
095
08
065
05
035
02
005
1
10
100
S1S2 S3S4S5
055
055 0
55
055
055
055
055
03
03
03
03
03
03
03
0 15 30 45 60 75
Nor
mal
ised
app
cond
ucta
nce (
mS)
Figure 6 2D Pseudo section contoured from normalized apparentconductance (119862
119860) of five soundings
Interpretation of sounding data without considering the 119862119860
may yield erroneous result and hence may not match withgeologic section Therefore we present the interpretationof soundings using number of layers on the basis of 119862
119860
Figure 7 presents the comparison between the observed andmodel data for all five soundings and their correspondingapparent conductance Figure 7(a) shows that model datafor soundings S1 and S3 could not fit precisely (especiallythe later part of the sounding data) due to fact that slopeof soundings S1 and S3 is more than 45∘ The resistivitysounding data shows that apparent resistivity is continuouslyincreasingwith depth after 10ndash20mAB2 values Hence it canbe understood that there is a massive resistive layer beneaththe near surface conducting layer corresponding to AB2values of 10ndash20m However this is not true either there aredifferent geological layers that are not seen in the 119862
119860data
or there are fractures in the massive resistive layer Since theseparation between S5 and S1 is 6 km it is unlikely that thereare only fractures which can cause such a correlatable 119862
119860
In principle only 3-layer models are sufficient to fit allresistivity sounding data However such interpretation willbe misleading A multiple layer model is selected on thebasis of 119862
119860and interpreted the sounding data However
such results have been arrived in a systematic manner afterconstraining some model parameters If we allow all themodel parameters to vary in the inversion process a highlynonuniquemodelwill be obtained To avoid this we first triedto match limited data sets using 3-layer models Whenmodeldata exactly matches with limited observed data the modelparameters are very near to the actual resistivity and thicknessindicating very small uncertainties in model parameters Inthe next step we fixed the model parameter for 3 layers andagain interpreted the complete data set using multiple layermodels This approach was very much helpful in interpretingthe resistivity sounding data where the formation of thesubsurface layer is dipping This yields very good resultscompared to the conventional method of resistivity datainterpretation technique Finally we are able to interpret thesounding data with the help of this method The interpretedmodel parameters are shown in Table 1
42 Gravity Methods At the middle portion of the Bouguerand residual gravity anomaly maps the ENE-WSW trendingnegative gravity anomaly zone is identified as the existingSPSZ (Figures 2 and 4) The intense brecciation myloniti-zation and ductile to brittle-ductile deformational patternof the shear zone mixed with quartz breccias ferruginousbreccias schroll and mylonitic rocks cause this negativegravity anomaly zone In the residual gravity anomaly mapthe closely spaced contour clearly indicates the existence ofsome shallow surface fracturesfaultscontact along parallelas well as across the shear zone (Figure 4) To get betterinterpretation of the subsurface the residual gravity datamodeling is performed
421 2D Forward Modeling of Residual Gravity AnomalyIn the present study 2D forward modeling approach wasemployed along a profile AA1015840 across the shear zone andpassing through the south-east of Raghunathpur village
International Journal of Geophysics 5
S1 S2 S3 S4 S510000
1000
100
10
10000
1000
100
10
1000
100
10
10000
1000
100
10
10000
1000
100
10
1 10 100 1000 1 10 100 1000 1 10 100 1000 1 10 100 1000 1 10 100 1000
Observed dataModel data
AB2 (m) AB2 (m) AB2 (m) AB2 (m) AB2 (m)
App
res
(Ohm
middotm)
(a)
App
cond
ucta
nce
(mS)
06
04
02
0
04
02
0
8
4
0
04
02
0
16
08
0
S1 S2 S3 S4 S5
1 10 100 1000 1 10 100 1000 1 10 100 1000 1 10 100 1000 1 10 100 1000
AB2 (m) AB2 (m) AB2 (m) AB2 (m) AB2 (m)
(b)
Figure 7 Fitting between the observed (solid dot) and calculated (continuous line) apparent resistivity of all soundings (S1ndashS5) and theircorresponding apparent conductance (119862
119860)
Table 1 Interpreted model parameters for five soundings
Parameters S1 S2 S3 S4 S51205881 (Ωm) 1313 1691 128 6801 25221205882 (Ωm) 221 503 159 920 17601205883 (Ωm) 9854 3875 1502 1671 48401205884 (Ωm) 1980 8462 97382 99756 26221205885 (Ωm) 94216 10116 8588 1695 957201205886 (Ωm) 7956 9360 99022 mdash 15701205887 (Ωm) 99772 74155 mdash mdash mdashℎ1 (m) 51 12 12 15 07ℎ2 (m) 23 43 88 42 59ℎ3 (m) 748 92 289 53 249ℎ4 (m) 10 331 997 1980 954ℎ5 (m) 997 618 101 mdash 874ℎ6 (m) 100 79 mdash mdash mdash
Misfit 68 times
10
minus3
13 times
10
minus2
22 times
10
minus3
12 times
10
minus3
34 times
10
minus4
(Figure 4) The study area mostly covered by weathered tocompact schist and the density of this layer is modeled as2650 kgm3 [29] The existing brecciated quartz vein almostparallel to the SPSZ is modeled with a density of 2470 kgm3Below these layers a 4-5 km wide highly sheared granite layermixed with quartz breccias ferruginous breccias schrolland mylonitic rocks (with assumed density 2270 kgm3) isidentified as the surface extension of the SPSZ The compactgranite and amphibolite hornblende-schist rocks as exposedon the north-east of Raghunathpur and over the southernside this shear zone are modeled with density varying from2790 to 2970 kgm3 assuming a granitic basement of density
2670 kgm3 [29]The 2-D forwardmodels along these profileswere performed with the GRAVMAG software [30] keepingthe above geological constraints in mindThe software calcu-lates the gravity effect for structures of infinite strike lengthand polygonal cross-section using the solution of Hubbert[31] and Talwani et al [32] Modeling along profile AA1015840(Figure 8) shows the subsurface gravity structure without anyresistivity constrain but only using the local geology Theestimated thickness of high density rocks on either side ofthe shear zone is quite largeThe fitting between the observedand calculated anomaly gives an rms misfit of 012mGalHowever the interpreted apparent conductance from theresistivity data (from soundings S1 and S2) as collected alongthe same profile suggests the existence of two contact zonesat sim40m and sim200m near to Raghunathpur village But thegravity model (Figure 8) does not reflect any contact zoneson these depths However after constraining the thickness ofhigh density layer and the depth of the contact zones (at about40m and 200m) according to resistivity data the gravitymodel shows a better match with the observed and calculatedanomaly and gives an rms misfit of 009mGal The widthof the low gravity zone is nearly 5 km which is identified asthe width of the existing shear zone The conducting zonesdepicted in resistivity sounding are identified as the contactbetween compact granite and metabasicmafic-ultramaficrocks (2790 kgm3) and low density material (2270 kgm3)possibly sheared granite and mineralization (Figure 9)Figure 9 is more realistic and follows the local geology Thebest fit 2-D models along the profile AA1015840 (Figure 9) suggestthe existence of mafic-ultramafic and metabasic volcanicrocks (of density 2790ndash2970 kgm3) on either side of theexisting shear zone (of density 2270 kgm3) with graniticbasement (of density 2670 kgm3) The gravity model along
6 International Journal of GeophysicsRe
sidua
l gra
vity
anom
aly
(mG
al)
Distance (m)
Rms misfit = 012 mGal
ObservedCalculated
4
2
0
minus2
minus4
0 2000 4000 6000 8000 10000
NE
A998400A
(a)
Dep
th (m
)
0
minus200
minus400
minus600
minus800
minus1000
SPSZRaghunathpur
S1S2 S3S4S5
2470
Kgm
3
2970
Kgm
3
2270 Kgm3
2790 Kgm3
2650 Kgm3
Distance (m)0 2000 4000 6000 8000 10000
2650 Kgm3
2790 Kgm3
2670 Kgm3
(b)
Figure 8 2D model along AA1015840 without resistivity constraints withrms misfit 012mGal The red dashed line in the model sectionindicating the width of the South Purulia Shear Zone (SPSZ)
this profile also clearly suggests the existence of northerlydipping structure
422 2D Inverse Modeling of Residual Gravity Anomaly The2-D compact inversion approach [33] has also been employedalong the same profile (AA1015840) (Figure 4) with vertical layers atdepths 1m 10m 40m 100m 200m 400m 600m 800mand 1000m The 40m and 200m layers were chosen asthe resistivity results suggest the existence of contact zonesat these depths It is highlighted here that the cell sizealong the profile is taken as 100m Considering the surfacegeology the density range was chosen as 2000ndash3000 kgm3for inversionThis approach tries to fit the observed anomalywith minimum area of source density distribution keepingmisfit as very low value [33 34] Modeling along profile AA1015840(SW-NE Figure 10) shows the subsurface gravity structuremostly as vertical The shear zone is identified as northerlydipping low density zones with nearly 5 kmwidth (alongAA1015840Figure 10) This is in well agreement with the existing litera-tures [17] The estimated thickness of high density rocks oneither side of the shear zone is quite large (going beyond1000m) Just south of Raghunathpur village the lowest
Resid
ual g
ravi
ty an
omal
y (m
Gal
)
Distance (m)
Rms misfit = 009 mGal
4
2
0
minus2
minus4
0 2000 4000 6000 8000 10000
NE
ObservedCalculated
A998400A
(a)
Dep
th (m
)
0
minus200
minus400
minus600
minus800
minus1000
SPSZRaghunathpur
S1S2 S3S4S5
2970
Kgm
3
2470
Kgm
3
2270 Kgm3
2790 Kgm3
2650 Kgm3
Distance (m)0 2000 4000 6000 8000 10000
2650 Kgm3
2670 Kgm3
2790
Kgm
3
(b)
Figure 9 2D model along AA1015840 with resistivity constraint Therms misfit is 009mGal The red dashed line in the model sectionindicating the width of the South Purulia Shear Zone (SPSZ)
density zone (density le 2500 kgm3) within the above shearzone depicts some vertical layers with gradually decreasingof density from 2650 kgm3 at the surface to lower than2400 kgm3 at the center of the lowest anomaly zone Thelowest density zone (density lt 2500 kgm3) extends to adepth of 400m approximately The interpreted apparentconductance from the resistivity data collected along thesame profile also suggests the existence of conductive contactzones The depth of these low density contact zones is shal-lower near Raghunathpur village and gradually increasingtowards south
5 Discussion
Gravity data suggest a low anomaly zone within the widthof the shear zone Resistivity soundings 1 and 2 carriedout in this location show a high 119862
119860at a depth of around
80m AB2 (sim40m) and 400m AB2 (sim200m) (currentelectrode spacing) It is also evident from the fact that onthat particular zone and at shallow depth hydro-uraniumanomaly has been reported at a depth of around 40m [17]
International Journal of Geophysics 7
Rms misfit = 00023 mGal
Calculated
0 2000 4000 6000 8000 10000
NE4
2
0
minus2
minus4
Observed (100m interpolation)
Resid
ual g
ravi
ty
anom
aly
(mG
al)
A998400A
(a)
Dep
th (m
)
RaghunathpurS1S2 S3S4S5
Distance (m)0 2000 4000 6000 8000 10000
0
minus200
minus400
minus600
minus800
minus1000
SPSZ
(kgm3)2400 2500 2600 2700 2800 2900 3000
(b)
Figure 10 2D residual gravity inverse model along profile AA1015840(Figure 4) The rms misfit is 00023mGal The red dashed line inthe model section indicating the width of the South Purulia ShearZone (SPSZ)
particularly in sounding 1 which is exactly on the samelocation of high anomaly The contact between schist andgranite at a depth below this region appears to be the hostof uranium mineralization The updated gravity model afterconstraining with 119862
119860and resistivity data are in agreement
The 2-D gravity inverse model is also in agreement with theintegration of apparent conductance to constrain forwardgravity modeling In particular the high to low densityalteration zones (Figure 10) are also correlating well withthe conducting layer at sounding locations (S1) Also thecoincidence of low gravity anomaly and a high conductivezone at around 200m depth near to Raghunathpur villagealso indicates signature of possible uranium mineralizationwithin the contact of sheared granite and mafic-ultramaficrocks According to the model the lowest density zone isextending up to sim400m depth Again the 2-D model alongthe profile indicates the presence of almost vertical alterationzones near to the south of Raghunathpur village Moreoverpresence of uraniummineralization and its extension has alsobeen confirmed from integrated geophysical studies aroundBeldihmine [35 36] together with drilled bore-hole data [16]
6 Conclusions
Electrical resistivity and gravity surveys performed aroundSPSZ clearly revealed subsurface structure associated with
uranium mineralization A continuously increasing trendin apparent resistivity with depth and a wide low gravityanomaly zone has been observed along a NE-SWprofile Dueto suppression problems in DC resistivity interpretation anddipping subsurface structures it is difficult to determine theactual resistivity and thickness of the layer parameter usingthe conventional interpretation method Apparent conduc-tance plots help in identifying different subsurface layers andto interpret the resistivity data accordingly The lithologicalboundaries interpreted from 119862
119860data used to constrain the
subsurface structure tomodel the gravity data revealed a goodcorrelation with the local geology of the areaThe constraintsfrom resistivity data revealed efficacy of 119862
119860in modeling
gravity data from such complex region Both forward andinverse gravity models revealed good correlation with theconducting structure Therefore the zones of low resistivitycoinciding with low density (negative gravity anomaly) alongthe SPSZ are expected to be the possible zone of uraniummineralization
Conflict of Interests
The authors declare that there is no conflict of interestsregarding the publication of this paper
Acknowledgments
Gravity data is a part of the project work sponsored bythe Atomic Mineral Directorates (AMD) and the BRNSunder Department of Atomic Energy Government of IndiaThe authors gratefully acknowledge the financial assistanceprovided by the BRNS under Department of Atomic EnergyGovernment of India (Project no 20073685-BRNS) in col-laboration with Atomic Minerals Directorate for Explorationand Research (AMD) Eastern Region Jamshedpur Theythank the anonymous reviewers for their comments andsuggestions that have improved the paper This paper is apart of collaborative PhD work of Arkoprovo Biswas andAnimesh Mandal who thank IIT Kharagpur for InstituteResearch Fellowship to pursue their work
References
[1] K L Bhola Y N RamaRao C S Sastry andN RMehta ldquoUra-nium mineralization in Singhbhum thrust belt Bihar IndiardquoEconomic Geology vol 61 no 1 pp 162ndash173 1966
[2] A K Saha ldquoCrustal evolution of Singhbhummdashnorth Orissaeastern Indiardquo Memoirs of the Geological Society of India vol27 p 341 1994
[3] B Krıbek K Zak P Dobea et al ldquoThe Rozna uranium deposit(Bohemian Massif Czech Republic) shear zone-hosted lateVariscan and post-Variscan hydrothermalmineralizationrdquoMin-eralium Deposita vol 44 no 1 pp 99ndash128 2009
[4] S I Turchenko A B Vrevsky and V B Dagelaisky ldquoThe pre-cambrianmetallogeny of IndiardquoGeology of Ore Deposits vol 51no 4 pp 317ndash329 2009
[5] D S Bhattacharyya ldquoEarly proterozoic metallogeny tectonicsand geochronology of the singhbhum CuU belt eastern IndiardquoPrecambrian Research vol 58 no 1ndash4 pp 71ndash83 1992
8 International Journal of Geophysics
[6] V Tuncer M J Unsworth W Siripunvaraporn and J ACraven ldquoExploration for unconformity-type uranium depos-its with audiomagnetotelluric data a case study from theMcArthur River mine Saskatchewan Canadardquo Geophysics vol71 no 6 pp B201ndashB209 2006
[7] G Nimeck and R Koch ldquoA progressive geophysical explorationstrategy at the Shea Creek uranium depositrdquo Leading Edge vol27 no 1 pp 52ndash63 2008
[8] J M Legault D Carriere and L Petrie ldquoSynthetic modeltesting and distributed acquisition dc resistivity results overan unconformity uranium target from the Athabasca Basinnorthern Saskatchewanrdquo Leading Edge vol 27 no 1 pp 46ndash512008
[9] W KMohanty AMandal S P Sharma S Gupta and SMisraldquoIntegrated geological and geophysical studies for delineationof chromite deposits a case study from Tangarparha OrissaIndiardquo Geophysics vol 76 no 5 pp B173ndashB185 2011
[10] A Chakrabarty A K Sen and T K Ghosh ldquoAmphibolemdasha keyindicator mineral for petrogenesis of the Purulia carbonatiteWest Bengal Indiardquo Mineralogy and Petrology vol 95 no 1-2pp 105ndash112 2009
[11] R K Verma A U S Sarma and M Mukhopadhyay ldquoGravityfield over Singhbhum its relationship to geology and tectonichistoryrdquoTectonophysics vol 106 no 1-2 pp 87ndash93 97ndash107 1984
[12] R K Verma P D V S Rao and M Mukhopadhyay ldquoAnalysisof gravity field over Singhbhum region and evolution of Singhb-hum cratonrdquo in Recent Researches in Geology A K Saha Edvol 16 pp 123ndash133 Hindustan Publishing Corporation NewDelhi India 1996
[13] L K Das C S Pathak N P Singh D K Saha M K Rai andD C Naskar ldquoA look at the metallogeny of Singhbhum India ageophysical approachrdquo Indian Minerals vol 51 no 1-2 pp 107ndash122 1997
[14] A Gupta and A Basu ldquoNorth Singhbhum Proterozoic mobilebelt eastern Indiamdasha reviewrdquoGeological Survey of India vol 55pp 195ndash226 2000
[15] A Acharyya S Ray B K Chaudhuri S K Basu S K Bhaduriand A K Sanyal ldquoProterozoic rock suites along south PuruliaShear Zone eastern India evidence for rift-related settingrdquoJournal of the Geological Society of India vol 68 no 6 pp 1069ndash1086 2006
[16] V J Katti J Sen andA K Bhatt ldquoUraniumpotentiality of southPurulia Shear Zone eastern India shieldrdquo in Proceedings of theTechnical Committee Meeting on Low Grade Uranium DepositsIAEA Vienna Austria March 2010
[17] A K Dwivedi J Sen C Murugan et al ldquoThe applicationof hydrogeochemical method in uranium explorationmdasha casestudy from Barabazar-Manbazar area Purulia district WestBengalrdquo Journal of the Geological Society of India vol 72 no4 pp 561ndash570 2008
[18] T K Baidya ldquoApatite-magnetite deposit in the chhotanagpurgneissic complex Panrkidih area Purulia District West Ben-galrdquo Indian Journal of Geology vol 64 pp 88ndash95 1992
[19] S K Basu ldquoAlkaline-carbonatite complex in Precambrian ofsouth Purulia Shear Zone eastern India its characteristics andmineral potentialitiesrdquo Indian Minerals vol 47 no 3 pp 179ndash194 1993
[20] A K G Roy and P R Sengupta ldquoAlkalic-carbonatitic magma-tism and associated mineralisation along the Porapahar-Tamarlineament in the Proterozoics of Purulia District West BengalrdquoIndian Journal of Earth Sciences vol 20 no 3-4 pp 193ndash2001993
[21] Y Vapnik S Bushmin A Chattopadhyay and D Dolivo-Dobrovolsky ldquoFluid inclusion and mineralogical study of vein-type apatite ores in shear zones from the Singhbhum metallo-genetic provinceWest Bengal IndiardquoOre Geology Reviews vol32 no 1-2 pp 412ndash430 2007
[22] A Biswas and A Mandal ldquoCurrent flow attribute in resistivitysounding to constrain gravity model around south PuruliaShear zonerdquo in Proceedings of the International Workshop onRecent Advances in Ground and Airborne Electromagnetic Meth-odsmdashInnovations in Processing and InversionTechniques pp 65ndash67 AMD-NGRI-GSI Hyderabad India September 2011
[23] S P Sharma and A Biswas ldquoA practical solution in delineatingthin conducting structures and suppression problem in directcurrent resistivity soundingrdquo Journal of Earth System Sciencevol 122 no 4 pp 1065ndash1080 2013
[24] M N Qureshy D V S Rao S C Bhatia P S Aravamadhuand C Subrahmanyam ldquoGravity bases established in India byNGRImdashpart IVrdquo Geophysical Research Bulletin vol 11 no 2pp 136ndash152 1973
[25] H Y Yen Y H Yeh and CH Chen ldquoGravity terrain correctionof Taiwan TAOrdquo Terrestrial Atmospheric and Oceanic Sciencesvol 5 no 1 pp 1ndash10 1994
[26] D JUnwin ldquoAn introduction to trend surface analysis conceptsand techniques in modern geographyrdquo Geo Abstracts Univer-sity of East Anglia Norwich No 5 NR4 7TJ 1978
[27] S P Sharma and S K Verma ldquoSolutions of the inherent prob-lem of the equivalence in direct current resistivity and elec-tromagnetic methods through global optimization and jointinversion by successive refinement of model spacerdquoGeophysicalProspecting vol 59 no 4 pp 760ndash776 2011
[28] S P Sharma ldquoVFSARESmdasha very fast simulated annealingFORTRAN program for interpretation of 1-D DC resistivitysounding data from various electrode arraysrdquo Computers andGeosciences vol 42 pp 177ndash188 2012
[29] W M Telford L P Geldart and R E Sheriff Applied Geo-physics Cambridge University Press New York NY USA 2ndedition 1990
[30] H R Burger A F Sheehan and C H Jones Introduction toApplied Geophysics W W Norton amp Company 2006
[31] M K Hubbert ldquoLine-integral method of computing the gravi-metric effects of two dimensional massesrdquo Geophysics vol 13pp 215ndash225 1948
[32] M Talwani J W Worzel and M Landsman ldquoRapid gravitycomputation of two-dimensional bodies with application to theMendocino submarine fracture zonerdquo Journal of GeophysicalResearch vol 64 pp 49ndash59 1959
[33] B J Last andK Kubik ldquoCompact gravity inversionrdquoGeophysicsvol 48 no 6 pp 713ndash721 1983
[34] Y L Ekinci ldquo2-D focusing inversion of gravity data with theuse of parameter variation as stopping criterionrdquo Journal of theBalkan Geophysical Society vol 11 no 1 pp 1ndash9 2008
[35] A Mandal A Biswas S Mittal et al ldquoGeophysical anomaliesassociated with Uranium mineralization from Beldih mineSouth Purulia Shear Zone Indiardquo Journal of the GeologicalSociety of India vol 82 no 6 pp 601ndash606 2013
[36] S P Sharma A Biswas and S Mittal ldquoDelineation of extensionof Uranium mineralization zone using Resistivity and VeryLow Frequency (VLF) Electromagnetic surveys around SouthPurulia Shear Zone (SPSZ) Indiardquo Journal of the GeologicalSociety of India In press
Submit your manuscripts athttpwwwhindawicom
Hindawi Publishing Corporationhttpwwwhindawicom Volume 2014
ClimatologyJournal of
EcologyInternational Journal of
Hindawi Publishing Corporationhttpwwwhindawicom Volume 2014
EarthquakesJournal of
Hindawi Publishing Corporationhttpwwwhindawicom Volume 2014
Hindawi Publishing Corporationhttpwwwhindawicom
Applied ampEnvironmentalSoil Science
Volume 2014
Mining
Hindawi Publishing Corporationhttpwwwhindawicom Volume 2014
Journal of
Hindawi Publishing Corporation httpwwwhindawicom Volume 2014
International Journal of
Geophysics
OceanographyInternational Journal of
Hindawi Publishing Corporationhttpwwwhindawicom Volume 2014
Journal of Computational Environmental SciencesHindawi Publishing Corporationhttpwwwhindawicom Volume 2014
Journal ofPetroleum Engineering
Hindawi Publishing Corporationhttpwwwhindawicom Volume 2014
GeochemistryHindawi Publishing Corporationhttpwwwhindawicom Volume 2014
Journal of
Atmospheric SciencesInternational Journal of
Hindawi Publishing Corporationhttpwwwhindawicom Volume 2014
OceanographyHindawi Publishing Corporationhttpwwwhindawicom Volume 2014
Advances in
Hindawi Publishing Corporationhttpwwwhindawicom Volume 2014
MineralogyInternational Journal of
Hindawi Publishing Corporationhttpwwwhindawicom Volume 2014
MeteorologyAdvances in
The Scientific World JournalHindawi Publishing Corporation httpwwwhindawicom Volume 2014
Paleontology JournalHindawi Publishing Corporationhttpwwwhindawicom Volume 2014
ScientificaHindawi Publishing Corporationhttpwwwhindawicom Volume 2014
Hindawi Publishing Corporationhttpwwwhindawicom Volume 2014
Geological ResearchJournal of
Hindawi Publishing Corporationhttpwwwhindawicom Volume 2014
Geology Advances in
2 International Journal of Geophysics
2308∘
2300∘
2292∘
8633∘
8667∘
2308∘
2300∘
2292∘
Raghunathpur
Beldih
MednitnarBarabazar South Purulia Shear Zone
Kutni
Amphibolite hornblende-schist in SG
Plutons of granitoid gneiss
South Purulia Shear Zone
Delhi
Study area
8633∘
8667∘
Chotanagpur Granite Gneissic Complex (CGGC)
Phyllite with minor schist of Singhbhum group (SG)
Amphibolite hornblende-schist in CGGC
N
Figure 1 Geological map of the study area (after [10]) with gravitysurvey area (dotted yellow) and sounding profile line (red)
from SPSZ to Raghunathpur village (where high hydro-uraniumanomalywas reported) Sometimes the possible thinmineralization zone may not be reflected in the conventionalapparent resistivity measurement Therefore apparent con-ductance has also been studied simultaneously at all soundinglocationsThe variation in the apparent conductance suggeststhe presence of conductive formation at depth which helpedin the correct interpretation of resistivity sounding dataand sometimes to constrain the subsurface structure for 2Dforward gravity data modeling
2 Geology of the Study Area
The SPSZ (Figure 1) forms a part of the ENE-WSW to E-Wto ESE-WNW trending curvilinear lineament which roughlymarks the contact between North Singhbhum Mobile Belt(NSMB) in the south and the CGGC in the north [14 15](Figure 1) This lineament extends from Tamar Ranchi dis-trict Jharkhand in the west to Porapahar Bankura districtWest Bengal in the eastThis lineament extends for a distanceof nearly 150 kmwith width of 4-5 km affecting a very narrowpart of CGGC and relatively broader part of Singhbhumgroup (reviewed in [15]) The major part of SPSZ is coveredby felsic volcanics accompanied by mafic and ultramaficrocks with subordinate metapelites Along the contact ofSPSZ and CGGC thin linear bandslenses of tourmalinitequartz reef quartz breccias ferruginous breccias schroll andmylonitic rocks are profusely developed Quartz-magnetite-apatite rocks carbonatite and syenites are some of the othersignificant rocks reported along the SPSZ [18ndash21]The generaltrend of the foliation along the shear zone is E-W to ESE-WNW with steep dip due north or south or vertical atplaces The shear zone shows ductile to brittle-ductile defor-mational pattern [15] associated with intense brecciationmylonitization and hydrothermal alterations accompaniedby development of apatite magnetite basemetal raremetalsrare earth and uranium [14 19 21]
3 Geophysical Survey
31 Electrical Resistivity Sounding and Apparent ConductanceIn electrical resistivity sounding current is passed into theground with a pair of metal electrodes and potential differ-ence is measured with another pair of electrodes (copperrod dipped into CuSO
4solution in a porous pot) The
ratio of potential difference and current flow yields theapparent resistance of the groundThis apparent resistance ismultiplied by the geometrical factor (depends on all electrodepositions) of the array to get the apparent resistivity for aparticular current electrode separation Current electrodeseparations are gradually increased from a very small value(say 10m to several km) to depict the vertical variation in theresistivity that reflects the variation in subsurface lithologyThe number of layers is decided on the basis of variation inthe apparent resistivity with electrode separation
In spite of multidimensional development in the acquisi-tion and interpretation of resistivity data a problem exists inthe conventional 1D electrical resistivity sounding to identifythe actual number of layers in certain geological conditionsIt is not possible to identify the actual number of layerswhen computed apparent resistivity increases continuouslywith increasing current electrode separation To solve thisproblem the amount of current flow at various currentelectrode separations can also monitored The current flowis normalized with the applied external voltage and referredto as apparent conductance (119862
119860) [22 23] Lithological change
in the subsurface is reflected in the119862119860 Even though apparent
resistivity is unable to reflect change in lithology 119862119860depicts
such changes and helps in the determination of actualnumber of layers present in the subsurface We tried toanalyze normalized 119862
119860in the area to study its relationship
with subsurface features or to get any additional informa-tion which might be helpful in qualitative or quantitativeinterpretation of conventional sounding data To interpret thesounding data some decisions about the number of layersand layer resistivities are also taken on the basis of119862
119860pattern
revealed for each sounding
32 Gravity A total of nearly 175 gravity observations wererecorded across the SPSZ along different approachable pathscovering nearly 80 km2 areaThe survey was executed by aWSodin gravimeter (sensitivity 001mGal) with a station spac-ing of nearly 200ndash250mThe gravity measurements obtainedfrom the study area were tied to the nearest absolute gravitybase station at Purulia railway station (absolute gravity value(119892
119899) = 97879673mGal) [24]The raw gravity data were reduced to mean sea level
following the standard data reduction procedures (ie byemploying instrumental drift correction free-air correctionBouguer correction and terrain correction) to keep the effectof subsurface mass only Base station was occupied at thebeginning and end of each working day to remove theinstrumental drift Using linear interpolation between basestation reoccupation this temporal variation in the gravityfield was estimated Theoretical gravity value was calculatedusing the formula given on the 1967 Geodetic ReferenceSystem (GRS67)The free-air correction term was derived by
International Journal of Geophysics 3
the standard free-air gradient of 03086 mGalm (neglectinghigher order terms) To compute the Bouguer correction theaverage crustal density was taken as 267 gcm3 Topographi-cally the study area was almost flatThus the terrain effect ascalculated from themass integral method [25] was very smallto affect the Bouguer anomaly significantly Bouguer anomalymap after the data reduction is shown in Figure 2
33 Regional-Residual Separation The separation of theregional component from the Bouguer anomaly is a crucialstep in subsurface gravity study for mineral exploration pointof view as the residual part is contributed solely by thenear surface density distribution In the present study theregional-residual separation was done using trend surfaceanalysis method [26] Third degree polynomial is used as theregional field for gravity anomaly (Figure 3)This polynomialgives the regional values at the analyzed points and theresidual anomaly (Figure 4) values were obtained by directsubtraction of the regional values from the observed Bougueranomaly values The high residual anomaly on the north-east part (east of Raghunathpur village) and south-west (nearBarabazar) are due to the high density metabasic rocksand compact granite intrusion within mica schistphyllitesrespectively The highly altered rocks and brecciated granitein themiddle part of the study area is depicted by a low gravityanomaly zone along the NW-SE trending shear zone Thisalso reveals the width of the shear zone Thus the residualgravity anomaly map shows a good correlation with thesurface geology
4 Results and Interpretations
41 Electrical Resistivity Sounding and Apparent ConductanceSchlumberger resistivity soundings were performed at 5 loca-tions (Figure 1) along a profile perpendicular to the SPSZThespread of current electrodes was kept approximately parallelto the known geological strike (NW-SE direction) for smoothvariation in the apparent resistivity Current electrodes wereexpanded with AB2 = 3 to 1000m to delineate the structuresextending to depth of 250m Since the apparent resistivitydata shows a continuously increasing trend with depth orcurrent electrode spacing (AB2) it was interpreted using 2-3- 4- and 5-layer model However the interpreted resistivityand thickness were erroneous and uncertainties in the modelparameter were very high without considering 119862
119860
We have studied the 119862119860data for each sounding simul-
taneously with apparent resistivity data First the mea-sured current flow at various current electrode spacings isnormalized with the applied voltage to obtain the currentflow for a unit applied voltage Subsequently each value isalso normalized with the 119862
119860computed at the first current
electrode separation Since the local condition varies at eachsounding location we again normalized each data by thecorresponding maximum value of 119862
119860(Figure 5) for unifor-
mity at various soundings This shows a good correlation inthe 119862
119860at each sounding and depicts an increased 119862
119860zone
(Figure 5) Soundings S5 S4 S2 and S1 show a maximum119862
119860(Figure 5) at a deeper depth (current electrode spacing
250m to 400m AB2) 119862119860is also contoured taking all the
Bouguer anomaly map
Longitude (deg)
Latit
ude (
deg)
Raghunathpur
S1S2
S3
S4
S5
2312
231
2308
2306
2304
2302
23
8637 8638 8641 8642 8643 8644
Barabazar
(mGal)
minus2
minus4
minus6
minus8
minus10
minus12
minus14
minus16
8639 864
Figure 2 Bouguer anomaly map of the study area Plus (+) symbolsare the gravity survey locations
Longitude (deg)
Latit
ude (
deg)
2312
231
2308
2306
2304
2302
23
8637 8638 8641 8642 8643 8644(mGal)
minus4
minus6
minus8
minus10
minus12
minus14
8639 864
Regional gravity anomaly map
Figure 3 Regional gravity anomaly map of the study area after 3rddegree trend surface fitting to Bouguer anomaly Plus (+) symbolsare the gravity survey locations
soundings into consideration Figure 6 shows the contourmap of normalized 119862
119860which clearly depicts conducting
layers at depth The green dotted line demarcates (Figure 5)as the probable conducting zones which might be associatedwith uranium mineralized zone Thus such normalized 119862
119860
can be very effective in delineating the subsurface conductorwhere the formation is dipping and cannot be delineatedusing conventional resistivity data interpretation techniqueThis normalized 119862
119860helps us to interpret the different layers
in the sounding data and is very effective in delineating thesubsurface layers accurately
411 Interpretation of Resistivity Sounding Data Resistivitysounding data is interpreted using 1D very fast simulatedannealing global optimization inversion technique [27 28]
4 International Journal of Geophysics
Longitude (deg)
Latit
ude (
deg)
2312
231
2308
2306
2304
2302
23
8637 8638 8641 8642 8643 8644 (mGal)8639 864
Residual gravity anomaly map
A
6
5
4
3
2
1
0
minus1
minus2
minus3
minus4
Raghunathpur
S1S2
S3
S4
S5
Barabazar
A998400
Figure 4 Residual gravity anomaly map of the study area afterseparation of 3rd degree trend surface polynomial from Bougueranomaly Plus (+) symbols are the gravity survey locations
Normalized apparent conductance
App conductance (mS)
AB2
(m)
1
10
100
1000
0 05 1
NE0 05 1 0 05 1 0 05 1 0 05 1
S1S2 S3S4S5
Figure 5 Normalized apparent conductance (119862119860) for five sound-
ings
AB2
(m)
Distance (km)
Raghunathpur NE
095
08
065
05
035
02
005
1
10
100
S1S2 S3S4S5
055
055 0
55
055
055
055
055
03
03
03
03
03
03
03
0 15 30 45 60 75
Nor
mal
ised
app
cond
ucta
nce (
mS)
Figure 6 2D Pseudo section contoured from normalized apparentconductance (119862
119860) of five soundings
Interpretation of sounding data without considering the 119862119860
may yield erroneous result and hence may not match withgeologic section Therefore we present the interpretationof soundings using number of layers on the basis of 119862
119860
Figure 7 presents the comparison between the observed andmodel data for all five soundings and their correspondingapparent conductance Figure 7(a) shows that model datafor soundings S1 and S3 could not fit precisely (especiallythe later part of the sounding data) due to fact that slopeof soundings S1 and S3 is more than 45∘ The resistivitysounding data shows that apparent resistivity is continuouslyincreasingwith depth after 10ndash20mAB2 values Hence it canbe understood that there is a massive resistive layer beneaththe near surface conducting layer corresponding to AB2values of 10ndash20m However this is not true either there aredifferent geological layers that are not seen in the 119862
119860data
or there are fractures in the massive resistive layer Since theseparation between S5 and S1 is 6 km it is unlikely that thereare only fractures which can cause such a correlatable 119862
119860
In principle only 3-layer models are sufficient to fit allresistivity sounding data However such interpretation willbe misleading A multiple layer model is selected on thebasis of 119862
119860and interpreted the sounding data However
such results have been arrived in a systematic manner afterconstraining some model parameters If we allow all themodel parameters to vary in the inversion process a highlynonuniquemodelwill be obtained To avoid this we first triedto match limited data sets using 3-layer models Whenmodeldata exactly matches with limited observed data the modelparameters are very near to the actual resistivity and thicknessindicating very small uncertainties in model parameters Inthe next step we fixed the model parameter for 3 layers andagain interpreted the complete data set using multiple layermodels This approach was very much helpful in interpretingthe resistivity sounding data where the formation of thesubsurface layer is dipping This yields very good resultscompared to the conventional method of resistivity datainterpretation technique Finally we are able to interpret thesounding data with the help of this method The interpretedmodel parameters are shown in Table 1
42 Gravity Methods At the middle portion of the Bouguerand residual gravity anomaly maps the ENE-WSW trendingnegative gravity anomaly zone is identified as the existingSPSZ (Figures 2 and 4) The intense brecciation myloniti-zation and ductile to brittle-ductile deformational patternof the shear zone mixed with quartz breccias ferruginousbreccias schroll and mylonitic rocks cause this negativegravity anomaly zone In the residual gravity anomaly mapthe closely spaced contour clearly indicates the existence ofsome shallow surface fracturesfaultscontact along parallelas well as across the shear zone (Figure 4) To get betterinterpretation of the subsurface the residual gravity datamodeling is performed
421 2D Forward Modeling of Residual Gravity AnomalyIn the present study 2D forward modeling approach wasemployed along a profile AA1015840 across the shear zone andpassing through the south-east of Raghunathpur village
International Journal of Geophysics 5
S1 S2 S3 S4 S510000
1000
100
10
10000
1000
100
10
1000
100
10
10000
1000
100
10
10000
1000
100
10
1 10 100 1000 1 10 100 1000 1 10 100 1000 1 10 100 1000 1 10 100 1000
Observed dataModel data
AB2 (m) AB2 (m) AB2 (m) AB2 (m) AB2 (m)
App
res
(Ohm
middotm)
(a)
App
cond
ucta
nce
(mS)
06
04
02
0
04
02
0
8
4
0
04
02
0
16
08
0
S1 S2 S3 S4 S5
1 10 100 1000 1 10 100 1000 1 10 100 1000 1 10 100 1000 1 10 100 1000
AB2 (m) AB2 (m) AB2 (m) AB2 (m) AB2 (m)
(b)
Figure 7 Fitting between the observed (solid dot) and calculated (continuous line) apparent resistivity of all soundings (S1ndashS5) and theircorresponding apparent conductance (119862
119860)
Table 1 Interpreted model parameters for five soundings
Parameters S1 S2 S3 S4 S51205881 (Ωm) 1313 1691 128 6801 25221205882 (Ωm) 221 503 159 920 17601205883 (Ωm) 9854 3875 1502 1671 48401205884 (Ωm) 1980 8462 97382 99756 26221205885 (Ωm) 94216 10116 8588 1695 957201205886 (Ωm) 7956 9360 99022 mdash 15701205887 (Ωm) 99772 74155 mdash mdash mdashℎ1 (m) 51 12 12 15 07ℎ2 (m) 23 43 88 42 59ℎ3 (m) 748 92 289 53 249ℎ4 (m) 10 331 997 1980 954ℎ5 (m) 997 618 101 mdash 874ℎ6 (m) 100 79 mdash mdash mdash
Misfit 68 times
10
minus3
13 times
10
minus2
22 times
10
minus3
12 times
10
minus3
34 times
10
minus4
(Figure 4) The study area mostly covered by weathered tocompact schist and the density of this layer is modeled as2650 kgm3 [29] The existing brecciated quartz vein almostparallel to the SPSZ is modeled with a density of 2470 kgm3Below these layers a 4-5 km wide highly sheared granite layermixed with quartz breccias ferruginous breccias schrolland mylonitic rocks (with assumed density 2270 kgm3) isidentified as the surface extension of the SPSZ The compactgranite and amphibolite hornblende-schist rocks as exposedon the north-east of Raghunathpur and over the southernside this shear zone are modeled with density varying from2790 to 2970 kgm3 assuming a granitic basement of density
2670 kgm3 [29]The 2-D forwardmodels along these profileswere performed with the GRAVMAG software [30] keepingthe above geological constraints in mindThe software calcu-lates the gravity effect for structures of infinite strike lengthand polygonal cross-section using the solution of Hubbert[31] and Talwani et al [32] Modeling along profile AA1015840(Figure 8) shows the subsurface gravity structure without anyresistivity constrain but only using the local geology Theestimated thickness of high density rocks on either side ofthe shear zone is quite largeThe fitting between the observedand calculated anomaly gives an rms misfit of 012mGalHowever the interpreted apparent conductance from theresistivity data (from soundings S1 and S2) as collected alongthe same profile suggests the existence of two contact zonesat sim40m and sim200m near to Raghunathpur village But thegravity model (Figure 8) does not reflect any contact zoneson these depths However after constraining the thickness ofhigh density layer and the depth of the contact zones (at about40m and 200m) according to resistivity data the gravitymodel shows a better match with the observed and calculatedanomaly and gives an rms misfit of 009mGal The widthof the low gravity zone is nearly 5 km which is identified asthe width of the existing shear zone The conducting zonesdepicted in resistivity sounding are identified as the contactbetween compact granite and metabasicmafic-ultramaficrocks (2790 kgm3) and low density material (2270 kgm3)possibly sheared granite and mineralization (Figure 9)Figure 9 is more realistic and follows the local geology Thebest fit 2-D models along the profile AA1015840 (Figure 9) suggestthe existence of mafic-ultramafic and metabasic volcanicrocks (of density 2790ndash2970 kgm3) on either side of theexisting shear zone (of density 2270 kgm3) with graniticbasement (of density 2670 kgm3) The gravity model along
6 International Journal of GeophysicsRe
sidua
l gra
vity
anom
aly
(mG
al)
Distance (m)
Rms misfit = 012 mGal
ObservedCalculated
4
2
0
minus2
minus4
0 2000 4000 6000 8000 10000
NE
A998400A
(a)
Dep
th (m
)
0
minus200
minus400
minus600
minus800
minus1000
SPSZRaghunathpur
S1S2 S3S4S5
2470
Kgm
3
2970
Kgm
3
2270 Kgm3
2790 Kgm3
2650 Kgm3
Distance (m)0 2000 4000 6000 8000 10000
2650 Kgm3
2790 Kgm3
2670 Kgm3
(b)
Figure 8 2D model along AA1015840 without resistivity constraints withrms misfit 012mGal The red dashed line in the model sectionindicating the width of the South Purulia Shear Zone (SPSZ)
this profile also clearly suggests the existence of northerlydipping structure
422 2D Inverse Modeling of Residual Gravity Anomaly The2-D compact inversion approach [33] has also been employedalong the same profile (AA1015840) (Figure 4) with vertical layers atdepths 1m 10m 40m 100m 200m 400m 600m 800mand 1000m The 40m and 200m layers were chosen asthe resistivity results suggest the existence of contact zonesat these depths It is highlighted here that the cell sizealong the profile is taken as 100m Considering the surfacegeology the density range was chosen as 2000ndash3000 kgm3for inversionThis approach tries to fit the observed anomalywith minimum area of source density distribution keepingmisfit as very low value [33 34] Modeling along profile AA1015840(SW-NE Figure 10) shows the subsurface gravity structuremostly as vertical The shear zone is identified as northerlydipping low density zones with nearly 5 kmwidth (alongAA1015840Figure 10) This is in well agreement with the existing litera-tures [17] The estimated thickness of high density rocks oneither side of the shear zone is quite large (going beyond1000m) Just south of Raghunathpur village the lowest
Resid
ual g
ravi
ty an
omal
y (m
Gal
)
Distance (m)
Rms misfit = 009 mGal
4
2
0
minus2
minus4
0 2000 4000 6000 8000 10000
NE
ObservedCalculated
A998400A
(a)
Dep
th (m
)
0
minus200
minus400
minus600
minus800
minus1000
SPSZRaghunathpur
S1S2 S3S4S5
2970
Kgm
3
2470
Kgm
3
2270 Kgm3
2790 Kgm3
2650 Kgm3
Distance (m)0 2000 4000 6000 8000 10000
2650 Kgm3
2670 Kgm3
2790
Kgm
3
(b)
Figure 9 2D model along AA1015840 with resistivity constraint Therms misfit is 009mGal The red dashed line in the model sectionindicating the width of the South Purulia Shear Zone (SPSZ)
density zone (density le 2500 kgm3) within the above shearzone depicts some vertical layers with gradually decreasingof density from 2650 kgm3 at the surface to lower than2400 kgm3 at the center of the lowest anomaly zone Thelowest density zone (density lt 2500 kgm3) extends to adepth of 400m approximately The interpreted apparentconductance from the resistivity data collected along thesame profile also suggests the existence of conductive contactzones The depth of these low density contact zones is shal-lower near Raghunathpur village and gradually increasingtowards south
5 Discussion
Gravity data suggest a low anomaly zone within the widthof the shear zone Resistivity soundings 1 and 2 carriedout in this location show a high 119862
119860at a depth of around
80m AB2 (sim40m) and 400m AB2 (sim200m) (currentelectrode spacing) It is also evident from the fact that onthat particular zone and at shallow depth hydro-uraniumanomaly has been reported at a depth of around 40m [17]
International Journal of Geophysics 7
Rms misfit = 00023 mGal
Calculated
0 2000 4000 6000 8000 10000
NE4
2
0
minus2
minus4
Observed (100m interpolation)
Resid
ual g
ravi
ty
anom
aly
(mG
al)
A998400A
(a)
Dep
th (m
)
RaghunathpurS1S2 S3S4S5
Distance (m)0 2000 4000 6000 8000 10000
0
minus200
minus400
minus600
minus800
minus1000
SPSZ
(kgm3)2400 2500 2600 2700 2800 2900 3000
(b)
Figure 10 2D residual gravity inverse model along profile AA1015840(Figure 4) The rms misfit is 00023mGal The red dashed line inthe model section indicating the width of the South Purulia ShearZone (SPSZ)
particularly in sounding 1 which is exactly on the samelocation of high anomaly The contact between schist andgranite at a depth below this region appears to be the hostof uranium mineralization The updated gravity model afterconstraining with 119862
119860and resistivity data are in agreement
The 2-D gravity inverse model is also in agreement with theintegration of apparent conductance to constrain forwardgravity modeling In particular the high to low densityalteration zones (Figure 10) are also correlating well withthe conducting layer at sounding locations (S1) Also thecoincidence of low gravity anomaly and a high conductivezone at around 200m depth near to Raghunathpur villagealso indicates signature of possible uranium mineralizationwithin the contact of sheared granite and mafic-ultramaficrocks According to the model the lowest density zone isextending up to sim400m depth Again the 2-D model alongthe profile indicates the presence of almost vertical alterationzones near to the south of Raghunathpur village Moreoverpresence of uraniummineralization and its extension has alsobeen confirmed from integrated geophysical studies aroundBeldihmine [35 36] together with drilled bore-hole data [16]
6 Conclusions
Electrical resistivity and gravity surveys performed aroundSPSZ clearly revealed subsurface structure associated with
uranium mineralization A continuously increasing trendin apparent resistivity with depth and a wide low gravityanomaly zone has been observed along a NE-SWprofile Dueto suppression problems in DC resistivity interpretation anddipping subsurface structures it is difficult to determine theactual resistivity and thickness of the layer parameter usingthe conventional interpretation method Apparent conduc-tance plots help in identifying different subsurface layers andto interpret the resistivity data accordingly The lithologicalboundaries interpreted from 119862
119860data used to constrain the
subsurface structure tomodel the gravity data revealed a goodcorrelation with the local geology of the areaThe constraintsfrom resistivity data revealed efficacy of 119862
119860in modeling
gravity data from such complex region Both forward andinverse gravity models revealed good correlation with theconducting structure Therefore the zones of low resistivitycoinciding with low density (negative gravity anomaly) alongthe SPSZ are expected to be the possible zone of uraniummineralization
Conflict of Interests
The authors declare that there is no conflict of interestsregarding the publication of this paper
Acknowledgments
Gravity data is a part of the project work sponsored bythe Atomic Mineral Directorates (AMD) and the BRNSunder Department of Atomic Energy Government of IndiaThe authors gratefully acknowledge the financial assistanceprovided by the BRNS under Department of Atomic EnergyGovernment of India (Project no 20073685-BRNS) in col-laboration with Atomic Minerals Directorate for Explorationand Research (AMD) Eastern Region Jamshedpur Theythank the anonymous reviewers for their comments andsuggestions that have improved the paper This paper is apart of collaborative PhD work of Arkoprovo Biswas andAnimesh Mandal who thank IIT Kharagpur for InstituteResearch Fellowship to pursue their work
References
[1] K L Bhola Y N RamaRao C S Sastry andN RMehta ldquoUra-nium mineralization in Singhbhum thrust belt Bihar IndiardquoEconomic Geology vol 61 no 1 pp 162ndash173 1966
[2] A K Saha ldquoCrustal evolution of Singhbhummdashnorth Orissaeastern Indiardquo Memoirs of the Geological Society of India vol27 p 341 1994
[3] B Krıbek K Zak P Dobea et al ldquoThe Rozna uranium deposit(Bohemian Massif Czech Republic) shear zone-hosted lateVariscan and post-Variscan hydrothermalmineralizationrdquoMin-eralium Deposita vol 44 no 1 pp 99ndash128 2009
[4] S I Turchenko A B Vrevsky and V B Dagelaisky ldquoThe pre-cambrianmetallogeny of IndiardquoGeology of Ore Deposits vol 51no 4 pp 317ndash329 2009
[5] D S Bhattacharyya ldquoEarly proterozoic metallogeny tectonicsand geochronology of the singhbhum CuU belt eastern IndiardquoPrecambrian Research vol 58 no 1ndash4 pp 71ndash83 1992
8 International Journal of Geophysics
[6] V Tuncer M J Unsworth W Siripunvaraporn and J ACraven ldquoExploration for unconformity-type uranium depos-its with audiomagnetotelluric data a case study from theMcArthur River mine Saskatchewan Canadardquo Geophysics vol71 no 6 pp B201ndashB209 2006
[7] G Nimeck and R Koch ldquoA progressive geophysical explorationstrategy at the Shea Creek uranium depositrdquo Leading Edge vol27 no 1 pp 52ndash63 2008
[8] J M Legault D Carriere and L Petrie ldquoSynthetic modeltesting and distributed acquisition dc resistivity results overan unconformity uranium target from the Athabasca Basinnorthern Saskatchewanrdquo Leading Edge vol 27 no 1 pp 46ndash512008
[9] W KMohanty AMandal S P Sharma S Gupta and SMisraldquoIntegrated geological and geophysical studies for delineationof chromite deposits a case study from Tangarparha OrissaIndiardquo Geophysics vol 76 no 5 pp B173ndashB185 2011
[10] A Chakrabarty A K Sen and T K Ghosh ldquoAmphibolemdasha keyindicator mineral for petrogenesis of the Purulia carbonatiteWest Bengal Indiardquo Mineralogy and Petrology vol 95 no 1-2pp 105ndash112 2009
[11] R K Verma A U S Sarma and M Mukhopadhyay ldquoGravityfield over Singhbhum its relationship to geology and tectonichistoryrdquoTectonophysics vol 106 no 1-2 pp 87ndash93 97ndash107 1984
[12] R K Verma P D V S Rao and M Mukhopadhyay ldquoAnalysisof gravity field over Singhbhum region and evolution of Singhb-hum cratonrdquo in Recent Researches in Geology A K Saha Edvol 16 pp 123ndash133 Hindustan Publishing Corporation NewDelhi India 1996
[13] L K Das C S Pathak N P Singh D K Saha M K Rai andD C Naskar ldquoA look at the metallogeny of Singhbhum India ageophysical approachrdquo Indian Minerals vol 51 no 1-2 pp 107ndash122 1997
[14] A Gupta and A Basu ldquoNorth Singhbhum Proterozoic mobilebelt eastern Indiamdasha reviewrdquoGeological Survey of India vol 55pp 195ndash226 2000
[15] A Acharyya S Ray B K Chaudhuri S K Basu S K Bhaduriand A K Sanyal ldquoProterozoic rock suites along south PuruliaShear Zone eastern India evidence for rift-related settingrdquoJournal of the Geological Society of India vol 68 no 6 pp 1069ndash1086 2006
[16] V J Katti J Sen andA K Bhatt ldquoUraniumpotentiality of southPurulia Shear Zone eastern India shieldrdquo in Proceedings of theTechnical Committee Meeting on Low Grade Uranium DepositsIAEA Vienna Austria March 2010
[17] A K Dwivedi J Sen C Murugan et al ldquoThe applicationof hydrogeochemical method in uranium explorationmdasha casestudy from Barabazar-Manbazar area Purulia district WestBengalrdquo Journal of the Geological Society of India vol 72 no4 pp 561ndash570 2008
[18] T K Baidya ldquoApatite-magnetite deposit in the chhotanagpurgneissic complex Panrkidih area Purulia District West Ben-galrdquo Indian Journal of Geology vol 64 pp 88ndash95 1992
[19] S K Basu ldquoAlkaline-carbonatite complex in Precambrian ofsouth Purulia Shear Zone eastern India its characteristics andmineral potentialitiesrdquo Indian Minerals vol 47 no 3 pp 179ndash194 1993
[20] A K G Roy and P R Sengupta ldquoAlkalic-carbonatitic magma-tism and associated mineralisation along the Porapahar-Tamarlineament in the Proterozoics of Purulia District West BengalrdquoIndian Journal of Earth Sciences vol 20 no 3-4 pp 193ndash2001993
[21] Y Vapnik S Bushmin A Chattopadhyay and D Dolivo-Dobrovolsky ldquoFluid inclusion and mineralogical study of vein-type apatite ores in shear zones from the Singhbhum metallo-genetic provinceWest Bengal IndiardquoOre Geology Reviews vol32 no 1-2 pp 412ndash430 2007
[22] A Biswas and A Mandal ldquoCurrent flow attribute in resistivitysounding to constrain gravity model around south PuruliaShear zonerdquo in Proceedings of the International Workshop onRecent Advances in Ground and Airborne Electromagnetic Meth-odsmdashInnovations in Processing and InversionTechniques pp 65ndash67 AMD-NGRI-GSI Hyderabad India September 2011
[23] S P Sharma and A Biswas ldquoA practical solution in delineatingthin conducting structures and suppression problem in directcurrent resistivity soundingrdquo Journal of Earth System Sciencevol 122 no 4 pp 1065ndash1080 2013
[24] M N Qureshy D V S Rao S C Bhatia P S Aravamadhuand C Subrahmanyam ldquoGravity bases established in India byNGRImdashpart IVrdquo Geophysical Research Bulletin vol 11 no 2pp 136ndash152 1973
[25] H Y Yen Y H Yeh and CH Chen ldquoGravity terrain correctionof Taiwan TAOrdquo Terrestrial Atmospheric and Oceanic Sciencesvol 5 no 1 pp 1ndash10 1994
[26] D JUnwin ldquoAn introduction to trend surface analysis conceptsand techniques in modern geographyrdquo Geo Abstracts Univer-sity of East Anglia Norwich No 5 NR4 7TJ 1978
[27] S P Sharma and S K Verma ldquoSolutions of the inherent prob-lem of the equivalence in direct current resistivity and elec-tromagnetic methods through global optimization and jointinversion by successive refinement of model spacerdquoGeophysicalProspecting vol 59 no 4 pp 760ndash776 2011
[28] S P Sharma ldquoVFSARESmdasha very fast simulated annealingFORTRAN program for interpretation of 1-D DC resistivitysounding data from various electrode arraysrdquo Computers andGeosciences vol 42 pp 177ndash188 2012
[29] W M Telford L P Geldart and R E Sheriff Applied Geo-physics Cambridge University Press New York NY USA 2ndedition 1990
[30] H R Burger A F Sheehan and C H Jones Introduction toApplied Geophysics W W Norton amp Company 2006
[31] M K Hubbert ldquoLine-integral method of computing the gravi-metric effects of two dimensional massesrdquo Geophysics vol 13pp 215ndash225 1948
[32] M Talwani J W Worzel and M Landsman ldquoRapid gravitycomputation of two-dimensional bodies with application to theMendocino submarine fracture zonerdquo Journal of GeophysicalResearch vol 64 pp 49ndash59 1959
[33] B J Last andK Kubik ldquoCompact gravity inversionrdquoGeophysicsvol 48 no 6 pp 713ndash721 1983
[34] Y L Ekinci ldquo2-D focusing inversion of gravity data with theuse of parameter variation as stopping criterionrdquo Journal of theBalkan Geophysical Society vol 11 no 1 pp 1ndash9 2008
[35] A Mandal A Biswas S Mittal et al ldquoGeophysical anomaliesassociated with Uranium mineralization from Beldih mineSouth Purulia Shear Zone Indiardquo Journal of the GeologicalSociety of India vol 82 no 6 pp 601ndash606 2013
[36] S P Sharma A Biswas and S Mittal ldquoDelineation of extensionof Uranium mineralization zone using Resistivity and VeryLow Frequency (VLF) Electromagnetic surveys around SouthPurulia Shear Zone (SPSZ) Indiardquo Journal of the GeologicalSociety of India In press
Submit your manuscripts athttpwwwhindawicom
Hindawi Publishing Corporationhttpwwwhindawicom Volume 2014
ClimatologyJournal of
EcologyInternational Journal of
Hindawi Publishing Corporationhttpwwwhindawicom Volume 2014
EarthquakesJournal of
Hindawi Publishing Corporationhttpwwwhindawicom Volume 2014
Hindawi Publishing Corporationhttpwwwhindawicom
Applied ampEnvironmentalSoil Science
Volume 2014
Mining
Hindawi Publishing Corporationhttpwwwhindawicom Volume 2014
Journal of
Hindawi Publishing Corporation httpwwwhindawicom Volume 2014
International Journal of
Geophysics
OceanographyInternational Journal of
Hindawi Publishing Corporationhttpwwwhindawicom Volume 2014
Journal of Computational Environmental SciencesHindawi Publishing Corporationhttpwwwhindawicom Volume 2014
Journal ofPetroleum Engineering
Hindawi Publishing Corporationhttpwwwhindawicom Volume 2014
GeochemistryHindawi Publishing Corporationhttpwwwhindawicom Volume 2014
Journal of
Atmospheric SciencesInternational Journal of
Hindawi Publishing Corporationhttpwwwhindawicom Volume 2014
OceanographyHindawi Publishing Corporationhttpwwwhindawicom Volume 2014
Advances in
Hindawi Publishing Corporationhttpwwwhindawicom Volume 2014
MineralogyInternational Journal of
Hindawi Publishing Corporationhttpwwwhindawicom Volume 2014
MeteorologyAdvances in
The Scientific World JournalHindawi Publishing Corporation httpwwwhindawicom Volume 2014
Paleontology JournalHindawi Publishing Corporationhttpwwwhindawicom Volume 2014
ScientificaHindawi Publishing Corporationhttpwwwhindawicom Volume 2014
Hindawi Publishing Corporationhttpwwwhindawicom Volume 2014
Geological ResearchJournal of
Hindawi Publishing Corporationhttpwwwhindawicom Volume 2014
Geology Advances in