Embed Size (px)
Citation preview
Research ArticleFluid Phase Simulation and Evolution of a Condensate GasReservoir in the Tazhong Uplift, Tarim Basin
Rui Deng,1,2 Chengsheng Chen,1,2 Shuyong Shi,1,2 and Yunpeng Wang 1
1State Key Laboratory of Organic Geochemistry, Guangzhou Institute of Geochemistry, Chinese Academy of Sciences,Guangzhou 510640, China2University of Chinese Academy of Sciences, Beijing 100039, China
Correspondence should be addressed to Yunpeng Wang; [email protected]
Received 30 January 2019; Revised 1 May 2019; Accepted 27 May 2019; Published 13 June 2019
Academic Editor: Julien Bourdet
Copyright © 2019 Rui Deng et al. This is an open access article distributed under the Creative Commons Attribution License, whichpermits unrestricted use, distribution, and reproduction in any medium, provided the original work is properly cited.
The fluid phase and the evolution of the condensate gas reservoir in the Lianglitage Formation (O3), Well ZG7-5, Tazhong Uplift,were studied by integrating the PVTsim and the PetroMod software. The fluid phase was successfully simulated, and the burial,temperature, pressure, and pressure coefficient histories were reconstructed. The evolution of the fluid phase and its properties(density, viscosity, and gas-oil ratio) under the ideal and gas washing conditions was also explored. The simulated pressure-temperature (P‐T) phase diagram confirms that the reservoir fluid is in the condensate gas phase at present, with an order ofcritical point-cricondenbar-cricondentherm (CP‐Pm‐Tm). The temperature and pressure show an overall increasing trendconsidering the entirety of geological evolution. Under ideal conditions, fluid transition from coexisting gas and liquid phases toa single condensate gas phase occurred during the Late Cretaceous (80Ma, T = 135 7°C, and P = 58 19MPa). The density andviscosity of the liquid phase decreased gradually while the density and viscosity of the gas phase and the solution gas-oil ratioincreased during geological processes. With the consideration of gas washing, the critical phase transition time points for 100%and 50% gas washing fluid are 394Ma, 383Ma, 331Ma, and 23Ma, as well as 266Ma and 23Ma, respectively. The averageliquid phase density, gas phase density, and liquid phase viscosity under 100% gas washing are larger than those under 50% gaswashing before 23Ma (Miocene), while the gas phase viscosity values are similar for both cases. This study visually suggests thatthe temperature and pressure histories, which are controlled by the burial history and heat flow evolution, and gas washing havesignificant impacts on the formation of the condensate gas reservoirs and evolution of the fluid phase and its features in theTazhong Uplift.
1. Introduction
The Tazhong Uplift is the most important oil and gas bearingarea in the Tarim Basin of China. In recent decades, manydifferent types of petroleum reservoirs have been discoveredin the Tazhong Uplift, and the phase states of reservoir fluidsvary among sand tar, super heavy oil, heavy oil, black oil,normal oil, light oil, condensate gas, and natural gas [1]. Thecondensate gas reservoirs serve as highly valued resourcesfor energy supply, and their characteristic phase transitionsduring the accumulation and exploitation processes makethem valuable for research [2].
Knowledge of the phase state and pressure-volume-temperature (PVT) properties of reservoir fluids is critical
to the exploration and development of the reservoirs and,therefore, of interest in petroleum engineering studies [3, 4].For all conventional and unconventional petroleum reser-voirs, it is essential to reconstruct the phase evolution historyand the changes in the gas-oil ratio (GOR) and physicalproperties of the fluid over time, which are all closely relatedto the burial and thermal histories of the fluid [5]. In manyprevious works, phase simulation experiments have beenconducted under high temperature and pressure usingPVT-based methods to obtain PVT properties and determinethe phase types of reservoir fluids; however, such experi-ments are complicated, time-consuming, and difficult to con-duct [6–10]. In addition, the fluid phase and evolution ofcondensate gas reservoirs in the Tazhong Uplift have not
HindawiGeofluidsVolume 2019, Article ID 8627698, 15 pageshttps://doi.org/10.1155/2019/8627698
been intensively studied; there is a lack of systematic studieson the temperature and pressure recoveries for condensategas reservoirs in the area, as well as a lack of the combinationwith PVT simulation and basin modeling. Therefore, thepurpose of this study was to explore the fluid phase and evo-lution of a typical condensate gas reservoir, Well ZG7-5, inthe Tazhong Uplift. We first simulated the phase envelopeand PVT properties of the fluids by using the PVTsim soft-ware, which is an easy-to-use and widely used software forthe phase simulation of reservoir fluids. We then recon-structed the burial, temperature, pressure, and pressure coef-ficient evolution histories of the target reservoir using thePetroMod software. Finally, we studied the evolution of thefluid phase and its features (density, viscosity, and solutionGOR) under ideal and gas washing conditions consideringthe entirety of geological evolution, by integrating the resultsof the PVTsim and the PetroMod software.
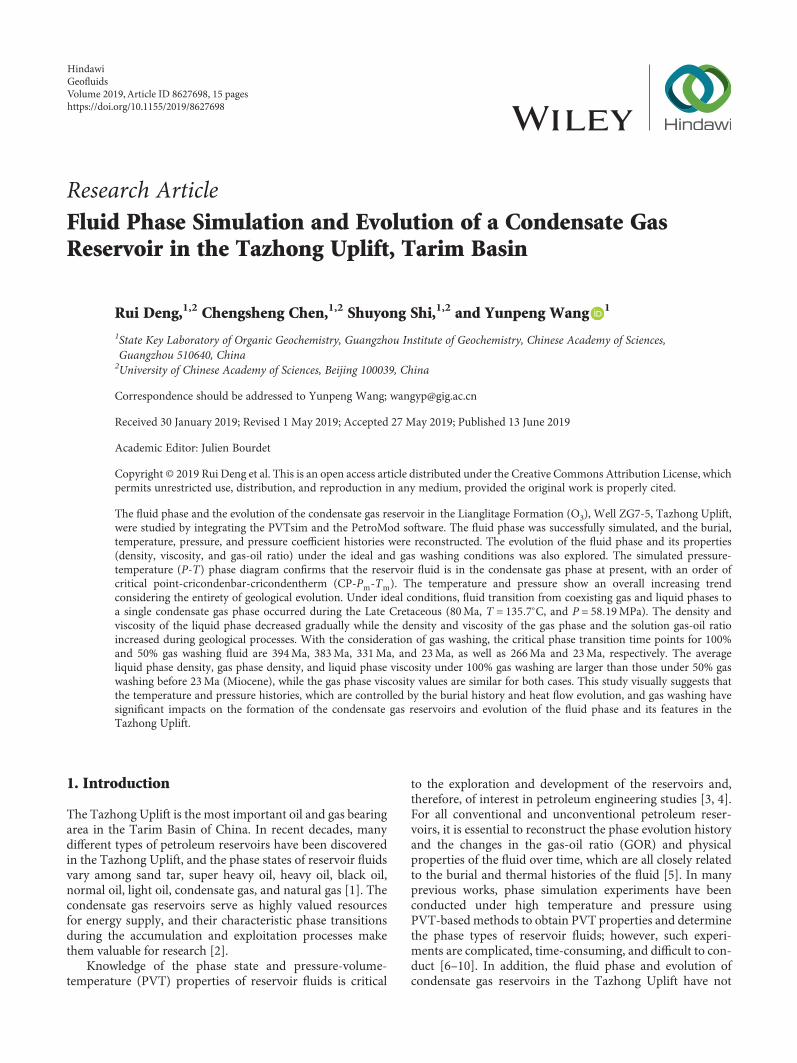
2. Geological Setting
The Tarim Basin, encompassing an area of 560,000 km2, isthe largest petroleum-bearing basin in China and is alsoone of the most complex superimposed basins in the world[11, 12]. This basin is characterized by thick sediments,multiple cycles of uplift and erosion, and complex distribu-tion of oil and gas accumulations [13]. The Tazhong Upliftis a long-term inherited paleouplift in the central TarimBasin, which was formed during the Caledonian orogenyand shaped by the Early Hercynian orogeny [14]; its tectonicframework did not significantly change during the subse-quent Indosinian-Himalayan orogeny [15]. The oil and gasin the Tazhong Uplift are mainly distributed in the Cam-brian, Ordovician, Silurian, and Carboniferous strata, andmost condensate gas reservoirs are found in the Ordovicianreservoirs originated from the Cambrian-Lower Ordovicianstrata and the Middle-Upper Ordovician source rocks [16].The Tazhong Uplift can be subdivided into several beltsincluding the Tazhong no. 1 fault zone, Tazhong no. 10structural belt, Tazhong central horst belt, and Tazhong 1-8buried hill belt [17, 18]. Well ZG7-5 is in the Tazhong no. 1gas field and is located on the north slope of the TazhongUplift (Figure 1). The borehole depth of Well ZG7-5 reaches5718m, encountering strata from the Quaternary to theOrdovician. The condensate gas reservoir was discovered inthe Lianglitage Formation (O3, 5655-5718m) where there isa daily gas production of 20399m3 but little oil production(inner report of the Tarim Oil Company, 2016).
3. Materials and Methods
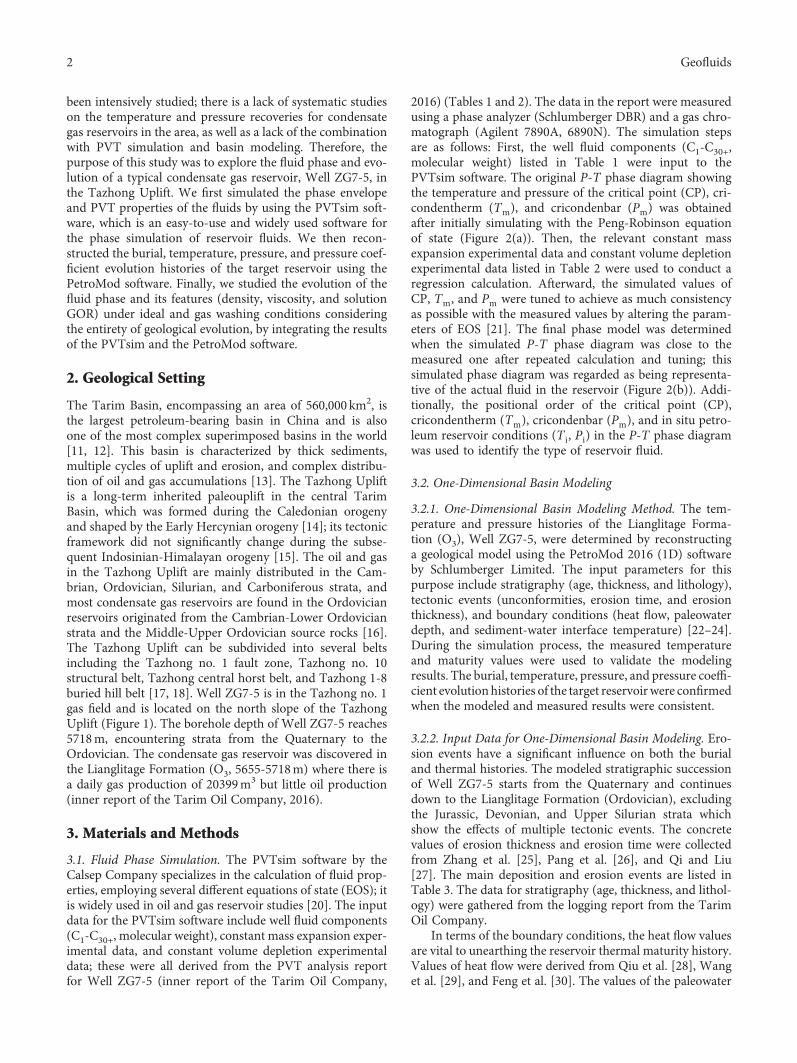
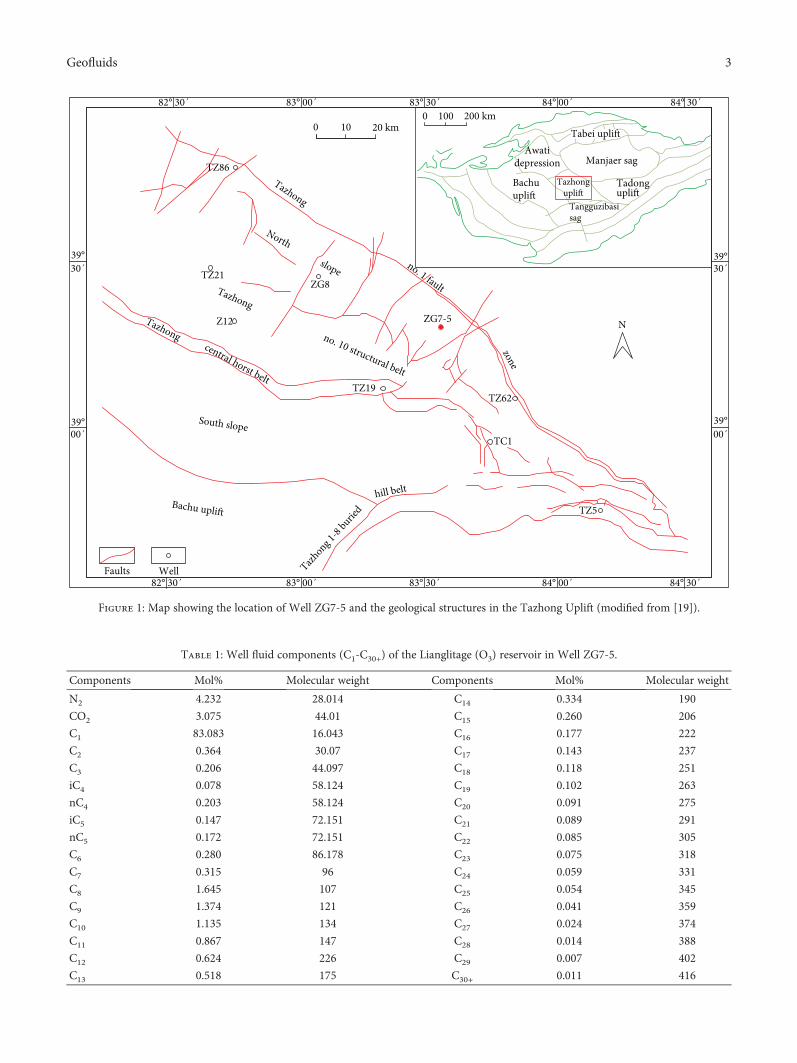
3.1. Fluid Phase Simulation. The PVTsim software by theCalsep Company specializes in the calculation of fluid prop-erties, employing several different equations of state (EOS); itis widely used in oil and gas reservoir studies [20]. The inputdata for the PVTsim software include well fluid components(C1-C30+, molecular weight), constant mass expansion exper-imental data, and constant volume depletion experimentaldata; these were all derived from the PVT analysis reportfor Well ZG7-5 (inner report of the Tarim Oil Company,
2016) (Tables 1 and 2). The data in the report were measuredusing a phase analyzer (Schlumberger DBR) and a gas chro-matograph (Agilent 7890A, 6890N). The simulation stepsare as follows: First, the well fluid components (C1-C30+,molecular weight) listed in Table 1 were input to thePVTsim software. The original P‐T phase diagram showingthe temperature and pressure of the critical point (CP), cri-condentherm (Tm), and cricondenbar (Pm) was obtainedafter initially simulating with the Peng-Robinson equationof state (Figure 2(a)). Then, the relevant constant massexpansion experimental data and constant volume depletionexperimental data listed in Table 2 were used to conduct aregression calculation. Afterward, the simulated values ofCP, Tm, and Pm were tuned to achieve as much consistencyas possible with the measured values by altering the param-eters of EOS [21]. The final phase model was determinedwhen the simulated P‐T phase diagram was close to themeasured one after repeated calculation and tuning; thissimulated phase diagram was regarded as being representa-tive of the actual fluid in the reservoir (Figure 2(b)). Addi-tionally, the positional order of the critical point (CP),cricondentherm (Tm), cricondenbar (Pm), and in situ petro-leum reservoir conditions (T i, Pi) in the P‐T phase diagramwas used to identify the type of reservoir fluid.
3.2. One-Dimensional Basin Modeling
3.2.1. One-Dimensional Basin Modeling Method. The tem-perature and pressure histories of the Lianglitage Forma-tion (O3), Well ZG7-5, were determined by reconstructinga geological model using the PetroMod 2016 (1D) softwareby Schlumberger Limited. The input parameters for thispurpose include stratigraphy (age, thickness, and lithology),tectonic events (unconformities, erosion time, and erosionthickness), and boundary conditions (heat flow, paleowaterdepth, and sediment-water interface temperature) [22–24].During the simulation process, the measured temperatureand maturity values were used to validate the modelingresults. The burial, temperature, pressure, and pressure coeffi-cient evolutionhistories of the target reservoirwere confirmedwhen the modeled and measured results were consistent.
3.2.2. Input Data for One-Dimensional Basin Modeling. Ero-sion events have a significant influence on both the burialand thermal histories. The modeled stratigraphic successionof Well ZG7-5 starts from the Quaternary and continuesdown to the Lianglitage Formation (Ordovician), excludingthe Jurassic, Devonian, and Upper Silurian strata whichshow the effects of multiple tectonic events. The concretevalues of erosion thickness and erosion time were collectedfrom Zhang et al. [25], Pang et al. [26], and Qi and Liu[27]. The main deposition and erosion events are listed inTable 3. The data for stratigraphy (age, thickness, and lithol-ogy) were gathered from the logging report from the TarimOil Company.
In terms of the boundary conditions, the heat flow valuesare vital to unearthing the reservoir thermal maturity history.Values of heat flow were derived from Qiu et al. [28], Wanget al. [29], and Feng et al. [30]. The values of the paleowater
2 Geofluids
82° 30´ 83° 30´ 84° 30´83° 00´ 84° 00´
Tazhong
zone
no. 1 fault
0 10 20 km0 100 200 km
Tazhongupli�
Manjaer sag
Tabei upli�
North slope
Tazhong
no. 10 structural belt
Tazhongcentral horst belt
South slope
Bachu upli�
Tazhong 1
-8 burie
d
hill belt
TZ86
TC1
ZG7-5
TZ19
Z12
ZG8
Bachuupli�
Awatidepression
Tadongupli�
Tangguzibasisag
TZ5
TZ62
TZ21
39°
39°
82° 30´ 83° 30´ 84° 30´83° 00´ 84° 00´
N
Faults Well
00´
30´39°30´
39°00´
Figure 1: Map showing the location of Well ZG7-5 and the geological structures in the Tazhong Uplift (modified from [19]).
Table 1: Well fluid components (C1-C30+) of the Lianglitage (O3) reservoir in Well ZG7-5.
Components Mol% Molecular weight Components Mol% Molecular weight
N2 4.232 28.014 C14 0.334 190
CO2 3.075 44.01 C15 0.260 206
C1 83.083 16.043 C16 0.177 222
C2 0.364 30.07 C17 0.143 237
C3 0.206 44.097 C18 0.118 251
iC4 0.078 58.124 C19 0.102 263
nC4 0.203 58.124 C20 0.091 275
iC5 0.147 72.151 C21 0.089 291
nC5 0.172 72.151 C22 0.085 305
C6 0.280 86.178 C23 0.075 318
C7 0.315 96 C24 0.059 331
C8 1.645 107 C25 0.054 345
C9 1.374 121 C26 0.041 359
C10 1.135 134 C27 0.024 374
C11 0.867 147 C28 0.014 388
C12 0.624 226 C29 0.007 402
C13 0.518 175 C30+ 0.011 416
3Geofluids
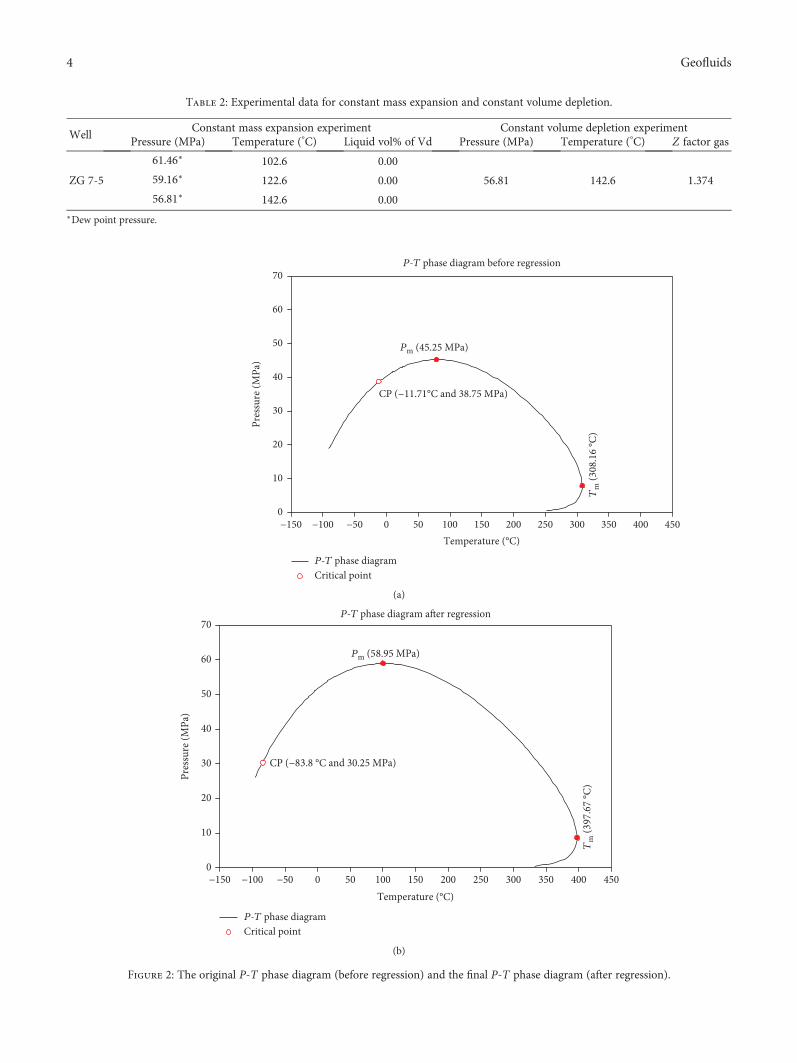
Table 2: Experimental data for constant mass expansion and constant volume depletion.
WellConstant mass expansion experiment Constant volume depletion experiment
Pressure (MPa) Temperature (°C) Liquid vol% of Vd Pressure (MPa) Temperature (°C) Z factor gas
ZG 7-5
61.46∗ 102.6 0.00
56.81 142.6 1.37459.16∗ 122.6 0.00
56.81∗ 142.6 0.00∗Dew point pressure.
P-T phase diagram before regression70
60
50
40
30
20
10
0−150 −100 −50 0 50 100 150 200 250 300 350 400 450
Temperature (°C)
Pres
sure
(MPa
)
Tm
(308
.16
°C)
Pm (45.25 MPa)
CP (−11.71°C and 38.75 MPa)
P-T phase diagramCritical point
(a)
P-T phase diagram a�er regression70
60
50
40
30
20
10
0−150 −100 −50 0 50 100 150 200 250 300 350 400 450
Temperature (°C)
Pres
sure
(MPa
)
Tm
(397
.67
°C)
Pm (58.95 MPa)
CP (−83.8 °C and 30.25 MPa)
P-T phase diagramCritical point
(b)
Figure 2: The original P‐T phase diagram (before regression) and the final P‐T phase diagram (after regression).
4 Geofluids
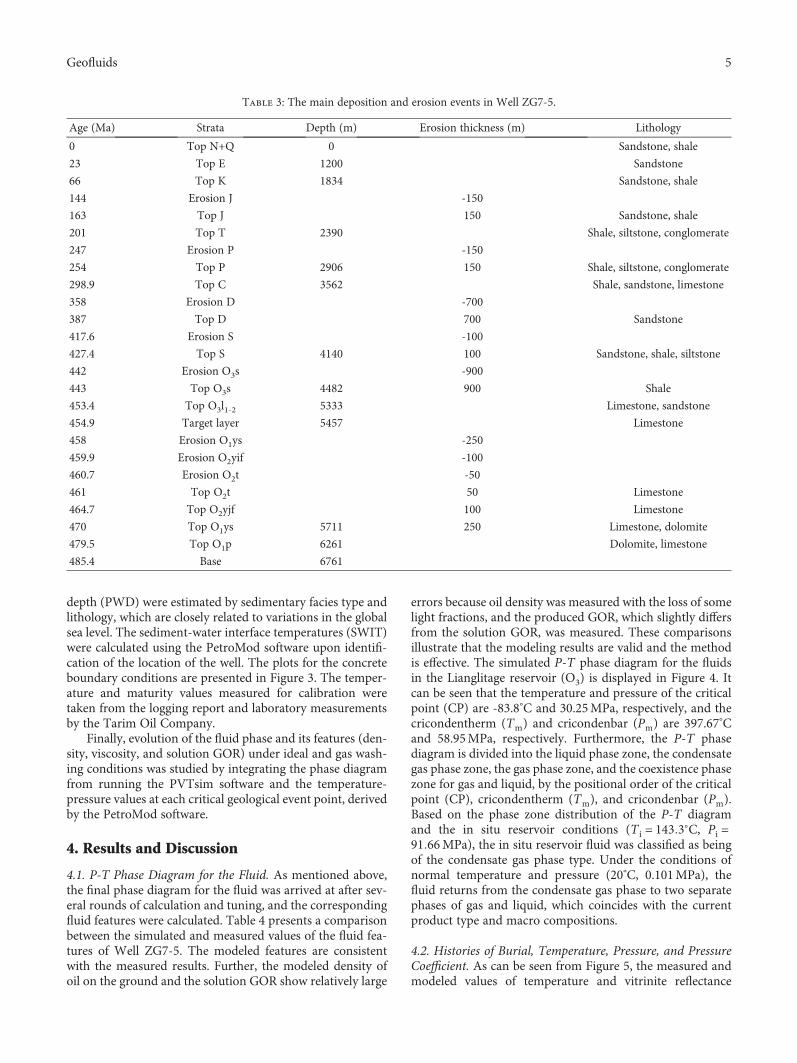
depth (PWD) were estimated by sedimentary facies type andlithology, which are closely related to variations in the globalsea level. The sediment-water interface temperatures (SWIT)were calculated using the PetroMod software upon identifi-cation of the location of the well. The plots for the concreteboundary conditions are presented in Figure 3. The temper-ature and maturity values measured for calibration weretaken from the logging report and laboratory measurementsby the Tarim Oil Company.
Finally, evolution of the fluid phase and its features (den-sity, viscosity, and solution GOR) under ideal and gas wash-ing conditions was studied by integrating the phase diagramfrom running the PVTsim software and the temperature-pressure values at each critical geological event point, derivedby the PetroMod software.
4. Results and Discussion
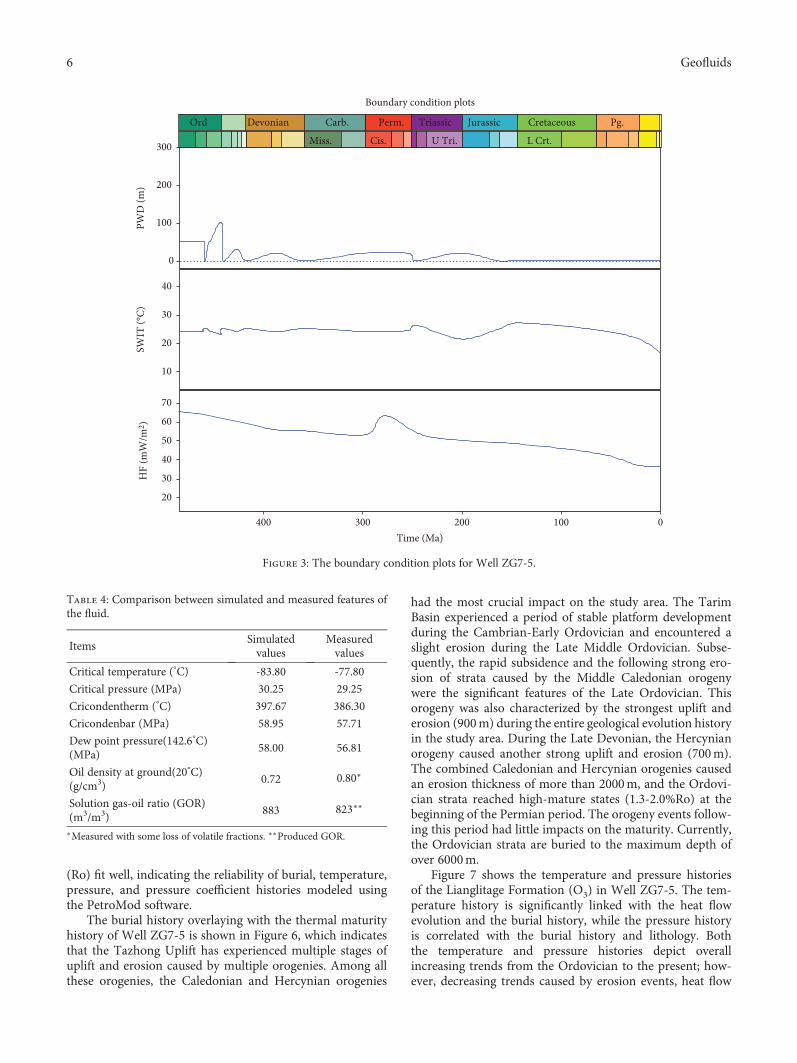
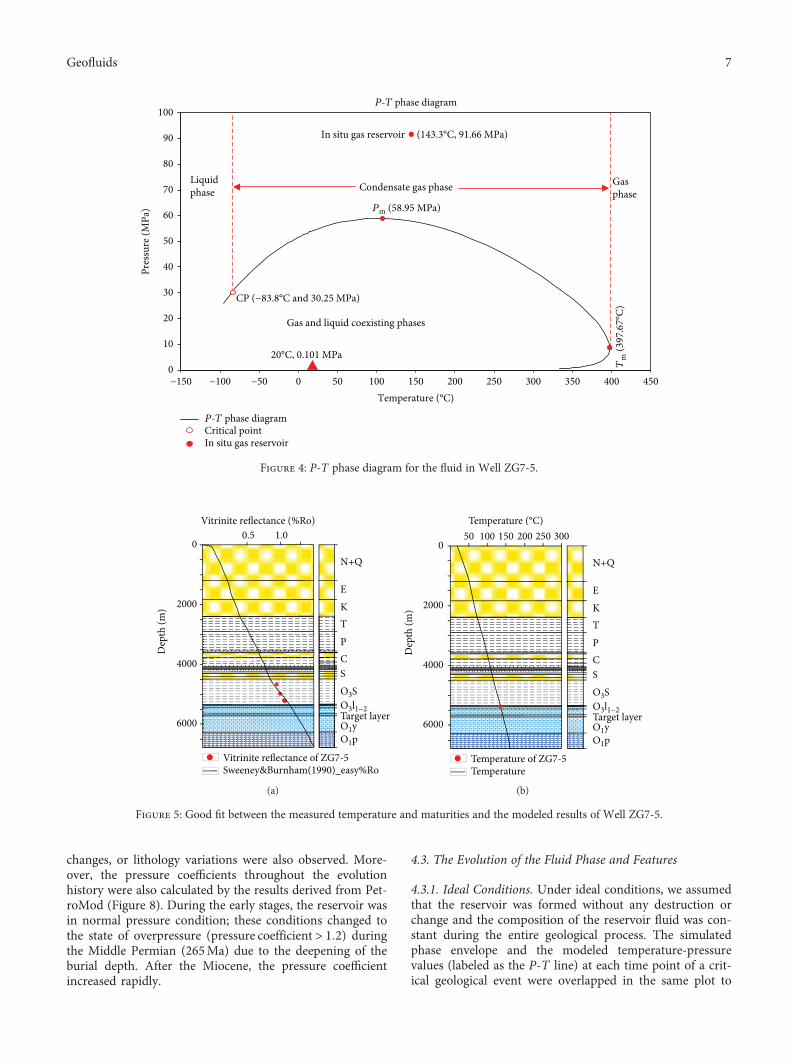
4.1. P-T Phase Diagram for the Fluid. As mentioned above,the final phase diagram for the fluid was arrived at after sev-eral rounds of calculation and tuning, and the correspondingfluid features were calculated. Table 4 presents a comparisonbetween the simulated and measured values of the fluid fea-tures of Well ZG7-5. The modeled features are consistentwith the measured results. Further, the modeled density ofoil on the ground and the solution GOR show relatively large
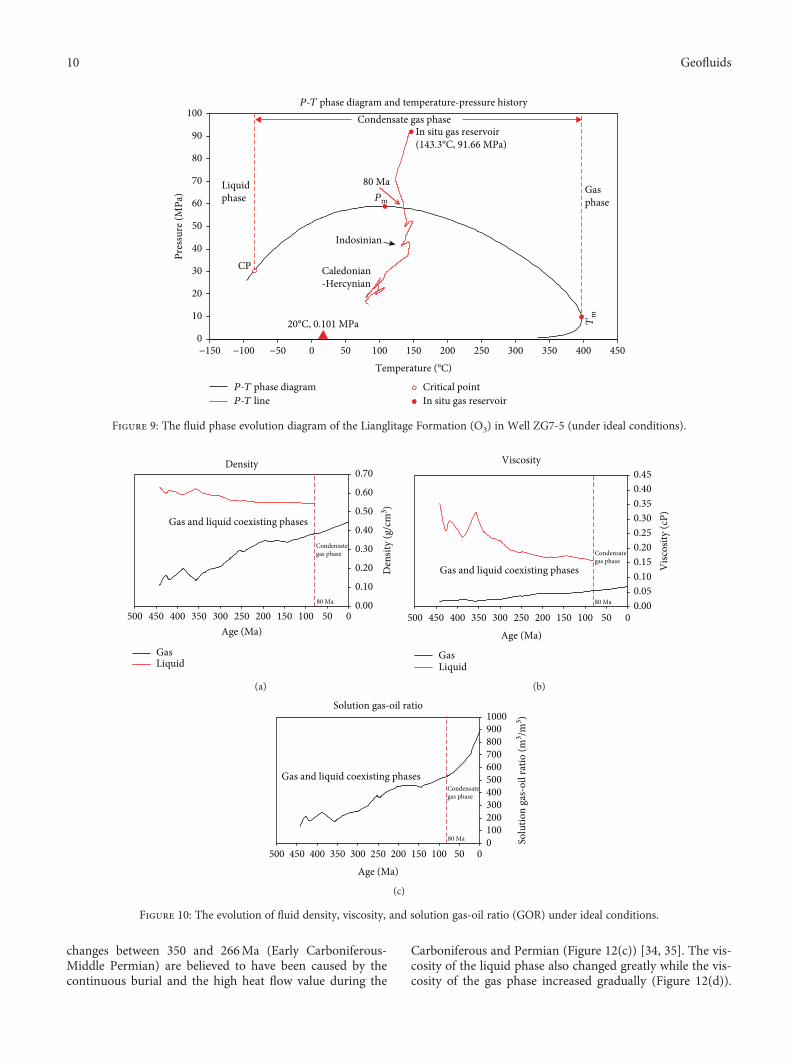
errors because oil density was measured with the loss of somelight fractions, and the produced GOR, which slightly differsfrom the solution GOR, was measured. These comparisonsillustrate that the modeling results are valid and the methodis effective. The simulated P‐T phase diagram for the fluidsin the Lianglitage reservoir (O3) is displayed in Figure 4. Itcan be seen that the temperature and pressure of the criticalpoint (CP) are -83.8°C and 30.25MPa, respectively, and thecricondentherm (Tm) and cricondenbar (Pm) are 397.67°Cand 58.95MPa, respectively. Furthermore, the P‐T phasediagram is divided into the liquid phase zone, the condensategas phase zone, the gas phase zone, and the coexistence phasezone for gas and liquid, by the positional order of the criticalpoint (CP), cricondentherm (Tm), and cricondenbar (Pm).Based on the phase zone distribution of the P‐T diagramand the in situ reservoir conditions (T i = 143 3°C, Pi =91 66MPa), the in situ reservoir fluid was classified as beingof the condensate gas phase type. Under the conditions ofnormal temperature and pressure (20°C, 0.101MPa), thefluid returns from the condensate gas phase to two separatephases of gas and liquid, which coincides with the currentproduct type and macro compositions.
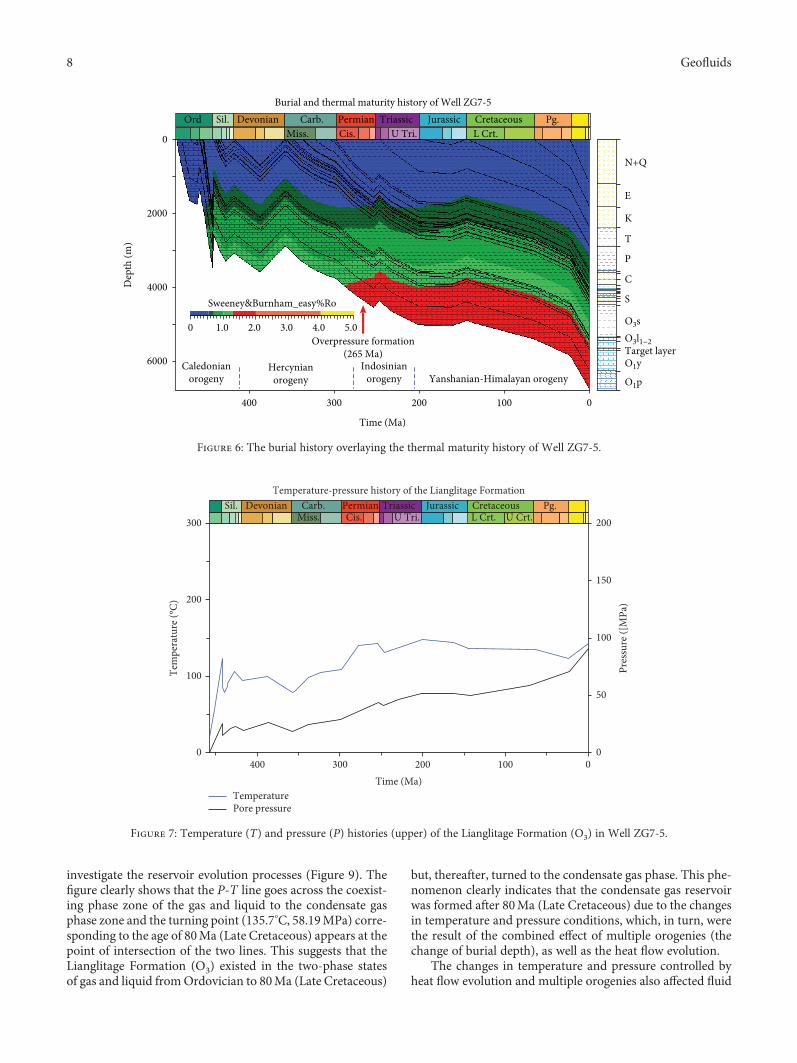
4.2. Histories of Burial, Temperature, Pressure, and PressureCoefficient. As can be seen from Figure 5, the measured andmodeled values of temperature and vitrinite reflectance
Table 3: The main deposition and erosion events in Well ZG7-5.
Age (Ma) Strata Depth (m) Erosion thickness (m) Lithology
0 Top N+Q 0 Sandstone, shale
23 Top E 1200 Sandstone
66 Top K 1834 Sandstone, shale
144 Erosion J -150
163 Top J 150 Sandstone, shale
201 Top T 2390 Shale, siltstone, conglomerate
247 Erosion P -150
254 Top P 2906 150 Shale, siltstone, conglomerate
298.9 Top C 3562 Shale, sandstone, limestone
358 Erosion D -700
387 Top D 700 Sandstone
417.6 Erosion S -100
427.4 Top S 4140 100 Sandstone, shale, siltstone
442 Erosion O3s -900
443 Top O3s 4482 900 Shale
453.4 Top O3l1-2 5333 Limestone, sandstone
454.9 Target layer 5457 Limestone
458 Erosion O1ys -250
459.9 Erosion O2yif -100
460.7 Erosion O2t -50
461 Top O2t 50 Limestone
464.7 Top O2yjf 100 Limestone
470 Top O1ys 5711 250 Limestone, dolomite
479.5 Top O1p 6261 Dolomite, limestone
485.4 Base 6761
5Geofluids
(Ro) fit well, indicating the reliability of burial, temperature,pressure, and pressure coefficient histories modeled usingthe PetroMod software.
The burial history overlaying with the thermal maturityhistory of Well ZG7-5 is shown in Figure 6, which indicatesthat the Tazhong Uplift has experienced multiple stages ofuplift and erosion caused by multiple orogenies. Among allthese orogenies, the Caledonian and Hercynian orogenies
had the most crucial impact on the study area. The TarimBasin experienced a period of stable platform developmentduring the Cambrian-Early Ordovician and encountered aslight erosion during the Late Middle Ordovician. Subse-quently, the rapid subsidence and the following strong ero-sion of strata caused by the Middle Caledonian orogenywere the significant features of the Late Ordovician. Thisorogeny was also characterized by the strongest uplift anderosion (900m) during the entire geological evolution historyin the study area. During the Late Devonian, the Hercynianorogeny caused another strong uplift and erosion (700m).The combined Caledonian and Hercynian orogenies causedan erosion thickness of more than 2000m, and the Ordovi-cian strata reached high-mature states (1.3-2.0%Ro) at thebeginning of the Permian period. The orogeny events follow-ing this period had little impacts on the maturity. Currently,the Ordovician strata are buried to the maximum depth ofover 6000m.
Figure 7 shows the temperature and pressure historiesof the Lianglitage Formation (O3) in Well ZG7-5. The tem-perature history is significantly linked with the heat flowevolution and the burial history, while the pressure historyis correlated with the burial history and lithology. Boththe temperature and pressure histories depict overallincreasing trends from the Ordovician to the present; how-ever, decreasing trends caused by erosion events, heat flow
200 100 0300400
20
30
40
50
60
70
10
20
30
40
0
100
200
300
Time (Ma)
PWD
(m)
SWIT
(°C)
HF
(mW
/m2 )
Boundary condition plots
Ord Devonian Carb. Perm. Triassic Jurassic Cretaceous Pg.
L Crt.U Tri.Cis.Miss.
Figure 3: The boundary condition plots for Well ZG7-5.
Table 4: Comparison between simulated and measured features ofthe fluid.
ItemsSimulatedvalues
Measuredvalues
Critical temperature (°C) -83.80 -77.80
Critical pressure (MPa) 30.25 29.25
Cricondentherm (°C) 397.67 386.30
Cricondenbar (MPa) 58.95 57.71
Dew point pressure(142.6°C)(MPa)
58.00 56.81
Oil density at ground(20°C)(g/cm3)
0.72 0.80∗
Solution gas-oil ratio (GOR)(m3/m3)
883 823∗∗
∗Measured with some loss of volatile fractions. ∗∗Produced GOR.
6 Geofluids
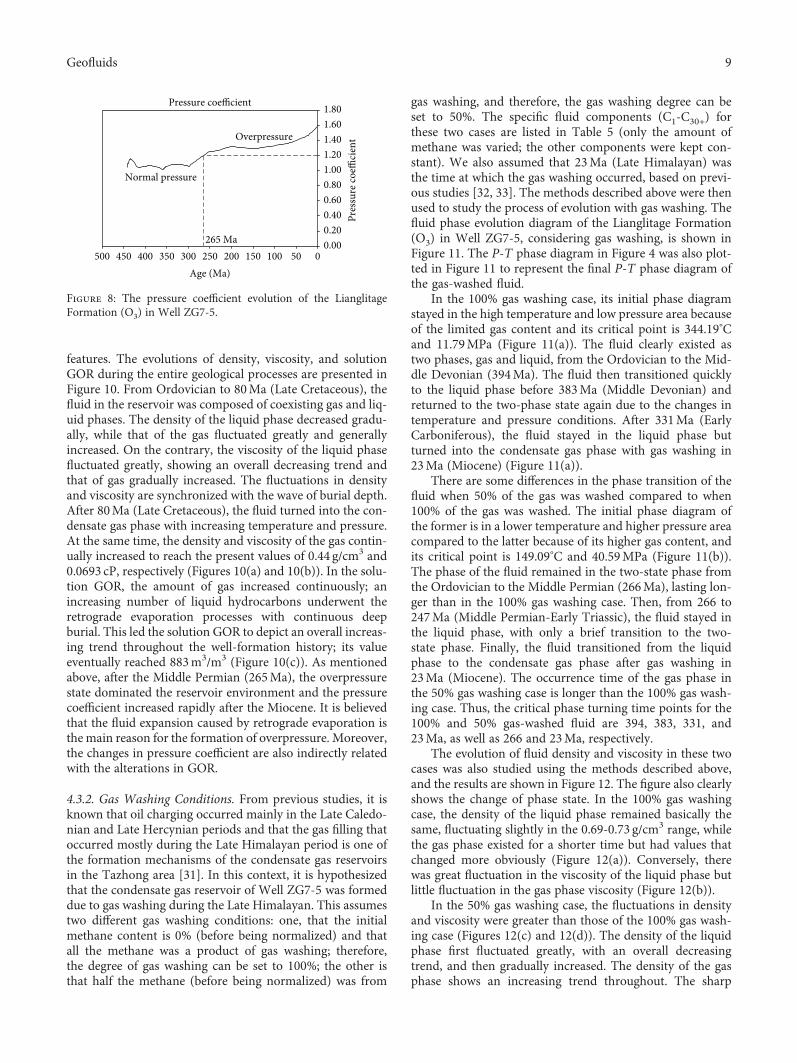
changes, or lithology variations were also observed. More-over, the pressure coefficients throughout the evolutionhistory were also calculated by the results derived from Pet-roMod (Figure 8). During the early stages, the reservoir wasin normal pressure condition; these conditions changed tothe state of overpressure (pressure coefficient > 1 2) duringthe Middle Permian (265Ma) due to the deepening of theburial depth. After the Miocene, the pressure coefficientincreased rapidly.
4.3. The Evolution of the Fluid Phase and Features
4.3.1. Ideal Conditions. Under ideal conditions, we assumedthat the reservoir was formed without any destruction orchange and the composition of the reservoir fluid was con-stant during the entire geological process. The simulatedphase envelope and the modeled temperature-pressurevalues (labeled as the P‐T line) at each time point of a crit-ical geological event were overlapped in the same plot to
0
10
20
30
40
50
60
70
80
90
100
−150 −100 −50 0 50 100 150 200 250 300 350 400 450
Pres
sure
(MPa
)
Temperature (°C)
P-T phase diagram
P-T phase diagramCritical pointIn situ gas reservoir
Condensate gas phase
Pm (58.95 MPa)
Tm
(397
.67°
C)
CP (−83.8°C and 30.25 MPa)
Liquidphase
Gasphase
Gas and liquid coexisting phases
In situ gas reservoir (143.3°C, 91.66 MPa)
20°C, 0.101 MPa
Figure 4: P‐T phase diagram for the fluid in Well ZG7-5.
Vitrinite reflectance (%Ro)
Dep
th (m
)
0.5 1.00
2000
N+Q
EKTPCSO3S
O1yO1p
O3l1−2Target layer
Vitrinite reflectance of ZG7-5Sweeney&Burnham(1990)_easy%Ro
4000
6000
(a)
Dep
th (m
)
50 100 150 200 250 300
Temperature of ZG7-5Temperature
N+Q
EKTPCSO3S
O1yO1p
O3l1−2Target layer
0
2000
4000
6000
Temperature (°C)
(b)
Figure 5: Good fit between the measured temperature and maturities and the modeled results of Well ZG7-5.
7Geofluids
investigate the reservoir evolution processes (Figure 9). Thefigure clearly shows that the P‐T line goes across the coexist-ing phase zone of the gas and liquid to the condensate gasphase zone and the turning point (135.7°C, 58.19MPa) corre-sponding to the age of 80Ma (Late Cretaceous) appears at thepoint of intersection of the two lines. This suggests that theLianglitage Formation (O3) existed in the two-phase statesof gas and liquid fromOrdovician to 80Ma (Late Cretaceous)
but, thereafter, turned to the condensate gas phase. This phe-nomenon clearly indicates that the condensate gas reservoirwas formed after 80Ma (Late Cretaceous) due to the changesin temperature and pressure conditions, which, in turn, werethe result of the combined effect of multiple orogenies (thechange of burial depth), as well as the heat flow evolution.
The changes in temperature and pressure controlled byheat flow evolution and multiple orogenies also affected fluid
Time (Ma)
0100200300400
K
T
P
C
S
O3sO3l1−2
O1p
O1y
E
N+Q
Target layer6000
4000
2000
0D
epth
(m)
Burial and thermal maturity history of Well ZG7-5
Caledonianorogeny
Hercynianorogeny
Indosinianorogeny Yanshanian-Himalayan orogeny
Overpressure formation(265 Ma)
0 1.0 2.0 3.0 4.0 5.0
Sweeney&Burnham_easy%Ro
Ord DevonianSil. Carb. Permian Triassic Jurassic Cretaceous Pg.L Crt.U Tri.Cis.Miss.
Figure 6: The burial history overlaying the thermal maturity history of Well ZG7-5.
Tem
pera
ture
(°C)
Pres
sure
([M
Pa)
Time (Ma)
300
200
100
0
200
150
50
0
100
0100200300400
Temperature-pressure history of the Lianglitage Formation
Pore pressureTemperature
DevonianSil. Carb. Permian Triassic Jurassic Cretaceous Pg.L Crt. U Crt.U Tri.Cis.Miss.
Figure 7: Temperature (T) and pressure (P) histories (upper) of the Lianglitage Formation (O3) in Well ZG7-5.
8 Geofluids
features. The evolutions of density, viscosity, and solutionGOR during the entire geological processes are presented inFigure 10. From Ordovician to 80Ma (Late Cretaceous), thefluid in the reservoir was composed of coexisting gas and liq-uid phases. The density of the liquid phase decreased gradu-ally, while that of the gas fluctuated greatly and generallyincreased. On the contrary, the viscosity of the liquid phasefluctuated greatly, showing an overall decreasing trend andthat of gas gradually increased. The fluctuations in densityand viscosity are synchronized with the wave of burial depth.After 80Ma (Late Cretaceous), the fluid turned into the con-densate gas phase with increasing temperature and pressure.At the same time, the density and viscosity of the gas contin-ually increased to reach the present values of 0.44 g/cm3 and0.0693 cP, respectively (Figures 10(a) and 10(b)). In the solu-tion GOR, the amount of gas increased continuously; anincreasing number of liquid hydrocarbons underwent theretrograde evaporation processes with continuous deepburial. This led the solution GOR to depict an overall increas-ing trend throughout the well-formation history; its valueeventually reached 883m3/m3 (Figure 10(c)). As mentionedabove, after the Middle Permian (265Ma), the overpressurestate dominated the reservoir environment and the pressurecoefficient increased rapidly after the Miocene. It is believedthat the fluid expansion caused by retrograde evaporation isthe main reason for the formation of overpressure. Moreover,the changes in pressure coefficient are also indirectly relatedwith the alterations in GOR.
4.3.2. Gas Washing Conditions. From previous studies, it isknown that oil charging occurred mainly in the Late Caledo-nian and Late Hercynian periods and that the gas filling thatoccurred mostly during the Late Himalayan period is one ofthe formation mechanisms of the condensate gas reservoirsin the Tazhong area [31]. In this context, it is hypothesizedthat the condensate gas reservoir of Well ZG7-5 was formeddue to gas washing during the Late Himalayan. This assumestwo different gas washing conditions: one, that the initialmethane content is 0% (before being normalized) and thatall the methane was a product of gas washing; therefore,the degree of gas washing can be set to 100%; the other isthat half the methane (before being normalized) was from
gas washing, and therefore, the gas washing degree can beset to 50%. The specific fluid components (C1-C30+) forthese two cases are listed in Table 5 (only the amount ofmethane was varied; the other components were kept con-stant). We also assumed that 23Ma (Late Himalayan) wasthe time at which the gas washing occurred, based on previ-ous studies [32, 33]. The methods described above were thenused to study the process of evolution with gas washing. Thefluid phase evolution diagram of the Lianglitage Formation(O3) in Well ZG7-5, considering gas washing, is shown inFigure 11. The P‐T phase diagram in Figure 4 was also plot-ted in Figure 11 to represent the final P‐T phase diagram ofthe gas-washed fluid.
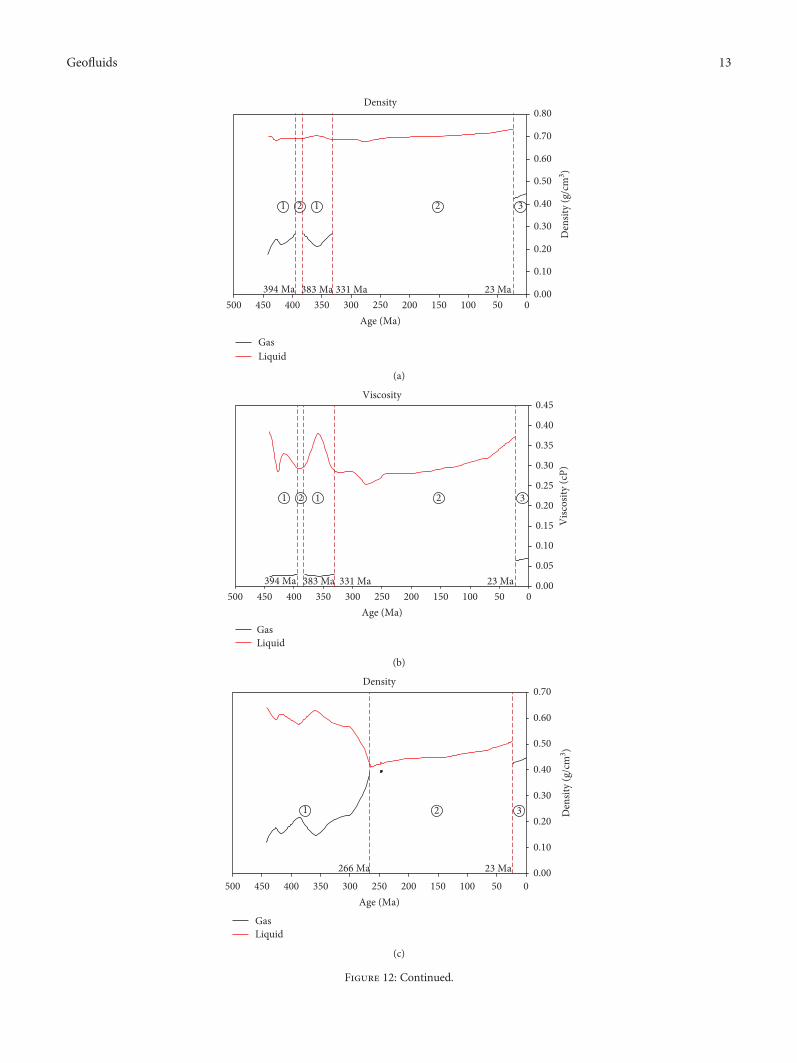
In the 100% gas washing case, its initial phase diagramstayed in the high temperature and low pressure area becauseof the limited gas content and its critical point is 344.19°Cand 11.79MPa (Figure 11(a)). The fluid clearly existed astwo phases, gas and liquid, from the Ordovician to the Mid-dle Devonian (394Ma). The fluid then transitioned quicklyto the liquid phase before 383Ma (Middle Devonian) andreturned to the two-phase state again due to the changes intemperature and pressure conditions. After 331Ma (EarlyCarboniferous), the fluid stayed in the liquid phase butturned into the condensate gas phase with gas washing in23Ma (Miocene) (Figure 11(a)).
There are some differences in the phase transition of thefluid when 50% of the gas was washed compared to when100% of the gas was washed. The initial phase diagram ofthe former is in a lower temperature and higher pressure areacompared to the latter because of its higher gas content, andits critical point is 149.09°C and 40.59MPa (Figure 11(b)).The phase of the fluid remained in the two-state phase fromthe Ordovician to the Middle Permian (266Ma), lasting lon-ger than in the 100% gas washing case. Then, from 266 to247Ma (Middle Permian-Early Triassic), the fluid stayed inthe liquid phase, with only a brief transition to the two-state phase. Finally, the fluid transitioned from the liquidphase to the condensate gas phase after gas washing in23Ma (Miocene). The occurrence time of the gas phase inthe 50% gas washing case is longer than the 100% gas wash-ing case. Thus, the critical phase turning time points for the100% and 50% gas-washed fluid are 394, 383, 331, and23Ma, as well as 266 and 23Ma, respectively.
The evolution of fluid density and viscosity in these twocases was also studied using the methods described above,and the results are shown in Figure 12. The figure also clearlyshows the change of phase state. In the 100% gas washingcase, the density of the liquid phase remained basically thesame, fluctuating slightly in the 0.69-0.73 g/cm3 range, whilethe gas phase existed for a shorter time but had values thatchanged more obviously (Figure 12(a)). Conversely, therewas great fluctuation in the viscosity of the liquid phase butlittle fluctuation in the gas phase viscosity (Figure 12(b)).
In the 50% gas washing case, the fluctuations in densityand viscosity were greater than those of the 100% gas wash-ing case (Figures 12(c) and 12(d)). The density of the liquidphase first fluctuated greatly, with an overall decreasingtrend, and then gradually increased. The density of the gasphase shows an increasing trend throughout. The sharp
Pressure coefficient 1.801.601.401.201.000.800.600.400.200.00
500 450 400 350 300 250Age (Ma)
200 150 100 50 0
Pres
sure
coeffi
cien
t
Normal pressure
Overpressure
265 Ma
Figure 8: The pressure coefficient evolution of the LianglitageFormation (O3) in Well ZG7-5.
9Geofluids
changes between 350 and 266Ma (Early Carboniferous-Middle Permian) are believed to have been caused by thecontinuous burial and the high heat flow value during the
Carboniferous and Permian (Figure 12(c)) [34, 35]. The vis-cosity of the liquid phase also changed greatly while the vis-cosity of the gas phase increased gradually (Figure 12(d)).
P-T phase diagram and temperature-pressure history
P-T phase diagramP-T line
Critical pointIn situ gas reservoir
100
90
80
70
60
50
40
Caledonian-Hercynian
30
20
10
0−150 −100 −50 0 50 100 150 200 250 300 350 400 450
Temperature (°C)
Pres
sure
(MPa
)
Tm
Liquidphase
CP
In situ gas reservoir(143.3°C, 91.66 MPa)
Condensate gas phase
80 MaPm
Indosinian
Gasphase
20°C, 0.101 MPa
Figure 9: The fluid phase evolution diagram of the Lianglitage Formation (O3) in Well ZG7-5 (under ideal conditions).
Density
GasLiquid
0.70
0.60
0.50
0.40
0.30
0.20
0.10
0.00500 450 400 350 300 250
Age (Ma)200 150 100 50 0
Den
sity
(g/c
m3 )
Gas and liquid coexisting phases
Condensategas phase
80 Ma
(a)
Viscosity
GasLiquid
0.450.400.350.300.250.200.150.100.050.00
500 450 400 350 300 250Age (Ma)
200 150 100 50 0
Visc
osity
(cP)
Gas and liquid coexisting phases
Condensategas phase
80 Ma
(b)
Solution gas-oil ratio10009008007006005004003002001000
500 450 400 350 300 250Age (Ma)
200 150 100 50 0
Solu
tion
gas-
oil r
atio
(m3 /m
3 )
Gas and liquid coexisting phasesCondensategas phase
80 Ma
(c)
Figure 10: The evolution of fluid density, viscosity, and solution gas-oil ratio (GOR) under ideal conditions.
10 Geofluids
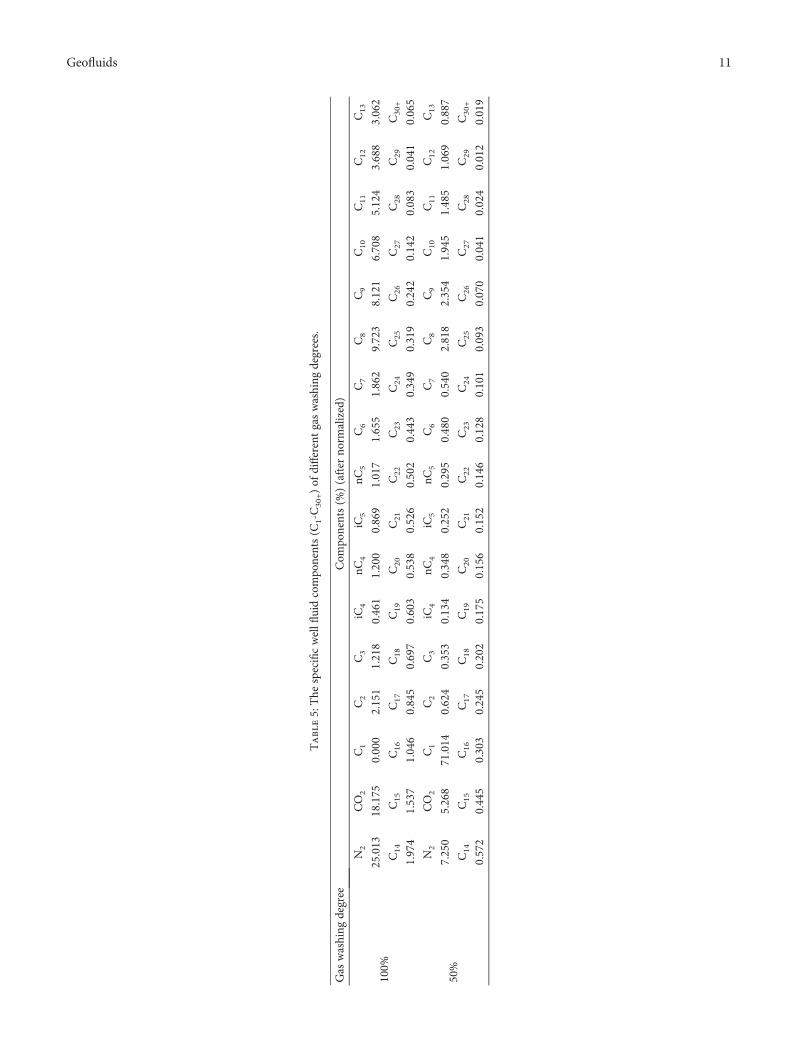
Table5:The
specificwellfl
uidcompo
nents(C
1-C30+)of
differentgaswashing
degrees.
Gas
washing
degree
Com
ponents(%
)(after
norm
alized)
100%
N2
CO2
C1
C2
C3
iC4
nC4
iC5
nC5
C6
C7
C8
C9
C10
C11
C12
C13
25.013
18.175
0.000
2.151
1.218
0.461
1.200
0.869
1.017
1.655
1.862
9.723
8.121
6.708
5.124
3.688
3.062
C14
C15
C16
C17
C18
C19
C20
C21
C22
C23
C24
C25
C26
C27
C28
C29
C30+
1.974
1.537
1.046
0.845
0.697
0.603
0.538
0.526
0.502
0.443
0.349
0.319
0.242
0.142
0.083
0.041
0.065
50%
N2
CO2
C1
C2
C3
iC4
nC4
iC5
nC5
C6
C7
C8
C9
C10
C11
C12
C13
7.250
5.268
71.014
0.624
0.353
0.134
0.348
0.252
0.295
0.480
0.540
2.818
2.354
1.945
1.485
1.069
0.887
C14
C15
C16
C17
C18
C19
C20
C21
C22
C23
C24
C25
C26
C27
C28
C29
C30+
0.572
0.445
0.303
0.245
0.202
0.175
0.156
0.152
0.146
0.128
0.101
0.093
0.070
0.041
0.024
0.012
0.019
11Geofluids
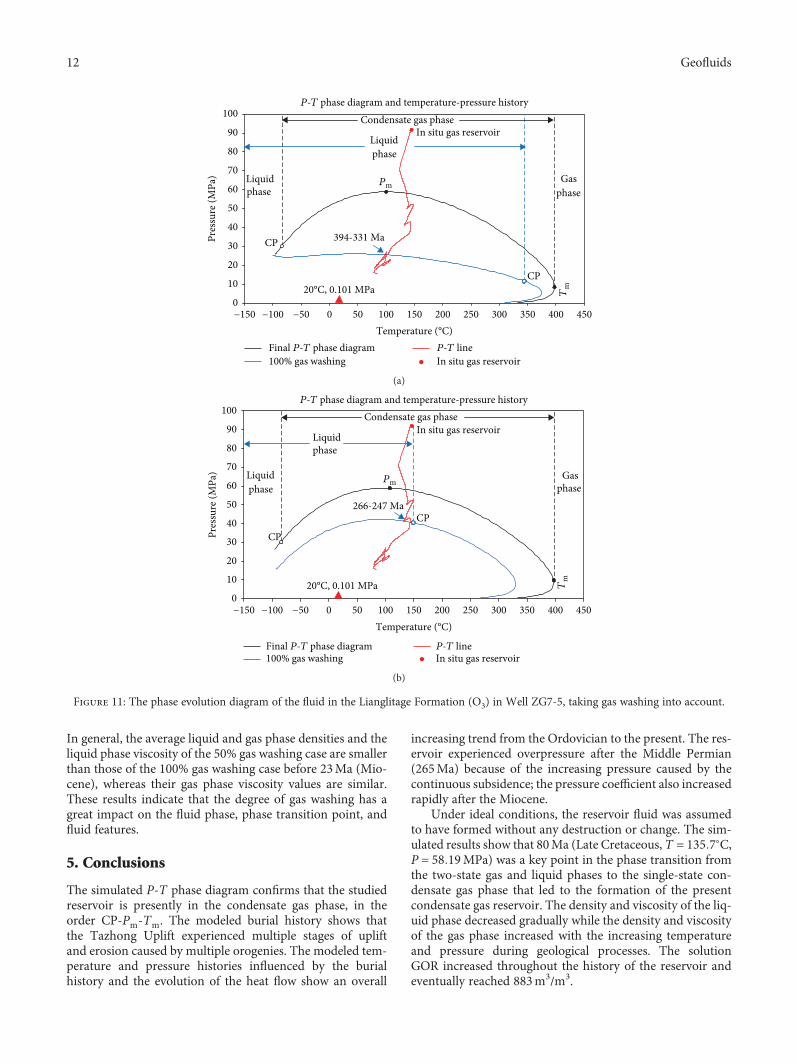
In general, the average liquid and gas phase densities and theliquid phase viscosity of the 50% gas washing case are smallerthan those of the 100% gas washing case before 23Ma (Mio-cene), whereas their gas phase viscosity values are similar.These results indicate that the degree of gas washing has agreat impact on the fluid phase, phase transition point, andfluid features.
5. Conclusions
The simulated P‐T phase diagram confirms that the studiedreservoir is presently in the condensate gas phase, in theorder CP‐Pm‐Tm. The modeled burial history shows thatthe Tazhong Uplift experienced multiple stages of upliftand erosion caused by multiple orogenies. The modeled tem-perature and pressure histories influenced by the burialhistory and the evolution of the heat flow show an overall
increasing trend from the Ordovician to the present. The res-ervoir experienced overpressure after the Middle Permian(265Ma) because of the increasing pressure caused by thecontinuous subsidence; the pressure coefficient also increasedrapidly after the Miocene.
Under ideal conditions, the reservoir fluid was assumedto have formed without any destruction or change. The sim-ulated results show that 80Ma (Late Cretaceous, T = 135 7°C,P = 58 19MPa) was a key point in the phase transition fromthe two-state gas and liquid phases to the single-state con-densate gas phase that led to the formation of the presentcondensate gas reservoir. The density and viscosity of the liq-uid phase decreased gradually while the density and viscosityof the gas phase increased with the increasing temperatureand pressure during geological processes. The solutionGOR increased throughout the history of the reservoir andeventually reached 883m3/m3.
P-T phase diagram and temperature-pressure history
Final P-T phase diagram100% gas washing
P-T line
100
90
80
70
60
50
40
30
20
10 20°C, 0.101 MPa0−150 −100 −50 0 50 100 150 200 250 300 350 400 450
Temperature (°C)
Pres
sure
(MPa
) Liquidphase
CP
Condensate gas phaseIn situ gas reservoir
Liquidphase
Pm
394-331 Ma
CP
Gas phase
Tm
In situ gas reservoir
(a)
P-T phase diagram and temperature-pressure history100
90
80
70
60
50
40
30
20
10
0−150 −100 −50 0 50 100 150 200 250 300 350 400 450
Temperature (°C)
Pres
sure
(MPa
)
Tm
Liquid phase
CP
Condensate gas phaseIn situ gas reservoir
Liquidphase
Pm
266-247 MaCP
Gasphase
20°C, 0.101 MPa
Final P-T phase diagram100% gas washing
P-T lineIn situ gas reservoir
(b)
Figure 11: The phase evolution diagram of the fluid in the Lianglitage Formation (O3) in Well ZG7-5, taking gas washing into account.
12 Geofluids
GasLiquid
Density0.80
0.70
0.60
0.50
0.40
0.30
0.20
0.10
0.00500 450 400 350
1
300 250Age (Ma)
200 150 100 50 0
Den
sity
(g/c
m3 )
394 Ma 383 Ma 331 Ma 23 Ma
2 1 2 3
(a)
GasLiquid
Viscosity0.45
0.40
0.35
0.30
0.25
0.20
0.15
0.10
0.05
0.00500 450 400 350 300 250
Age (Ma)200 150 100 50 0
Visc
osity
(cP)
394 Ma 383 Ma 331 Ma 23 Ma
1 2 1 2 3
(b)
GasLiquid
1 2 3
Density0.70
0.60
0.50
0.40
0.30
0.20
0.10
0.00500 450 400 350 300 250 200
Age (Ma)150 100 50 0
Den
sity
(g/c
m3 )
266 Ma 23 Ma
(c)
Figure 12: Continued.
13Geofluids
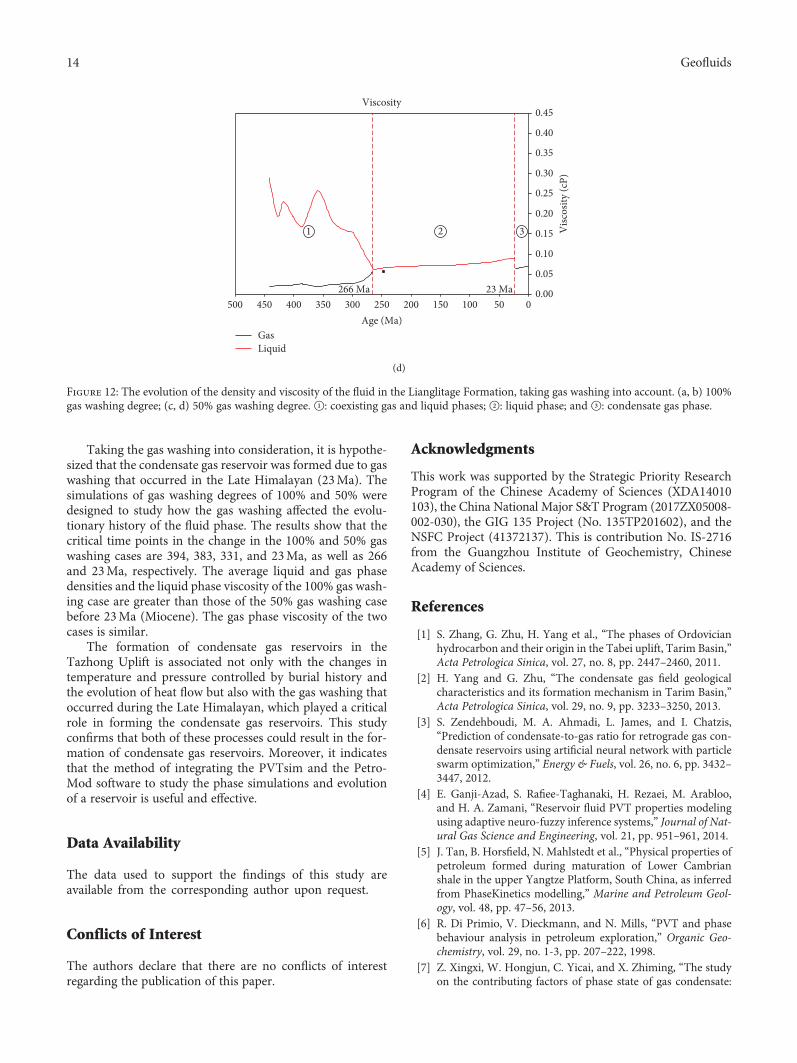
Taking the gas washing into consideration, it is hypothe-sized that the condensate gas reservoir was formed due to gaswashing that occurred in the Late Himalayan (23Ma). Thesimulations of gas washing degrees of 100% and 50% weredesigned to study how the gas washing affected the evolu-tionary history of the fluid phase. The results show that thecritical time points in the change in the 100% and 50% gaswashing cases are 394, 383, 331, and 23Ma, as well as 266and 23Ma, respectively. The average liquid and gas phasedensities and the liquid phase viscosity of the 100% gas wash-ing case are greater than those of the 50% gas washing casebefore 23Ma (Miocene). The gas phase viscosity of the twocases is similar.
The formation of condensate gas reservoirs in theTazhong Uplift is associated not only with the changes intemperature and pressure controlled by burial history andthe evolution of heat flow but also with the gas washing thatoccurred during the Late Himalayan, which played a criticalrole in forming the condensate gas reservoirs. This studyconfirms that both of these processes could result in the for-mation of condensate gas reservoirs. Moreover, it indicatesthat the method of integrating the PVTsim and the Petro-Mod software to study the phase simulations and evolutionof a reservoir is useful and effective.
Data Availability
The data used to support the findings of this study areavailable from the corresponding author upon request.
Conflicts of Interest
The authors declare that there are no conflicts of interestregarding the publication of this paper.
Acknowledgments
This work was supported by the Strategic Priority ResearchProgram of the Chinese Academy of Sciences (XDA14010103), the China National Major S&T Program (2017ZX05008-002-030), the GIG 135 Project (No. 135TP201602), and theNSFC Project (41372137). This is contribution No. IS-2716from the Guangzhou Institute of Geochemistry, ChineseAcademy of Sciences.
References
[1] S. Zhang, G. Zhu, H. Yang et al., “The phases of Ordovicianhydrocarbon and their origin in the Tabei uplift, Tarim Basin,”Acta Petrologica Sinica, vol. 27, no. 8, pp. 2447–2460, 2011.
[2] H. Yang and G. Zhu, “The condensate gas field geologicalcharacteristics and its formation mechanism in Tarim Basin,”Acta Petrologica Sinica, vol. 29, no. 9, pp. 3233–3250, 2013.
[3] S. Zendehboudi, M. A. Ahmadi, L. James, and I. Chatzis,“Prediction of condensate-to-gas ratio for retrograde gas con-densate reservoirs using artificial neural network with particleswarm optimization,” Energy & Fuels, vol. 26, no. 6, pp. 3432–3447, 2012.
[4] E. Ganji-Azad, S. Rafiee-Taghanaki, H. Rezaei, M. Arabloo,and H. A. Zamani, “Reservoir fluid PVT properties modelingusing adaptive neuro-fuzzy inference systems,” Journal of Nat-ural Gas Science and Engineering, vol. 21, pp. 951–961, 2014.
[5] J. Tan, B. Horsfield, N. Mahlstedt et al., “Physical properties ofpetroleum formed during maturation of Lower Cambrianshale in the upper Yangtze Platform, South China, as inferredfrom PhaseKinetics modelling,” Marine and Petroleum Geol-ogy, vol. 48, pp. 47–56, 2013.
[6] R. Di Primio, V. Dieckmann, and N. Mills, “PVT and phasebehaviour analysis in petroleum exploration,” Organic Geo-chemistry, vol. 29, no. 1-3, pp. 207–222, 1998.
[7] Z. Xingxi, W. Hongjun, C. Yicai, and X. Zhiming, “The studyon the contributing factors of phase state of gas condensate:
GasLiquid
1 2 3
Viscosity0.45
0.40
0.35
0.30
0.25
0.20
0.15
0.10
0.05
0.00500 450 400 350 300 250 200
Age (Ma)150 100 50 0
Visc
osity
(cP)
266 Ma 23 Ma
(d)
Figure 12: The evolution of the density and viscosity of the fluid in the Lianglitage Formation, taking gas washing into account. (a, b) 100%gas washing degree; (c, d) 50% gas washing degree. ①: coexisting gas and liquid phases; ②: liquid phase; and ③: condensate gas phase.
14 Geofluids
examples from Tarim Basin,” Marine and Petroleum Geology,vol. 15, no. 1, pp. 21–31, 1998.
[8] H. Zhang, S. Zhou, D. Fu et al., “Petroleum phase state predic-tion in deep reservoir of Tashen-1 well in Tarim Basin,” Natu-ral Gas Geoscience, vol. 24, no. 5, pp. 999–1004, 2013.
[9] Y. Tan, Y. Jiang, L. Zhao, X. Mu, and T. Xu, “Main controllingfactors of phase evolution and charging pattern of hydrocar-bons in northern Dongpu sag,” Petroleum Geology & Experi-ment, vol. 37, no. 1, pp. 28–34, 2015.
[10] S. Cui, H. Gu, S. Fang, andW. Yu, “Full component simulationof condensate gas in well Chunxiao 3 in Donghai oilfield,”Petroleum Geology and Recovery Efficiency, vol. 9, no. 1,pp. 54–56, 2002.
[11] L. Desheng, L. Digang, J. Chengzao, W. Gang, W. Qizhi, andH. Dengfa, “Hydrocarbon accumulations in the Tarim Basin,China,” AAPG Bulletin, vol. 80, no. 10, pp. 1587–1603, 1996.
[12] G. Zhu, A. V. Milkov, F. Chen et al., “Non-cracked oil in ultra-deep high-temperature reservoirs in the Tarim Basin, China,”Marine and Petroleum Geology, vol. 89, pp. 252–262, 2018.
[13] C. Jia, Tectonic Characteristics and Petroleum, Tarim Basin,Petroleum Industry Press, China, 1997.
[14] H. Pang, J. Chen, X. Pang et al., “Analysis of secondary migra-tion of hydrocarbons in the Ordovician carbonate reservoirs inthe Tazhong uplift, Tarim Basin, China,” AAPG Bulletin,vol. 97, no. 10, pp. 1765–1783, 2013.
[15] S. Li, X. Pang, Z. Jin et al., “Petroleum source in the Tazhonguplift, Tarim Basin: new insights from geochemical andfluid inclusion data,” Organic Geochemistry, vol. 41, no. 6,pp. 531–553, 2010.
[16] Q. Liu, Z. Jin, H. Li et al., “Geochemistry characteristics andgenetic types of natural gas in central part of the Tarim Basin,NW China,” Marine and Petroleum Geology, vol. 89, pp. 91–105, 2018.
[17] X. Zhou, X. Pang, Q. Li et al., “Advances and problems inhydrocarbon exploration in the Tazhong area, Tarim Basin,”Petroleum Science, vol. 7, no. 2, pp. 164–178, 2010.
[18] J. Chen, X. Pang, and Z. Jiang, “Controlling factors and genesisof hydrocarbons with complex phase state in the upper Ordo-vician of the Tazhong area, Tarim Basin, China,” CanadianJournal of Earth Sciences, vol. 52, no. 10, pp. 880–892, 2015.
[19] Y. Zhang, X. Lyu, H. Yu, B. Jing, C. Zhang, and J. Cai, “Con-trolling mechanism of two strike-slip fault groups on thedevelopment of the Ordovician karst reservoirs in the Tazhonguplift, Tarim Basin,”Oil & Gas Geology, vol. 37, no. 5, pp. 663–673, 2016.
[20] P. Dimitrakopoulos, W. Jia, and C. Li, “An improved compu-tational method for the calculation of mixture liquid–vaporcritical points,” International Journal of Thermophysics,vol. 35, no. 5, pp. 865–889, 2014.
[21] W. A. England, “Empirical correlations to predict gas/gascondensate phase behaviour in sedimentary basins,” OrganicGeochemistry, vol. 33, no. 6, pp. 665–673, 2002.
[22] X. Yao and Y. Wang, “Assessing shale gas resources ofWufeng-Longmaxi shale (O3w-S1l) in Jiaoshiba area, SESichuan (China) using PetroMod I: burial and thermal histo-ries,” Petroleum Science and Technology, vol. 34, no. 11-12,pp. 1000–1007, 2016.
[23] M. Mei, K. K. (. A.). Bissada, T. B. Malloy, L. M. Darnell, andZ. Liu, “Origin of condensates and natural gases in the AlmondFormation reservoirs in southwestern Wyoming, USA,”Organic Geochemistry, vol. 124, pp. 164–179, 2018.
[24] C. Shangbin, Z. Yanming, C. Si, H. Yufu, F. Changqing, andF. Junhua, “Hydrocarbon generation and shale gas accumula-tion in the Longmaxi Formation, southern Sichuan Basin,China,” Marine and Petroleum Geology, vol. 86, pp. 248–258,2017.
[25] Y. Zhang, Z. Jin, G. Liu, and J. Li, “Study on the formation ofunconformaties and the amount of the eroded sedimentationin the Tarim Basin,” Earth Science Frontiers, vol. 7, no. 4,pp. 449–457, 2000.
[26] X. Pang, C. Jia, H. Pang, and H. Yang, “Destruction of hydro-carbon reservoirs due to tectonic modifications: conceptualmodels and quantitative evaluation on the Tarim Basin,China,” Marine and Petroleum Geology, vol. 91, pp. 401–421,2018.
[27] Y. Qi and G. Liu, “Wave process analysis and erosion thicknessstudy of unconformities in the sedimentary basin: examples ofthe Tarim Basin, Xinjiang,” Journal of Jiaozuo Institute ofTechnology, vol. 18, no. 3, pp. 161–165, 1999.
[28] N. Qiu, J. Chang, Y. Zuo, J. Wang, and H. Li, “Thermal evolu-tion and maturation of lower Paleozoic source rocks in theTarim Basin, Northwest China,” AAPG Bulletin, vol. 96,no. 5, pp. 789–821, 2012.
[29] L. Wang, C. Li, and Y. Shi, “Distribution of terrestrial heat flowdensity in the Tarim Basin,” Acta Geophysica Sinica, vol. 38,no. 6, pp. 855-856, 1995.
[30] C. G. Feng, S. W. Liu, L. S. Wang, and C. Li, “Present-day geo-thermal regime in Tarim Basin, Northwest China,” ChineseJournal of Geophysics, vol. 52, no. 6, pp. 1237–1250, 2009.
[31] H. Yang, G. Zhu, J. Han et al., “Conditions and mechanism ofhydrocarbon accumulation in large reef-bank karst oil/gasfields of Tazhong area, Tarim Basin,” Acta Petrologica Sinica,vol. 27, no. 6, pp. 1865–1885, 2011.
[32] G. Zhu, B. Zhang, H. Yang, J. Su, K. Liu, and Y. Zhu, “Second-ary alteration to ancient oil reservoirs by late gas filling in theTazhong area, Tarim Basin,” Journal of Petroleum Scienceand Engineering, vol. 122, pp. 240–256, 2014.
[33] S. Zhang, B. Zhang, H. Yang, G. Zhu, J. Su, and X. Wang,“Adjustment and alteration of hydrocarbon reservoirs duringthe late Himalayan period, Tarim Basin, NW China,” Petro-leum Exploration and Development, vol. 39, no. 6, pp. 712–724, 2012.
[34] J. Li, Z. Li, N. Qiu, Y. Zuo, J. Yu, and J. Liu, “Carboniferous-Permian abnormal thermal evolution of the Tarim Basin andits implication for deep structure and magmatic activity,” Chi-nese Journal of Geophysics, vol. 59, no. 9, pp. 3318–3329, 2016.
[35] H. Li, N. Qiu, Z. Jin, and Z. He, “Geothermal history of TarimBasin,” Oil & Gas Geology, vol. 26, no. 5, pp. 613–617, 2005.
15Geofluids

Hindawiwww.hindawi.com Volume 2018
Journal of
ChemistryArchaeaHindawiwww.hindawi.com Volume 2018
Marine BiologyJournal of
Hindawiwww.hindawi.com Volume 2018
BiodiversityInternational Journal of
Hindawiwww.hindawi.com Volume 2018
EcologyInternational Journal of
Hindawiwww.hindawi.com Volume 2018
Hindawiwww.hindawi.com
Applied &EnvironmentalSoil Science
Volume 2018
Forestry ResearchInternational Journal of
Hindawiwww.hindawi.com Volume 2018
Hindawiwww.hindawi.com Volume 2018
International Journal of
Geophysics
Environmental and Public Health
Journal of
Hindawiwww.hindawi.com Volume 2018
Hindawiwww.hindawi.com Volume 2018
International Journal of
Microbiology
Hindawiwww.hindawi.com Volume 2018
Public Health Advances in
AgricultureAdvances in
Hindawiwww.hindawi.com Volume 2018
Agronomy
Hindawiwww.hindawi.com Volume 2018
International Journal of
Hindawiwww.hindawi.com Volume 2018
MeteorologyAdvances in
Hindawi Publishing Corporation http://www.hindawi.com Volume 2013Hindawiwww.hindawi.com
The Scientific World Journal
Volume 2018Hindawiwww.hindawi.com Volume 2018
ChemistryAdvances in
Scienti�caHindawiwww.hindawi.com Volume 2018
Hindawiwww.hindawi.com Volume 2018
Geological ResearchJournal of
Analytical ChemistryInternational Journal of
Hindawiwww.hindawi.com Volume 2018
Submit your manuscripts atwww.hindawi.com