Embed Size (px)
Citation preview
Hindawi Publishing CorporationEconomics Research InternationalVolume 2012, Article ID 691302, 11 pagesdoi:10.1155/2012/691302
Research Article
Unilateral Trade Preferences in the EU: An Empirical Assessmentfor the Case of Mozambican Exports
Xavier Cirera1 and Andrea Alfieri2
1 Institute of Development Studies, University of Sussex, Brighton BN1 9RE, UK2 Independent Consultant, Via Passo Bocco 1, Parma, Italy
Correspondence should be addressed to Xavier Cirera, [email protected]
Received 4 August 2011; Revised 21 September 2011; Accepted 13 October 2011
Academic Editor: Priya Ranjan
Copyright © 2012 X. Cirera and A. Alfieri. This is an open access article distributed under the Creative Commons AttributionLicense, which permits unrestricted use, distribution, and reproduction in any medium, provided the original work is properlycited.
Unilateral trade preferences are one of the most important instruments offered by developed countries to foster developing countryexports. This paper analyzes the impact of unilateral trade preferences on developing countries by focusing on the experience ofMozambique. In this paper, we analyze whether unilateral preferences offered by the EU are “valuable” for Mozambican exportersbased on the impact on preferential margins, utilization rates, and export prices. We use a detailed dataset with cif unit values atHS8-digits level covering the period 2000–2007. Our findings indicate that (i) for a large number of product lines, export marginsare zero; (ii) utilization rates are generally high; however, (iii) this does not translate into a positive price margins captured byMozambican exporters compared to MFN competitors. These findings cast doubts on the “value” of preferences and their potentialimpact on developing country exports.
1. Introduction
Unilateral export preferences are an important trade policytool for less developed countries (LDCs). Successive roundsof trade liberalization in developed countries under WTOagreements and the increasing number of preferential tradeagreements (PTAs) have reduced the preferential margin thatunilateral trade preferences provided. This so-called “erosionof preferences” has created concern among LDCs regardingthe potential impact on their exports. However, the potentialimpact of “preference erosion” on LDCs depends on whetherunilateral preferences are valuable.
This paper explores this issue using Mozambican exportsto the EU as a case study. We focus on three main ele-ments that may make unilateral preferences “valuable”: (i)whether unilateral preferences have been used; (ii) whetherpreferences provide a significant tariff margin; (iii) the degreeof appropriation of the price margin theoretically induced bythe preference margin.
The paper is organized as follows. The following sectiongives a brief introduction to the economic rationale of exportpreferences and their expected impact. Section 3 analyzespreference utilization and price margins in Mozambican
exports to the EU market. In Section 4, we employ econo-metric analysis in order to analyze in more detail the degreeof passthrough from tariffs to price margins. The last sectiondraws some conclusions.
2. Unilateral Export Preferences2.1. Historical Background. Unilateral trade preferences aretariff concessions given by developed to developing countriesthat do not require reciprocity from beneficiary countries.There are several elements that justify the rationale of thosepreferences (see Hoekman and Ozden [1] for a compre-hensive survey). The main rationale is based on the notionof special and differential treatment (SDT) for developingcountries (DCs) in multilateral trade agreements. The SDTprinciple draws upon the idea, widely influential in the 1950sand 1960s, that DCs needed to protect their markets in orderto support infant industry and develop export manufactur-ing sectors.1
Existing unilateral export preferences were rationalizedunder United Nations Conference on Trade and Develop-ment (UNCTAD) in 1968 with the introduction of the Gen-eralized System of Preferences (GSP), and GATT articles
2 Economics Research International
were amended in order to allow for discrimination. Sincethen, several other schemes have proliferated. The EU, forinstance, granted unilateral preferences to former Africa,Caribbean, and Pacific colonies (ACP) in 1975 (the so-calledLome Conventions) rationalized in 2000 under the CotonouAgreement. The US targeted specific groups of commoditiesand countries with acts such as the Caribbean Basin Initiative(CBI). In addition, the last decade has also seen proliferationand expansion of the GSP, with the GSP-plus and the Every-thing but Arms (EBA) initiative granted by the EU to leastdeveloped countries (LDCs), or the African Growth Oppor-tunity Act (AGOA) granted by the US to African countries.
Product coverage differs substantially, going from thenearly full coverage granted by EBA to roughly 6400 tarifflines in AGOA. Country coverage also varies, creating insome cases discrimination between DCs and LDCs. Thishas been the subject of some controversy. Commodity-specific provisions of the Cotonou Agreement, for instance,have been repeatedly challenged in the WTO (excludingbanana and sugar). As a result, EU and ACP countries havebeen negotiating for a decade replacing Cotonou unilateralpreferences by reciprocal free trade agreements (FTAs), theeconomic partnership agreements (EPAs). Other differencesinclude rules on trade defense measures and, particularly,nontariff barriers such as rules of origin.
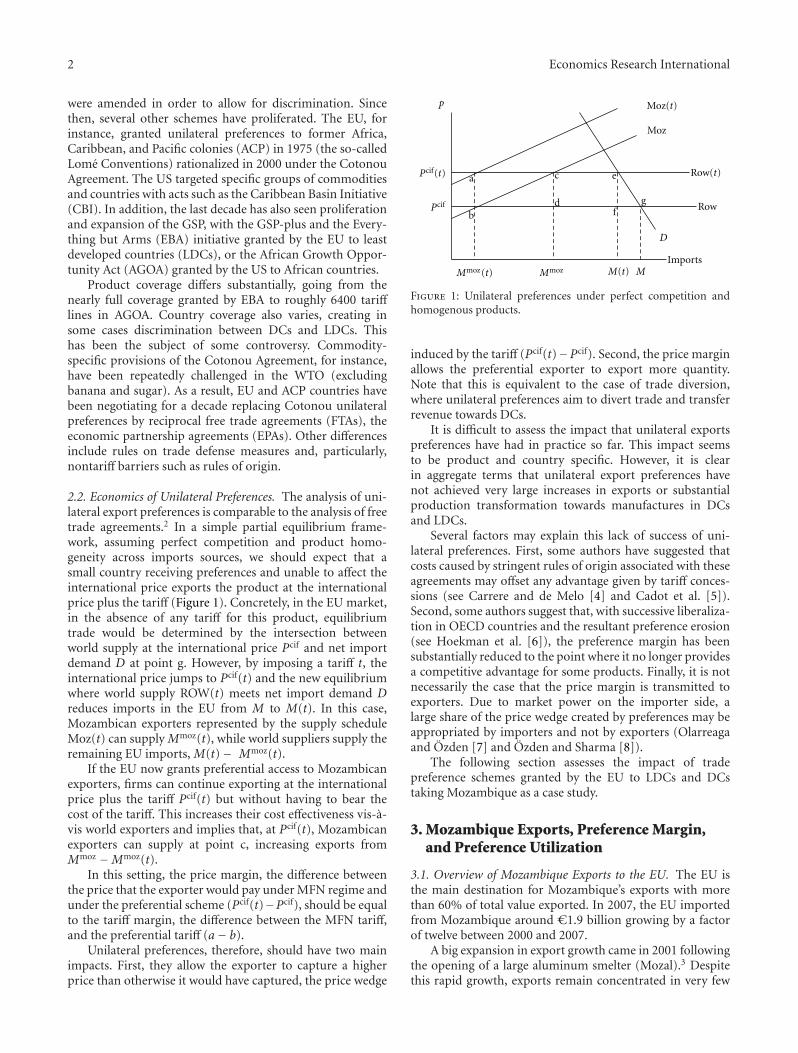
2.2. Economics of Unilateral Preferences. The analysis of uni-lateral export preferences is comparable to the analysis of freetrade agreements.2 In a simple partial equilibrium frame-work, assuming perfect competition and product homo-geneity across imports sources, we should expect that asmall country receiving preferences and unable to affect theinternational price exports the product at the internationalprice plus the tariff (Figure 1). Concretely, in the EU market,in the absence of any tariff for this product, equilibriumtrade would be determined by the intersection betweenworld supply at the international price Pcif and net importdemand D at point g. However, by imposing a tariff t, theinternational price jumps to Pcif(t) and the new equilibriumwhere world supply ROW(t) meets net import demand Dreduces imports in the EU from M to M(t). In this case,Mozambican exporters represented by the supply scheduleMoz(t) can supply Mmoz(t), while world suppliers supply theremaining EU imports, M(t)− Mmoz(t).
If the EU now grants preferential access to Mozambicanexporters, firms can continue exporting at the internationalprice plus the tariff Pcif(t) but without having to bear thecost of the tariff. This increases their cost effectiveness vis-a-vis world exporters and implies that, at Pcif(t), Mozambicanexporters can supply at point c, increasing exports fromMmoz −Mmoz(t).
In this setting, the price margin, the difference betweenthe price that the exporter would pay under MFN regime andunder the preferential scheme (Pcif(t)−Pcif), should be equalto the tariff margin, the difference between the MFN tariff,and the preferential tariff (a− b).
Unilateral preferences, therefore, should have two mainimpacts. First, they allow the exporter to capture a higherprice than otherwise it would have captured, the price wedge
p
ImportsM(t)
D
Mmoz(t)
Row
a
b
e
f
Pcif(t)
Moz
Pcif
c
d g
MMmoz
Row(t)
Moz(t)
Figure 1: Unilateral preferences under perfect competition andhomogenous products.
induced by the tariff (Pcif(t)−Pcif). Second, the price marginallows the preferential exporter to export more quantity.Note that this is equivalent to the case of trade diversion,where unilateral preferences aim to divert trade and transferrevenue towards DCs.
It is difficult to assess the impact that unilateral exportspreferences have had in practice so far. This impact seemsto be product and country specific. However, it is clearin aggregate terms that unilateral export preferences havenot achieved very large increases in exports or substantialproduction transformation towards manufactures in DCsand LDCs.
Several factors may explain this lack of success of uni-lateral preferences. First, some authors have suggested thatcosts caused by stringent rules of origin associated with theseagreements may offset any advantage given by tariff conces-sions (see Carrere and de Melo [4] and Cadot et al. [5]).Second, some authors suggest that, with successive liberaliza-tion in OECD countries and the resultant preference erosion(see Hoekman et al. [6]), the preference margin has beensubstantially reduced to the point where it no longer providesa competitive advantage for some products. Finally, it is notnecessarily the case that the price margin is transmitted toexporters. Due to market power on the importer side, alarge share of the price wedge created by preferences may beappropriated by importers and not by exporters (Olarreagaand Ozden [7] and Ozden and Sharma [8]).
The following section assesses the impact of tradepreference schemes granted by the EU to LDCs and DCstaking Mozambique as a case study.
3. Mozambique Exports, Preference Margin,and Preference Utilization
3.1. Overview of Mozambique Exports to the EU. The EU isthe main destination for Mozambique’s exports with morethan 60% of total value exported. In 2007, the EU importedfrom Mozambique around C1.9 billion growing by a factorof twelve between 2000 and 2007.
A big expansion in export growth came in 2001 followingthe opening of a large aluminum smelter (Mozal).3 Despitethis rapid growth, exports remain concentrated in very few
Economics Research International 3
Table 1: Main Mozambican export to the EU 2000/2007 by HS2 chapter.
HS 2 chapter Product Value (millions EUR) % share
76 Aluminum and articles thereof 11,437,495.00 77.79%
3 Fish and crustaceans 1,508,769.60 10.26%
24 Tobacco and manufactured tobacco substitutes 936,790.14 6.37%
25Salt; sulphur; earths and stone; plastering material,lime, and cement
267,836.09 1.82%
17 Sugars and sugar confectionery 228,689.40 1.56%
52 Cotton 115,070.22 0.78%
8 Edible fruit and nuts; peel of citrus fruits or melons 82,720.88 0.56%
44 Wood and articles of wood; wood charcoal 52,284.92 0.36%
27Mineral fuels, mineral oils, and products of theirdistillation; bituminous substances; mineral waxes
20,881.43 0.14%
9 Coffee and tea 16,185.38 0.11%
41 Raw hides and skin leathers 11,103.54 0.08%
12Oil seeds and oleaginous fruits; miscellaneous grains,seeds, and fruit; industrial or medical plants; straw andfodder
10,030.34 0.07%
56Wadding, felt, and nonwovens; special yarns; twine,cordage, rope and cable, and articles thereof
6,583.09 0.04%
61Articles of apparel and clothing accessories, knitted, orcrocheted
3,599.13 0.02%
64 Footwear 1,275.65 0.01%
Source: authors’ calculations based on EUROSTAT.
products. Table 1 reports the value of main exports (HS2)between 2000 and 2007.4 In this period, a mere five chaptersamounted to around 98% of the total value exported to theEU. Unwrought aluminum alone represented 77% of totalexports, followed by fish and crustaceans and tobacco prod-ucts with, respectively, 10.3% and 6.37%. If we exclude occa-sional exports5 from the analysis, we can identify 55 productsat HS 8-digits as main exports over the period 2000–2007.
At first glance, what emerges from the data is the low levelof processing of Mozambican exports, clustered around pri-mary agriculture products, low-processed fishery products,and mineral resources. Cotton is only ginned in Mozam-bique, while tobacco and wood products are exported mainlynot manufactured.
Mozambique enjoyed preferential market access for ex-ports to the EU through different schemes: the CotonouAgreement, replaced in 2008 by the EPAs and the EBA ini-tiative. Coverage, tariff margins and compliance procedures6
vary between the schemes. For instance, the former offersreduced tariffs, while the latter offers duty-free access for al-most all products covered.
3.2. Preference Margins for Mozambican Exports. The maindata source for the analysis is the EUROSTAT COMEXTdatabase. It includes information on volume, quantities,country of origin, and whether exports were eligible and usedpreferences. It is important to point out that by preferenceuse we understand whether preferences were requested, sincethe database does not provide information on whetherpreferential regime was rejected at EU arrival.7 As the pro-duct price, we use the unit value obtained by dividing the
value of exports with the correspondent number of tons oritems. All unit values are expressed as Euro (C) cif valuesper ton. Working with unit values is a challenging exercise,since errors can be made inputting either values, quantities,or both, and, therefore, distorting unit values. As a result, wefirst filter the data using Hadi’s [10] methodology, in orderto eliminate outliers.8
Any Mozambican export is eligible for duty-free accessunder the EBA initiative.9 This has two implications: (i) thepreference margin potentially available for Mozambique isbasically the full MFN tariff since the preferential tariff iszero, and (ii) any access through the MFN regime wouldautomatically signal nonuse of preferences (see next sectionfor an assessment of utilization rates in Mozambique).
In terms of MFN tariffs, more than 42% of the tariff linesanalyzed had MFN duty-free access.10 For these products(mainly cotton, tea, paprika, copra, and wood products), anypreferential access is, therefore, irrelevant, although in termsof value these products represent only a mere 5.4% of totalexports. Aluminum, which is almost 80% of total exportvalue, faces a MFN tariff greater than zero (6%).
We define the preference margin as the differencebetween the MFN tariff and the tariff actually applied ongood i exported by Mozambique at time t:
Margin prefi,t = MFNi,t − Tariffi,t . (1)
If the MFN tariff is equal to the tariff applied or it iszero, then it means that there is no positive preference marginand Margin pref will take the value zero. On the other hand,if the MFN tariff is greater than the applied tariff, thenthere is potential use of preference, and Margin pref will be
4 Economics Research International
Table 2: Average preference margins (Mozambique).
Average preference margin (all tariff lines) Average preference margin (tariff lines with MFN > 0 only)
Year Average Max Year Average
2000 5.13% 15.00% 2000 8.51%
2001 6.39% 63.05% 2001 9.94%
2002 7.34% 82.80% 2002 12.45%
2003 6.72% 82.31% 2003 10.55%
2004 5.67% 80.91% 2004 9.85%
2005 5.92% 86.37% 2005 10.79%
2006 6.49% 69.68% 2006 12.94%
2007 7.12% 69.68% 2007 13.33%
Source: authors’ calculations based on TARIC and EUROSTAT.Note by the authors: the substantial change in the max preference margin is due to the specific duties applied to sugar.
positive. Theoretically, due to EBA, any export should enterthe EU duty free (MFN equals preference margin). However,since some Mozambican exports entered using Cotonou’spreferences, in some cases, we expect tariff margins lowerthan MFN. Alfieri and Cirera [11] show that in practice asignificant share of exports (49%) does not benefit fromany margin of preference. For a large share of observations(42.3%), this is explained by the fact that MFN is alreadyzero, while for the remaining cases it is due to nonuse ofpreferences (6.7%).
On average, the preference margin enjoyed by Mozam-bican exports is between 5% and 7% (See Table 2). MFNand preferential tariffs have been slightly modified duringthe period,11 and part of the variation is also explained byfew tariff lines facing seasonal or specific duties (agriculturalproducts). Excluding the tariff lines already liberalized atMFN level, the average preference margin is between 8.5%and 13.3%.
3.3. Price Margins for Mozambican Exports. As discussed inSection 2.2, we should expect (i) Mozambican exporters toget a higher price compared to MFN exporters of the samegood in the same period; (ii) the difference in prices beingequal to the preference margin.
The main challenge when analyzing price margins is thelack of counterfactual. This implies that we do not observethe MFN price for most periods since most exports usepreferential schemes. Interestingly, in our sample, we findcases of Mozambican firms exporting the same good throughthe MFN regime and also via preferential schemes, in thesame year or the same month. These are cases where bothutilization and nonutilization of preferences occur in thesame period. As a result, we use nonutilization prices as oneof the main reference prices to further reduce the potentialquality bias and compare the results using alternative ref-erence MFN prices.12 We define PcifMFN1 to PcifMFN4 asfollows:13
(i) PcifMFN1—the unit value paid to Mozambican ex-porters when they do not use preferences. This ref-erence price eliminates potential quality biases, sinceit is the same product exported also under preferen-tial use;
(ii) PcifMFN2—the minimum unit value paid to MFNexporters in the same month;
(iii) PcifMFN3—the average cif unit value paid to MFNexporters in the same month;
(iv) PcifMFN4—the cif unit value paid to the largest MFNexporter in the same month. We then construct priceratios as unit values recorded under preference overreference MFN unit values:
Margin pricek = log
(PcifMozambiquei,t
PcifMFNk
), (2)
where PcifMozambiquei,t is the cif unit value paid to theexport of good i in month t and the denominator is alter-natively one of the four reference prices described above.
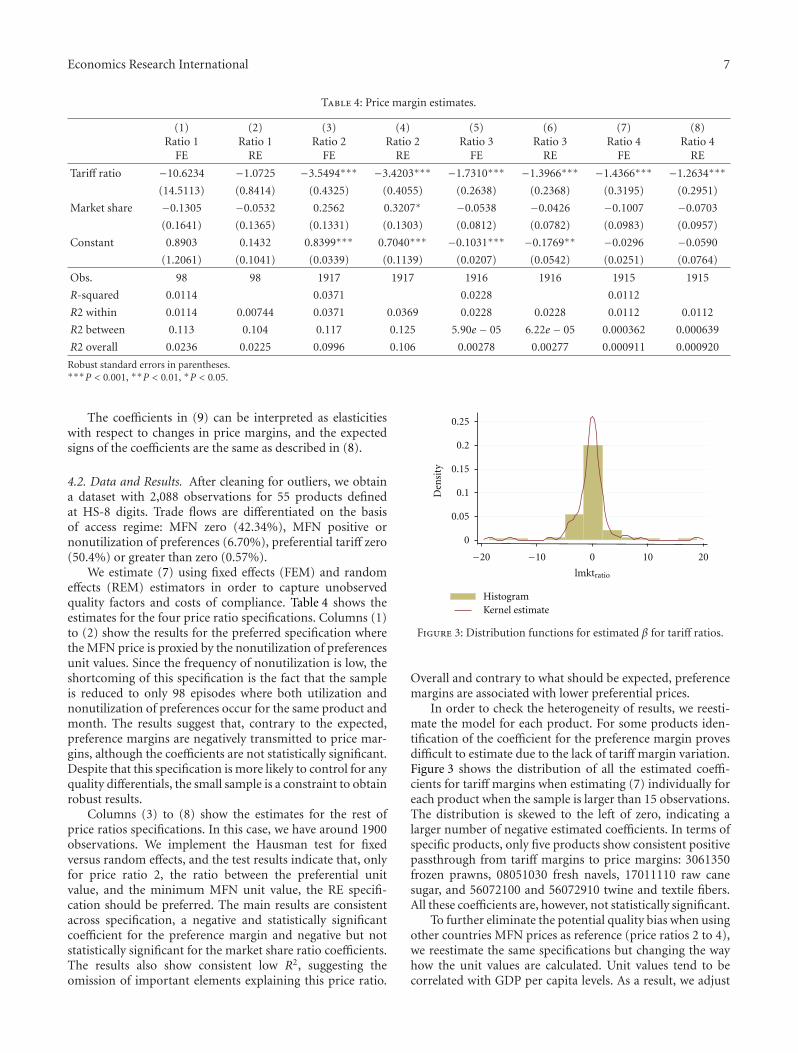
Figure 4 shows the probability distribution functions ofMargin price1 to Margin price4. For a large number of ob-servations the price paid to Mozambican exporters is actuallylower than the MFN reference prices used. Using PcifMFN1,we have a positive price margin only for 53% of the obser-vations, for PcifMFN3, 34% of observations have a positivemargin, and, for PcifMFN4, around 44% of observations arepositive. However, for PcifMFN2, this figure raises up to 85%.As expected, price margin ratios 3 and 4 tend to have lowerpreferential unit values, since we are comparing them withaverage and larger exporter unit value, likely to be a richercountry that produces higher quality goods. While ratio 2tends to be positive since we use the minimum unit value asreference. This implies a potential quality bias when usingthese ratios. The most interesting result is, however, whencomparing underprice margin ratio 1, unit values under uti-lization and nonutilization of preferences in the same periodand product, for controlling for quality differentials. In thiscase, the probability of a larger preferential price is only of53%.
At the product level, we find that only five productsalways report price ratios above one, consistent with a posi-tive tariff margin.14 At first glance, it seems that Mozambicanexporters are not always capturing a higher price than MFNcompetitors even in the presence of positive preferencemargins.
Economics Research International 5
It is important to point out that when using price margin1, the results may be biased due the reasons behind pref-erence nonutilization. Preferential exports need additionaldocumentation (i.e., certificate of origin to be provided bypublic authorities). If there is a delay in obtaining such doc-uments, the exporter may choose to export via MFN in orderto honor the export contract, especially when delays maytrigger penalties or in case of perishable goods.15 Thus, in thepresence of rigid contract prices, exporters may be unable topass MFN duties now being paid into the cif price.
3.4. Preference Utilization. A final element that needs to beassessed when analyzing the “value” of preferences is the deg-ree of preference utilization by Mozambican exporters.16 Awidespread critique made to preferential schemes is thatoften the products covered are the ones scarcely exported bythe beneficiaries.17 In the case of Mozambique, this critiquecould be applied to the Cotonou Agreement, where only afew agricultural products offer preferential access, but notfor the EBA initiative, since the few excluded products frompreferential access (i.e., rice, banana) are not being exportedand sugar is exported at very favorable price (and withincreasing quotas).
For those lines with MFN greater than zero, Mozambiqueshows a high utilization rate, on average across products andyears equal to 93% of the value of eligible exports. Manchin[14] finds an average utilization rate of Cotonou for non-LDCs in the range of 50% in 2000 and a much lower forGSP (6%). In the same year, Mold [15] finds an averageutilization rate for GSP of 41% for African LDCs. However,both examine only one scheme and do not take into accountcompeting schemes as we do. In a broader evaluation of EUpreferential schemes, OECD [16] finds that utilization ratesare much higher than commonly thought when competingschemes are taken into account. This is confirmed by ourfindings for the case of Mozambique.
There are two main potential explanations for lack ofpreference utilization. The first explanation is related to thecosts of compliance attached to preferential schemes andinduced by rules of origin (Cadot et al., [5]). Carrere andde Melo [4] estimate (nonparametrically) such costs forEU preferential schemes and FTAs (PANEURO) between4.7% and 8.2% of the cif export price. Manchin [14] ob-tains a similar estimate (4.5%) for a preference thresholdbelow which traders do not have the incentive to requestpreferences. Under this argument, preferences are only usedif the expected price gain exceeds the costs of compliance.However, as shown in Section 3.3, such a link seems weak inthe case of Mozambique.
The second explanation for nonutilization is related tothe delays by public authorities in delivering documentationfor preferential export. Considering this explanation, weshould observe unexpected jumps in preference utilizationuncorrelated with price or tariff margins (random events dueto random delays).
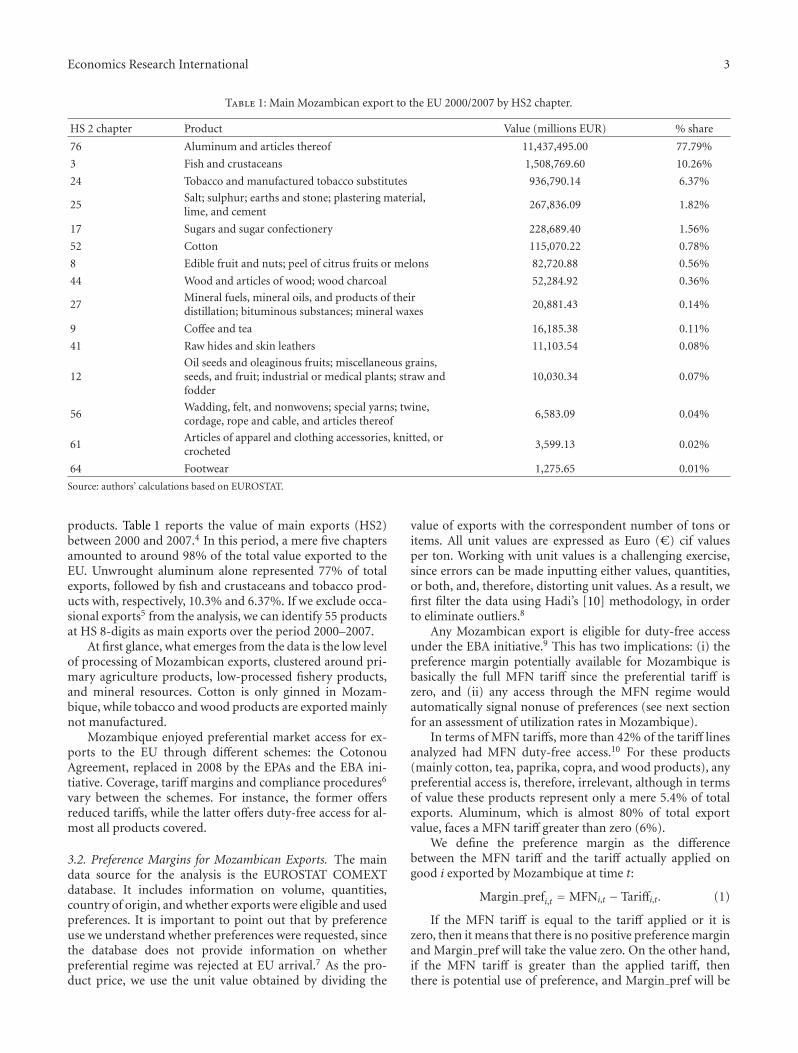
In Figure 2, we plot the utilization rates against the(yearly average) MFN tariff. There is no indication of a sub-stantial drop in utilization rates when the MFN tariff is belowa certain threshold. Even at the product level, the products
Rat
iou
ti
0
0.2
0.4
0.6
0.8
1
0 0.2 0.4 0.6 0.8
(Mean) MFN
Figure 2: Utilization rates and MFN tariff (Mozambique). Source:authors’ calculations.
showing the highest nonutilization rates do not necessarilydisplay the lowest MFN tariffs (See Table 3).
The existing narrow export base in Mozambique impliesthat each product is probably exported by one or twofirms. At the same time, preference margins have been quitestable over time. If the cost of compliance would impactsignificantly the choice of trade regime, we would expectlower utilization for products facing low MFN tariffs. Incontrast, in our data, we observe high utilization rates acrossproducts and few isolated drops in utilization rates. There-fore, unforeseen administrative problems may be a muchmore likely explanation for the discontinuous utilizationrates in Mozambique, and any estimates of average costs ofcompliance would ignore the fact that we observe utilizationof preferences at very low preferential margins.
So far, we have performed an analysis based on simplecorrelations. However, it is possible that this analysis is notable to isolate the quality bias when comparing products.In addition, we cannot exclude that other factors otherthan tariff differentials may impact on price margins. Forthese reasons, we now proceed to test econometrically therelationship between prices and preference margins.
4. Econometric Estimations
4.1. Analytical Framework. The starting point is to assumethat the price of the same good in the same period in the EUmarket is the same for imports under the MFN and underthe preferential scheme. Since most of the products in thesample are primary commodities, it is therefore plausible toassume that these are homogenous products. However, inorder to allow for some quality differences that may arisewhen using alternative reference MFN prices, we allow fora quality adjustment δi (3). We assume that the qualitydifferential is product specific and constant over time andthat it is zero when using the same country reference MFNprice. This is represented in (3), where the price of good ifrom country j in year t not eligible for preferences, andtherefore entering via MFN, PMFN
i jt , is equal to the price of
good i from country k in year t eligible for preferences, Pprefikt ,
plus the quality adjustment term (1 + δi).
6 Economics Research International
Table 3: Products showing highest nonutilization rates.
HS8 Product Nonutilization rates Average MFN tariff
17031000 Cane molasses 47.37% 3.49%
08051030 Fresh navels 28.63% 17.11%
61091000 T-shirts, knitted or crocheted 26.34% 12.00%
56072100 Binder twine of sisal 24.70% 12.00%
08054000 Fresh or dried grapefruit 23.31% 2.25%
Source: authors’ calculations.
The price paid for good i by the exporter from country junder the MFN regime, PMFN
i jt , is the cif unit value Pcifi jt times
the MFN tariff ( 1+τi jt) and a variable that reflects its marketpower (1 + mijt) (4). On the other hand, the preferential
price, Pprefikt , is defined by the cif unit value, Pcif
ikt , times thepreferential tariff (1 + τpref), a margin that represents themarket power of the exporter relative to the importer (1 +mikt), which is proxied by its relative market share, and thecompliance cost18 associated to the scheme, also assumedproduct specific and constant over time (1 + ci) (5).
Substituting (4) and (5) into (3), we obtain (6), andtaking logs and adding an error term, we obtain (7). Equation(7) implies that the ratio of prices (preferential over MFN)should be explained by the tariff margin ratio, the relativemarket power between exporters relative to importers, theinverse of the cost of compliance, and the product specificquality adjustment:
PMFNi jt = (1 + δi)P
prefikt , (3)
PMFNi jt = Pcif
i jt
(1 + τi jt
) (1 + mijt
), (4)
Pprefikt = Pcif
ikt
(1 + τ
prefikt
)(1 + mikt)(1 + ci), (5)
Pcifikt
Pcifi jt
=(
1 + τi jt) (
1 + mijt
)(
1 + τpre fikt
)(1 + mikt)(1 + ci)(1 + δi)
, (6)
ln
⎛⎝ Pcif
ikt
Pcifi jt
⎞⎠ = α + β ln
⎛⎝ 1 + τi jt
1 + τpre fikt
⎞⎠ + δ ln
(1 + mijt
1 + mikt
)
+ γ ln(
1(1 + ci)(1 + δi)
)+ εikt,
(7)
ln
⎛⎝ Pcif
ikt
Pcifi jt
⎞⎠ = α + β ln
⎛⎝ 1 + τi jt
1 + τpre fikt
⎞⎠
+ δ ln(1 + mijt
1 + mikt
)+ φi + εikt.
(8)
We expect to find a positive sign for β, since an increase inthe tariff margin would imply a higher price for the exporterusing preferences. We expect to find a negative sign for δ,since a higher market power of MFN exporters compared tothose exporting preferentially would imply less bargainingpower. Because compliance costs and quality differentialsare unobservable, the assumption that these elements are
constant over time allows us to treat them as product fixedeffects φ. A priori we should not expect any significantchanges of these two elements over the sample period.
Equation (5) is, therefore, estimated using a monthlypanel of 55 products exported from Mozambique from2000 to 2007, which represents more than 99% value ofMozambican exports to the EU. As a dependent variable,we alternatively use the price ratios defined in Section 3.3.Our preferred specification is price ratio 1, which comparesutilization and nonutilization unit values when they occurin the same period and, therefore, minimizes any qualitydifferential bias (δi = 0), since we are comparing exportersfrom the same product and year. This, however, reduces thesample to 98 observations. As a result, we also compare theresults with the estimates using the other three alternativereference prices, which provide some sensitivity analysis.
As tariff ratio, we use MFN and preferential tariffs facedby country j exporting product i in month t. As proxyfor relative margins, we take the ratio between the averagemarket share of countries exporting product i through MFNduring the year t and the market share of a country jexporting product i in year t.19 Finally, regarding the unob-served quality differences and costs of compliance, we treatthem as product fixed effects. The fact that the coefficientsare absorbed by product dummies implies that we cannotidentify both variables. However, our main interest is thepassthrough coefficient from preference margins to prices.In addition, as discussed above, although some authorshave used average estimates of compliance costs based inparametric or nonparametric estimates (see Carrere and deMelo, [4]), we find large utilization occurring at very lowpreferential margins (i.e., 3%) or high nonutilization ratesoccurring at high preferential margins (i.e., 11.20%). For thisreason, we believe that compliance costs are better modeledas product specific dummies.
Since it is possible that product-fixed effects may not fullycontrol for such quality differences, we introduce a furthercontrol and estimate (8) in first differences (yearly) usingOLS as in (9) below. The assumption here is that if the qualitydifferences are time invariant, they will be wiped out in thedifferences model:
Δ ln
⎛⎝ Pcif
ikt
Pcifi jt
⎞⎠t;t−1
= βΔ ln
⎛⎝ 1 + τi jt
1 + τprefikt + c
⎞⎠t;t−1
+ δΔ ln(1 + mijt
1 + mikt
)t;t−1
+ εikt.
(9)
Economics Research International 7
Table 4: Price margin estimates.
(1)Ratio 1
FE
(2)Ratio 1
RE
(3)Ratio 2
FE
(4)Ratio 2
RE
(5)Ratio 3
FE
(6)Ratio 3
RE
(7)Ratio 4
FE
(8)Ratio 4
RE
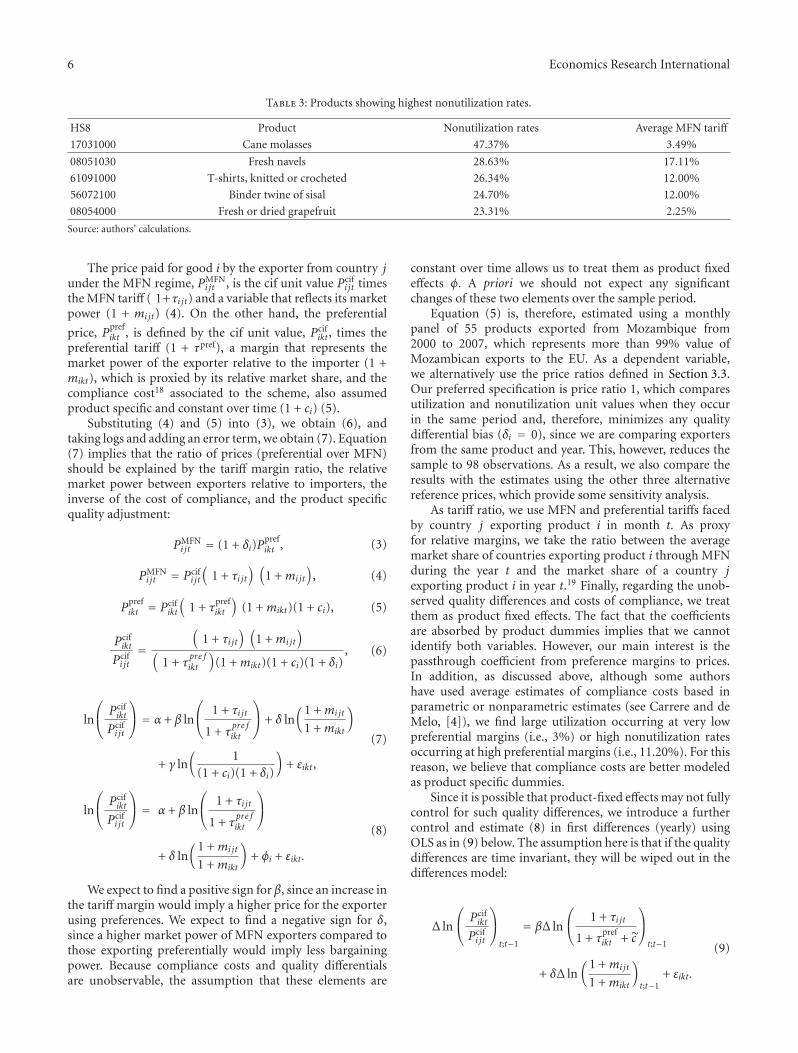
Tariff ratio −10.6234 −1.0725 −3.5494∗∗∗ −3.4203∗∗∗ −1.7310∗∗∗ −1.3966∗∗∗ −1.4366∗∗∗ −1.2634∗∗∗
(14.5113) (0.8414) (0.4325) (0.4055) (0.2638) (0.2368) (0.3195) (0.2951)
Market share −0.1305 −0.0532 0.2562 0.3207∗ −0.0538 −0.0426 −0.1007 −0.0703
(0.1641) (0.1365) (0.1331) (0.1303) (0.0812) (0.0782) (0.0983) (0.0957)
Constant 0.8903 0.1432 0.8399∗∗∗ 0.7040∗∗∗ −0.1031∗∗∗ −0.1769∗∗ −0.0296 −0.0590
(1.2061) (0.1041) (0.0339) (0.1139) (0.0207) (0.0542) (0.0251) (0.0764)
Obs. 98 98 1917 1917 1916 1916 1915 1915
R-squared 0.0114 0.0371 0.0228 0.0112
R2 within 0.0114 0.00744 0.0371 0.0369 0.0228 0.0228 0.0112 0.0112
R2 between 0.113 0.104 0.117 0.125 5.90e − 05 6.22e − 05 0.000362 0.000639
R2 overall 0.0236 0.0225 0.0996 0.106 0.00278 0.00277 0.000911 0.000920
Robust standard errors in parentheses.∗∗∗P < 0.001, ∗∗P < 0.01, ∗P < 0.05.
The coefficients in (9) can be interpreted as elasticitieswith respect to changes in price margins, and the expectedsigns of the coefficients are the same as described in (8).
4.2. Data and Results. After cleaning for outliers, we obtaina dataset with 2,088 observations for 55 products definedat HS-8 digits. Trade flows are differentiated on the basisof access regime: MFN zero (42.34%), MFN positive ornonutilization of preferences (6.70%), preferential tariff zero(50.4%) or greater than zero (0.57%).
We estimate (7) using fixed effects (FEM) and randomeffects (REM) estimators in order to capture unobservedquality factors and costs of compliance. Table 4 shows theestimates for the four price ratio specifications. Columns (1)to (2) show the results for the preferred specification wherethe MFN price is proxied by the nonutilization of preferencesunit values. Since the frequency of nonutilization is low, theshortcoming of this specification is the fact that the sampleis reduced to only 98 episodes where both utilization andnonutilization of preferences occur for the same product andmonth. The results suggest that, contrary to the expected,preference margins are negatively transmitted to price mar-gins, although the coefficients are not statistically significant.Despite that this specification is more likely to control for anyquality differentials, the small sample is a constraint to obtainrobust results.
Columns (3) to (8) show the estimates for the rest ofprice ratios specifications. In this case, we have around 1900observations. We implement the Hausman test for fixedversus random effects, and the test results indicate that, onlyfor price ratio 2, the ratio between the preferential unitvalue, and the minimum MFN unit value, the RE specifi-cation should be preferred. The main results are consistentacross specification, a negative and statistically significantcoefficient for the preference margin and negative but notstatistically significant for the market share ratio coefficients.The results also show consistent low R2, suggesting theomission of important elements explaining this price ratio.
0
0.05
0.1
0.15
0.2
0.25
Den
sity
−20 −10 0 10 20
HistogramKernel estimate
lmktratio
Figure 3: Distribution functions for estimated β for tariff ratios.
Overall and contrary to what should be expected, preferencemargins are associated with lower preferential prices.
In order to check the heterogeneity of results, we reesti-mate the model for each product. For some products iden-tification of the coefficient for the preference margin provesdifficult to estimate due to the lack of tariff margin variation.Figure 3 shows the distribution of all the estimated coeffi-cients for tariff margins when estimating (7) individually foreach product when the sample is larger than 15 observations.The distribution is skewed to the left of zero, indicating alarger number of negative estimated coefficients. In terms ofspecific products, only five products show consistent positivepassthrough from tariff margins to price margins: 3061350frozen prawns, 08051030 fresh navels, 17011110 raw canesugar, and 56072100 and 56072910 twine and textile fibers.All these coefficients are, however, not statistically significant.
To further eliminate the potential quality bias when usingother countries MFN prices as reference (price ratios 2 to 4),we reestimate the same specifications but changing the wayhow the unit values are calculated. Unit values tend to becorrelated with GDP per capita levels. As a result, we adjust
8 Economics Research International
Table 5: Price margin estimates-GDP per capita adjusted.
(1)Ratio 2
FE
(2)Ratio 2
RE
(3)Ratio 3
FE
(4)Ratio 3
RE
(5)Ratio 4
FE
(6)Ratio 4
RE
Tariff ratio −0.0757 −0.0539 −0.1341∗∗ −0.1205∗∗∗ 0.0287∗ 0.0348∗∗
(0.0482) (0.0353) (0.0431) (0.0353) (0.0137) (0.0112)
Market share 0.0274 0.0359∗ 0.0214 0.0359∗ 0.0009 −0.0029
(0.0209) (0.0172) (0.0187) (0.0166) (0.0059) (0.0053)
Constant −0.0166∗∗∗ −0.0195∗∗ −0.0788∗∗∗ −0.0791∗∗∗ −0.0407∗∗∗ −0.0413∗∗∗
(0.0042) (0.0063) (0.0038) (0.0070) (0.0012) (0.0022)
Observations 352 352 351 351 352 352
R-squared 0.0133 0.0349 0.0148
R2 within 0.0133 0.0120 0.0349 0.0326 0.0148 0.0138
R2 between 0.0549 0.0721 0.0920 0.118 0.103 0.125
R2 overall 0.0335 0.0419 0.0872 0.112 0.0729 0.0797
Robust standard errors in parentheses.∗∗∗P < 0.001, ∗∗P < 0.01, ∗P < 0.05.
Table 6: Price margin estimates-model in differences.
Variables(1)
Ratio 2OLS
(2)Ratio 2
FE
(3)Ratio 2
RE
(4)Ratio 3
OLS
(5)Ratio 3
FE
(6)Ratio 3
RE
(7)Ratio 4
OLS
(8)Ratio 4
FE
(9)Ratio 4
RE
L. traiff ratio −1.8364∗ 0.0982 −1.2985 0.5135 0.1403 0.5270 0.1211 0.2224 0.2347
(0.8842) (2.0520) (1.0787) (0.5255) (1.3303) (0.5460) (0.6598) (1.4369) (0.6027)
L. marketshare
2.2838∗∗∗ 1.5857∗ 1.9810∗∗∗ 0.3694 0.9140∗ 0.6267∗ 0.6510∗ 0.6180 0.7496∗
(0.5181) (0.6754) (0.5139) (0.2347) (0.4379) (0.2816) (0.3154) (0.4730) (0.3094)
Constant 0.6345∗∗∗ 0.6415∗∗∗ 0.5535∗∗ −0.3863∗∗∗ −0.4528∗∗∗ −0.4514∗∗∗ −0.3130∗∗ −0.3132∗∗ −0.3525∗∗∗
(0.1780) (0.1590) (0.1716) (0.0929) (0.1031) (0.0859) (0.0979) (0.1113) (0.0948)
Observations 224 224 224 224 224 224 224 224 224
R-squared 0.1927 0.0311 0.0171 0.0248 0.0367 0.0100
R2 within 0.0311 0.0294 0.0248 0.0236 0.00997 0.00996
R2 between 0.198 0.226 0.0290 0.0385 0.0948 0.0946
R2 overall 0.169 0.192 0.0111 0.0159 0.0365 0.0366
Robust standard errors in parentheses.∗∗∗P < 0.001, ∗∗P < 0.01, ∗P < 0.05.
prices to income per capita by regressing yearly unit values onGDP per capita and use the estimated residuals as our proxyfor prices. With the new adjusted unit values, we recalculatethe reference prices and reproduce the estimations in Table 5for price ratios 2 to 4. The results show a much lowerpassthrough, negative for price ratios 2 and 3 and positivebut very small for ratio 4.
A final check for the robustness of the results is to esti-mate the model in differences (9). In order to do so, we com-pute the annual averages for the variables of interest andapply first differences. The main results for each price ratioare summarized in Table 6. We also add robust Hubert-White-Sandwich OLS estimates since by differentiating themodel we may control for product specific and time invariantquality and cost of compliance costs.
Due to the small sample, we omit from the estimationsprice ratio 1 specification. The results show a positive and
statistically significant coefficient for most of the marketshare ratio coefficients. This suggests that increases in marketshare tend to increase price margins. Regarding the maincoefficient of interest, the tariff margin, the results suggesta positive coefficient but not statistically significant. Again,there is no evidence that changes in tariff margins are trans-mitted to price ratio changes.
5. Conclusions
The question that we formulated at the beginning of thepaper is whether EU unilateral preferences are valuableaccording to use and price advantage for exporters. In thecase of Mozambique, a first element to be stressed is that thejoint coverage of both Cotonou and EBA reaches 100% ofthe products exported and the large majority of these exportsenter duty free under both schemes. On the other hand,
Economics Research International 9
0
1
2
3
−0.5 0 0.5 1Irat1
Den
sity
(a)
0
2.0
4.0
6.0
8.0
−4 −2 0 2 4 6Irat2
Den
sity
(b)
0
0.5
1
1.5
−8 −6 −4 −2
Irat3
Den
sity
0 2
(c)
HistogramKernel estimate
0
0.5
1
−10 −5 0 5
Irat4
Den
sity
(d)
Figure 4: (a) Distribution of Margin price1. (b) Distribution of Margin price2. (c) Distribution of Margin price3. (d) Distribution of Mar-gin price4. Source: authors’ calculations.
more than 42% of the tariff lines and 5.4% of value exportedby Mozambique does not benefit from any “preferential”advantage compared to world exporters (MFN zero). Thus,for these goods, Mozambican firms are able to compete withworld exporters without the advantage of preferences. On theremaining exports, Mozambique enjoys a significant de jurepreference margin, between 9% and 12% (on average).
The second element to be highlighted is the relativelyhigh and fairly stable preference utilization rate (92% onaverage). There are no drops of utilization in correspondenceof low tariff margins, suggesting that the negative effect ofcosts of compliance on utilization does not hold for Mozam-bican exporters. In addition, since exported products are pri-mary or with very low level of processing, rules of origin arenot impacting substantially on producers’ costs. Therefore,nonutilization episodes are likely to be the result of sporadicproblems in the certification process required by preferentialschemes.
A third and more important element is that when com-paring unit values, we do not find evidence of a positiveprice margin for preferential exporters compared to MFNcompetitors. On the contrary, most statistically significantcoefficients indicate a negative relationship between tariffmargins and price ratios, suggesting that preferential marginsare not passed into exporters’ prices. This result is robust todifferent controls for potential quality biases.
The findings of this paper have significant policy impli-cations. Unilateral preferences are one of the main instru-ments offered by the EU to foster export growth in devel-oping countries. The findings of the paper indicate, however,that the “value” given to these schemes and their potentialimpact is likely to be overstated. This is due to the fact thata significant number of products exported by developingcountries do not experience any positive preferential marginand, more importantly, the fact that exporters are unable to
capture the price margin associated to preferences. Consid-ering these findings and the increasing trend in preferenceerosion due to further liberalization in the EU market inthe future suggest the need to focus in other instruments tosupport developing countries exports.
A final element to consider is the fact that the poten-tial impact of export preferences goes beyond its limitedimpact on prices. It is possible that preferences may shapeimporters’ choice among potential suppliers, thus positivelycontributing to export volume growth in some preferencereceiving countries. This is an empirical question that wehave not analyzed in this paper but that is worth noting.The extension of the analysis to other countries and otherpreferential schemes may offer some more guidance andshould be considered for further research. In addition, moreempirical work is needed in order to determine qualitydifferences within product lines.
Acknowledgments
The authors would like to thank Channing Arndt, Finn Tarp,and Alan Winters for useful comments and suggestions,Ramon Ynaraja for providing relevant data, and DANIDAfor financial support. This paper was carried out as partof the trade component of the DANIDA-funded project“Capacity Strengthening and Technical Assistance to theNational Directorate of Studies and Policy Analysis” to theMinistry of Planning and Development, Mozambique. A.Alfieri would like to thank USAID for financial support.
Endnotes
1. This would allow DCs to replace exports of primarycommodities that exhibit declining terms of trade, the
10 Economics Research International
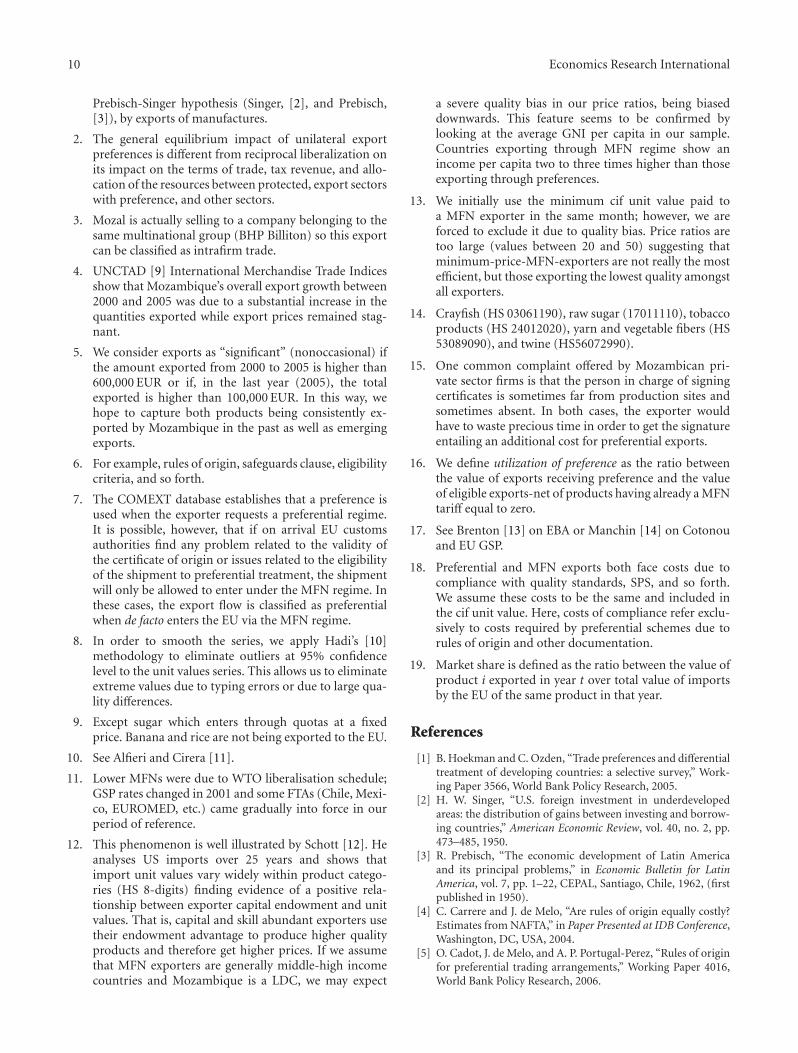
Prebisch-Singer hypothesis (Singer, [2], and Prebisch,[3]), by exports of manufactures.
2. The general equilibrium impact of unilateral exportpreferences is different from reciprocal liberalization onits impact on the terms of trade, tax revenue, and allo-cation of the resources between protected, export sectorswith preference, and other sectors.
3. Mozal is actually selling to a company belonging to thesame multinational group (BHP Billiton) so this exportcan be classified as intrafirm trade.
4. UNCTAD [9] International Merchandise Trade Indicesshow that Mozambique’s overall export growth between2000 and 2005 was due to a substantial increase in thequantities exported while export prices remained stag-nant.
5. We consider exports as “significant” (nonoccasional) ifthe amount exported from 2000 to 2005 is higher than600,000 EUR or if, in the last year (2005), the totalexported is higher than 100,000 EUR. In this way, wehope to capture both products being consistently ex-ported by Mozambique in the past as well as emergingexports.
6. For example, rules of origin, safeguards clause, eligibilitycriteria, and so forth.
7. The COMEXT database establishes that a preference isused when the exporter requests a preferential regime.It is possible, however, that if on arrival EU customsauthorities find any problem related to the validity ofthe certificate of origin or issues related to the eligibilityof the shipment to preferential treatment, the shipmentwill only be allowed to enter under the MFN regime. Inthese cases, the export flow is classified as preferentialwhen de facto enters the EU via the MFN regime.
8. In order to smooth the series, we apply Hadi’s [10]methodology to eliminate outliers at 95% confidencelevel to the unit values series. This allows us to eliminateextreme values due to typing errors or due to large qua-lity differences.
9. Except sugar which enters through quotas at a fixedprice. Banana and rice are not being exported to the EU.
10. See Alfieri and Cirera [11].
11. Lower MFNs were due to WTO liberalisation schedule;GSP rates changed in 2001 and some FTAs (Chile, Mexi-co, EUROMED, etc.) came gradually into force in ourperiod of reference.
12. This phenomenon is well illustrated by Schott [12]. Heanalyses US imports over 25 years and shows thatimport unit values vary widely within product catego-ries (HS 8-digits) finding evidence of a positive rela-tionship between exporter capital endowment and unitvalues. That is, capital and skill abundant exporters usetheir endowment advantage to produce higher qualityproducts and therefore get higher prices. If we assumethat MFN exporters are generally middle-high incomecountries and Mozambique is a LDC, we may expect
a severe quality bias in our price ratios, being biaseddownwards. This feature seems to be confirmed bylooking at the average GNI per capita in our sample.Countries exporting through MFN regime show anincome per capita two to three times higher than thoseexporting through preferences.
13. We initially use the minimum cif unit value paid toa MFN exporter in the same month; however, we areforced to exclude it due to quality bias. Price ratios aretoo large (values between 20 and 50) suggesting thatminimum-price-MFN-exporters are not really the mostefficient, but those exporting the lowest quality amongstall exporters.
14. Crayfish (HS 03061190), raw sugar (17011110), tobaccoproducts (HS 24012020), yarn and vegetable fibers (HS53089090), and twine (HS56072990).
15. One common complaint offered by Mozambican pri-vate sector firms is that the person in charge of signingcertificates is sometimes far from production sites andsometimes absent. In both cases, the exporter wouldhave to waste precious time in order to get the signatureentailing an additional cost for preferential exports.
16. We define utilization of preference as the ratio betweenthe value of exports receiving preference and the valueof eligible exports-net of products having already a MFNtariff equal to zero.
17. See Brenton [13] on EBA or Manchin [14] on Cotonouand EU GSP.
18. Preferential and MFN exports both face costs due tocompliance with quality standards, SPS, and so forth.We assume these costs to be the same and included inthe cif unit value. Here, costs of compliance refer exclu-sively to costs required by preferential schemes due torules of origin and other documentation.
19. Market share is defined as the ratio between the value ofproduct i exported in year t over total value of importsby the EU of the same product in that year.
References
[1] B. Hoekman and C. Ozden, “Trade preferences and differentialtreatment of developing countries: a selective survey,” Work-ing Paper 3566, World Bank Policy Research, 2005.
[2] H. W. Singer, “U.S. foreign investment in underdevelopedareas: the distribution of gains between investing and borrow-ing countries,” American Economic Review, vol. 40, no. 2, pp.473–485, 1950.
[3] R. Prebisch, “The economic development of Latin Americaand its principal problems,” in Economic Bulletin for LatinAmerica, vol. 7, pp. 1–22, CEPAL, Santiago, Chile, 1962, (firstpublished in 1950).
[4] C. Carrere and J. de Melo, “Are rules of origin equally costly?Estimates from NAFTA,” in Paper Presented at IDB Conference,Washington, DC, USA, 2004.
[5] O. Cadot, J. de Melo, and A. P. Portugal-Perez, “Rules of originfor preferential trading arrangements,” Working Paper 4016,World Bank Policy Research, 2006.
Economics Research International 11
[6] B. Hoekman, W. Martin, and C. A. Primo Braga, “Preferenceerosion: the terms of the debate,” in Trade, Doha, and Devel-opment: A Window into the Issues, R. Newfarmer, Ed., pp. 329–340, World Bank, Washington, DC, USA, 2006.
[7] M. Olarreaga and C. Ozden, “AGOA and Apparel: who cap-tures the tariff rent in the presence of preferential marketaccess?” World Economy, vol. 28, no. 1, pp. 63–77, 2005.
[8] C. Ozden and G. Sharma, “Price effects of preferential marketaccess: the Caribbean Basin Initiative and the apparel sector,”Working Paper 3244, World Bank Policy Research, 2004.
[9] UNCTAD, Handbook of Statistics 2006-2007, 2007.[10] A. S. Hadi, “A new measure of overall potential influence in
linear regression,” Computational Statistics and Data Analysis,vol. 14, no. 1, pp. 1–27, 1992.
[11] A. Alfieri and X. Cirera, “Unilateral trade preferences in theEU: an empirical assessment for the case of Mozambican ex-ports,” DNEAP Discussion Paper 60E, Maputo, Mozambique,2007.
[12] P. K. Schott, “Across-product versus within-product special-ization in international trade,” Quarterly Journal of Economics,vol. 119, no. 2, pp. 647–678, 2004.
[13] P. Brenton, “Integrating the least developed countries into theworld trading system: the current impact of European Unionpreferences under “Everything but arms”,” Journal of WorldTrade, vol. 37, no. 3, pp. 623–646, 2003.
[14] M. Manchin, “Preference utilization and tariff reduction inEU imports from ACP countrie,” Working Paper 3688, WorldBank Policy Research, 2005.
[15] A. Mold, “Trade preferences and Africa: the state of play andthe issues at stake,” ATPC UN Economic Commission forAfrica, 2005.
[16] OECD, “Assessment of utilization and motive for under-util-ization of preferences in selected LDCs,” October Joint Work-ing Party on Agricultural Trade, COM/AGR/TD/WP(2004)-12/REV2, 2004.

Submit your manuscripts athttp://www.hindawi.com
Child Development Research
Hindawi Publishing Corporationhttp://www.hindawi.com Volume 2014
Education Research International
Hindawi Publishing Corporationhttp://www.hindawi.com Volume 2014
Biomedical EducationJournal of
Hindawi Publishing Corporationhttp://www.hindawi.com Volume 2014
Hindawi Publishing Corporationhttp://www.hindawi.com Volume 2014
Psychiatry Journal
ArchaeologyJournal of
Hindawi Publishing Corporationhttp://www.hindawi.com Volume 2014
Hindawi Publishing Corporationhttp://www.hindawi.com Volume 2014
AnthropologyJournal of
Hindawi Publishing Corporationhttp://www.hindawi.com Volume 2014
Research and TreatmentSchizophrenia
Hindawi Publishing Corporationhttp://www.hindawi.com Volume 2014
Urban Studies Research
Population ResearchInternational Journal of
Hindawi Publishing Corporationhttp://www.hindawi.com Volume 2014
CriminologyJournal of
Hindawi Publishing Corporationhttp://www.hindawi.com Volume 2014
Aging ResearchJournal of
Hindawi Publishing Corporationhttp://www.hindawi.com Volume 2014
Hindawi Publishing Corporationhttp://www.hindawi.com Volume 2014
NursingResearch and Practice
Current Gerontology& Geriatrics Research
Hindawi Publishing Corporationhttp://www.hindawi.com
Volume 2014
Sleep DisordersHindawi Publishing Corporationhttp://www.hindawi.com Volume 2014
AddictionJournal of
Hindawi Publishing Corporationhttp://www.hindawi.com Volume 2014
Depression Research and TreatmentHindawi Publishing Corporationhttp://www.hindawi.com Volume 2014
Hindawi Publishing Corporationhttp://www.hindawi.com Volume 2014
Geography Journal
Hindawi Publishing Corporationhttp://www.hindawi.com Volume 2014
Research and TreatmentAutism
Hindawi Publishing Corporationhttp://www.hindawi.com Volume 2014
Economics Research International


![Review Article - Hindawi Publishing Corporationdownloads.hindawi.com/journals/ecam/2011/835945.pdf · Review Article ComplementarySpiritistTherapy: ... [7], “Spiritism proceeds](https://img.pdfslide.us/doc/110x75/5c172ece09d3f228458b757c/review-article-hindawi-publishing-review-article-complementaryspiritisttherapy.jpg)