Embed Size (px)
Citation preview
Research ArticleEffects of Rolling Reduction and Strength of ComposedLayers on Bond Strength of Pure Copper and Aluminium AlloyClad Sheets Fabricated by Cold Roll Bonding
Yoji Miyajima, Kotaro Iguchi, Susumu Onaka, and Masaharu Kato
Department of Materials Science and Engineering, Graduate School of Science and Engineering, Tokyo Institute of Technology,4250-J2-63 Nagatsuta-cho, Midori-ku, Yokohama 226-8502, Japan
Correspondence should be addressed to Yoji Miyajima; [email protected]
Received 18 January 2014; Accepted 12 March 2014; Published 17 April 2014
Academic Editor: Roohollah Jamaati
Copyright © 2014 Yoji Miyajima et al. This is an open access article distributed under the Creative Commons Attribution License,which permits unrestricted use, distribution, and reproduction in any medium, provided the original work is properly cited.
Three types of clad sheets, Cu/Al, Cu/AA5052, and Cu/AA5083, were produced by cold roll bonding with the rolling reduction of50% and 75%. Tensile shear tests which give tensile shear strength were performed in order to assess the bond strength. Scanningelectron microscopy was performed on the fractured interface produced by the tensile shear tests, which suggests that the fractureoccurs within the Al alloy layer. The tensile shear strengths considering the area fraction of deposit of Al alloy on Cu side werecompared with the shear stress converting from the ultimate tensile strengths. As a result, the tensile shear strength of the cladsheets is attributed to the shear strength of Al alloy layer close to the well bonded interface. A simple model was proposed thatexplains the effects of the rolling reduction and area fraction of deposit of Al alloy.
1. Introduction
Composite materials which have superior characteristicscompared with each composed material are widely used, andmetals can be used as the composed materials. For instance,Cu/Al composites have smaller density than Cu and higherthermal and electrical conductivities than Al [1]; therefore,they are used as light weight electric wires. Such metalliccomposites can be fabricated by mechanical alloying, diffu-sion bonding, and roll bonding. Especially, roll bonding canproduce large amount of metallic sheet-shaped composites,which are also called clad sheets, faster than other methodssuch as diffusion welding.
There are two types of roll bonding: one is hot roll bond-ing and the other is cold roll bonding, of which definitionis that the former and the latter are carried out above andbelow recrystallization temperature, respectively. During hotrolling, intermetallic layers are often formed at the interfacesof clad sheets. Such intermetallic layers would reduce thebond strength for Cu/Al composites [1]. On the other hand,it is possible to form the bonding without intermetallic layers
by cold roll bonding since the critical diffusion does not occurat the low process temperature.
Li et al. reviewed the bond strength of clad sheetsformed by cold roll bonding for several combinations of fcccomposed layers and concluded that the sufficient bondingcould be achieved rather easily between fccmetallic layers [2];Manesh prepared Al/Fe clad sheets using roll bonding andmeasured the bond strength by peeling tests [3]. Pozuelo etal. measured the bond strength of ultrahigh carbon steel/mildsteel clad sheets by Charpy impact tests and three pointsbending tests. It has been reported that the higher rollingreduction and the higher surface roughness of the unrolledcomposed layers produce higher bond strength [4].
There are a few related models and theories for the bond-ing and the bond strength of clad sheets. Jamaati and Torogh-inejad suggest that the faced and contaminated surface layersof metals are destroyed during roll bonding and virgin sur-faces appear from the crack at the contaminated surfaces [5,6]. Once the virgin surfaces are contacted, bonding betweentwo metals is achieved [5, 6]. However, the relationshipbetween the rolling reduction and the bond strength was not
Hindawi Publishing CorporationAdvances in Materials Science and EngineeringVolume 2014, Article ID 614821, 11 pageshttp://dx.doi.org/10.1155/2014/614821
2 Advances in Materials Science and Engineering
Table 1: The chemical composition of AA5052 and AA5083.
Element (mass %) Si Fe Cu Mn Mg Cr Zn AlAA5052 0.10 0.26 0.02 0.04 2.50 0.20 0.03 Bal.AA5083 0.14 0.20 0.02 0.68 4.40 0.12 0.00 Bal.
mentioned in the paper. Le et al. reported the effect of thethickness of the surface oxide layer onAl alloys and the rollingreductions against the creation of the crack at the surfaceoxide layer [7], but there is no description in the case of rollbonding. Furthermore, as far as the authors know, the effectof the strength of the composed layer on the bond strength ofclad sheets has not been fully understood yet.
In the present study, three types of Al alloys are chosenwith strength lower than, nearly equal to, and higher than thatof Cu. Using these alloy combinations, we will investigate theeffect of rolling reduction and strength of composed metalliclayers on bond strength of Cu/Al alloy clad sheets.
2. Materials and Methods
2.1.Materials. Materials used in the present study are pureCu(purity of 99.99%: 4N-Cu) and three types of Al alloys (4N-Al with 99.99% purity, AA5052, and AA5083). The chemicalcompositions of AA5052 and AA5083 are shown in Table 1.Prior to the cold roll bonding, the alloy and metal sheetswith 1 to 2mm thickness, 70mm width, and 150mm lengthwere prepared and annealed using a furnace in ambientatmosphere at 873K for 7.2 ks for 4N-Cu and 673K for 5.4 ksfor 4N-Al, AA5052, and AA5083. Clad sheets with 1mmthickness were made with cold rolling reductions 𝑟 (%) ofeither 50% (1mm thick sheets) or 75% (2mm thick sheets).
2.2. Cold Roll Bonding. Although there are many parametersaffecting cold roll bonding such as rolling conditions, shapefactor in rolling, surface conditions, adsorbed contaminants,oxide films, surface preparation methods, lubricant condi-tions, and postheat treatments [2], a specific cold rollingcondition for accumulative roll bonding (ARB) process withlubrication is treated in this paper. It is noted that thelubrication condition was achieved by using machine oil.
The ARB process is one of the severe plastic deformationprocesses which allows giving large amount of plastic strainfor metallic sheets in order to fabricate ultrafine grains(UFGs) [8, 9].The procedure of cold roll bonding used in thisstudy is almost the same as that used in the ARB process.Thecold roll bonding consists of three steps. First, the surface ofannealed sheets was cleaned using acetone, and a side of thesheets was surface treated by a wire-brash. Secondly, a 4N-Cusheet and an Al alloy sheet were stacked, and then four holesat the four corners are created using a drill. Then, the twometal sheets were tied bymetallic wires.Thirdly, roll bondingwas achieved using a rolling mill of which diameter of rollsis 250mm with a roll speed of 21 rpm and two types of therolling reductions 𝑟; one is 50% and the other is 75%. Here,it should be pointed out that 50% of rolling reduction wasperformed by one path of rolling, whereas 75% of rolling was
carried out by three paths in order to reduce the process heatand protect the rolling mill. The average strain rate for theroll bonding is between 10 s−1 and 30 s−1. Here, the averagestrain rate is equivalent to strain divided by time of rolling.As a result, clad sheets consisting of two metallic layers arefabricated.
The effective prevention of heat generation is very impor-tant since the temperature increase may create intermetalliclayers between the metal sheets which would deteriorate thebond strength. Here, the sample coordination was definedas rolling direction (RD), normal direction (ND), and trans-verse direction (TD).
Judging from the fact that the length of the plates after50% and 75% of rolling reduction became almost twice andfour times, respectively. Therefore, the plastic deformationduring the cold rolling can be approximated as the planestrain compression alongNDand the length change alongTDcan be neglected.
The combinations of the metal sheets were 4N-Cu/4N-Al, 4N-Cu/AA5053, and 4N-Cu/AA5083. Thus, there are sixtypes of samples with regard to the combination of themetalsand the thickness reduction. Hereby, the samples are denotedas combination of metals and the thickness reduction, suchas Cu/Al-50% and Cu/AA5052-75%. Here, it should be notedthat the thickness reduction values have a scatter of about afew percent, but this amount of difference in the thicknessreduction did not affect the Vickers hardness𝐻V of the metalsheet. Thus, nominal thickness reduction values are used inthis study.
2.3. Mechanical Tests. Vickers hardness tests were carried outusing micro-Vickers hardness machine MXT-𝛼1 (Matsuza-waseiki) with the load of 300 gf. The specimens for Vickershardness testswere cut frommetal sheets using awire-electricdischargemachine.The planes normal to the TD of the sheetswere used for the Vickers hardness tests. The surface of thespecimens was polishedmechanically and finished by buffingwith 1 𝜇m diamond liquid (Refinetech). Seven points on thecut specimen were used for measuring Vickers hardness perone specimen, and the average of five values of𝐻V excludingthe highest and the lowest values was treated as the 𝐻V ofthe specimen. In the case of the roll bonded specimens, themetal layers were chosen for the measurement points. In thismanner, it was confirmed that a few % difference in 𝑟 doesnot affect the 𝐻V of composed layers after cold roll bondingas mentioned before.
Two types of mechanical tests, uniaxial tensile testsand tensile shear tests, were performed using a tensile testmachine NMB TG-50 kN (Minebea) at room temperature(R.T.). Specimens for the uniaxial tensile tests were cut usingthe wire-electric discharge machine, and the surface of thespecimens was mechanically polished using SiC paper up
Advances in Materials Science and Engineering 3
5mm
9mm
9mm
10mm
r = 1mm
r = 1mm
t = 1mm
TD
RD
(a)
5mm1mm
30mm
TD
RD
TD
ND
(b)
dslit
TD
ND
(c)
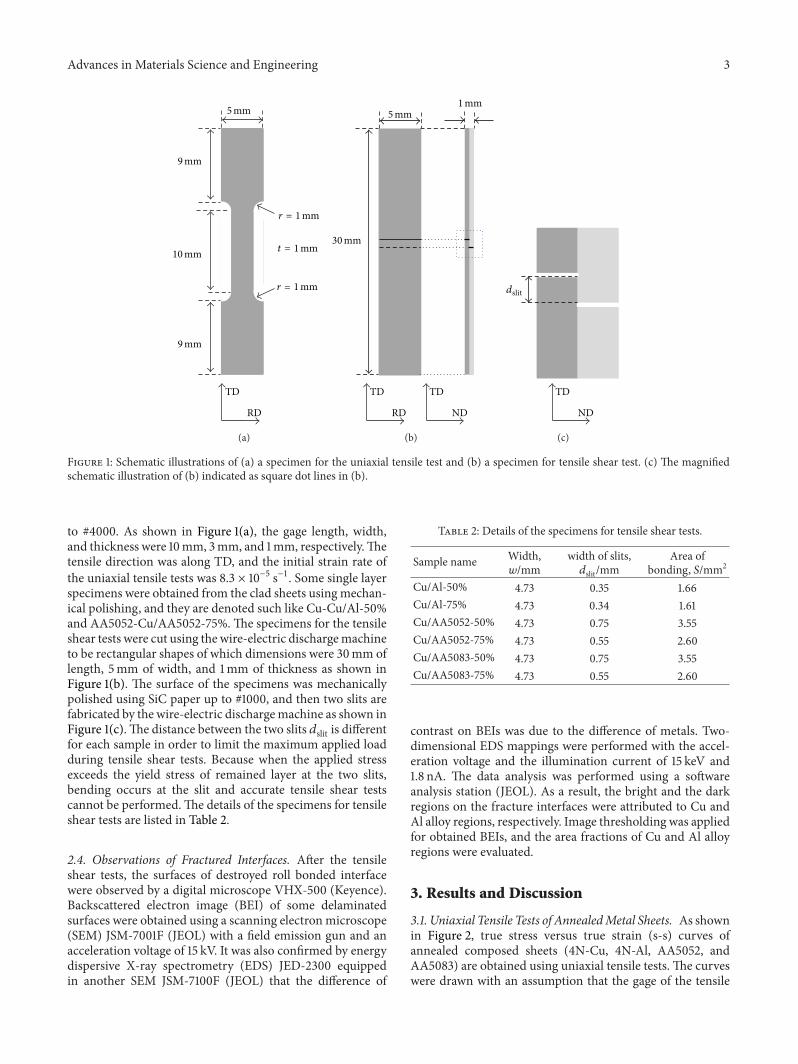
Figure 1: Schematic illustrations of (a) a specimen for the uniaxial tensile test and (b) a specimen for tensile shear test. (c) The magnifiedschematic illustration of (b) indicated as square dot lines in (b).
to #4000. As shown in Figure 1(a), the gage length, width,and thickness were 10mm, 3mm, and 1mm, respectively.Thetensile direction was along TD, and the initial strain rate ofthe uniaxial tensile tests was 8.3 × 10⁻⁵ s−1. Some single layerspecimens were obtained from the clad sheets using mechan-ical polishing, and they are denoted such like Cu-Cu/Al-50%and AA5052-Cu/AA5052-75%.The specimens for the tensileshear tests were cut using the wire-electric dischargemachineto be rectangular shapes of which dimensions were 30mm oflength, 5mm of width, and 1mm of thickness as shown inFigure 1(b). The surface of the specimens was mechanicallypolished using SiC paper up to #1000, and then two slits arefabricated by the wire-electric dischargemachine as shown inFigure 1(c).The distance between the two slits 𝑑slit is differentfor each sample in order to limit the maximum applied loadduring tensile shear tests. Because when the applied stressexceeds the yield stress of remained layer at the two slits,bending occurs at the slit and accurate tensile shear testscannot be performed.The details of the specimens for tensileshear tests are listed in Table 2.
2.4. Observations of Fractured Interfaces. After the tensileshear tests, the surfaces of destroyed roll bonded interfacewere observed by a digital microscope VHX-500 (Keyence).Backscattered electron image (BEI) of some delaminatedsurfaces were obtained using a scanning electron microscope(SEM) JSM-7001F (JEOL) with a field emission gun and anacceleration voltage of 15 kV. It was also confirmed by energydispersive X-ray spectrometry (EDS) JED-2300 equippedin another SEM JSM-7100F (JEOL) that the difference of
Table 2: Details of the specimens for tensile shear tests.
Sample name Width,𝑤/mm
width of slits,𝑑slit/mm
Area ofbonding, 𝑆/mm2
Cu/Al-50% 4.73 0.35 1.66Cu/Al-75% 4.73 0.34 1.61Cu/AA5052-50% 4.73 0.75 3.55Cu/AA5052-75% 4.73 0.55 2.60Cu/AA5083-50% 4.73 0.75 3.55Cu/AA5083-75% 4.73 0.55 2.60
contrast on BEIs was due to the difference of metals. Two-dimensional EDS mappings were performed with the accel-eration voltage and the illumination current of 15 keV and1.8 nA. The data analysis was performed using a softwareanalysis station (JEOL). As a result, the bright and the darkregions on the fracture interfaces were attributed to Cu andAl alloy regions, respectively. Image thresholding was appliedfor obtained BEIs, and the area fractions of Cu and Al alloyregions were evaluated.
3. Results and Discussion
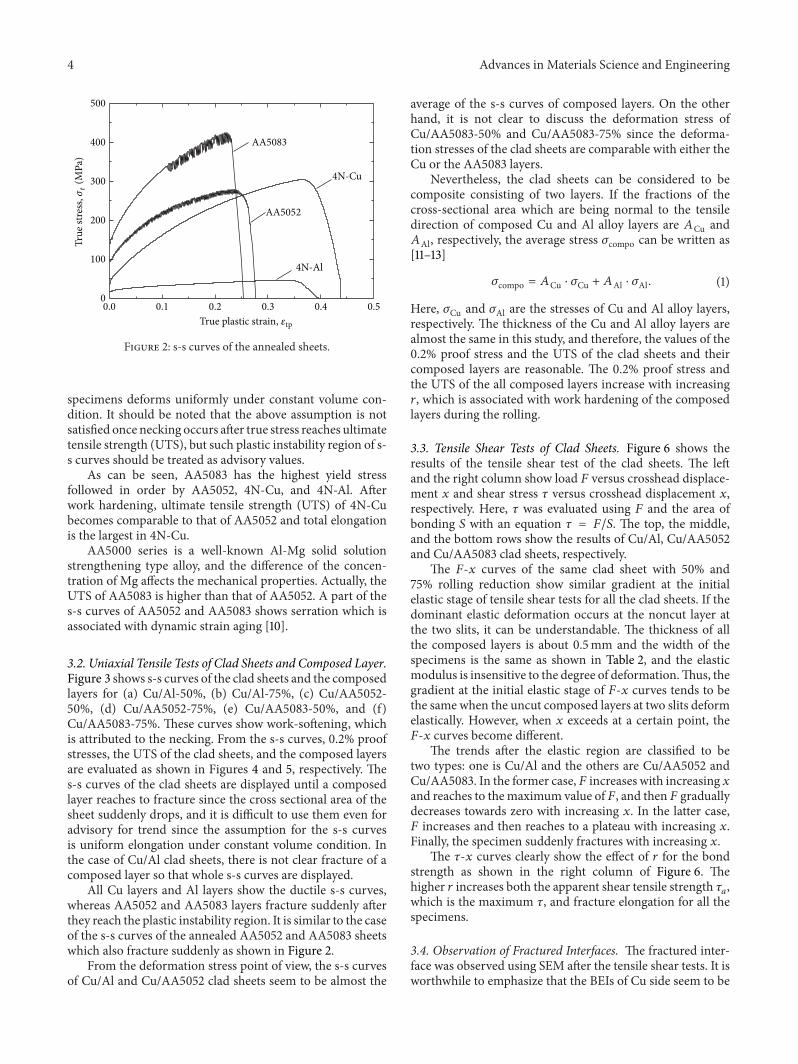
3.1. Uniaxial Tensile Tests of AnnealedMetal Sheets. As shownin Figure 2, true stress versus true strain (s-s) curves ofannealed composed sheets (4N-Cu, 4N-Al, AA5052, andAA5083) are obtained using uniaxial tensile tests. The curveswere drawn with an assumption that the gage of the tensile
4 Advances in Materials Science and Engineering
500
400
300
200
100
00.0 0.1 0.2 0.3 0.4 0.5
AA5083
AA5052
4N-Al
4N-Cu
True
stre
ss,𝜎
t(M
Pa)
True plastic strain, 𝜀tp
Figure 2: s-s curves of the annealed sheets.
specimens deforms uniformly under constant volume con-dition. It should be noted that the above assumption is notsatisfied once necking occurs after true stress reaches ultimatetensile strength (UTS), but such plastic instability region of s-s curves should be treated as advisory values.
As can be seen, AA5083 has the highest yield stressfollowed in order by AA5052, 4N-Cu, and 4N-Al. Afterwork hardening, ultimate tensile strength (UTS) of 4N-Cubecomes comparable to that of AA5052 and total elongationis the largest in 4N-Cu.
AA5000 series is a well-known Al-Mg solid solutionstrengthening type alloy, and the difference of the concen-tration of Mg affects the mechanical properties. Actually, theUTS of AA5083 is higher than that of AA5052. A part of thes-s curves of AA5052 and AA5083 shows serration which isassociated with dynamic strain aging [10].
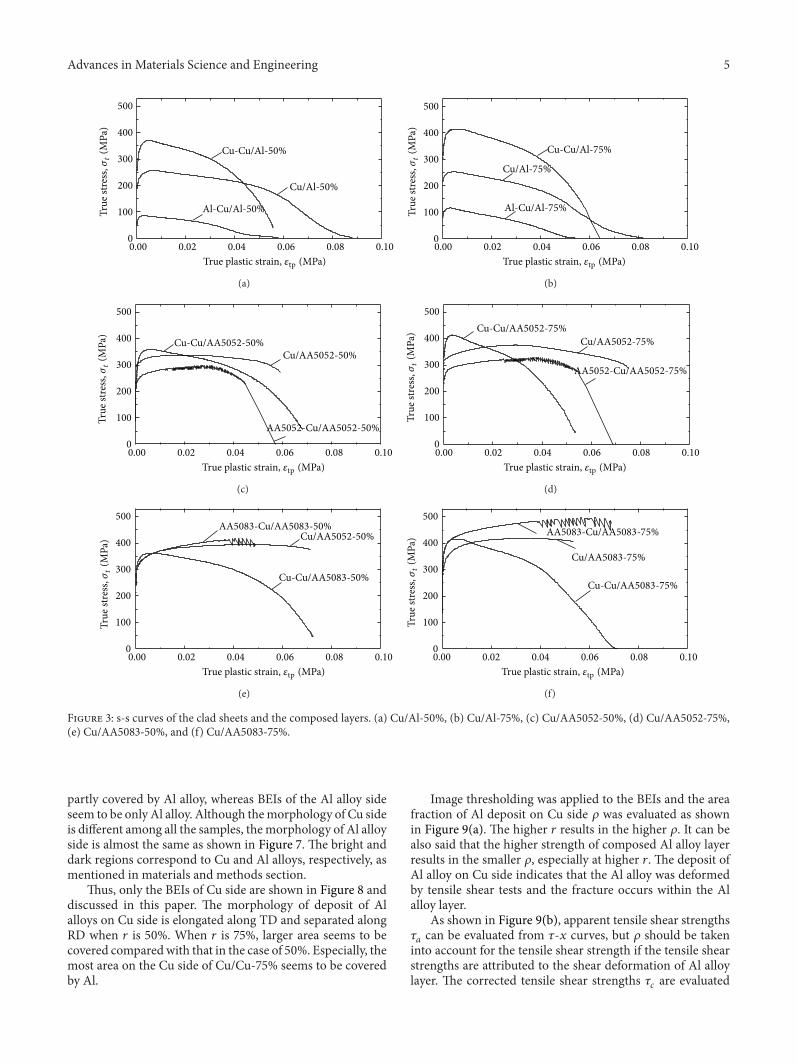
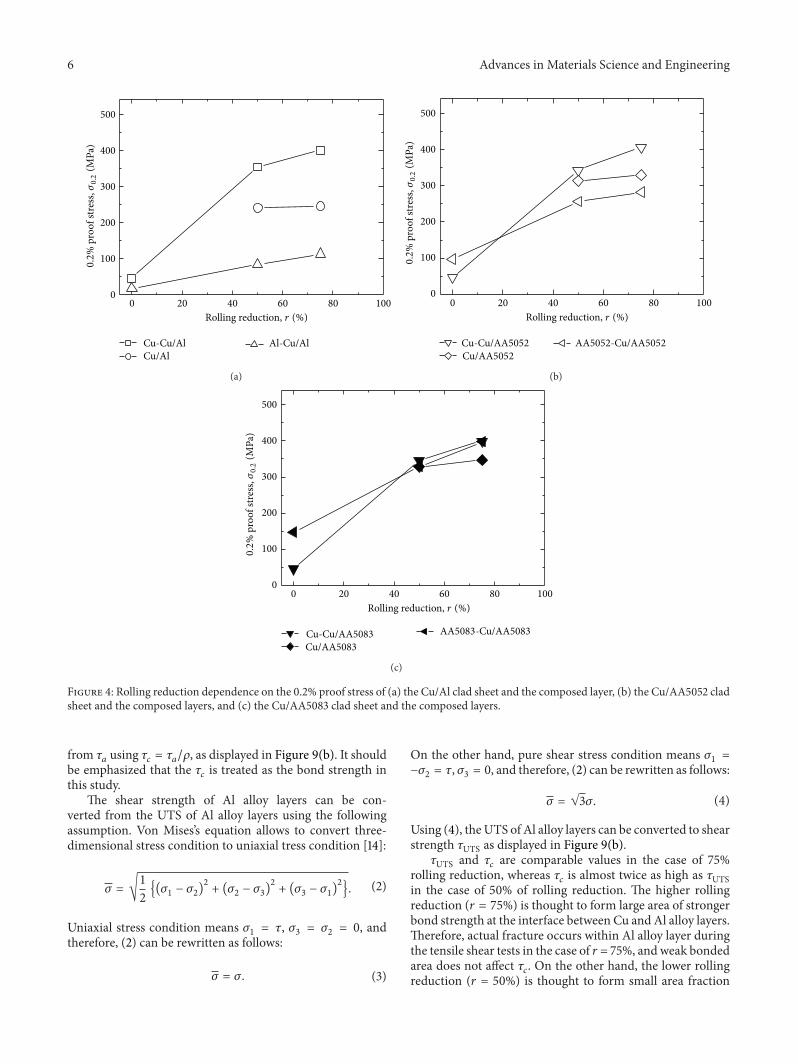
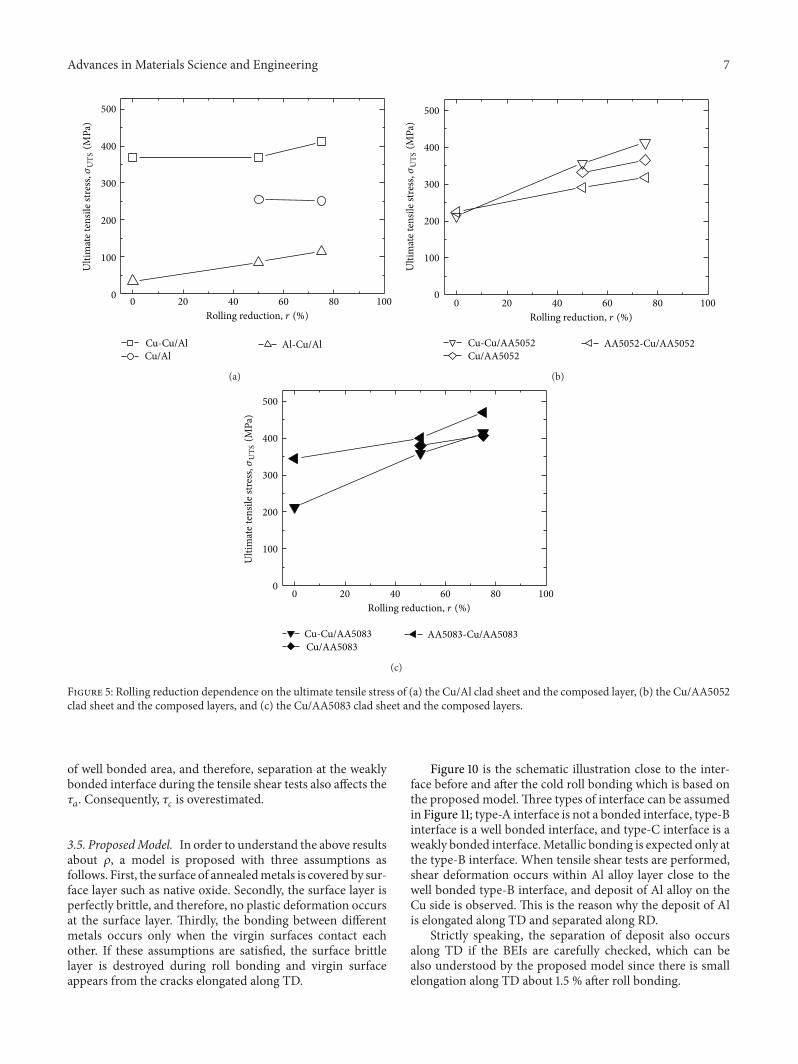
3.2. Uniaxial Tensile Tests of Clad Sheets and Composed Layer.Figure 3 shows s-s curves of the clad sheets and the composedlayers for (a) Cu/Al-50%, (b) Cu/Al-75%, (c) Cu/AA5052-50%, (d) Cu/AA5052-75%, (e) Cu/AA5083-50%, and (f)Cu/AA5083-75%. These curves show work-softening, whichis attributed to the necking. From the s-s curves, 0.2% proofstresses, the UTS of the clad sheets, and the composed layersare evaluated as shown in Figures 4 and 5, respectively. Thes-s curves of the clad sheets are displayed until a composedlayer reaches to fracture since the cross sectional area of thesheet suddenly drops, and it is difficult to use them even foradvisory for trend since the assumption for the s-s curvesis uniform elongation under constant volume condition. Inthe case of Cu/Al clad sheets, there is not clear fracture of acomposed layer so that whole s-s curves are displayed.
All Cu layers and Al layers show the ductile s-s curves,whereas AA5052 and AA5083 layers fracture suddenly afterthey reach the plastic instability region. It is similar to the caseof the s-s curves of the annealed AA5052 and AA5083 sheetswhich also fracture suddenly as shown in Figure 2.
From the deformation stress point of view, the s-s curvesof Cu/Al and Cu/AA5052 clad sheets seem to be almost the
average of the s-s curves of composed layers. On the otherhand, it is not clear to discuss the deformation stress ofCu/AA5083-50% and Cu/AA5083-75% since the deforma-tion stresses of the clad sheets are comparable with either theCu or the AA5083 layers.
Nevertheless, the clad sheets can be considered to becomposite consisting of two layers. If the fractions of thecross-sectional area which are being normal to the tensiledirection of composed Cu and Al alloy layers are 𝐴Cu and𝐴Al, respectively, the average stress 𝜎compo can be written as[11–13]
𝜎compo = 𝐴Cu ⋅ 𝜎Cu + 𝐴Al ⋅ 𝜎Al. (1)
Here, 𝜎Cu and 𝜎Al are the stresses of Cu and Al alloy layers,respectively. The thickness of the Cu and Al alloy layers arealmost the same in this study, and therefore, the values of the0.2% proof stress and the UTS of the clad sheets and theircomposed layers are reasonable. The 0.2% proof stress andthe UTS of the all composed layers increase with increasing𝑟, which is associated with work hardening of the composedlayers during the rolling.
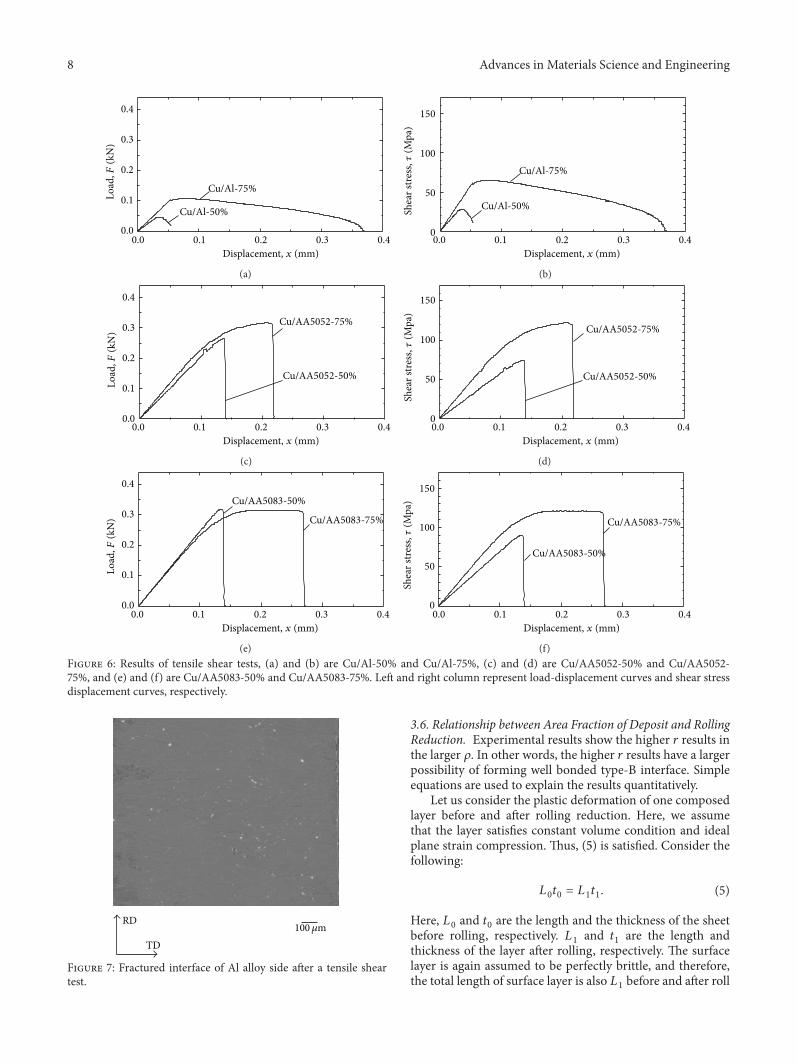
3.3. Tensile Shear Tests of Clad Sheets. Figure 6 shows theresults of the tensile shear test of the clad sheets. The leftand the right column show load 𝐹 versus crosshead displace-ment 𝑥 and shear stress 𝜏 versus crosshead displacement 𝑥,respectively. Here, 𝜏 was evaluated using 𝐹 and the area ofbonding 𝑆 with an equation 𝜏 = 𝐹/𝑆. The top, the middle,and the bottom rows show the results of Cu/Al, Cu/AA5052and Cu/AA5083 clad sheets, respectively.
The 𝐹-𝑥 curves of the same clad sheet with 50% and75% rolling reduction show similar gradient at the initialelastic stage of tensile shear tests for all the clad sheets. If thedominant elastic deformation occurs at the noncut layer atthe two slits, it can be understandable. The thickness of allthe composed layers is about 0.5mm and the width of thespecimens is the same as shown in Table 2, and the elasticmodulus is insensitive to the degree of deformation.Thus, thegradient at the initial elastic stage of 𝐹-𝑥 curves tends to bethe same when the uncut composed layers at two slits deformelastically. However, when 𝑥 exceeds at a certain point, the𝐹-𝑥 curves become different.
The trends after the elastic region are classified to betwo types: one is Cu/Al and the others are Cu/AA5052 andCu/AA5083. In the former case,𝐹 increases with increasing 𝑥and reaches to themaximum value of 𝐹, and then 𝐹 graduallydecreases towards zero with increasing 𝑥. In the latter case,𝐹 increases and then reaches to a plateau with increasing 𝑥.Finally, the specimen suddenly fractures with increasing 𝑥.
The 𝜏-𝑥 curves clearly show the effect of 𝑟 for the bondstrength as shown in the right column of Figure 6. Thehigher 𝑟 increases both the apparent shear tensile strength 𝜏
𝑎
,which is the maximum 𝜏, and fracture elongation for all thespecimens.
3.4. Observation of Fractured Interfaces. The fractured inter-face was observed using SEM after the tensile shear tests. It isworthwhile to emphasize that the BEIs of Cu side seem to be
Advances in Materials Science and Engineering 5
Cu-Cu/Al-50%
Cu/Al-50%
Al-Cu/Al-50%
500
400
300
200
100
0
True
stre
ss,𝜎
t(M
Pa)
0.00 0.02 0.04 0.06 0.08 0.10
True plastic strain, 𝜀tp (MPa)
(a)
500
400
300
200
100
0
Cu-Cu/Al-75%
Cu/Al-75%
Al-Cu/Al-75%True
stre
ss,𝜎
t(M
Pa)
0.00 0.02 0.04 0.06 0.08 0.10
True plastic strain, 𝜀tp (MPa)
(b)
Cu-Cu/AA5052-50%Cu/AA5052-50%
AA5052-Cu/AA5052-50%
500
400
300
200
100
0
True
stre
ss,𝜎
t(M
Pa)
0.00 0.02 0.04 0.06 0.08 0.10
True plastic strain, 𝜀tp (MPa)
(c)
500
400
300
200
100
0
Cu-Cu/AA5052-75%Cu/AA5052-75%
AA5052-Cu/AA5052-75%
True
stre
ss,𝜎
t(M
Pa)
0.00 0.02 0.04 0.06 0.08 0.10
True plastic strain, 𝜀tp (MPa)
(d)
AA5083-Cu/AA5083-50%Cu/AA5052-50%
Cu-Cu/AA5083-50%
500
400
300
200
100
00.00 0.02 0.04 0.06 0.08 0.10
True
stre
ss,𝜎
t(M
Pa)
True plastic strain, 𝜀tp (MPa)
(e)
500
400
300
200
100
00.00 0.02 0.04 0.06 0.08 0.10
True
stre
ss,𝜎
t(M
Pa) AA5083-Cu/AA5083-75%
Cu/AA5083-75%
Cu-Cu/AA5083-75%
True plastic strain, 𝜀tp (MPa)
(f)
Figure 3: s-s curves of the clad sheets and the composed layers. (a) Cu/Al-50%, (b) Cu/Al-75%, (c) Cu/AA5052-50%, (d) Cu/AA5052-75%,(e) Cu/AA5083-50%, and (f) Cu/AA5083-75%.
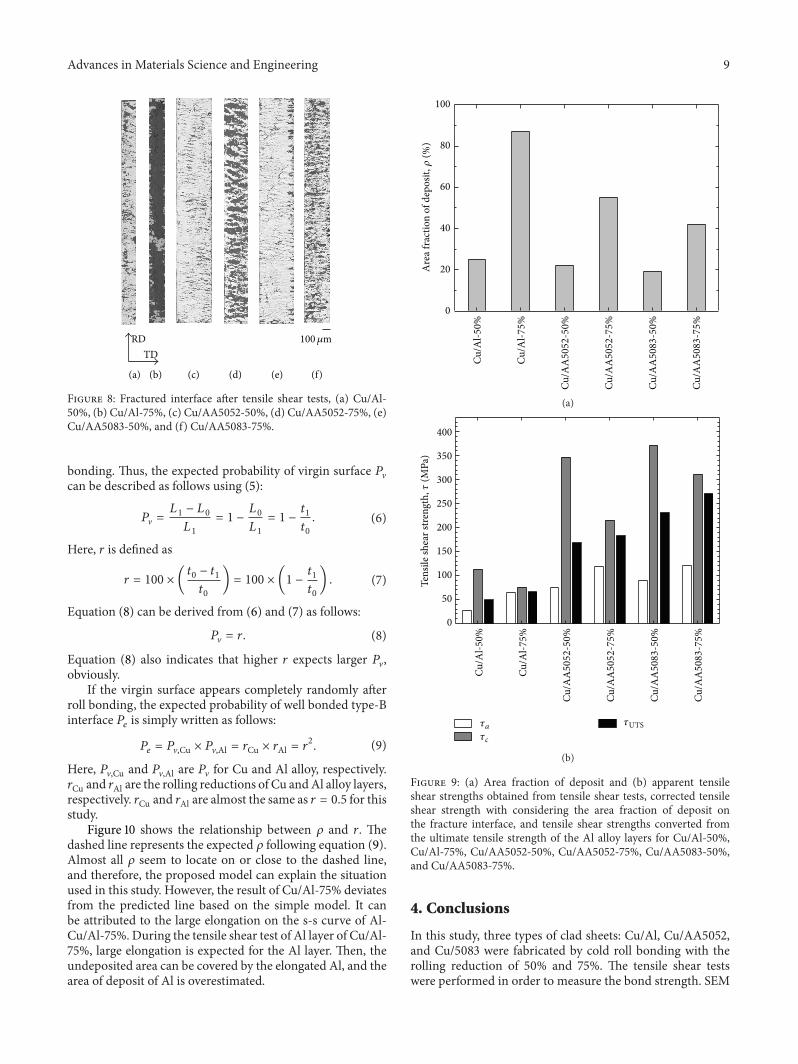
partly covered by Al alloy, whereas BEIs of the Al alloy sideseem to be only Al alloy. Although themorphology of Cu sideis different among all the samples, themorphology of Al alloyside is almost the same as shown in Figure 7. The bright anddark regions correspond to Cu and Al alloys, respectively, asmentioned in materials and methods section.
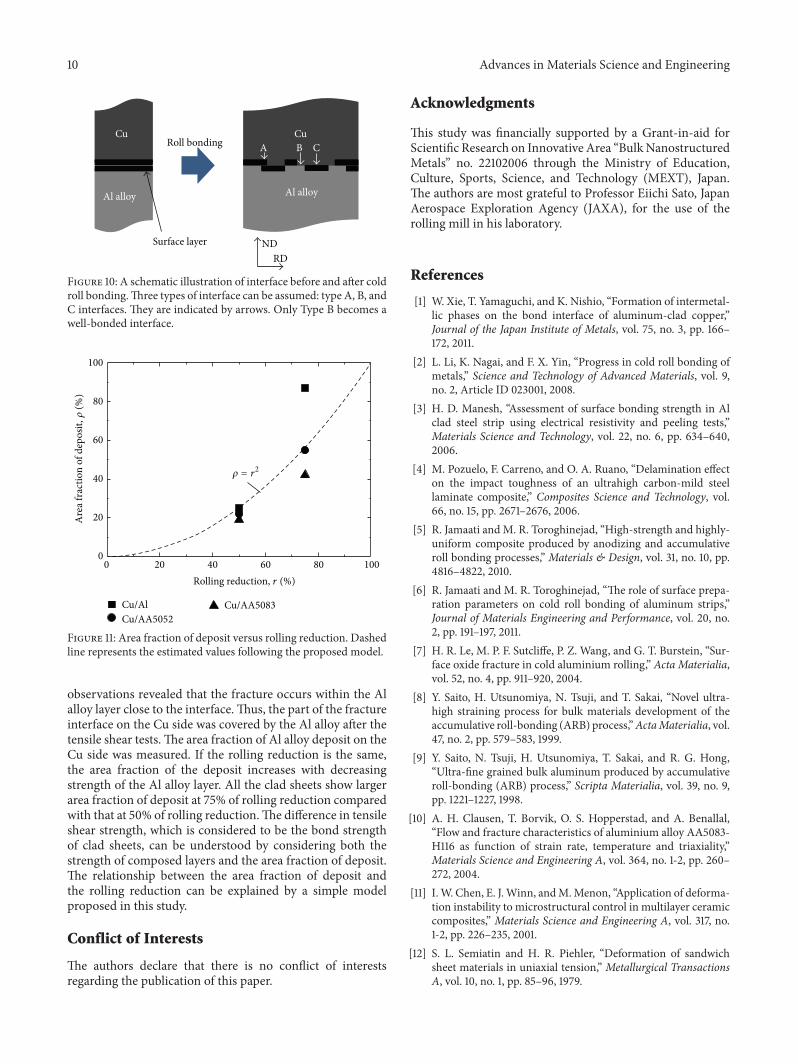
Thus, only the BEIs of Cu side are shown in Figure 8 anddiscussed in this paper. The morphology of deposit of Alalloys on Cu side is elongated along TD and separated alongRD when 𝑟 is 50%. When 𝑟 is 75%, larger area seems to becovered comparedwith that in the case of 50%. Especially, themost area on the Cu side of Cu/Cu-75% seems to be coveredby Al.
Image thresholding was applied to the BEIs and the areafraction of Al deposit on Cu side 𝜌 was evaluated as shownin Figure 9(a). The higher 𝑟 results in the higher 𝜌. It can bealso said that the higher strength of composed Al alloy layerresults in the smaller 𝜌, especially at higher 𝑟. The deposit ofAl alloy on Cu side indicates that the Al alloy was deformedby tensile shear tests and the fracture occurs within the Alalloy layer.
As shown in Figure 9(b), apparent tensile shear strengths𝜏𝑎
can be evaluated from 𝜏-𝑥 curves, but 𝜌 should be takeninto account for the tensile shear strength if the tensile shearstrengths are attributed to the shear deformation of Al alloylayer. The corrected tensile shear strengths 𝜏
𝑐
are evaluated
6 Advances in Materials Science and Engineering
500
400
300
200
100
0
Al-Cu/AlCu-Cu/AlCu/Al
0 20 40 60 80 100
Rolling reduction, r (%)
0.2
% p
roof
stre
ss,𝜎
0.2
(MPa
)
(a)
500
400
300
200
100
00 20 40 60 80 100
Cu-Cu/AA5052
Cu/AA5052
AA5052-Cu/AA5052
Rolling reduction, r (%)
0.2
% p
roof
stre
ss,𝜎
0.2
(MPa
)
(b)
0 20 40 60 80 100
500
400
300
200
100
0
Cu-Cu/AA5083Cu/AA5083
AA5083-Cu/AA5083
Rolling reduction, r (%)
0.2
% p
roof
stre
ss,𝜎
0.2
(MPa
)
(c)
Figure 4: Rolling reduction dependence on the 0.2% proof stress of (a) the Cu/Al clad sheet and the composed layer, (b) the Cu/AA5052 cladsheet and the composed layers, and (c) the Cu/AA5083 clad sheet and the composed layers.
from 𝜏𝑎
using 𝜏𝑐
= 𝜏𝑎
/𝜌, as displayed in Figure 9(b). It shouldbe emphasized that the 𝜏
𝑐
is treated as the bond strength inthis study.
The shear strength of Al alloy layers can be con-verted from the UTS of Al alloy layers using the followingassumption. Von Mises’s equation allows to convert three-dimensional stress condition to uniaxial tress condition [14]:
𝜎 = √1
2
{(𝜎1
− 𝜎2
)2
+ (𝜎2
− 𝜎3
)2
+ (𝜎3
− 𝜎1
)2
}. (2)
Uniaxial stress condition means 𝜎1
= 𝜏, 𝜎3
= 𝜎2
= 0, andtherefore, (2) can be rewritten as follows:
𝜎 = 𝜎. (3)
On the other hand, pure shear stress condition means 𝜎1
=
−𝜎2
= 𝜏, 𝜎3
= 0, and therefore, (2) can be rewritten as follows:
𝜎 = √3𝜎. (4)
Using (4), theUTS of Al alloy layers can be converted to shearstrength 𝜏UTS as displayed in Figure 9(b).𝜏UTS and 𝜏
𝑐
are comparable values in the case of 75%rolling reduction, whereas 𝜏
𝑐
is almost twice as high as 𝜏UTSin the case of 50% of rolling reduction. The higher rollingreduction (𝑟 = 75%) is thought to form large area of strongerbond strength at the interface between Cu and Al alloy layers.Therefore, actual fracture occurs within Al alloy layer duringthe tensile shear tests in the case of 𝑟 = 75%, and weak bondedarea does not affect 𝜏
𝑐
. On the other hand, the lower rollingreduction (𝑟 = 50%) is thought to form small area fraction
Advances in Materials Science and Engineering 7
500
400
300
200
100
00 20 40 60 80 100
Rolling reduction, r (%)
Cu-Cu/AlCu/Al
Al-Cu/Al
Ulti
mat
e ten
sile s
tress
,𝜎U
TS(M
Pa)
(a)
500
400
300
200
100
0
Ulti
mat
e ten
sile s
tress
,𝜎U
TS(M
Pa)
0 20 40 60 80 100
Rolling reduction, r (%)
Cu-Cu/AA5052
Cu/AA5052AA5052-Cu/AA5052
(b)
0 20 40 60 80 100
Rolling reduction, r (%)
500
400
300
200
100
0
Ulti
mat
e ten
sile s
tress
,𝜎U
TS(M
Pa)
Cu-Cu/AA5083
Cu/AA5083AA5083-Cu/AA5083
(c)
Figure 5: Rolling reduction dependence on the ultimate tensile stress of (a) the Cu/Al clad sheet and the composed layer, (b) the Cu/AA5052clad sheet and the composed layers, and (c) the Cu/AA5083 clad sheet and the composed layers.
of well bonded area, and therefore, separation at the weaklybonded interface during the tensile shear tests also affects the𝜏𝑎
. Consequently, 𝜏𝑐
is overestimated.
3.5. ProposedModel. In order to understand the above resultsabout 𝜌, a model is proposed with three assumptions asfollows. First, the surface of annealedmetals is covered by sur-face layer such as native oxide. Secondly, the surface layer isperfectly brittle, and therefore, no plastic deformation occursat the surface layer. Thirdly, the bonding between differentmetals occurs only when the virgin surfaces contact eachother. If these assumptions are satisfied, the surface brittlelayer is destroyed during roll bonding and virgin surfaceappears from the cracks elongated along TD.
Figure 10 is the schematic illustration close to the inter-face before and after the cold roll bonding which is based onthe proposed model. Three types of interface can be assumedin Figure 11; type-A interface is not a bonded interface, type-Binterface is a well bonded interface, and type-C interface is aweakly bonded interface.Metallic bonding is expected only atthe type-B interface. When tensile shear tests are performed,shear deformation occurs within Al alloy layer close to thewell bonded type-B interface, and deposit of Al alloy on theCu side is observed. This is the reason why the deposit of Alis elongated along TD and separated along RD.
Strictly speaking, the separation of deposit also occursalong TD if the BEIs are carefully checked, which can bealso understood by the proposed model since there is smallelongation along TD about 1.5 % after roll bonding.
8 Advances in Materials Science and Engineering
Cu/Al-75%
Cu/Al-50%
0.4
0.3
0.2
0.1
0.0
Load
,F(k
N)
0.0 0.1 0.2 0.3 0.4
Displacement, x (mm)
(a)
150
100
50
0
Cu/Al-75%
Cu/Al-50%
0.0 0.1 0.2 0.3 0.4
Displacement, x (mm)
Shea
r stre
ss,𝜏
(Mpa
)
(b)
0.4
0.3
0.2
0.1
0.0
Load
,F(k
N)
Cu/AA5052-75%
Cu/AA5052-50%
0.0 0.1 0.2 0.3 0.4
Displacement, x (mm)
(c)
150
100
50
0
Cu/AA5052-75%
Cu/AA5052-50%
0.0 0.1 0.2 0.3 0.4
Displacement, x (mm)
Shea
r stre
ss,𝜏
(Mpa
)
(d)
0.4
0.3
0.2
0.1
0.0
Load
,F(k
N)
0.0 0.1 0.2 0.3 0.4
Displacement, x (mm)
Cu/AA5083-50%
Cu/AA5083-75%
(e)
Cu/AA5083-75%
Cu/AA5083-50%
150
100
50
00.0 0.1 0.2 0.3 0.4
Displacement, x (mm)
Shea
r stre
ss,𝜏
(Mpa
)
(f)Figure 6: Results of tensile shear tests, (a) and (b) are Cu/Al-50% and Cu/Al-75%, (c) and (d) are Cu/AA5052-50% and Cu/AA5052-75%, and (e) and (f) are Cu/AA5083-50% and Cu/AA5083-75%. Left and right column represent load-displacement curves and shear stressdisplacement curves, respectively.
RD
TD100𝜇m
Figure 7: Fractured interface of Al alloy side after a tensile sheartest.
3.6. Relationship between Area Fraction of Deposit and RollingReduction. Experimental results show the higher 𝑟 results inthe larger 𝜌. In other words, the higher 𝑟 results have a largerpossibility of forming well bonded type-B interface. Simpleequations are used to explain the results quantitatively.
Let us consider the plastic deformation of one composedlayer before and after rolling reduction. Here, we assumethat the layer satisfies constant volume condition and idealplane strain compression. Thus, (5) is satisfied. Consider thefollowing:
𝐿0
𝑡0
= 𝐿1
𝑡1
. (5)
Here, 𝐿0
and 𝑡0
are the length and the thickness of the sheetbefore rolling, respectively. 𝐿
1
and 𝑡1
are the length andthickness of the layer after rolling, respectively. The surfacelayer is again assumed to be perfectly brittle, and therefore,the total length of surface layer is also 𝐿
1
before and after roll
Advances in Materials Science and Engineering 9
RDTD
100𝜇m
(a) (b) (c) (d) (e) (f)
Figure 8: Fractured interface after tensile shear tests, (a) Cu/Al-50%, (b) Cu/Al-75%, (c) Cu/AA5052-50%, (d) Cu/AA5052-75%, (e)Cu/AA5083-50%, and (f) Cu/AA5083-75%.
bonding. Thus, the expected probability of virgin surface 𝑃Vcan be described as follows using (5):
𝑃V =𝐿1
− 𝐿0
𝐿1
= 1 −
𝐿0
𝐿1
= 1 −
𝑡1
𝑡0
. (6)
Here, 𝑟 is defined as
𝑟 = 100 × (
𝑡0
− 𝑡1
𝑡0
) = 100 × (1 −
𝑡1
𝑡0
) . (7)
Equation (8) can be derived from (6) and (7) as follows:
𝑃V = 𝑟. (8)
Equation (8) also indicates that higher 𝑟 expects larger 𝑃V,obviously.
If the virgin surface appears completely randomly afterroll bonding, the expected probability of well bonded type-Binterface 𝑃
𝑒
is simply written as follows:
𝑃𝑒
= 𝑃V,Cu × 𝑃V,Al = 𝑟Cu × 𝑟Al = 𝑟2
. (9)
Here, 𝑃V,Cu and 𝑃V,Al are 𝑃V for Cu and Al alloy, respectively.𝑟Cu and 𝑟Al are the rolling reductions of Cu andAl alloy layers,respectively. 𝑟Cu and 𝑟Al are almost the same as 𝑟 = 0.5 for thisstudy.
Figure 10 shows the relationship between 𝜌 and 𝑟. Thedashed line represents the expected 𝜌 following equation (9).Almost all 𝜌 seem to locate on or close to the dashed line,and therefore, the proposed model can explain the situationused in this study. However, the result of Cu/Al-75% deviatesfrom the predicted line based on the simple model. It canbe attributed to the large elongation on the s-s curve of Al-Cu/Al-75%. During the tensile shear test of Al layer of Cu/Al-75%, large elongation is expected for the Al layer. Then, theundeposited area can be covered by the elongated Al, and thearea of deposit of Al is overestimated.
100
80
60
40
20
0
Are
a fra
ctio
n of
dep
osit,
𝜌(%
)
Cu/A
l-50%
Cu/A
l-75%
Cu/A
A5052
-50%
Cu/A
A5052
-75%
Cu/A
A5083
-50%
Cu/A
A5083
-75%
(a)
Cu/A
l-50%
Cu/A
l-75%
Cu/A
A5052
-50%
Cu/A
A5052
-75%
Cu/A
A5083
-50%
Cu/A
A5083
-75%
Tens
ile sh
ear s
treng
th,𝜏
(MPa
)400
350
300
250
200
150
100
50
0
𝜏a𝜏c
𝜏UTS
(b)
Figure 9: (a) Area fraction of deposit and (b) apparent tensileshear strengths obtained from tensile shear tests, corrected tensileshear strength with considering the area fraction of deposit onthe fracture interface, and tensile shear strengths converted fromthe ultimate tensile strength of the Al alloy layers for Cu/Al-50%,Cu/Al-75%, Cu/AA5052-50%, Cu/AA5052-75%, Cu/AA5083-50%,and Cu/AA5083-75%.
4. Conclusions
In this study, three types of clad sheets: Cu/Al, Cu/AA5052,and Cu/5083 were fabricated by cold roll bonding with therolling reduction of 50% and 75%. The tensile shear testswere performed in order to measure the bond strength. SEM
10 Advances in Materials Science and Engineering
A BCuCu
Al alloyAl alloy
NDRD
Surface layer
Roll bonding C
Figure 10: A schematic illustration of interface before and after coldroll bonding.Three types of interface can be assumed: type A, B, andC interfaces. They are indicated by arrows. Only Type B becomes awell-bonded interface.
100
80
60
40
20
0100806040200
Are
a fra
ctio
n of
dep
osit,
𝜌(%
)
Rolling reduction, r (%)
𝜌 = r2
Cu/AlCu/AA5052
Cu/AA5083
Figure 11: Area fraction of deposit versus rolling reduction. Dashedline represents the estimated values following the proposed model.
observations revealed that the fracture occurs within the Alalloy layer close to the interface.Thus, the part of the fractureinterface on the Cu side was covered by the Al alloy after thetensile shear tests.The area fraction of Al alloy deposit on theCu side was measured. If the rolling reduction is the same,the area fraction of the deposit increases with decreasingstrength of the Al alloy layer. All the clad sheets show largerarea fraction of deposit at 75% of rolling reduction comparedwith that at 50% of rolling reduction.The difference in tensileshear strength, which is considered to be the bond strengthof clad sheets, can be understood by considering both thestrength of composed layers and the area fraction of deposit.The relationship between the area fraction of deposit andthe rolling reduction can be explained by a simple modelproposed in this study.
Conflict of Interests
The authors declare that there is no conflict of interestsregarding the publication of this paper.
Acknowledgments
This study was financially supported by a Grant-in-aid forScientific Research on Innovative Area “BulkNanostructuredMetals” no. 22102006 through the Ministry of Education,Culture, Sports, Science, and Technology (MEXT), Japan.The authors are most grateful to Professor Eiichi Sato, JapanAerospace Exploration Agency (JAXA), for the use of therolling mill in his laboratory.
References
[1] W. Xie, T. Yamaguchi, and K. Nishio, “Formation of intermetal-lic phases on the bond interface of aluminum-clad copper,”Journal of the Japan Institute of Metals, vol. 75, no. 3, pp. 166–172, 2011.
[2] L. Li, K. Nagai, and F. X. Yin, “Progress in cold roll bonding ofmetals,” Science and Technology of Advanced Materials, vol. 9,no. 2, Article ID 023001, 2008.
[3] H. D. Manesh, “Assessment of surface bonding strength in Alclad steel strip using electrical resistivity and peeling tests,”Materials Science and Technology, vol. 22, no. 6, pp. 634–640,2006.
[4] M. Pozuelo, F. Carreno, and O. A. Ruano, “Delamination effecton the impact toughness of an ultrahigh carbon-mild steellaminate composite,” Composites Science and Technology, vol.66, no. 15, pp. 2671–2676, 2006.
[5] R. Jamaati andM. R. Toroghinejad, “High-strength and highly-uniform composite produced by anodizing and accumulativeroll bonding processes,” Materials & Design, vol. 31, no. 10, pp.4816–4822, 2010.
[6] R. Jamaati and M. R. Toroghinejad, “The role of surface prepa-ration parameters on cold roll bonding of aluminum strips,”Journal of Materials Engineering and Performance, vol. 20, no.2, pp. 191–197, 2011.
[7] H. R. Le, M. P. F. Sutcliffe, P. Z. Wang, and G. T. Burstein, “Sur-face oxide fracture in cold aluminium rolling,” Acta Materialia,vol. 52, no. 4, pp. 911–920, 2004.
[8] Y. Saito, H. Utsunomiya, N. Tsuji, and T. Sakai, “Novel ultra-high straining process for bulk materials development of theaccumulative roll-bonding (ARB) process,”ActaMaterialia, vol.47, no. 2, pp. 579–583, 1999.
[9] Y. Saito, N. Tsuji, H. Utsunomiya, T. Sakai, and R. G. Hong,“Ultra-fine grained bulk aluminum produced by accumulativeroll-bonding (ARB) process,” Scripta Materialia, vol. 39, no. 9,pp. 1221–1227, 1998.
[10] A. H. Clausen, T. Borvik, O. S. Hopperstad, and A. Benallal,“Flow and fracture characteristics of aluminium alloy AA5083-H116 as function of strain rate, temperature and triaxiality,”Materials Science and Engineering A, vol. 364, no. 1-2, pp. 260–272, 2004.
[11] I.W. Chen, E. J.Winn, andM.Menon, “Application of deforma-tion instability to microstructural control in multilayer ceramiccomposites,” Materials Science and Engineering A, vol. 317, no.1-2, pp. 226–235, 2001.
[12] S. L. Semiatin and H. R. Piehler, “Deformation of sandwichsheet materials in uniaxial tension,” Metallurgical TransactionsA, vol. 10, no. 1, pp. 85–96, 1979.

Advances in Materials Science and Engineering 11
[13] S. L. Semiatin and H. R. Piehler, “Formability of sandwich sheetmaterials in plane strain compression and rolling,”MetallurgicalTransactions A, vol. 10, no. 1, pp. 97–107, 1979.
[14] M. Kato, S. Onaka, and S. Kumai, Zairyokyodogaku, Asakura,Tokyo, Japan, 1999.

Submit your manuscripts athttp://www.hindawi.com
ScientificaHindawi Publishing Corporationhttp://www.hindawi.com Volume 2014
CorrosionInternational Journal of
Hindawi Publishing Corporationhttp://www.hindawi.com Volume 2014
Polymer ScienceInternational Journal of
Hindawi Publishing Corporationhttp://www.hindawi.com Volume 2014
Hindawi Publishing Corporationhttp://www.hindawi.com Volume 2014
CeramicsJournal of
Hindawi Publishing Corporationhttp://www.hindawi.com Volume 2014
CompositesJournal of
NanoparticlesJournal of
Hindawi Publishing Corporationhttp://www.hindawi.com Volume 2014
Hindawi Publishing Corporationhttp://www.hindawi.com Volume 2014
International Journal of
Biomaterials
Hindawi Publishing Corporationhttp://www.hindawi.com Volume 2014
NanoscienceJournal of
TextilesHindawi Publishing Corporation http://www.hindawi.com Volume 2014
Journal of
NanotechnologyHindawi Publishing Corporationhttp://www.hindawi.com Volume 2014
Journal of
CrystallographyJournal of
Hindawi Publishing Corporationhttp://www.hindawi.com Volume 2014
The Scientific World JournalHindawi Publishing Corporation http://www.hindawi.com Volume 2014
Hindawi Publishing Corporationhttp://www.hindawi.com Volume 2014
CoatingsJournal of
Advances in
Materials Science and EngineeringHindawi Publishing Corporationhttp://www.hindawi.com Volume 2014
Smart Materials Research
Hindawi Publishing Corporationhttp://www.hindawi.com Volume 2014
Hindawi Publishing Corporationhttp://www.hindawi.com Volume 2014
MetallurgyJournal of
Hindawi Publishing Corporationhttp://www.hindawi.com Volume 2014
BioMed Research International
MaterialsJournal of
Hindawi Publishing Corporationhttp://www.hindawi.com Volume 2014
Nano
materials
Hindawi Publishing Corporationhttp://www.hindawi.com Volume 2014
Journal ofNanomaterials