Embed Size (px)
Citation preview

Research ArticleECG Sensor Verification System with Mean-IntervalAlgorithm for Handling Sport Issue
Kuo-Kun Tseng1 Fufu Zeng1 W H Ip2 and C H Wu2
1Harbin Institute of Technology Shenzhen Graduate School Shenzhen 518055 China2Department of Industrial and Systems Engineering The Hong Kong Polytechnic University Hung Hom Kowloon Hong Kong
Correspondence should be addressed to W H Ip whippolyueduhk
Received 15 December 2015 Accepted 28 March 2016
Academic Editor Parham Aarabi
Copyright copy 2016 Kuo-Kun Tseng et alThis is an open access article distributed under the Creative CommonsAttribution Licensewhich permits unrestricted use distribution and reproduction in any medium provided the original work is properly cited
With the development of biometric verification we proposed a new algorithm and personal mobile sensor card system for ECGverification The proposed new mean-interval approach can identify the user quickly with high accuracy and consumes a smallamount of flash memory in the microprocessor The new framework of the mobile card system makes ECG verification becomea feasible application to overcome the issues of a centralized database For a fair and comprehensive evaluation the experimentalresults have been tested on public MIT-BIH ECG databases and our circuit system they confirm that the proposed scheme is ableto provide excellent accuracy and low complexity Moreover we also proposed a multiple-state solution to handle the heat ratechanges of sports problem It should be the first to address the issue of sports in ECG verification
1 Introduction
Electrocardiography (ECG) was discovered at the end of the19th century It is the electronic activity of the human heartand became a very significant tool for the recognition of ahealthy heart A common ECG cycle is composed of fivepoints P Q R S and T in other words one cycle is composedof P waves QRS complexes and T waves Throughout thewhole 20th centurymuch attentionwas paid to the detectionanalysis and classification of ECG [1ndash12] Based on pastworks on ECG such as the filtering [9] QRS and R detection[6 10 12] compression of the ECG signal and analysis [2 45] and especially on automatic disease classification [1 3 8]recognition and identification systems based on ECG arebecoming more and more practical
With the development of biometric identificationverifica-tion technology features such as fingerprint face iris palmprint vein DNA and voice are used as the biological char-acteristics Over the past ten years the electrocardiogram asa new biological characteristic is being popularly researchedTraditional biological characteristics can easily be capturedand copied and furthermore most of them are visual yourfingerprint can be obtained easily and voice can also be
recorded thus reducing the security of biometric identifica-tion systems But electrocardiogram records the change inthe voltage of the heart and is also a sign of life so it can beused to detect vitality The counterfeiting of ECGs is difficultand that and the vitality feature are the two advantages ofthe electrocardiogram over other biological characteristicsSo the ECG has a fair unique biological characteristic youcan use it alone or in cooperation with other biologicalcharacteristics
In 2001 Biel et al first proved that the electrocardio-graph can be used in person identification They extractedten features from one ECG cycle and then used principlecomponent analysis (PCA) to identify 20 individuals [13]From then on many identification algorithms based onECG have been developed including template matchingand distance classification methods which used templatematching as the prescreen and distance classification as thedistance algorithm to identify 50 persons obtaining a 100identification rate [14] template matching andmean distancemeasure which extracted PR RQ RS RT PS TS PQ and TQamplitudes as the feature using template matching with thecorrelation coefficient and mean distance measure on a sam-ple of ten individuals from the MIT-BIH database obtaining
Hindawi Publishing CorporationJournal of SensorsVolume 2016 Article ID 1814264 12 pageshttpdxdoiorg10115520161814264
2 Journal of Sensors
a 99 accuracy rate [15] wavelet where ECG data was col-lected from 50 individuals and the wavelet distance measureused with a classification accuracy of 89 [16] polynomialdistancemeasurement (PDM) a fast and less template storagealgorithm used to experiment on a population size of 15achieving a high accuracy rate (up to 100) [17] independentcomponent analysis (ICA) where wavelet transform (WT)and independent component analysis (ICA) methods wereused to extract morphological features that can identify aperson better and the method was implemented on threepublic ECG databases namely the MIT-BIH ArrhythmiasDatabase MIT-BIH Normal Sinus Rhythm Database andLong-Term ST Database taking the two-lead ECG signalsinto account and obtaining a recognition rate of 996withinrank-1 [18] Matching Pursuit (MP) and Support VectorMachine (SVM) using SVM to identify over 20 subjects andachieving a performance of 953 [19] decision-based neuralnetwork (DBNN) combining the two methods of templatematching and decision-based neural networks producing100 precision on a group of 20 subjects from the MIT-BIHDatabase extracting seven features (RQ RS ST amplitudeQSQTduration RS slopeQRS triangle area) based onQRSTpoints [20] and some statistical methods like frequency andrank order [21] and statistical tests (such as the 119885-test 119905-testand 120594
2-test) [22] and so onFrom the above statement we know that extracting
features is very important program for almost all of theabove algorithms and that the template matching algorithmis commonly used In fact most of these algorithms use thetemplate matching algorithm as a prescreen method Thesealgorithms can be divided into two kinds fiducial algorithmswhich need to detect the fiducial points (like PQRST) andextract some useful features at the beginning and nonfiducialalgorithms which contain statistical methods or some trans-form methods (wavelet etc) For the fiducial algorithm thebasis is finding steady and typical features These features arebased on the PQRST points including amplitude segmentinterval slope area derivative value and other values definedby the user Furthermore the feature must have scalability inorder to characterise a large population and stability over longtime intervals [23] for nonfiducial algorithms somemethodsare used to redefine and evaluate the whole ECG wave forexample the underlying pattern of the ECG
The development ECG hardware is not as fast as thesoftwareThe first report on ECG appeared in 1875 by RichardCaton And the first human electrocardiogramwas publishedby the British physiologist AugustusDWaller in 1887 In 1895Willem Einthoven improved the electrometer and definedthe main elements (P Q R S T) of the ECG The 2Delectrocardiogram (VCG) was unveiled in 1956 by Frank In1989 3D-ECG technology was invented Now in most ofhospitals the 12-leads method and the 5-leads are used forcapturing the 1DECG signal [24] Improving the sensitivity ofthe electrodes and increasing the comfort of themeasurementof the ECG are the hot topics of ECG measurement infuture research For example ECG can be measured withoutcontacts [25] or wirelessly [26] For the hardware of theapplication for identification based on the ECG convenienceand accuracy are very important factors
Averageten R-Rs
Correlation coefficient
Identificationresult
Find R points
Training
ECG signal
Preprocess
IdentifyObtain oneR-R cycle
Mean cycle(model)
Figure 1 Flow of mean-interval algorithm
There have been many good algorithms for ECG iden-tificationverification but none has a simple and practicalsolution to implement ECG identificationverification ona microprocessor So we propose one called the mean-interval ECG verification system In this verification systema mean-interval (MI) calculated from ten R-R intervals isstored in advance in the flash memory of a microprocessorThe hardware circuit of the ECG capture uses two contactsmethods (left hand and right hand) Our goal is to developan ECG verification card
The verification algorithm of the system will be detailedin Section 2 The circuit system design is found in Section 3Three other algorithms compared with our algorithm areshown in Section 4 The comparison experiments betweenour algorithm and three other algorithms are implemented inSection 5 which also presents the real implementation resultsfor our system Section 6 states the conclusions
2 Algorithm Design
21 Flow of the Algorithm The system of the solution com-bines hardware architecture and a verification algorithm torealise personal verification based on an ECG signal Firstthe ECG signal is captured by the hardware then R pointsare found in the signal and finally ten R-R intervals are cutfrom the ECG signal to be averaged into one mean cycle Forone person in the training stage the mean cycle is calculatedand stored in the flash memory of a microprocessor In theverifying stage one R-R interval is captured from the inputsignal and compared with the stored mean cycle (using thecorrelation coefficient) if the compared result is greater than085 a successful verification is made otherwise it fails Thegraph of this flow is shown in Figure 1
Journal of Sensors 3
0
0
1000 2000 3000 4000 5000 6000 7000 8000 9000 10000
200
150
100
50
minus50
minus100
(a) Twenty seconds of raw ECG data0 500 1000 1500 2000 2500
160
140
120
100
80
60
40
20
0
minus20
minus40
(b) Five seconds of filtered ECG data
Pow
er
Frequency (Hz)0 50 100 150 200 250 300 350 400 450 500
times105
14
12
10
8
6
4
2
0
(c) Frequency response of the raw ECG data
Pow
er
Frequency (Hz)0 50 100 150 200 250 300 350 400 450 500
times105
3
25
2
15
1
05
0
(d) Frequency response of the filtered ECG data
Figure 2 Preprocessing of the ECG signal
22 Preprocessing of the ECG Signal Various noises [27] existin the ECG signal such as the power frequency baseline drifthand motion on the contactor electrode contact noise andexpansion degree of the muscles These noises are classifiedas high frequency and low frequency The high frequencynoises are mainly in the power frequency of 50Hz andthe low frequency ones mainly include the baseline driftof 006Hz caused by breath Since ECG verification is notdoing diagnosis we do not need to do a radical noisefiltering to normalize and regularize ECG signals From ourexperiment and experience some noises might represent theuserrsquos features Therefore we only filtered out the noises ofhigh-frequency power and low frequency baseline drift
Raw ECG data sampled from our verification card isshown in Figure 2(a)The sample rate is 500Hz Its frequencyresponse is shown in Figure 2(c) and we can see that thepower of the 006Hz and 50Hz frequencies shows a sym-metry frequency distribution A low-pass filter and a high-pass filter are applied to filter the two main noises leaving
a remaining frequency of 11 Hzsim30Hz Figure 2(b) showsthe filtered ECG data and their corresponding frequencyresponse is shown in Figure 2(d) after removing the noisesof 06Hz and 50Hz In the microprocessor we design a 17-tap low-pass FIR filter with passband upper frequency of6Hz and stopband lower frequency of 30Hz and a 17-taphigh-pass FIR filter with a corner frequency of 2Hz Thefilter coefficients of the two filters are calculated using theMATLAB Signal Processing Toolbox
After filtering of the raw ECG signal one next importantstep in preprocessing is QRS detection or R detection Thereare many ways of QRS detection based on derivative anddigital filters wavelets neural networks adaptive filters andso forth [28] The Pan-Tompkins real-time QRS detectionalgorithm [29] is used in our systemTheRpoint (red circle inthe figure) detection is shown in Figure 3 The other fiducialpoints (Q S and T) can be detected near the R point TheQ may be the lowest point before the R point within a smallrange
4 Journal of Sensors
0 500 1000 1500 2000 2500minus40
minus20
160
140
120
100
80
60
40
20
0
Figure 3 R detection of five seconds ECG
23 Mean-Interval Method We designed an experiment fortesting the number of cycles used to obtain themean-intervalin the ECG verification model to achieve a good recognitionresult with a low complexity of calculation So this test takes1 to 10 cycles of ECG data into account and is implementedon the MIT-BIH Normal Sinus Rhythm Database with 18healthy individuals
In preparing the data for the experimentation stage 100cycles are filtered out from every person There are 60 to 100heartbeats in one minute in common in other words there isat least one ECG cycle in one second Therefore we roughlyuse this range 06 times sample rate to filter the input ECG signaland obtain 100 ECG cycles whose length is within the lengthrange of each person Of course the R point must first beextracted from the ECG data and then you can measure thelength of the R-R interval and decide whether to use it or not(not in the length range)
In the mean-interval method there are 119899 normal R-Rintervals of one person like 119878
1 1198782 1198783 119878
119899 How to ldquoaveragerdquo
and get the ldquomean-intervalrdquo is as follows(1) Calculate the average length of the 119899 R-R intervals
120583 =(10038161003816100381610038161198781
1003816100381610038161003816 +10038161003816100381610038161198782
1003816100381610038161003816 +10038161003816100381610038161198783
1003816100381610038161003816 + sdot sdot sdot +1003816100381610038161003816119878119899
1003816100381610038161003816)
119899 (1)
In (1) |119878119894| means the length of the R-R interval 119878
119894
(2) Stretch every R-R interval to make its length equal to120583 using the 119894th R-R interval as an example
If |119878119894| gt 120583 you should compress it deleting one sample
point at 120588 intervals
120588 = lfloor
10038161003816100381610038161198781198941003816100381610038161003816
(1003816100381610038161003816119878119894
1003816100381610038161003816 minus 120583)+ 1rfloor (2)
If120583 gt |119878119894| you should stretch it inserting one sample point
with a value 120593 between 119886 and 119887 at 120588 intervals
120593 =(119886 + 119887)
2
120588 = lfloor
10038161003816100381610038161198781198941003816100381610038161003816
(120583 minus1003816100381610038161003816119878119894
1003816100381610038161003816)+ 1rfloor
(3)
A =
[[[[[[[[[[[[[[[[[[
12057211120572121205721n12057291120572921205729n
]]]]]]]]]]]]]]]]]]
B =
[[[[[[[[[[[[[[[[[[
1205731
1205732
1205737
1205738
1205739
]]]]]]]]]]]]]]]]]]
50bpm
60bpm
70bpm
110 bpm120 bpm
130bpm
1205733
Figure 4 Calculation of the multiple-status
Supposing 120572 = min(|1198781| |1198782| |1198783| |119878
119899|) and 120573 =
max(|1198781| |1198782| |1198783| |119878
119899|) the method of the R-R length
filter makes sure that 2120572 ge 120573 in other words there is just onecompress or stretch implementation in the second step
(3) Average the 119899 normal R-R interval into one ldquomean-intervalrdquo 119883 with the length 120583
119883119894=
(1198781119894
+ 1198782119894
+ 1198783119894
+ sdot sdot sdot + 119878119899119894)
119899 (4)
The 1198781119894
equals the 119894th sample point of the 1st R-Rinterval and so on For ECG verification using the mean-interval method mentioned above to obtain one averaged R-R interval under a fixed heartbeat rate as the model in thetraining step is called single-status MI algorithm which onlyconsiders the R-R interval within one certain heartbeat rateBut we know that the heart rate of one person will decreaseslowly from 125 bpm to 60 bpm after playing sport The waveof the ECG is stretched along with the change in the rate ofthe heartbeat Soweuse amultiple-statusMI algorithmwhichconsiders the R-R intervals of 50sim125 bpm heartbeat ratesSome programs are required to realise this
(1) Consider heartbeat rates from 50sim130 bpm and use10 bpm to segment them into 9 heartbeat rates (119867 =
[50 60 70 80 90 100 110 120 130]) because thereis just a slight change in the ECG for one personwhoseheartbeat rate wavers within 10 bpm
(2) Capture 119860 which contains 119899 R-R intervals whoselength is nearest to the fixed length of the R-R intervalof each heartbeat rate of 119867 If the sample rate of theraw data is 120588 then the length of the R-R interval ofevery heartbeat rate of 119867 is expressed by
Hl = 119867 sdot120588
60 (5)
(3) In 119860 for every heartbeat rate of 119867 the averaged R-R interval is calculated from its 119899 R-R intervals Thisprocess is shown in Figure 4 The 120572
119894119895presents the 119895th
R-R interval of119867(119894) of one person and120573119894is themean-
interval of 1205721198941 1205721198942 1205721198943 120572
119894119899119861 denotes themultiple-
status of one person for ECG verification
Journal of Sensors 5
Average Average
middot middot middot
middot middot middot
middot middot middot
1 2 3 4 5
1 2 3 4 5
100
100
Model 1 Model 2
Figure 5 Diagram of starting mean-interval method (SMI)
24 Mean Cycle Model There are two mean-interval modelsstarting with the averaging (SMI model) and ending withthe mean-interval model (EMI model) In the SMI model119899 R-R intervals are averaged to obtain one averaged R-Rinterval (called themean cycle) then the verification distancebetween the comparing R-R interval and mean cycle iscalculated In contrast for the EMI model the verificationdistances between the 119899 R-R intervals and the comparingR-R interval are first calculated and then the 119899 verificationdistance values are averaged to obtain the final distance
So there are two questions one is how many 119899 shouldbe set and the other is which averaging model is better forverification We designed an experiment based on the above18 times 100 R-R intervals (there are 18 persons with 100 filteredR-R intervals) and used the crossingmethodWe use the SMImodel as an example and use 119899 = 3 so 100 R-R intervalswill generate 33 mean cycles Each cycle is compared withthe mean cycle and then a 33 times 100 matrix will be obtainedFigure 5 shows the diagram of the SMI model In Figure 5we can see that there are three layers the first layer and thethird layer denote the 100 R-R intervals and the second layerrepresents the 33 mean cycles (called the model) Throughaveraging the first layer becomes the second layer and thena correlation coefficient value is calculated between eachcycle of the third layer and every model of the second layerFigure 6 shows the diagram of the EMImodelThere are fourlayers in Figure 6 the first layer and second layer denote theone hundred cycles of one person and every three elementsof the third layer with three values (termed CC
1CC2CC3)
are the correlation coefficient values between one cycle of thesecond layer and 119899 = 3 cycles of the first layer The 119872
119894in the
fourth layer is the average value of every three values in thethird layer
Suppose that there is a database which contains 119872
cycles with the same length 119871 of one person If the startingmean-interval method using 119899 R-R intervals as the referencesegment is applied to this database (6) and (7) can describethe program of the experiment method of the algorithm Inthese formulas 119889[119894] represents the 119894th R-R interval ECG dataof one person and 119889[119894][119895] indicates the 119895th value of the 119894thR-R interval That is an averaged value is calculated fromthe 119899 corresponding points of the 119899 intervals chosen as thereference segment before averaging and the chosen 119899 R-R
100
M1 M2
middot middot middot
middot middot middot
middot middot middot
middot middot middot
1 2 3 4 5 100
1 2
CC1 CC2 CC1 CC2CC3 CC3
AverageAverage
Figure 6 Diagram of ending mean-interval method (EMI)
intervals must be interpolated into the same length 119871 (6)shows this function So 119872 cycles will have lfloor119872119899rfloor referencecycles and themean-interval (MI) as amodel that comes fromit In (7) there is a correlation coefficient between 119872 cyclesand the lfloor119872119899rfloor mean-intervals which come from the meanof the lfloor119872119899rfloor reference segments Finally calculate the meanvalue of all correlation coefficient values named the distance
mean cycle [119894] [119895] =
119871
sum
119895=1
sum119899
119896=1119889 [(119894 minus 1) times 119899 + 119896] [119895]
119899(6)
distance
=
sumlfloor119872119899rfloor
119894=1sum119872
119895=1corrcoef (119889 [119895] mean cycle [119894])
lfloor119872119899rfloor times 119872
(7)
The function corrcoef (correlation coefficient represent-ing the similar relationship between two waves) is expressedby
119903119883119884
=
sum119873
119894=1(119883119894minus 119883) (119884
119894minus 119884)
radicsum119873
119894=1(119883119894minus 119883)2
sum119873
119894=1(119884119894minus 119884)2
(8)
For 18 individuals we obtain a 18 times 33 times 100 value matrixby averaging the 33 times 100 submatrix and obtaining 18 meandistances of self-comparison for every person such as thecomparison of one individualrsquos data against their remainingdata it takes the 119899 (= 1sim10) cycles as the reference segmentinto account we finally obtain a 10 times 18 distance matrix Themean values of the 18 distances are shown in Figures 7 and8 within SMI and EMI methods The horizontal axis denotesthe cycle and the vertical axis denotes the distance generatedby (2)
In Figure 7 as 119899 increases the value of the mean corre-lation coefficient (MIC) also increases In particular whenthe cycle number is greater than 2 the value of the meancorrelation coefficient is higher than 09 But in Figure 8when the cycle number increases the trend of the value ofMIC is down obviously the MIC does not exceed 09
From the above comparison between Figures 7 and 8it can be seen that the starting mean-interval model (SMI
6 Journal of Sensors
1 2 3 4 5 6 7 8 109087
088
089
09
091
092
093
094M
ean
corr
elat
ion
coeffi
cien
t(M
CC)
Cycle number (n)
Figure 7 Comparison result of starting mean-interval method
087088089
09091092093094
Mea
n co
rrel
atio
n co
effici
ent
(MCC
)
1 2 3 4 5 6 7 8 109Cycle number (n)
Figure 8 Comparison result of ending mean-interval method
model) is better than the ending mean-interval model (EMImodel) in the self-comparison in another test the resultsfrom the comparison of others are the same as those forself-comparison From Figure 7 we can see that there is anacceptable verification result for self-comparison when 119899 isabove 3
3 Circuit System Design
The hardware architecture of this system contains two partsa verification card and door control In Figure 9 the leftpart of the top section is the verification part there are two-hand contacting dots on the card for the introduction ofLead I of the ECG Its overall size is slightly smaller thanthat of a common bank card and the other side of the topsection is the door control part This includes the controllerwhich is a ZigBee module just for receiving the signal and adoor whose lock is connected to the controller In the lowersection of Figure 9 there are two images corresponding to theabove section As a connection interface the wireless ZigBeemodule provides simple low data traffic but a security bridgeis required between the verification card part and the doorcontrol part
31 Verification Card Part Themain function of the verifica-tion part is to capture the ECG signal from the human filterand extract features for verification and perform verificationand the translation of the verification results by the ZigBeemodule
MSP430
Touchspot I
Touchspot II
Instrumentamplifier
ZigBee
Cloc
kCl
ock
Antenna
Battery
Battery
Ant
enna
ZigBee
Cloc
k
Electricrelay
Door
Reset button
Figure 9 Hardware architecture of ECG verification system
In the verification part the MSP430 is chosen as themicroprocessor since it has an ultra-low power consumptionfeature and internal operational amplifier whichmust be usedin the amplification of the ECG signal Combined with theZigBee module a network is created between the ECG veri-fication card and the door connected to the ZigBee modulefor receiving the control command An amplifier is used foraccurately capturing the ECG signal from two hands and canbe disabled by the microprocessor further saving energy
How Is the Electrocardiogram Signal Captured There aremany hardware circuits designed for the capture of ECGsignals The common medical measurement of ECG signalincludes 12-leads and 5-leads Another specialist method isthe 1-lead it is a subset of the above two methods capturingthe ECG signal from the left and right hands We can see thatthe 1-lead is sufficient enough [13] and convenient for ECGverification So we chose this measurement method for oursolution
Two steps must be taken for the 1-lead method thefirst step captures the voltage difference which is the weakelectrical signal from the heart and the second step amplifiesthat weak front signal hundreds of times for the AD functionmodule Figure 10 shows the relationship of these functionblocks A low-pass filter or high-pass filter circuit can be setbetween the ldquoOPrdquo block and ldquoADrdquo block to filter the noiseWe implement this in the microprocessor by incorporating asoftware filter
In the first step in order to capture the ECG signalavailably and accurately the circuit is designed by consideringsome important factors
Journal of Sensors 7
Elec-trodes Pr
e-am
plifi
erOperational
amplifier DAC
Step 1 Step 2
Figure 10 Functional blocks of ECG measurement
(1) The real ECG signal is an mV signal so it must bemagnified about 1000 times A high gain circuit isrequired
(2) The ECG signal is translated from the heart to thehand and the body has high resistance To overcomethis problem the circuit should have a high inputimpedance feature
(3) Because there are various noises especially common-mode interference coming from the movement ofthe hand temperature and interference from othernearby electrical equipment which influences themeasurement of the ECG
(4) The heart rate of a human is 60sim100 times perminute and the frequency of the ECG signal mainlyconcentrates around 025sim35Hz The low-pass filtercan be operated by the hardware circuit or softwarefilter In our system the low-pass filter is implementedby the software
Taking these factors into account the instrument ampli-fier with a high CMMR (should gt80 dB) is chosen as thefront-end amplifier A typical circuit graph of the instrumentamplifier is shown in Figure 11 Its gain can be calculated by(9) Here 119866 = 5
119866 = (1 +21198771
119877119892
)(
119877119891
1198773
) (9)
In the second step we know that the weak ECG signalshould be magnified by about 1000 times and magnify 5times in the front-end amplifier so in current step further200 times are required The operational amplifier is usedto achieve this Because the MSP430 microprocessor itselfhas several operational amplifiers the second step is imple-mented within it And the final amplified ECG signal is inputinto its AD function module in order to sample data
32 Door Control Part The door control part with theZigBee module receives the control command from theverification part and controls the door obeying the commandThe command set just contains the opening and closing of thedoor lock
The connection security between the verification cardpart and door control part is mature and the hardwareencryption technology of the ZigBee is provided in theirproducts
R1
Rg
R2
R3
R4
Rf
R5
Vout
+
+
+
minus
minus
minus
V1
V2
A1
A2
A3
Figure 11 Typical circuit of instrument amplifier
0
0
500 1000 1500 2000 2500
160
140
120
100
80
60
40
20
minus20
minus40
Figure 12 Difference of 119899 (cycle number) and 119872 (sample cyclenumber) 119872 = 5 and 119899 = 6
4 Compared Algorithms
Four ECG verification algorithms are compared in thisexperiment with the same database and comparisonmethodThe four verification algorithms are listed below
41 Mean-Interval From Section 2 we know that the SMImodel is better than the EMI model and while the cycle isincreased the comparison of the results for self-comparisonslowly improves So we use the SMImodel and choose 119899 = 10
to achieve person verification In fact we use sample cycle(119872) to improve 119899 for practical applications The value ofsample cycle is fixed but 119899 is based on the number of realR-R intervals existing in the current 119872 cycles That is 119899 R-R intervals of 119872 cycles of ECG data are averaged to onemean cycle as the reference cycle For equality we set 119872 =
10 (every 119872 sample cycles) and 119899 R-R intervals from eachsample cycles Supposing a sample rate of 500Hz and119872 = 5Figure 12 shows the result of 119899 Because 6 R-R intervals existwithin the 2500 (= 119872 times sample rate) sample points 119899 = 6
42 Wavelet Wavelet analysis or wavelet transformation isthe finite or rapid attenuation of oscillation waveform signals
8 Journal of Sensors
140
120
100
80
60
40
20
minus20
minus400
0
50 100 150 200 250 300 350 400
R-R interval
4385
Figure 13 Segmentation method in R-R interval
which is called themother waveletThewaveform is zoomingand panning tomatch the input signalWavelet transformhasgood location on the timeline and fast calculation
There are many different wavelet transforms such asContinuous Wavelet Transforms (CWT) Discrete WaveletTransforms (DWT) Fast Wavelet Transform (FWT) andWavelet Packets Decomposition (WPD) and each of them issuited to different applications
Themother wavelet120595119895119896
(119905) expansion and transformationcan be expressed as in formula
120595119895119896
(119905) =1
radic119896
[119905 minus 120591
119896] (10)
In (10) 119896 is a scale coefficient and 120591 defines the shiftcoefficient The wavelet coefficient equation and inversetransform formulae are as follows
119862119895119896
= int
infin
minusinfin
119891 (119905) 120595119895119896
(119905) 119889119905
119891 (119905) = sum119862119895119896
120595119895119896
(11)
The approach of achieving ECG verification uses Wavelettransform processing [16] for our comparison and firstperformsR detection for ECGWavelet analysis to obtain eachR-R cardiac interval After that it performs a cutting methodon the R-R intervals to conduct R-R width adjustment to fita single new cycle with 128 points The cutting method for aR-R interval cuts 85 points from the beginning of the intervaland 43 points from the end of the interval This is shown inFigure 13 Then 4 R-R intervals are cut into four new cycleswith 512 points Finally it applies the Wavelet transform formultiple layers processing to obtain the Wavelet coefficientswhich is a new sequence of wavelet coefficients as given in
1198831015840= 119886119899+ 119889119899+ 119889119899minus1
+ sdot sdot sdot + 1198891 (12)
If 1198831015840 and 119884
1015840 are two different Wavelet coefficientsverification can be estimated by a suitable distance formula119889(1198831015840 1198841015840)
In practice 10 layersrsquo processing of theWavelet transformis implemented on 512 sample points sampled from 4 R-R
intervals by the segmentationmethod At last the verificationbases on the Euclidean distance as the distance formulashown in
119889 (119883 119884) = radic
119899
sum
119894=1
(119883119894minus 119884119894)2
(13)
43 Waveform Waveform-based algorithms are a represen-tation of the ECG waveform feature and these features areused for verification Since a statistical approach is used toobtain these waveform features sometimes they are alsocalled statistical algorithms in other literatures
Their general operational procedure is as follows Firstlyafter ECG-collection high- and low-pass filtering are used forearly preprocessing then variousmethods are used to extractthe characteristic points of these waveforms such as points PQ R S and T among the ECG signals On the basis of theirfeatures relative representations are extracted to composeproper individual features such as amplitude duration andslope and area The extraction of feature points and valuesis shown in Figure 14 There are four kinds of verificationfeature
(1) Amplitude PQ RQ TQ RT PS RP TS RS PT QS(2) Duration QS PR QR ST QT(3) Slope RS ST and QR(4) Area QRS triangle area
After obtaining some waveform features for the individ-ual differences a similarity algorithm is applied to evaluatethe differences between two individuals
44 Reduced Binary Pattern This algorithm uses the fre-quency and rank order statistics of the underlying patternof the input ECG data [30] Such data exists in serial 119878 =
1199041 1199042 1199043 119904
119899 consider
119883119894=
1 119904119894+1
gt 119904119894
0 119904119894+1
le 119904119894
(14)
So through (14) 119878 is translated to 119883 containing 01 bitand 119899minus1 in length From the first number in119883 119898 sequentialnumbers compose an 119898-bit-word number Then by shiftingone by one finally a new serial 119884 of 119899 minus119898 in length is createdfrom 119883 And the value of the number in 119884 is between 1sim
2119898minus1 Then the frequency and rank order statistic method isimplemented on 119884
5 Experiment
We have introduced four algorithms used for verification inSection 4 In the current section an experiment is designedto conduct a comparison between the four algorithms Forequality a cross comparison method is applied to the exper-iments Meanwhile for completeness two public MIT-BIHECGdatabasesMIT-BIHArrhythmia andNormalDatabaseare adopted as input data for the experiments
Journal of Sensors 9
T
QRStriangle
area
Q
P
S
RQamplitude
RPamplitude
PQamplitude
PSamplitude
RSamplitude
RTamplitude
TPamplitude
QSamplitude
TSamplitude TQ
amplitude
STduration
QSduration
QRduration
QTduration
PRduration R
RQ slope RS
slope
STslope
Figure 14 Extracted features from one cycle
51 Experiment Data Two ECG databases are used in ourexperiment
(1) MIT-BIH Arrhythmia Database [31] the BIHArrhythmia Laboratory was built between 1975 and1979 The data selected is 48 groups within two-leadECG data recordings of half an hour a total of up to24 hours of ECG data It contains 47 personal ECGdata (201 groups and 202 groups of ECG data comingfrom the same person) the subjects are 25 men withages ranging from 32 to 89 years and 22 women withages from 23 to 89 years in which close to 60 of the47 subjects are hospitalised patients
(2) MIT-BIH Normal Sinus Rhythm Database [32] thisdatabase contains 18 long-termECG recordings thesepeople are found to have no significant arrhythmiasThe subjects include 5 men aged 26 to 45 and 13women aged 20 to 50 The ECG signal sampling rateis 128HzThe data storage format for 12 bits of binaryrepresentation is known as ldquo212rdquo format in whichthere is a sign bit
From the above descriptionwe know there are 65 subjectsAccording to the data requirement of the experimentalmethod eight groups containing ten sample cycles (10seconds) of data are cut from each personUse 119878
119894119895(1 le 119894 le 65
1 le 119895 le 8) to represent the 119894th group of ECG data from the119895th person
52 Experimental Method This experiment uses the crosscomparison method if making a comparison with a cross
self-comparison should bemade between the 8 groups of datafrom one person if comparing with others conduct a mutualcomparison between the 8 groups of data from one personand the 8 groups from the other person We use the averagedistance to represent the final distance of the two individualsso a division will be operated after an addition of the 64distance values
The experimental method can be described as [14]
119863(119878119901 119878119902) =
1
119898119901sdot 119898119902
119898119901
sum
119894=1
119898119902
sum
119895=1
119889 (119878119901119894 119878119902119895) (15)
In formula (9) 119878119901119894and 119878119902119895denote respectively the 119894th 119895th
groups of data from 119901th and 119902th individuals (1 le 119901 119902 le 65
and 1 le 119894 119895 le 8) 119863(119878119901 119878119902) calculates the average distance
between the 119901th and 119902th person Furthermore the 119889(119878119901119894 119878119902119895)
works as the verification distance between the two groups ofECG dates by the verification algorithms
53 Experiment Result We apply the four verification algo-rithms and the experimental method to the two MIT-BIH databases mentioned above The mean-interval (MI)algorithm for example is implemented on the MIT-BIHArrhythmia Database for which a 47 times 47 resultsrsquo table isgenerated the comparison results of self-comparison lie onthe diagonal line of the table and the other cells of the tableidentify the value of comparison with others A section (8persons) of the results table is shown in Table 1
From Table 1 we can see that the value of the numberslying on the diagonal is larger than the others in the same
10 Journal of Sensors
Table 1 Comparison results of 8 people
Number 1 2 3 4 5 6 7 8Data file name 100dat 101dat 102dat 103dat 104dat 105dat 106dat 107dat1 100dat 0995739 0040959 0025142 0091299 minus015982 0011561 0014194 0024176
2 101dat 0042074 0991551 minus009187 005923 minus004554 minus00517 0016271 0120851
3 102dat 0021244 minus007092 0972407 minus015169 minus00293 0065066 minus003552 minus002223
4 103dat 0070864 0049626 minus014143 099771 minus008191 007528 0046861 0015396
5 104dat minus021247 minus006998 0009141 minus009159 094894 0041129 0006288 minus005862
6 105dat minus000549 minus006269 0060439 00534 0084114 0992397 0034648 minus006725
7 106dat 0043187 0066068 minus005331 0058882 minus004081 005672 0952014 minus005169
8 107dat 0009627 0149587 minus004291 0026265 minus006453 minus004472 minus004213 0984541
Table 2 The success rate of the four algorithms
Algorithm Success rateWavelet 957447RBP 95656Waveform 993351Mean-interval (MI) 100
row of the table and most of them are close to 099 It alsoproves that one person has a high similarity to themselvesIn contrast the value of the comparison with others is verysmall some even negative denoting a negative relationshipThe larger the gap between the values of the diagonal and theothers value the simpler it is to distinguish self-comparisonfrom the others Suppose that there is an error when a valuelying on the diagonal is smaller than the others that lie on thesame row Using this rule we can statistically determine thesuccess rate of the four algorithms Table 2 shows the successrate of the four algorithms
Table 2 shows that the success rates of all four algorithmsthat are greater than 95 and the mean-interval (MI)algorithm has the best success rate of 100 of all fouralgorithms So it is a useful and effective method for personalverification based on ECG But we must consider that themean-interval algorithm using the correlation coefficientwhich simply evaluates the similarity or the waviness of twowaves and disregards the specific valuesThis weak point willintroduce some issues of safety Even with that shortcomingthe MI algorithm is sufficient for our verification system
54 Sport Issue We know that there are big changes in theheart rate after the sport This will seriously disturb thepersonrsquos verification based on their ECG signal so the sportproblem is more important than the long-term problem inECG verification Figure 15 shows the electrocardiograms ofone person with different heart rates There are two mainchanges taking place one is that the baseline seriously shiftsdue to the deeper breaths taken after sport the other is thatthe heart rate of the person becomes higher due to acceleratedheart action
From the measurement of the ECG after sport the heartrate waves near a special number like 60 or 55 in the resting
Table 3 Sport verification results
MI algorithm FR FA AverageSingle-state 01407 02573 0398Multiple-state 00915 00750 01665
120110
100 90 7080 60bpm 50
Time
Am
plitu
de
1 51 101 151 201 251 301 351 401 451 501 551
Figure 15 R-R intervals of different heartbeat rates of one person
state and when you take exercise within 3 minutes the heartrate quickly increases to 100 within 5 minutes or more theheart rate slowly begins increasing to 120 finally it will standnear 125 There are 10 individuals including 1 female and 9males in the sport ECG database The FreeScale ECG boardis used to measure all subjects for five minutes in the restingstate and five minutes after hisher sport
To conquer the issue of the sport heart rate we use themultiple-state MI algorithm We use resting and sportrsquos datato train the system and then test it with the only the sportdata For comparison the single-state MI algorithm is alsoimplemented on this sport ECG database Table 3 shows theverification results of the two algorithms The multiple-stateMI has much better performance than the original single-state algorithms
6 Conclusions
Wehave proposed a new algorithm andmobile circuit systemfor ECG verification An effective verification algorithm isimplemented on this system providing a feasible applicationThe hardware is designed for consideration of low powerconsumption and the convenience of a wireless network Wedesigned an operational solution to overcome the issue ofECG verification In the evaluation the accuracy of the MI
Journal of Sensors 11
algorithm is better than in previous algorithms Next we alsoproposed amultiple-stateMI algorithm to handle the issue ofthe heart rate after sport In the evaluation it truly presentsbetter performance than the original MI with 2315 forsport testing Finally if the sport issue can be resolved forECG verification it might also be a feasible tool for biometricverification systems
Competing Interests
The authors have no competing interests to declare
Acknowledgments
The work described in this paper was partially supportedby a grant from the Research Grants Council of theHong Kong Special Administrative Region China (PolyU15210815E) This work is also partially supported by theResearch Committee and the Department of ISE of the HongKong Polytechnic University (G-UB97) the Department ofComputer Science Shenzhen Graduate School of HarbinInstitute of Technology and Shenzhen Technology Project(JCY2015051706567)
References
[1] N Maglaveras T Stamkopoulos K Diamantaras C Pappasand M Strintzis ldquoECG pattern recognition and classificationusing non-linear transformations and neural networks Areviewrdquo International Journal of Medical Informatics vol 52 no1-3 pp 191ndash208 1998
[2] H Zhang and L-Q Zhang ldquoECG analysis based on PCA andsupport vector machinesrdquo in Proceedings of the InternationalConference on Neural Networks and Brain Proceedings (ICNNBrsquo05) pp 743ndash747 Beijing China October 2005
[3] H Blackburn A Keys E Simonson P Rautaharju and SPunsar ldquoThe electrocardiogram in population studies A clas-sification systemrdquo Circulation vol 21 pp 1160ndash1175 1960
[4] D P Golden R A Wolthuis and G W Hoffler ldquoA spectralanalysis of the normal resting electrocardiogramrdquo IEEE Trans-actions on Biomedical Engineering vol 20 no 5 pp 366ndash3721973
[5] M Kobayashi and T Musha ldquo1f Fluctuation of heartbeatperiodrdquo IEEE Transactions on Biomedical Engineering vol 29no 6 pp 456ndash457 1982
[6] N V Thakor J G Webster and W J Tompkins ldquoEstimation ofQRS complex power spectra for design of a QRS filterrdquo IEEETransactions on Biomedical Engineering vol 31 no 11 pp 702ndash706 1984
[7] N V Thakor and Y-S Zhu ldquoApplications of adaptive filteringto ECG analysis noise cancellation and arrhythmia detectionrdquoIEEE Transactions on Biomedical Engineering vol 38 no 8 pp785ndash794 1991
[8] Y H Hu W J Tompkins and J L Urrusti ldquoApplicationsof artificial neural networks for ECG signal detection andclassificationrdquo Journal of Electrocardiology vol 26 pp 66ndash731993
[9] V F Kravchenko andA Y Popov ldquoDigital filters in human ECGprocessing and analysisrdquoMeasurement Techniques vol 37 no 2pp 220ndash223 1994
[10] G G Berntson JThomas Bigger Jr D L Eckberg et al ldquoHeartrate variability origins methods and interpretive caveatsrdquoPsychophysiology vol 34 no 6 pp 623ndash648 1997
[11] I J Rampil ldquoA primer for EEG signal processing in anesthesiardquoAnesthesiology vol 89 no 4 pp 980ndash1002 1998
[12] V X Afonso W J Tompkins T Q Nguyen and S LuoldquoECG beat detection using filter banksrdquo IEEE Transactions onBiomedical Engineering vol 46 no 2 pp 192ndash202 1999
[13] L Biel O Pettersson L Philipson and P Wide ldquoECG analysisa new approach in human identificationrdquo IEEE Transactions onInstrumentation and Measurement vol 50 no 3 pp 808ndash8122001
[14] T W Shen W J Tompkins and Y H Hu ldquoImplementationof a one-lead ECG human identification system on a normalpopulationrdquo Journal of Engineering and Computer Innovationsvol 2 pp 12ndash21 2011
[15] P Sasikala and R S DWahidabanu ldquoIdentification of individu-als using electrocardiogramrdquo International Journal of ComputerScience and Network Security vol 10 pp 147ndash153 2010
[16] A D C Chan M M Hamdy A Badre and V BadeeldquoWavelet distance measure for person identification usingelectrocardiogramsrdquo IEEE Transactions on Instrumentation andMeasurement vol 57 no 2 pp 248ndash253 2008
[17] F Sufi I Khalil and I Habib ldquoPolynomial distance measure-ment for ECG based biometric authenticationrdquo Security andCommunication Networks vol 3 no 4 pp 303ndash319 2010
[18] C Ye M T Coimbra and B V K V Kumar ldquoInvestigation ofhuman identification using two-lead electrocardiogram (ECG)signalsrdquo in Proceedings of the 4th IEEE International Conferenceon Biometrics Theory Applications and Systems (BTAS rsquo10) pp1ndash8 Washington DC USA September 2010
[19] Z D Zhao and L Yang ldquoECG identification based onmatchingpursuitrdquo in Proceedings of the 4th International Conference onBiomedical Engineering and Informatics (BMEI rsquo11) vol 2 pp721ndash724 Shanghai China October 2011
[20] T W Shen W J Tompkins and Y H Hu ldquoOne-leadECG for identity verificationrdquo in Proceedings of the 2ndJoint EMBSBMES Conference Engineering in Medicine andBiologymdash24th Annual Conference and the Annual Fall Meetingof the Biomedical Engineering Society vol 1 pp 62ndash63 HoustonTex USA October 2002
[21] A C-C Yang S-S Hseu H-W Yien A L Goldberger andC-K Peng ldquoLinguistic analysis of the human heartbeat usingfrequency and rank order statisticsrdquo Physical Review Letters vol90 no 10 2003
[22] C Hegde H R Prabhu D S Sagar P Deepa Shenoy K RVenugopal and L M Patnaik ldquoStatistical analysis for humanauthentication using ECG wavesrdquo in Information IntelligenceSystems Technology and Management vol 141 of Communica-tions in Computer and Information Science pp 287ndash298 2011
[23] S A Israel J M Irvine A Cheng M DWiederhold and B KWiederhold ldquoECG to identify individualsrdquo Pattern Recognitionvol 38 no 1 pp 133ndash142 2005
[24] J G WebsterMedical Instrumentation Application and DesignJohn Wiley amp Sons Philadelphia Pa USA 1997
[25] A Aleksandrowicz and S Leonhardt ldquoWireless and non-contact ECG measurement systemmdashthe lsquoAachen SmartChairrsquordquoActa Polytechnica vol 47 no 4-5 pp 68ndash71 2007
[26] Y G Lim K K Kim and K S Park ldquoECG measurementon a chair without conductive contactrdquo IEEE Transactions onBiomedical Engineering vol 53 no 5 pp 956ndash959 2006
12 Journal of Sensors
[27] G M Friesen T C Jannett M A Jadallah S L Yates S RQuint and H T Nagle ldquoA comparison of the noise sensitivityof nine QRS detection algorithmsrdquo IEEE Transactions onBiomedical Engineering vol 37 no 1 pp 85ndash98 1990
[28] B-U Kohler C Hennig and R Orglmeister ldquoThe principlesof software QRS detectionrdquo IEEE Engineering in Medicine andBiology Magazine vol 21 no 1 pp 42ndash57 2002
[29] J Pan and W J Tompkins ldquoA real-time QRS detection algo-rithmrdquo IEEE Transactions on Biomedical Engineering vol 32no 3 pp 230ndash236 1985
[30] F Zeng K-K Tseng H-N Huang S-Y Tu and J-S PanldquoA new statistical-based algorithm for ECG identificationrdquo inProceedings of the 8th International Conference on IntelligentInformation Hiding andMultimedia Signal Processing (IIH-MSPrsquo12) pp 301ndash304 IEEE Piraeus Greece July 2012
[31] A L Goldberger L A N Amaral L Glass et al ldquoPhysioBankPhysioToolkit and PhysioNet components of a new researchresource for complex physiologic signalsrdquo Circulation vol 101no 23 pp e215ndashe220 2000
[32] G B Moody and R G Mark ldquoThe impact of the MIT-BIHarrhythmia databaserdquo IEEE Engineering inMedicine and BiologyMagazine vol 20 no 3 pp 45ndash50 2001
International Journal of
AerospaceEngineeringHindawi Publishing Corporationhttpwwwhindawicom Volume 2014
RoboticsJournal of
Hindawi Publishing Corporationhttpwwwhindawicom Volume 2014
Hindawi Publishing Corporationhttpwwwhindawicom Volume 2014
Active and Passive Electronic Components
Control Scienceand Engineering
Journal of
Hindawi Publishing Corporationhttpwwwhindawicom Volume 2014
International Journal of
RotatingMachinery
Hindawi Publishing Corporationhttpwwwhindawicom Volume 2014
Hindawi Publishing Corporation httpwwwhindawicom
Journal ofEngineeringVolume 2014
Submit your manuscripts athttpwwwhindawicom
VLSI Design
Hindawi Publishing Corporationhttpwwwhindawicom Volume 2014
Hindawi Publishing Corporationhttpwwwhindawicom Volume 2014
Shock and Vibration
Hindawi Publishing Corporationhttpwwwhindawicom Volume 2014
Civil EngineeringAdvances in
Acoustics and VibrationAdvances in
Hindawi Publishing Corporationhttpwwwhindawicom Volume 2014
Hindawi Publishing Corporationhttpwwwhindawicom Volume 2014
Electrical and Computer Engineering
Journal of
Advances inOptoElectronics
Hindawi Publishing Corporation httpwwwhindawicom
Volume 2014
The Scientific World JournalHindawi Publishing Corporation httpwwwhindawicom Volume 2014
SensorsJournal of
Hindawi Publishing Corporationhttpwwwhindawicom Volume 2014
Modelling amp Simulation in EngineeringHindawi Publishing Corporation httpwwwhindawicom Volume 2014
Hindawi Publishing Corporationhttpwwwhindawicom Volume 2014
Chemical EngineeringInternational Journal of Antennas and
Propagation
International Journal of
Hindawi Publishing Corporationhttpwwwhindawicom Volume 2014
Hindawi Publishing Corporationhttpwwwhindawicom Volume 2014
Navigation and Observation
International Journal of
Hindawi Publishing Corporationhttpwwwhindawicom Volume 2014
DistributedSensor Networks
International Journal of
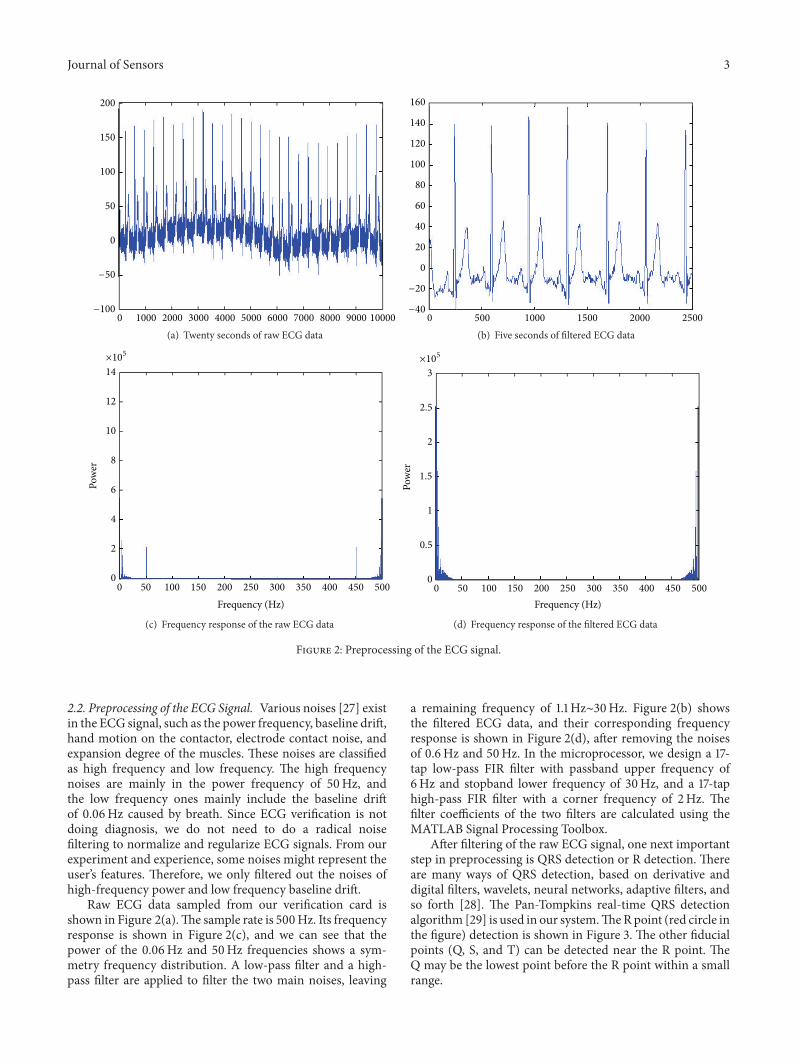
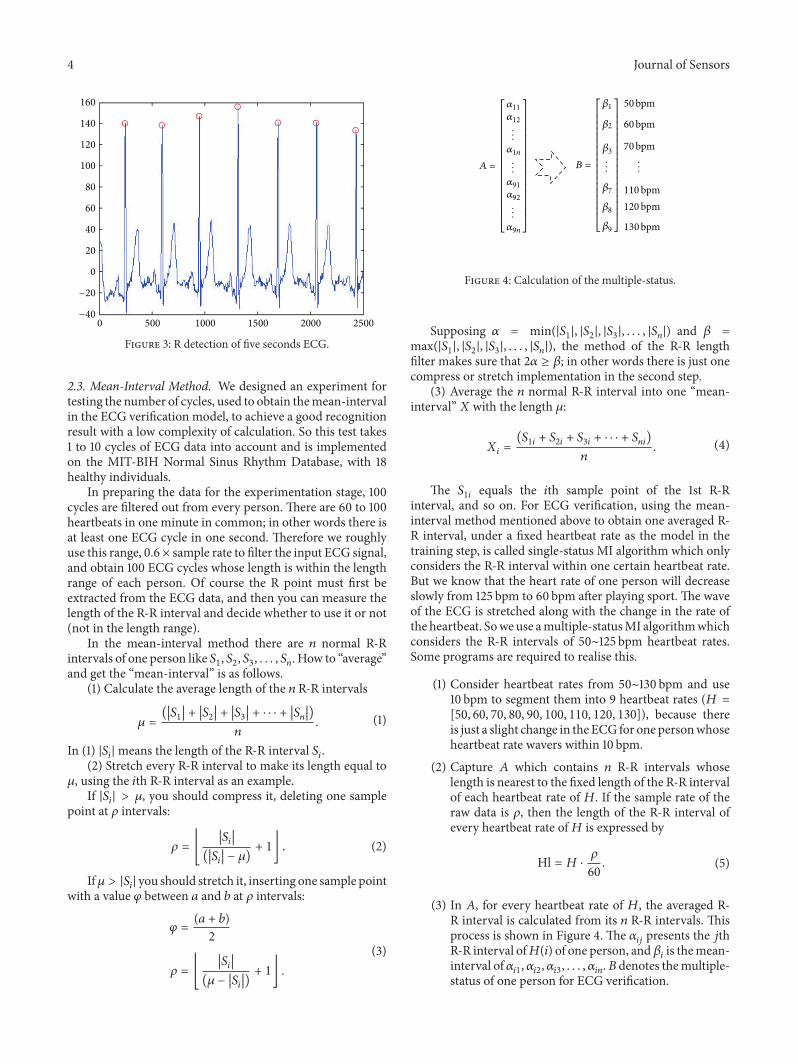
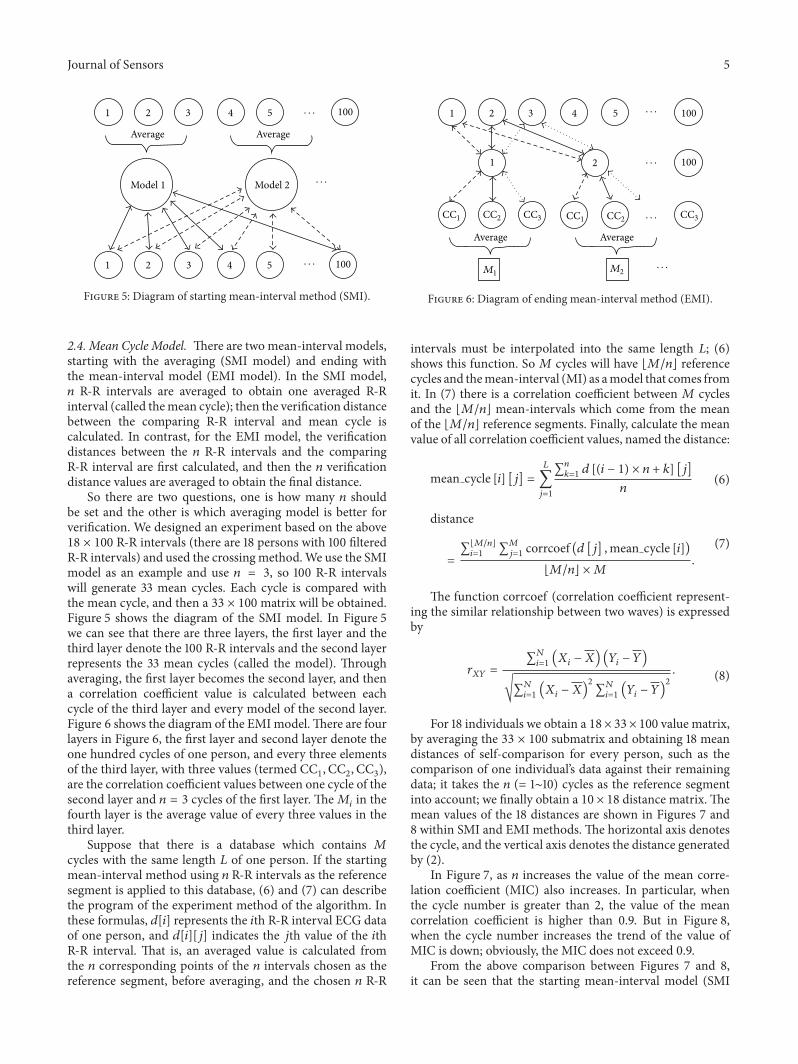
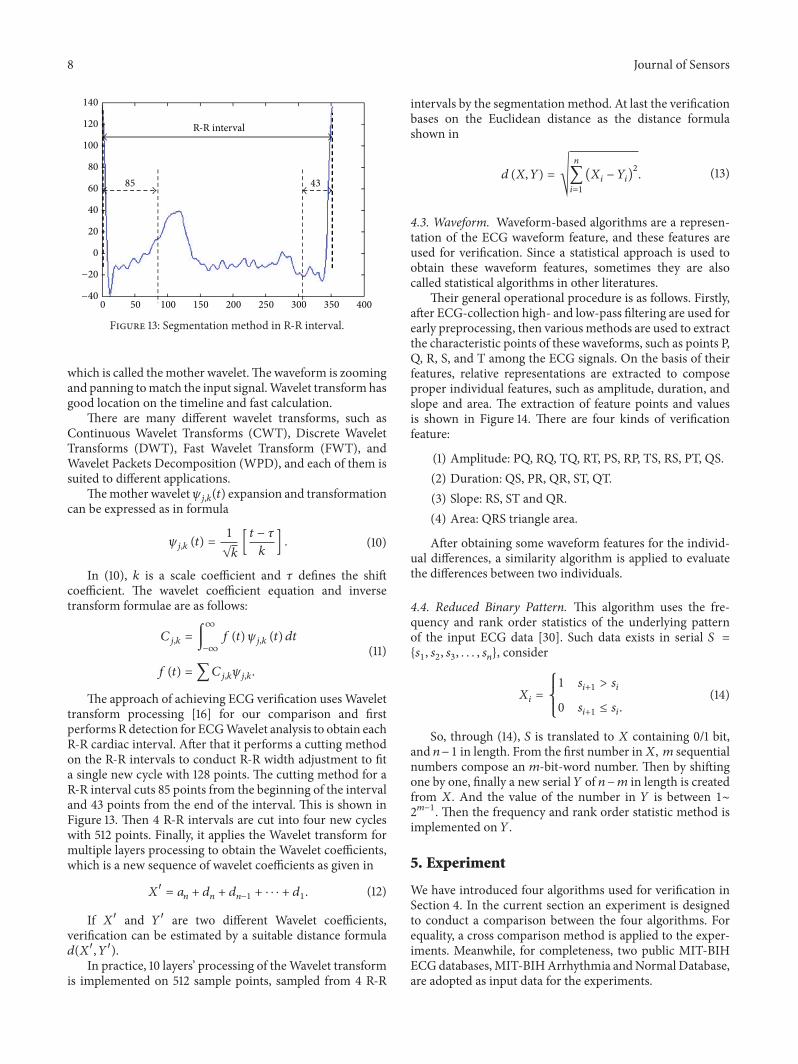
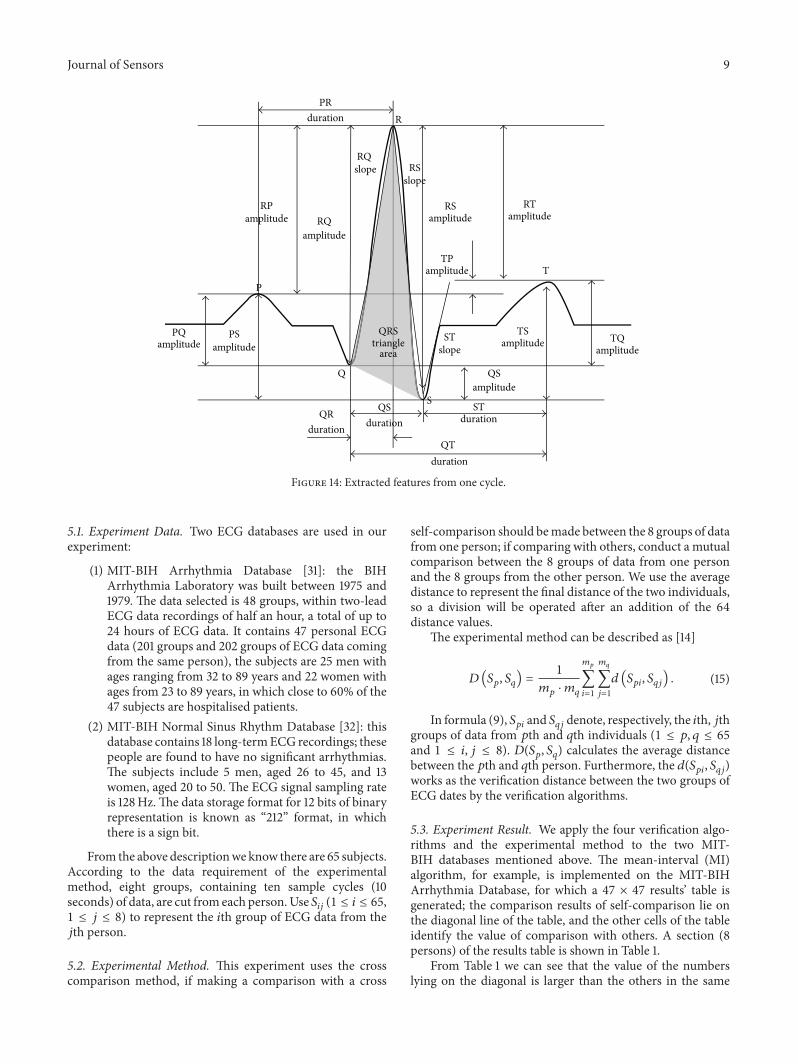

International Journal of
AerospaceEngineeringHindawi Publishing Corporationhttpwwwhindawicom Volume 2014
RoboticsJournal of
Hindawi Publishing Corporationhttpwwwhindawicom Volume 2014
Hindawi Publishing Corporationhttpwwwhindawicom Volume 2014
Active and Passive Electronic Components
Control Scienceand Engineering
Journal of
Hindawi Publishing Corporationhttpwwwhindawicom Volume 2014
International Journal of
RotatingMachinery
Hindawi Publishing Corporationhttpwwwhindawicom Volume 2014
Hindawi Publishing Corporation httpwwwhindawicom
Journal ofEngineeringVolume 2014
Submit your manuscripts athttpwwwhindawicom
VLSI Design
Hindawi Publishing Corporationhttpwwwhindawicom Volume 2014
Hindawi Publishing Corporationhttpwwwhindawicom Volume 2014
Shock and Vibration
Hindawi Publishing Corporationhttpwwwhindawicom Volume 2014
Civil EngineeringAdvances in
Acoustics and VibrationAdvances in
Hindawi Publishing Corporationhttpwwwhindawicom Volume 2014
Hindawi Publishing Corporationhttpwwwhindawicom Volume 2014
Electrical and Computer Engineering
Journal of
Advances inOptoElectronics
Hindawi Publishing Corporation httpwwwhindawicom
Volume 2014
The Scientific World JournalHindawi Publishing Corporation httpwwwhindawicom Volume 2014
SensorsJournal of
Hindawi Publishing Corporationhttpwwwhindawicom Volume 2014
Modelling amp Simulation in EngineeringHindawi Publishing Corporation httpwwwhindawicom Volume 2014
Hindawi Publishing Corporationhttpwwwhindawicom Volume 2014
Chemical EngineeringInternational Journal of Antennas and
Propagation
International Journal of
Hindawi Publishing Corporationhttpwwwhindawicom Volume 2014
Hindawi Publishing Corporationhttpwwwhindawicom Volume 2014
Navigation and Observation
International Journal of
Hindawi Publishing Corporationhttpwwwhindawicom Volume 2014
DistributedSensor Networks
International Journal of