Embed Size (px)
Citation preview
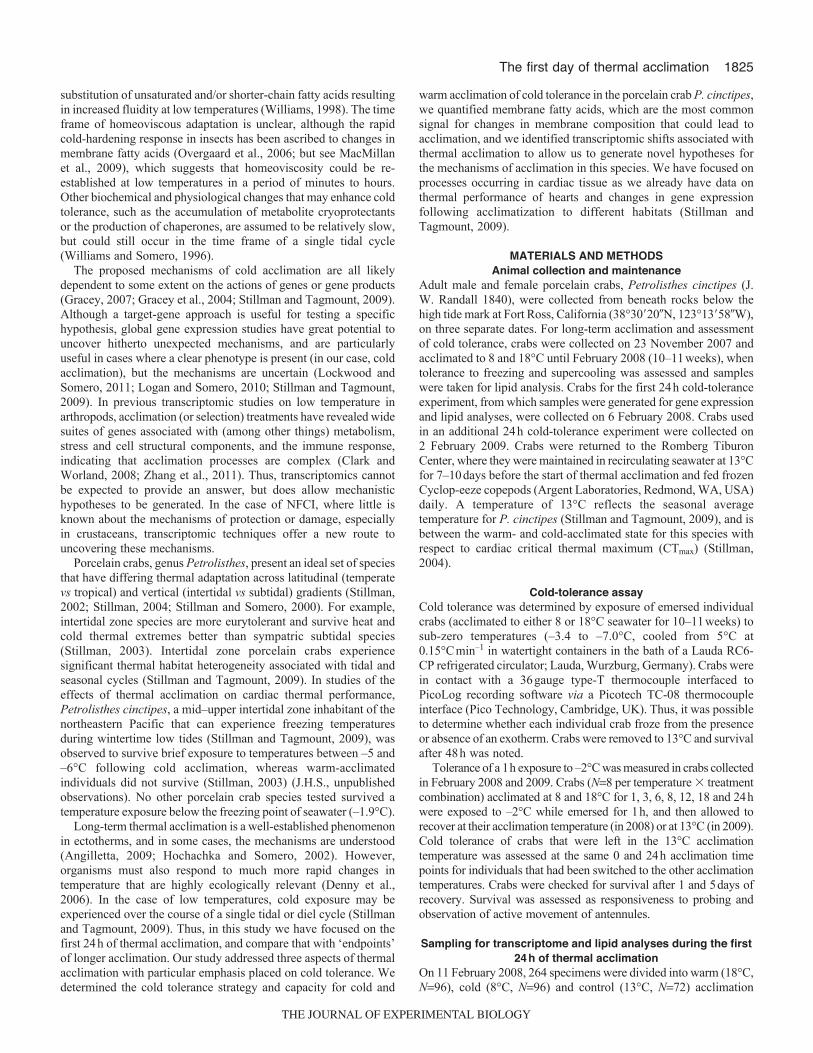
1824
INTRODUCTIONMarine intertidal ectotherms exposed to temperatures below theirfreezing point must either avoid or tolerate extracellular iceformation, and the mechanisms of these tolerances have receivedsome attention (Hawes et al., 2010; Loomis, 1995; Pineda et al.,2005; Storey and Storey, 1996). However, the majority of ectothermsare killed at low temperatures above their freezing points, and themechanisms underlying this non-freezing cold injury (NFCI) arepoorly understood. In insects, NFCI is hypothesised to result frommembrane phase transition and/or ion equilibration (Kostal et al.,2004), whereas in marine invertebrates, failure of oxygen deliveryto mitochondria has also been implicated (Pörtner, 2010; Pörtner etal., 2006). In comparison to the large number of studiesdemonstrating short-term cold-hardening in terrestrial arthropods[primarily insects (e.g. MacMillan and Sinclair, 2011; Overgaardet al., 2008)], very few studies have demonstrated that marine orintertidal zone arthropods are capable of acclimation to lowtemperatures (McAllen and Block, 1997). In an era of rapidlychanging climates, there is considerable interest in understandingthe speed, effectiveness and constraints of phenotypic plasticity
related to temperature sensitivity (Angilletta, 2009; Deutsch et al.,2008; Dillon et al., 2010; Stillman, 2003), and here we extend theseinvestigations in intertidal arthropods to include low temperatures.
To survive exposure to low temperatures, intertidal invertebratesmust maintain metabolic homeostasis, and this is likely aided bypre-existing adaptations to hypoxia associated with emersion(Mandic et al., 2009; Sloman et al., 2008). Possible mechanisms ofphysiological acclimation by arthropods to avoid NFCI at lowtemperatures include homeoviscous adaptation of membranefluidity, production of metabolite cryoprotectants and changes inpump, ion or membrane permeability characteristics to maintain ionhomeostasis (Hochachka and Somero, 1984; Hochachka andSomero, 2002). Homeoviscous adaptation, whereby membranefluidity increases with cold acclimation, has been observed in manyectothermic taxa including fish (Logue et al., 2000; Williams andHazel, 1994), mollusks (Pernet et al., 2007; Williams and Somero,1996), nematodes (Hayward et al., 2007; Murray et al., 2007), insects(Kostal and Simek, 1998; Purac et al., 2011) and crabs (Cuculescuet al., 1999). Homeoviscous adaptation is often identified througha change in membrane fatty acid chain composition, with a
The Journal of Experimental Biology 215, 1824-1836© 2012. Published by The Company of Biologists Ltddoi:10.1242/jeb.069658
RESEARCH ARTICLE
Changes in extreme cold tolerance, membrane composition and cardiactranscriptome during the first day of thermal acclimation in the porcelain crab
Petrolisthes cinctipes
Daria Ronges1, Jillian P. Walsh2, Brent J. Sinclair2 and Jonathon H. Stillman1,3,*1Romberg Tiburon Center and Department of Biology, San Francisco State University, 3150 Paradise Drive, Tiburon, CA 94920,USA, 2Department of Biology, The University of Western Ontario, London, ON, Canada, N6A 5B7 and 3Department of Integrative
Biology, University of California, Berkeley, Berkeley, CA 94720, USA*Author for correspondence ([email protected])
Accepted 6 February 2012
SUMMARYIntertidal zone organisms can experience transient freezing temperatures during winter low tides, but their extreme cold tolerancemechanisms are not known. Petrolisthes cinctipes is a temperate mid–high intertidal zone crab species that can experiencewintertime habitat temperatures below the freezing point of seawater. We examined how cold tolerance changed during the initialphase of thermal acclimation to cold and warm temperatures, as well as the persistence of cold tolerance during long-termthermal acclimation. Thermal acclimation for as little as 6h at 8°C enhanced cold tolerance during a 1h exposure to –2°C relativeto crabs acclimated to 18°C. Potential mechanisms for this enhanced tolerance were elucidated using cDNA microarrays to probefor differences in gene expression in cardiac tissue of warm- and cold-acclimated crabs during the first day of thermalacclimation. No changes in gene expression were detected until 12h of thermal acclimation. Genes strongly upregulated in warm-acclimated crabs represented immune response and extracellular/intercellular processes, suggesting that warm-acclimated crabshad a generalized stress response and may have been remodelling tissues or altering intercellular processes. Genes stronglyupregulated in cold-acclimated crabs included many that are involved in glucose production, suggesting that cold acclimationinvolves increasing intracellular glucose as a cryoprotectant. Structural cytoskeletal proteins were also strongly representedamong the genes upregulated in only cold-acclimated crabs. There were no consistent changes in composition or the level ofunsaturation of membrane phospholipid fatty acids with cold acclimation, which suggests that neither short- nor long-termchanges in cold tolerance are mediated by changes in membrane fatty acid composition. Overall, our study demonstrates thatinitial changes in cold tolerance are likely not regulated by transcriptomic responses, but that gene-expression-related changesin homeostasis begin within 12h, the length of a tidal cycle.
Supplementary material available online at http://jeb.biologists.org/cgi/content/full/215/11/1824/DC1
Key words: crustacean, acclimation, temperature, transcriptome, membrane, cold tolerance.
THE JOURNAL OF EXPERIMENTAL BIOLOGY
1825The first day of thermal acclimation
substitution of unsaturated and/or shorter-chain fatty acids resultingin increased fluidity at low temperatures (Williams, 1998). The timeframe of homeoviscous adaptation is unclear, although the rapidcold-hardening response in insects has been ascribed to changes inmembrane fatty acids (Overgaard et al., 2006; but see MacMillanet al., 2009), which suggests that homeoviscosity could be re-established at low temperatures in a period of minutes to hours.Other biochemical and physiological changes that may enhance coldtolerance, such as the accumulation of metabolite cryoprotectantsor the production of chaperones, are assumed to be relatively slow,but could still occur in the time frame of a single tidal cycle(Williams and Somero, 1996).
The proposed mechanisms of cold acclimation are all likelydependent to some extent on the actions of genes or gene products(Gracey, 2007; Gracey et al., 2004; Stillman and Tagmount, 2009).Although a target-gene approach is useful for testing a specifichypothesis, global gene expression studies have great potential touncover hitherto unexpected mechanisms, and are particularlyuseful in cases where a clear phenotype is present (in our case, coldacclimation), but the mechanisms are uncertain (Lockwood andSomero, 2011; Logan and Somero, 2010; Stillman and Tagmount,2009). In previous transcriptomic studies on low temperature inarthropods, acclimation (or selection) treatments have revealed widesuites of genes associated with (among other things) metabolism,stress and cell structural components, and the immune response,indicating that acclimation processes are complex (Clark andWorland, 2008; Zhang et al., 2011). Thus, transcriptomics cannotbe expected to provide an answer, but does allow mechanistichypotheses to be generated. In the case of NFCI, where little isknown about the mechanisms of protection or damage, especiallyin crustaceans, transcriptomic techniques offer a new route touncovering these mechanisms.
Porcelain crabs, genus Petrolisthes, present an ideal set of speciesthat have differing thermal adaptation across latitudinal (temperatevs tropical) and vertical (intertidal vs subtidal) gradients (Stillman,2002; Stillman, 2004; Stillman and Somero, 2000). For example,intertidal zone species are more eurytolerant and survive heat andcold thermal extremes better than sympatric subtidal species(Stillman, 2003). Intertidal zone porcelain crabs experiencesignificant thermal habitat heterogeneity associated with tidal andseasonal cycles (Stillman and Tagmount, 2009). In studies of theeffects of thermal acclimation on cardiac thermal performance,Petrolisthes cinctipes, a mid–upper intertidal zone inhabitant of thenortheastern Pacific that can experience freezing temperaturesduring wintertime low tides (Stillman and Tagmount, 2009), wasobserved to survive brief exposure to temperatures between –5 and–6°C following cold acclimation, whereas warm-acclimatedindividuals did not survive (Stillman, 2003) (J.H.S., unpublishedobservations). No other porcelain crab species tested survived atemperature exposure below the freezing point of seawater (–1.9°C).
Long-term thermal acclimation is a well-established phenomenonin ectotherms, and in some cases, the mechanisms are understood(Angilletta, 2009; Hochachka and Somero, 2002). However,organisms must also respond to much more rapid changes intemperature that are highly ecologically relevant (Denny et al.,2006). In the case of low temperatures, cold exposure may beexperienced over the course of a single tidal or diel cycle (Stillmanand Tagmount, 2009). Thus, in this study we have focused on thefirst 24h of thermal acclimation, and compare that with ‘endpoints’of longer acclimation. Our study addressed three aspects of thermalacclimation with particular emphasis placed on cold tolerance. Wedetermined the cold tolerance strategy and capacity for cold and
warm acclimation of cold tolerance in the porcelain crab P. cinctipes,we quantified membrane fatty acids, which are the most commonsignal for changes in membrane composition that could lead toacclimation, and we identified transcriptomic shifts associated withthermal acclimation to allow us to generate novel hypotheses forthe mechanisms of acclimation in this species. We have focused onprocesses occurring in cardiac tissue as we already have data onthermal performance of hearts and changes in gene expressionfollowing acclimatization to different habitats (Stillman andTagmount, 2009).
MATERIALS AND METHODSAnimal collection and maintenance
Adult male and female porcelain crabs, Petrolisthes cinctipes (J.W. Randall 1840), were collected from beneath rocks below thehigh tide mark at Fort Ross, California (38°30�20�N, 123°13�58�W),on three separate dates. For long-term acclimation and assessmentof cold tolerance, crabs were collected on 23 November 2007 andacclimated to 8 and 18°C until February 2008 (10–11weeks), whentolerance to freezing and supercooling was assessed and sampleswere taken for lipid analysis. Crabs for the first 24h cold-toleranceexperiment, from which samples were generated for gene expressionand lipid analyses, were collected on 6 February 2008. Crabs usedin an additional 24h cold-tolerance experiment were collected on2 February 2009. Crabs were returned to the Romberg TiburonCenter, where they were maintained in recirculating seawater at 13°Cfor 7–10days before the start of thermal acclimation and fed frozenCyclop-eeze copepods (Argent Laboratories, Redmond, WA, USA)daily. A temperature of 13°C reflects the seasonal averagetemperature for P. cinctipes (Stillman and Tagmount, 2009), and isbetween the warm- and cold-acclimated state for this species withrespect to cardiac critical thermal maximum (CTmax) (Stillman,2004).
Cold-tolerance assayCold tolerance was determined by exposure of emersed individualcrabs (acclimated to either 8 or 18°C seawater for 10–11weeks) tosub-zero temperatures (–3.4 to –7.0°C, cooled from 5°C at0.15°Cmin–1 in watertight containers in the bath of a Lauda RC6-CP refrigerated circulator; Lauda, Wurzburg, Germany). Crabs werein contact with a 36gauge type-T thermocouple interfaced toPicoLog recording software via a Picotech TC-08 thermocoupleinterface (Pico Technology, Cambridge, UK). Thus, it was possibleto determine whether each individual crab froze from the presenceor absence of an exotherm. Crabs were removed to 13°C and survivalafter 48h was noted.
Tolerance of a 1h exposure to –2°C was measured in crabs collectedin February 2008 and 2009. Crabs (N8 per temperature � treatmentcombination) acclimated at 8 and 18°C for 1, 3, 6, 8, 12, 18 and 24hwere exposed to –2°C while emersed for 1h, and then allowed torecover at their acclimation temperature (in 2008) or at 13°C (in 2009).Cold tolerance of crabs that were left in the 13°C acclimationtemperature was assessed at the same 0 and 24h acclimation timepoints for individuals that had been switched to the other acclimationtemperatures. Crabs were checked for survival after 1 and 5days ofrecovery. Survival was assessed as responsiveness to probing andobservation of active movement of antennules.
Sampling for transcriptome and lipid analyses during the first24h of thermal acclimation
On 11 February 2008, 264 specimens were divided into warm (18°C,N96), cold (8°C, N96) and control (13°C, N72) acclimation
THE JOURNAL OF EXPERIMENTAL BIOLOGY
1826
groups. Crabs were sampled from the 13°C group at 0h (the startof the experiment) and 24h (the termination of the experiment).Crabs were sampled from the warm and cold acclimation groups at6, 12, 18 and 24h following the start of thermal acclimation. Ateach time point, heart tissue from 16 crabs from each group wasdissected, flash frozen and stored at –80°C.
RNA extraction, purification and linear amplificationPreparation and microarray analyses of heart tissue samples wereperformed as previously described for porcelain crabs (Stillman andTagmount, 2009). Cardiac tissues from eight specimens per groupwere shaken in guanidinium thiocyanate-phenol-chloroformextraction buffer [38% phenol in saturated buffer pH6.6, 0.8moll–1
guanidinium thiocyanate, 0.4moll–1 ammonium thiocyanate,0.1moll–1 sodium acetate pH5.0 and 5% glycerol (Chomczynskiand Sacchi, 1987)] in a Retsch MixerMill MM300 (Retsch Inc.Newtown, PA, USA) at 30Hz for 10min. Total RNA was extractedby standard chloroform and isopropanol precipitation methods, andthen purified using Qiagen RNeasy columns (Valencia, CA, USA)and quantitated on a NanoDrop spectrophotometer (Thermo FisherScientific Inc., Wilmington, DE, USA). In some cases, individualcardiac tissues did not yield adequate total RNA to continue, andin one group only five specimens yielded adequate total RNA. Apooled total RNA sample was prepared for each group by mixingequal quantities of total RNA from five individuals in each groupin order to have the same amount of biological diversity within eachpooled RNA sample. Linear amplification of RNA by in vitrotranscription (Van Gelder et al., 1990) was performed as follows.First-strand cDNA was synthesized by heating 3g of pooled totalRNA with 500ng of OligodT-T7 primer (5�- GCATTAGC -GGCCGCGAAATTAATACGACTCACTATAGGGAGATTTTT -TTTTTTTTTTTTTTTTV-3�) (Baugh et al., 2001) in a volume of15l for 5min at 70°C and then 5l 5� first strand buffer [M531A,Promega, Madison, WI, USA; final concentration: 50mmoll–1 Tris-HCl pH8.3 at 25°C, 75mmoll–1 KCl, 3mmoll–1 MgCl2, 10mmoll–1
dithiothreitol (DTT)], 1.25l 10mmoll–1 dNTPs, 200U MMLVreverse transcriptase (M1705, Promega), 15U RNase inhibitor(bp3225-1, Fisher Scientific, Pittsburgh, PA, USA) and 2.25ldouble distilled water (ddH2O) were added and tubes were incubatedat 42°C for 60–90min followed by a heat inactivation at 70°C for10min.
Double-stranded cDNA was produced by adding 75l of thefollowing: 1� Escherichia coli DNA polymerase buffer (NEBbuffer #2, New England Biolabs, Ipswich, MA, USA), 0.25mmoll–1
dNTPs, 3U E. coli RNaseH (TAK 2150A, Takara Mirus Bio,Mountain View, CA, USA) and 40U E. coli DNA polymerase(M0209L, New England Biolabs). Following 2h incubation at 16°C,1U E. coli DNA ligase (M0205L, New England Biolabs) and 11l10� DNA ligase buffer were added and incubated at roomtemperature for 15min. Finally, 6U T4 DNA polymerase (M0203L,New England Biolabs) were added followed by incubation for15min at room temperature. Double-stranded cDNAs were purifiedusing the Qiagen QIAquick PCR purification kit following themanufacturer’s protocol, except that cDNA was eluted from thecolumn in 2� 50l elution steps using RNase-free water. Purifieddouble-stranded cDNA was dried by vacuum centrifugation in aspeed vacuum and stored at –20°C. For RNA amplification, 40lof in vitro transcription cocktail [120mmoll–1 HEPES, pH7.5,28mmoll–1 MgCl2, 6mmoll–1 rNTPs (N0466L, New EnglandBiolabs), 1mmoll–1 spermidine (19485201, MP Biomedicals, Inc.,Solon, OH, USA), 0.1mmoll–1 acetylated bovine serum albumin(BSA) (R3961, Promega), 40mmoll–1 DTT (9779, Sigma-Aldrich,
D. Ronges and others
St Louis, MO, USA), 0.2U pyrophosphatase (EF0221, Fermentas,Hanover, MD, USA), 200U T7 RNA polymerase (EP0113,Fermentas) and 15U RNase inhibitor (bp3225-1, Fisher Scientific)]were added and incubated at 37°C for 14h. Amplified RNA waspurified (Qiagen RNeasy), eluted 2� with 50l RNase-free water,concentrated by speed vacuum and quantified from absorbance at260nm. For the seasonal comparison, a second round ofamplification was performed, except that: (1) random hexamerprimers were used in the first strand synthesis and (2) 500ng ofoligodT-T7 primer were added to the second strand reaction.
Microarray analysisReverse transcription of antisense RNA (aRNA) was performed byincubating 3.25g aRNA, 1g random hexamer primers and waterto a total volume of 15l for 5min at 65°C, then adding 10l ofaa-dNTP cocktail [1� first strand buffer, 1mmoll–1 DTT,1.25mmoll–1 amino allyl dNTP mix (10mmoll–1 dATP, dGTP,dCTP, 3.33mmoll–1 dTTP, 6.66mmoll–1 amino allyl dUTP), 200UMMLV reverse transcriptase, 5% v/v RNase inhibitor] andincubating at 42°C for 70min. aRNA was hydrolyzed by adding10l of 1moll–1 NaOH (0.22moll–1 final concentration) and 10l0.5moll–1 EDTA, pH8.0 (0.11moll–1 final concentration) at 65°Cfor 15min, and then neutralized by addition of 25l HEPES, pH7.4.Amino-allyl cDNAs were purified (Qiagen QIAquick PCRpurification kit) and cDNA was eluted from the column in 2� 30lelution steps using pH8.0 adjusted ddH2O, and dried.
Cy3 or Cy5 fluorescent dyes (PA23001, PA25001, AmershamBiosciences, GE Healthcare, Piscataway, NJ, USA) were coupledto cDNAs resuspended in 9l 0.1moll–1 NaHCO3 buffer, pH9.0.Five microliters of dye dissolved in DMSO (final concentration1.14mmoll–1) were added and incubated at room temperature inthe dark for 1h. Dye coupling was quenched by addition of 4.5lof 4moll–1 hydroxylamine (final concentration 0.97moll–1).Samples to be hybridized together on a microarray (supplementarymaterial Fig.S1, see below) were combined and diluted to a totalvolume of 100l with water. cDNA was purified (Qiagen QIAquickPCR purification) and eluted in 2� 50l ddH2O. Thirty microgramsof polyA RNA was added to each tube, and tubes were speed vacuumdried.
For microarray hybridizations, we used 25 slides in an incompleteloop design where each sample was hybridized five times andlabelled with each Cy dye two to three times (supplementary materialFig.S1). Because we used pooled RNA samples to make aRNA,all of our replication assessed technical variation in estimating themeans of the five individuals in each group.
Custom microarrays were printed on poly-L-lysine coated glassslides (Erie Scientific, Portsmouth, NH, USA) at the UCSF Centerfor Advanced Technology using 24,748 PCR-amplified cDNAs,each representing a unique consensus sequence from a library of61,440 cloned cDNAs (Stillman et al., 2006; Tagmount et al., 2010).Before use, spots were rehydrated by incubating slides in humidifiedair, snap dried at 100°C and cross-linked by 200mJ UV exposurein a cross linker (Spectronics Co., Westbury, NY, USA). Slides wereshaken in 0.2% sodium dodecyl sulfate (SDS), washed in copiousamounts of ddH2O and incubated at 42°C for 30–45min in pre-warmed blocking solution [0.1% SDS, 5� saline-sodium citrate(SSC) and 1% BSA] to block free poly-L-lysine molecules. Slideswere washed in five to six changes of ultrapure water, denaturedby washing in 95°C ddH2O for 2min and centrifuged to dry at 125gfor 3min. Dried cDNA + polyA RNAs were resuspended in 40lhybridization buffer (50% deoinized formamide, 5� SSC and 0.1%SDS), heated 2min at 94°C, chilled on ice, and pipetted underneath
THE JOURNAL OF EXPERIMENTAL BIOLOGY
1827The first day of thermal acclimation
an Erie LifterSlip placed on the microarray slide and hybridized for12–16h at 42°C. Following hybridization, coverslips were removedand slides were washed for 5min with gentle shaking at 42°C twotimes in 2� SSC and 0.1% SDS, two times in 1� SSC and twotimes in 0.1� SSC. Slides were dried during gentle centrifugation(500g) for 5min.
Hybridized slides were scanned at 10m resolution (GenePix4000B and GenePix Pro v.6.0, Axon Instruments, Union City, CA,USA) while adjusting photomultiplier voltage to balance signalintensity in the red and green channels. Features that were not usablewere flagged, and flagged features were excluded from the results.
Statistical analysis of microarray dataDifferentially expressed features were identified using MAANOVA[version 1.8.1 (Wu et al., 2003)] in Version 2.6.2 of the R statisticalenvironment (http://www.r-project.org/). Median fluorescence valuesfor each feature were log transformed (Draghici et al., 2003), and aweighted linear least-squares regression LOWESS normalization wasconducted on log2-transformed data using the joint LOWESS function(Wu et al., 2003). GenePix results files and log2-transformedLOWESS normalized data have been submitted to the NCBI GeneExpression Omnibus (http://www.ncbi.nlm.nih.gov/geo/query/acc.cgi?accGSE35307). Microarray images and sequence data arealso available at the Porcelain Crab Array Database (PCAD;http://array.sfsu.edu).
A fixed ANOVA model with array, dye and sample (treatmentgroup) terms was fit using restricted maximum likelihood (REML),and a permutated F-test (N500 permutations) was used to identifyfeatures that significantly differed (tabulated P≤0.001) among itemsin the sample term using the FS statistic at 0.001. The FS statisticuses overall gene expression variation to calculate a gene-specificvariance (Cui et al., 2005; Wu et al., 2003) and has a much higherstringency than other F or t statistics. To control for false positives,we employed the q-value false discovery rate correction (Storey,2002; Storey, 2003; Storey et al., 2004; Storey and Tibshirani, 2003).For those features selected as significant by the FS-test, we exportedlog2 expression fold change data for filtering and k-means clusteringusing Cluster v.3.0, and for visualization as heat maps usingTreeview software version 1.60 (http://rana.lbl.gov/EisenSoftware.htm). Data were filtered to remove flagged features.Mean expression values and standard deviations for each clusterwere calculated in Microsoft Excel and data were plotted usingDeltaGraph v5.7.5 (Red Rock Software, Salt Lake City, UT, USA).
Gene homology for each microarray feature was determined fromconsensus sequences submitted to the following searches: BLASTx(GenBank, UniProt, SwissProt, Daphnia pulex v1.1 Filtered Modelsprotein set), InterPro Scan (13 different protein identificationalgorithms) and tBLASTx (Daphnia pulex v1.1 transcript set)(Stillman et al., 2006; Tagmount et al., 2010). Using all of theavailable data, we ascribed gene identity for each feature where therewas a match with a score of ≤1e–5. Putative functions weredetermined from the UniProt database.
Phospholipid compositionLipid extraction and separation
Crab hearts (N8 per acclimation temperature and time point) wereplaced in a –80°C freezer until assays were performed. All sampleswere weighed using a microbalance (Mettler Toledo MX5,Columbus, OH, USA), and then homogenized in 2ml of Folchreagent (1:1 chloroform:methanol). Homogenate was then rinsedinto a 20ml glass culture tube with an additional 2ml of Folchreagent. Glass homogenizers were cleaned between each sample by
rinsing with 2ml of Folch reagent and 1ml of distilled water.Homogenates were then centrifuged at 2000g for 15min. Followingcentrifugation, samples were filtered through #1 Whatman filters(VWR, Mississauga, ON, Canada) into clean, dry culture tubes,where 5ml of Folch (2:1) reagent was added. Samples where thenvortexed and filtered again into clean tubes, into which 3ml of 0.25%KCl was added. The tubes were incubated at 70°C for 10min thencooled. The aqueous layer was then removed and discarded, whilethe remaining organic layer was dried under a nitrogen stream at70°C.
Dried samples were re-suspended in 100l of pure chloroform.Prior to loading samples, 1ml Supelclean LC-NH2 SPE tubes fixedto the Supelco Visiprep DL vacuum block were conditioned byadding 2ml of hexane. Each sample tube was then rinsed with2�100l of chloroform and added to the appropriate column.Column and sample tube were then centrifuged together for 1minat 1300g. To elute neutral lipids from the loaded columns, twoaliquots of 0.9ml of chloroform:isopropanol (2:1) were added, andthe column and tube were centrifuged as above. Eluting non-esterified fatty acids was done in a similar fashion using two washesof 0.8ml of isopropyl ether:acetic acid (49:1), followed bycentrifugation. Finally, phospholipids were eluted from the columnwith 3�0.9ml of methanol. To this separated phospholipid sample,20l of a 19:0 fatty acid in hexane (0.31mgml–1) was added as aninternal standard. All samples were then evaporated under a nitrogenstream.
Gas chromatographyDried samples were re-suspended in 2ml of 1moll–1 acetylchloride in cold methanol, capped tightly and incubated at 90°Cfor 2h. Samples were then evaporated under nitrogen andredissolved in 1ml methanol to remove residual HCl. Samples wereevaporated one last time, and redissolved in 100ldichloromethane, and transferred to gas chromatography (GC) vialinserts.
Phosopholipid samples were run on an Agilent Technologies6890N network GC system (Agilent Technologies, Mississauga,ON, Canada) equipped with a J&W 122-233230.0m�250m�0.25m capillary column (AgilentTechnologies). Helium was used as the carrier gas at an averagevelocity of 42cms–1. The inlet temperature was set at 250°C withan injection volume of 1l under splitless mode and the flame-ionization detector temperature was set at 280°C. Initial columntemperature was set to 80°C for 2min, and was then ramped upto 180°C at 5°Cmin–1, held for 3min, and heated from 180 to200°C at 1.5°Cmin–1. Fatty acids were identified by comparingretention times with standards (Sigma-Aldrich). Peak areas werecorrected using a molecular weight correction factor (Christie,1989) and were then used in calculating the molar percent of eachfatty acid.
Analysis of fatty acids was performed in SAS (v. 9.1, SASInstitute, Cary, NC, USA). Samples with extreme outliers (two ormore fatty acids that were more than 50% larger or smaller thanthe mean concentration of that fatty acid) were discarded, and themean number of double bonds per molecule and ratio ofsaturated:unsaturated fatty acids were calculated for each sample.These parameters (which approximated normal distributions) werecompared among sexes, acclimation temperatures and times usinga repeated-measures ANOVA using PROC MIXED in SAS, and astepwise model building approach where the Akaike informationcriteria of the models were compared and the best explanatory modelwas chosen.
THE JOURNAL OF EXPERIMENTAL BIOLOGY
1828
RESULTSIn this study we examined changes in organismal tolerance tofreezing and supercooling, organismal tolerances to extreme cold,transcriptome profiles of cardiac tissue, and phospholipidcomposition that occurred during the first 24h of thermalacclimation. Our results from cold tolerance assays suggest that theprocess of thermal acclimation begins within 6h of transfer to anew temperature, but no gene expression differences were observeduntil 12h following transfer to a new temperature. There were nodifferences in phospholipid composition with respect to acclimationtemperature.
Cold toleranceRegardless of thermal acclimation, no crabs survived internal iceformation (N21). However, acclimation for 10–11weeks in cold(8°C) or warm (18°C) conditions had a significant impact on survivalof chilling at sub-zero temperatures. All 18°C-acclimated crabs thatremained unfrozen (N12) died following exposure to temperaturesbelow –2°C, but 37.5% (N8) of 8°C-acclimated crabs survivedexposure to temperatures below –3.5°C, provided they did not freeze.
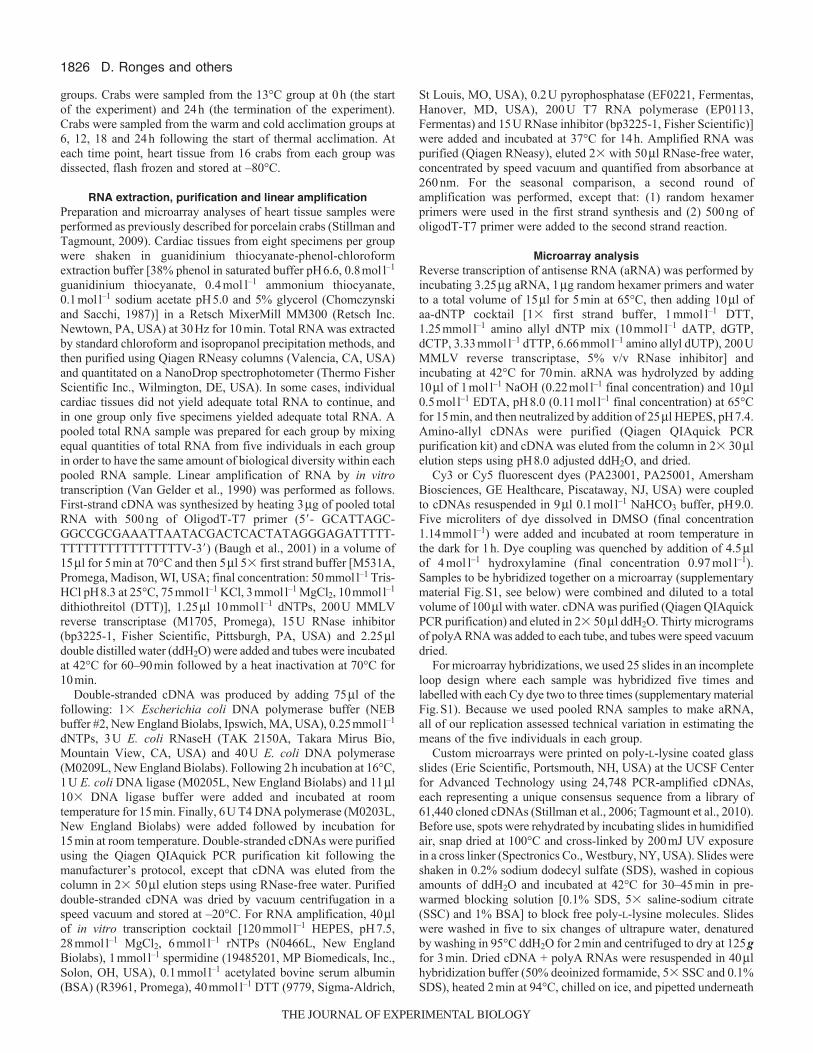
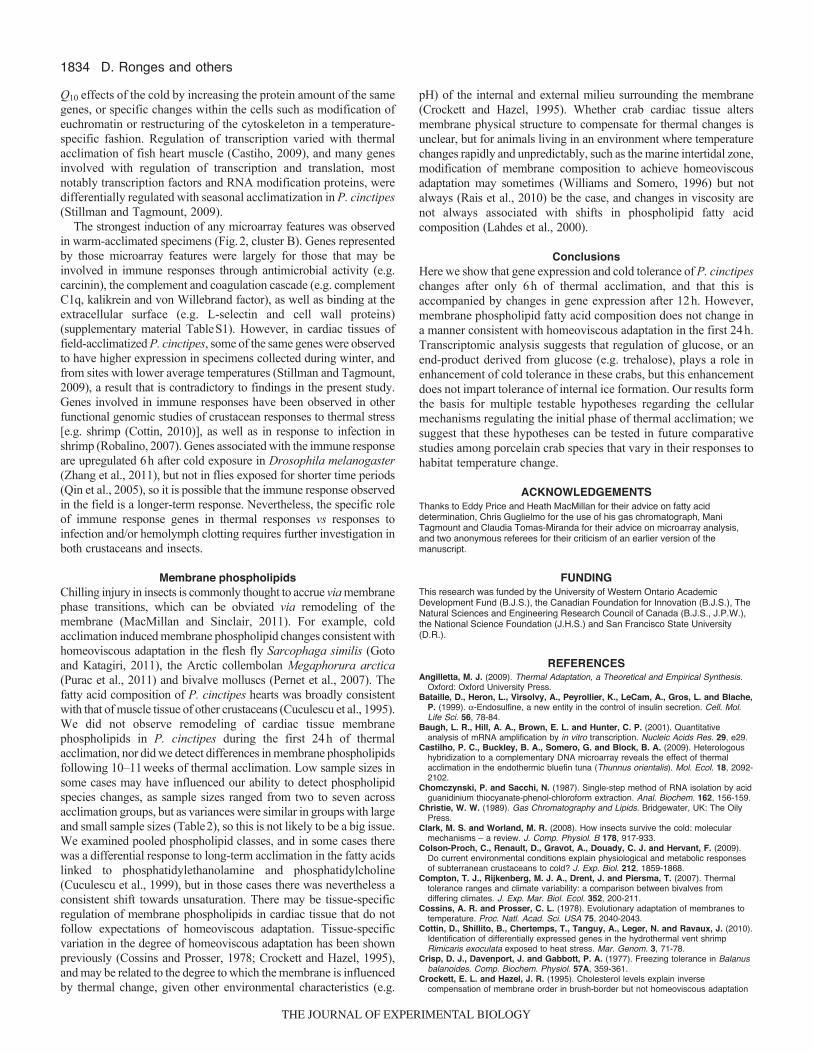
Following 10–11weeks of thermal acclimation to warm (18°C)or cold (8°C) temperatures there were marked differences in survivalfollowing a 1h exposure at –2°C (Fig.1A,B). Warm-acclimatedcrabs had approximately 10% survival whereas all cold-acclimatedcrabs survived exposure to –2°C (Fig.1A,B). Thermal acclimationfor only a few hours at warm or cold temperatures was sufficientto alter survival following exposure to –2°C for 1h (Fig.1). Survivalof 13°C-acclimated crabs was generally 40–60% 1–5days followingthe exposure to –2°C (Fig.1). Acclimation at 8°C enhancedsurvivorship to between 60–100%, whereas acclimation to 18°Creduced survivorship to below 50% in most cases (Fig.1). Therewas not a large difference in survival of crabs that recovered at13°C following the –2°C exposure (Fig.1C) compared with crabsthat recovered at their acclimation temperatures (Fig.1A). Survivalpatterns 5days following the –2°C exposure (Fig.1B) were notsystematically different to survival observed 1day following the–2°C exposure (Fig.1A).
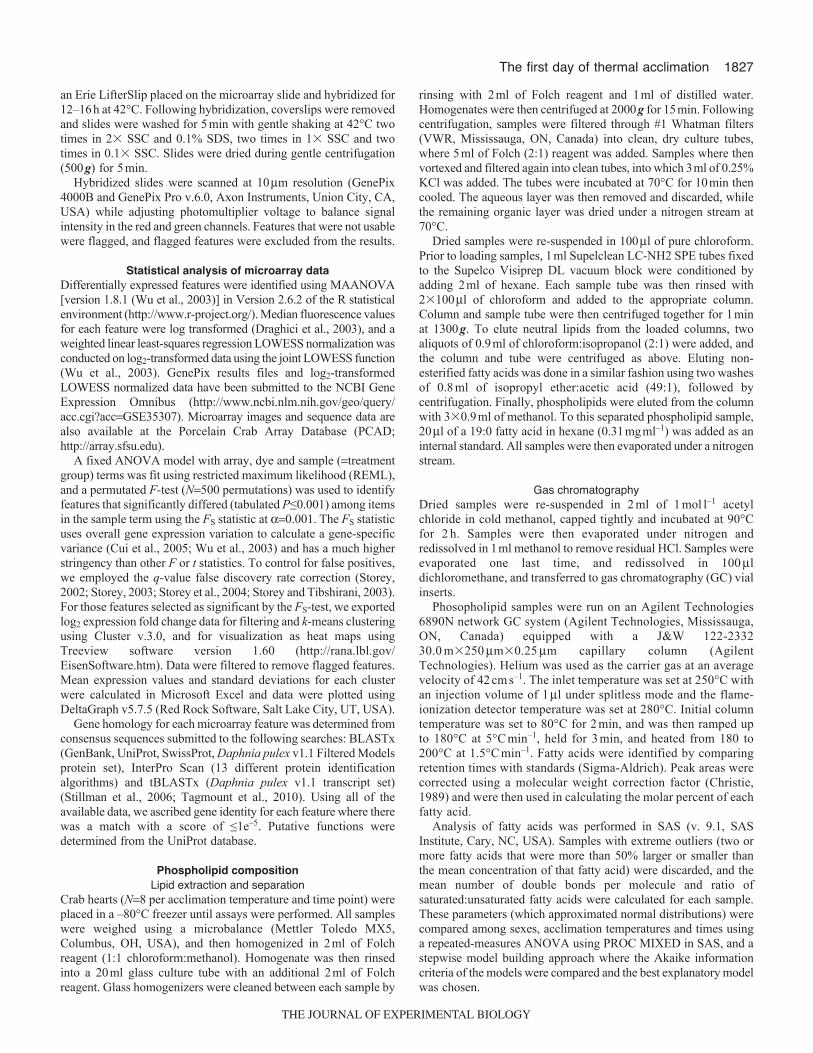
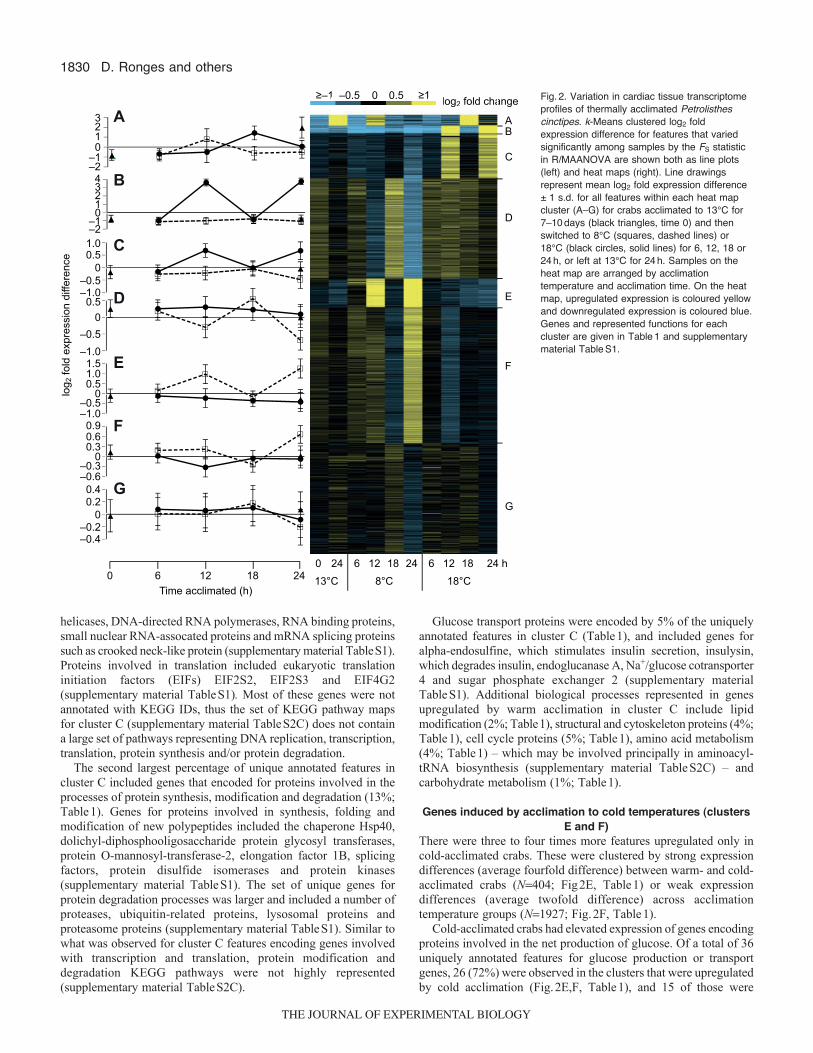
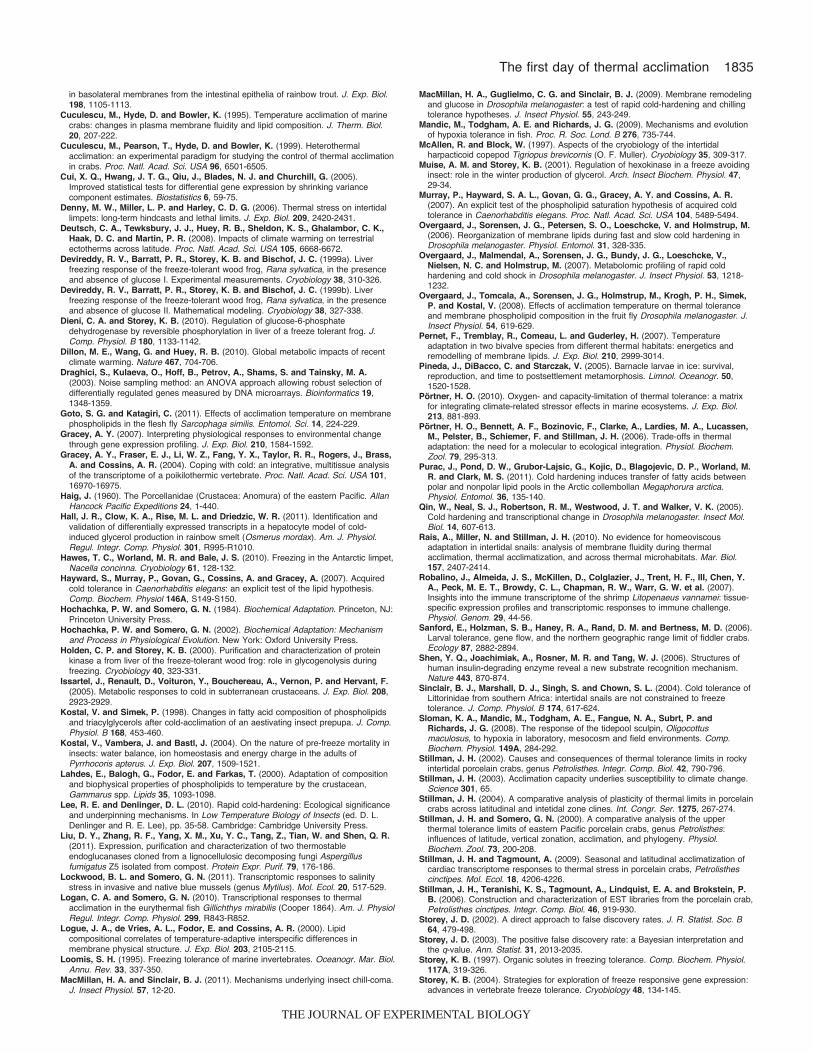
Transcriptome changes during thermal acclimationA total of 6209 microarray features were statistically significantlydifferentially expressed across acclimation treatments and times(Table1). Expression patterns fell into seven k-means clusters: twoclusters contained features solely upregulated in warm-acclimatedcrabs, two clusters contained features solely upregulated in cold-acclimated crabs, and three clusters had mixed expression patternsacross the sample groups and did not vary systematically withacclimation temperature (Fig.2, Table1). In general, there wasconsiderable variation across acclimation time points in expressionlevels (Fig.2). In all clusters there were no differences in expressionobserved at 6h of acclimation, nor were the 6h acclimationexpression levels different from the expression levels of 13°C-acclimated crabs sampled at the start of the acclimation experiment(0h) (Fig.2). Large differences in gene expression between warm-and cold-acclimated crabs were observed at 12 and 24h ofacclimation (Fig.2B–F), although at 18h of acclimation theexpression differences often either disappeared (Fig.2B,C,E,F) orwere the opposite of what was observed at the 12 and 24h timepoints (Fig.2D). In all but one cluster (Fig.2A), there was no changein expression level in 13°C-acclimated crabs between the start (t0h,when crabs had been acclimated to 13°C for 7–10days) and the end(t24 h)of the acclimation experiment (Fig.2). Expression patternswere divided into four groups (Table1): (1) ‘mixed’, where at some
D. Ronges and others
time points expression was higher in 8°C-acclimated crabs and atother time points expression was higher in 18°C-acclimated crabs(Fig.2A,D); (2) ‘no difference’, where there was no systematicdifference between 8°C- and 18°C-acclimated crabs (Fig.2G); (3)‘warm acclimation specific’, where expression was elevated onlyin 18°C-acclimated crabs (Fig.2B,C); and (4) ‘cold acclimationspecific’, where expression was elevated only in 8°C-acclimatedcrabs (Fig.2E,F).
For all seven clusters, approximately 52% of the features hadsome annotation where the sequence matched a known gene, andapproximately 73% of those annotations were to unique genes(Table1), thus approximately 38% of the features within each clusterhad a unique functional annotation. As the purpose of this studywas to identify genes with acclimation-temperature-specificexpression profiles, our paper focuses on the four clusters wherethere was specific induction in warm- (Fig.2C,D) or cold-acclimated(Fig.2E,F) specimens. For each cluster, gene functions were ascribedto 15 categories (Table1), including one category ‘other’ for whichapproximately 24% of all annotated unique genes were placed(Table1). Functions were assessed using the UniProtKB database(http://pir.uniprot.org/uniprot/) as well as primary literature sources.
0
20
40
60
80
100
–2 0 6 12 18 24
0
20
40
60
80
1000
20
40
60
80
100
% S
urvi
val a
fter 1
h e
xpos
ure
to –
2°C
Time acclimated (h)10–11 weeks
A
B
C
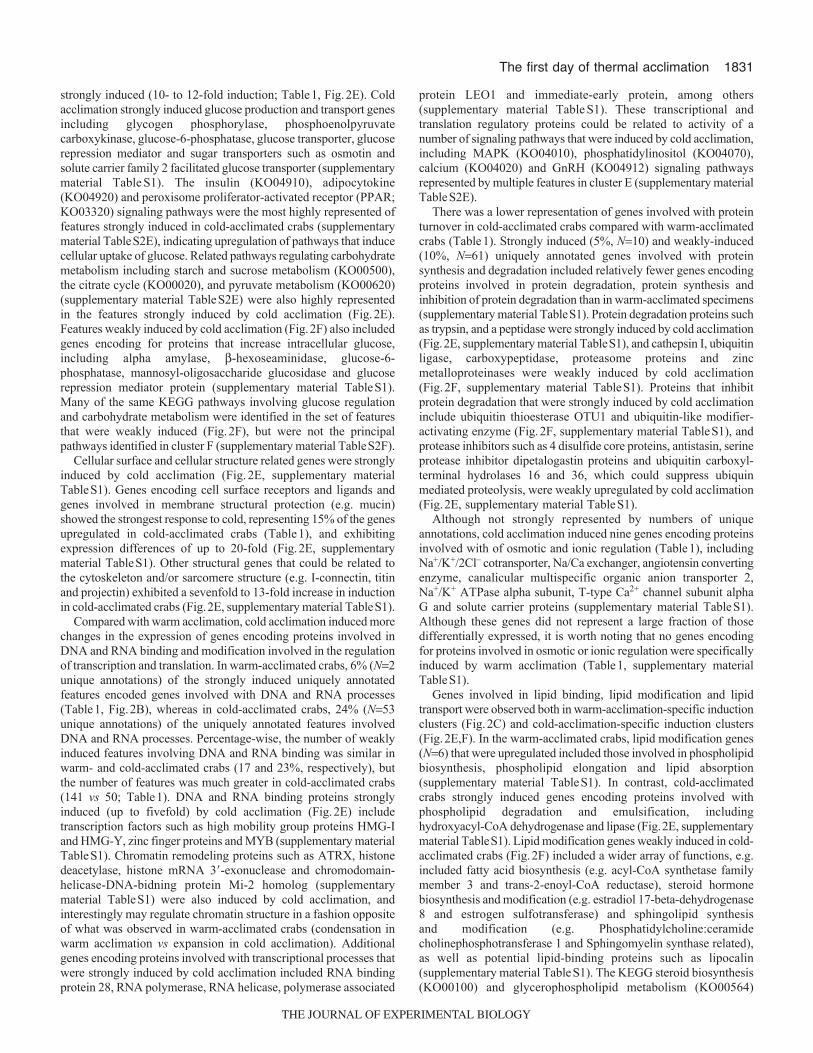
Fig.1. Cold tolerance in Petrolisthes cinctipes changes during the first 24hof thermal acclimation. Survival was assessed in crabs acclimated to 13°Cfor 7–10days (black triangles) and then switched to 8°C (squares, dashedlines) or 18°C (black circles, solid lines) for 1, 3, 6, 12, 18 or 24h or10–11weeks (acclimation endpoint for A and B only). Crabs were removedfrom their acclimation tank, exposed to –2°C for 1h and then replaced backinto the acclimation tank. In the 2008 experiment (A,B), crabs were placedback at their 8 or 18°C acclimation temperature following the –2°Cexposure and survival was assessed after 1day (A) and 5days (B). In the2009 experiment (C), crabs were placed back at 13°C following the –2°Cexposure and survival was assessed after 1day. Differences in tolerance toa –2°C exposure were evident within 6h of acclimation, as cold-acclimatedcrabs (squares) always had higher survival than warm-acclimated crabs(circles), but with substantial fluctuation in survivorship during the first 24h.
THE JOURNAL OF EXPERIMENTAL BIOLOGY
1829The first day of thermal acclimation
Expression data, CloneIDs and functional annotations for all featureswithin each cluster are available in supplementary material TableS1.For the subset of the annotated features in each cluster from whichwe could extract KEGG IDs (Tagmount et al., 2010), KEGGpathway representations have been provided and are hyperlinkedto the KEGG database (supplementary material TableS2).
Genes induced by acclimation to warm temperatures (clustersB and C)
The largest expression changes exhibited an average 34-foldupregulation (Table1) and ranged from 7- to 131-fold upregulation(supplementary material TableS1), and were observed in warm-acclimated crabs (Fig.2B). This cluster (cluster B) was relativelysmall and contained only 99 features, 55 of which were annotatedto 34 unique genes (Table1). Immune response protein-encodinggenes comprised 35% of the 34 unique genes (Table1, cluster B),and included boophilin, carcinin, complement and von WillebrandFactor genes (supplementary material TableS1). Genes encodingproteins involved in extracellular processes comprised 21% of the34 unique genes (Table1, cluster B), and included L-selectin,cerebellin and other cell wall and epithelial proteins (supplementarymaterial TableS1). KEGG pathways identified from more than oneof the features from annotated genes in cluster B (supplementarymaterial TableS2B) included complement and coagulation cascades(KO04610), and neuroactive ligand-receptor interaction (KO04080),supporting both immune response and extracellular processes asbeing upregulated.
Features that were statistically significantly upregulated in warm-acclimated specimens, but that had only a small increase inexpression (twofold), are illustrated in cluster C (Table1, Fig.2C).Cluster C contained 643 features, 58% of which were annotated toknown genes, and 80% of those represented unique genes (Table1),for a total of 46% of features in cluster C representing unique knowngenes. Like cluster B, immune response genes were represented,but only 6% of the unique annotations matched immune and stressresponsive genes (Table1). These genes encoded immune responseproteins such as macroglobulins, Anti-lipopolysaccharide factor,
carcinin, crustin, clotting protein, clumping factor, Kunitz-typeproteinase inhibitor 5 II, lysozyme, macrophage mannose receptor,Plasma kallikrein and complement, and encode stress responseproteins including thioredoxins, the 70 kDa heat shock proteins,heat shock protein 90, hypoxia up-regulated protein 1 and PCNAassociated factor (supplementary material TableS1). One of the mosthighly represented KEGG pathways from cluster C (supplementarymaterial TableS2C) involved immune response (complement andcoagulation cascades, KO04610). Extracellular/intercellularprocesses were highly represented in cluster C, with 9% of the uniqueannotated features. Genes for cuticular and extracellular proteinssuch as cell wall protein DAN4, chitin binding peritrophin-A and–48, endocuticle structural glycoprotein SgAbd-8, FRAS1 and anumber of additional transmembrane and translocon associatedproteins were observed, indicating modification of cell surface andintercellular interaction (supplementary material TableS1). Anumber of N-acetylglucosaminidases and N-acetylglucosaminebinding proteins were also observed (supplementary materialTableS1). KEGG pathways represented by multiple features incluster C that involve extracellular and intercellular actions includegap junction (KO04540), focal adhesion (KO04510), antigenprocessing and presentation (KO04612), neuroactive ligand-receptorinteraction (KO04080), and pathways involving synthesis anddegradation of extracellular matrix materials includingglycosphingolipids, glycosaminoglycans and other glycans(supplementary material TableS2C).
The largest fraction of unique annotated genes represented incluster C (17% of unique features; Table1) encoded proteinsinvolved in modification and regulation of nucleic acids andproteins, representing processes of DNA replication, transcriptionalregulation and translation initiation (supplementary materialTableS1). DNA replication and chromatin modifying proteinsencoded by these genes included DNA replication licensing factorMCM5 and MCM6, histones, histone methytransferase, histoneacetyltransferase and DNA topoisomerase (supplementary materialTableS1). Proteins involved in transcription and processing ofmRNA included kruppel-like factor 6, zinc finger proteins, RNA
Table1. Summary of clustered expression data with functional annotation
Cluster and expression pattern
A B C D E F G
Warm Warm Cold Coldacclimation acclimation acclimation acclimation
Mixed specific specific Mixed specific specific No difference Total
Total no. features 159 99 643 1413 404 1926 1565 6209No. features annotated 71 (45%) 55 (56%) 374 (58%) 795 (56%) 227 (56%) 974 (51%) 740 (47%) 3236 (52%)No. unique annotations 61 (86%) 34 (62%) 301 (80%) 527 (66%) 219 (96%) 605 (62%) 602 (81%) 2349 (73%)
Immune and stress response 8 (13%) 12 (35%) 19 (6%) 9 (2%) 4 (2%) 29 (5%) 45 (7%) 126 (5%)Glucose transport 0 (0%) 0 (0%) 5 (2%) 1 (0%) 15 (7%) 11 (2%) 4 (1%) 36 (2%)Lipid modification 3 (5%) 0 (0%) 6 (2%) 5 (1%) 5 (2%) 19 (3%) 25 (4%) 63 (3%)Transcription/DNA, RNA binding 9 (15%) 2 (6%) 50 (17%) 73 (14%) 53 (24%) 141 (23%) 108 (18%) 436 (19%)Protein synthesis and degradation 3 (5%) 3 (9%) 39 (13%) 124 (24%) 10 (5%) 61 (10%) 106 (18%) 346 (15%)Extracellular/cuticle/cell–cell interaction 8 (13%) 7 (21%) 27 (9%) 13 (2%) 2 (1%) 69 (11%) 53 (9%) 179 (8%)Biological rhythms 0 (0%) 2 (6%) 0 (0%) 0 (0%) 0 (0%) 0 (0%) 0 (0%) 2 (0%)Structural–cytoskeleton 3 (5%) 0 (0%) 11 (4%) 42 (8%) 32 (15%) 59 (10%) 30 (5%) 177 (8%)Cell cycle or cell development 5 (8%) 0 (0%) 14 (5%) 11 (2%) 10 (5%) 22 (4%) 20 (3%) 82 (3%)Transport 0 (0%) 1 (3%) 10 (3%) 5 (1%) 3 (1%) 10 (2%) 24 (4%) 53 (2%)Amino acid metabolism 1 (2%) 0 (0%) 11 (4%) 0 (0%) 0 (0%) 6 (1%) 12 (2%) 30 (1%)Osmotic and ionic regulation 0 (0%) 0 (0%) 0 (0%) 0 (0%) 2 (1%) 7 (1%) 16 (3%) 25 (1%)Oxidative metabolism 1 (2%) 0 (0%) 0 (0%) 139 (26%) 0 (0%) 28 (5%) 38 (6%) 206 (9%)Carbohydrate metabolism 1 (2%) 0 (0%) 4 (1%) 0 (0%) 0 (0%) 0 (0%) 15 (2%) 20 (1%)Other 19 (31%) 7 (21%) 105 (35%) 105 (20%) 83 (38%) 143 (24%) 106 (18%) 568 (24%)
THE JOURNAL OF EXPERIMENTAL BIOLOGY
1830
helicases, DNA-directed RNA polymerases, RNA binding proteins,small nuclear RNA-assocated proteins and mRNA splicing proteinssuch as crooked neck-like protein (supplementary material TableS1).Proteins involved in translation included eukaryotic translationinitiation factors (EIFs) EIF2S2, EIF2S3 and EIF4G2(supplementary material TableS1). Most of these genes were notannotated with KEGG IDs, thus the set of KEGG pathway mapsfor cluster C (supplementary material TableS2C) does not containa large set of pathways representing DNA replication, transcription,translation, protein synthesis and/or protein degradation.
The second largest percentage of unique annotated features incluster C included genes that encoded for proteins involved in theprocesses of protein synthesis, modification and degradation (13%;Table1). Genes for proteins involved in synthesis, folding andmodification of new polypeptides included the chaperone Hsp40,dolichyl-diphosphooligosaccharide protein glycosyl transferases,protein O-mannosyl-transferase-2, elongation factor 1B, splicingfactors, protein disulfide isomerases and protein kinases(supplementary material TableS1). The set of unique genes forprotein degradation processes was larger and included a number ofproteases, ubiquitin-related proteins, lysosomal proteins andproteasome proteins (supplementary material TableS1). Similar towhat was observed for cluster C features encoding genes involvedwith transcription and translation, protein modification anddegradation KEGG pathways were not highly represented(supplementary material TableS2C).
D. Ronges and others
Glucose transport proteins were encoded by 5% of the uniquelyannotated features in cluster C (Table1), and included genes foralpha-endosulfine, which stimulates insulin secretion, insulysin,which degrades insulin, endoglucanase A, Na+/glucose cotransporter4 and sugar phosphate exchanger 2 (supplementary materialTableS1). Additional biological processes represented in genesupregulated by warm acclimation in cluster C include lipidmodification (2%; Table1), structural and cytoskeleton proteins (4%;Table1), cell cycle proteins (5%; Table1), amino acid metabolism(4%; Table1) – which may be involved principally in aminoacyl-tRNA biosynthesis (supplementary material TableS2C) – andcarbohydrate metabolism (1%; Table1).
Genes induced by acclimation to cold temperatures (clustersE and F)
There were three to four times more features upregulated only incold-acclimated crabs. These were clustered by strong expressiondifferences (average fourfold difference) between warm- and cold-acclimated crabs (N404; Fig2E, Table1) or weak expressiondifferences (average twofold difference) across acclimationtemperature groups (N1927; Fig.2F, Table1).
Cold-acclimated crabs had elevated expression of genes encodingproteins involved in the net production of glucose. Of a total of 36uniquely annotated features for glucose production or transportgenes, 26 (72%) were observed in the clusters that were upregulatedby cold acclimation (Fig.2E,F, Table1), and 15 of those were
A
C
B
D
E
F
G
0 24 6 2412 18 6 24 h12 1813°C 8°C 18°C0 6 12 18 24
Time acclimated (h)
log 2
fold
exp
ress
ion
diffe
renc
e
0≥–1 –0.5 0.5 ≥1 log2 fold change0≥ 1 0.5 0.5 ≥1 log2 fold chaA
C
B
D
E
F
G0
–0.2–0.4
0.40.2
0–0.3–0.6
0.60.3
0.9
0–0.5–1.0
1.00.5
0–0.5–1.0
1.00.5
0–0.5–1.0
0.5
1.5
0–1–2
213
0–1–2
21
3
4
Fig.2. Variation in cardiac tissue transcriptomeprofiles of thermally acclimated Petrolisthescinctipes. k-Means clustered log2 foldexpression difference for features that variedsignificantly among samples by the FS statisticin R/MAANOVA are shown both as line plots(left) and heat maps (right). Line drawingsrepresent mean log2 fold expression difference± 1 s.d. for all features within each heat mapcluster (A–G) for crabs acclimated to 13°C for7–10days (black triangles, time 0) and thenswitched to 8°C (squares, dashed lines) or18°C (black circles, solid lines) for 6, 12, 18 or24h, or left at 13°C for 24h. Samples on theheat map are arranged by acclimationtemperature and acclimation time. On the heatmap, upregulated expression is coloured yellowand downregulated expression is coloured blue.Genes and represented functions for eachcluster are given in Table1 and supplementarymaterial TableS1.
THE JOURNAL OF EXPERIMENTAL BIOLOGY
1831The first day of thermal acclimation
strongly induced (10- to 12-fold induction; Table1, Fig.2E). Coldacclimation strongly induced glucose production and transport genesincluding glycogen phosphorylase, phosphoenolpyruvatecarboxykinase, glucose-6-phosphatase, glucose transporter, glucoserepression mediator and sugar transporters such as osmotin andsolute carrier family 2 facilitated glucose transporter (supplementarymaterial TableS1). The insulin (KO04910), adipocytokine(KO04920) and peroxisome proliferator-activated receptor (PPAR;KO03320) signaling pathways were the most highly represented offeatures strongly induced in cold-acclimated crabs (supplementarymaterial TableS2E), indicating upregulation of pathways that inducecellular uptake of glucose. Related pathways regulating carbohydratemetabolism including starch and sucrose metabolism (KO00500),the citrate cycle (KO00020), and pyruvate metabolism (KO00620)(supplementary material TableS2E) were also highly representedin the features strongly induced by cold acclimation (Fig.2E).Features weakly induced by cold acclimation (Fig.2F) also includedgenes encoding for proteins that increase intracellular glucose,including alpha amylase, b-hexoseaminidase, glucose-6-phosphatase, mannosyl-oligosaccharide glucosidase and glucoserepression mediator protein (supplementary material TableS1).Many of the same KEGG pathways involving glucose regulationand carbohydrate metabolism were identified in the set of featuresthat were weakly induced (Fig.2F), but were not the principalpathways identified in cluster F (supplementary material TableS2F).
Cellular surface and cellular structure related genes were stronglyinduced by cold acclimation (Fig.2E, supplementary materialTableS1). Genes encoding cell surface receptors and ligands andgenes involved in membrane structural protection (e.g. mucin)showed the strongest response to cold, representing 15% of the genesupregulated in cold-acclimated crabs (Table1), and exhibitingexpression differences of up to 20-fold (Fig.2E, supplementarymaterial TableS1). Other structural genes that could be related tothe cytoskeleton and/or sarcomere structure (e.g. I-connectin, titinand projectin) exhibited a sevenfold to 13-fold increase in inductionin cold-acclimated crabs (Fig.2E, supplementary material TableS1).
Compared with warm acclimation, cold acclimation induced morechanges in the expression of genes encoding proteins involved inDNA and RNA binding and modification involved in the regulationof transcription and translation. In warm-acclimated crabs, 6% (N2unique annotations) of the strongly induced uniquely annotatedfeatures encoded genes involved with DNA and RNA processes(Table1, Fig.2B), whereas in cold-acclimated crabs, 24% (N53unique annotations) of the uniquely annotated features involvedDNA and RNA processes. Percentage-wise, the number of weaklyinduced features involving DNA and RNA binding was similar inwarm- and cold-acclimated crabs (17 and 23%, respectively), butthe number of features was much greater in cold-acclimated crabs(141 vs 50; Table1). DNA and RNA binding proteins stronglyinduced (up to fivefold) by cold acclimation (Fig.2E) includetranscription factors such as high mobility group proteins HMG-Iand HMG-Y, zinc finger proteins and MYB (supplementary materialTableS1). Chromatin remodeling proteins such as ATRX, histonedeacetylase, histone mRNA 3�-exonuclease and chromodomain-helicase-DNA-bidning protein Mi-2 homolog (supplementarymaterial TableS1) were also induced by cold acclimation, andinterestingly may regulate chromatin structure in a fashion oppositeof what was observed in warm-acclimated crabs (condensation inwarm acclimation vs expansion in cold acclimation). Additionalgenes encoding proteins involved with transcriptional processes thatwere strongly induced by cold acclimation included RNA bindingprotein 28, RNA polymerase, RNA helicase, polymerase associated
protein LEO1 and immediate-early protein, among others(supplementary material TableS1). These transcriptional andtranslation regulatory proteins could be related to activity of anumber of signaling pathways that were induced by cold acclimation,including MAPK (KO04010), phosphatidylinositol (KO04070),calcium (KO04020) and GnRH (KO04912) signaling pathwaysrepresented by multiple features in cluster E (supplementary materialTableS2E).
There was a lower representation of genes involved with proteinturnover in cold-acclimated crabs compared with warm-acclimatedcrabs (Table1). Strongly induced (5%, N10) and weakly-induced(10%, N61) uniquely annotated genes involved with proteinsynthesis and degradation included relatively fewer genes encodingproteins involved in protein degradation, protein synthesis andinhibition of protein degradation than in warm-acclimated specimens(supplementary material TableS1). Protein degradation proteins suchas trypsin, and a peptidase were strongly induced by cold acclimation(Fig.2E, supplementary material TableS1), and cathepsin I, ubiquitinligase, carboxypeptidase, proteasome proteins and zincmetalloproteinases were weakly induced by cold acclimation(Fig.2F, supplementary material TableS1). Proteins that inhibitprotein degradation that were strongly induced by cold acclimationinclude ubiquitin thioesterase OTU1 and ubiquitin-like modifier-activating enzyme (Fig.2F, supplementary material TableS1), andprotease inhibitors such as 4 disulfide core proteins, antistasin, serineprotease inhibitor dipetalogastin proteins and ubiquitin carboxyl-terminal hydrolases 16 and 36, which could suppress ubiquinmediated proteolysis, were weakly upregulated by cold acclimation(Fig.2E, supplementary material TableS1).
Although not strongly represented by numbers of uniqueannotations, cold acclimation induced nine genes encoding proteinsinvolved with of osmotic and ionic regulation (Table1), includingNa+/K+/2Cl– cotransporter, Na/Ca exchanger, angiotensin convertingenzyme, canalicular multispecific organic anion transporter 2,Na+/K+ ATPase alpha subunit, T-type Ca2+ channel subunit alphaG and solute carrier proteins (supplementary material TableS1).Although these genes did not represent a large fraction of thosedifferentially expressed, it is worth noting that no genes encodingfor proteins involved in osmotic or ionic regulation were specificallyinduced by warm acclimation (Table1, supplementary materialTableS1).
Genes involved in lipid binding, lipid modification and lipidtransport were observed both in warm-acclimation-specific inductionclusters (Fig.2C) and cold-acclimation-specific induction clusters(Fig.2E,F). In the warm-acclimated crabs, lipid modification genes(N6) that were upregulated included those involved in phospholipidbiosynthesis, phospholipid elongation and lipid absorption(supplementary material TableS1). In contrast, cold-acclimatedcrabs strongly induced genes encoding proteins involved withphospholipid degradation and emulsification, includinghydroxyacyl-CoA dehydrogenase and lipase (Fig.2E, supplementarymaterial TableS1). Lipid modification genes weakly induced in cold-acclimated crabs (Fig.2F) included a wider array of functions, e.g.included fatty acid biosynthesis (e.g. acyl-CoA synthetase familymember 3 and trans-2-enoyl-CoA reductase), steroid hormonebiosynthesis and modification (e.g. estradiol 17-beta-dehydrogenase8 and estrogen sulfotransferase) and sphingolipid synthesis and modification (e.g. Phosphatidylcholine:ceramidecholinephosphotransferase 1 and Sphingomyelin synthase related),as well as potential lipid-binding proteins such as lipocalin(supplementary material TableS1). The KEGG steroid biosynthesis(KO00100) and glycerophospholipid metabolism (KO00564)
THE JOURNAL OF EXPERIMENTAL BIOLOGY
1832
pathways were well represented in genes weakly induced by coldacclimation (Fig.2F), as were a number of additional lipidmetabolism and modification pathways (supplementary materialTableS2).
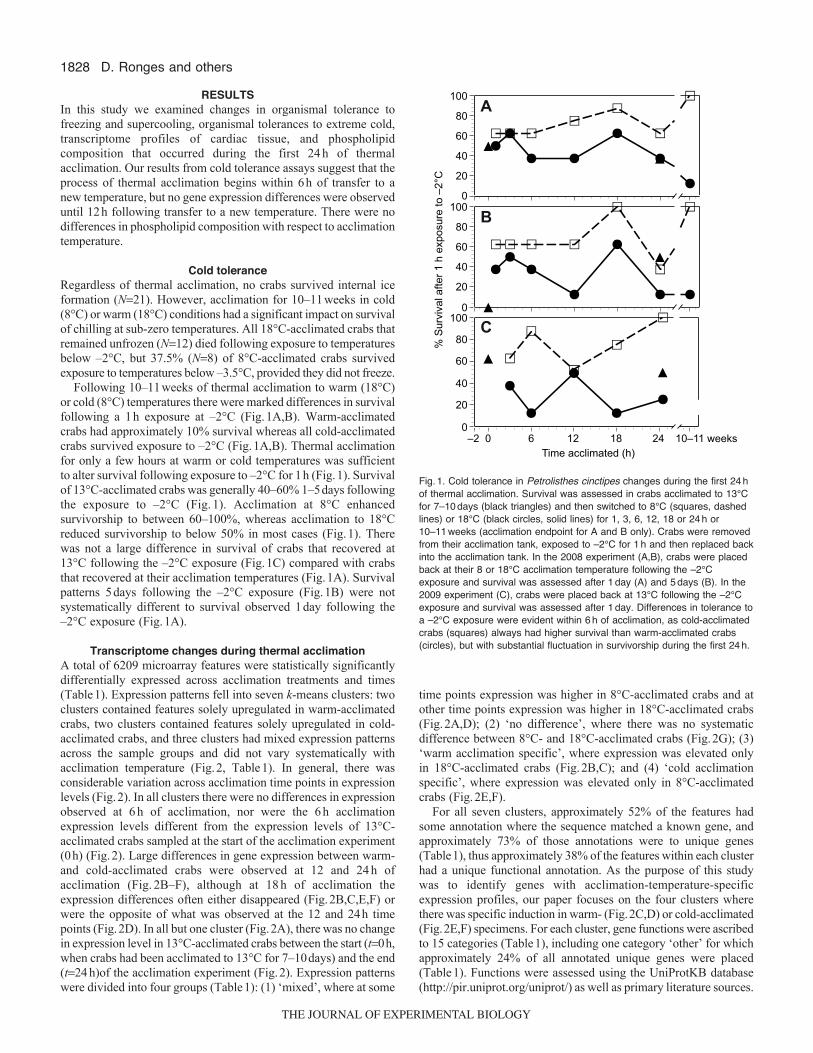
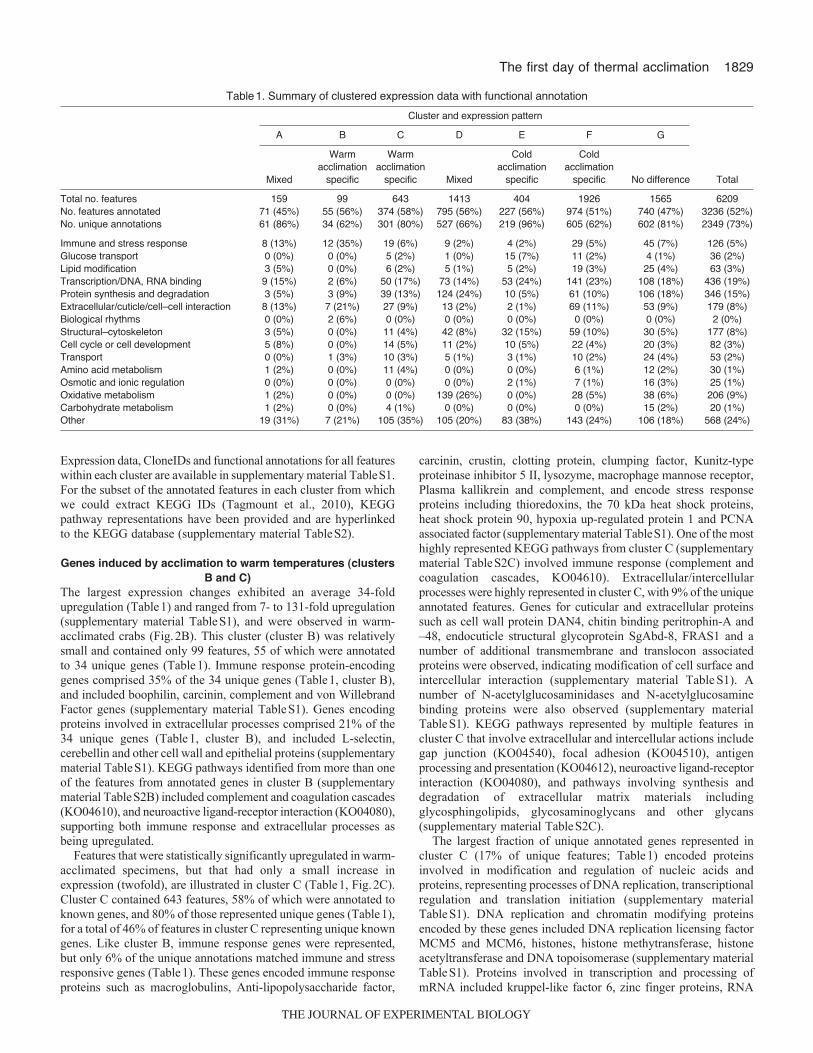
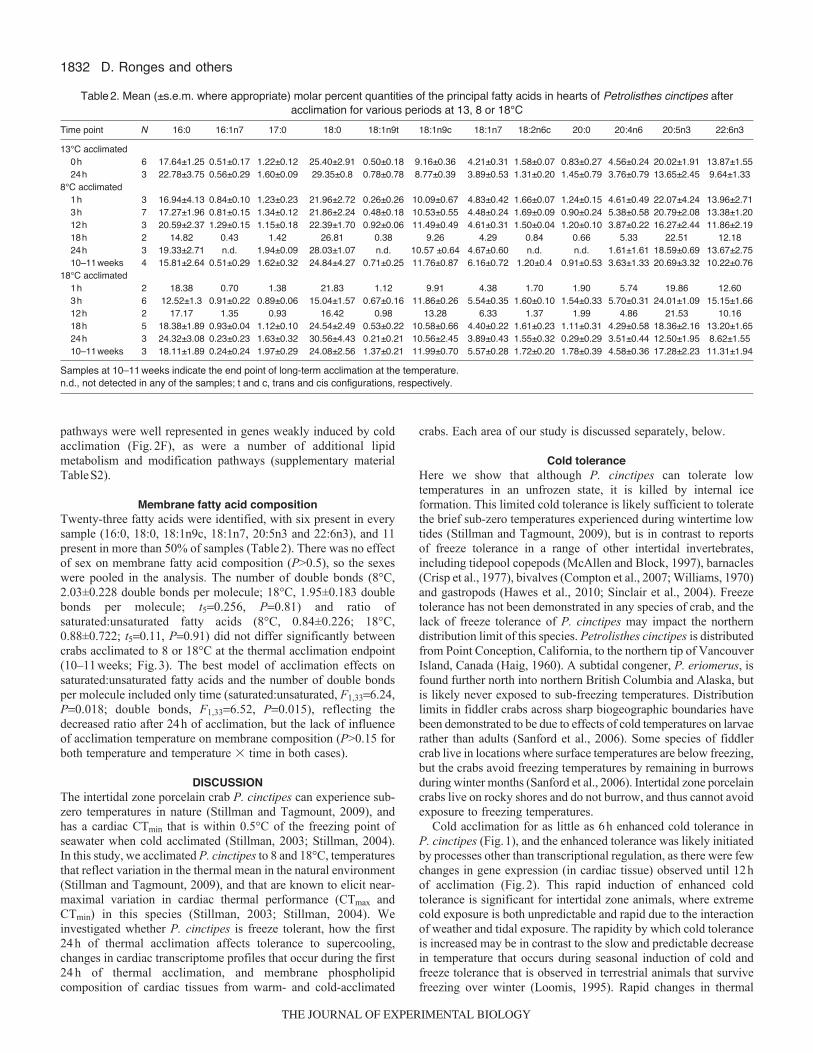
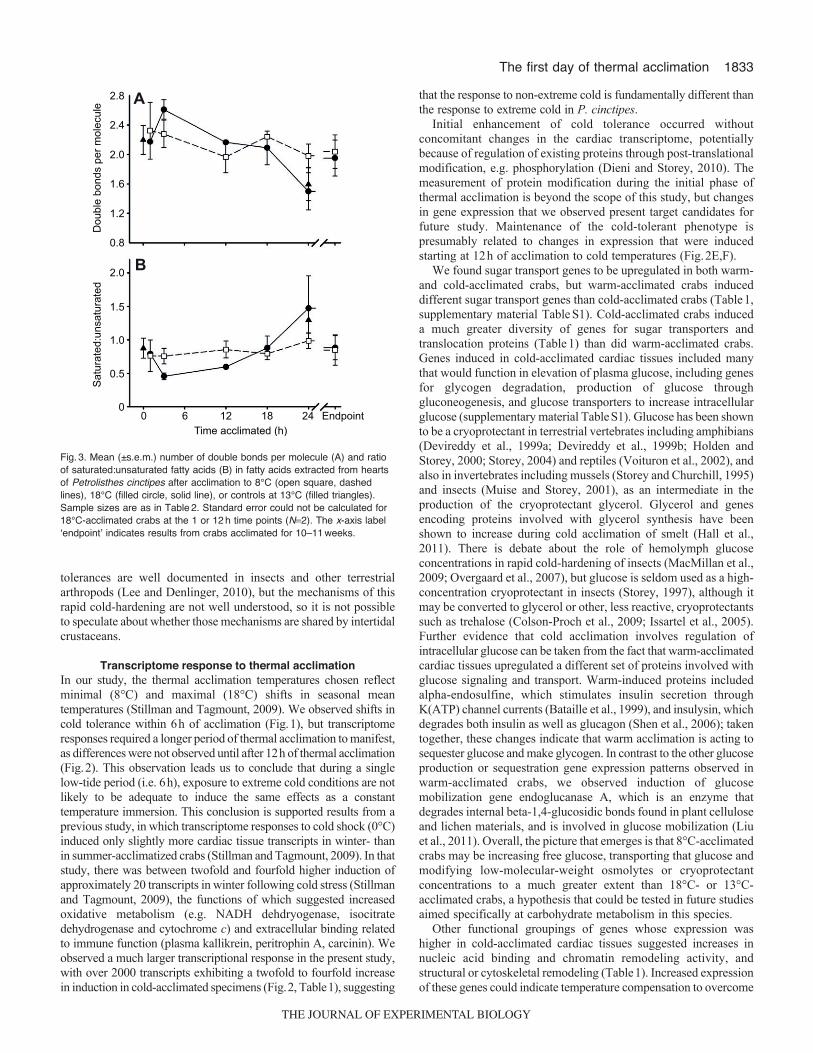
Membrane fatty acid compositionTwenty-three fatty acids were identified, with six present in everysample (16:0, 18:0, 18:1n9c, 18:1n7, 20:5n3 and 22:6n3), and 11present in more than 50% of samples (Table2). There was no effectof sex on membrane fatty acid composition (P>0.5), so the sexeswere pooled in the analysis. The number of double bonds (8°C,2.03±0.228 double bonds per molecule; 18°C, 1.95±0.183 doublebonds per molecule; t50.256, P0.81) and ratio ofsaturated:unsaturated fatty acids (8°C, 0.84±0.226; 18°C,0.88±0.722; t50.11, P0.91) did not differ significantly betweencrabs acclimated to 8 or 18°C at the thermal acclimation endpoint(10–11weeks; Fig.3). The best model of acclimation effects onsaturated:unsaturated fatty acids and the number of double bondsper molecule included only time (saturated:unsaturated, F1,336.24,P0.018; double bonds, F1,336.52, P0.015), reflecting thedecreased ratio after 24h of acclimation, but the lack of influenceof acclimation temperature on membrane composition (P>0.15 forboth temperature and temperature � time in both cases).
DISCUSSIONThe intertidal zone porcelain crab P. cinctipes can experience sub-zero temperatures in nature (Stillman and Tagmount, 2009), andhas a cardiac CTmin that is within 0.5°C of the freezing point ofseawater when cold acclimated (Stillman, 2003; Stillman, 2004).In this study, we acclimated P. cinctipes to 8 and 18°C, temperaturesthat reflect variation in the thermal mean in the natural environment(Stillman and Tagmount, 2009), and that are known to elicit near-maximal variation in cardiac thermal performance (CTmax andCTmin) in this species (Stillman, 2003; Stillman, 2004). Weinvestigated whether P. cinctipes is freeze tolerant, how the first24h of thermal acclimation affects tolerance to supercooling,changes in cardiac transcriptome profiles that occur during the first24h of thermal acclimation, and membrane phospholipidcomposition of cardiac tissues from warm- and cold-acclimated
D. Ronges and others
crabs. Each area of our study is discussed separately, below.
Cold toleranceHere we show that although P. cinctipes can tolerate lowtemperatures in an unfrozen state, it is killed by internal iceformation. This limited cold tolerance is likely sufficient to toleratethe brief sub-zero temperatures experienced during wintertime lowtides (Stillman and Tagmount, 2009), but is in contrast to reportsof freeze tolerance in a range of other intertidal invertebrates,including tidepool copepods (McAllen and Block, 1997), barnacles(Crisp et al., 1977), bivalves (Compton et al., 2007; Williams, 1970)and gastropods (Hawes et al., 2010; Sinclair et al., 2004). Freezetolerance has not been demonstrated in any species of crab, and thelack of freeze tolerance of P. cinctipes may impact the northerndistribution limit of this species. Petrolisthes cinctipes is distributedfrom Point Conception, California, to the northern tip of VancouverIsland, Canada (Haig, 1960). A subtidal congener, P. eriomerus, isfound further north into northern British Columbia and Alaska, butis likely never exposed to sub-freezing temperatures. Distributionlimits in fiddler crabs across sharp biogeographic boundaries havebeen demonstrated to be due to effects of cold temperatures on larvaerather than adults (Sanford et al., 2006). Some species of fiddlercrab live in locations where surface temperatures are below freezing,but the crabs avoid freezing temperatures by remaining in burrowsduring winter months (Sanford et al., 2006). Intertidal zone porcelaincrabs live on rocky shores and do not burrow, and thus cannot avoidexposure to freezing temperatures.
Cold acclimation for as little as 6h enhanced cold tolerance inP. cinctipes (Fig.1), and the enhanced tolerance was likely initiatedby processes other than transcriptional regulation, as there were fewchanges in gene expression (in cardiac tissue) observed until 12hof acclimation (Fig.2). This rapid induction of enhanced coldtolerance is significant for intertidal zone animals, where extremecold exposure is both unpredictable and rapid due to the interactionof weather and tidal exposure. The rapidity by which cold toleranceis increased may be in contrast to the slow and predictable decreasein temperature that occurs during seasonal induction of cold andfreeze tolerance that is observed in terrestrial animals that survivefreezing over winter (Loomis, 1995). Rapid changes in thermal
Table2. Mean (±s.e.m. where appropriate) molar percent quantities of the principal fatty acids in hearts of Petrolisthes cinctipes afteracclimation for various periods at 13, 8 or 18°C
Time point N 16:0 16:1n7 17:0 18:0 18:1n9t 18:1n9c 18:1n7 18:2n6c 20:0 20:4n6 20:5n3 22:6n3
13°C acclimated0h 6 17.64±1.25 0.51±0.17 1.22±0.12 25.40±2.91 0.50±0.18 9.16±0.36 4.21±0.31 1.58±0.07 0.83±0.27 4.56±0.24 20.02±1.91 13.87±1.5524h 3 22.78±3.75 0.56±0.29 1.60±0.09 29.35±0.8 0.78±0.78 8.77±0.39 3.89±0.53 1.31±0.20 1.45±0.79 3.76±0.79 13.65±2.45 9.64±1.33
8°C acclimated1h 3 16.94±4.13 0.84±0.10 1.23±0.23 21.96±2.72 0.26±0.26 10.09±0.67 4.83±0.42 1.66±0.07 1.24±0.15 4.61±0.49 22.07±4.24 13.96±2.713h 7 17.27±1.96 0.81±0.15 1.34±0.12 21.86±2.24 0.48±0.18 10.53±0.55 4.48±0.24 1.69±0.09 0.90±0.24 5.38±0.58 20.79±2.08 13.38±1.2012h 3 20.59±2.37 1.29±0.15 1.15±0.18 22.39±1.70 0.92±0.06 11.49±0.49 4.61±0.31 1.50±0.04 1.20±0.10 3.87±0.22 16.27±2.44 11.86±2.1918h 2 14.82 0.43 1.42 26.81 0.38 9.26 4.29 0.84 0.66 5.33 22.51 12.1824h 3 19.33±2.71 n.d. 1.94±0.09 28.03±1.07 n.d. 10.57 ±0.64 4.67±0.60 n.d. n.d. 1.61±1.61 18.59±0.69 13.67±2.7510–11weeks 4 15.81±2.64 0.51±0.29 1.62±0.32 24.84±4.27 0.71±0.25 11.76±0.87 6.16±0.72 1.20±0.4 0.91±0.53 3.63±1.33 20.69±3.32 10.22±0.76
18°C acclimated1h 2 18.38 0.70 1.38 21.83 1.12 9.91 4.38 1.70 1.90 5.74 19.86 12.603h 6 12.52±1.3 0.91±0.22 0.89±0.06 15.04±1.57 0.67±0.16 11.86±0.26 5.54±0.35 1.60±0.10 1.54±0.33 5.70±0.31 24.01±1.09 15.15±1.6612h 2 17.17 1.35 0.93 16.42 0.98 13.28 6.33 1.37 1.99 4.86 21.53 10.1618h 5 18.38±1.89 0.93±0.04 1.12±0.10 24.54±2.49 0.53±0.22 10.58±0.66 4.40±0.22 1.61±0.23 1.11±0.31 4.29±0.58 18.36±2.16 13.20±1.6524h 3 24.32±3.08 0.23±0.23 1.63±0.32 30.56±4.43 0.21±0.21 10.56±2.45 3.89±0.43 1.55±0.32 0.29±0.29 3.51±0.44 12.50±1.95 8.62±1.5510–11weeks 3 18.11±1.89 0.24±0.24 1.97±0.29 24.08±2.56 1.37±0.21 11.99±0.70 5.57±0.28 1.72±0.20 1.78±0.39 4.58±0.36 17.28±2.23 11.31±1.94
Samples at 10–11weeks indicate the end point of long-term acclimation at the temperature.n.d., not detected in any of the samples; t and c, trans and cis configurations, respectively.
THE JOURNAL OF EXPERIMENTAL BIOLOGY
1833The first day of thermal acclimation
tolerances are well documented in insects and other terrestrialarthropods (Lee and Denlinger, 2010), but the mechanisms of thisrapid cold-hardening are not well understood, so it is not possibleto speculate about whether those mechanisms are shared by intertidalcrustaceans.
Transcriptome response to thermal acclimationIn our study, the thermal acclimation temperatures chosen reflectminimal (8°C) and maximal (18°C) shifts in seasonal meantemperatures (Stillman and Tagmount, 2009). We observed shifts incold tolerance within 6h of acclimation (Fig.1), but transcriptomeresponses required a longer period of thermal acclimation to manifest,as differences were not observed until after 12h of thermal acclimation(Fig.2). This observation leads us to conclude that during a singlelow-tide period (i.e. 6h), exposure to extreme cold conditions are notlikely to be adequate to induce the same effects as a constanttemperature immersion. This conclusion is supported results from aprevious study, in which transcriptome responses to cold shock (0°C)induced only slightly more cardiac tissue transcripts in winter- thanin summer-acclimatized crabs (Stillman and Tagmount, 2009). In thatstudy, there was between twofold and fourfold higher induction ofapproximately 20 transcripts in winter following cold stress (Stillmanand Tagmount, 2009), the functions of which suggested increasedoxidative metabolism (e.g. NADH dehdryogenase, isocitratedehydrogenase and cytochrome c) and extracellular binding relatedto immune function (plasma kallikrein, peritrophin A, carcinin). Weobserved a much larger transcriptional response in the present study,with over 2000 transcripts exhibiting a twofold to fourfold increasein induction in cold-acclimated specimens (Fig.2, Table1), suggesting
that the response to non-extreme cold is fundamentally different thanthe response to extreme cold in P. cinctipes.
Initial enhancement of cold tolerance occurred withoutconcomitant changes in the cardiac transcriptome, potentiallybecause of regulation of existing proteins through post-translationalmodification, e.g. phosphorylation (Dieni and Storey, 2010). Themeasurement of protein modification during the initial phase ofthermal acclimation is beyond the scope of this study, but changesin gene expression that we observed present target candidates forfuture study. Maintenance of the cold-tolerant phenotype ispresumably related to changes in expression that were inducedstarting at 12h of acclimation to cold temperatures (Fig.2E,F).
We found sugar transport genes to be upregulated in both warm-and cold-acclimated crabs, but warm-acclimated crabs induceddifferent sugar transport genes than cold-acclimated crabs (Table1,supplementary material TableS1). Cold-acclimated crabs induceda much greater diversity of genes for sugar transporters andtranslocation proteins (Table1) than did warm-acclimated crabs.Genes induced in cold-acclimated cardiac tissues included manythat would function in elevation of plasma glucose, including genesfor glycogen degradation, production of glucose throughgluconeogenesis, and glucose transporters to increase intracellularglucose (supplementary material TableS1). Glucose has been shownto be a cryoprotectant in terrestrial vertebrates including amphibians(Devireddy et al., 1999a; Devireddy et al., 1999b; Holden andStorey, 2000; Storey, 2004) and reptiles (Voituron et al., 2002), andalso in invertebrates including mussels (Storey and Churchill, 1995)and insects (Muise and Storey, 2001), as an intermediate in theproduction of the cryoprotectant glycerol. Glycerol and genesencoding proteins involved with glycerol synthesis have beenshown to increase during cold acclimation of smelt (Hall et al.,2011). There is debate about the role of hemolymph glucoseconcentrations in rapid cold-hardening of insects (MacMillan et al.,2009; Overgaard et al., 2007), but glucose is seldom used as a high-concentration cryoprotectant in insects (Storey, 1997), although itmay be converted to glycerol or other, less reactive, cryoprotectantssuch as trehalose (Colson-Proch et al., 2009; Issartel et al., 2005).Further evidence that cold acclimation involves regulation ofintracellular glucose can be taken from the fact that warm-acclimatedcardiac tissues upregulated a different set of proteins involved withglucose signaling and transport. Warm-induced proteins includedalpha-endosulfine, which stimulates insulin secretion throughK(ATP) channel currents (Bataille et al., 1999), and insulysin, whichdegrades both insulin as well as glucagon (Shen et al., 2006); takentogether, these changes indicate that warm acclimation is acting tosequester glucose and make glycogen. In contrast to the other glucoseproduction or sequestration gene expression patterns observed inwarm-acclimated crabs, we observed induction of glucosemobilization gene endoglucanase A, which is an enzyme thatdegrades internal beta-1,4-glucosidic bonds found in plant celluloseand lichen materials, and is involved in glucose mobilization (Liuet al., 2011). Overall, the picture that emerges is that 8°C-acclimatedcrabs may be increasing free glucose, transporting that glucose andmodifying low-molecular-weight osmolytes or cryoprotectantconcentrations to a much greater extent than 18°C- or 13°C-acclimated crabs, a hypothesis that could be tested in future studiesaimed specifically at carbohydrate metabolism in this species.
Other functional groupings of genes whose expression washigher in cold-acclimated cardiac tissues suggested increases innucleic acid binding and chromatin remodeling activity, andstructural or cytoskeletal remodeling (Table1). Increased expressionof these genes could indicate temperature compensation to overcome
0
0.5
1.0
1.5
2.0
0.8
1.2
1.6
2.0
2.4
2.8
0 6 12 18 24 Endpoint
Sat
urat
ed:u
nsat
urat
edD
oubl
e bo
nds
per m
olec
ule
Time acclimated (h)
A
B
Fig.3. Mean (±s.e.m.) number of double bonds per molecule (A) and ratioof saturated:unsaturated fatty acids (B) in fatty acids extracted from heartsof Petrolisthes cinctipes after acclimation to 8°C (open square, dashedlines), 18°C (filled circle, solid line), or controls at 13°C (filled triangles).Sample sizes are as in Table2. Standard error could not be calculated for18°C-acclimated crabs at the 1 or 12h time points (N2). The x-axis labelʻendpointʼ indicates results from crabs acclimated for 10–11weeks.
THE JOURNAL OF EXPERIMENTAL BIOLOGY
1834
Q10 effects of the cold by increasing the protein amount of the samegenes, or specific changes within the cells such as modification ofeuchromatin or restructuring of the cytoskeleton in a temperature-specific fashion. Regulation of transcription varied with thermalacclimation of fish heart muscle (Castiho, 2009), and many genesinvolved with regulation of transcription and translation, mostnotably transcription factors and RNA modification proteins, weredifferentially regulated with seasonal acclimatization in P. cinctipes(Stillman and Tagmount, 2009).
The strongest induction of any microarray features was observedin warm-acclimated specimens (Fig.2, cluster B). Genes representedby those microarray features were largely for those that may beinvolved in immune responses through antimicrobial activity (e.g.carcinin), the complement and coagulation cascade (e.g. complementC1q, kalikrein and von Willebrand factor), as well as binding at theextracellular surface (e.g. L-selectin and cell wall proteins)(supplementary material TableS1). However, in cardiac tissues offield-acclimatized P. cinctipes, some of the same genes were observedto have higher expression in specimens collected during winter, andfrom sites with lower average temperatures (Stillman and Tagmount,2009), a result that is contradictory to findings in the present study.Genes involved in immune responses have been observed in otherfunctional genomic studies of crustacean responses to thermal stress[e.g. shrimp (Cottin, 2010)], as well as in response to infection inshrimp (Robalino, 2007). Genes associated with the immune responseare upregulated 6h after cold exposure in Drosophila melanogaster(Zhang et al., 2011), but not in flies exposed for shorter time periods(Qin et al., 2005), so it is possible that the immune response observedin the field is a longer-term response. Nevertheless, the specific roleof immune response genes in thermal responses vs responses toinfection and/or hemolymph clotting requires further investigation inboth crustaceans and insects.
Membrane phospholipidsChilling injury in insects is commonly thought to accrue via membranephase transitions, which can be obviated via remodeling of themembrane (MacMillan and Sinclair, 2011). For example, coldacclimation induced membrane phospholipid changes consistent withhomeoviscous adaptation in the flesh fly Sarcophaga similis (Gotoand Katagiri, 2011), the Arctic collembolan Megaphorura arctica(Purac et al., 2011) and bivalve molluscs (Pernet et al., 2007). Thefatty acid composition of P. cinctipes hearts was broadly consistentwith that of muscle tissue of other crustaceans (Cuculescu et al., 1995).We did not observe remodeling of cardiac tissue membranephospholipids in P. cinctipes during the first 24h of thermalacclimation, nor did we detect differences in membrane phospholipidsfollowing 10–11weeks of thermal acclimation. Low sample sizes insome cases may have influenced our ability to detect phospholipidspecies changes, as sample sizes ranged from two to seven acrossacclimation groups, but as variances were similar in groups with largeand small sample sizes (Table2), so this is not likely to be a big issue.We examined pooled phospholipid classes, and in some cases therewas a differential response to long-term acclimation in the fatty acidslinked to phosphatidylethanolamine and phosphatidylcholine(Cuculescu et al., 1999), but in those cases there was nevertheless aconsistent shift towards unsaturation. There may be tissue-specificregulation of membrane phospholipids in cardiac tissue that do notfollow expectations of homeoviscous adaptation. Tissue-specificvariation in the degree of homeoviscous adaptation has been shownpreviously (Cossins and Prosser, 1978; Crockett and Hazel, 1995),and may be related to the degree to which the membrane is influencedby thermal change, given other environmental characteristics (e.g.
D. Ronges and others
pH) of the internal and external milieu surrounding the membrane(Crockett and Hazel, 1995). Whether crab cardiac tissue altersmembrane physical structure to compensate for thermal changes isunclear, but for animals living in an environment where temperaturechanges rapidly and unpredictably, such as the marine intertidal zone,modification of membrane composition to achieve homeoviscousadaptation may sometimes (Williams and Somero, 1996) but notalways (Rais et al., 2010) be the case, and changes in viscosity arenot always associated with shifts in phospholipid fatty acidcomposition (Lahdes et al., 2000).
ConclusionsHere we show that gene expression and cold tolerance of P. cinctipeschanges after only 6h of thermal acclimation, and that this isaccompanied by changes in gene expression after 12h. However,membrane phospholipid fatty acid composition does not change ina manner consistent with homeoviscous adaptation in the first 24h.Transcriptomic analysis suggests that regulation of glucose, or anend-product derived from glucose (e.g. trehalose), plays a role inenhancement of cold tolerance in these crabs, but this enhancementdoes not impart tolerance of internal ice formation. Our results formthe basis for multiple testable hypotheses regarding the cellularmechanisms regulating the initial phase of thermal acclimation; wesuggest that these hypotheses can be tested in future comparativestudies among porcelain crab species that vary in their responses tohabitat temperature change.
ACKNOWLEDGEMENTSThanks to Eddy Price and Heath MacMillan for their advice on fatty aciddetermination, Chris Guglielmo for the use of his gas chromatograph, ManiTagmount and Claudia Tomas-Miranda for their advice on microarray analysis,and two anonymous referees for their criticism of an earlier version of themanuscript.
FUNDINGThis research was funded by the University of Western Ontario AcademicDevelopment Fund (B.J.S.), the Canadian Foundation for Innovation (B.J.S.), TheNatural Sciences and Engineering Research Council of Canada (B.J.S., J.P.W.),the National Science Foundation (J.H.S.) and San Francisco State University(D.R.).
REFERENCESAngilletta, M. J. (2009). Thermal Adaptation, a Theoretical and Empirical Synthesis.
Oxford: Oxford University Press.Bataille, D., Heron, L., Virsolvy, A., Peyrollier, K., LeCam, A., Gros, L. and Blache,
P. (1999). -Endosulfine, a new entity in the control of insulin secretion. Cell. Mol.Life Sci. 56, 78-84.
Baugh, L. R., Hill, A. A., Brown, E. L. and Hunter, C. P. (2001). Quantitativeanalysis of mRNA amplification by in vitro transcription. Nucleic Acids Res. 29, e29.
Castilho, P. C., Buckley, B. A., Somero, G. and Block, B. A. (2009). Heterologoushybridization to a complementary DNA microarray reveals the effect of thermalacclimation in the endothermic bluefin tuna (Thunnus orientalis). Mol. Ecol. 18, 2092-2102.
Chomczynski, P. and Sacchi, N. (1987). Single-step method of RNA isolation by acidguanidinium thiocyanate-phenol-chloroform extraction. Anal. Biochem. 162, 156-159.
Christie, W. W. (1989). Gas Chromatography and Lipids. Bridgewater, UK: The OilyPress.
Clark, M. S. and Worland, M. R. (2008). How insects survive the cold: molecularmechanisms – a review. J. Comp. Physiol. B 178, 917-933.
Colson-Proch, C., Renault, D., Gravot, A., Douady, C. J. and Hervant, F. (2009).Do current environmental conditions explain physiological and metabolic responsesof subterranean crustaceans to cold? J. Exp. Biol. 212, 1859-1868.
Compton, T. J., Rijkenberg, M. J. A., Drent, J. and Piersma, T. (2007). Thermaltolerance ranges and climate variability: a comparison between bivalves fromdiffering climates. J. Exp. Mar. Biol. Ecol. 352, 200-211.
Cossins, A. R. and Prosser, C. L. (1978). Evolutionary adaptation of membranes totemperature. Proc. Natl. Acad. Sci. USA 75, 2040-2043.
Cottin, D., Shillito, B., Chertemps, T., Tanguy, A., Leger, N. and Ravaux, J. (2010).Identification of differentially expressed genes in the hydrothermal vent shrimpRimicaris exoculata exposed to heat stress. Mar. Genom. 3, 71-78.
Crisp, D. J., Davenport, J. and Gabbott, P. A. (1977). Freezing tolerance in Balanusbalanoides. Comp. Biochem. Physiol. 57A, 359-361.
Crockett, E. L. and Hazel, J. R. (1995). Cholesterol levels explain inversecompensation of membrane order in brush-border but not homeoviscous adaptation
THE JOURNAL OF EXPERIMENTAL BIOLOGY
1835The first day of thermal acclimation
in basolateral membranes from the intestinal epithelia of rainbow trout. J. Exp. Biol.198, 1105-1113.
Cuculescu, M., Hyde, D. and Bowler, K. (1995). Temperature acclimation of marinecrabs: changes in plasma membrane fluidity and lipid composition. J. Therm. Biol.20, 207-222.
Cuculescu, M., Pearson, T., Hyde, D. and Bowler, K. (1999). Heterothermalacclimation: an experimental paradigm for studying the control of thermal acclimationin crabs. Proc. Natl. Acad. Sci. USA 96, 6501-6505.
Cui, X. Q., Hwang, J. T. G., Qiu, J., Blades, N. J. and Churchill, G. (2005).Improved statistical tests for differential gene expression by shrinking variancecomponent estimates. Biostatistics 6, 59-75.
Denny, M. W., Miller, L. P. and Harley, C. D. G. (2006). Thermal stress on intertidallimpets: long-term hindcasts and lethal limits. J. Exp. Biol. 209, 2420-2431.
Deutsch, C. A., Tewksbury, J. J., Huey, R. B., Sheldon, K. S., Ghalambor, C. K.,Haak, D. C. and Martin, P. R. (2008). Impacts of climate warming on terrestrialectotherms across latitude. Proc. Natl. Acad. Sci. USA 105, 6668-6672.
Devireddy, R. V., Barratt, P. R., Storey, K. B. and Bischof, J. C. (1999a). Liverfreezing response of the freeze-tolerant wood frog, Rana sylvatica, in the presenceand absence of glucose I. Experimental measurements. Cryobiology 38, 310-326.
Devireddy, R. V., Barratt, P. R., Storey, K. B. and Bischof, J. C. (1999b). Liverfreezing response of the freeze-tolerant wood frog, Rana sylvatica, in the presenceand absence of glucose II. Mathematical modeling. Cryobiology 38, 327-338.
Dieni, C. A. and Storey, K. B. (2010). Regulation of glucose-6-phosphatedehydrogenase by reversible phosphorylation in liver of a freeze tolerant frog. J.Comp. Physiol. B 180, 1133-1142.
Dillon, M. E., Wang, G. and Huey, R. B. (2010). Global metabolic impacts of recentclimate warming. Nature 467, 704-706.
Draghici, S., Kulaeva, O., Hoff, B., Petrov, A., Shams, S. and Tainsky, M. A.(2003). Noise sampling method: an ANOVA approach allowing robust selection ofdifferentially regulated genes measured by DNA microarrays. Bioinformatics 19,1348-1359.
Goto, S. G. and Katagiri, C. (2011). Effects of acclimation temperature on membranephospholipids in the flesh fly Sarcophaga similis. Entomol. Sci. 14, 224-229.
Gracey, A. Y. (2007). Interpreting physiological responses to environmental changethrough gene expression profiling. J. Exp. Biol. 210, 1584-1592.
Gracey, A. Y., Fraser, E. J., Li, W. Z., Fang, Y. X., Taylor, R. R., Rogers, J., Brass,A. and Cossins, A. R. (2004). Coping with cold: an integrative, multitissue analysisof the transcriptome of a poikilothermic vertebrate. Proc. Natl. Acad. Sci. USA 101,16970-16975.
Haig, J. (1960). The Porcellanidae (Crustacea: Anomura) of the eastern Pacific. AllanHancock Pacific Expeditions 24, 1-440.
Hall, J. R., Clow, K. A., Rise, M. L. and Driedzic, W. R. (2011). Identification andvalidation of differentially expressed transcripts in a hepatocyte model of cold-induced glycerol production in rainbow smelt (Osmerus mordax). Am. J. Physiol.Regul. Integr. Comp. Physiol. 301, R995-R1010.
Hawes, T. C., Worland, M. R. and Bale, J. S. (2010). Freezing in the Antarctic limpet,Nacella concinna. Cryobiology 61, 128-132.
Hayward, S., Murray, P., Govan, G., Cossins, A. and Gracey, A. (2007). Acquiredcold tolerance in Caenorhabditis elegans: an explicit test of the lipid hypothesis.Comp. Biochem. Physiol 146A, S149-S150.
Hochachka, P. W. and Somero, G. N. (1984). Biochemical Adaptation. Princeton, NJ:Princeton University Press.
Hochachka, P. W. and Somero, G. N. (2002). Biochemical Adaptation: Mechanismand Process in Physiological Evolution. New York: Oxford University Press.
Holden, C. P. and Storey, K. B. (2000). Purification and characterization of proteinkinase a from liver of the freeze-tolerant wood frog: role in glycogenolysis duringfreezing. Cryobiology 40, 323-331.
Issartel, J., Renault, D., Voituron, Y., Bouchereau, A., Vernon, P. and Hervant, F.(2005). Metabolic responses to cold in subterranean crustaceans. J. Exp. Biol. 208,2923-2929.
Kostal, V. and Simek, P. (1998). Changes in fatty acid composition of phospholipidsand triacylglycerols after cold-acclimation of an aestivating insect prepupa. J. Comp.Physiol. B 168, 453-460.
Kostal, V., Vambera, J. and Bastl, J. (2004). On the nature of pre-freeze mortality ininsects: water balance, ion homeostasis and energy charge in the adults ofPyrrhocoris apterus. J. Exp. Biol. 207, 1509-1521.
Lahdes, E., Balogh, G., Fodor, E. and Farkas, T. (2000). Adaptation of compositionand biophysical properties of phospholipids to temperature by the crustacean,Gammarus spp. Lipids 35, 1093-1098.
Lee, R. E. and Denlinger, D. L. (2010). Rapid cold-hardening: Ecological significanceand underpinning mechanisms. In Low Temperature Biology of Insects (ed. D. L.Denlinger and R. E. Lee), pp. 35-58. Cambridge: Cambridge University Press.
Liu, D. Y., Zhang, R. F., Yang, X. M., Xu, Y. C., Tang, Z., Tian, W. and Shen, Q. R.(2011). Expression, purification and characterization of two thermostableendoglucanases cloned from a lignocellulosic decomposing fungi Aspergillusfumigatus Z5 isolated from compost. Protein Expr. Purif. 79, 176-186.
Lockwood, B. L. and Somero, G. N. (2011). Transcriptomic responses to salinitystress in invasive and native blue mussels (genus Mytilus). Mol. Ecol. 20, 517-529.
Logan, C. A. and Somero, G. N. (2010). Transcriptional responses to thermalacclimation in the eurythermal fish Gillichthys mirabilis (Cooper 1864). Am. J. PhysiolRegul. Integr. Comp. Physiol. 299, R843-R852.
Logue, J. A., de Vries, A. L., Fodor, E. and Cossins, A. R. (2000). Lipidcompositional correlates of temperature-adaptive interspecific differences inmembrane physical structure. J. Exp. Biol. 203, 2105-2115.
Loomis, S. H. (1995). Freezing tolerance of marine invertebrates. Oceanogr. Mar. Biol.Annu. Rev. 33, 337-350.
MacMillan, H. A. and Sinclair, B. J. (2011). Mechanisms underlying insect chill-coma.J. Insect Physiol. 57, 12-20.
MacMillan, H. A., Guglielmo, C. G. and Sinclair, B. J. (2009). Membrane remodelingand glucose in Drosophila melanogaster: a test of rapid cold-hardening and chillingtolerance hypotheses. J. Insect Physiol. 55, 243-249.
Mandic, M., Todgham, A. E. and Richards, J. G. (2009). Mechanisms and evolutionof hypoxia tolerance in fish. Proc. R. Soc. Lond. B 276, 735-744.
McAllen, R. and Block, W. (1997). Aspects of the cryobiology of the intertidalharpacticoid copepod Tigriopus brevicornis (O. F. Muller). Cryobiology 35, 309-317.
Muise, A. M. and Storey, K. B. (2001). Regulation of hexokinase in a freeze avoidinginsect: role in the winter production of glycerol. Arch. Insect Biochem. Physiol. 47,29-34.
Murray, P., Hayward, S. A. L., Govan, G. G., Gracey, A. Y. and Cossins, A. R.(2007). An explicit test of the phospholipid saturation hypothesis of acquired coldtolerance in Caenorhabditis elegans. Proc. Natl. Acad. Sci. USA 104, 5489-5494.
Overgaard, J., Sorensen, J. G., Petersen, S. O., Loeschcke, V. and Holmstrup, M.(2006). Reorganization of membrane lipids during fast and slow cold hardening inDrosophila melanogaster. Physiol. Entomol. 31, 328-335.
Overgaard, J., Malmendal, A., Sorensen, J. G., Bundy, J. G., Loeschcke, V.,Nielsen, N. C. and Holmstrup, M. (2007). Metabolomic profiling of rapid coldhardening and cold shock in Drosophila melanogaster. J. Insect Physiol. 53, 1218-1232.
Overgaard, J., Tomcala, A., Sorensen, J. G., Holmstrup, M., Krogh, P. H., Simek,P. and Kostal, V. (2008). Effects of acclimation temperature on thermal toleranceand membrane phospholipid composition in the fruit fly Drosophila melanogaster. J.Insect Physiol. 54, 619-629.
Pernet, F., Tremblay, R., Comeau, L. and Guderley, H. (2007). Temperatureadaptation in two bivalve species from different thermal habitats: energetics andremodelling of membrane lipids. J. Exp. Biol. 210, 2999-3014.
Pineda, J., DiBacco, C. and Starczak, V. (2005). Barnacle larvae in ice: survival,reproduction, and time to postsettlement metamorphosis. Limnol. Oceanogr. 50,1520-1528.
Pörtner, H. O. (2010). Oxygen- and capacity-limitation of thermal tolerance: a matrixfor integrating climate-related stressor effects in marine ecosystems. J. Exp. Biol.213, 881-893.
Pörtner, H. O., Bennett, A. F., Bozinovic, F., Clarke, A., Lardies, M. A., Lucassen,M., Pelster, B., Schiemer, F. and Stillman, J. H. (2006). Trade-offs in thermaladaptation: the need for a molecular to ecological integration. Physiol. Biochem.Zool. 79, 295-313.
Purac, J., Pond, D. W., Grubor-Lajsic, G., Kojic, D., Blagojevic, D. P., Worland, M.R. and Clark, M. S. (2011). Cold hardening induces transfer of fatty acids betweenpolar and nonpolar lipid pools in the Arctic collembollan Megaphorura arctica.Physiol. Entomol. 36, 135-140.
Qin, W., Neal, S. J., Robertson, R. M., Westwood, J. T. and Walker, V. K. (2005).Cold hardening and transcriptional change in Drosophila melanogaster. Insect Mol.Biol. 14, 607-613.
Rais, A., Miller, N. and Stillman, J. H. (2010). No evidence for homeoviscousadaptation in intertidal snails: analysis of membrane fluidity during thermalacclimation, thermal acclimatization, and across thermal microhabitats. Mar. Biol.157, 2407-2414.
Robalino, J., Almeida, J. S., McKillen, D., Colglazier, J., Trent, H. F., III, Chen, Y.A., Peck, M. E. T., Browdy, C. L., Chapman, R. W., Warr, G. W. et al. (2007).Insights into the immune transcriptome of the shrimp Litopenaeus vannamei: tissue-specific expression profiles and transcriptomic responses to immune challenge.Physiol. Genom. 29, 44-56.
Sanford, E., Holzman, S. B., Haney, R. A., Rand, D. M. and Bertness, M. D. (2006).Larval tolerance, gene flow, and the northern geographic range limit of fiddler crabs.Ecology 87, 2882-2894.
Shen, Y. Q., Joachimiak, A., Rosner, M. R. and Tang, W. J. (2006). Structures ofhuman insulin-degrading enzyme reveal a new substrate recognition mechanism.Nature 443, 870-874.
Sinclair, B. J., Marshall, D. J., Singh, S. and Chown, S. L. (2004). Cold tolerance ofLittorinidae from southern Africa: intertidal snails are not constrained to freezetolerance. J. Comp. Physiol. B 174, 617-624.
Sloman, K. A., Mandic, M., Todgham, A. E., Fangue, N. A., Subrt, P. andRichards, J. G. (2008). The response of the tidepool sculpin, Oligocottusmaculosus, to hypoxia in laboratory, mesocosm and field environments. Comp.Biochem. Physiol. 149A, 284-292.
Stillman, J. H. (2002). Causes and consequences of thermal tolerance limits in rockyintertidal porcelain crabs, genus Petrolisthes. Integr. Comp. Biol. 42, 790-796.
Stillman, J. H. (2003). Acclimation capacity underlies susceptibility to climate change.Science 301, 65.
Stillman, J. H. (2004). A comparative analysis of plasticity of thermal limits in porcelaincrabs across latitudinal and intetidal zone clines. Int. Congr. Ser. 1275, 267-274.
Stillman, J. H. and Somero, G. N. (2000). A comparative analysis of the upperthermal tolerance limits of eastern Pacific porcelain crabs, genus Petrolisthes:influences of latitude, vertical zonation, acclimation, and phylogeny. Physiol.Biochem. Zool. 73, 200-208.
Stillman, J. H. and Tagmount, A. (2009). Seasonal and latitudinal acclimatization ofcardiac transcriptome responses to thermal stress in porcelain crabs, Petrolisthescinctipes. Mol. Ecol. 18, 4206-4226.
Stillman, J. H., Teranishi, K. S., Tagmount, A., Lindquist, E. A. and Brokstein, P.B. (2006). Construction and characterization of EST libraries from the porcelain crab,Petrolisthes cinctipes. Integr. Comp. Biol. 46, 919-930.
Storey, J. D. (2002). A direct approach to false discovery rates. J. R. Statist. Soc. B64, 479-498.
Storey, J. D. (2003). The positive false discovery rate: a Bayesian interpretation andthe q-value. Ann. Statist. 31, 2013-2035.
Storey, K. B. (1997). Organic solutes in freezing tolerance. Comp. Biochem. Physiol.117A, 319-326.
Storey, K. B. (2004). Strategies for exploration of freeze responsive gene expression:advances in vertebrate freeze tolerance. Cryobiology 48, 134-145.
THE JOURNAL OF EXPERIMENTAL BIOLOGY
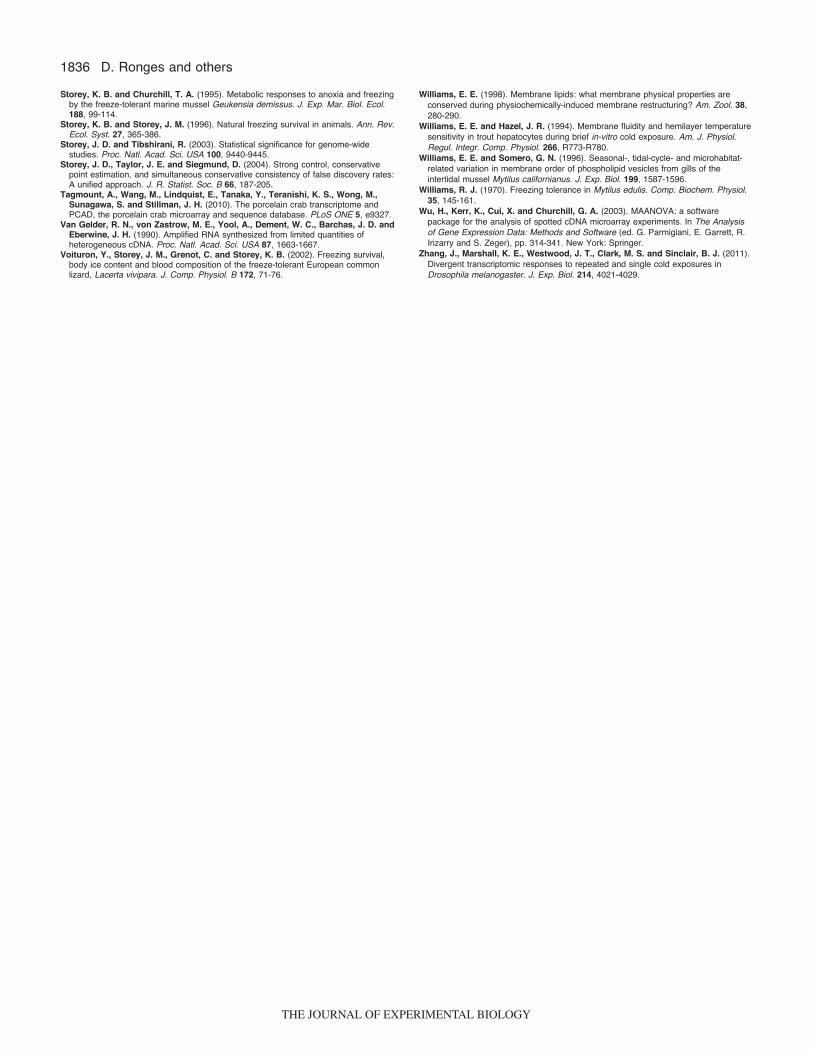
1836 D. Ronges and others
Storey, K. B. and Churchill, T. A. (1995). Metabolic responses to anoxia and freezingby the freeze-tolerant marine mussel Geukensia demissus. J. Exp. Mar. Biol. Ecol.188, 99-114.
Storey, K. B. and Storey, J. M. (1996). Natural freezing survival in animals. Ann. Rev.Ecol. Syst. 27, 365-386.
Storey, J. D. and Tibshirani, R. (2003). Statistical significance for genome-widestudies. Proc. Natl. Acad. Sci. USA 100, 9440-9445.
Storey, J. D., Taylor, J. E. and Siegmund, D. (2004). Strong control, conservativepoint estimation, and simultaneous conservative consistency of false discovery rates:A unified approach. J. R. Statist. Soc. B 66, 187-205.
Tagmount, A., Wang, M., Lindquist, E., Tanaka, Y., Teranishi, K. S., Wong, M.,Sunagawa, S. and Stillman, J. H. (2010). The porcelain crab transcriptome andPCAD, the porcelain crab microarray and sequence database. PLoS ONE 5, e9327.
Van Gelder, R. N., von Zastrow, M. E., Yool, A., Dement, W. C., Barchas, J. D. andEberwine, J. H. (1990). Amplified RNA synthesized from limited quantities ofheterogeneous cDNA. Proc. Natl. Acad. Sci. USA 87, 1663-1667.
Voituron, Y., Storey, J. M., Grenot, C. and Storey, K. B. (2002). Freezing survival,body ice content and blood composition of the freeze-tolerant European commonlizard, Lacerta vivipara. J. Comp. Physiol. B 172, 71-76.
Williams, E. E. (1998). Membrane lipids: what membrane physical properties areconserved during physiochemically-induced membrane restructuring? Am. Zool. 38,280-290.
Williams, E. E. and Hazel, J. R. (1994). Membrane fluidity and hemilayer temperaturesensitivity in trout hepatocytes during brief in-vitro cold exposure. Am. J. Physiol.Regul. Integr. Comp. Physiol. 266, R773-R780.
Williams, E. E. and Somero, G. N. (1996). Seasonal-, tidal-cycle- and microhabitat-related variation in membrane order of phospholipid vesicles from gills of theintertidal mussel Mytilus californianus. J. Exp. Biol. 199, 1587-1596.
Williams, R. J. (1970). Freezing tolerance in Mytilus edulis. Comp. Biochem. Physiol.35, 145-161.
Wu, H., Kerr, K., Cui, X. and Churchill, G. A. (2003). MAANOVA: a softwarepackage for the analysis of spotted cDNA microarray experiments. In The Analysisof Gene Expression Data: Methods and Software (ed. G. Parmigiani, E. Garrett, R.Irizarry and S. Zeger), pp. 314-341. New York: Springer.
Zhang, J., Marshall, K. E., Westwood, J. T., Clark, M. S. and Sinclair, B. J. (2011).Divergent transcriptomic responses to repeated and single cold exposures inDrosophila melanogaster. J. Exp. Biol. 214, 4021-4029.
THE JOURNAL OF EXPERIMENTAL BIOLOGY