Embed Size (px)
Citation preview
International Journal of Advanced Engineering Technology E-ISSN 0976-3945
IJAET/Vol.I/ Issue II/July-Sept.,2010/150-164
Research Article
ARTIFICIAL GROUND WATER RECHARGE FIELD
STUDY : SITE CHARACTERIZATION AND TEST
RESULTS
1Prof. Pratima Patel,
2Dr. M. D. Desai
Address for correspondence 1Ph.D Research Scholar SVNIT, Surat & Asst. Prof. Civil Engineering Department, Sarvajanik
College of Engineering & Technology, Athwalines, Surat-395001, Gujarat, India,
E-mail [email protected] 2Ex. Prof. & Head, Applied Mechanics Department, S. V. National Institute of Technology,
Surat-395007, Gujarat, India,
ABSTRACT Over-exploitation of local ground-water resources can be prevented by inducing ground-water
mounding through artificial recharge using rain water stored in specially constructed basins. In
order to maintain the regional water balance and to assure optimal use of available water,
knowledge of the water-table fluctuation in response to the proposed recharged scheme is
essential. In this paper suitability of the site criteria for recharge bore well is discussed. Also
focused on collection of surrounding site geotechnical data, topography of the site, geometrical
parameters, evaluation of aquifer, and mathematics of ground water.
Mathematical modelling of ground water flow related to unconfined aquifer with a change in
saturated thickness with variation in Piezometric level, permeability, radius of influences or
distance between two recharge well and presence of recharge by rainfall is discussed here. By
using quadratic mathematical expression some significant relationship can be established.
Drawdown and detention time of water storage can also be determined. The technique is
implemented to an unconfined aquifer with horizontal impervious base receiving vertical
recharge using rain water stored in specially designed basin.
Authors have set up precast octagonal recharge well system at proposed site and suggested design
parameters for roof top rain water recharge system. Recharging capacity of well can be evaluated
by field test and confirmed with analytical solution.
Authors have established correlations between radius of bore well r and depth of pervious strata h
with capacity of borehole Qr which are adopted at site and gives satisfactory results, few are
highlighted.
KEYWORDS: unconfined aquifer, artificial recharges techniques, geometrical parameters,
radius of influence, draw down, Hypothesis of Water.
INTRODUCTION
Human health and welfare, food
security, industrial development and the
ecosystems on which they depend, are
all at risk, unless water and land
resources are managed more effectively
in the present decade and beyond. About
one-fifth of the world’s population lacks
access to safe drinking water and with
the present consumption patterns; two
out of every three persons on the earth
would live in water-stressed conditions
International Journal of Advanced Engineering Technology E-ISSN 0976-3945
IJAET/Vol.I/ Issue II/July-Sept.,2010/150-164
by 2025. With the growing demand of
water, recharging of aquifer is fulfilled
the need of the water crisis for future
generation.
Water is one of the renewable resources.
India with an average rainfall of 1150
mm is the second wettest country in the
world with good water resources. But
the water resources are not evenly
distributed over the country due to
varied Hydro geological conditions and
high variations in precipitation both in
time and space. As large quantities of
rainfall are going to sea as runoff, it is
better to harness this wasteful runoff by
adopting proper scientific conservation
measures and constructing suitable
recharge structures at appropriate
locations and artificially recharge the
depleted aquifers through recharge bore
wells. Added would be the tremendous
pressure to meet water requirements for
other purposes such as for industrial use,
environment and ecological management
etc. emanating from population growth,
the land use policies, degradation of
water resources and depletion of aquifers
in the country. [2]
RESEARCHERS VIEW
The problem of ground-water mound
formation below artificial recharge
basins has been investigated by many
researchers-Baumann (1952) Glover
(1960) Davis S. N. and Dewiest R. J. M.
(1966) highlight the methods of
recharging of various aquifers. Hantush
(1967) Hunt (1971) Bear J. (1979)
Warner et al. (1989), Bouwer H. (1989)
system for artificial recharge of aquifer
Basak (1982) has presented closed-form
analytical solutions of the Boussinesq
equation for mound build-up and
depletion in an island aquifer in response
to constant recharge and evaporation
over the entire aquifer. The water table
at the boundary of the aquifer is assumed
invariant with time. Zomorodi (1991)
has shown solutions For different one-
dimensional and two dimensional flow
models, Rai and Singh (1981, 1995) and
Rai et al. (1994) have also shown that
variations in the rate of recharge have
significant effects on the growth of
ground water mounds. Todd D.K. (2006)
illustrates how the recharging of aquifer
stops the salt water intrusion. I.S 15792
(2008) Artificial Recharge to Ground
Water– Guidelines mention the various
methodology installed at various site.
Design criteria for installing recharge
system are not highlighted. So at present
design procedure, system erection
method & implementation of artificial
recharge system is a today’s prime need.
International Journal of Advanced Engineering Technology E-ISSN 0976-3945
IJAET/Vol.I/ Issue II/July-Sept.,2010/150-164
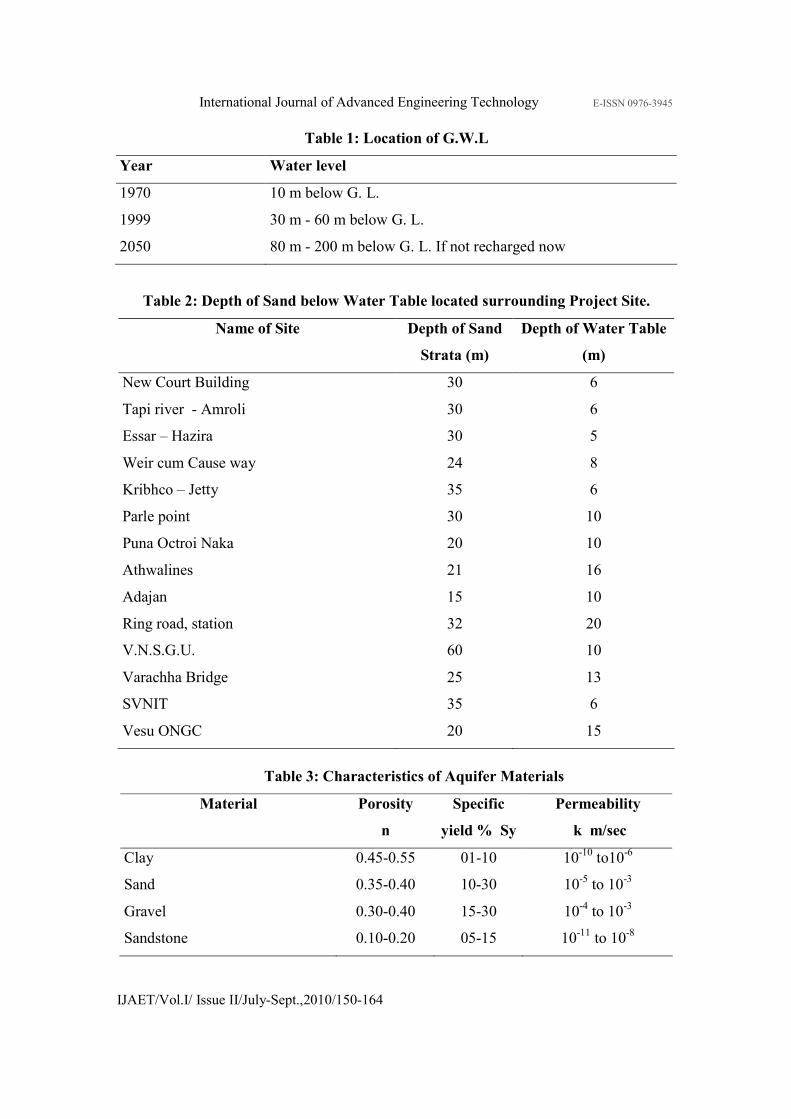
Table 1: Location of G.W.L
Year Water level
1970 10 m below G. L.
1999 30 m - 60 m below G. L.
2050 80 m - 200 m below G. L. If not recharged now
Table 2: Depth of Sand below Water Table located surrounding Project Site.
Name of Site Depth of Sand
Strata (m)
Depth of Water Table
(m)
New Court Building 30 6
Tapi river - Amroli 30 6
Essar – Hazira 30 5
Weir cum Cause way 24 8
Kribhco – Jetty 35 6
Parle point 30 10
Puna Octroi Naka 20 10
Athwalines 21 16
Adajan 15 10
Ring road, station 32 20
V.N.S.G.U. 60 10
Varachha Bridge 25 13
SVNIT 35 6
Vesu ONGC 20 15
Table 3: Characteristics of Aquifer Materials
Material Porosity
n
Specific
yield % Sy
Permeability
k m/sec
Clay 0.45-0.55 01-10 10-10 to10
-6
Sand 0.35-0.40 10-30 10-5 to 10
-3
Gravel 0.30-0.40 15-30 10-4 to 10
-3
Sandstone 0.10-0.20 05-15 10-11 to 10
-8
International Journal of Advanced Engineering Technology E-ISSN 0976-3945
IJAET/Vol.I/ Issue II/July-Sept.,2010/150-164
POPULATION, WATER NEED AND
WATER AVAILABILITY [8]
The population of India is estimated to
reach a figure between 1.5 billion and
1.8 billion by the year 2050. The UN
agencies have put the figure 1.64 billion.
It is now generally accepted that the
countries with annual per-capita water
availability of less than 1,700 m3 are
water stressed and less than 1000 m3 as
water scarce. India would therefore need
2,788 billion cubic meters (b.c.m.) of
water annually by 2050 to be above
water stress zone and 1650 b.c.m. to
avoid being water scarce country.
The average annual surface water flows
in India has been estimated as 1869
b.c.m. of which 690 b.c.m. only can be
utilized. If appropriate storage
techniques can be created than
maximum water can be store. The
demand of water is increasing day-by-
day resulting in extraction of more and
more groundwater and such extraction is
in far excess of net average recharge
from natural sources and hence it
necessitates artificially recharging the
aquifers to balance the output.
Hypothesis of water available
In year 1970, water was freely available.
In year 1980, 50 paisa/glass. In year
1999 12 Rs./liter. In year 2050, may be
100 Rs./liter. [6] Thus, there is immediate
need to conserve every source of usable
water for the future generation. Planning
and management of 10 years could post
pone water crisis by few more years.
Ground Water Level in Past Tweenty
Years
Data are shown in Table 1
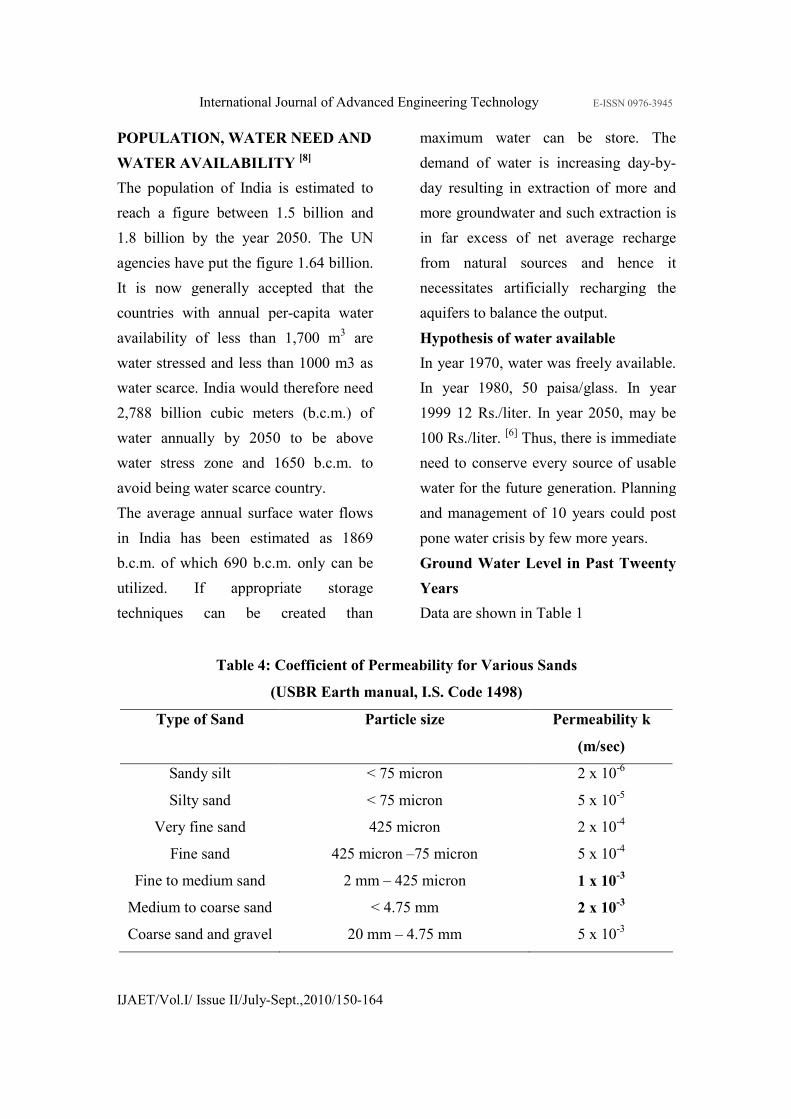
Table 4: Coefficient of Permeability for Various Sands
(USBR Earth manual, I.S. Code 1498)
Type of Sand Particle size Permeability k
(m/sec)
Sandy silt < 75 micron 2 x 10⁻⁶
Silty sand < 75 micron 5 x 10⁻⁵
Very fine sand 425 micron 2 x 10⁻⁴
Fine sand 425 micron –75 micron 5 x 10⁻⁴
Fine to medium sand 2 mm – 425 micron 1 x 10⁻³
Medium to coarse sand < 4.75 mm 2 x 10⁻³
Coarse sand and gravel 20 mm – 4.75 mm 5 x 10⁻³
International Journal of Advanced Engineering Technology E-ISSN 0976-3945
IJAET/Vol.I/ Issue II/July-Sept.,2010/150-164
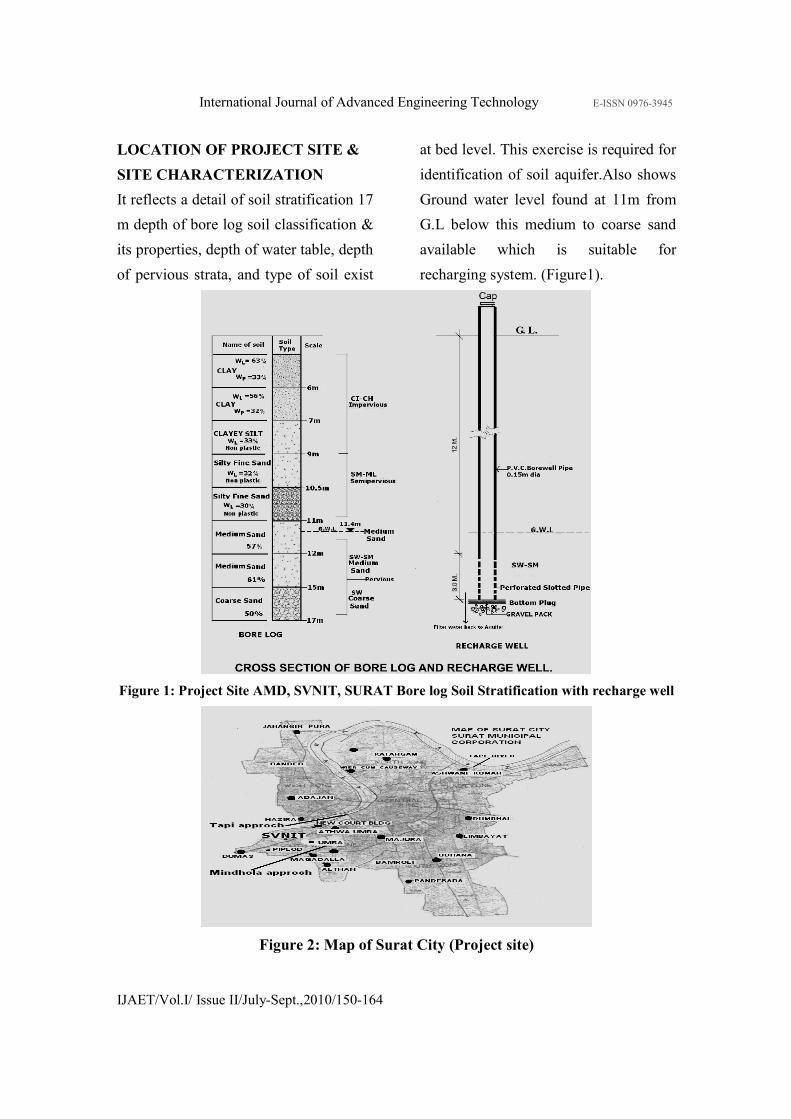
LOCATION OF PROJECT SITE &
SITE CHARACTERIZATION
It reflects a detail of soil stratification 17
m depth of bore log soil classification &
its properties, depth of water table, depth
of pervious strata, and type of soil exist
at bed level. This exercise is required for
identification of soil aquifer.Also shows
Ground water level found at 11m from
G.L below this medium to coarse sand
available which is suitable for
recharging system. (Figure1).
Figure 1: Project Site AMD, SVNIT, SURAT Bore log Soil Stratification with recharge well
Figure 2: Map of Surat City (Project site)
International Journal of Advanced Engineering Technology E-ISSN 0976-3945
IJAET/Vol.I/ Issue II/July-Sept.,2010/150-164
EVALUATION OF SOIL AQUIFER
W.R.T. EXPLORATION DATA
(Figure 2 & Table 2).
Referring to geotechnical exploration
data of SVNIT project site and its
surrounding region following
observations are made:
• Up to 25-30 m depth sand strata
(SW-SM-SC-GM) available
below G.W.L. and below this
depth highly impervious soil
strata (MH-CH-CI) exists.
• A soil stratum below the well
casing is greater or equal to five
times diameter of bore well.
Depth of pervious soil strata ≥≥≥≥ 5 x d or
(10 x r)
• Water table = 11.4 m.
• Sand strata available in general
below G.W.L. up to 25 m
• Pervious Strata available at this
site is 25 – 11 = 14 m.
• 14 m ≥ 5 x 0.15 i.e. 14 m ≥
0.75 m
Above remarks fulfil the criteria of
unconfined aquifer so recharge problem
can be design and analyze under the
UNCONFINED AQUIFER category.
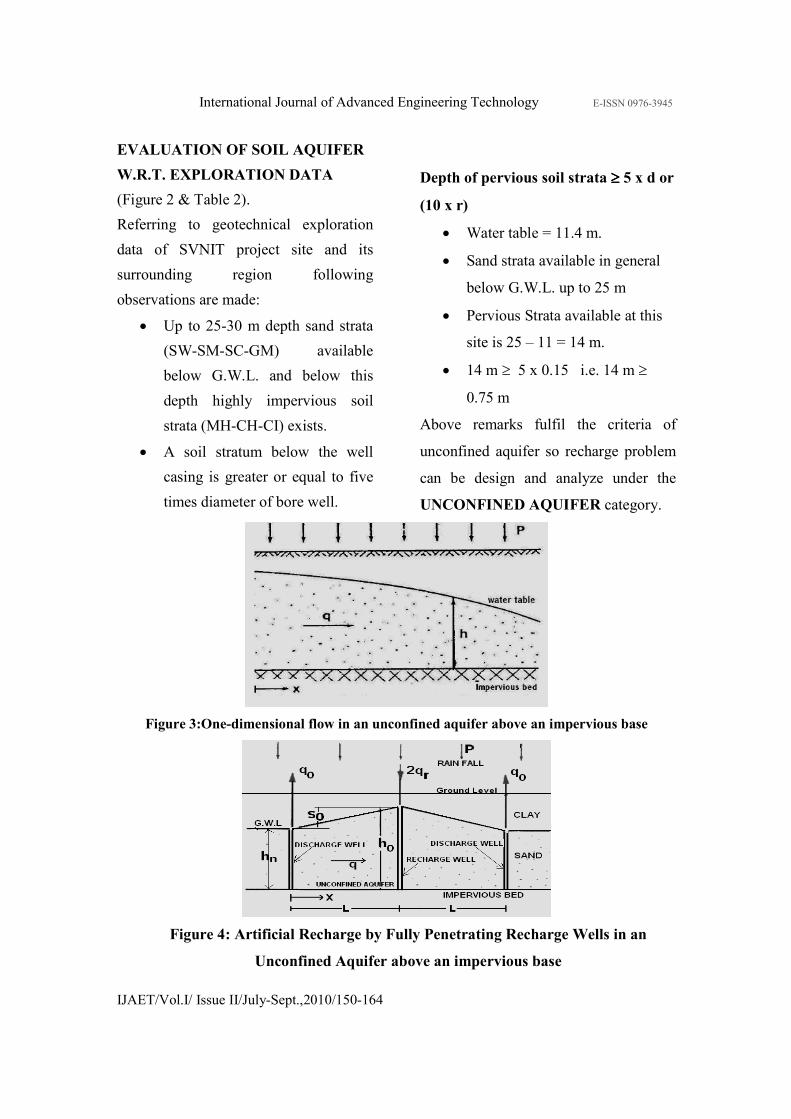
Figure 3:One-dimensional flow in an unconfined aquifer above an impervious base
Figure 4: Artificial Recharge by Fully Penetrating Recharge Wells in an
Unconfined Aquifer above an impervious base
International Journal of Advanced Engineering Technology E-ISSN 0976-3945
IJAET/Vol.I/ Issue II/July-Sept.,2010/150-164
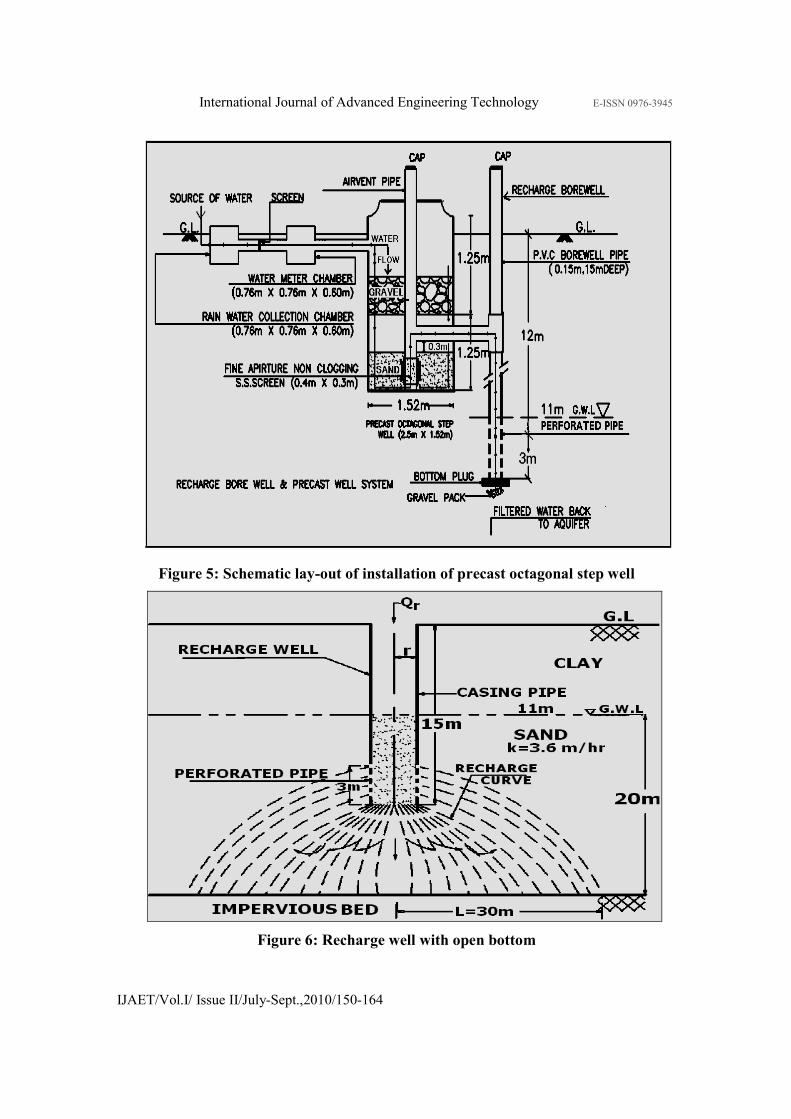
Figure 5: Schematic lay-out of installation of precast octagonal step well
Figure 6: Recharge well with open bottom
International Journal of Advanced Engineering Technology E-ISSN 0976-3945
IJAET/Vol.I/ Issue II/July-Sept.,2010/150-164
GEOMATRICAL PROPERTIES OF
UNCONFINED AQUIFER
For designing any type of recharge
system geometrical properties of an
unconfined aquifer is required. Storage
function of aquifer material is depending
on: porosity, specific yield, retention,
storage coefficient, transmissibility,
permittivity & permeability.
(i) Porosity (n)
It is the ratio of the volume of voids
(pores) in soil mass to its total volume.
Coarse to medium sand : 0.26to 0.42
Fine Sand : 0.3 to 0.4
Sandy Gravel : 0.2 to 0.35
Uniformly graded sand has a higher
porosity than coarse sand.
(ii) Storage Co-Efficient
It is defined as the volume of water
released (or stored) by an aquifer per
unit surface area.
In an unconfined aquifer, it corresponds
to its specific yield.
For unconfined aquifers it range from
0.02 to 0.3
The actual values can be obtained from
the pumping out test.
(iii) Specific Retention (Sr)
It is ratio of the water retained to the
volume of aquifer. It depends on grain
size, shape, distribution of pores and
compaction of the soil formation.
For sand 10 to 30%,
For sandy Gravel 10 to 80%,
n = Sy + Sr (Table 3).
(iv) Specific Yield (Sy)
The volume of water, expressed as a
percentage of the total volume of
saturated aquifer, that can be drained by
gravity is called the specific yield.
Sand = 10% to 30%
Sandy Gravel = 15% to 25%
For unconfined aquifer Sy = 0.01 to 0.3
Specific yield depends upon - grain size,
shape and distribution of pores and
compaction of the formation.
(v) Permeability (k)
It is the ability of a formation to transmit
water through its pores when subjected
to a difference in water head. It has
dimension of velocity (m/sec). It is the
rate of flow per unit cross sectional area
under unit hydraulic gradient. (Table 4)
(vi) Transmissibility (T)
It is the discharge through unit width of
aquifer for the fully saturated depth
under unit hydraulic gradient. T is
directly varies with permeability and
saturated thickness of the aquifer.
International Journal of Advanced Engineering Technology E-ISSN 0976-3945
IJAET/Vol.I/ Issue II/July-Sept.,2010/150-164
T = k ⋅ b (m2/sec)
For unconfined aquifer
T = k ⋅ ba (m2/sec)
ba = average saturated thickness =
(H + h) / 2
H=height of original water table,h=
height of water in well after drawdown.
(vii) PERMITTIVITY (ΨΨΨΨ): The ratio
of permeability of soil (k) to thickness of
soil sample (dx) is known as
permittivity, measured in (sec)-1. It is
preferred measure of water flow capacity
across the soil mass.
Ψ = k/dx
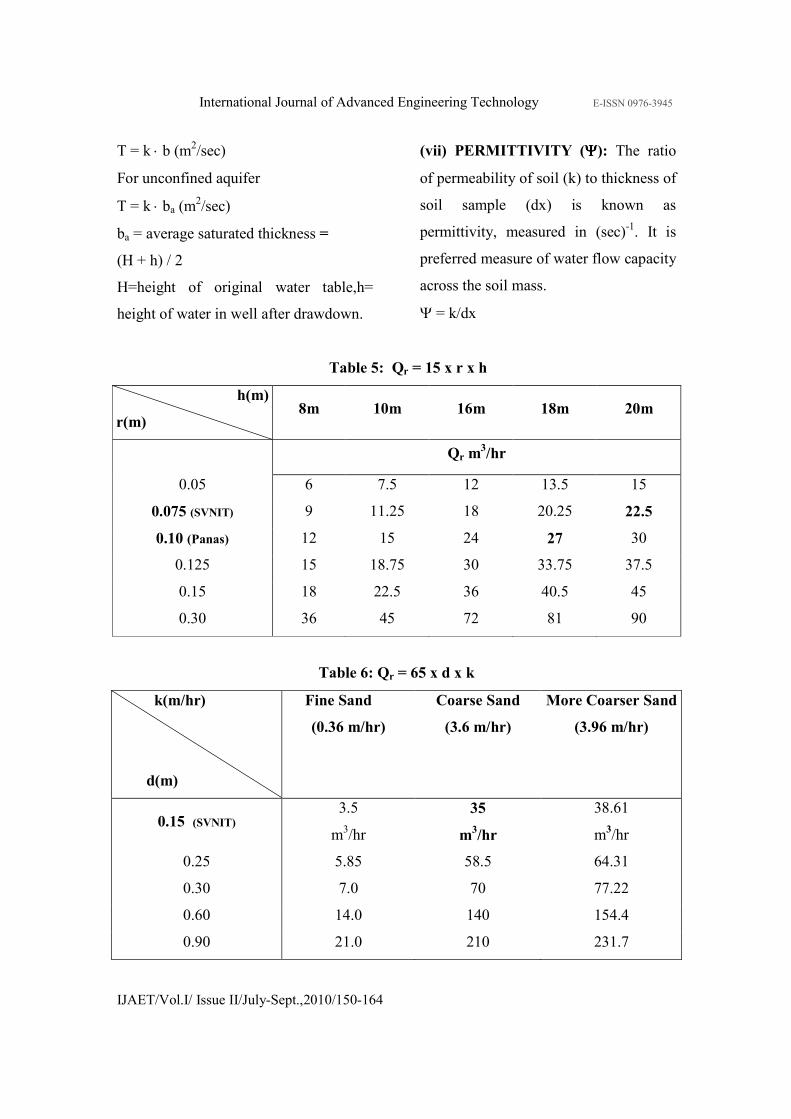
Table 5: Qr = 15 x r x h
h(m)
r(m) 8m 10m 16m 18m 20m
Qr m3/hr
0.05 6 7.5 12 13.5 15
0.075 (SVNIT) 9 11.25 18 20.25 22.5
0.10 (Panas) 12 15 24 27 30
0.125 15 18.75 30 33.75 37.5
0.15 18 22.5 36 40.5 45
0.30 36 45 72 81 90
Table 6: Qr = 65 x d x k
k(m/hr)
d(m)
Fine Sand
(0.36 m/hr)
Coarse Sand
(3.6 m/hr)
More Coarser Sand
(3.96 m/hr)
0.15 (SVNIT) 3.5
m3/hr
35
m3/hr
38.61
m3/hr
0.25 5.85 58.5 64.31
0.30 7.0 70 77.22
0.60 14.0 140 154.4
0.90 21.0 210 231.7
International Journal of Advanced Engineering Technology E-ISSN 0976-3945
IJAET/Vol.I/ Issue II/July-Sept.,2010/150-164
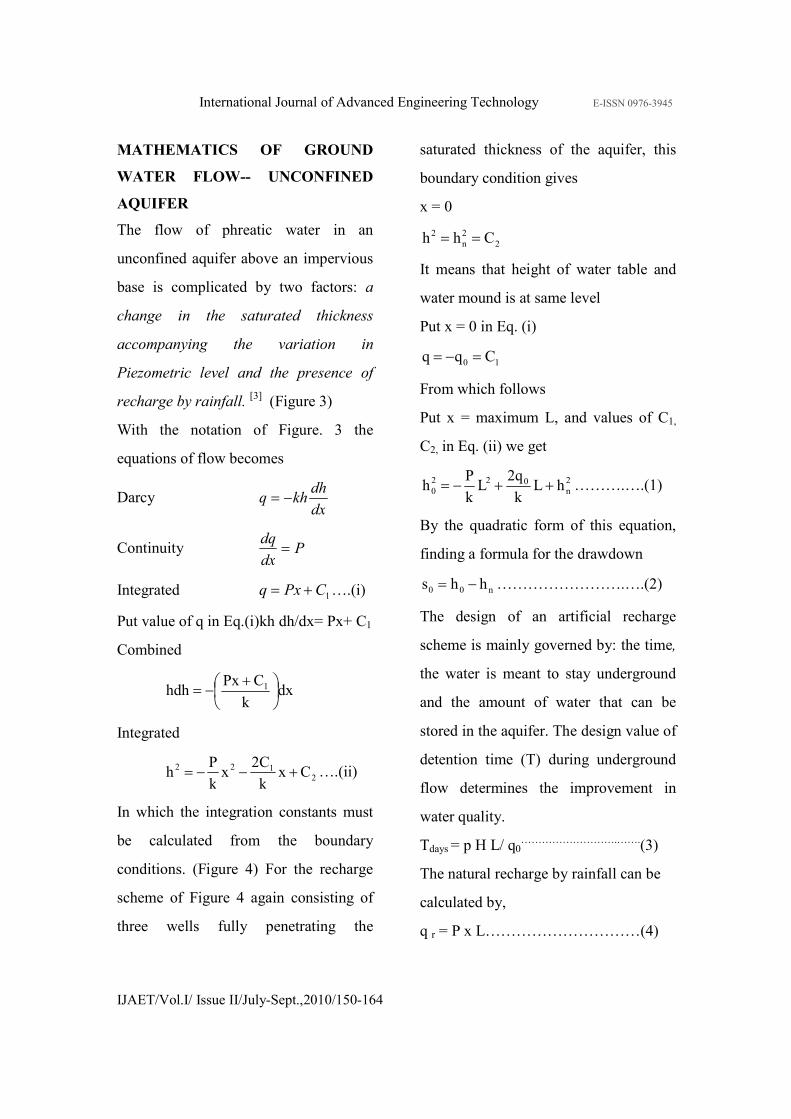
MATHEMATICS OF GROUND
WATER FLOW-- UNCONFINED
AQUIFER
The flow of phreatic water in an
unconfined aquifer above an impervious
base is complicated by two factors: a
change in the saturated thickness
accompanying the variation in
Piezometric level and the presence of
recharge by rainfall. [3]
(Figure 3)
With the notation of Figure. 3 the
equations of flow becomes
Darcy dx
dhkhq −=
Continuity Pdx
dq=
Integrated 1CPxq += ….(i)
Put value of q in Eq.(i)kh dh/dx= Px+ C1
Combined
dxk
CPxhdh 1
+−=
Integrated
2
122Cx
k
2Cx
k
Ph +−−= ….(ii)
In which the integration constants must
be calculated from the boundary
conditions. (Figure 4) For the recharge
scheme of Figure 4 again consisting of
three wells fully penetrating the
saturated thickness of the aquifer, this
boundary condition gives
x = 0
2
2
n
2 Chh ==
It means that height of water table and
water mound is at same level
Put x = 0 in Eq. (i)
10 Cqq =−=
From which follows
Put x = maximum L, and values of C1,
C2, in Eq. (ii) we get
2
n022
0 hLk
2qL
k
Ph ++−= ……….….(1)
By the quadratic form of this equation,
finding a formula for the drawdown
n00 hhs −= …………………….….(2)
The design of an artificial recharge
scheme is mainly governed by: the time,
the water is meant to stay underground
and the amount of water that can be
stored in the aquifer. The design value of
detention time (T) during underground
flow determines the improvement in
water quality.
Tdays = p H L/ q0……………………….…….
(3)
The natural recharge by rainfall can be
calculated by,
q r = P x L…………………………(4)

International Journal of Advanced Engineering Technology E-ISSN 0976-3945
IJAET/Vol.I/ Issue II/July-Sept.,2010/150-164
ERRECTION OF RECHARGE WELL
WITH PRECAST OCTAGONAL STEP
WELL AT PROJECT SITE.
Please refer figure 5
TEST RESULTS
Evaluation of Recharging Capacity of
Design Well
Recharging capacity of Recharge bore
well with step well system installed at
site is evaluated as: 8000 liter water
from the tanker takes 15 minutes to
percolate in the soil strata through 0.15
m diameter & 15 m deep recharge bore
well.
Therefore,
Recharging capacity of design well=
8000lit./15min=533lit./min.=32 m3/ hr.
The overall recharging capacity of
installed recharge well at project site is
32 m3/ hr. It shows that in one hour
32,000 lit. water store in recharge well
without spill off.
Correlation Between r, h and Qr.
� Correlations between radius of bore
well (r) and depth of pervious strata
(h) with capacity of borehole (Qr)
(Figure 6)
Overall capacity of Borehole [1]
Qr = k A i t
Coarse sand permeability10-3m/sec=(3.6
m/hr)
Area of Borehole = 2πrh
Hydraulic gradient i = h/L = 20/30
Time = 1 hr
Qr = 3.6 x (2πrh) x h/L x 1
= 3.6 x (2πrh) x 0.67 x 1
Qr = 15 r h…………………………..(5)
(Table 5)
Estimation of Recharge Capacity
w.r.t. d and k
Flow qr by constant head recharge in
borehole.
qr = 2.75 x d x h x k [3]
Where,
d = diameter of bore (m)
h = depth of strata above the G.W.L (m)
= Maximum up to 25 m
k = co-efficient of permeability (m/sec)
qr = 2.75 x 25 x d x k
qr = 65 x d x k………………………..(6)
(Table 6)
� Constant value of bore diameter,
with decrease in permeability
recharges capacity reduces to 10
times.
� If we required more recharge rate
then provide larger diameter bore
instead of installing two smaller
diameter of bore. If the recharge
systems extend in fine sand (semi
pervious strata) (refer figure 1) then
10% recharge rate is added to the
original system in coarse sand.
International Journal of Advanced Engineering Technology E-ISSN 0976-3945
IJAET/Vol.I/ Issue II/July-Sept.,2010/150-164
Confirmation of Test Results for
SVNIT (SURAT, GUJARAT) Project
Site
Verifying recharge rate of installed
artificial recharge well system at SVNIT
by theoretical, experiment & design
table. [4]
���� qr = 30 m3/hr (Theoretically)
���� qr = 32 m3/hr (In-situ pumping in
recharge trial test)
���� qr = 35 m3/hr (Design table 6)
All three approaches give considerably
same value of recharge rate. So adopted
value of designed recharge rate is
confirmed.
Table 7: Recharged water Quality Analysis
S.
No.
Parameters Before Recharge One Year after
Recharge
Two Year
after Recharge
1. Rise of G.W.L. 10.5 m 9.9 m 8.0 m
2. pH 8.2 6.8 7.5
3. Chloride mg/l 550 90 30
4. Hardness mg/l 399 200 200
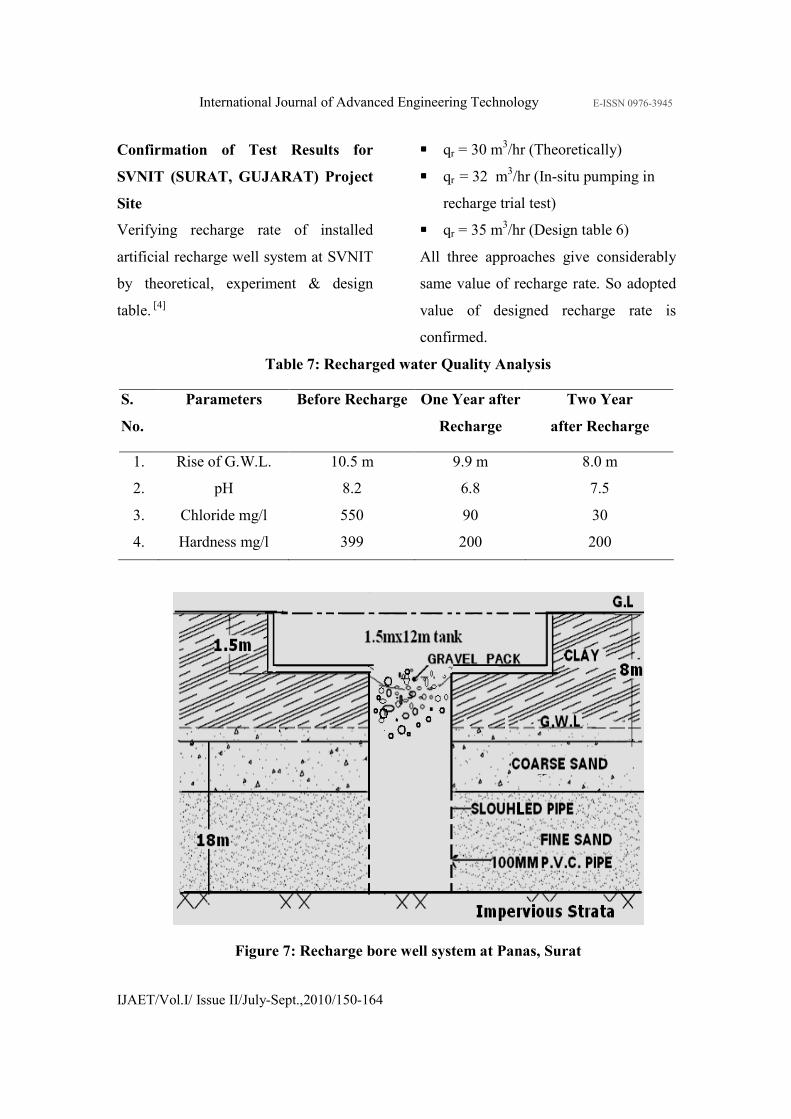
Figure 7: Recharge bore well system at Panas, Surat
International Journal of Advanced Engineering Technology E-ISSN 0976-3945
IJAET/Vol.I/ Issue II/July-Sept.,2010/150-164
CASE STUDIES
Recharge of groundwater through storm
run off and roof top. Water collection,
diversion and collection of run off into
dry tanks, play grounds, parks and other
vacant places are to be implemented by a
recharge well. Authors have suggested
(designed) different techniques at
various sites which are listed below.
Panas Recharge Bore Well: S.M.C.,
Surat. (Figure 7)
Adopting 1.5 m depth and 12 m wide
tank storage tank, 100 mm radius of P.
V. C. pipe, 12m - 20m sloughed pipes
and 20 - 22 cm Gravel pack [1] [9]
Recharge rate Qr= 5.5 x r x h x kav
= 5.5 x 0.1 x 18 x 10-3
= 35.6 m3/hr.
This implies that recharging capacity of
well is of 35.6 m3/hr.Cosidering amount
of recharge is 10 to 20 % of this means
35.6 x .2 = 28.48 m3/hr. Which is
confirmed with value of design Table 5
( 27 m3/hr ).
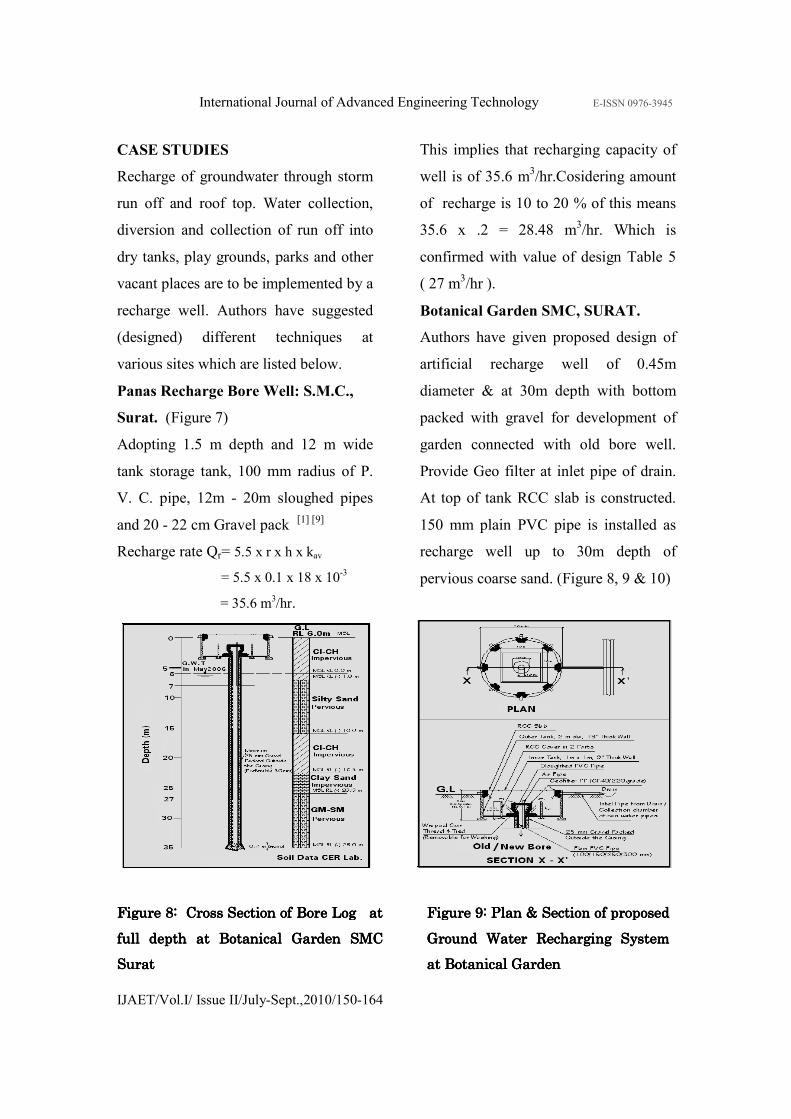
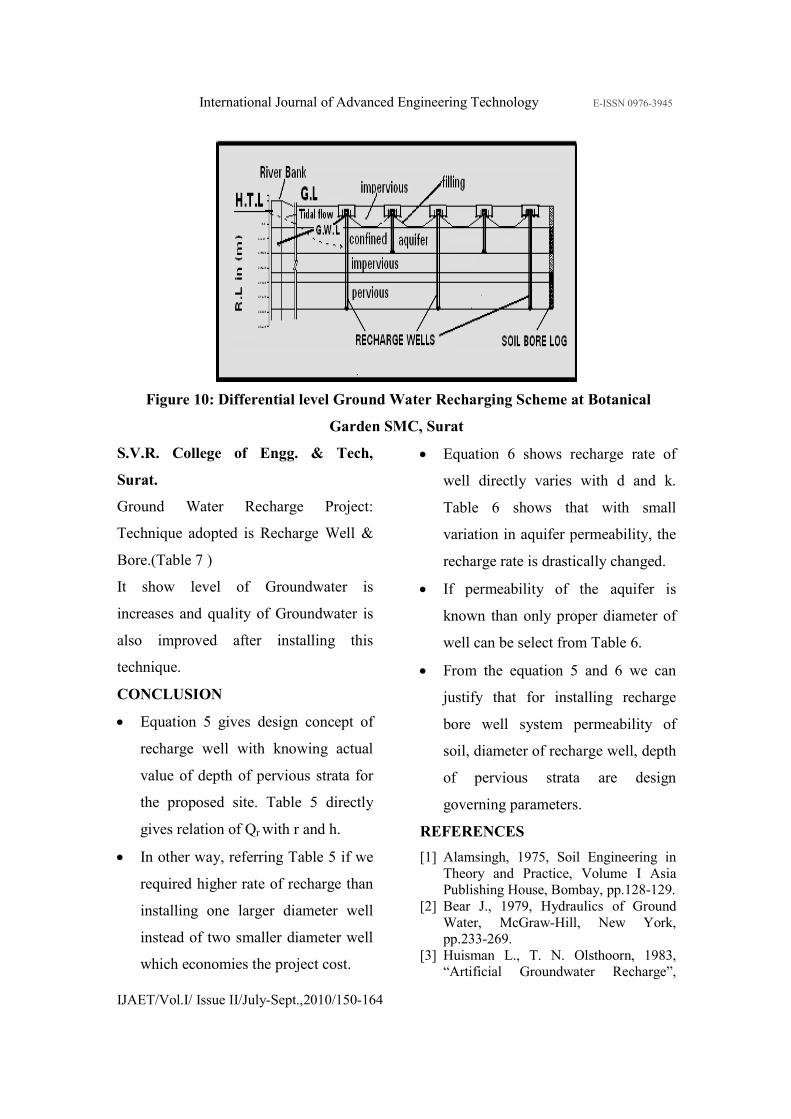
Botanical Garden SMC, SURAT.
Authors have given proposed design of
artificial recharge well of 0.45m
diameter & at 30m depth with bottom
packed with gravel for development of
garden connected with old bore well.
Provide Geo filter at inlet pipe of drain.
At top of tank RCC slab is constructed.
150 mm plain PVC pipe is installed as
recharge well up to 30m depth of
pervious coarse sand. (Figure 8, 9 & 10)
Figure 8Figure 8Figure 8Figure 8:::: Cross Section of Bore Log at Cross Section of Bore Log at Cross Section of Bore Log at Cross Section of Bore Log at
full depfull depfull depfull depth at th at th at th at Botanical Garden SMC Botanical Garden SMC Botanical Garden SMC Botanical Garden SMC
Surat Surat Surat Surat
Figure 9Figure 9Figure 9Figure 9:::: Plan & Section of proposed Plan & Section of proposed Plan & Section of proposed Plan & Section of proposed
GroundGroundGroundGround Water Recharging System Water Recharging System Water Recharging System Water Recharging System
at Botanical Gardenat Botanical Gardenat Botanical Gardenat Botanical Garden
International Journal of Advanced Engineering Technology E-ISSN 0976-3945
IJAET/Vol.I/ Issue II/July-Sept.,2010/150-164
Figure 10: Differential level Ground Water Recharging Scheme at Botanical
Garden SMC, Surat
S.V.R. College of Engg. & Tech,
Surat.
Ground Water Recharge Project:
Technique adopted is Recharge Well &
Bore.(Table 7 )
It show level of Groundwater is
increases and quality of Groundwater is
also improved after installing this
technique.
CONCLUSION
• Equation 5 gives design concept of
recharge well with knowing actual
value of depth of pervious strata for
the proposed site. Table 5 directly
gives relation of Qr with r and h.
• In other way, referring Table 5 if we
required higher rate of recharge than
installing one larger diameter well
instead of two smaller diameter well
which economies the project cost.
• Equation 6 shows recharge rate of
well directly varies with d and k.
Table 6 shows that with small
variation in aquifer permeability, the
recharge rate is drastically changed.
• If permeability of the aquifer is
known than only proper diameter of
well can be select from Table 6.
• From the equation 5 and 6 we can
justify that for installing recharge
bore well system permeability of
soil, diameter of recharge well, depth
of pervious strata are design
governing parameters.
REFERENCES
[1] Alamsingh, 1975, Soil Engineering in
Theory and Practice, Volume I Asia
Publishing House, Bombay, pp.128-129.
[2] Bear J., 1979, Hydraulics of Ground
Water, McGraw-Hill, New York,
pp.233-269.
[3] Huisman L., T. N. Olsthoorn, 1983,
“Artificial Groundwater Recharge”,
International Journal of Advanced Engineering Technology E-ISSN 0976-3945
IJAET/Vol.I/ Issue II/July-Sept.,2010/150-164
Pitman Advanced Publishing Program,
London, pp. 33-79.
[4] I.S.5529 Part I 1985, Indian Standard
Code of Practice for In-situ Permeability
Tests pp.6-12.
[5] James W. Warner, David Molden, 1989,
Mathematical Analysis of Artificial
Recharge from Basins Water Resource,
Bulletin 25, pp. 401-411.
[6] Patel Pratima, Desai M. D., 2008,
Analytical and Computational Aspect of
Artificial Ground Water Recharging into
Unconfined Aquifer, National
Conference on Bitcon Durg, M.P.
(India), pp. 16-19.
[7] Patel Pratima, Desai M. D., 2009,
Numerical Modelling and Mathematics
of Ground Water Recharging --
Unconfined Aquifer, ACSGE
International Conference BITS Pilani,
Rajasthan. pp. 96–105.
[8] Patel Pratima, Desai M. D., 2010,
Artificial Recharge of Ground Water by
Storm Water Reuse is Viable and
Sustainable Solution for Better
Tomorrow, 17th
IAHR-APD
International Conference, AUCKLAND
NEW ZEALAND Session: 6, Green
Devices 3, Paper No.5.
[9] USBR EARTH MANUAL PART I & II
1998, 3rd Edition Bureau of
Reclamation. pp.541-546.