Embed Size (px)
Citation preview

Research ArticleAmelioration of Diabetes and Painful DiabeticNeuropathy by Punica granatum L. Extract andIts Spray Dried Biopolymeric Dispersions
K. Raafat1 and W. Samy2,3
1 Department of Pharmaceutical Sciences, Faculty of Pharmacy, Beirut Arab University, Beirut 115020, Lebanon2Department of Pharmaceutical Technology, Faculty of Pharmacy, Beirut Arab University, Beirut 115020, Lebanon3Department of Industrial Pharmacy, Faculty of Pharmacy, Alexandria University, Alexandria 21521, Egypt
Correspondence should be addressed to K. Raafat; [email protected]
Received 10 February 2014; Revised 14 April 2014; Accepted 30 April 2014; Published 27 May 2014
Academic Editor: Srinivas Nammi
Copyright © 2014 K. Raafat and W. Samy. This is an open access article distributed under the Creative Commons AttributionLicense, which permits unrestricted use, distribution, and reproduction in any medium, provided the original work is properlycited.
Aims. To evaluate the effect of Punica granatum (Pg) rind extract and its spray dried biopolymeric dispersions with casein (F1) orchitosan (F2) againstDiabetes mellitus (DM) and diabetic neuropathy (DN).Methods.Wemeasured the acute (6 h) and subacute (8days) effect of various doses of Pg, F1, and F2 and the active compounds on alloxan-induced DMmouse model. We evaluated DNutilizing latency tests for longer period of time (8 weeks). In addition, the in vivo antioxidant activity was assessed utilizing serumcatalase level. Results.The results proved that the highest dose levels of Pg extract, F1, F2 exerted remarkable hypoglycemic activitywith 48, 52, and 40% drop in the mice glucose levels after 6 hours, respectively. The tested compounds also improved peripheralnerve function as observed from the latency tests. Bioguided fractionation suggested that gallic acid (GA) was Pg main activeingredient responsible for its actions. Conclusion. Pg extract, F1, F2, and GA could be considered as a new therapeutic potential forthe amelioration of diabetic neuropathic pain and the observed in vivo antioxidant potential may be involved in its antinociceptiveeffect. It is highly significant to pay attention to Pg and GA for amelioration and control of DM and its complications.
1. Introduction
Diabetes mellitus (DM) is a major endocrine disorder and theglobal annual cost of treating DM and its complication couldreach US $ trillion [1]. Amelioration of DM is a high priorityin medical research. Self-management of DM is cornerstoneto achieving good glycemic control and reducing the riskof developing microvascular (retinopathy, nephropathy, andneuropathy) and macrovascular (cardiovascular and cere-brovascular) complications [2]. Natural extracts have beenused inmanagement of diabetes and its related complicationsbecause they are safe and readily available [3]. Many plantspecies are used in folk medicine for their hypoglycemicproperties and therefore potentially used for treatment ofDM[4].
Punica granatum (P. granatum) L., universally known aspomegranate, from family Punicaceae, is a distinctive fruitbearing plant with variousmedicinal and dietary importance,
native to the Middle East. P. granatum has shown to possessfree radical scavenging, anticarcinogenic, anti-inflammatory,and effectiveness in the treatment of cancer, cardiovasculardisease, Alzheimer’s disease, arthritis, and erectile dysfunc-tion [5]. Folk medicine suggests some possible benefits of P.granatum to diabetes and some related complications. Somein vitro studies were done to show the antihyperglycemiceffect of P. granatum [6, 7]. The available research suggeststhat ellagic acid is the effective antihyperglycemic compoundin P. granatum [8]. None of these investigations were doneto show the antinociceptive effect of P. granatum on diabeticneuropathy (DN).
Oxidative stress, mediated mainly by hyperglycemia-induced generation of free radicals, helps in the developmentand progression of DM and its complications [4]. Diabeticperipheral neuropathy, which is one of the most frequentlong-term complications of DM, is frequently accompanied
Hindawi Publishing CorporationEvidence-Based Complementary and Alternative MedicineVolume 2014, Article ID 180495, 12 pageshttp://dx.doi.org/10.1155/2014/180495

2 Evidence-Based Complementary and Alternative Medicine
with inferior quality of life [9]. This complication occurs inabout one-quarter of diabetic patients [10]. Painful diabeticneuropathy is associated with symptoms and signs suchas burning, tingling, or lancing type of spontaneous pain,allodynia, and hyperalgesia [11]. Thus, novel therapeutictargets are required for the satisfactory treatment of diabeticneuropathic pain [9, 12]. Abnormal free radicals high levelscause membrane damage leading to decline of antioxidantdefense mechanisms causing cell and tissue damage [13]. Therecent strategy for alleviating the oxidative damage in DM isbased on supplementation with certain dietary antioxidantssuch as vitamins E and C and flavonoids [14].
Due to its unique physicochemical properties, casein, anatural biopolymeric surfactant, has a potential use in thepreparation of conventional and novel pharmaceutical drugdelivery systems. A number of in vitro and in vivo studiesshowed that casein is a suitable material for efficient drugdelivery. Researchers have noted that casein has evolved to beeasily degradable by the digestive enzymes proteases. Caseinmicrospheres, either plain or cross-linked, could be promis-ing parenteral biodegradable carriers for sustained delivery ofdrugs when administered via intramuscular, intraperitoneal,or direct intratumoral or intra-arterially for embolization insolid tumor deposits [15].
Chitosan, another biodegradable polymer, is a lin-ear polysaccharide composed of randomly distributed (1–4)-linked d-glucosamine and N-acetyl-d-glucosamine [16].Studies on the possible biomedical applications of chitosanhave been adapted due to its low cytotoxicity, biodegradabil-ity, and antimicrobial activity [17–19].
Therefore, the aim of the present work involves the studyof possible hypoglycemic, in vivo antioxidant, and diabeticneuropathy management effects of ethanolic rind extract ofP. granatum and its biodegradable polymeric dispersionswitheither casein or chitosan.
2. Materials and Methods
2.1. Materials. Dried P. granatum L. fruit rind was purchasedcommercially from Ibn-Al-Nafess herbalist, Beirut, Lebanon.The solvents used in extraction and standards, alloxan, caseinand chitosan (150 kDa) were purchased from Sigma-Aldrich(St. Louis, USA). Glibenclamide (GB) was commerciallypurchased (Lansa Pharm., China). Tramadol hydrochloridewas obtained commercially (Deutsche Labs, Germany). Allother chemicals were analytical grade chemicals.
2.2. Preparation of Plant Extract. The dried rind wasextracted using 80% ethanol. The ethanolic extract was driedin a rotary evaporator (Buchi, Germany) at temperature 40∘Cunder vacuum. The rind was authenticated with a referencesample, and a voucher specimen (PS-13-11) was deposited inthe faculty herbarium.
2.3. Preparation of the Spray Dried Polymeric Dispersions.Casein was dissolved in 0.1 N NaOH in a concentrationof 1.5% w/w. The partially dried extract (soft extract) ofP. granatum was then added and mixed using a magneticstirrer to have an extract/polymer ratio of 1 : 1. The polymeric
dispersion was then neutralized with a few drops of 1 N HCltill a pH of 7.4 before feeding into LabPlant Mini-Spray dryerSD-06AG (LabPlant, UK). Inlet temperature was adjusted at165∘C and the outlet at 75–80∘C. The dried product (F1) wascollected and kept in a desiccator till further testing.
For chitosan dispersions (F2), chitosan solution (1.5%w/w) was prepared in 1% acetic acid and the soft extractwas added to the solution to have an extract/polymer ratioof 1 : 1. The dispersion was then fed into the spray dryer asdescribed above. The dried products were collected and keptin desiccators till further testing. Placebo dispersions of thepolymers were prepared for control testing.
At the used extract/polymer ratios, the produced powdersshould have 1mg Pg extract/2mg of either of the driedformula (that the given Pg extract doses of 25, 50, and100mg/kg are equivalent to a powder dose; of either F1 or F2;of 50, 100, and 200mg/kg, resp.).
2.4. HPLC Analysis of P. granatum Ethanolic Extract. Chro-matographic optimization was done using the HPLC condi-tions and the investigation of columns with different packingmaterials, different wavelengths from 200 nm to 400 nm,and different mobile phase systems. An ideal chromato-graphic separation was achieved using RP-C18 endcappedLichrospher column (250 × 4.6mm I. D.; 5𝜇M particle size)(Merck), at 40∘C [20]. Isocratic elution was performed using(43 : 57) methanol/phosphate buffer 34.1mM and pH 2.1.Theflow rate was adjusted to 1mL/min.
2.5. Determination of Total Phenolic Compounds in the Extractand Spray Dried Polymeric Dispersions. Generally, measure-ment of color occurred by reaction between Folin-Ciocalteu’sphenol reagent [21, 22], and extract is a preferred methodfor the determination of the phenolic compounds, becausethe majority of their ingredients are polyphenols [21, 23].Total contents of the phenolic compounds in the extractswere determined by Folin-Ciocalteu’s method [22] as gallicacid equivalents (GAE) [23, 24]. In brief, 250 𝜇L of Folin-Ciocalteu’s phenol reagent was mixed with 50𝜇L of thesamples, and 500 𝜇L of 20% water solution of Na
2CO3was
added to the mixture. Mixtures were vortexed and completedwith water to 5mL. As control, reagent without addition ofextract was used. After incubation of the samples at ambienttemperature for 30min, their absorbance was measured at765 nm. The calibration curve was assembled by using freshprepared gallic acid solutions as a base in calculations of totalphenolic compound contents in the extracts. Experimentswere repeated three times for every extract and the total phe-nolics were given in average values as GAE (mg gallic acid/gextract) [25, 26]. For the calibration curve, 10mg of gallicacid was dissolved in 10mL of MeOH utilizing an ultrasonicbath (stock solution). Various dilutions of stock solutionwereprepared and were determined by Folin-Ciocalteu’s method[22, 27].The experiments were repeated three times for everydilution and a calibration curve was created [24].
2.6. Content and In Vitro Release Pattern of the Dispersions.An amount equivalent to 8mg of the soft extract was digested

Evidence-Based Complementary and Alternative Medicine 3
in 100mL PBS pH 7.4. After sonication for 15 minutes,the content was assayed for the total phenolics by Folin-Ciocalteu’s method [22] after proper dilution.
The in vitro release pattern of the extract was estimated byplacing an amount equivalent to 8mg of each formulation ina dialysis tubing (Visking Dialysis Tubing) closed by tubingclosures at one end, 2mL of the release medium was thenadded, and the other tube end was also closed by the tubingclosure. The tube assembly was clamped to the paddle of adissolution rate apparatus immersed in 500mL PBS (pH 7.4)placed in the dissolution apparatus jar. The temperature wasadjusted at 35∘C, while the paddle was rotated at 50 rpm.Samples of 5mL each were withdrawn at fixed time intervalsand replaced with prewarmed buffer solution. Each samplewas assayed by Folin-Ciocalteu’s method and the averagereading was calculated.
2.7. Bio-Guided Chromatographic Fractionation and Identifi-cation of the Effective Compounds. The P. granatum ethanolicextract (Pg) was fractionated using column chromatography.Preparative chromatography column, 50mm diameter and100 cmheight, was used. Elutionwas done using ethyl acetate,formic acid, water, and hexane at ratios of 70 : 7.5 : 7.5 : 15,respectively, asmobile phase and silica gel as stationary phase.During the entire chromatography process the eluent wascollected in a series of over 200 fractions by time.
Each fraction was tested in the same way as the testsolutions in this study using in vivo alloxan-diabetic mice.The most active fraction was analyzed using RP-HPLC.The injection volume was 20 𝜇L and UV detection wasperformed using UV-detector at 270 nm, which has the high-est absorbance for the tested active fraction, using JASCOspectrophotometer (JASCO), and confirmed utilizing TLCand standard steeping method utilizing standard calibrationcurves.
2.8. Animals. Male Swiss-Webster mice (Faculty of Phar-macy, Beirut Arab University) were accommodated for oneweek prior to the experimentation. The environment con-sisted of standard mouse cages with a 12 h light/dark cycle.The temperature was 22 ± 1∘C; animals had open accessto water and standard laboratory pellets (20% proteins, 5%fats, and 1% multivitamins) [26, 28]. The mice were kept inthose conditions for a seven-day period of adaptation priorto the beginning of the experiment. Sixteen hours before theexperiment, mice were fasted overnight but allowed openaccess to water. All animal care and experiments were donein accordance with Lebanese Ministry of Higher Educationand with the approval of Beirut Arab University InstitutionalReview Board.
2.9. Diabetes Induction. Experimental DM was induced byintraperitoneal (IP) injection of freshly prepared alloxandissolved in sterile saline (0.9%) every 48 h for three timesat a dose of 180mg/kg. Fasting glucose levels in the bloodsamples obtained from the tail of each mouse 72 h after thelast alloxan injection were measured with Accu-Chek Activeglucose strips in Accu-Chek Active TestMeter (Roche, USA).
The glucose levels were expressed asmg/dL.Glucose (5%)wasadded to mice drinking water. The mice with blood glucoselevelmore than 200mg/dLwere considered to be diabetic andwere used in the experiment.
2.10. Acute Antidiabetic Effect of the P. granatum Extractin Alloxan-Induced Diabetic Mice. The diabetic mice weredivided into sixteen groups of seven animals each. Theanimals of each group had a single IP injection as follows.
(i) Group I received only vehicle (0.9% sterile saline) andserved as control.
(ii) Group II receivedGB dissolved inDMSO as referencedrug (5mg/kg).
(iii) Groups III, IV, andV received the Pg extract dissolvedin vehicle at doses of 25, 50, and 100mg/kg, respec-tively.
(iv) Groups VI, VII, and VIII received F1, suspended invehicle at doses equivalent to 25, 50, and 100mg Pgextract/kg, respectively.
(v) Group VIII received placebo F1 suspended in vehicle(200mg/kg).
(vi) Groups IX, X, and XII received F2, suspended invehicle at doses equivalent to 25, 50, and 100mg Pgextract/kg, respectively.
(vii) Group XIII received placebo F2 suspended in vehicle(200mg/kg).
(viii) Groups XIV, XV, and XVI received gallic acid (GA)dissolved in DMSO, at doses of 3, 6, and 12mg/kg tothe animals, respectively.
Blood samples were collected from the tail just prior toand at 0.5, 2, and 6 h after dosing. Blood glucose and bodyweight were determined.
2.11. Subacute Antidiabetic Effect of the P. granatum Extractin Alloxan-Induced Diabetic Mice. The action of Pg was alsotested during a longer duration of treatment. The mice weredivided into groups containing healthy and diabetic animals.Group I (healthy mice, 𝑛 = 7) received only vehicle IP for7 days and served as control [4]. The diabetic mice weredivided into sixteen groups (II–XVII) of seven animals each.The animals of each group were treated for 7 days with a dailyIP injection as follows.
(i) Group II received only vehicle (0.9% sterile saline)and served as diabetic control.
(ii) Group III received GB dissolved in DMSO as refer-ence drug (5mg/kg, IP).
(iii) Groups IV, V, and VI received Pg extract dissolved invehicle at doses of 25, 50, and 100mg/kg, respectively.
(iv) Groups VII, VIII, and IX received F1 suspended invehicle at doses equivalent to 25, 50, and 100mg Pgextract/kg, respectively.
(v) Group X received placebo F1 suspended in vehicle200mg/kg.
4 Evidence-Based Complementary and Alternative Medicine
(vi) Groups XI, XII, and XIII received Pg F2 suspended invehicle at doses equivalent to 25, 50, and 100mg Pgextract/kg, respectively.
(vii) Group XIV received placebo F2 suspended in vehicle200mg/kg.
(viii) Groups XV, XVI, and XVII received GA, dissolved inDMSO, at doses of 3, 6, and 12mg/kg, respectively.
The blood glucose level of each animal was monitored onthe 1st, 3rd, 5th, and 8th days after 6 h of each injection givenevery other day.
The antioxidant enzyme (catalase) levels were measuredand the body weights of the animals were recorded at thesame day.
2.12. Management of Diabetic Neuropathy. After six weeksof induction of diabetes in animals, DN success rate (i.e.,loss of sensory of thermal sensitivity significantly below 10 s[29]) was ca. 85%, and their neurological function was testedat one-week intervals for eight weeks, with tramadol (TRA)10mg/kg as a positive control, using the following tests.
2.12.1. Hot Plate Latency Test. The animals were positionedone at a time on the hot plate (hot plate analgesia meter, UgoBasile, Italy) that is maintained at a temperature of 55±0.1∘C.Response latency either to jump or to a hindpaw lick wasmonitored by means of an electronic timer. To avoid tissuedamage, a cut-off time of 30 s was selected [30].
2.12.2. Tail Flick Latency Test. In brief, a beam of light wasfocused on the dorsal surface of the mouse tail using tail flickapparatus with appropriate tail flick mice restrainer (HugoSachs Elektronik, Germany) and the time until the tail flickedwas measured. The tail withdrawal latency, time from onsetof the radiant heat to the withdrawal of the tail, was recordedwith a timer. The light intensity in the apparatus was set sothat the baseline tail withdrawal latency was about 5.6 s in allmice. A cut-off time of 10.00 ± 0.50 s was set with the purposeof preventing tissue damage [30].
2.13. Estimation of Antioxidant Activity. Catalase (CAT)activity was determined in serum using themodifiedmethoddescribed before in the literature [31]. CAT activity wasexpressed as kU/L.
2.14. Statistical Analysis. All values are presented as means ±SEM. Statistical differences between the test and the controlwere tested by one-way analysis of variance (ANOVA) fol-lowed by the Student-Newman-Keuls test using the “Orig-inPro” statistic computer program. A difference in the meanvalues of 𝑃 ≤ 0.05 was considered to be statistically signif-icant.
3. Results
3.1. HPLC Analysis of Pg Extract. After the bioguided frac-tionation, the most active P. granatum extract fraction was
0
20
40
60
80
100
120
0 0.5 1 1.5 2 2.5 3 3.5
Time (hr)
F1F2
Rele
ased
(%)
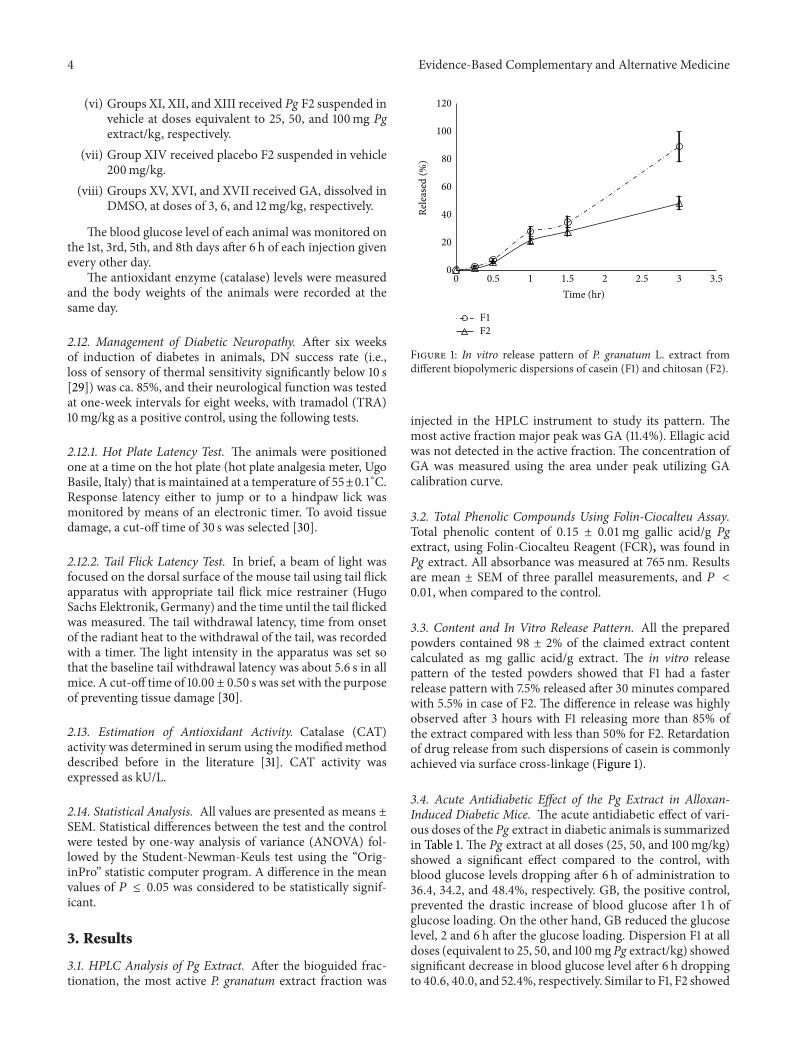
Figure 1: In vitro release pattern of P. granatum L. extract fromdifferent biopolymeric dispersions of casein (F1) and chitosan (F2).
injected in the HPLC instrument to study its pattern. Themost active fraction major peak was GA (11.4%). Ellagic acidwas not detected in the active fraction. The concentration ofGA was measured using the area under peak utilizing GAcalibration curve.
3.2. Total Phenolic Compounds Using Folin-Ciocalteu Assay.Total phenolic content of 0.15 ± 0.01mg gallic acid/g Pgextract, using Folin-Ciocalteu Reagent (FCR), was found inPg extract. All absorbance was measured at 765 nm. Resultsare mean ± SEM of three parallel measurements, and 𝑃 <0.01, when compared to the control.
3.3. Content and In Vitro Release Pattern. All the preparedpowders contained 98 ± 2% of the claimed extract contentcalculated as mg gallic acid/g extract. The in vitro releasepattern of the tested powders showed that F1 had a fasterrelease pattern with 7.5% released after 30 minutes comparedwith 5.5% in case of F2. The difference in release was highlyobserved after 3 hours with F1 releasing more than 85% ofthe extract compared with less than 50% for F2. Retardationof drug release from such dispersions of casein is commonlyachieved via surface cross-linkage (Figure 1).
3.4. Acute Antidiabetic Effect of the Pg Extract in Alloxan-Induced Diabetic Mice. The acute antidiabetic effect of vari-ous doses of the Pg extract in diabetic animals is summarizedin Table 1. The Pg extract at all doses (25, 50, and 100mg/kg)showed a significant effect compared to the control, withblood glucose levels dropping after 6 h of administration to36.4, 34.2, and 48.4%, respectively. GB, the positive control,prevented the drastic increase of blood glucose after 1 h ofglucose loading. On the other hand, GB reduced the glucoselevel, 2 and 6 h after the glucose loading. Dispersion F1 at alldoses (equivalent to 25, 50, and 100mg Pg extract/kg) showedsignificant decrease in blood glucose level after 6 h droppingto 40.6, 40.0, and 52.4%, respectively. Similar to F1, F2 showed

Evidence-Based Complementary and Alternative Medicine 5
Table 1: Acute effect of P. granatum ethanolic extract (Pg), F1, F2, and gallic acid (GA) on blood glucose of alloxan-induced diabetic mice (n= 7).
Group Dose (mg/kg) Mean blood glucose concentration ± SEM (mg/dL)0 hr 0.5 hr 2 hr 6 hr
Diabetic control — 202.79 ± 5.60 211.93 ± 4.50 214.21 ± 9.70 210.15 ± 7.30GB 5 219.70 ± 3.70 223.64 ± 1.80 159.74 ± 2.10 130.64 ± 2.40∗∗
Pg 25 218.29 ± 1.50 142.44 ± 2.80 181.56 ± 2.02 138.89 ± 1.45∗
Pg 50 200.43 ± 2.10 240.93 ± 2.50 158.41 ± 2.60 131.96 ± 1.90∗
Pg 100 249.92 ± 1.80 292.44 ± 2.80 228.56 ± 2.02 128.98± 1.54∗
Placebo F1 200 208.10 ± 3.10 227.23 ± 2.10 222.62 ± 2.30 209.98 ± 2.90F1 50 243.12 ± 1.30 158.44 ± 1.90 167.65 ± 2.10 144.33 ± 2.00∗
F1 100 201.33 ± 1.70 130.44 ± 2.10 160.89 ± 2.90 120.77 ± 2.10∗
F1 200 263.11 ± 2.90 139.56 ± 2.40 117.79 ± 2.80 125.33 ± 2.30∗
Placebo F2 200 213.56 ± 3.10 202.17 ± 2.60 201.13 ± 2.80 229.56 ± 3.10F2 50 211.55 ± 2.90 205.12 ± 1.30 146.82 ± 1.40 147.725 ± 2.80∗
F2 100 214.65 ± 1.30 213.99 ± 1.90 186.83 ± 1.10 123.27 ± 1.20∗
F2 200 240.44 ± 2.50 190.825 ± 1.90 172.165 ± 1.80 142.87 ± 2.20∗
GA 3 201.29 ± 5.60 210.43 ± 4.50 213.71 ± 9.70 209.05 ± 7.30GA 6 202.20 ± 3.70 222.14 ± 1.80 158.24 ± 2.10 129.14 ± 2.40∗∗
GA 12 218.29 ± 1.50 142.44 ± 2.80 181.56 ± 2.02 138.89 ± 1.45∗
SEM: standard error of the mean.∗P < 0.05 significant from the control animals.∗∗P < 0.01 significant from the control animals.
significant decrease in blood glucose level after 6 h at all doses(equivalent to 25, 50, and 100mg Pg extract/kg) with theglucose level dropping to 30.2, 42.6, and 40.6%, respectively.On the other hand, placebos F1 and F2 did not significantlyreduce the glucose level 6 h after the glucose loading. In caseofGA, standardGA at the lowest dose (3mg/kg) did not showa significant effect from that of control after 6 h of glucoseadministration. At higher doses (6 and 12mg/kg) GA showeda significant effect, with blood glucose levels dropping to 36.1and 36.4%, respectively, compared to that of control after 6 hof glucose administration.
3.5. Subacute Effect of the Pg Extract in Alloxan-InducedDiabetic Mice. As shown in Table 2, the blood glucose levelsof diabetic control (positive control) mice were significantlyhigher than those of the control (negative control) miceduring the experiment period. The highest reduction inblood glucose using Pg extract was observed with a dose of100mg/kg, showing 54.2% reduction in blood glucose levelson the 8th day compared with 17.7 and 6.4% reduction in caseof 25, 50mg/kg doses, respectively.
The F1 at all doses (equivalent to 25, 50, and 100mg Pgextract/kg) showed significant decrease in blood glucose levelon the 8th day compared to that of the diabetic control withthe mice glucose levels dropping to 40.2, 40.9, and 50.5%,respectively. Similarly, F2 at all doses (equivalent to 25, 50,and 100mg Pg extract/kg) showed significant decrease inblood glucose level on the 8th day dropping to 43.7, 44.1, and49.0%, respectively. Placebos F1 and F2 did not significantlyreduce the glucose level on the 8th day compared to that ofthe diabetic control.
For GA, standard GA showed a significant effect com-pared to that of diabetic control on the 8th day at all doses(3, 6, and 12mg/kg), with blood glucose levels dropping to51.6, 53.3, and 43.7%, respectively.
During the subacute administration, mice treated withGB and various doses of the Pg extract, F1, F2, and GA werealsomonitored for changes inweight (Table 3).ThePg extractshowed 5.9, 30.7, and 21.9% increase in body weight at dosesof 25, 50, and 100mg/kg, respectively, on the 8th day. In caseof F1 at doses equivalent to 25, 50, and 100mg Pg extract/kgshowed 9.8, 10.5, and 17.8% increase in body weight on the 8thday, respectively. Similarly, F2 at doses equivalent to 25, 50,and 100mg Pg extract/kg showed 9.8, 10.5, and 17.8% increasein body weight on the 8th day. Placebos F1 and F2 did notsignificantly show any increase in body weight on the 8th daycompared to that of the diabetic control. Also GA at all doses(3, 6, and 12mg/kg) showed a significant increase in bodyweight on the 8th day, of 23.9, 18.9, and 6.5%, respectively.
In order to evaluate in vivo antioxidant effect of the testedPg extract and its polymeric dispersions, CAT level in serumof each mouse was monitored on 1st, 3rd, 5th, and 8th daysafter administration. As shown in Table 4, diabetic mice weremonitored for changes in serum CAT level after treatmentwith GB and various doses of the Pg extract, F1, F2, andGA. The Pg extract at doses of 25, 50, and 100mg/kg hada gradual rise in serum CAT activity to reach a significantdifference on 5th (1.0, 9.2, and 15.1%, resp.) and 8th day (4.1,6.1, and 15.5%, resp.) as compared with diabetic control mice.Polymeric dispersion F1 at doses equivalent to 25, 50, and100mg Pg extract/kg had a gradual rise in serumCAT activityto reach significant differences on 5th (2.7, 8.7, and 14.5%,resp.) and 8th day (5.2, 6.1, and 19.8%, resp.) as compared

6 Evidence-Based Complementary and Alternative Medicine
Table 2: Subacute effect of Pg, F1, F2, and GA on blood glucose of alloxan-induced diabetic mice (n = 7).
Group Dose (mg/kg) Mean blood glucose concentration ± SEM (mg/dL)1st day 3rd day 5th day 8th day
Control — 107.90 ± 2.50 109.80 ± 3.60 108.86 ± 3.20 117.50 ± 4.70Diabetic controla — 202.79 ± 5.60∗∗∗ 211.93 ± 4.50∗∗∗ 214.91 ± 9.70∗∗∗ 210.55 ± 7.30∗∗∗
GBb 5 186.70 ± 3.70 179.53 ± 2.90 161.54 ± 2.40∗∗ 171.97 ± 3.10Pgb 25 138.67 ± 2.60 87.54 ± 1.70 158.63 ± 2.30 135.50 ± 2.10∗∗
Pgb 50 143.34 ± 1.90 119.67 ± 1.70 119.33 ± 1.90 119.10 ± 1.10∗∗
Pgb 100 132.12 ± 1.30 112.98 ± 2.50 124.36 ± 2.60 111.50 ± 2.50∗
Placebo F1 200 193.10 ± 3.10 212.66 ± 2.90 229.54 ± 2.80 226.33 ± 2.10F1b 50 144.11 ± 1.20 129.40 ± 1.60 130.66 ± 2.40 125.88 ± 3.10∗
F1b 100 120.33 ± 1.70 115.60 ± 2.40 128.65 ± 2.90 124.33 ± 3.20∗
F1b 200 125.21 ± 2.90 115.50 ± 3.10 108.40 ± 2.40 104.32 ± 1.90∗
Placebo F2 200 229.33 ± 2.50 226.89 ± 2.90 204.98 ± 3.10 265.44 ± 2.90F2b 50 175.50 ± 2.50 119.90 ± 2.10 119.10 ± 1.30 118.50 ± 1.90∗
F2b 100 118.65 ± 1.30 128.10 ± 1.30 122.49 ± 2.40 117.65 ± 2.10∗
F2b 200 191.33 ± 3.90 94.54 ± 1.40 108.55 ± 3.40 107.43 ± 2.50∗
GAb 3 198.10 ± 1.90 208.00 ± 2.20 111.36 ± 3.30 101.88 ± 2.22∗
GAb 6 179.65 ± 3.10 134.66 ± 2.60 130.54 ± 2.90 98.23 ± 2.87∗
GAb 12 168.33 ± 2.90 140.50 ± 3.50 137.25 ± 2.70 118.55 ± 3.50∗
SEM: standard error of the mean.∗P < 0.05 significant from the control animals.∗∗P < 0.01 significant from the control animals.∗∗∗P < 0.001 significant from the control animals.aCompared to vehicle control.bCompared to diabetic control.
Table 3: Subacute effect of Pg, F1, F2, and GA on body weights in alloxan-induced diabetic mice (n = 7).
Group Dose (mg/kg) Mean body weight ± SEM (gm)1st day 3rd day 5th day 8th day
Control — 25.90 ± 0.50 26.00 ± 0.60 26.01 ± 0.97 26.62 ± 0.70Diabetic controla — 28.68 ± 0.70 27.10 ± 0.20 27.15 ± 0.80 27.69 ± 0.50GBb 5 22.90 ± 0.70 28.17 ± 1.70 28.54 ± 0.40 30.37 ± 1.10∗
Pgb 25 24.11 ± 2.60 27.70 ± 1.50 30.20 ± 1.60 30.40 ± 2.10∗∗
Pgb 50 29.30 ± 1.90 29.20 ± 1.60 29.30 ± 1.80 31.50 ± 2.20∗∗
Pgb 100 30.24 ± 2.60 30.40 ± 1.70 31.54 ± 3.90 31.98 ± 2.90∗
Placebo F1 200 27.50 ± 2.10 27.50 ± 2.20 27.00 ± 2.40 26.88 ± 2.50F1b 50 31.11 ± 1.20 31.00 ± 1.50 31.10 ± 1.60 31.50 ± 1.90F1b 100 30.10 ± 1.40 29.50 ± 2.50 30.50 ± 2.40 31.70 ± 2.50∗
F1b 200 31.00 ± 1.90 29.00 ± 3.50 32.60 ± 2.90 33.80 ± 2.80∗
Placebo F2 200 24.50 ± 2.50 24.45 ± 2.60 24.01 ± 2.50 23.60 ± 2.40F2b 50 27.30 ± 1.90 27.40 ± 1.80 27.5 ± 1.90 27.8 ± 2.00F2b 100 28.40 ± 1.40 28.5 ± 1.50 28.90 ± 1.60 30.25 ± 2.50∗
F2b 200 31.90 ± 1.90 32.00 ± 1.80 32.50 ± 1.90 33.11 ± 2.10∗
GAb 3 29.20 ± 1.20 30.30 ± 1.30 30.50 ± 1.10 32.05 ± 1.20∗
GAb 6 31.56 ± 1.10 32.67 ± 0.60 33.45 ± 1.00 34.10 ± 1.60∗
GAb 12 30.20 ± 1.20 30.30 ± 1.30 29.50 ± 1.50 30.56 ± 1.40SEM: standard error of the mean.∗P < 0.05 significant from the control animals.aCompared to vehicle control.bCompared to diabetic control.

Evidence-Based Complementary and Alternative Medicine 7
Table 4: In vivo assessment of the antioxidant activity of Pg, F1, F2, and GA using catalase levels in serum of alloxan-induced diabetic mice(n = 7).
Group Dose (mg/kg) Catalase level ± SEM (kU/I)1st day 3rd day 5th day 8th day
Control — 41.00 ± 1.50 41.50 ± 1.60 40.86 ± 1.20 41.62 ± 1.70Diabetic controla — 21.67 ± 1.60∗∗∗ 20.93 ± 1.30∗∗∗ 24.01 ± 1.90∗∗∗ 25.55 ± 1.40∗∗∗
GBb 5 22.60 ± 1.70 25.00 ± 1.70 31.54 ± 1.40∗ 32.37 ± 1.00∗∗
Pgb 25 22.33 ± 1.80 22.66 ± 1.60 24.26 ± 2.10∗ 26.60 ± 1.90∗∗
Pgb 50 20.44 ± 1.30 22.55 ± 1.90 26.22 ± 1.69∗ 27.10 ± 1.20∗∗
Pgb 100 23.33 ± 1.50 26.40 ± 2.10 27.63 ± 2.10∗ 29.50 ± 2.30∗
Placebo F1 200 21.50 ± 2.80 20.77 ± 2.10 20.84 ± 2.80 20.33 ± 2.20F1b 50 20.11 ± 1.20 21.40 ± 1.60 24.66 ± 2.40∗ 26.88 ± 3.10∗
F1b 100 22.33 ± 1.70 23.42 ± 2.20 26.10 ± 2.70∗ 27.10 ± 2.90∗
F1b 200 19.44 ± 2.10 23.66 ± 2.70 27.50 ± 2.50∗ 30.62 ± 1.60∗
Placebo F2 200 22.54 ± 2.40 20.89 ± 2.80 20.89 ± 3.10 20.66 ± 2.80F2b 50 24.44 ± 2.70 24.21± 2.00 25.40 ± 1.70∗ 26.40 ± 1.70F2b 100 20.14 ± 1.30 19.40 ± 1.40 24.00 ± 2.10∗ 26.56 ± 2.20∗
F2b 200 21.85 ± 3.10 24.54 ± 2.40 26.66 ± 3.40∗ 28.34 ± 2.40∗
GAb 3 21.44 ± 1.60 20.11 ± 1.10 22.36 ± 1.60 23.22 ± 1.30GAb 6 20.55 ± 1.50 22.78 ± 1.60 24.85 ± 1.80∗ 26.42 ± 0.80∗
GAb 12 24.00 ± 1.80 22.30 ± 1.40 24.11 ± 1.10∗ 26.33 ± 1.20∗
SEM: standard error of the mean.∗P < 0.05 significant from the control animals.∗∗P < 0.01 significant from the control animals.∗∗∗P < 0.001 significant from the control animals.aCompared to vehicle control.bCompared to diabetic control.
0 2 4 6 84
5
6
7
8
9
10
11
Hot
pla
te la
tenc
y (s
)
Weeks
NORMDIA + VEHDIA + TRA 10mg/kg
DIA + Pg 100mg/kgDIA + Pg 50mg/kgDIA + Pg 25mg/kg
(a)
1
2
3
4
5
6
7
8
9
10
11
Tail
with
draw
al la
tenc
y (s
)
0 2 4 6 8
Weeks
NORMDIA + VEH
∗∗
∗
∗∗
∗∗
∗
∗
∗
∗
∗∗
∗
∗
∗
DIA + TRA 10mg/kg
DIA + Pg 100mg/kgDIA + Pg 50mg/kgDIA + Pg 25mg/kg
(b)
Figure 2: Effect of P. granatum ethanolic extract (Pg) and tramadol (TRA) 10mg/kg, as positive control, on the hot plate and tail withdrawallatencies in alloxan-induced diabetic mice. (a) Hot plate latency: NORM: normal control mice (crossed-triangles, straight line); DIA + VEH:diabetic animals treated with vehicle as control (closed-squares, straight-line); positive control TRA 10mg/kg: alloxan treated mice withTRA 10mg/kg (solid-stars, dotted-line); DIA + Pg 25mg/kg: diabetic animals treated with Pg 25mg/kg (solid-circles, straight-line); DIA +Pg 50mg/kg: diabetic animals treated with Pg 50mg/kg (up-triangles, dashed-line); DIA + Pg 100mg/kg: diabetic animals treated with Pg100mg/kg (right-triangles, dashed-dotted-line). (b) Tail withdrawal latency: NORM: normal control mice (crossed-triangles, straight line);DIA + VEH: diabetic animals treated with vehicle as control (closed-squares, straight-line); positive control TRA 10mg/kg: alloxan treatedmice with TRA 10mg/kg (solid-stars, dotted-line); DIA + Pg 25mg/kg: diabetic animals treated with Pg 25mg/kg (solid-circles, straight-line);DIA + Pg 50mg/kg: diabetic animals treated with Pg 50mg/kg (up-triangles, dashed-line); DIA + Pg 100mg/kg: diabetic animals treated withPg 100mg/kg (right-triangles, dashed-dotted-line). Data are expressed in mean ± SEM. “∗” means 𝑃 < 0.05 compared with vehicle. “∗∗”means 𝑃 < 0.01 compared with vehicle.

8 Evidence-Based Complementary and Alternative Medicine
4
5
6
7
8
9
10
11H
ot p
late
late
ncy
(s)
0 2 4 6 8
Weeks
NORM
DIA + VEHPlacebo F1
TRA 10mg/kg
∗∗
∗∗∗∗
∗
∗
∗ ∗ ∗ ∗
∗∗
∗∗
DIA + Pg F1300mg/kgDIA + Pg F1150mg/kg
DIA + Pg F175mg/kg
(a)
0 2 4 6 8
Weeks
NORM
DIA + VEHPlacebo F1
TRA 10mg/kg
1
2
3
4
5
6
7
8
9
10
11
Tail
with
draw
al la
tenc
y (s
)
∗∗∗∗
∗
∗ ∗∗
∗∗
∗
∗∗∗
∗∗
∗
∗
∗
DIA + F1Pg300mg/kgDIA + F1Pg150mg/kg
DIA + F1Pg75mg/kg
(b)
Figure 3: Effect of F1 and TRA 10mg/kg, as positive control, on the hot plate and tail withdrawal latencies in alloxan-induced diabetic mice.(a) Hot plate latency: NORM: normal control mice (crossed-triangles, straight line); DIA + VEH: diabetic animals treated with vehicle ascontrol (closed-squares, straight-line); placebo F1: diabetic animals treatedwith placebo F1 200mg/kg (crossed-squares, dashed-line); positivecontrol TRA 10mg/kg: alloxan treatedmice with TRA 10mg/kg (solid-stars, dotted-line); DIA + F1 50mg/kg: diabetic animals treated with F150mg/kg (solid-circles, straight-line); DIA + F1 100mg/kg: diabetic animals treated with F1 100mg/kg (up-triangles, dashed-line); DIA + F1200mg/kg: diabetic animals treated with Pg F1 200mg/kg (right-triangles, dashed-dotted-line). (b) Tail withdrawal latency: NORM: normalcontrol mice (crossed-triangles, straight line); DIA + VEH: diabetic animals treated with vehicle as control (closed-squares, straight-line);placebo F1: diabetic animals treated with placebo F1 200mg/kg (crossed-squares, dashed-line); positive control TRA 10mg/kg: alloxan treatedmice with TRA 10mg/kg (solid-stars, dotted-line); DIA + F1 50mg/kg: diabetic animals treated with F1 50mg/kg (solid-circles, straight-line);DIA + F1 100mg/kg: diabetic animals treated with F1 100mg/kg (up-triangles, dashed-line); DIA + F1 200mg/kg: diabetic animals treatedwith F1 200mg/kg (right-triangles, dashed-dotted-line). Data are expressed in mean ± SEM. “∗” means 𝑃 < 0.05 compared with vehicle.“∗∗” means 𝑃 < 0.01 compared with vehicle.
with diabetic control mice. Similarly, F2 had a gradual risein serum CAT activity to reach a significant difference on the8th day with CAT activities of 3.3, 4.0, and 10.9% for dosesequivalent to 25, 50, and 100mg Pg extract/kg, respectively.Placebos F1 and F2 did not significantly show any increasein serum CAT level compared to that of the diabetic control.GA at doses 6 and 12mg/kg had also shown a gradual rise inserumCATactivity to reach a significant difference on the 8thday (3.4 and 3.1%, resp.) as compared with diabetic controlmice.
The acute and subacute antihyperglycemic activity of thePg extract, F1, F2, and GA were shown to be more potent andprolonged than those of GB.
3.6. Management of Diabetic Neuropathy. Deterioration ofperipheral nerve conduction is a milestone indicator fordiabetic patients having peripheral neuropathy [32–34]. So,we examined the effect ofPg extract, F1, F2, andGA treatmenton sensory function by measuring the thermal latency withtail flick and hot plate tests on the 8th week after alloxaninjection.
Treatment of the alloxan-induced diabetic mice with Pgextract markedly improved the thermal latency comparedwith TRA 10mg/kg positive control (Figure 2(a)). Diabetic
mice exhibited transient hyperalgesic response in thermaltests. On the 8th week after alloxan injection, treatment withPg extract showed amarked improvement in hot plate latencycompared to vehicle treated group by 33.3, 73.5, and 85.1% indoses of 25, 50, and 100mg/kg, respectively (Figure 2(a)).
Nevertheless, treatment with all doses of Pg extractdemonstrated a marked improvement in tail flick latencyby ca. one-, two-, and threefold fordoses of 25, 50, and100mg/kg, respectively, compared to vehicle treated group(Figure 2(b)).
On the 8th week, treatment with the lowest dose of F1 didnot significantly improve hot plate latency, while higher doses(equivalent to 50 and 100mg Pg extract/kg) of F1 markedlyimproved hot plate latency by 15.7 and 84.3%, respectively,compared to vehicle treated group (Figure 3(a)). Nonetheless,treatment with all doses of F1 the tail flick latency havemarkedly improved by ca. 1.5-, 1.7-, and 3-fold in F1 dosesequivalent to 25, 50, and 100mg Pg extract/kg, respectively(Figure 3(b)).
Moreover, treatment with the lowest dose of F2 did notsignificantly improve hot plate or tail flick latencies, whilehigher doses (equivalent to 50 and 100mg Pg extract/kg) ofF2 markedly improved hot plate latency by 45.5 and 60.8%,respectively, and tail flick latency by ca. 0.3- and 0.9-foldcompared to vehicle treated group (Figures 4(a) and 4(b)).

Evidence-Based Complementary and Alternative Medicine 9
4
5
6
7
8
9
10
11
Hot
pla
te la
tenc
y (s
)
0 2 4 6 8
Weeks
DIA + VEHPlacebo F2
NORM
DIA + TRA 10mg/kg
∗∗
∗
∗∗∗∗
∗
∗
∗ ∗ ∗ ∗
∗ ∗∗
DIA + Pg F2 225mg/kgDIA + Pg F2 112.5mg/kg
DIA + Pg F2 56.25mg/kg
(a)
0 2 4 6 8
Weeks
1
2
3
4
5
6
7
8
9
10
11
Tail
with
draw
al la
tenc
y (s
)
DIA + TRA 10mg/kg
NORMPlacebo F2DIA + VEH
∗∗∗∗
∗
∗ ∗∗ ∗
∗
∗
∗
∗
DIA + F2 Pg 225mg/kgDIA + F2 Pg 112.5mg/kg
DIA + F2 Pg 56.25mg/kg
(b)
Figure 4: Effect of F2 and TRA 10mg/kg, as positive control, on the hot plate and tail withdrawal latencies in alloxan-induced diabeticmice. (a) Hot plate latency: NORM: normal control mice (crossed-triangles, straight line); DIA + VEH: diabetic animals treated with vehicleas control (closed-squares, straight-line); placebo F2: diabetic animals treated with placebo F2 200mg/kg (crossed-squares, dashed-line);positive control TRA 10mg/kg: alloxan treatedmicewith TRA 10mg/kg (solid-stars, dotted-line); DIA+F2 50mg/kg: diabetic animals treatedwith F2 50mg/kg (solid-circles, straight-line); DIA + F2 100mg/kg: diabetic animals treated with F2 100mg/kg (up-triangles, dashed-line).DIA + Pg 200mg/kg: diabetic animals treated with F2 200mg/kg (right-triangles, dashed-dotted-line). (b) Tail withdrawal latency: NORM:normal control mice (crossed-triangles, straight line); DIA + VEH: diabetic animals treated with vehicle as control (closed-squares, straight-line); placebo F2: diabetic animals treated with placebo F2 200mg/kg (crossed-squares, dashed-line); positive control TRA 10mg/kg: alloxantreated mice with TRA 10mg/kg (solid-stars, dotted-line). DIA + F2 50mg/kg: diabetic animals treated with F2 50mg/kg (solid-circles,straight-line); DIA + F2 100mg/kg: diabetic animals treated with F2 100mg/kg (up-triangles, dashed-line). DIA + F2 200mg/kg: diabeticanimals treated with F2 200mg/kg (right-triangles, dashed-dotted-line). Data are expressed in mean ± SEM. “∗” means 𝑃 < 0.05 comparedwith vehicle. “∗∗” means 𝑃 < 0.01 compared with vehicle.
Both Placebos F1 and F2 did not significantly improveneither hot plate nor tail flick latencies (Figures 3 and 4).
In addition, treatment with GA (3, 6, and 12mg/kg)showed a marked improvement in hot plate latency by 70.6,78.6, and 86.3% and tail flick latency by ca. 1.5-, 2-, and 2.4-fold, respectively, compared to vehicle treated group (Figures5(a) and 5(b)).
4. Discussion
Extended exposure to hyperglycemia promotes the devel-opment of microvascular and macrovascular complicationsassociated with DM [35]. The high oxidative stress in dia-betics considerably contributes to the complications of thisdisease [36] and excessive production of free radicals is a dis-covered phenomenon associated with diabetic complications[37]. Management of DM and diabetic complications withminimal side effect is still a major challenge to the medicalsystem [35].
This directed scientists to broader exploration of potentnatural antidiabetics with fewer side effects. In this study wechose Pg extract based on its folkloric use in treatment of DMin Lebanon. The current research was focused on assessingits possible antidiabetic and antinociceptive activities of Pg
extract and its spray dried biodegradable polymeric disper-sions, along with its most effective compound, GA.
There are a number of scientific reports proposing theantidiabetic potential of Pg extracts [5, 7, 8], whereas theactive compound responsible for this action was assumedto be ellagic acid [8]. In the present work, bioguided frac-tionation utilizing column chromatography, TLC and RP-HPLC, indicated that gallic acid (GA) is the most effectivecompound.
The hypoglycemic action of the extract was observed tobe dose dependent in hyperglycemic mice, with significantdecrease of blood glucose level at the highest dose levels of100mg extract/kg.
It has been found that the highest dose levels of Pg extract(100mg/kg), F1, F2, and GA (6mg/kg) are the most effectivedoses in the acute and subacute groups. These doses havemore significant effect on blood glucose level compared tothat of the synthetic drug, GB. An initial increase in bloodglucose levels after 0.5 and sometimes 2 hrs after treatmentwith Pg extract andGAwas observed during testing the acuteantidiabetic effect.This temporary initial hyperglycemia maybe due to preglucose loading, while, at the same time, thetest compounds did not start to give their effect directly afteradministration.

10 Evidence-Based Complementary and Alternative Medicine
4
5
6
7
8
9
10
11H
ot p
late
late
ncy
(s)
0 2 4 6 8
Weeks
DIA + GA 12mg/kgDIA + GA 6mg/kg
DIA + GA 3mg/kg
DIA + TRA 10mg/kg
NORM
DIA + VEH
(a)
0 2 4 6 8
Weeks
DIA + GA 12mg/kgDIA + GA 6mg/kg
DIA + GA 3mg/kg
DIA + TRA 10mg/kg
NORM
DIA + VEH
1
2
3
4
5
6
7
8
9
10
11
Tail
with
draw
al la
tenc
y (s
)
∗∗∗∗
∗
∗
∗
∗
∗
∗
∗
∗
∗∗
∗
∗
(b)
Figure 5: Effect of gallic acid (GA) and tramadol (TRA) 10mg/kg, as positive control, on the hot plate and tail withdrawal latencies in alloxan-induced diabetic mice. (a) Hot plate latency: NORM: normal control mice (crossed-triangles, straight line); DIA + VEH: diabetic animalstreated with vehicle as control (closed-squares, straight-line); positive control TRA 10mg/kg: alloxan treated mice with TRA 10mg/kg (solid-stars, dotted-line); DIA + GA 3mg/kg: diabetic animals treated with GA 3mg/kg (solid-circles, straight-line); DIA + GA 6mg/kg: diabeticanimals treated with GA 6mg/kg (up-triangles, dashed-line). DIA + Pg 12mg/kg: diabetic animals treated with GA 12mg/kg (right-triangles,dashed-dotted-line). (b) Tail withdrawal latency: NORM: normal control mice (crossed-triangles, straight line); DIA +VEH: diabetic animalstreated with vehicle as control (closed-squares, straight-line); positive control TRA 10mg/kg: alloxan treated mice with TRA 10mg/kg (solid-stars, dotted-line); DIA + GA 3mg/kg: diabetic animals treated with GA 3mg/kg (solid-circles, straight-line); DIA + GA 6mg/kg: diabeticanimals treated withGA 6mg/kg (up-triangles, dashed-line); DIA +GA 12mg/kg: diabetic animals treated with GA 12mg/kg (right-triangles,dashed-dotted-line). Data are expressed in mean ± SEM. “∗” means 𝑃 < 0.05 compared with vehicle. “∗∗” means 𝑃 < 0.01 compared withvehicle.
In the acute antidiabetic effect, F1 had shown a relativelyhigher reduction in glucose level compared with F2. Thiscould be attributed to the micellar arrangement of casein thatpromotes solubilization within the release medium [15], thusimproving the release. The same release pattern was seen inthe in vitro release experiment with F1 showing faster releasethan F2.
In the subacute antidiabetic effect, due to F2 relativelyslower release seen in its in vitro release pattern, F2 showeda relatively higher subacute effect compared to F1, an effectthat could be beneficial for designing a long acting form ofthe extract for controlling DM.
Currently, much attention has been given on the roleof oxidative stress. It has been suggested that oxidativestress may comprise the key and common events in thepathogenesis of different diabetic complications [38].
Pg extract, F1, F2, andGA showed a significant increase inbody weight, as an evidence of alleviating of hyperglycemia,as demonstrated before with pharmacotherapies used inmanagement of DM [3, 39].
It was suggested that the mechanism of action of GAappears to be through the regeneration of the damagedLangerhans 𝛽-cells and the potentiation of insulin releasefrom the existing ones [40].
In our study, the activity of CAT decreased in diabeticmice as reported earlier [38, 41] which could be due to
inactivation caused by alloxan-generated reactive oxygenspecies (ROS). Long-term treatment of DM with all doses,especially with the highest dose of the Pg extract, F1, F2,and GA, could have reversed the activities of this enzymaticantioxidant, which might be due to lessened oxidative stressas evidenced by the elevation in CAT activity.
Pg extract has long been known as having antioxidantmolecules of gallic and ellagic acids [42, 43]. The mosteffective active fraction of our extract did not contain ellagicacid; on the other hand, it has shown a comparatively highpercentage ofGA.The effect ofGA in the same concentration,relative to that present in the Pg extract, is comparativelyshowing equipotent antihyperglycemic and antioxidant activ-ity to Pg extract, which may indicate that GA is the mosteffective bioactive component in Pg extract.
Administration of Pg extract, F1, F2, and GA also allevi-ated hyperalgesia in pain conditions compared to that of thepositive control, tramadol (TRA).
These findings supply health care providers with apromising medication intended for symptomatic manage-ment of diabetic neuropathy, a safe antidiabetic agent, and asafe treatment of micro- and macrovascular complications ofDM. Slow release dispersions (F2) may be more beneficial inlong-term management (subacute antidiabetic effect) whilerapid ones (F1) may be better for acute management.

Evidence-Based Complementary and Alternative Medicine 11
In conclusion, the present study indicated that Pg extractas well as its biodegradable polymeric dispersions with casein(F1) and chitosan (F2) exerted remarkable hypoglycemicactivity and improved peripheral nerve function, whichmight be due to GA, that prevents oxidative stress in diabeticanimals beside its insulin-secretagogue action.Therefore, theobserved in vivo antioxidant potential of the Pg extract mightpossibly be added to the mechanism of action responsible forits antinociceptive effect.
Abbreviations
DM: Diabetes mellitusDN: Diabetic neuropathyGA: Gallic acidGB: GlibenclamideIP: IntraperitonealFCR: Folin–Ciocalteu reagentRP: Reversed phaseDMSO: Dimethyl sulfoxideLD50: Lethality towards 50% of a populationca.: ApproximatelyP. granatum (Pg): Punica granatumROS: Reactive oxygen speciesCAT: Catalase.
Conflict of Interests
The authors declare that there is no conflict of interests.
Acknowledgments
The authors would like to thank Dr. A. Yacout for partiallyfunding this research. Thanks are also extended to JuniorResearch Team, Department of Pharmaceutical Sciences,Faculty of Pharmacy, BAU, for helping in methodologypreparation.
References
[1] H. King, R. E. Aubert, and W. H. Herman, “Global burdenof diabetes, 1995–2025: prevalence, numerical estimates, andprojections,” Diabetes Care, vol. 21, no. 9, pp. 1414–1431, 1998.
[2] R. Stopford, K. Winkley, and K. Ismail, “Social support andglycemic control in type 2 diabetes: a systematic review ofobservational studies,” Patient Education and Counseling, vol.93, no. 3, pp. 549–558, 2013.
[3] K. Raafat, R. Boukhary, M. Aboul-Ela, and A. El-Lakany,“Endogenous Lebanese plants treating diabetes and relatedcomplications,” Natural Products Chemistry and Research, vol.1, no. 3, pp. 112–120.
[4] T. Bakirel, U. Bakirel, O. U. Keles, S. G. Ulgen, and H. Yardibi,“In vivo assessment of antidiabetic and antioxidant activities ofrosemary (Rosmarinus officinalis) in alloxan-diabetic rabbits,”Journal of Ethnopharmacology, vol. 116, no. 1, pp. 64–73, 2008.
[5] M. S. Baliga, A. R. Shivashankara, C. B. Shetty, K. R. Thi-lakchand, N. Periera, and P. L. Palatty, “Antidiabetic effects ofPunica granatum L, (Pomegranate): a review,” in Bioactive Foodas Dietary Interventions for Diabetes, R. R. Watson and V. R.Preed, Eds., pp. 355–369, Academic Press, 2013.
[6] T. H. W. Huang, G. Peng, B. P. Kota et al., “Anti-diabetic actionof Punica granatum flower extract: activation of PPAR-𝛾 andidentification of an active component,” Toxicology and AppliedPharmacology, vol. 207, no. 2, pp. 160–169, 2005.
[7] B. Fuhrman, N. Volkova, and M. Aviram, “Pomegranate juicepolyphenols increase recombinant paraoxonase-1 binding tohigh-density lipoprotein: studies in vitro and in diabeticpatients,” Nutrition, vol. 26, no. 4, pp. 359–366, 2010.
[8] S. Banihani, S. Swedan, and Z. Alguraan, “Pomegranate andtype 2 diabetes,” Nutrition Research, vol. 33, no. 5, pp. 341–348,2013.
[9] S. Tesfaye and D. Selvarajah, “Advances in the epidemiology,pathogenesis and management of diabetic peripheral neu-ropathy,” Diabetes/Metabolism Research and Reviews, vol. 28,supplement 1, pp. 8–14, 2012.
[10] C. Quattrini and S. Tesfaye, “Understanding the impact ofpainful diabetic neuropathy,”Diabetes/MetabolismResearch andReviews, vol. 19, supplement 1, pp. S2–S8, 2003.
[11] S. Tesfaye, “Advances in the management of diabetic peripheralneuropathy,” Current Opinion in Supportive and Palliative Care,vol. 3, no. 2, pp. 136–143, 2009.
[12] K. Raafat, M. Aboul-Ela, and A. El-Lakany, “Alloxan-induceddiabetic thermal hyperalgesia, prophylaxis and phytotherapeu-tic effects of Rheum ribes L. in mouse model,” Archives ofPharmacal Research. In press.
[13] A. C. Maritim, R. A. Sanders, and J. B. Watkins III, “Diabetes,oxidative stress, and antioxidants: a review,” Journal of Biochem-ical and Molecular Toxicology, vol. 17, no. 1, pp. 24–38, 2003.
[14] R. Rahimi, S. Nikfar, B. Larijani, andM.Abdollahi, “A review onthe role of antioxidants in the management of diabetes and itscomplications,” Biomedicine and Pharmacotherapy, vol. 59, no.7, pp. 365–373, 2005.
[15] A. O. Elzoghby, W. S. Abo El-Fotoh, and N. A. Elgindy,“Casein-based formulations as promising controlled releasedrug delivery systems,” Journal of Controlled Release, vol. 153,no. 3, pp. 206–216, 2011.
[16] K. M. Picker-Freyer and D. Brink, “Evaluation of powder andtableting properties of chitosan,”AAPS PharmSciTech, vol. 7, no.3, article 75, 2006.
[17] M. N. V. R. Kumar, R. A. A. Muzzarelli, C. Muzzarelli, H.Sashiwa, and A. J. Domb, “Chitosan chemistry and pharmaceu-tical perspectives,” Chemical Reviews, vol. 104, no. 12, pp. 6017–6084, 2004.
[18] N. Elgindy, K. Elkhodairy, A. Molokhia, and A. Elzoghby,“Lyophilization monophase solution technique for improve-ment of the physicochemical properties of an anticancer drug,flutamide,” European Journal of Pharmaceutics and Biopharma-ceutics, vol. 74, no. 2, pp. 397–405, 2010.
[19] W. Samy, N. Elgindy, and H. M. El-Gowelli, “Biopolymericnifedipine powder for acceleration of wound healing,” Interna-tional Journal of Pharmaceutics, vol. 422, no. 1-2, pp. 323–331,2012.
[20] K. Raafat, “Exploration of the protective effects of some nat-ural compounds against neurodegeneration exploiting glycinereceptors in vivo model,” Natural Products Chemistry andResearch, vol. 1, no. 3, pp. 1–6, 2013.
[21] K. Kogure, I. Yamauchi, A. Tokumura et al., “Novel antioxidantsisolated from plants of the genera Ferula, Inula, Prangos andRheum collected in Uzbekistan,” Phytomedicine, vol. 11, no. 7-8,pp. 645–651, 2004.

12 Evidence-Based Complementary and Alternative Medicine
[22] A. Mavi, Z. Terzi, U. Ozgen, A. Yildirim, and M. Coskun,“Antioxidant properties of some medicinal plants: Prangosferulacea (Apiaceae), Sedum sempervivoides (Crassulaceae),Malva neglecta (Malvaceae), Cruciata taurica (Rubiaceae), Rosapimpinellifolia (Rosaceae), Galium verum subsp. verum (Rubi-aceae), Urtica dioica (Urticaceae),” Biological and Pharmaceuti-cal Bulletin, vol. 27, no. 5, pp. 702–705, 2004.
[23] V. L. Singleton and J. A. Rossi, “Colorimetry of total phenolicswith phosphomolybdic-phosphotungstic acid reagents,”Ameri-can Journal of Enology and Viticulture, vol. 16, no. 3, pp. 144–158,1965.
[24] J. Ahmed, A. Guvenc, N. Kucukboyaci, A. Baldemir, and M.Coskun, “Total phenolic contents and antioxidant activitiesof Prangos Lindl. (Umbelliferae) species growing in Konyaprovince (Turkey),” Turkish Journal of Biology, vol. 35, no. 3, pp.353–360, 2011.
[25] Y. Baravalia, M. Kaneria, Y. Vaghaslya, J. Parekh, and S. Chanda,“Antioxidant and antibacterial activity of Diospyros ebenumroxb. Leaf extracts,” Turkish Journal of Biology, vol. 33, no. 2, pp.159–164, 2009.
[26] K. M. Raafat, H. Jassar, M. Aboul-Ela, and A. El-Lakany, “Pro-tective effects of Origanum majorana L. against neurodegen-eration: fingerprinting, isolation and in vivo glycine receptorsbehavioral model,” Inernational Journal of Phytomedicine, vol.5, no. 1, pp. 46–57.
[27] K. Slinkard andV. L. Singleton, “Total phenols analysis: automa-tion and comparison with manual methods,” American Journalof Enology and Viticulture, vol. 28, pp. 49–55, 1977.
[28] K. Raafat, U. Breitinger, L.Mahran, N. Ayoub, andH. Breitinger,“Synergistic inhibition of glycinergic transmission in vitro andin vivo by flavonoids and strychnine,”Toxicological Sciences, vol.118, no. 1, pp. 171–182, 2010.
[29] K. A. Sullivan, J. M. Hayes, T. D. Wiggin et al., “Mouse modelsof diabetic neuropathy,” Neurobiology of Disease, vol. 28, no. 3,pp. 276–285, 2007.
[30] A. Ulugol, C. Oltulu, O. Gunduz et al., “5-HT7 receptor acti-vation attenuates thermal hyperalgesia in streptozocin-induceddiabetic mice,” Pharmacology Biochemistry and Behavior, vol.102, no. 2, pp. 344–348, 2012.
[31] W. G. Yasmineh, T. P. Kaur, B. R. Blazar, and A. Theologides,“Serum catalase as marker of graft-vs-host disease in allogeneicbone marrow transplant recipients: pilot study,” Clinical Chem-istry, vol. 41, no. 11, pp. 1574–1580, 1995.
[32] G. Said, “Diabetic neuropathy—a review,” Nature Clinical Prac-tice Neurology, vol. 3, no. 6, pp. 331–340, 2007.
[33] S. Tesfaye, A. J. Boulton, P. J. Dyck et al., “Diabetic neuropathies:update on definitions, diagnostic criteria, estimation of severity,and treatments,” Diabetes Care, vol. 33, no. 10, pp. 2285–2293,2010.
[34] J. Widenfalk, W. Wu, J. Hao, J. K. E. Person, Z. Wiesenfeldt-Hallin, and M. Risling, “Treatment of transected peripheralnerves with artemin improved motor neuron regeneration,but did not reduce nerve injury-induced pain behaviour,”Scandinavian Journal of Plastic and Reconstructive Surgery andHand Surgery, vol. 43, no. 5, pp. 245–250, 2009.
[35] R. Singh, N. Kaur, L. Kishore, and G. K. Gupta, “Manage-ment of diabetic complications: a chemical constituents basedapproach,” Journal of Ethnopharmacology, vol. 150, no. 1, pp. 51–70, 2013.
[36] J. W. Baynes and S. R. Thorpe, “Role of oxidative stress indiabetic complications: a new perspective on an old paradigm,”Diabetes, vol. 48, no. 1, pp. 1–9, 1999.
[37] I. S. Young, S. Tate, J. H. Lightbody, D. McMaster, and E.R. Trimble, “The effects of desferrioxamine and ascorbate onoxidative stress in the streptozotocin diabetic rat,” Free RadicalBiology and Medicine, vol. 18, no. 5, pp. 833–840, 1995.
[38] A. Sepici-Dincel, S. Acikgoz, C. Cevik, M. Sengelen, and E.Yesilada, “Effects of in vivo antioxidant enzyme activities ofmyrtle oil in normoglycaemic and alloxan diabetic rabbits,”Journal of Ethnopharmacology, vol. 110, no. 3, pp. 498–503, 2007.
[39] D. Russell-Jones and R. Khan, “Insulin-associated weight gainin diabetes -causes, effects and coping strategies,” Diabetes,Obesity and Metabolism, vol. 9, no. 6, pp. 799–812, 2007.
[40] R. C. R. Latha and P. Daisy, “Insulin-secretagogue, antihyper-lipidemic and other protective effects of gallic acid isolated fromTerminalia bellerica Roxb. in streptozotocin-induced diabeticrats,” Chemico-Biological Interactions, vol. 189, no. 1-2, pp. 112–118, 2011.
[41] H. F. Al-Azzawie and M. S. Alhamdani, “Hypoglycemic andantioxidant effect of oleuropein in alloxan-diabetic rabbits,” LifeSciences, vol. 78, no. 12, pp. 1371–1377, 2006.
[42] F. Tosun and C. A. Kizilay, “Anthraquinones and flavonoidsfrom Rheum ribes,” Ankara Universitesi Eczacilik FakultesiDergisi, vol. 32, no. 1, pp. 31–35, 2003.
[43] M. Rosenblat, T. Hayek, and M. Aviram, “Anti-oxidative effectsof pomegranate juice (PJ) consumption by diabetic patients onserum and on macrophages,” Atherosclerosis, vol. 187, no. 2, pp.363–371, 2006.

Submit your manuscripts athttp://www.hindawi.com
Stem CellsInternational
Hindawi Publishing Corporationhttp://www.hindawi.com Volume 2014
Hindawi Publishing Corporationhttp://www.hindawi.com Volume 2014
MEDIATORSINFLAMMATION
of
Hindawi Publishing Corporationhttp://www.hindawi.com Volume 2014
Behavioural Neurology
EndocrinologyInternational Journal of
Hindawi Publishing Corporationhttp://www.hindawi.com Volume 2014
Hindawi Publishing Corporationhttp://www.hindawi.com Volume 2014
Disease Markers
Hindawi Publishing Corporationhttp://www.hindawi.com Volume 2014
BioMed Research International
OncologyJournal of
Hindawi Publishing Corporationhttp://www.hindawi.com Volume 2014
Hindawi Publishing Corporationhttp://www.hindawi.com Volume 2014
Oxidative Medicine and Cellular Longevity
Hindawi Publishing Corporationhttp://www.hindawi.com Volume 2014
PPAR Research
The Scientific World JournalHindawi Publishing Corporation http://www.hindawi.com Volume 2014
Immunology ResearchHindawi Publishing Corporationhttp://www.hindawi.com Volume 2014
Journal of
ObesityJournal of
Hindawi Publishing Corporationhttp://www.hindawi.com Volume 2014
Hindawi Publishing Corporationhttp://www.hindawi.com Volume 2014
Computational and Mathematical Methods in Medicine
OphthalmologyJournal of
Hindawi Publishing Corporationhttp://www.hindawi.com Volume 2014
Diabetes ResearchJournal of
Hindawi Publishing Corporationhttp://www.hindawi.com Volume 2014
Hindawi Publishing Corporationhttp://www.hindawi.com Volume 2014
Research and TreatmentAIDS
Hindawi Publishing Corporationhttp://www.hindawi.com Volume 2014
Gastroenterology Research and Practice
Hindawi Publishing Corporationhttp://www.hindawi.com Volume 2014
Parkinson’s Disease
Evidence-Based Complementary and Alternative Medicine
Volume 2014Hindawi Publishing Corporationhttp://www.hindawi.com