Embed Size (px)
Citation preview
Asian Pacific Journal of Cancer Prevention, Vol 15, 2014 2565
DOI:http://dx.doi.org/10.7314/APJCP.2014.15.6.2565Aflatoxin B1 promotes Cell Growth and Invasion in HCC HepG2 Cells through Actions on H19 and E2F1
Asian Pac J Cancer Prev, 15 (6), 2565-2570
Introduction
Aflatoxins are secondary metabolites produced by the fungi, Aspergillus avus and Aspergillus parasiticus and usually divided four major types, aflatoxin B1, B2, G1 and G2. Among these, AFB1 produced by Aspergillus avus is the most potent of these toxins, and has the highest hepatocarcinogenic potential (McLean et al., 1995; IARC, 2002). The binding of AFB1 to DNA is responsible for the inhibition of RNA synthesis, which is involved in gene expression (Oyagbemi et al., 2010). It has been estimated that AFB1 can affect RASSF1A hypermethylation in hepatocellular carcinoma (Feng et al., 2012). Moreover, it has been demonstrated that AFB1 can affect the expression of a kind of genes on mRNA level, including UDP-glucuronosyltransferase (UGT) (Hanioka et al., 2012), nuclear receptors PXR, CAR, AhR and cytochromes P450 (Ayed-Boussema et al., 2012). In recent years, some author performed further study on the role of AFB1 in carcinogenesis development based on the previous study. Yang C et al found that AFB1 treatment could increase the expression of IDH3α, and the activated PI3K/Akt pathway by IDH3α eventually neutralized the apoptosis induced by AFB1 (Yang et al., 2013). Moreover, AFB1could negatively regulate Wnt/β-catenin signaling pathway through activating miR-33a (Fang et al., 2013).
1Department of Hepatobiliary Surgery, 3Department of Medical Intensive Care Unit, the First Affiliated Hospital of Sun Yat-Sen University, Guangzhou, 2Department of Hepatobiliary Surgery, the Affiliated Hospital of Guilin Medical College, Guilin, China *For correspondence: [email protected]
Abstract
H19 is an imprinted oncofetal gene, and loss of imprinting at the H19 locus results in over-expression of H19 in cancers. Aflatoxin B1(AFB1) is regarded as one of the most dangerous carcinogens. Exposure to AFB1 would most easily increase susceptibility to diseases such as hepatocellular carcinoma(HCC) but any possible relationship between AFB1 and H19 is not clear. In present study, we found that AFB1 could up-regulate the expression of H19 and promote cell growth and invasion by hepatocellular carcinoma HepG2 cells. Knocking down H19 RNA co ld reverse the effects of AFB1 on cell growth and invasion. In addition, AFB1 induced the expression of E2F1 and its knock-down could down-regulate H19 expression and suppress cell growth and invasion in hepatocellular carcinoma HepG2 cells. Furthermore, E2F1 over-expression could up-regulate H19 expression and promote cell growth and invasion, with binding to the H19 promoter being demonstrated by chromatin immunoprecipitation assays (ChIP). In summary, our results suggested that aflatoxin B1could promote cell growth and invasion in hepatocellular carcinoma HepG2 cells through actions on H19 and E2F1. Keywords: H19 - AFB1- cell growth and invasion - hepatocellular carcinoma - E2F1
RESEARCH ARTICLE
Aflatoxin B1 Promotes Cell Growth and Invasion in Hepatocellular Carcinoma HepG2 Cells through H19 and E2F1
Jun Lv1, Ya-Qun Yu2, Shu-Qun Li2, Liang Luo3, Qian Wang1*
This is the powerful evidence that AFB1 could directly regulate the expression of non-coding RNAs. However, the relationship of AFB1 and Long non-coding RNAs (lncRNAs) is not certain. lncRNAs are normally defined as transcribed RNA molecules greater than 200 nt in length and lacking an open reading frame of significant length. In recent years, the functions of lncRNAs in cancer were broadly investigated. In general, lncRNAs could play an important role in a wide range of biological processes, including proliferation, cell cycle, apoptosis, differentiation and invasion (Calin et al., 2007; Braconi et al., 2011; Khaitan et al., 2011). The list of lncRNA having functions in hepatocellular are H19, HULC, TUC338, MALAT1 and HOTAIR (Gabory et al., 2006; Luo et al., 2006; Panzitt et al., 2007; Braconi et al., 2011; Yang et al., 2011). Among these, H19 is an imprinted oncofetal gene that locates on chromosome 11p15.5 and lies within 200 kbp downstream of the IGF-2 gene (Zemel et al., 1992). These two genes are imprinted in opposite directions, so that IGF-2 and H19 alleles are selectively expressed (Zhang et al., 1992; Giannoukakis et al., 1993). The previous study has shown that over-expression of an ectopic H19 gene enhances the tumorigenic properties of breast cancer cells (Lottin et al., 2002). In addition, the expression of H19 is positively controlled by E2F1 and suppressed by p53 (Dugimont et al., 1998;Berteaux et
Jun Lv et al
Asian Pacific Journal of Cancer Prevention, Vol 15, 20142566
al., 2005). Although we have known the respective roles of AFB1 and H19, the relationship between them is not known so far. In present study, we focused our attention to investigate whether AFB1 could affect cell growth and invasion in hepatocellular carcinoma HepG2 cells through regulating H19 expression. The results showed that AFB1 could promote the expression of H19 and cell growth and invasion in hepatocellular carcinoma HepG2 cells. In addition, AFB1 induced the expression of E2F1. Moreover, E2F1 could bind on the promoter of H19. In summary, our results suggested that aflatoxin B1could promote cell growth and invasion in hepatocellular carcinoma HepG2 cells through H19 and E2F1.
Materials and Methods
Cell culture The hepatocellular carcinoma HepG2 cell line used in this study was obtained from the American Type Culture Collection (Manassas, VA, USA). The cells were maintained in RPMI 1640 medium supplemented with 10% fetal calf serum, 25 mM HEPES (pH 7.4), penicillin (180 units/ml), streptomycin (100 mg/ml) and amphotericin B (0.2 mg/ml) in a 37°C humidified incubator in the presence of 5% CO2. The cells were dislodged with 0.05% trypsin (Sigma) when they reached 70-80% confluence.
AFB1 Treatment 1 mg of AFB1 (Sigma-aldrich, Saint Louis, USA) were dissolved into 100 μl of DMSO. Cells were plated into 24- or 6-well plates, and then exposed to AFB1 at different concentrations (5, 10, 20, 40 and 80 μg/ml). Since DMSO was required for the solublization of AFB1, the same concentrations of DMSO were used in the controls for this assay.
H19 siRNA sequence and transfection The siRNA sequence of H19 is as follows: 5’-GCAGGACAUGACAUGGUCCdTdT-3’ (Matouk et al., 2007). Transfection of siRNAs was conducted with lipofectamine 2000 (Invitrogen, USA) according to the manufacturer’s instructions.
Real-time PCR Total RNAs were extracted from the cells by using TRIzol Reagent and 2 μg total RNA was reverse-transcribed by using a First Strand cDNA Synthesis Kit (Promega, USA) to synthesize cDNA. The PCR primers sequences of H19 are as follows: 5’-AAAGACACCATCGGAACAGC-3’ and 5’-AGAGTCGTGGAGGCTTTGAA-3’. All reactions were carried out using SYBR Green Mix (Takara), and the PCR conditions for quantitative RT-PCR were as follows: 94 °C for 5 min, 40 cycles of 94°C for 30 s, 55°C for 30 s, and 72°C for 20 s. The fluorescence of each sample was determined after every cycle. The fluorescence of samples was continuously traced during this period. Relative expression levels were calculated as ratios normalized against those of beta-actin. All results are expressed as the means±SD of three independent experiments.
Cell proliferation analysis HepG2 cells were seeded in 12 well plates and then treated with H19 siRNA and AFB1 for 4d, and the cell viability was determined each day. MTT assay was performed. MTT assay was performed according to the procedure provided by the supplier (Promega, USA). The absorbance at 490 nm was recorded using ELISA plate reader.
Matrigel invasion assay The invasion potential was determined by using a transwell chamber system with 8 μm pore polycarbonate filter inserts (24-well plates, 8 mm pore size, Corning). The lower and upper sides of the filter were coated with gelatin and Matrigel, respectively. Cells (5×10⁴) in the serum-free medium containing 0.1% bovine serum albumin were added to each upper chamber of the transwell. RPMI 1640 medium supplemented with 10% fetal bovine serum was placed in the lower chamber, and cells were incubated at 37°C. After 48 h, the noninvasive cells were removed with cotton swabs. Invasive cells at the bottom of the membrane were stained with 0.1% crystal violet and were counted under microscopic observation. The assays were performed in triplicate and were repeated three times.
Western blot analysis HepG2 cells (2×10⁶) were harvested and washed twice with ice-cold PBS , and lysed in 0.5ml of lysis buffer. Equal amounts (40 mg) of proteins were loaded and resolved by sodium dodecylsulfate-polyacrylamide gel electrophoresis (SDS-PAGE) and then transferred onto PVDF membrane (Millipore). The membrane was blocked with 5% non-fat milk in Tris-buffered saline (TBS, pH 7.4) for 1h and then incubated with antibody (E2F1, 1:1000) in 5% non-fat milk in TBS. After the incubation of primary antibody, the membrane was washed with TBS including 5‰ Tween-20 (TBST) and incubated with secondary antibodies conjugated with horseradish peroxidase in 5% non-fat milk in TBS. After washing with TBST, labeling was visualized with ECL reagent and recorded on X-ray films.
E2F1 RNA interference and over-expression The siRNA sequence of E2F1 is as follows: 5’-GGGAGAAGUCACGCUAUGA-3’ (Berteaux et al., 2005). The open reading frame of E2F1 (NM_005225) was cloned and inserted into expression plasmid pcDNA3.1. The transfection of siRNAs and plasmid were conducted with lipofectamine 2000 (Invitrogen, USA) according to the manufacturer’s instructions.
Chromatin immunoprecipitation assays (ChIP) ChIP assays were performed according to the manufacturer’s instructions (Active Motif, Carlsbad, CA, USA). Briefly, HepG2 cells were fixed with 1% formaldehyde, washed with cold phosphate-buffered saline, and lysed in buffer. Nuclei were sonicated to shear DNA, and the lysates were pelleted and precleared. The protein-DNA complexes were incubated with 4 mg E2F1 primary antibody overnight and then incubated with protein A beads followed by elution in 1% SDS/0.1 M NaHCO3 and
Asian Pacific Journal of Cancer Prevention, Vol 15, 2014 2567
DOI:http://dx.doi.org/10.7314/APJCP.2014.15.6.2565Aflatoxin B1 promotes Cell Growth and Invasion in HCC HepG2 Cells through Actions on H19 and E2F1
cross-links were reversed at 65°C. To detect the H19 gene in protein-DNA complexes, a 141-bp fragment located in the promoter was amplified by quantitative PCR analysis using primers: 5’-GTCTGGGAGGGAGAGGTCCT-3’ and 5’-CCACTCTCTCTGCACACGAC-3’.
Statistical analyses Results are presented as means±standard deviation (SD). Differences between means were analyzed using the unpaired Student’s t-test (two-tailed). The probability value p<0.05 was considered statistically significant.
Results
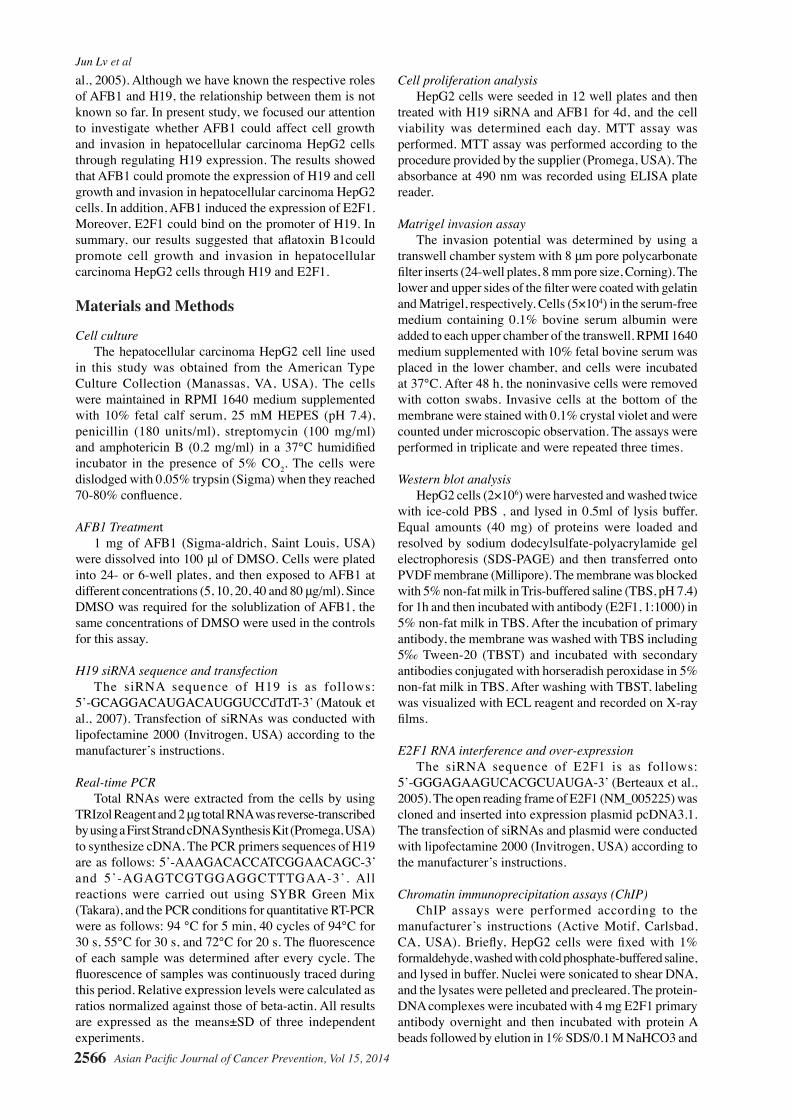
Exposure to AFB1 leads to H19 up-regulation HepG2 cells were treated with AFB1 on a series of concentration and harvested at 48h after treatment. Then the RNA level of H19 was examined by qRT-PCR. The results showed that the treatment of AFB1 could up-regulate the expression of H19 in hepatocellular carcinoma HepG2 cells (Figure 1A). The results showed that H19 expression was up-regulated in response to the addition of increasing concentrations of AFB1 (5-20 μg/ml). The expression level of H19 reached to peak on the concentration of 40 μg/ml AFB1. Surprisingly, the expression level of H19 in 80 μg/ml AFB1 group was decreased compared with 40 μg/ml AFB1 group.
AFB1 influences cell growth and invasion in hepatocellular carcinoma HepG2 cells To detect the effect of AFB1 on the cell growth in hepatocellular carcinoma HepG2 cells, MTT assay was
carried out according to the instruction of manufacturer. The results revealed that AFB1could promote cell growth in hepatocellular carcinoma HepG2 cells. As shown in Figure 2A, cell proliferation rate of hepatocellular carcinoma HepG2 cells treated with 40 μg/ml AFB1 was significantly increased at 24h, 48h, 72h (Figure 1B), in comparison to control group. Then the invasion ability of hepatocellular carcinoma HepG2 cells was detected by using matrigel invasion assay. We found that the number of invading hepatocellular carcinoma HepG2 cells treated with AFB1 was remarkably increased compared with control group (Figure 1C, 1D), which revealed that the AFB1 could enhance cell invasion in hepatocellular carcinoma HepG2 cells.
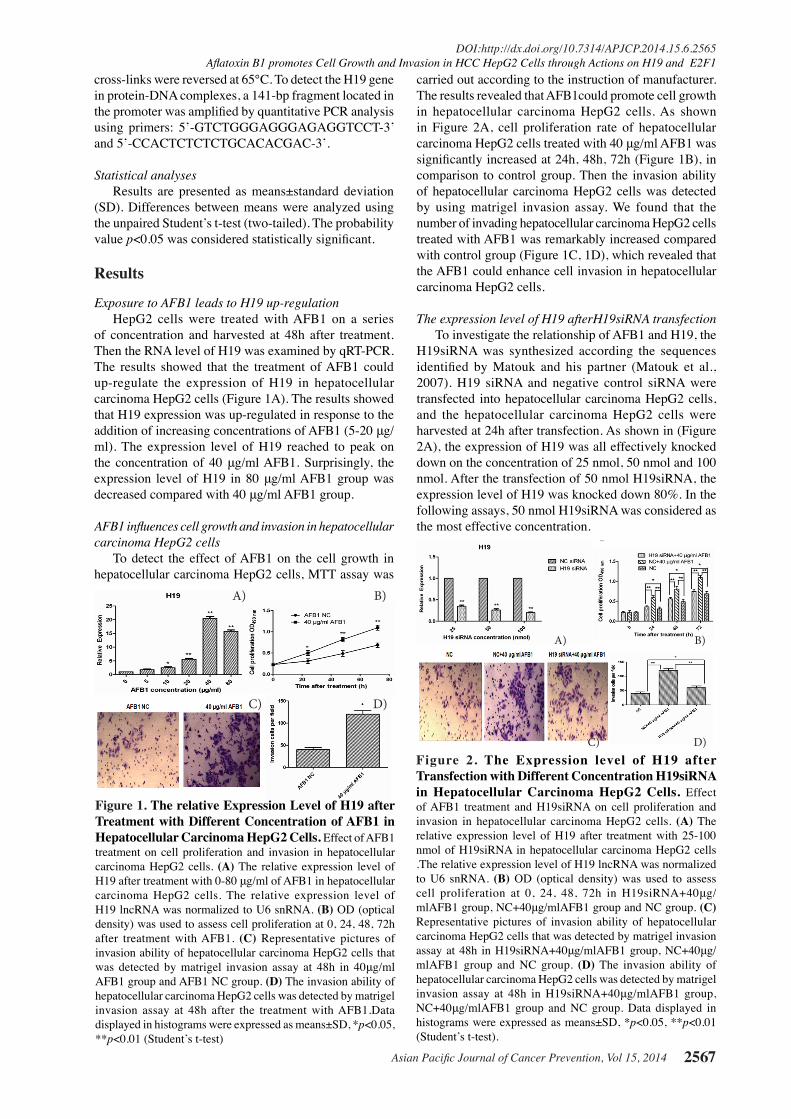
The expression level of H19 afterH19siRNA transfection To investigate the relationship of AFB1 and H19, the H19siRNA was synthesized according the sequences identified by Matouk and his partner (Matouk et al., 2007). H19 siRNA and negative control siRNA were transfected into hepatocellular carcinoma HepG2 cells, and the hepatocellular carcinoma HepG2 cells were harvested at 24h after transfection. As shown in (Figure 2A), the expression of H19 was all effectively knocked down on the concentration of 25 nmol, 50 nmol and 100 nmol. After the transfection of 50 nmol H19siRNA, the expression level of H19 was knocked down 80%. In the following assays, 50 nmol H19siRNA was considered as the most effective concentration.
Figure 1. The relative Expression Level of H19 after Treatment with Different Concentration of AFB1 in Hepatocellular Carcinoma HepG2 Cells. Effect of AFB1 treatment on cell proliferation and invasion in hepatocellular carcinoma HepG2 cells. (A) The relative expression level of H19 after treatment with 0-80 μg/ml of AFB1 in hepatocellular carcinoma HepG2 cells. The relative expression level of H19 lncRNA was normalized to U6 snRNA. (B) OD (optical density) was used to assess cell proliferation at 0, 24, 48, 72h after treatment with AFB1. (C) Representative pictures of invasion ability of hepatocellular carcinoma HepG2 cells that was detected by matrigel invasion assay at 48h in 40μg/ml AFB1 group and AFB1 NC group. (D) The invasion ability of hepatocellular carcinoma HepG2 cells was detected by matrigel invasion assay at 48h after the treatment with AFB1.Data displayed in histograms were expressed as means±SD, *p<0.05, **p<0.01 (Student’s t-test)
A) B)
C) D)
Figure 2. The Expression level of H19 after Transfection with Different Concentration H19siRNA in Hepatocellular Carcinoma HepG2 Cells. Effect of AFB1 treatment and H19siRNA on cell proliferation and invasion in hepatocellular carcinoma HepG2 cells. (A) The relative expression level of H19 after treatment with 25-100 nmol of H19siRNA in hepatocellular carcinoma HepG2 cells .The relative expression level of H19 lncRNA was normalized to U6 snRNA. (B) OD (optical density) was used to assess cell proliferation at 0, 24, 48, 72h in H19siRNA+40μg/mlAFB1 group, NC+40μg/mlAFB1 group and NC group. (C) Representative pictures of invasion ability of hepatocellular carcinoma HepG2 cells that was detected by matrigel invasion assay at 48h in H19siRNA+40μg/mlAFB1 group, NC+40μg/mlAFB1 group and NC group. (D) The invasion ability of hepatocellular carcinoma HepG2 cells was detected by matrigel invasion assay at 48h in H19siRNA+40μg/mlAFB1 group, NC+40μg/mlAFB1 group and NC group. Data displayed in histograms were expressed as means±SD, *p<0.05, **p<0.01 (Student’s t-test).
A) B)
C) D)
Jun Lv et al
Asian Pacific Journal of Cancer Prevention, Vol 15, 20142568
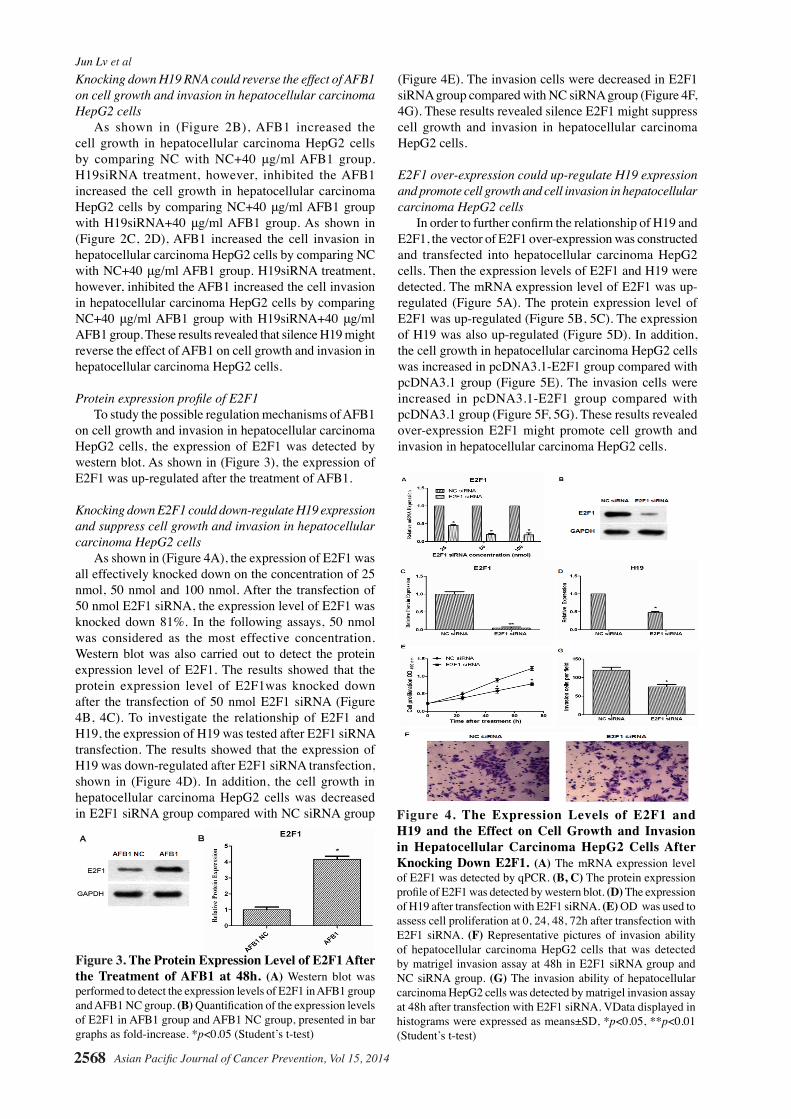
Knocking down H19 RNA could reverse the effect of AFB1 on cell growth and invasion in hepatocellular carcinoma HepG2 cells As shown in (Figure 2B), AFB1 increased the cell growth in hepatocellular carcinoma HepG2 cells by comparing NC with NC+40 μg/ml AFB1 group. H19siRNA treatment, however, inhibited the AFB1 increased the cell growth in hepatocellular carcinoma HepG2 cells by comparing NC+40 μg/ml AFB1 group with H19siRNA+40 μg/ml AFB1 group. As shown in (Figure 2C, 2D), AFB1 increased the cell invasion in hepatocellular carcinoma HepG2 cells by comparing NC with NC+40 μg/ml AFB1 group. H19siRNA treatment, however, inhibited the AFB1 increased the cell invasion in hepatocellular carcinoma HepG2 cells by comparing NC+40 μg/ml AFB1 group with H19siRNA+40 μg/ml AFB1 group. These results revealed that silence H19 might reverse the effect of AFB1 on cell growth and invasion in hepatocellular carcinoma HepG2 cells.
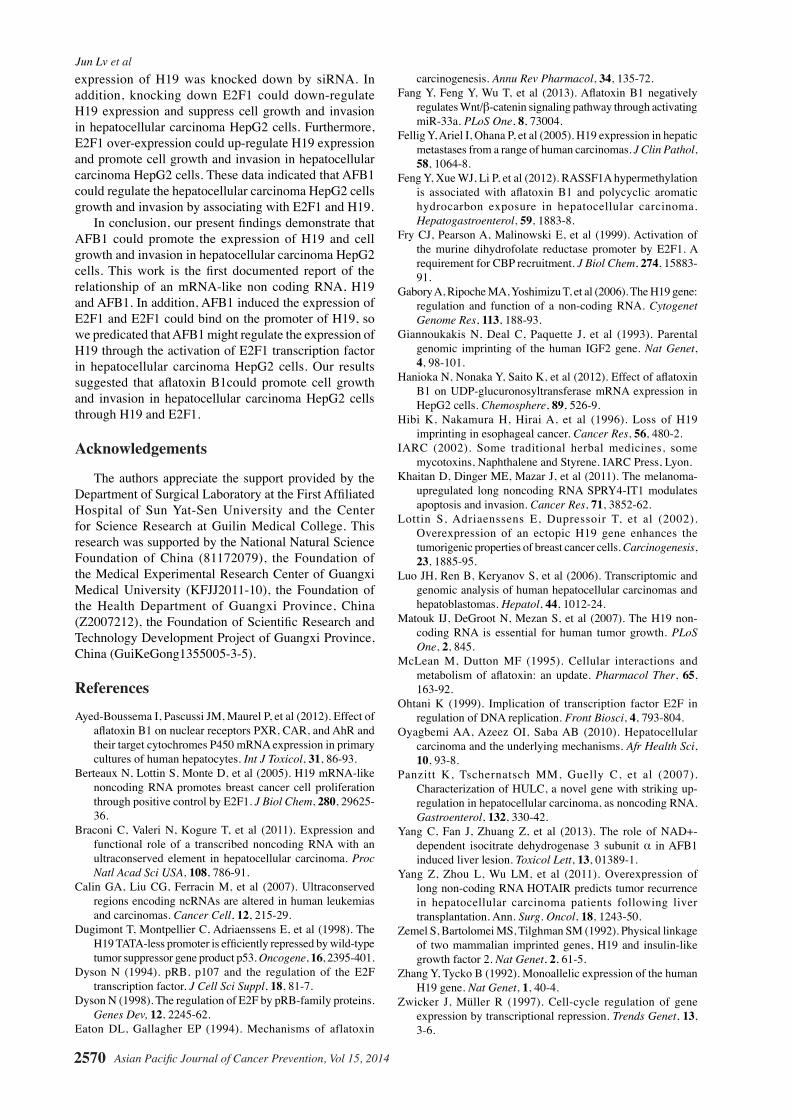
Protein expression profile of E2F1 To study the possible regulation mechanisms of AFB1 on cell growth and invasion in hepatocellular carcinoma HepG2 cells, the expression of E2F1 was detected by western blot. As shown in (Figure 3), the expression of E2F1 was up-regulated after the treatment of AFB1.
Knocking down E2F1 could down-regulate H19 expression and suppress cell growth and invasion in hepatocellular carcinoma HepG2 cells As shown in (Figure 4A), the expression of E2F1 was all effectively knocked down on the concentration of 25 nmol, 50 nmol and 100 nmol. After the transfection of 50 nmol E2F1 siRNA, the expression level of E2F1 was knocked down 81%. In the following assays, 50 nmol was considered as the most effective concentration. Western blot was also carried out to detect the protein expression level of E2F1. The results showed that the protein expression level of E2F1was knocked down after the transfection of 50 nmol E2F1 siRNA (Figure 4B, 4C). To investigate the relationship of E2F1 and H19, the expression of H19 was tested after E2F1 siRNA transfection. The results showed that the expression of H19 was down-regulated after E2F1 siRNA transfection, shown in (Figure 4D). In addition, the cell growth in hepatocellular carcinoma HepG2 cells was decreased in E2F1 siRNA group compared with NC siRNA group
(Figure 4E). The invasion cells were decreased in E2F1 siRNA group compared with NC siRNA group (Figure 4F, 4G). These results revealed silence E2F1 might suppress cell growth and invasion in hepatocellular carcinoma HepG2 cells.
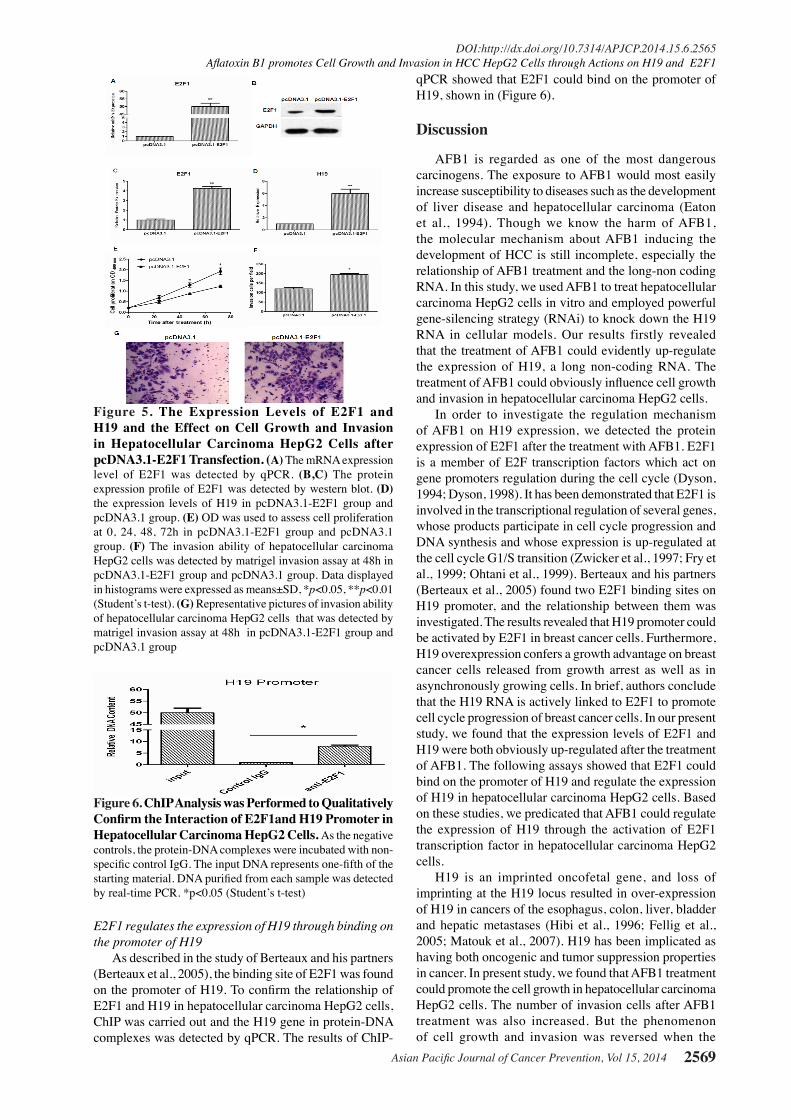
E2F1 over-expression could up-regulate H19 expression and promote cell growth and cell invasion in hepatocellular carcinoma HepG2 cells In order to further confirm the relationship of H19 and E2F1, the vector of E2F1 over-expression was constructed and transfected into hepatocellular carcinoma HepG2 cells. Then the expression levels of E2F1 and H19 were detected. The mRNA expression level of E2F1 was up-regulated (Figure 5A). The protein expression level of E2F1 was up-regulated (Figure 5B, 5C). The expression of H19 was also up-regulated (Figure 5D). In addition, the cell growth in hepatocellular carcinoma HepG2 cells was increased in pcDNA3.1-E2F1 group compared with pcDNA3.1 group (Figure 5E). The invasion cells were increased in pcDNA3.1-E2F1 group compared with pcDNA3.1 group (Figure 5F, 5G). These results revealed over-expression E2F1 might promote cell growth and invasion in hepatocellular carcinoma HepG2 cells.
0
25.0
50.0
75.0
100.0
New
ly d
iagn
osed
with
out
trea
tmen
t
New
ly d
iagn
osed
with
tre
atm
ent
Pers
iste
nce
or r
ecur
renc
e
Rem
issi
on
Non
e
Chem
othe
rapy
Radi
othe
rapy
Conc
urre
nt c
hem
orad
iatio
n
10.3
0
12.8
30.025.0
20.310.16.3
51.7
75.051.1
30.031.354.2
46.856.3
27.625.033.130.031.3
23.738.0
31.3
Figure 3. The Protein Expression Level of E2F1 After the Treatment of AFB1 at 48h. (A) Western blot was performed to detect the expression levels of E2F1 in AFB1 group and AFB1 NC group. (B) Quantification of the expression levels of E2F1 in AFB1 group and AFB1 NC group, presented in bar graphs as fold-increase. *p<0.05 (Student’s t-test)
Figure 4. The Expression Levels of E2F1 and H19 and the Effect on Cell Growth and Invasion in Hepatocellular Carcinoma HepG2 Cells After Knocking Down E2F1. (A) The mRNA expression level of E2F1 was detected by qPCR. (B, C) The protein expression profile of E2F1 was detected by western blot. (D) The expression of H19 after transfection with E2F1 siRNA. (E) OD was used to assess cell proliferation at 0, 24, 48, 72h after transfection with E2F1 siRNA. (F) Representative pictures of invasion ability of hepatocellular carcinoma HepG2 cells that was detected by matrigel invasion assay at 48h in E2F1 siRNA group and NC siRNA group. (G) The invasion ability of hepatocellular carcinoma HepG2 cells was detected by matrigel invasion assay at 48h after transfection with E2F1 siRNA. VData displayed in histograms were expressed as means±SD, *p<0.05, **p<0.01 (Student’s t-test)
Asian Pacific Journal of Cancer Prevention, Vol 15, 2014 2569
DOI:http://dx.doi.org/10.7314/APJCP.2014.15.6.2565Aflatoxin B1 promotes Cell Growth and Invasion in HCC HepG2 Cells through Actions on H19 and E2F1
E2F1 regulates the expression of H19 through binding on the promoter of H19 As described in the study of Berteaux and his partners (Berteaux et al., 2005), the binding site of E2F1 was found on the promoter of H19. To confirm the relationship of E2F1 and H19 in hepatocellular carcinoma HepG2 cells, ChIP was carried out and the H19 gene in protein-DNA complexes was detected by qPCR. The results of ChIP-
qPCR showed that E2F1 could bind on the promoter of H19, shown in (Figure 6).
Discussion
AFB1 is regarded as one of the most dangerous carcinogens. The exposure to AFB1 would most easily increase susceptibility to diseases such as the development of liver disease and hepatocellular carcinoma (Eaton et al., 1994). Though we know the harm of AFB1, the molecular mechanism about AFB1 inducing the development of HCC is still incomplete, especially the relationship of AFB1 treatment and the long-non coding RNA. In this study, we used AFB1 to treat hepatocellular carcinoma HepG2 cells in vitro and employed powerful gene-silencing strategy (RNAi) to knock down the H19 RNA in cellular models. Our results firstly revealed that the treatment of AFB1 could evidently up-regulate the expression of H19, a long non-coding RNA. The treatment of AFB1 could obviously influence cell growth and invasion in hepatocellular carcinoma HepG2 cells.
In order to investigate the regulation mechanism of AFB1 on H19 expression, we detected the protein expression of E2F1 after the treatment with AFB1. E2F1 is a member of E2F transcription factors which act on gene promoters regulation during the cell cycle (Dyson, 1994; Dyson, 1998). It has been demonstrated that E2F1 is involved in the transcriptional regulation of several genes, whose products participate in cell cycle progression and DNA synthesis and whose expression is up-regulated at the cell cycle G1/S transition (Zwicker et al., 1997; Fry et al., 1999; Ohtani et al., 1999). Berteaux and his partners (Berteaux et al., 2005) found two E2F1 binding sites on H19 promoter, and the relationship between them was investigated. The results revealed that H19 promoter could be activated by E2F1 in breast cancer cells. Furthermore, H19 overexpression confers a growth advantage on breast cancer cells released from growth arrest as well as in asynchronously growing cells. In brief, authors conclude that the H19 RNA is actively linked to E2F1 to promote cell cycle progression of breast cancer cells. In our present study, we found that the expression levels of E2F1 and H19 were both obviously up-regulated after the treatment of AFB1. The following assays showed that E2F1 could bind on the promoter of H19 and regulate the expression of H19 in hepatocellular carcinoma HepG2 cells. Based on these studies, we predicated that AFB1 could regulate the expression of H19 through the activation of E2F1 transcription factor in hepatocellular carcinoma HepG2 cells.
H19 is an imprinted oncofetal gene, and loss of imprinting at the H19 locus resulted in over-expression of H19 in cancers of the esophagus, colon, liver, bladder and hepatic metastases (Hibi et al., 1996; Fellig et al., 2005; Matouk et al., 2007). H19 has been implicated as having both oncogenic and tumor suppression properties in cancer. In present study, we found that AFB1 treatment could promote the cell growth in hepatocellular carcinoma HepG2 cells. The number of invasion cells after AFB1 treatment was also increased. But the phenomenon of cell growth and invasion was reversed when the
Figure 5. The Expression Levels of E2F1 and H19 and the Effect on Cell Growth and Invasion in Hepatocellular Carcinoma HepG2 Cells after pcDNA3.1-E2F1 Transfection. (A) The mRNA expression level of E2F1 was detected by qPCR. (B,C) The protein expression profile of E2F1 was detected by western blot. (D) the expression levels of H19 in pcDNA3.1-E2F1 group and pcDNA3.1 group. (E) OD was used to assess cell proliferation at 0, 24, 48, 72h in pcDNA3.1-E2F1 group and pcDNA3.1 group. (F) The invasion ability of hepatocellular carcinoma HepG2 cells was detected by matrigel invasion assay at 48h in pcDNA3.1-E2F1 group and pcDNA3.1 group. Data displayed in histograms were expressed as means±SD, *p<0.05, **p<0.01 (Student’s t-test). (G) Representative pictures of invasion ability of hepatocellular carcinoma HepG2 cells that was detected by matrigel invasion assay at 48h in pcDNA3.1-E2F1 group and pcDNA3.1 group
Figure 6. ChIP Analysis was Performed to Qualitatively Confirm the Interaction of E2F1and H19 Promoter in Hepatocellular Carcinoma HepG2 Cells. As the negative controls, the protein-DNA complexes were incubated with non-specific control IgG. The input DNA represents one-fifth of the starting material. DNA purified from each sample was detected by real-time PCR. *p<0.05 (Student’s t-test)
Jun Lv et al
Asian Pacific Journal of Cancer Prevention, Vol 15, 20142570
expression of H19 was knocked down by siRNA. In addition, knocking down E2F1 could down-regulate H19 expression and suppress cell growth and invasion in hepatocellular carcinoma HepG2 cells. Furthermore, E2F1 over-expression could up-regulate H19 expression and promote cell growth and invasion in hepatocellular carcinoma HepG2 cells. These data indicated that AFB1 could regulate the hepatocellular carcinoma HepG2 cells growth and invasion by associating with E2F1 and H19.
In conclusion, our present findings demonstrate that AFB1 could promote the expression of H19 and cell growth and invasion in hepatocellular carcinoma HepG2 cells. This work is the first documented report of the relationship of an mRNA-like non coding RNA, H19 and AFB1. In addition, AFB1 induced the expression of E2F1 and E2F1 could bind on the promoter of H19, so we predicated that AFB1 might regulate the expression of H19 through the activation of E2F1 transcription factor in hepatocellular carcinoma HepG2 cells. Our results suggested that aflatoxin B1could promote cell growth and invasion in hepatocellular carcinoma HepG2 cells through H19 and E2F1.
Acknowledgements
The authors appreciate the support provided by the Department of Surgical Laboratory at the First Affiliated Hospital of Sun Yat-Sen University and the Center for Science Research at Guilin Medical College. This research was supported by the National Natural Science Foundation of China (81172079), the Foundation of the Medical Experimental Research Center of Guangxi Medical University (KFJJ2011-10), the Foundation of the Health Department of Guangxi Province, China (Z2007212), the Foundation of Scientific Research and Technology Development Project of Guangxi Province, China (GuiKeGong1355005-3-5).
ReferencesAyed-Boussema I, Pascussi JM, Maurel P, et al (2012). Effect of
aflatoxin B1 on nuclear receptors PXR, CAR, and AhR and their target cytochromes P450 mRNA expression in primary cultures of human hepatocytes. Int J Toxicol, 31, 86-93.
Berteaux N, Lottin S, Monte D, et al (2005). H19 mRNA-like noncoding RNA promotes breast cancer cell proliferation through positive control by E2F1. J Biol Chem, 280, 29625-36.
Braconi C, Valeri N, Kogure T, et al (2011). Expression and functional role of a transcribed noncoding RNA with an ultraconserved element in hepatocellular carcinoma. Proc Natl Acad Sci USA, 108, 786-91.
Calin GA, Liu CG, Ferracin M, et al (2007). Ultraconserved regions encoding ncRNAs are altered in human leukemias and carcinomas. Cancer Cell, 12, 215-29.
Dugimont T, Montpellier C, Adriaenssens E, et al (1998). The H19 TATA-less promoter is efficiently repressed by wild-type tumor suppressor gene product p53. Oncogene, 16, 2395-401.
Dyson N (1994). pRB, p107 and the regulation of the E2F transcription factor. J Cell Sci Suppl, 18, 81-7.
Dyson N (1998). The regulation of E2F by pRB-family proteins. Genes Dev, 12, 2245-62.
Eaton DL, Gallagher EP (1994). Mechanisms of aflatoxin
carcinogenesis. Annu Rev Pharmacol, 34, 135-72. Fang Y, Feng Y, Wu T, et al (2013). Aflatoxin B1 negatively
regulates Wnt/β-catenin signaling pathway through activating miR-33a. PLoS One, 8, 73004.
Fellig Y, Ariel I, Ohana P, et al (2005). H19 expression in hepatic metastases from a range of human carcinomas. J Clin Pathol, 58, 1064-8.
Feng Y, Xue WJ, Li P, et al (2012). RASSF1A hypermethylation is associated with aflatoxin B1 and polycyclic aromatic hydrocarbon exposure in hepatocellular carcinoma. Hepatogastroenterol, 59, 1883-8.
Fry CJ, Pearson A, Malinowski E, et al (1999). Activation of the murine dihydrofolate reductase promoter by E2F1. A requirement for CBP recruitment. J Biol Chem, 274, 15883-91.
Gabory A, Ripoche MA, Yoshimizu T, et al (2006). The H19 gene: regulation and function of a non-coding RNA. Cytogenet Genome Res, 113, 188-93.
Giannoukakis N, Deal C, Paquette J, et al (1993). Parental genomic imprinting of the human IGF2 gene. Nat Genet, 4, 98-101.
Hanioka N, Nonaka Y, Saito K, et al (2012). Effect of aflatoxin B1 on UDP-glucuronosyltransferase mRNA expression in HepG2 cells. Chemosphere, 89, 526-9.
Hibi K, Nakamura H, Hirai A, et al (1996). Loss of H19 imprinting in esophageal cancer. Cancer Res, 56, 480-2.
IARC (2002). Some traditional herbal medicines, some mycotoxins, Naphthalene and Styrene. IARC Press, Lyon.
Khaitan D, Dinger ME, Mazar J, et al (2011). The melanoma-upregulated long noncoding RNA SPRY4-IT1 modulates apoptosis and invasion. Cancer Res, 71, 3852-62.
Lottin S, Adriaenssens E, Dupressoir T, et al (2002). Overexpression of an ectopic H19 gene enhances the tumorigenic properties of breast cancer cells. Carcinogenesis, 23, 1885-95.
Luo JH, Ren B, Keryanov S, et al (2006). Transcriptomic and genomic analysis of human hepatocellular carcinomas and hepatoblastomas. Hepatol, 44, 1012-24.
Matouk IJ, DeGroot N, Mezan S, et al (2007). The H19 non-coding RNA is essential for human tumor growth. PLoS One, 2, 845.
McLean M, Dutton MF (1995). Cellular interactions and metabolism of aflatoxin: an update. Pharmacol Ther, 65, 163-92.
Ohtani K (1999). Implication of transcription factor E2F in regulation of DNA replication. Front Biosci, 4, 793-804.
Oyagbemi AA, Azeez OI, Saba AB (2010). Hepatocellular carcinoma and the underlying mechanisms. Afr Health Sci, 10, 93-8.
Panzitt K, Tschernatsch MM, Guelly C, et al (2007). Characterization of HULC, a novel gene with striking up-regulation in hepatocellular carcinoma, as noncoding RNA. Gastroenterol, 132, 330-42.
Yang C, Fan J, Zhuang Z, et al (2013). The role of NAD+-dependent isocitrate dehydrogenase 3 subunit α in AFB1 induced liver lesion. Toxicol Lett, 13, 01389-1.
Yang Z, Zhou L, Wu LM, et al (2011). Overexpression of long non-coding RNA HOTAIR predicts tumor recurrence in hepatocellular carcinoma patients following liver transplantation. Ann. Surg. Oncol, 18, 1243-50.
Zemel S, Bartolomei MS, Tilghman SM (1992). Physical linkage of two mammalian imprinted genes, H19 and insulin-like growth factor 2. Nat Genet, 2, 61-5.
Zhang Y, Tycko B (1992). Monoallelic expression of the human H19 gene. Nat Genet, 1, 40-4.
Zwicker J, Müller R (1997). Cell-cycle regulation of gene expression by transcriptional repression. Trends Genet, 13, 3-6.
![Aflatoxin B1 contamination in sunflower oil collected from ... · A simple method was proposed for aflatoxin determi-nation in vegetable oils [9]. The method was success-fully applied](https://img.pdfslide.us/doc/110x75/5e5014bf516584470e521bae/aflatoxin-b1-contamination-in-sunflower-oil-collected-from-a-simple-method-was.jpg)