Embed Size (px)
Citation preview
Hindawi Publishing CorporationISRN SpectroscopyVolume 2013, Article ID 980754, 7 pageshttp://dx.doi.org/10.1155/2013/980754
Research ArticleA Sensitive Spectrophotometric Estimation of Nimodipine inTablets and Injection Using Phloroglucinol
Hemavathi N. Deepakumari and Hosakere D. Revanasiddappa
Department of Chemistry, University of Mysore, Manasagangotri, Mysore 570 006, India
Correspondence should be addressed to Hosakere D. Revanasiddappa; [email protected]
Received 2 April 2013; Accepted 7 May 2013
Academic Editors: G. D’Errico and E. Stathatos
Copyright © 2013 H. N. Deepakumari and H. D. Revanasiddappa. This is an open access article distributed under the CreativeCommons Attribution License, which permits unrestricted use, distribution, and reproduction in any medium, provided theoriginal work is properly cited.
A rapid, simple, and sensitive spectrophotometric method has been described for the determination of nimodipine in bulk drug,tablets, and injection. The proposed method is based on the diazotization of reduced nimodipine with nitrous acid followed bycoupling with phloroglucinol to form colored azo dye and showing absorption maximum (𝜆max) at 410 nm. The formed coloredazo dye is stable for about more than 2 h. The method obeyed Beer’s law over the concentration range of 0–25𝜇g/mL and thecorresponding molar absorptivity value is 1.23 × 10⁴ L/moL/cm. The Sandell sensitivity values limits of detection (LOD) andquantification (LOQ) values have also been reported for the developed method. The accuracy and precision of the method wasevaluated on intra- and interday basis; the relative error (%RE) and the relative standard deviation (RSD) were <2.0%. All variableshave been optimized and the presented reaction sequence was applied to the analysis of nimodipine in bulk drug, tablets, andinjections. The performance of this method was evaluated in terms of Student’s 𝑡-test and variance ratio 𝐹-test to find out thesignificance of proposed method over the reference method.
1. Introduction
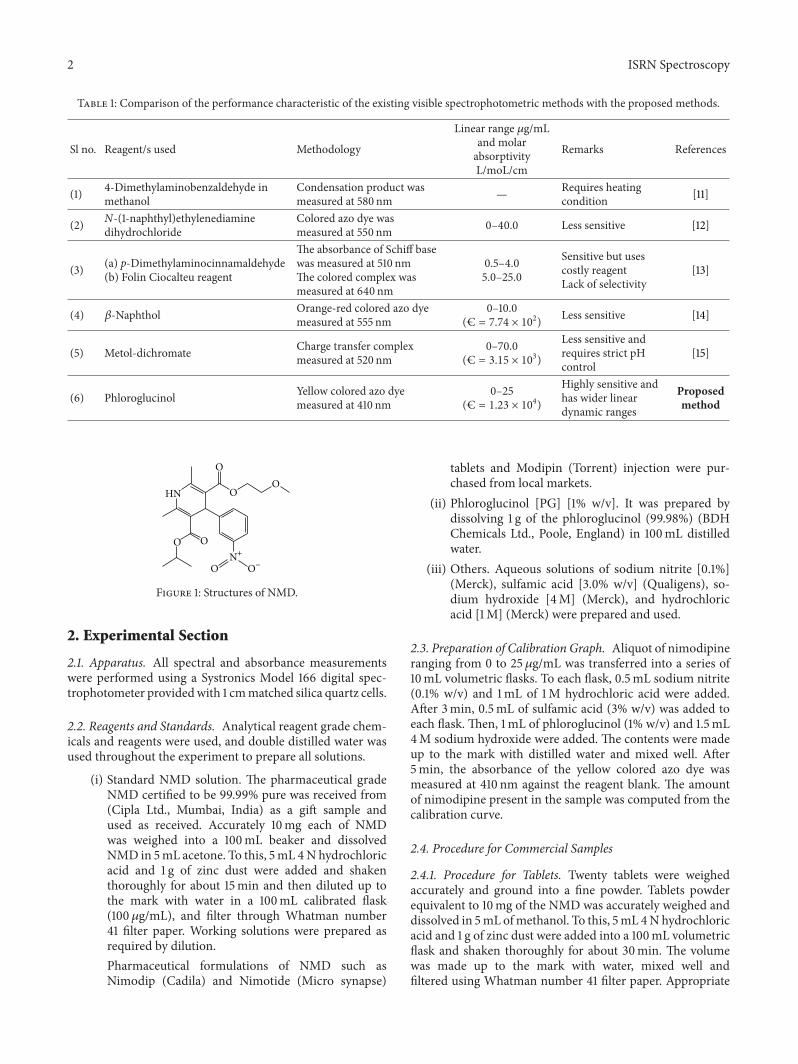
Nimodipine (NMD), chemically known as isopropyl-2-methoxyethyl-1,4-dihydro-2,6-dimethyl-4-(3-nitrophenyl)-3,5-pyridine dicarboxylate (Figure 1), is a dihydropyridinecalcium channel blocker that acts by relaxing the arterialsmooth muscle. It is known for its preferential action oncerebral blood vessels and its potential cytoprotective effectsby reducing calcium influx into nerve cells [1]. Nimodipinehas also been used in the other cerebrovascular disorders,such as ischemic stroke, hypertension, and multi-infarctdementia [2]. It increases blood flow to injured brain tissues.It has been officially determined by liquid chromatographicmethod with UV detection [3].
Various analytical methods for the measurement of thiscompound have been reported. These include HPLC [4],LC-MS-MS [5], LC-MS [6], and GC with electron capturedetection [7]. These techniques are highly expensive and notaffordable for the routine analysis of dosage forms. Variousanalytical techniques that have been reported for this drug in
therapeutics include atomic absorption spectrophotometry[8], polarography [9], spectrofluorimetry [10], and spectro-photometry [11–16].
Many of the reported methods are time consuming andrequire expensive experimental setup [4–7], and polaro-graphic methods are less sensitive [9]. Besides, the reportedspectrophotometric methods are less sensitive [11–16] andrequire heating conditions [11] and costly chromogenicreagent [13], (Table 1). Considering these demerits, there wasa need to develop more advantageous spectrophotometricmethod for the determination of NMD in bulk sample andin tablets.
The present investigation reports the development andvalidation of a simple, highly sensitive, and accurate methodfor the determination of NMD in bulk drug, tablets, and ininjection based on diazo-coupling reaction using phloroglu-cinol (PG) as the coupling agent. The developed method isvalidated for linearity, accuracy, precision, selectivity, andrecovery as per the current ICH guidelines.
2 ISRN Spectroscopy
Table 1: Comparison of the performance characteristic of the existing visible spectrophotometric methods with the proposed methods.
Sl no. Reagent/s used Methodology
Linear range 𝜇g/mLand molarabsorptivityL/moL/cm
Remarks References
(1) 4-Dimethylaminobenzaldehyde inmethanol
Condensation product wasmeasured at 580 nm — Requires heating
condition [11]
(2) N-(1-naphthyl)ethylenediaminedihydrochloride
Colored azo dye wasmeasured at 550 nm 0–40.0 Less sensitive [12]
(3) (a) p-Dimethylaminocinnamaldehyde(b) Folin Ciocalteu reagent
The absorbance of Schiff basewas measured at 510 nmThe colored complex wasmeasured at 640 nm
0.5–4.05.0–25.0
Sensitive but usescostly reagentLack of selectivity
[13]
(4) 𝛽-Naphthol Orange-red colored azo dyemeasured at 555 nm
0–10.0(C = 7.74 × 10²) Less sensitive [14]
(5) Metol-dichromate Charge transfer complexmeasured at 520 nm
0–70.0(C = 3.15 × 10³)
Less sensitive andrequires strict pHcontrol
[15]
(6) Phloroglucinol Yellow colored azo dyemeasured at 410 nm
0–25(C = 1.23 × 10⁴)
Highly sensitive andhas wider lineardynamic ranges
Proposedmethod
HN
O
OO
O
O ON+
O−
Figure 1: Structures of NMD.
2. Experimental Section
2.1. Apparatus. All spectral and absorbance measurementswere performed using a Systronics Model 166 digital spec-trophotometer providedwith 1 cmmatched silica quartz cells.
2.2. Reagents and Standards. Analytical reagent grade chem-icals and reagents were used, and double distilled water wasused throughout the experiment to prepare all solutions.
(i) Standard NMD solution. The pharmaceutical gradeNMD certified to be 99.99% pure was received from(Cipla Ltd., Mumbai, India) as a gift sample andused as received. Accurately 10mg each of NMDwas weighed into a 100mL beaker and dissolvedNMD in 5mL acetone. To this, 5mL 4Nhydrochloricacid and 1 g of zinc dust were added and shakenthoroughly for about 15min and then diluted up tothe mark with water in a 100mL calibrated flask(100 𝜇g/mL), and filter through Whatman number41 filter paper. Working solutions were prepared asrequired by dilution.Pharmaceutical formulations of NMD such asNimodip (Cadila) and Nimotide (Micro synapse)
tablets and Modipin (Torrent) injection were pur-chased from local markets.
(ii) Phloroglucinol [PG] [1% w/v]. It was prepared bydissolving 1 g of the phloroglucinol (99.98%) (BDHChemicals Ltd., Poole, England) in 100mL distilledwater.
(iii) Others. Aqueous solutions of sodium nitrite [0.1%](Merck), sulfamic acid [3.0% w/v] (Qualigens), so-dium hydroxide [4M] (Merck), and hydrochloricacid [1M] (Merck) were prepared and used.
2.3. Preparation of Calibration Graph. Aliquot of nimodipineranging from 0 to 25 𝜇g/mL was transferred into a series of10mL volumetric flasks. To each flask, 0.5mL sodium nitrite(0.1% w/v) and 1mL of 1M hydrochloric acid were added.After 3min, 0.5mL of sulfamic acid (3% w/v) was added toeach flask. Then, 1mL of phloroglucinol (1% w/v) and 1.5mL4M sodium hydroxide were added. The contents were madeup to the mark with distilled water and mixed well. After5min, the absorbance of the yellow colored azo dye wasmeasured at 410 nm against the reagent blank. The amountof nimodipine present in the sample was computed from thecalibration curve.
2.4. Procedure for Commercial Samples
2.4.1. Procedure for Tablets. Twenty tablets were weighedaccurately and ground into a fine powder. Tablets powderequivalent to 10mg of the NMD was accurately weighed anddissolved in 5mL ofmethanol. To this, 5mL 4Nhydrochloricacid and 1 g of zinc dust were added into a 100mL volumetricflask and shaken thoroughly for about 30min. The volumewas made up to the mark with water, mixed well andfiltered using Whatman number 41 filter paper. Appropriate
ISRN Spectroscopy 3
0
0.1
0.2
0.3
0 1 2 3
Abso
rban
ce
Volume of PG (mL)
10 𝜇g/mL NMD
(a)
0
0.1
0.2
0.3
0 0.5 1 1.5 2
Abso
rban
ce
Volume of reagent (mL)
10 𝜇g/mL NMD
(b)
0
0.05
0.1
0.15
0.2
0.25
0 0.5 1 1.5 2 2.5
Abso
rban
ce
Volume of HCl (mL)
10 𝜇g/mL NMD
(c)
0
0.05
0.1
0.15
0.2
0.25
0.3
0 20 40 60 80 100 120 140
Abso
rbna
ce
Time (min)
10 𝜇g/mL NMD
(d)
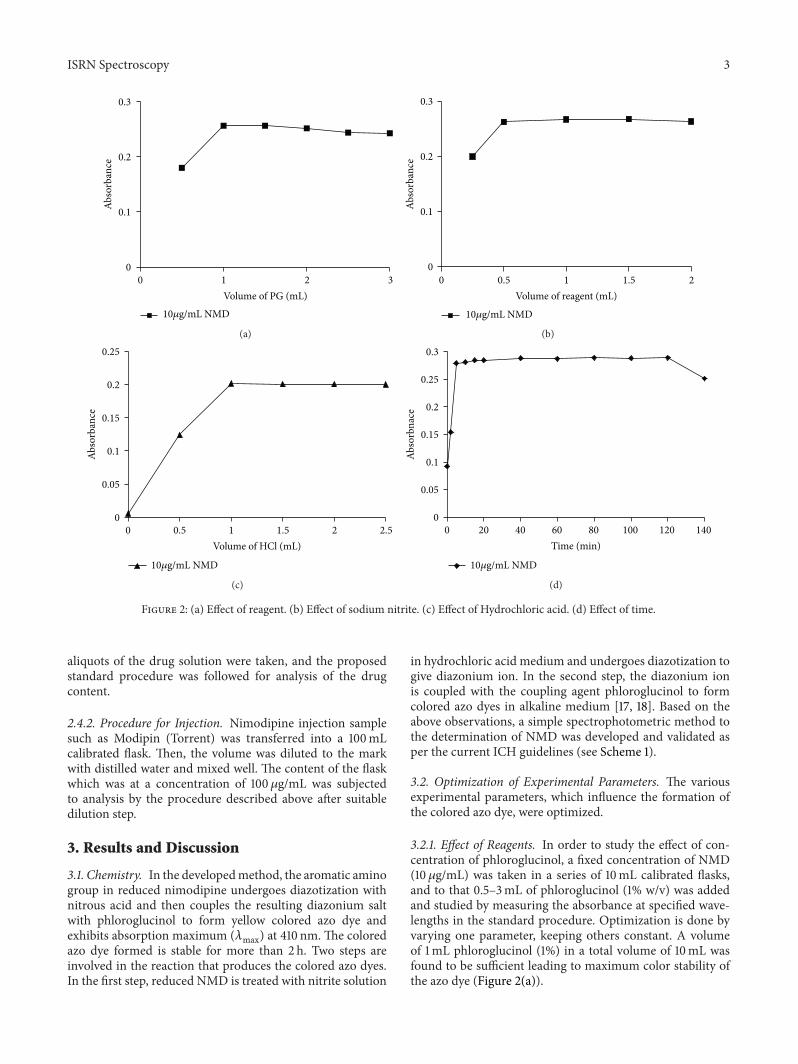
Figure 2: (a) Effect of reagent. (b) Effect of sodium nitrite. (c) Effect of Hydrochloric acid. (d) Effect of time.
aliquots of the drug solution were taken, and the proposedstandard procedure was followed for analysis of the drugcontent.
2.4.2. Procedure for Injection. Nimodipine injection samplesuch as Modipin (Torrent) was transferred into a 100mLcalibrated flask. Then, the volume was diluted to the markwith distilled water and mixed well. The content of the flaskwhich was at a concentration of 100𝜇g/mL was subjectedto analysis by the procedure described above after suitabledilution step.
3. Results and Discussion
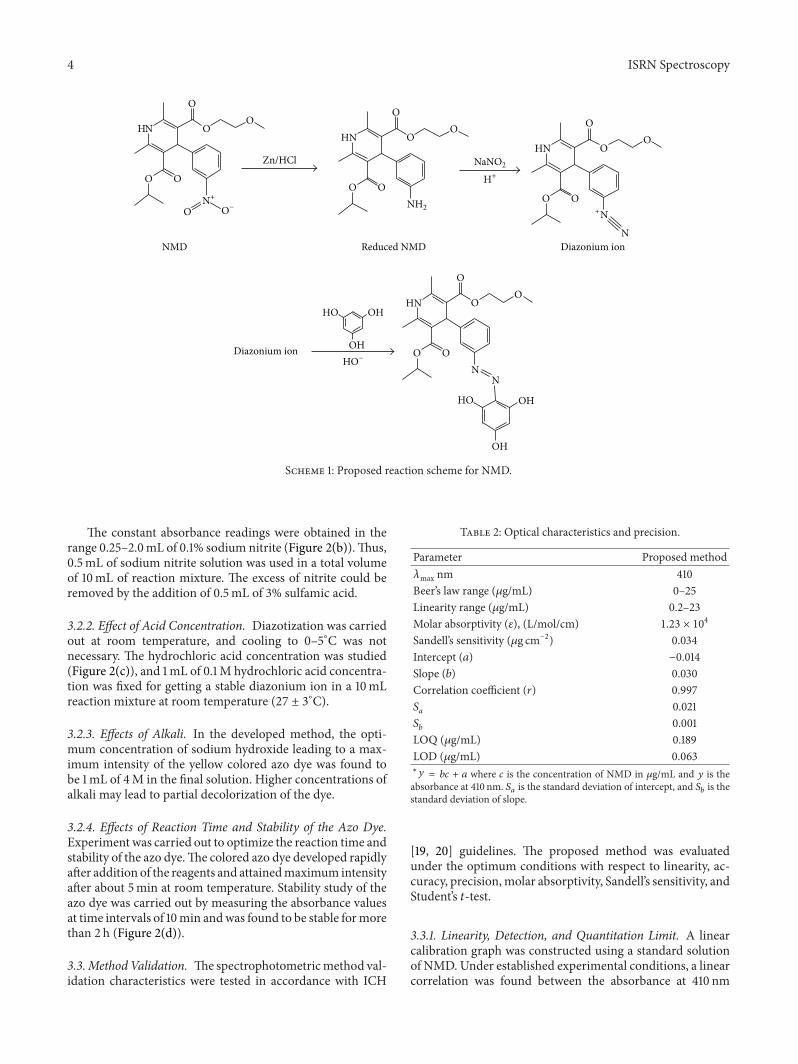
3.1. Chemistry. In the developedmethod, the aromatic aminogroup in reduced nimodipine undergoes diazotization withnitrous acid and then couples the resulting diazonium saltwith phloroglucinol to form yellow colored azo dye andexhibits absorption maximum (𝜆max) at 410 nm. The coloredazo dye formed is stable for more than 2 h. Two steps areinvolved in the reaction that produces the colored azo dyes.In the first step, reduced NMD is treated with nitrite solution
in hydrochloric acid medium and undergoes diazotization togive diazonium ion. In the second step, the diazonium ionis coupled with the coupling agent phloroglucinol to formcolored azo dyes in alkaline medium [17, 18]. Based on theabove observations, a simple spectrophotometric method tothe determination of NMD was developed and validated asper the current ICH guidelines (see Scheme 1).
3.2. Optimization of Experimental Parameters. The variousexperimental parameters, which influence the formation ofthe colored azo dye, were optimized.
3.2.1. Effect of Reagents. In order to study the effect of con-centration of phloroglucinol, a fixed concentration of NMD(10 𝜇g/mL) was taken in a series of 10mL calibrated flasks,and to that 0.5–3mL of phloroglucinol (1% w/v) was addedand studied by measuring the absorbance at specified wave-lengths in the standard procedure. Optimization is done byvarying one parameter, keeping others constant. A volumeof 1mL phloroglucinol (1%) in a total volume of 10mL wasfound to be sufficient leading to maximum color stability ofthe azo dye (Figure 2(a)).
4 ISRN Spectroscopy
HN
O
O
OO
O
Zn/HCl
HN
O
O
OO
O
HN
O
O
OO
O
NNMD Reduced NMD Diazonium ion
Diazonium ion
HN
O
O
OON
O
N
HO OH
OH
HO OH
OH
ON+
O− NH2
NaNO2
H+
+N
HO−
Scheme 1: Proposed reaction scheme for NMD.
The constant absorbance readings were obtained in therange 0.25–2.0mL of 0.1% sodium nitrite (Figure 2(b)).Thus,0.5mL of sodium nitrite solution was used in a total volumeof 10mL of reaction mixture. The excess of nitrite could beremoved by the addition of 0.5mL of 3% sulfamic acid.
3.2.2. Effect of Acid Concentration. Diazotization was carriedout at room temperature, and cooling to 0–5∘C was notnecessary. The hydrochloric acid concentration was studied(Figure 2(c)), and 1mL of 0.1M hydrochloric acid concentra-tion was fixed for getting a stable diazonium ion in a 10mLreaction mixture at room temperature (27 ± 3∘C).
3.2.3. Effects of Alkali. In the developed method, the opti-mum concentration of sodium hydroxide leading to a max-imum intensity of the yellow colored azo dye was found tobe 1mL of 4M in the final solution. Higher concentrations ofalkali may lead to partial decolorization of the dye.
3.2.4. Effects of Reaction Time and Stability of the Azo Dye.Experiment was carried out to optimize the reaction time andstability of the azo dye.The colored azo dye developed rapidlyafter addition of the reagents and attainedmaximum intensityafter about 5min at room temperature. Stability study of theazo dye was carried out by measuring the absorbance valuesat time intervals of 10min andwas found to be stable formorethan 2 h (Figure 2(d)).
3.3.MethodValidation. Thespectrophotometricmethod val-idation characteristics were tested in accordance with ICH
Table 2: Optical characteristics and precision.
Parameter Proposed method𝜆max nm 410Beer’s law range (𝜇g/mL) 0–25Linearity range (𝜇g/mL) 0.2–23Molar absorptivity (𝜀), (L/mol/cm) 1.23 × 10
4
Sandell’s sensitivity (𝜇g cm−2) 0.034Intercept (𝑎) −0.014Slope (𝑏) 0.030Correlation coefficient (𝑟) 0.997𝑆𝑎
0.021𝑆𝑏
0.001LOQ (𝜇g/mL) 0.189LOD (𝜇g/mL) 0.063∗𝑦 = 𝑏𝑐 + 𝑎 where 𝑐 is the concentration of NMD in 𝜇g/mL and 𝑦 is the
absorbance at 410 nm. 𝑆𝑎 is the standard deviation of intercept, and 𝑆𝑏 is thestandard deviation of slope.
[19, 20] guidelines. The proposed method was evaluatedunder the optimum conditions with respect to linearity, ac-curacy, precision,molar absorptivity, Sandell’s sensitivity, andStudent’s 𝑡-test.
3.3.1. Linearity, Detection, and Quantitation Limit. A linearcalibration graph was constructed using a standard solutionof NMD. Under established experimental conditions, a linearcorrelation was found between the absorbance at 410 nm
ISRN Spectroscopy 5
Table 3: Evaluation of intraday and interday accuracy and precision results.
NMD taken 𝜇g/mL Intradaya Interdayb
NMD foundc𝜇g/mL Precisiond Accuracye NMD foundc𝜇g/mL Precisiond Accuracye
10 9.94 ± 0.09 0.86 0.62 9.87 ± 0.15 1.55 1.29Proposed method 15 14.92 ± 0.05 0.30 0.53 14.77 ± 0.23 1.56 1.56
20 20.07 ± 0.05 0.25 −0.34 20.17 ± 0.33 1.62 −0.86aMean value of five determinations; bmean value of five determinations; cmean value of three determinations; drelative standard deviation (%); ebias%: (found-taken/taken) × 100.
Table 4: Results of determination of NMD in tablets and statistical comparison with the reference method.
Tablet brand name∗ Nominal amount mg per tablet Found∗∗ (% of nominal amount ± SD)Reference method [14] Method
Nimodipa 30mg 99.20 ± 0.38100.27 ± 0.62
𝑡 = 0.11, 𝐹 = 2.68
Nimotideb 30mg 99.34 ± 0.43100.54 ± 0.41𝑡 = 0.12, 𝐹 = 0.89
Modipinc 30mg/injection 100.02 ± 0.53100.28 ± 0.66
𝑡 = 0.03, 𝐹 = 1.53∗Marketed by; aCadila; bMicro Synapse; cTorrent.∗∗Mean value of five determinations.Tabulated 𝑡- and 𝐹-values at 95% confidence level are 2.77 and 6.39, respectively.
and concentrations of NMD in the ranges given in Table 2.Regression analysis of the calibration curve is described by
𝑌 = 𝑎 + 𝑏𝑥, (1)
where 𝑦 = absorbance, 𝑎 = intercept, 𝑏 = slope, and 𝑥 =concentration, and the values are presented in Table 2. Theoptical characteristics such as absorption maxima, Beer’s lawlimit, molar absorptivity, and Sandell’s sensitivity values [21]are also given in Table 2.
3.3.2. Accuracy and Precision
Precision and Accuracy. The intraday and interday precisionof the proposed method was established by replicate analysisof NMD samples at three different concentrations (low,medium, and high) (Table 3) within the working limits, eachbeing repeated five times. The percentage relative standarddeviation (% RSD) values of both intra- and interday studiesare shown in Table 3 were satisfactory and showed thebest appraisal of the procedures in daily use. Accuracy wasevaluated as percentage relative error (% RE) between themeasured mean concentrations and taken concentrations forNMD. Bias {bias% = [(Concentration found-known con-centration) × 100/known concentration]} was calculatedat each concentration, and the results obtained from thisinvestigation are also summarized in Table 3. The valuespercentage relative error between the concentrations ofNMDfor taken and found less than 2% showed the high accuracy ofthe proposedmethod.The proposedmethodwas successfullyapplied to the determination of NMD in pharmaceuticaldosage forms.
3.3.3. Selectivity. The selectivity of the proposed method topharmaceutical samples was tested by a placebo blank andsyntheticmixture analyses. A placebo blank containing starch(10mg), acacia (10mg), methyl cellulose (20mg), sodiumcitrate (15mg), talc (15mg), magnesium stearate (10mg),and sodium alginate (15mg) was prepared by combiningall components, and its solution was prepared as describedunder “procedure for tablets” and was subjected to analysisby following the general procedures. It was found that, therewas no interference from the common excipients added to thetablets.
A synthetic mixture was separately prepared by addingpure NMD (10mg) to placebo blank of similar composi-tion and homogenized. The extract was prepared by takingsynthetic mixture containing NMD (10mg in 100mL) togive NMD (100𝜇g/mL). Synthetic mixture solution preparedabove was taken at three different concentrations equivalentto 10, 15, and 20𝜇g/mL and was subjected to analysis byfollowing the general procedure. The results of the studyindicate that the common excipients did not interfere withthe analysis by the proposed method and the results wereobtained in the range from 98% to 101.5%. These resultscomplemented the findings of the placebo blank analysis withrespect to selectivity.
3.3.4. Application to the Tablets and Injection. The proposedmethod was applied successfully to the determination ofNMD in commercial tablets and injection. The same batchtablets were also assayed by the reference method [14] whichconsisted of measurement of absorbance of NMD at 550 nm.The results of an assay were statistically compared with
6 ISRN Spectroscopy
Table 5: Results of recovery by standard-addition method.
Tablet brand name NMD tablet 𝜇g/mL Pure NMD added 𝜇g/mL Total found 𝜇g/mL Pure NMD recovered∗%± SD5 5 10.03 100.62 ± 0.38
Nimodip 5 10 14.97 99.76 ± 0.83
5 15 20.07 100.44 ± 0.65
5 5 10.05 101.05 ± 0.66
Nimotide 5 10 15.02 100.19 ± 0.33
5 15 20.05 100.35 ± 0.22
5 5 9.99 99.85 ± 0.53
Modipin 5 10 14.99 99.97 ± 0.69
5 15 20.15 101.01 ± 0.75
∗Mean value of three measurements.
the reference method [14] by applying the Student’s 𝑡-testfor accuracy and 𝐹-test for precision. The results in Table 4showed that there is no significant difference between theproposed and reference method [14] at the 95% confidencelevel with respect to accuracy and precision.
3.3.5. Recovery. To further assess the accuracy of the pro-posed method, recovery experiment was performed byapplying the standard addition technique. The recovery testwas done by adding nimodipine to the previously analyzedtablets. The recovery of each drug was calculated by compar-ing the concentration obtained from the spikedmixtures withthose of pure drugs. The results are summarized in Table 5.
4. Conclusions
In the present investigation, a simple, highly sensitive, accu-rate, and precise spectrophotometric method for the routineestimation of NMD in pure form, tablets, and injection isdescribed. The proposed method has better linear dynamicranges and sensitivity compared to the reported visible [10–14] spectrophotometric method. The main advantages of theestablished method are as follow.
(i) Diazotization was carried out at room temperature,and cooling to 0–5∘C was not necessary.
(ii) The amount of the reagents used in the reaction isminimum. In addition, organic solvent are not usedin the determination.
Furthermore, the proposed method does not requireelaborate procedures, which are usually associated withchromatographic methods and other traditional extractivespectrophotometric methods. The methods are unaffectedby slight variations in the experimental conditions suchas basicity, reagent concentrations, and temperature. Theseadvantages give the proposed method a great value andmakeit applicable for the analysis of NMD in routine qualitycontrol pharmaceutical laboratories.
Acknowledgments
The authors are grateful to Cipla Ltd., India, for the gen-erous supply of pure drug sample. One of the authors
H. N. Deepakumari is thankful to the University of Mysore,Mysore, for providing necessary facilities.
References
[1] M. S. Langley and E. M. Sorkin, “Nimodipine: a review of itspharmacodynamic and pharmacokinetic properties, and thera-peutic potential in cerebrovascular disease,” Drugs, vol. 37, no.5, pp. 669–699, 1989.
[2] J. E. F. Reynolds Martindale,The Extra Pharmacopeia, Pharma-ceutical Press, London, UK.
[3] G. Ragno, M. Veronico, and C. Vetuschi, “Analysis of nimodip-ine and its photodegradation product by derivative spectropho-tometry and gas chromatography,” International Journal ofPharmaceutics, vol. 119, no. 1, pp. 115–119, 1995.
[4] D. B. Yang, J. B. Zhu, R. Q. Lv, Z. G. Hu, and J. Q. Shen,“Liquid chromatographic method for determination of free andniosome-entrapped nimodipine in mouse plasma and differenttissues,” Analalytical Letters, vol. 41, pp. 533–542, 2008.
[5] F. Qiu, X. Chen, X. Li, and D. Zhong, “Determination ofnimodipine in human plasma by a sensitive and selective liquidchromatography-tandem mass spectrometry method,” Journalof Chromatography B, vol. 802, no. 2, pp. 291–297, 2004.
[6] W. M. Muck, “Enantiospecific determination of nimodipinein human plasma by liquid chromatography-tandem massspectrometry,” Journal of Chromatography A, vol. 712, no. 1, pp.45–53, 1995.
[7] P. Jakobsen, E. O. Mikkelsen, J. Laursen, and F. Jensen, “Deter-mination of nimodipine by gas chromatography using electron-capture detection; External factors influencing nimodipineconcentrations during intravenous administration,” Journal ofChromatography, vol. 374, no. 2, pp. 383–387, 1986.
[8] M.Canlica and S. Islimyeli, “The atomic absorption spectropho-tometric method for indirect determination of nimodipine intablets,” Turkish Journal of Chemistry, vol. 29, no. 2, pp. 141–146,2005.
[9] J. A. Squella, J. C. Sturm, R. Lenac, and L. J. Nunez-Vergara, “Polarographic and spectrophotometric determinationof nimodipine in tablets,”Analytical Letters, vol. 25, pp. 281–292,1992.
[10] F. Belal, A. A.Al-Majed, S. Julkhuf, andN.Y. Khalil, “Spectroflu-orometric determination of nimodipine in dosage forms andhuman urine,” Pharmazie, vol. 58, no. 12, pp. 874–876, 2003.
ISRN Spectroscopy 7
[11] S. Nirmala Bharathi, M. S. Prakash, M. Nagarajan, and K. AsokKumar, “Spectrophotometric determination of nimodipine andits formulations,” IndianDrugs, vol. 36, no. 10, pp. 661–662, 1999.
[12] K. P. R. Chowdary andG.Devala Rao, “Anew spectrophotomet-ric method for the determination of nimodipine,” Indian Drugs,vol. 32, no. 11, pp. 548–550, 1995.
[13] M. N. Reddy, T. K. Murthy, K. V. Rao Kanna, A. V. Gopal Hara,and D. G. Sankar, “New spectrophotometric methods for thedetermination of nimodipine,” Indian Drugs, vol. 38, no. 3, pp.140–142, 2001.
[14] V. Ravichandran, M. T. Sulthan, A. Shameen, M. Balakumar,S. Raghuraman, and V. Sankar, “Spectrophotometric methodfor the determination of nimodipine in pharmaceutical dosageforms,” Indian Journal of Pharmaceutical Science, vol. 63, pp.425–427, 2001.
[15] H. D. Revanasiddappa, S. M. Mallegowda, H. N. Deepaku-mari, and K. B. Vinay, “Spectrophotometric determination ofnitrazepam and nimodipine in pure and the tablet dosageforms,” Asian Journal of Biochemical and PharmaceuticalResearch, vol. 1, pp. 70–77, 2011.
[16] H. D. Revanasiddappa, S. M. Mallegowda, H. N. Deepaku-mari, and K. B. Vinay, “Spectrophotometric methods for thedetermination of nimodipine in pure and in pharmaceuticalpreparations,” Jordan Journal of Chemistry, vol. 6, pp. 413–422,2011.
[17] H. D. Revanasiddappa, H. N. Deepakumari, S. M. Mallegowda,and K. B. Vinay, “Facile spectrophotometric determination ofnimodipine and nitrazepam in pharmaceutical preparations,”Analele Universitatii din Bucuresti-Chimie, vol. 20, pp. 189–196,2011.
[18] H. D. Revanasiddappa, S. M. Mallegowda, H. N. Deepaku-mari, and K. B. Vinay, “Spectrophotometric methods for thedetermination of nimodipine in pure and in pharmaceuticalpreparations,” Jordan Journal of Chemistry, vol. 6, pp. 413–422,2011.
[19] ICH, “Note for Guidance on Validation of Analytical Proce-dures: Methodology Q2B,” 1996.
[20] International Conference On Harmonization of TechnicalRequirements for Registration of Pharmaceuticals for HumanUse, ICH Harmonised Tripartite Guideline, Validation of Ana-lytical Procadures: Text and Methodology Q2(R 1), Compli-mentary Guideline on Methodology, dated 06 November 1996,London, UK, November 2005.
[21] H. Zavis, D. Ludvik, K. Milan, S. Liadidlaw, and V. Frantisk,Handbook of Organic Reagents in Inorganic Anaslysis, Eds:University of Aberdem, Ellis Horwood Limited, John Wiley &Sons, London, UK, 1976.

Submit your manuscripts athttp://www.hindawi.com
Hindawi Publishing Corporationhttp://www.hindawi.com Volume 2014
Inorganic ChemistryInternational Journal of
Hindawi Publishing Corporation http://www.hindawi.com Volume 2014
International Journal ofPhotoenergy
Hindawi Publishing Corporationhttp://www.hindawi.com Volume 2014
Carbohydrate Chemistry
International Journal of
Hindawi Publishing Corporationhttp://www.hindawi.com Volume 2014
Journal of
Chemistry
Hindawi Publishing Corporationhttp://www.hindawi.com Volume 2014
Advances in
Physical Chemistry
Hindawi Publishing Corporationhttp://www.hindawi.com
Analytical Methods in Chemistry
Journal of
Volume 2014
Bioinorganic Chemistry and ApplicationsHindawi Publishing Corporationhttp://www.hindawi.com Volume 2014
SpectroscopyInternational Journal of
Hindawi Publishing Corporationhttp://www.hindawi.com Volume 2014
The Scientific World JournalHindawi Publishing Corporation http://www.hindawi.com Volume 2014
Medicinal ChemistryInternational Journal of
Hindawi Publishing Corporationhttp://www.hindawi.com Volume 2014
Chromatography Research International
Hindawi Publishing Corporationhttp://www.hindawi.com Volume 2014
Applied ChemistryJournal of
Hindawi Publishing Corporationhttp://www.hindawi.com Volume 2014
Hindawi Publishing Corporationhttp://www.hindawi.com Volume 2014
Theoretical ChemistryJournal of
Hindawi Publishing Corporationhttp://www.hindawi.com Volume 2014
Journal of
Spectroscopy
Analytical ChemistryInternational Journal of
Hindawi Publishing Corporationhttp://www.hindawi.com Volume 2014
Journal of
Hindawi Publishing Corporationhttp://www.hindawi.com Volume 2014
Quantum Chemistry
Hindawi Publishing Corporationhttp://www.hindawi.com Volume 2014
Organic Chemistry International
ElectrochemistryInternational Journal of
Hindawi Publishing Corporation http://www.hindawi.com Volume 2014
Hindawi Publishing Corporationhttp://www.hindawi.com Volume 2014
CatalystsJournal of