Embed Size (px)
Citation preview
Research ArticleA New Least Squares Support Vector Machines Ensemble Modelfor Aero Engine Performance Parameter Chaotic Prediction
Dangdang Du Xiaoliang Jia and Chaobo Hao
School of Mechanical Engineering Northwestern Polytechnical University Xirsquoan 710072 China
Correspondence should be addressed to Xiaoliang Jia jiaxlnwpueducn
Received 25 September 2015 Accepted 26 January 2016
Academic Editor Francesco Franco
Copyright copy 2016 Dangdang Du et al This is an open access article distributed under the Creative Commons Attribution Licensewhich permits unrestricted use distribution and reproduction in any medium provided the original work is properly cited
Aiming at the nonlinearity chaos and small-sample of aero engine performance parameters data a new ensemble model namedthe least squares support vector machine (LSSVM) ensemble model with phase space reconstruction (PSR) and particle swarmoptimization (PSO) is presented First to guarantee the diversity of individualmembers different single kernel LSSVMs are selectedas base predictors and they also output the primary prediction results independently Then all the primary prediction results areintegrated to produce the most appropriate prediction results by another particular LSSVMmdasha multiple kernel LSSVM whichreduces the dependence of modeling accuracy on kernel function and parameters Phase space reconstruction theory is applied toextract the chaotic characteristic of input data source and reconstruct the data sample and particle swarm optimization algorithmis used to obtain the best LSSVM individual members A case study is employed to verify the effectiveness of presented model withreal operation data of aero engine The results show that prediction accuracy of the proposed model improves obviously comparedwith other three models
1 Introduction
With increasing demands in the field of operation safetyasset availability and economy the health monitoring of aeroengine has been widely considered as the key prerequisite forthe competition of an airline company One of the main tasksof healthmonitoring is to predict the performance parameterof aero engine By predicting and analyzing the trend of per-formance parameters one can obtain valuable information toavoid future risk and loss due to faults or accidents and reduceassociated maintenance costs [1] Therefore it is necessary todesign a high accurate and robust prediction model for aeroengine performance parameter (AEPP)
A variety of traditional time series prediction approacheshave already been proposed for this problem such as fuzzyrule [2] Kalman filter [3] grey prediction [4] ARMA [5] andmultiple regression [6] These approaches are very maturein theory but the accuracy is not always high and therobustness is not always satisfied in the application [7] Withthe development of artificial intelligence techniques recent
studies for AEPP prediction are mainly focused on artificialneural network (ANN) [8 9] and support vector machine(SVM) [10 11]
Comparedwith standard SVM least squares support vec-tormachine (LSSVM) adopts equality constraints and a linearKarush-Kuhn-Tucker system which has a more powerfulcomputational ability in solving the nonlinear and small-sample problem [12 13] In addition LSSVM eliminates localminima and structure design complexity of ANNThereforeLSSVM is a good choice for AEPP prediction model design-ingHowever themodeling accuracy of a single LSSVM is notonly influenced by the input data source but also affected byits kernel function and regularization parameters [12] Thusseveral main disadvantages are worth to be addressed Firstlyusing a data-driven technique to design an LSSVM modeldata source should be considered as the first factor AEPPdata is different from the pure random system that is thechaotic characteristic of AEPP data should be extracted toreconstruct input data samples before modeling Secondlyas two common parameter optimized methods for LSSVM
Hindawi Publishing CorporationMathematical Problems in EngineeringVolume 2016 Article ID 4615903 8 pageshttpdxdoiorg10115520164615903
2 Mathematical Problems in Engineering
conventional cross-validation and grid search methods haveseveral defects such as high time consuming and a prioriknowledge requirement
In addition although a single LSSVM with optimalparameters and reconstructed input data samples may havean excellent prediction performance under certain circum-stances because its kernel function is fixed it perhaps hassome kinds of inherent bias under other cases In the litera-tures due to the super robustness and generalization ensem-ble model has been proved to be an effective way to reducebiases of single model Ensemble model can make full useof diversity to compensate for disadvantages among the indi-vidual members and the reasonable combination strategy isbelieved to be able to produce better prediction accuracy andgeneralization than singlemodel [13ndash16] By using combiningsubmodels the multilayer networks of LS-SVMs ensemblehave been discussed deeply which is very encouraging andpromising for further research [13] but up to now theapplication of LSSVM ensemble model for AEPP predictionis relatively fresh and untouched in the open literature
For ensemble model design there are two points thatshould be considered One is that the selected individualmembers need to exhibit much diversity (disagreement) andaccuracy The other is the effectiveness of the combinationstrategy [17] For the diversity of individual members itis an easy and common way to build individual membersby using data decomposition [18] However this methodis proved to be effective when the original data sampleis sufficient and it is not suitable for small-sample dataCompared with the existing combination strategies such assimple averaging weighting method mean squared errorweighting method and least squares estimation weightingaveraging method intelligent method based combinationstrategies include ANN combiner and SVM combiner whichhave become the current trend [18] however ANN com-biner cannot avoid falling into local optima and for SVMcombiner it is not easy to select appropriate kernel functionso it is necessary to further improve these ensemble strate-gies
As previously mentioned in this paper a new PSR-PSO-(SK)LSSVM-(MK)LSSVM ensemble (PPLLE) modelforAEPPprediction is proposed Firstly a set of diverse singlekernel LSSVMs are created as base predictors Subsequentlythese individualmember LSSVMsoutput the primary predic-tion results independently Finally all the primary predictionresults are combined to produce themost appropriate predic-tion results by another particular multiple kernel LSSVM Inthe process of modeling phase space reconstruction (PSR)theory is applied to extract the chaotic characteristic ofinput data source and reconstruct the data samples Particleswarm optimization algorithm is used to search the bestparameters for LSSVM members to ensure their predictionaccuracies
The rest of this paper is organized as followsThenext sec-tion provides a brief introduction to the related knowledgeSection 3 formulates the proposed PPLLE model For illus-tration purpose the detailed application on AEPP predictionand model comparisons is proposed in Section 4 Section 5concludes this study
2 An Overview of the Related Knowledge
21 Data Samples Reconstruction Based on PSR TheoryAlthough the nonlinear chaos behavior is the main challengeconfronting the chaotic data series prediction the underlyingdata generating mechanisms can still be explored by PSRtheory [19] By means of the ability of revealing the natureof dynamic system state the PSR theory is useful in systemcharacterization in nonlinear prediction and in estimatingbounds on the size of the system [20 21]
According to Takensrsquo theorem for the nonlinear timeseries 119909
119894119899
119894=1 the current state information can be represented
by an119898-dimensional vector
119909119894+120591= 119891 (119909
119894 119909119894minus120591 119909
119894minus(119898minus1)120591) (1)
where 120591 is the delay time119898 is the embedded dimension theyare two important parameters for phase space constructionand119891 is themapping relation between the inputs and outputs
The autocorrelation function of time series at the firstminimum value is taken as the delay time 120591 of the recon-structed phase space we write
CR =sum119899minus120591
119894=1(119909119894minus 119909) (119909
119894+120591minus 119909)
sum119899minus120591
119894=1(119909119894minus 119909)2
(2)
where 119909 is the mean of 119909119894
To calculate the correlation dimension the correlationintegral 119862(119903) needs to be computed
119862 (119903) =1
1198732
119873
sum119894=1
119873
sum119895=1
119906 (119903 minus10038171003817100381710038171003817119883119894minus 119883119895
10038171003817100381710038171003817) (3)
where 119903 is the selected radius and 119903 gt 0 119906(119909) is the Heavisidefunction
The correlation dimension 119889(119898) is calculated by theformula as below
119889 (119898) =ln119862 (119903)ln 119903
(4)
Suppose119884119894= 119909119894119883119894= (119909119894minus120591 119909119894minus2120591 119909
119894minus119898120591) then we can
reconstruct 119899 minus 119898 data samples 119883119894 119884119894119899
119898+1
22 Least Squares Support Vector Machine LSSVM is theleast squares form of a standard SVM it was firstly proposedby Suykens and Vandewalle [12] LSSVM uses a set of linearequations during the training process and chooses all trainingdata as support vectors so it has excellent generalization andlow computation complexity [12ndash14]
In LSSVM the regression issue can be expressed as thefollowing optimization problem
min 1
21198822+1
2120574
119873
sum119905=1
1198902
119905(120574 gt 0)
st 119910119905= ⟨119882 120593 (X
119905)⟩ + 119887 + 119890
119905
(5)
where 120593(X119905) is a nonlinear function which maps the input
data into a higher dimensional space 119890119905is the error at time
119905 119887 is the bias and 120574 is the regulation constant
Mathematical Problems in Engineering 3
According to the Lagrange function and Karush-Kuhn-Tucker theorem the LSSVM for nonlinear functions can begiven as below
119910119905=
119873
sum119905=1
120572119905119870(119883119883
119905) + 119887 (6)
where 120572119905is the Lagrangemultiplier and119870(119883119883
119905) is the kernel
function which is applied to substitute the mapping processand avoid computing the function 120593(X
119905)
Typical kernel functions include linear kernel functionpolynomial kernel function radial basis kernel functionsigmoid kernel function and multiple kernel function Someof them are listed as follows
(1) linear kernel function (LKF)
119870(119883119883119905) = (119883119883
1015840
119905) (7)
(2) polynomial kernel function (PKF)
119870(119883119883119905) = [(119883119883
119905) + 1]
119902 (8)
(3) Gaussian radial basis kernel function (RBF)
119870(119883119883119905) = exp(minus
1003817100381710038171003817119883 minus 11988311990510038171003817100381710038172
1205902) (9)
(4) sigmoid kernel function (SKF)
119870(119883119883119905) = tanh (] (119883119883
119905) + 119890) (10)
(5) multiple kernel function (MKF)
119870(119883119883119905) = 12058811198701(119883119883
119905) + sdot sdot sdot + 120588
119899119870119899(119883119883
119905)
st119899
sum119894=1
120588119894= 1 (0 le 120588
119894le 1)
(11)
The nonlinear mapping ability of LSSVM is mainlydetermined by its kernel function form and relevant param-eters setting that is various kernel functions or parametershave different influence on the prediction ability of LSSVMpredictor (the parameters setting will be discussed in the nextsection) As to kernel function the LKF is suited to expressingthe linear component of the mapping relation and the RBFpossesses a wider convergence domain and an outstandinglearning ability and high resolution power while the PKFhas a powerful approximation and generalization abilityMeanwhile kernel functions can also be divided into localkernel function and global kernel function For the globalkernel function it has the overall situation characteristic andis commonly good at fitting the sample points which arefar away from the testing points but the fitting effect is notperfect on the sample points which are near the testing pointsand vice versa to the local kernel function [15] Each kindof kernel function has its own advantages and disadvantagesthe prediction performances of LSSVM with different kernelfunctions are not identical
Here we define the LSSVM configured with a multiplekernel function as themultiple kernel LSSVM (MK-LSSVM)otherwise we call it the single kernel LSSVM (SK-LSSVM)
23 Parameters Optimized Based on PSO Particle swarmoptimization (PSO) algorithm is a popular swarm intelligenceevolutionary algorithm used for solving global optimizationproblem [22] It can search the global optimal solution indifferent regions of the solution space in parallel
In PSO the position of each particle represents a solutionto the optimization problem 119909
119896= (1199091198961 1199091198962 119909
119896119889) is the
position vector and V119896= (V1198961 V1198962 V
119896119889) is the velocity
vector of the 119896th particle Similarly 119875119896= (1199011198961 1199011198962 119901
119896119889)
represents the best position of the 119896th particle which has beenachieved and 119875
119892= (1199011198921 1199011198922 119901
119892119889) represents the best
position among the whole particle groupThe values of position and velocity of the particle are
updated as follows
V119905+1119894119889= [120596V119905
119894119889+ 11988811199031(119901119905
119894119889minus 119909119905
119894119889) + 11988821199032(119901119905
119892119889minus 119909119905
119894119889)]
119909119905+1
119894119889= 119909119905
119894119889+ V119905+1119894119889
(12)
where 1198881and 1198882are the acceleration constant 119903
1and 1199032are two
random numbers in the range [0 1] and 120596 is inertia weightfactor To improve the convergence speed of PSO 119888
1 1198882 and
120596 of PSO are adjusted by using the formulas as below
120596 = 120596max minus120596max minus 120596min
119905max119905
1198881= 1198881max minus
1198881max minus 1198881min119905max
119905
1198882= 1198882max minus
1198882max minus 1198882min119905max
119905
(13)
where 119905max expresses the maximum iteration number and 119905 isthe current iteration number
3 Overall Process of Designingthe PPLLE Model
The core idea of the ensemble model lies in that all theindividual members are accurate as much as possible anddiverse enough and it adopts an appropriate ensemblestrategy to combine these outputs of the selected members[13ndash18]
31 Selection of the Appropriate Individual Member PredictorsFor LSSVM predictionmodel several diverse strategies suchas data diversity parameter diversity and kernel diversityhave been proved effectively for the creation of ensemblemembers with much dissimilarity [13] Because kernel func-tion has a crucial and direct effect on the learning andgeneralizing performance of LSSVM various kernel func-tions can be used to create diverse LSSVMs In this study119899 independent SK-LSSVMs such as LKF-LSSVM PKF-LSSVM and RBF-LSSVM are selected as individual memberLSSVM predictors
32 Combination of the Selected Individual Member LSSVMPredictors After the diverse individual member LSSVM
4 Mathematical Problems in Engineering
Individual
Individual
Reconstructdata samples
Combiner MK-LSSVM
Data source
PSR
Stage 2Stage 1 Stage 3
Partitiondata samples
PSO
Individual
y
x1
x2
xn
middot middot middot
middot middot middot
SK-LSSVM1
SK-LSSVM2
SK-LSSVMn
Figure 1 Basic framework of the PPLLE model
predictors have been selected the other key question ishow to determine the weight coefficient of each individualpredictor that is how to construct the combiner effectivelyAs depicted in previous section the MKF integrates theadvantages of global kernel function and local kernel functionand offsets some shortages of both simultaneously Henceanother specialMK-LSSVM is chosen as the combiner In thispaper theMKF is composed of aRBF and aPKF the former isa typical local kernel function and the latter is a representativeglobe kernel function A similar MK-LSSVMmodel has highprediction accuracy and generalization ability which hasbeen proved with chaotic time series by Tian et al [15]
33 Overall Process of Designing the PPLLE Model The basicframework of the proposed PPLLEmodel is given in Figure 1where 119899 is the number of the individual member LSSVMpredictors
As shown in Figure 1 there are three main stages in thebasic framework which can be summarized as follows
Stage 1 (sample dataset reconstruction and partition) Thedata source is reconstructed as data samples by using PSRthen the reconstructed data samples are divided into twoindispensable subsets training subset and testing subset
Stage 2 (individual member creation and prediction) Basedon kernel function diversity principle 119899 independent SK-LSSVMs are created as the individual member Each SK-LSSVM is trained by using the training subset Accordinglythe computational results
1 2 3
119899of the 119899 SK-
LSSVM predictors can be obtained respectively In theprocess of SK-LSSVM creating PSO is used to optimizeparameters of each member SK-LSSVM
Stage 3 (combiner creation and prediction) When the com-putational results of the individual member predictors inthe second stage are acquired they are aggregated intoan ensemble result by another special MK-LSSVM Sim-ilarly to create the optimal MK-LSSVM PSO is appliedagain
Here 119891(sdot) is the mapping function determined by thespecial combiner MK-LSSVM thus the final predictionoutput of the PPLLE model can be given as below
= 119891 (1 2 3
119899) (14)
4 Case Study
Due to different gas path component degradations such asfouling erosion corrosion and foreign object damage theperformance of an aero engine will decline over the servicetime [23] A lot of gas path performance parameters areoften used in health monitoring of aero engine from differentangles and levels such as exhaust gas temperature (EGT)fuel flow (FF) and low pressure fan speed (N1) Amongthese performance parameters EGT is considered as one ofthe most crucial working performance parameters of aeroengine which is measured to represent outlet temperatureof combustor chamber in practice When other conditionsremain the same the higher the EGT is the more seriousthe performance degradation of aero engine is [4] EGTgradually rises when theworking life of aero engine increasesif the EGT value reaches or exceeds the scheduled thresholdprovided by the original equipment manufacturer then theaero engine needs to be arranged for maintenance timely
In this study we select EGT as the AEPP representativeto predict by using the proposed PPLLE model and it isworth mentioning that other similar parameters can also bepredicted in the same way
41 Data Description and Samples Reconstruction In thisstudy the EGT data come from the real flight recorders ofthe cruise state of a certain type of aero engine and thesampling interval is 5 flight cycles The data series consistsof 148 EGT datasets covering the period from February 2013to September 2014 To increase the quality of the predictionresults some abnormal samples have been discarded fromthe original data series The observed EGT data is shown inFigure 2
For the observed EGT data series EGT119894148
119894=1 according
to (2) (3) and (4) the delay time 120591 is set as 1 and embed-ding dimension 119898 = 5 is obtained by computing Thus(EGT
119894minus5EGT
119894minus4 EGT
119894minus1) is taken as the input vector119883
119894
and119884119894= EGT
119894(119894 = 6 7 148) is used as the corresponding
expected value so we can get the reconstructed data samples119883119894 119884119894148
119894=6 The data samples 119883
119894 119884119894120
119894=6are used as training
subset to train each individual LSSVM of the ensemblemodel and the samples 119883
119894 119884119894148
119894=121are chosen as testing
subset to validate the ensemble model The one-step aheadprediction used in this paper is explained as in Figure 3After the ensemble model has been trained vector 119883
121
is entered into 4 individual predictors (SK-LSSVM predic-tors) to compute their predicted values 1
121 2
121
4
121
respectively Then these predicted values are aggregated intoan ensemble result by using a combination predictor (MK-LSSVM predictor) Hence the final predicted value
121is
obtained In this way from 119894 = 121 to 148 all the finalpredicted values
121to 148
can be got in turn
Mathematical Problems in Engineering 5
Table 1 Optimal parameters of LSSVM2simLSSVM
5
LSSVM1
(LKF-LSSVM)LSSVM
2
(PKF-LSSVM)LSSVM
3
(RBF-LSSVM)LSSVM
4
(SKF-LSSVM)LSSVM
5
(MK-LSSVM)119902 = 3
120574 = 9341
1205902= 032
120574 = 17682
V = 1 119890 = 1120574 = 12513
119902 = 2 1205902 = 051120588 = 027 120574 = 1683
0 10 20 30 40 50 60 70 80 90 100 110 120 130 140 150690
700
710
720
730
740
750
Sample number
Observed data
EGT
(∘C)
Figure 2 The observed EGT data
42 Evaluation Indices Mean absolute percentage error(MAPE) mean absolute error (MAE) mean squared error(MSE) and Theilrsquos Inequality Coefficient (TIC) are used toevaluate the prediction ability of the prediction model
MAPE = 1119896
119896
sum119894=1
10038161003816100381610038161003816100381610038161003816
119910119894minus 119894
119910119894
10038161003816100381610038161003816100381610038161003816times 100
MAE = 1119896
119896
sum119894=1
1003816100381610038161003816119910119894 minus 1198941003816100381610038161003816
MSE = 1119896
119896
sum119894=1
(119910119894minus 119894)2
TIC =radicsum119896
119894=1(119910119894minus 119894)2
radicsum119896
119894=1(119910119894)2+ radicsum
119896
119894=1(119894)2
(15)
where 119910119894and
119894are the observed values and corresponding
prediction values respectively
43 Model Parameters Setting In the modeling process ofLSSVMs the parameters of PSO are set as follows 119888
1min =1198882min = 2 119888
1max = 1198882max = 3 120596min = 1 120596max = 3 119901 =
50 and 119905max = 1000 By using the PSO the correspondingoptimal parameters of LSSVM
2simLSSVM
5are obtained and
listed in Table 1 An appropriate individual member numberof the ensemble model is able to achieve a balance between
Individual
Individual
Combination predictor
Individual
EndYesNo i = i + 1
i = 121
yi
x1
i
x2
i
x4
i
middot middot middot
middot middot middot
Xi
i gt 148
predictor1
predictor2
predictor4
Figure 3 One-step ahead prediction from 119894 = 121 to 148
120 125 130 135 140 145 150690
700
710
720
730
740
750
Sample number
Observed dataPPLLE predicted data
EGT
(∘C)
Figure 4 Prediction results of the PPLLE model on EGT testingdataset
the prediction efficiency and the prediction ability [17] In thisstudy the member number is set as 5
44 Results and Discussion Figure 4 illustrates the predic-tion results for the EGT testing dataset by PPLLE modeland corresponding observed EGT value The black symbolrepresents the observed value and the red symbol expressesthe prediction value From Figure 4 we can find that therise and fall trends of the two curves are approximatelythe same and only the individual points have some highergaps of the size which means EGT is predicted with good
6 Mathematical Problems in Engineering
Table 2 Comparison of different models on EGT testing dataset
Model MAPE () MAE MSE TICPPLLE 051 367 1404 000258PPLLElowast 062 448 2248 000327RBF-chaos 085 616 4970 000485Single LSSVM 110 799 7566 000598
accuracy on the testing data samples as a whole There aretwo causes that may explain the gaps between the observedvalues and prediction values Firstly it is difficult to give athorough consideration to extract the EGT characteristicswhen determining the model input data Secondly due to theinfluence of subjective factors it is impossible to eliminate allthe outliers properly
In contrast the single LSSVM model proposed by Tianet al [15] RBF-chaos model proposed by Zhang et al [24]and PPLLElowast (PSR-PSO-LSSVM-LSSVMlowast ensemble) modelare built The kernel function and parameters of the singleLSSVM model are the same as those of the LSSVM
5model
listed in Table 1 The RBF-chaos model aggregated chaoscharacteristics and RBF neural networks (here the inputlayer hidden layer and output layer of RBF neural networkare set as 5 11 and 1 resp)The difference between the PPLLEmodel and PPLLElowast model lies in that the latter uses an RBF-LSSVM (ie SK-LSSVM) as the combiner
In Table 2 the MAPE MAE MSE and TIC values ofthe PPLLE PPLLElowast RBF-chaos and single LSSVM modelson the testing dataset are listed It shows that the PPLLEmodel performs the best among the four modes with MAPEof 051 compared with those of 062 085 and 110 by thePPLLElowast RBF-chaos and single LSSVMmodels respectivelyTheMAE of PPLLE PPLLElowast RBF-chaos and single LSSVMmodels are 367 448 616 and 799 respectively whichdemonstrates the prediction accuracy of the proposedmodelPPLLE model predicts the EGT with MSE of 1404 betterthan PPLLElowast RBF-chaos and single LSSVM models withthose of 2248 4970 and 7566 respectively Besides itshould be pointed out that the TIC of PPLLE is 000258which is quite acceptable compared with those of the other3 models A strong support is also exhibited by Figure 5where the curve of PPLLE model intuitively shows the goodprediction accuracy and excellent ability in tracking theobserved EGT compared to the other 3 models
Figures 6(a)ndash6(d) show a detailed profile of relativepercentage error (RPE) between the observed values andprediction values of different models on the EGT testingdata samples It illustrates that the PPLLE model has anoutstanding approximation ability with the RPE rangingfrom minus07 to 09 the RPE ranging around [minus14 29]in Figure 6(d) shows that the single LSSVM has the worstperformance RPE distribution range of PPLLElowast model isbetter than that of RBF-chaos model which are exhibitedby Figures 6(c) and 6(d) Comparison results of Figure 6also prove the effectiveness of our proposed approach Someof the main reasons why the PPLLE model is superiorto others can be summarized as follows (1) the PPLLEensemble model based on kernel diverse principle eliminates
120 125 130 135 140 145 150690
700
710
720
730
740
750
Sample number
Observed dataPPLLE predicted data
RBF-chaos predicted dataSingle LSSVM predicted data
PPLLElowast predicted data
EGT
(∘C)
Figure 5 Prediction results of different models on EGT testingdataset
the possible inherent biases of single LSSVM and makes fulluse of the advantages of individual member LSSVMs (2) thePSR extracts the chaotic feature of the original data sourceand reconstructs data samples which elucidates the inputcharacteristic for the PPLLE model (3) the PSO ensure thateach individual LSSVM achieves the best performance (4)the particular ensemble strategy of PPLLE employs an MK-LSSVM and further enhances the prediction ability of theensemble model
5 Conclusions
Designing a high accuracy and robust model for AEPPprediction is quite challenging since AEPP data is nonlinearchaotic and small-sample and the traditional single predic-tion model may have some inherent biases To solve thisproblem and to realize high prediction accuracy level a newLSSVM ensemble model based on PSR and PSO is presentedand applied to AEPP prediction in this paper
For the presented PPLLE prediction model individualmember LSSVMs based on kernel diverse principle eliminatethe inherent biases of single LSSVM and make full use ofthe advantages of them as much as possible PSR is appliedto reconstruct data samples which alleviates the influence ofthe chaotic feature of the original data source to the PPLLEmodel PSO is used to guarantee that each individual LSSVMachieves the best performance The particular ensemblestrategy employs an MK-LSSVM combiner as the MKFintegrates the advantages of global kernel function and localkernel function and it offsets some shortages of both thisensemble strategy further enhances the prediction ability ofthe ensemble model
EGT is selected as the representative health monitoringparameter of aero engine for validating the effectiveness of the
Mathematical Problems in Engineering 7
120 125 130 135 140 145 150minus3
minus2
minus1
0
1
2
3
Sample number
EG
T RP
E
PPLLE(a) RPE of PPLLE
120 125 130 135 140 145 150minus3
minus2
minus1
0
1
2
3
Sample number
EG
T RP
E
PPLLElowast
(b) RPE of PPLLElowast
120 125 130 135 140 145 150minus3
minus2
minus1
0
1
2
3
Sample number
EG
T RP
E
RBF-chaos(c) RPE of RBF-chaos
120 125 130 135 140 145 150minus3
minus2
minus1
0
1
2
3
Sample number
EG
T RP
E
Single LSSVM
(d) RPE of single LSSVM
Figure 6 RPE comparison of different models on EGT testing dataset
proposed PPLLE model For comparison the PPLLElowast RBF-chaos and single LSSVMmodels are also developed and eval-uated The PPLLE predicts EGT with MAPE of 051 betterthan the PPLLElowast RBF-chaos and single LSSVMmodels withthose of 062 085 and 110 respectively Similarly thePPLLE predicts EGT with TIC of 000258 better than thePPLLElowast RBF-chaos and single LSSVM models with thoseof 000327 000485 and 000598 respectively In additionMAE andMSE indices also confirm that the presentedmodelgives improved prediction accuracy In a word the above fourevaluation indices consistently demonstrate that the PPLLEmodel is more suitable for AEPP prediction problem and thePPLLE model can meet the actual demand of engineeringapplication Moreover comparing results imply that thisensemble model has a promising application in other similarengineering areas where the data have complex nonlinearchaos relationships
Conflict of Interests
The authors declare that there is no conflict of interestsregarding the publication of this paper
References
[1] L-F Yang and I Ioachim ldquoAdaptive estimation of aircraft flightparameters for engine health monitoring systemrdquo Journal ofAircraft vol 39 no 3 pp 404ndash408 2002
[2] J Hong L Han X Miao et al ldquoFuzzy logic inference for pre-dicting aero-engine bearing grad-liferdquo in Proceedings of the 9thInternational Flins Conference on Computational IntelligenceFoundations and Applications vol 4 pp 367ndash373 ChengduChina August 2010
[3] G You and NWang ldquoAero-engine conditionmonitoring basedonKalmanfilter theoryrdquoAdvancedMaterials Research vol 490ndash495 no 4 pp 176ndash181 2012
8 Mathematical Problems in Engineering
[4] N-B Zhao J-L Yang S-Y Li and Y-W Sun ldquoA GM (1 1)Markov chain-based aeroengine performance degradation fore-cast approach using exhaust gas temperaturerdquo MathematicalProblems in Engineering vol 2014 Article ID 832851 11 pages2014
[5] Z G Liu Z J Cai and XM Tan ldquoForecasting research of aero-engine rotate speed signal based on ARMA modelrdquo ProcediaEngineering vol 15 pp 115ndash121 2011
[6] Y-X Song K-X Zhang and Y-S Shi ldquoResearch on aeroengineperformance parameters forecast based on multiple linearregression forecastingmethodrdquo Journal of Aerospace Power vol24 no 2 pp 427ndash431 2009 (Chinese)
[7] C Chatfield The Analysis of Time Series An IntroductionChapmanampHallCRC BocaRaton Fla USA 6th edition 2003
[8] S G Luan S S Zhong and Y Li ldquoHybrid recurrent processneural network for aero engine condition monitoringrdquo NeuralNetwork World vol 18 no 2 pp 133ndash145 2008
[9] D Gang and S S Zhong ldquoAircraft engine lubricating oilmonitoring by process neural networkrdquo Neural Network Worldvol 16 no 1 pp 15ndash24 2006
[10] C Zhang and N Wang ldquoAero-engine condition monitoringbased on support vector machinerdquo Physics Procedia vol 24 pp1546ndash1552 2012
[11] X-Y Fu and S-S Zhong ldquoAeroengine turbine exhaust gastemperature prediction using process support vectormachinesrdquoinAdvances in Neural NetworksmdashSNN 2013 vol 7951 of LectureNotes in Computer Science pp 300ndash310 Springer Berlin Ger-many 2013
[12] J A K Suykens and J Vandewalle ldquoLeast squares supportvector machine classifiersrdquo Neural Processing Letters vol 9 no3 pp 293ndash300 1999
[13] J A K Suykens T Van Gestel J De Brabanter B DeMoor andJ Vandewalle Least Squares Support Vector Machines WorldScientific Singapore 2002
[14] X Yan and N A Chowdhury ldquoMid-term electricity marketclearing price forecasting a hybrid LSSVM and ARMAXapproachrdquo International Journal of Electrical Power amp EnergySystems vol 53 no 1 pp 20ndash26 2013
[15] Z-D Tian X-W Gao and T Shi ldquoCombination kernel func-tion least squares support vector machine for chaotic timeseries predictionrdquo Acta Physica Sinica vol 63 no 16 Article ID160508 2014 (Chinese)
[16] O Cagcag Yolcu ldquoA hybrid fuzzy time series approach based onfuzzy clustering and artificial neural network with single multi-plicative neuronmodelrdquoMathematical Problems in Engineeringvol 2013 Article ID 560472 9 pages 2013
[17] L Yu W Y Yue S Y Wang and K K Lai ldquoSupport vectormachine based multiagent ensemble learning for credit riskevaluationrdquo Expert Systems with Applications vol 37 no 2 pp1351ndash1360 2010
[18] Y Lv J Liu T Yang andD Zeng ldquoA novel least squares supportvector machine ensemble model for NO
119909emission prediction
of a coal-fired boilerrdquo Energy vol 55 pp 319ndash329 2013[19] Q Zhang P W-T Tse X Wan and G Xu ldquoRemaining useful
life estimation for mechanical systems based on similarity ofphase space trajectoryrdquo Expert Systems with Applications vol42 no 5 pp 2353ndash2360 2015
[20] B F Feeny and G Lin ldquoFractional derivatives applied to phase-space reconstructionsrdquoNonlinear Dynamics vol 38 no 1ndash4 pp85ndash99 2004
[21] L Su and C Li ldquoLocal prediction of chaotic time series basedon polynomial coefficient autoregressive modelrdquoMathematicalProblems in Engineering vol 2015 Article ID 901807 14 pages2015
[22] Y B Yuan and X H Yuan ldquoAn improved PSO approach toshort-term economic dispatch of cascaded hydropower plantsrdquoKybernetes vol 39 no 8 pp 1359ndash1365 2010
[23] L Wang Y G Li M F Abdul Ghafir and A Swingler ldquoARough Set-based gas turbine fault classification approach usingenhanced fault signaturesrdquo Proceedings of the Institution ofMechanical Engineers vol 225 no 8 pp 1052ndash1065 2011
[24] Z Y Zhang T Wang and X G Liu ldquoMelt index prediction byaggregated RBF neural networks trained with chaotic theoryrdquoNeurocomputing vol 131 pp 368ndash376 2014
Submit your manuscripts athttpwwwhindawicom
Hindawi Publishing Corporationhttpwwwhindawicom Volume 2014
MathematicsJournal of
Hindawi Publishing Corporationhttpwwwhindawicom Volume 2014
Mathematical Problems in Engineering
Hindawi Publishing Corporationhttpwwwhindawicom
Differential EquationsInternational Journal of
Volume 2014
Applied MathematicsJournal of
Hindawi Publishing Corporationhttpwwwhindawicom Volume 2014
Probability and StatisticsHindawi Publishing Corporationhttpwwwhindawicom Volume 2014
Journal of
Hindawi Publishing Corporationhttpwwwhindawicom Volume 2014
Mathematical PhysicsAdvances in
Complex AnalysisJournal of
Hindawi Publishing Corporationhttpwwwhindawicom Volume 2014
OptimizationJournal of
Hindawi Publishing Corporationhttpwwwhindawicom Volume 2014
CombinatoricsHindawi Publishing Corporationhttpwwwhindawicom Volume 2014
International Journal of
Hindawi Publishing Corporationhttpwwwhindawicom Volume 2014
Operations ResearchAdvances in
Journal of
Hindawi Publishing Corporationhttpwwwhindawicom Volume 2014
Function Spaces
Abstract and Applied AnalysisHindawi Publishing Corporationhttpwwwhindawicom Volume 2014
International Journal of Mathematics and Mathematical Sciences
Hindawi Publishing Corporationhttpwwwhindawicom Volume 2014
The Scientific World JournalHindawi Publishing Corporation httpwwwhindawicom Volume 2014
Hindawi Publishing Corporationhttpwwwhindawicom Volume 2014
Algebra
Discrete Dynamics in Nature and Society
Hindawi Publishing Corporationhttpwwwhindawicom Volume 2014
Hindawi Publishing Corporationhttpwwwhindawicom Volume 2014
Decision SciencesAdvances in
Discrete MathematicsJournal of
Hindawi Publishing Corporationhttpwwwhindawicom
Volume 2014 Hindawi Publishing Corporationhttpwwwhindawicom Volume 2014
Stochastic AnalysisInternational Journal of
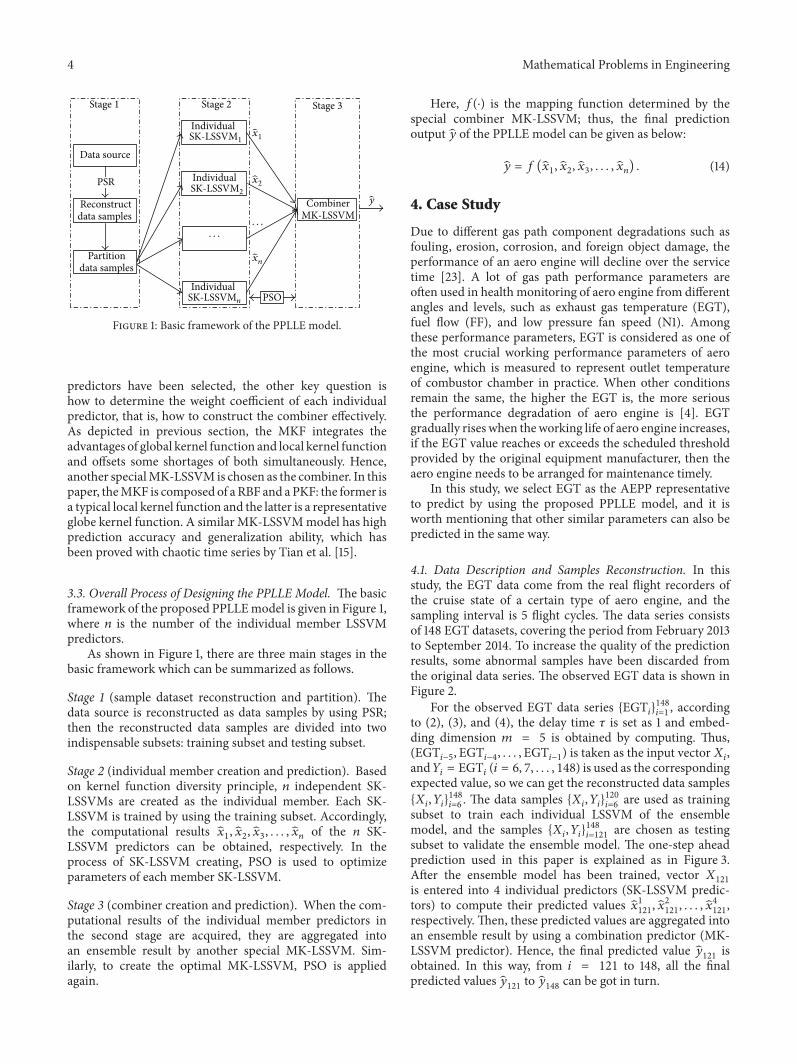
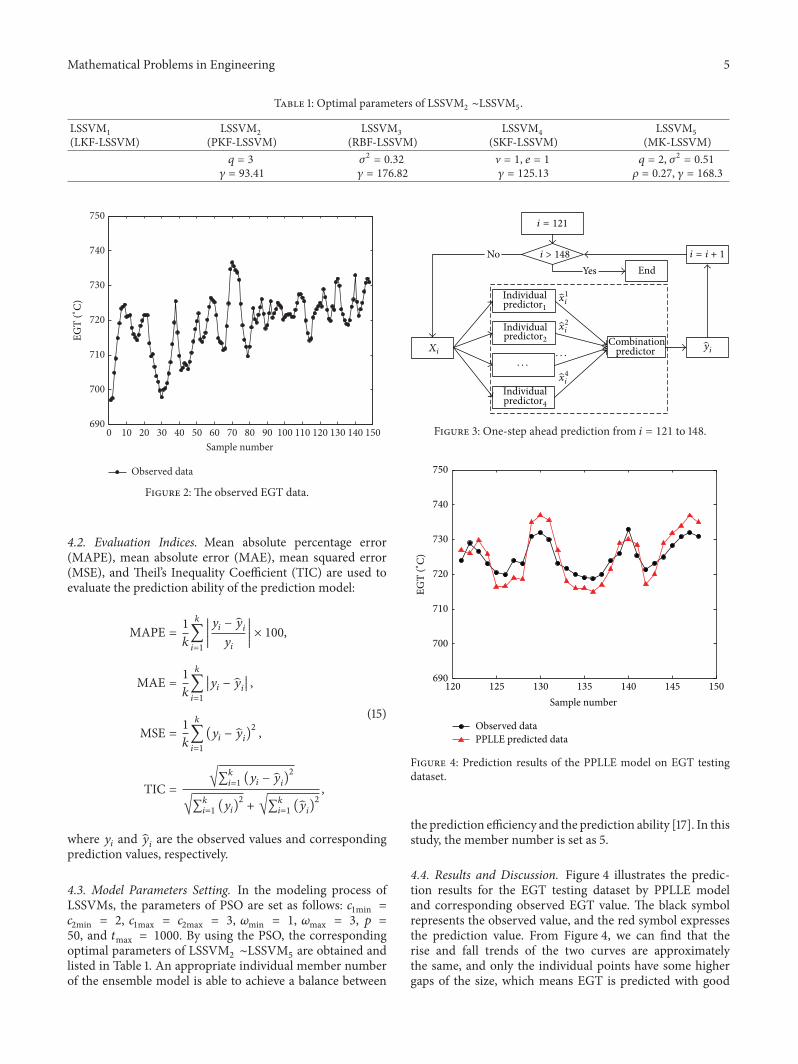
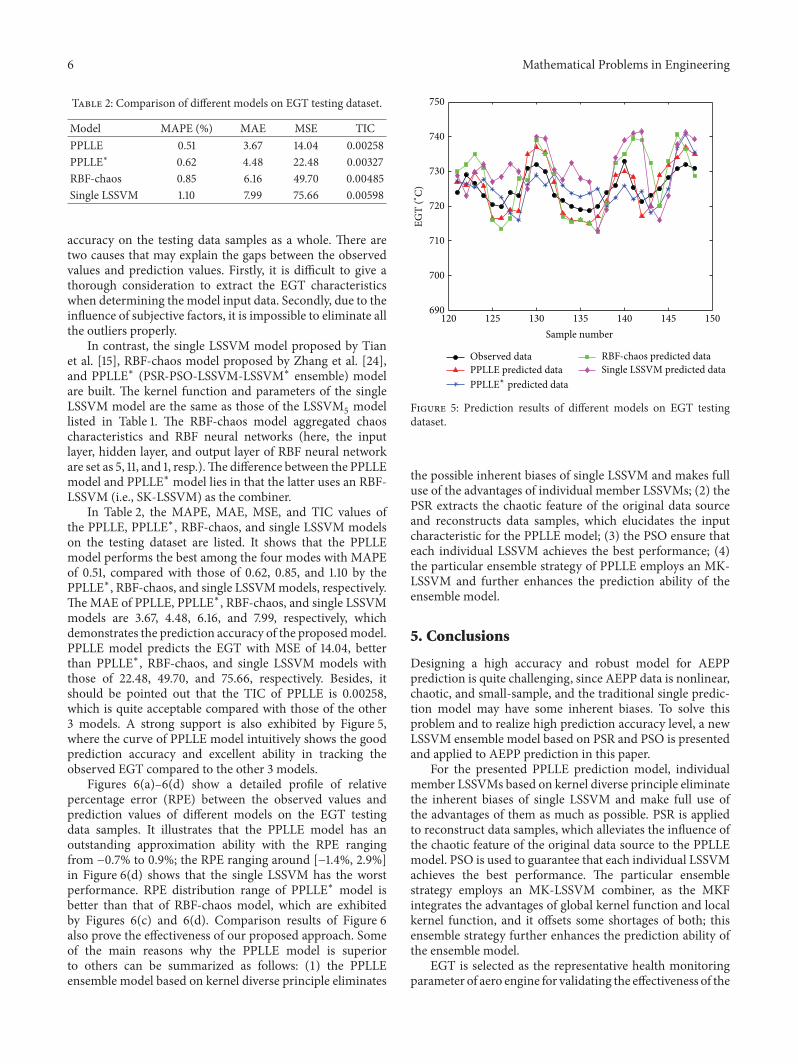
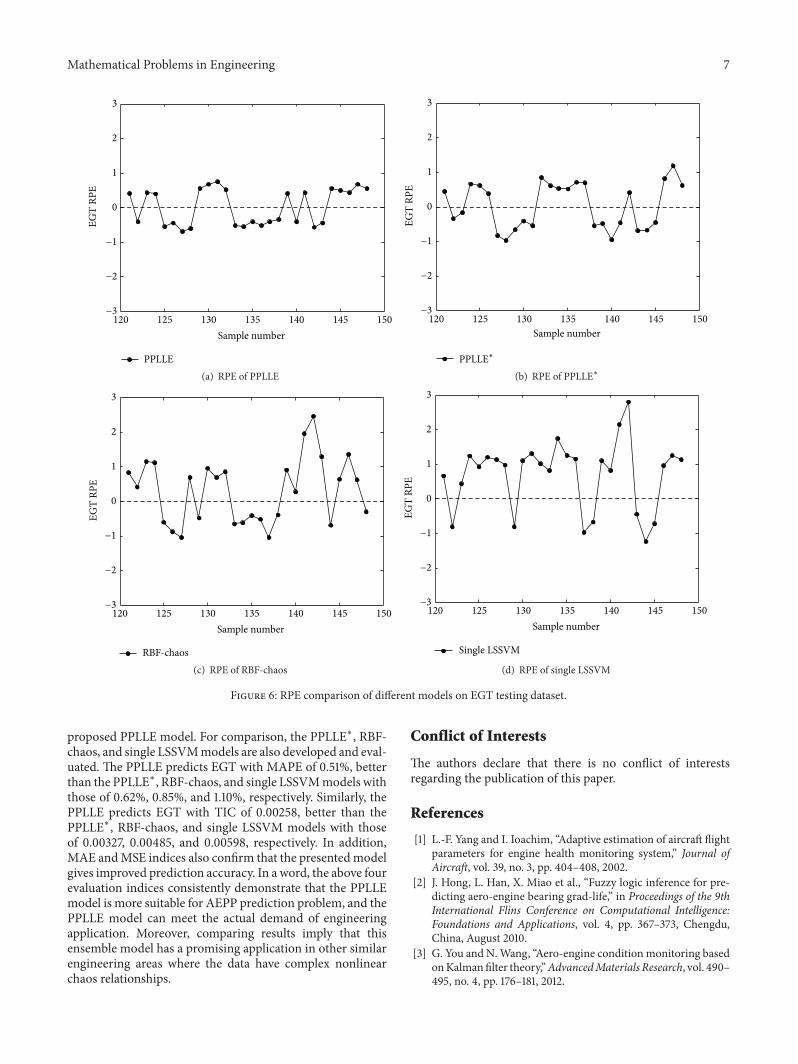


![Robust energy-based least squares twin support vector machines · Robust energy-based least squares twin support vector machines 175 support vector machine (LSTSVM) [14] has been](https://img.pdfslide.us/doc/110x75/5b47bc007f8b9aa4148d0ec7/robust-energy-based-least-squares-twin-support-vector-machines-robust-energy-based.jpg)