Embed Size (px)
Citation preview
October 12, 2011
Smart Grid Reliability ResearchOctober 12, 2011Research
Research & Technology M tManagement
Joe SchatzJoe Schatz
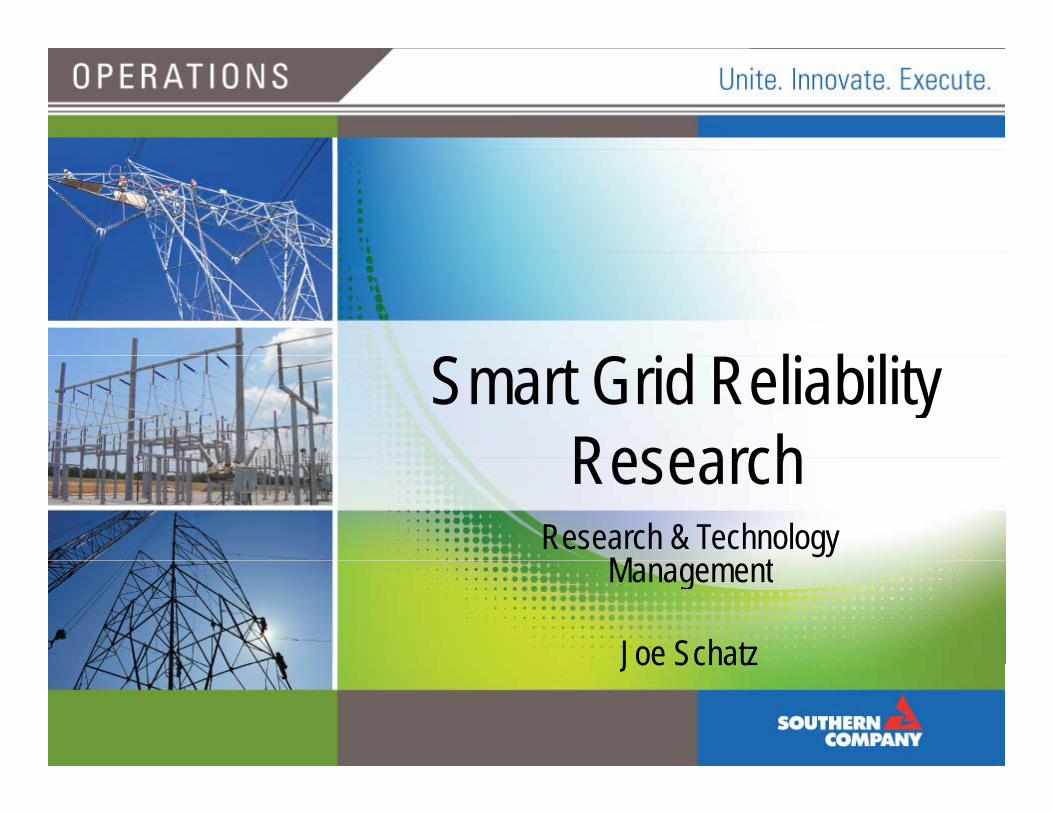
• Consider BAU, but continue investigation of SVCs, synch condensers, UVLS
Transmission Reliability Thoughts• Modeling different load and source types – as well as geographic locations• Analytics and Accurate Models (FIDVR & GenVARR)• Sensor Development and Demonstrationp• ZED Meter• Smart Inverters• As well as • As well as …
– Transmission and Distribution Automation – Increasing DFR installations– System MonitoringSystem Monitoring– PMUs– Asset Management– Augmented Reality and visualization
S th ’ PMU A hit tV θVeθe
SOUTH HALLBOWEN
MILLERVfθf
NORCROSS
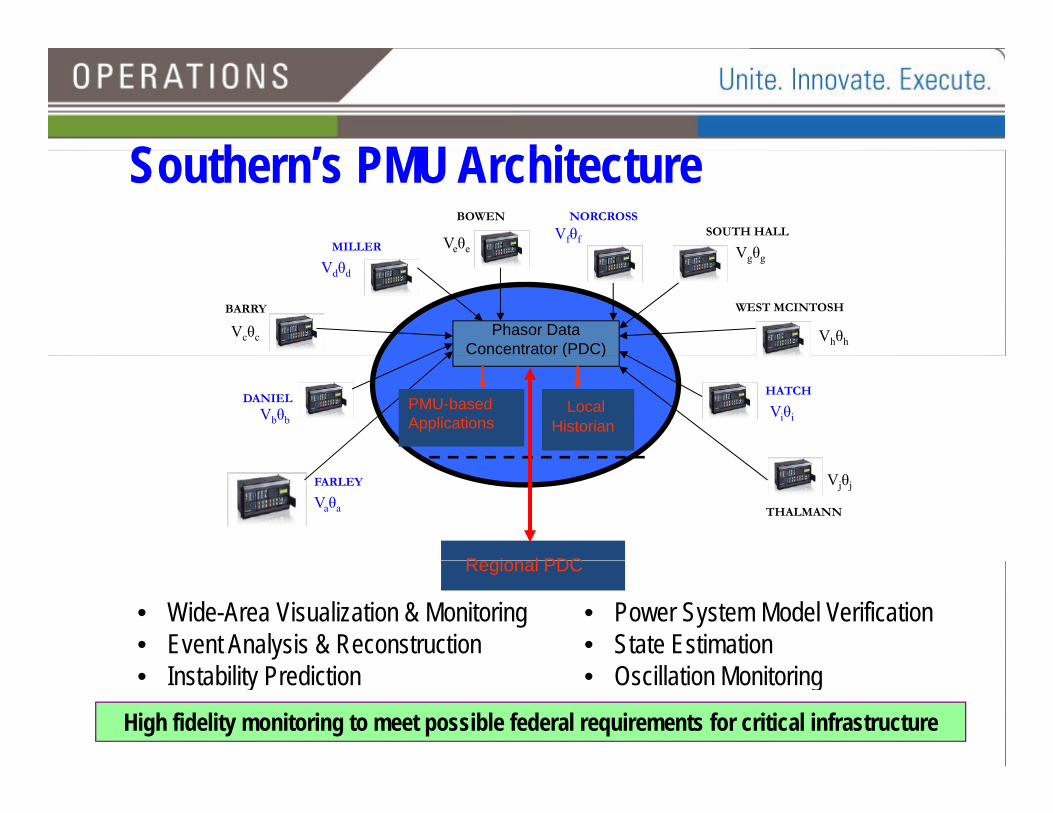
Southern’s PMU ArchitectureVgθg
Vdθd
Phasor Data Concentrator (PDC)
Vcθc
BARRY WEST MCINTOSH
Vhθh
HATCH
Vbθb Viθi
DANIEL
( )
Local Historian
PMU-based Applications
Vjθj
R i l PDC
Vaθa
FARLEY
THALMANN
Regional PDC
• Wide-Area Visualization & Monitoring• Event Analysis & Reconstruction
• Power System Model Verification• State Estimation
High fidelity monitoring to meet possible federal requirements for critical infrastructure
• Instability Prediction • Oscillation Monitoring
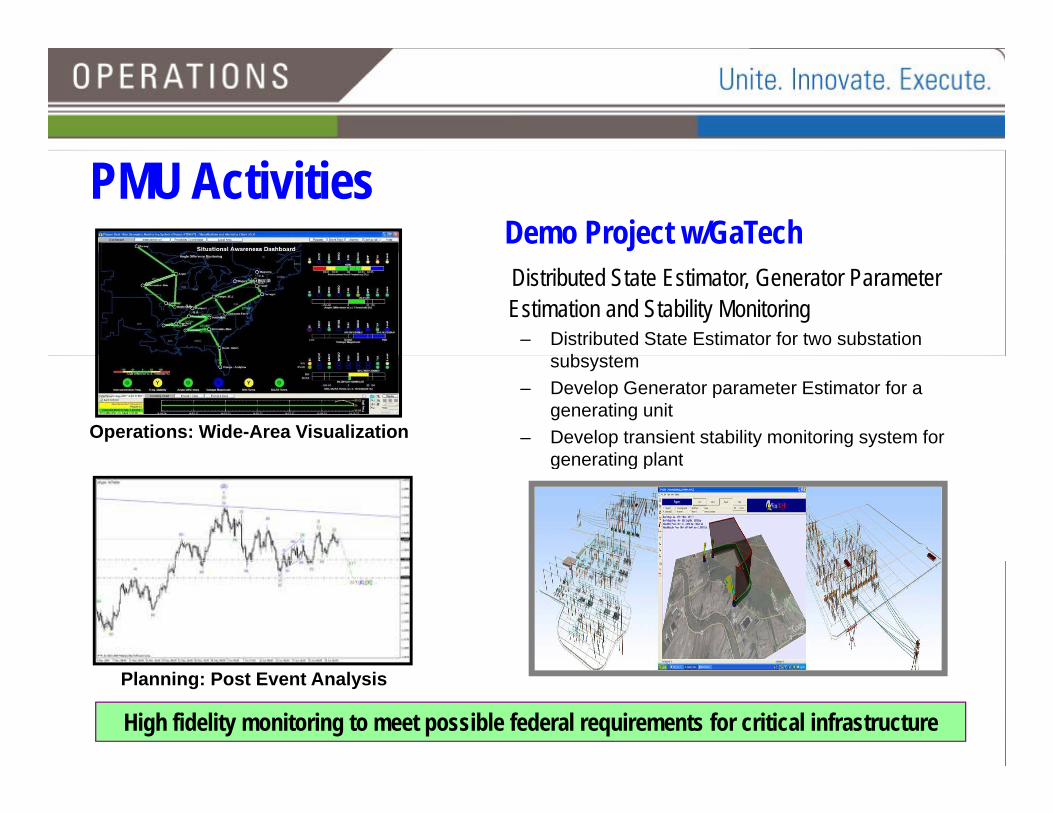
Demo Project w/GaTechPMU Activities
Distributed State Estimator, Generator Parameter Estimation and Stability Monitoring
– Distributed State Estimator for two substation b t
Operations: Wide-Area Visualization
subsystem– Develop Generator parameter Estimator for a
generating unit– Develop transient stability monitoring system for
generating plantgenerating plant
Planning: Post Event Analysis
High fidelity monitoring to meet possible federal requirements for critical infrastructure
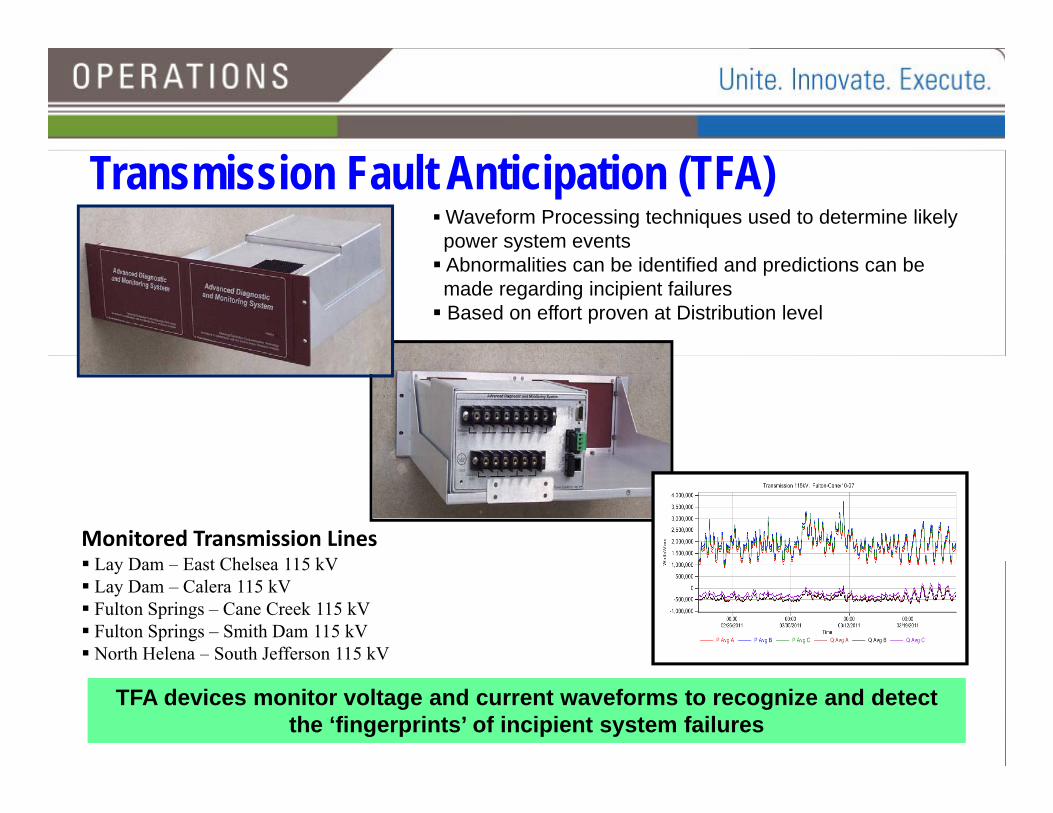
Transmission Fault Anticipation (TFA)Waveform Processing techniques used to determine likely power system events Abnormalities can be identified and predictions can be made regarding incipient failures Based on effort proven at Distribution level
Monitored Transmission LinesL D E t Ch l 115 kV Lay Dam – East Chelsea 115 kV Lay Dam – Calera 115 kV Fulton Springs – Cane Creek 115 kV Fulton Springs – Smith Dam 115 kV North Helena – South Jefferson 115 kV
TFA devices monitor voltage and current waveforms to recognize and detect the ‘fingerprints’ of incipient system failures
TFA devices monitor voltage and current waveforms to recognize and detect the ‘fingerprints’ of incipient system failures
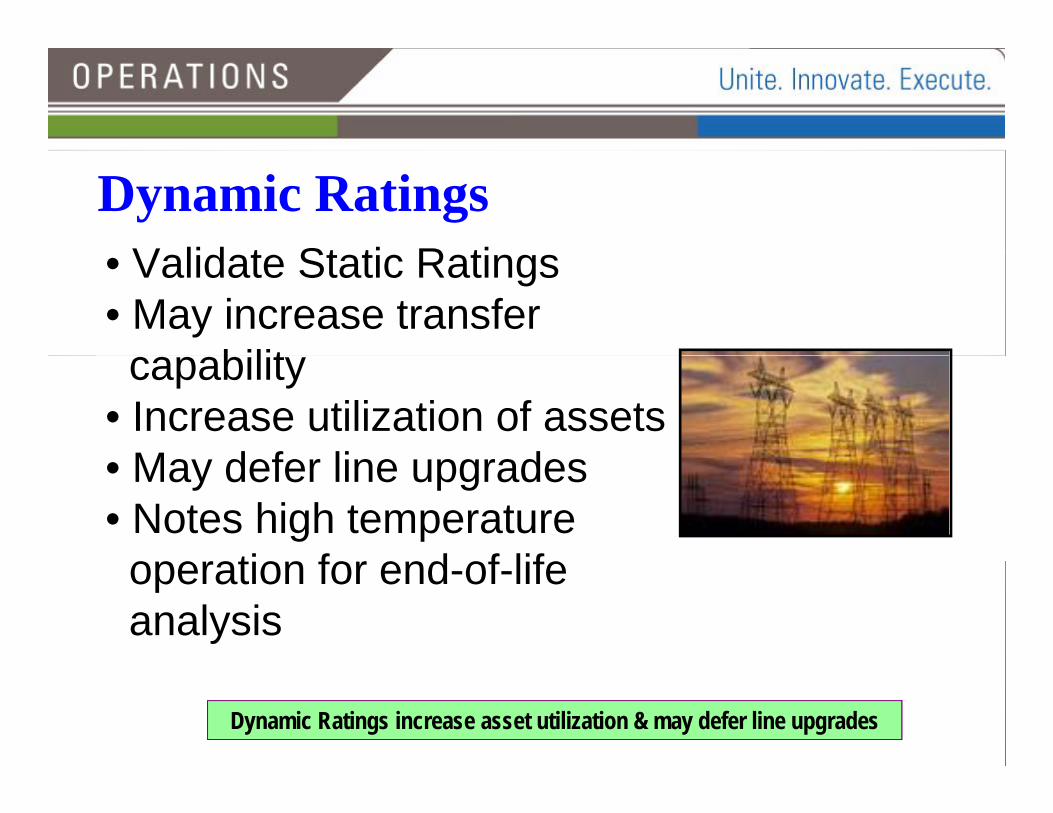
Dynamic RatingsV lid t St ti R ti• Validate Static Ratings
• May increase transfer bilitcapability
• Increase utilization of assetsM d f li d• May defer line upgrades
• Notes high temperature ti f d f lifoperation for end-of-life
analysis
Dynamic Ratings increase asset utilization & may defer line upgrades
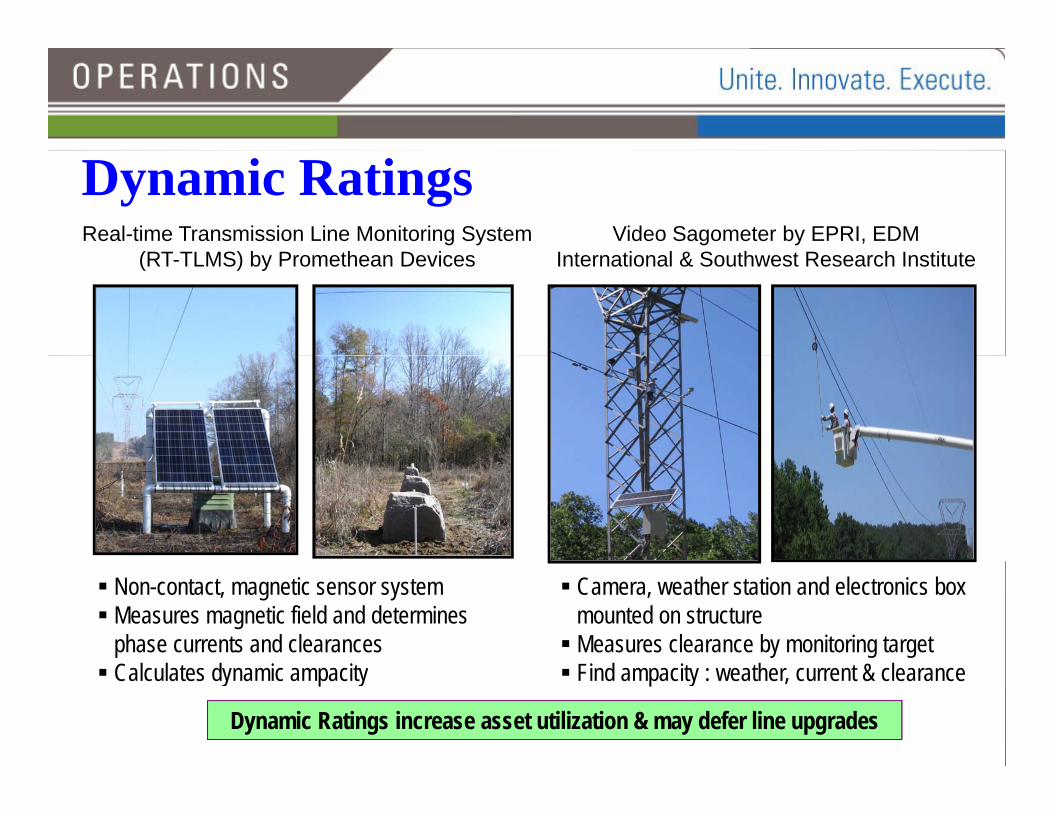
Dynamic RatingsReal-time Transmission Line Monitoring System
(RT TLMS) b P th D iVideo Sagometer by EPRI, EDM
I t ti l & S th t R h I tit t(RT-TLMS) by Promethean Devices International & Southwest Research Institute
Non-contact, magnetic sensor system Measures magnetic field and determines
phase currents and clearances
Camera, weather station and electronics box mounted on structure Measures clearance by monitoring target
Dynamic Ratings increase asset utilization & may defer line upgrades
Calculates dynamic ampacity Find ampacity : weather, current & clearance
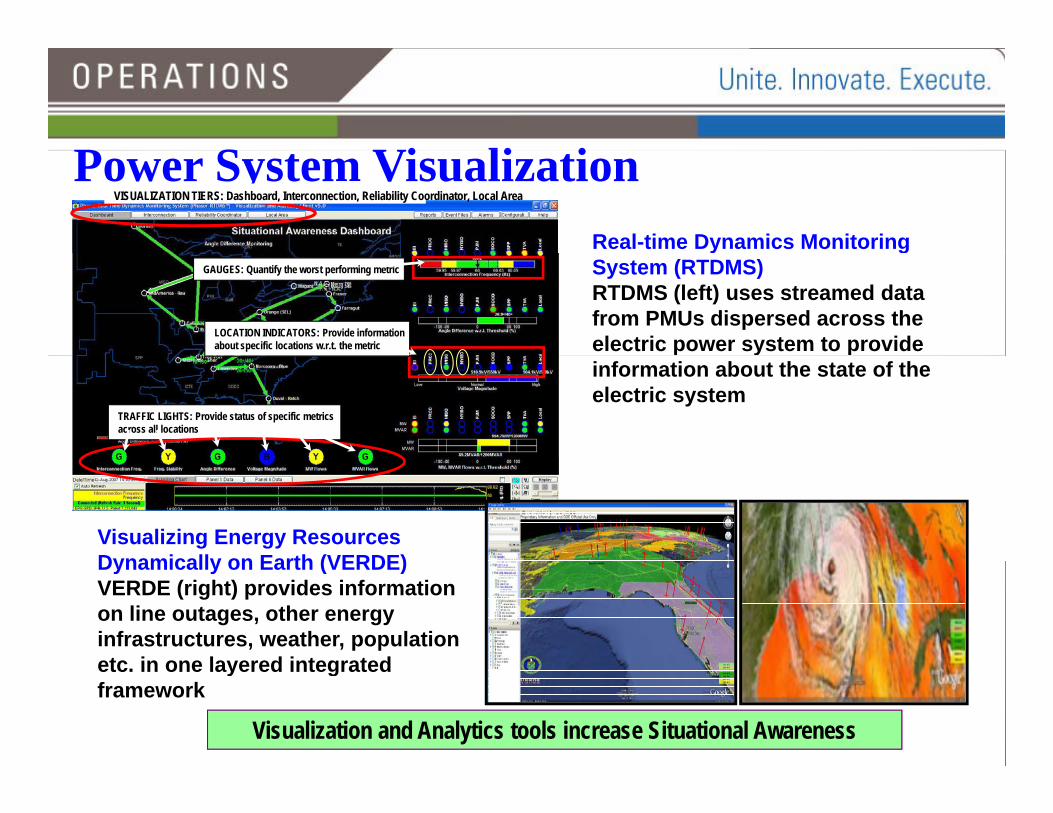
P S Vi li iPower System VisualizationVISUALIZATION TIERS: Dashboard, Interconnection, Reliability Coordinator, Local Area
Real-time Dynamics Monitoring GAUGES: Quantify the worst performing metric
LOCATION INDICATORS: Provide informationabout specific locations w.r.t. the metric
y gSystem (RTDMS) RTDMS (left) uses streamed data from PMUs dispersed across the electric power system to provide
TRAFFIC LIGHTS: Provide status of specific metrics across all locations
yinformation about the state of the electric system
Visualizing Energy Resources Dynamically on Earth (VERDE)Dynamically on Earth (VERDE)VERDE (right) provides information on line outages, other energy infrastructures, weather, population etc in one layered integrated
Visualization and Analytics tools increase Situational Awareness
etc. in one layered integrated framework
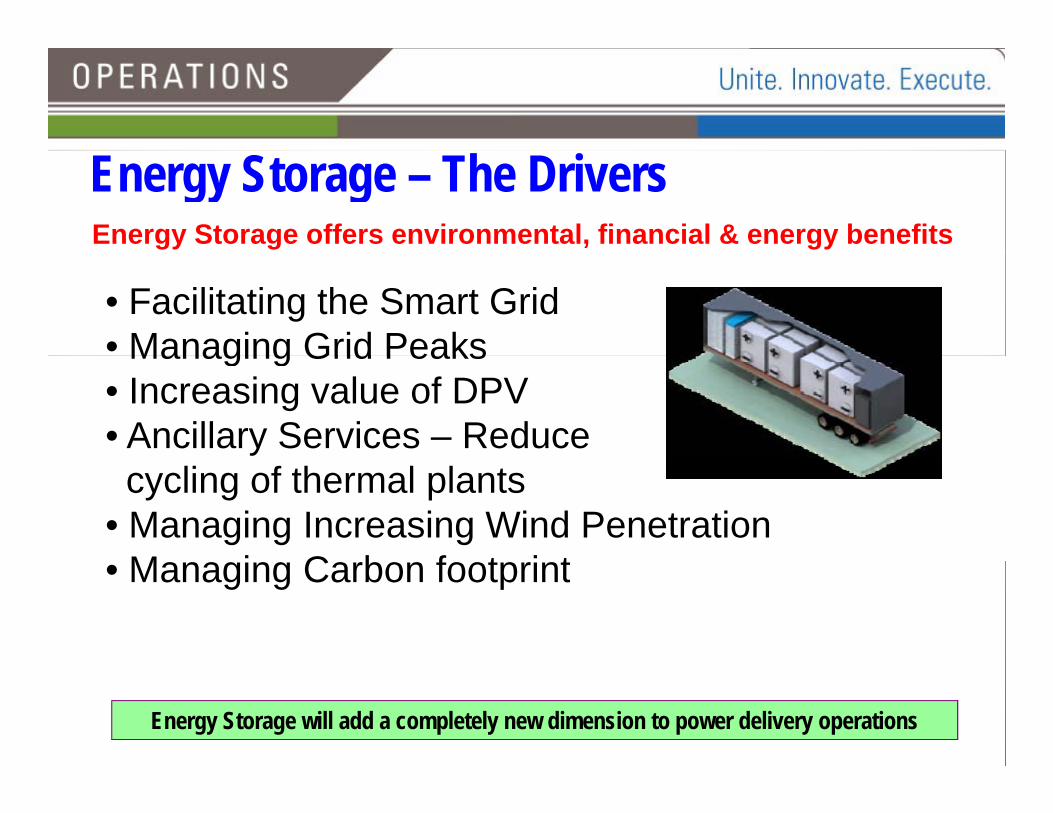
Energy Storage – The DriversEnergy Storage offers environmental, financial & energy benefits
• Facilitating the Smart Grid• Managing Grid PeaksManaging Grid Peaks • Increasing value of DPV• Ancillary Services – Reduce cycling of thermal plants
• Managing Increasing Wind PenetrationM i C b f t i t• Managing Carbon footprint
Energy Storage will add a completely new dimension to power delivery operations
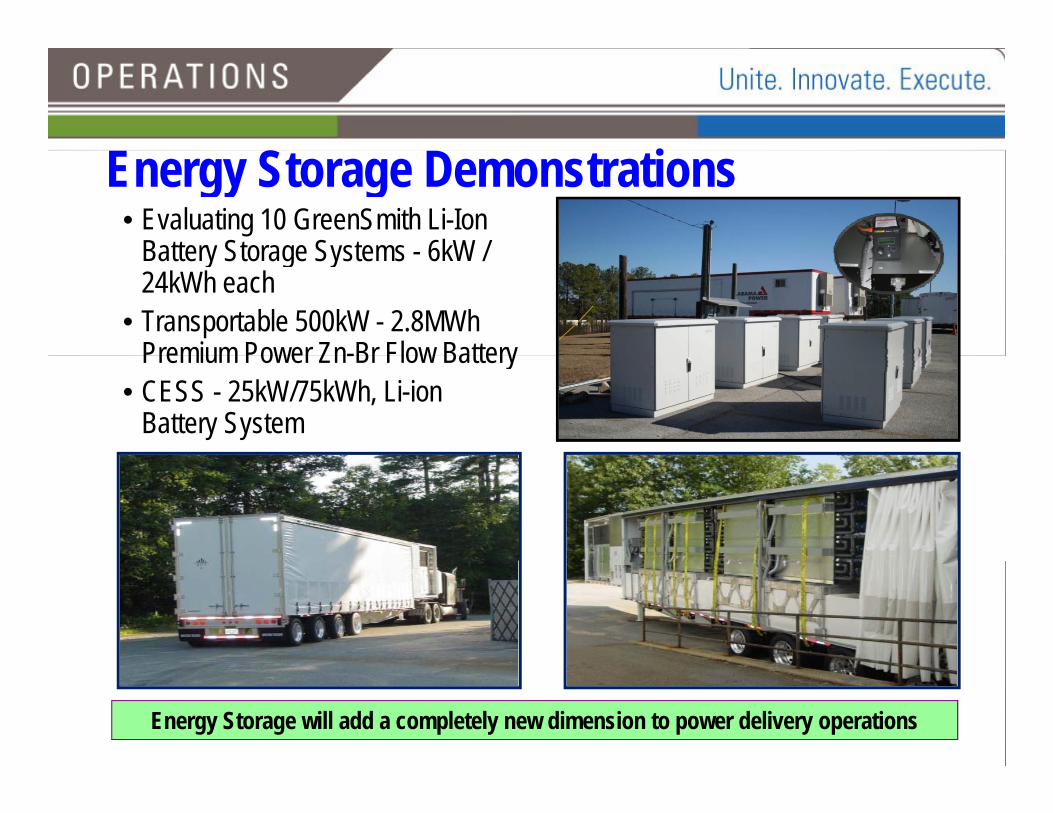
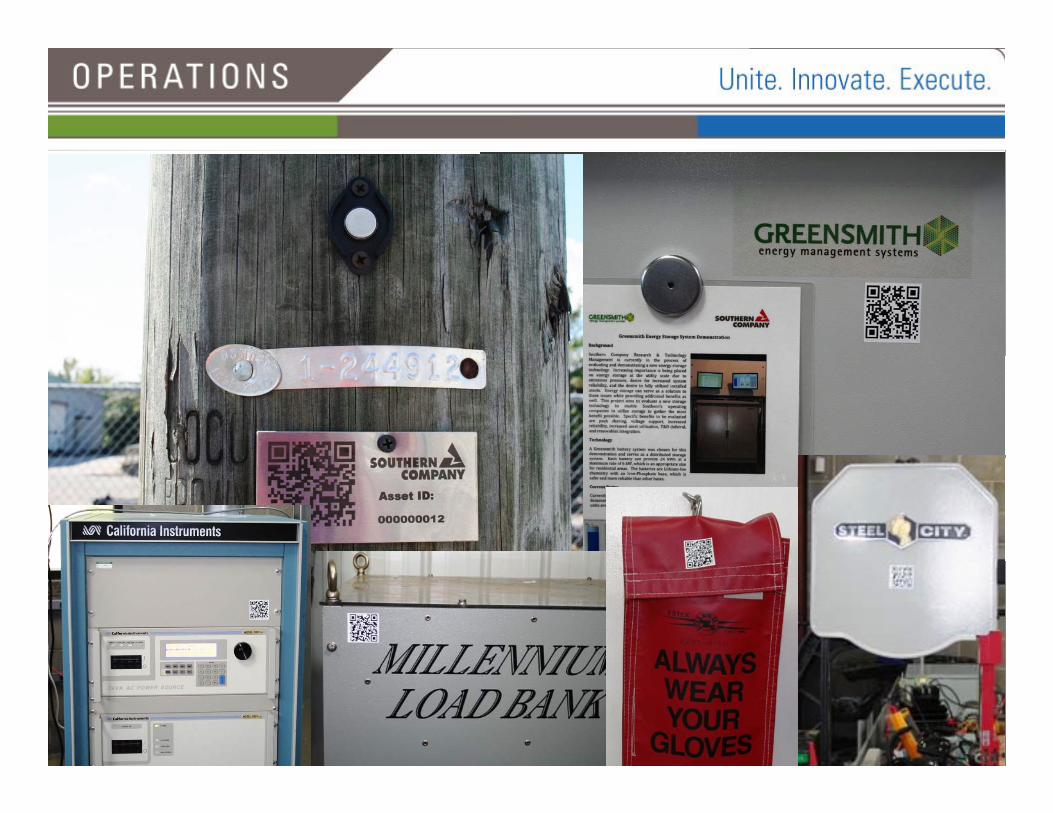
S• Evaluating 10 GreenSmith Li-Ion
Battery Storage Systems - 6kW /
Energy Storage DemonstrationsBattery Storage Systems - 6kW / 24kWh each
• Transportable 500kW - 2.8MWh Premium Power Zn-Br Flow BatteryPremium Power Zn-Br Flow Battery
• CESS - 25kW/75kWh, Li-ion Battery System
Energy Storage will add a completely new dimension to power delivery operations
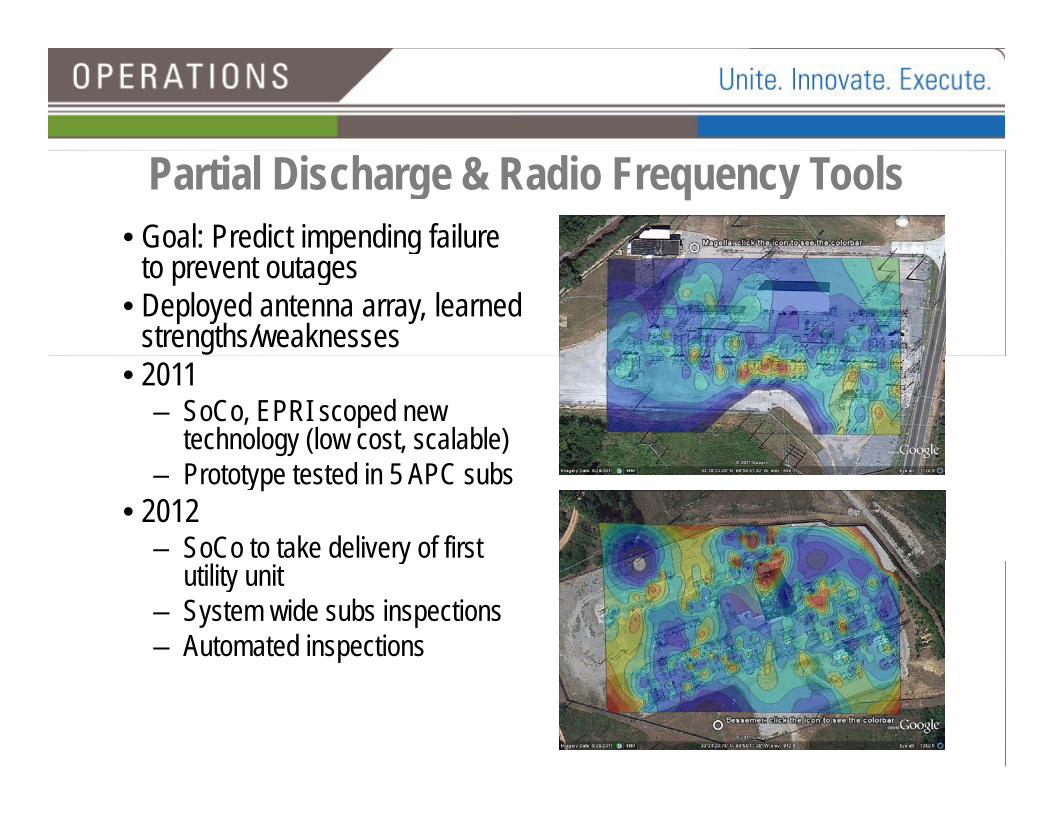
Partial Discharge & Radio Frequency Tools• Goal: Predict impending failure p g
to prevent outages• Deployed antenna array, learned
strengths/weaknesses• 2011
– SoCo, EPRI scoped new technology (low cost, scalable)
– Prototype tested in 5 APC subs• 2012
– SoCo to take delivery of first yutility unit
– System wide subs inspections– Automated inspections
Sensors
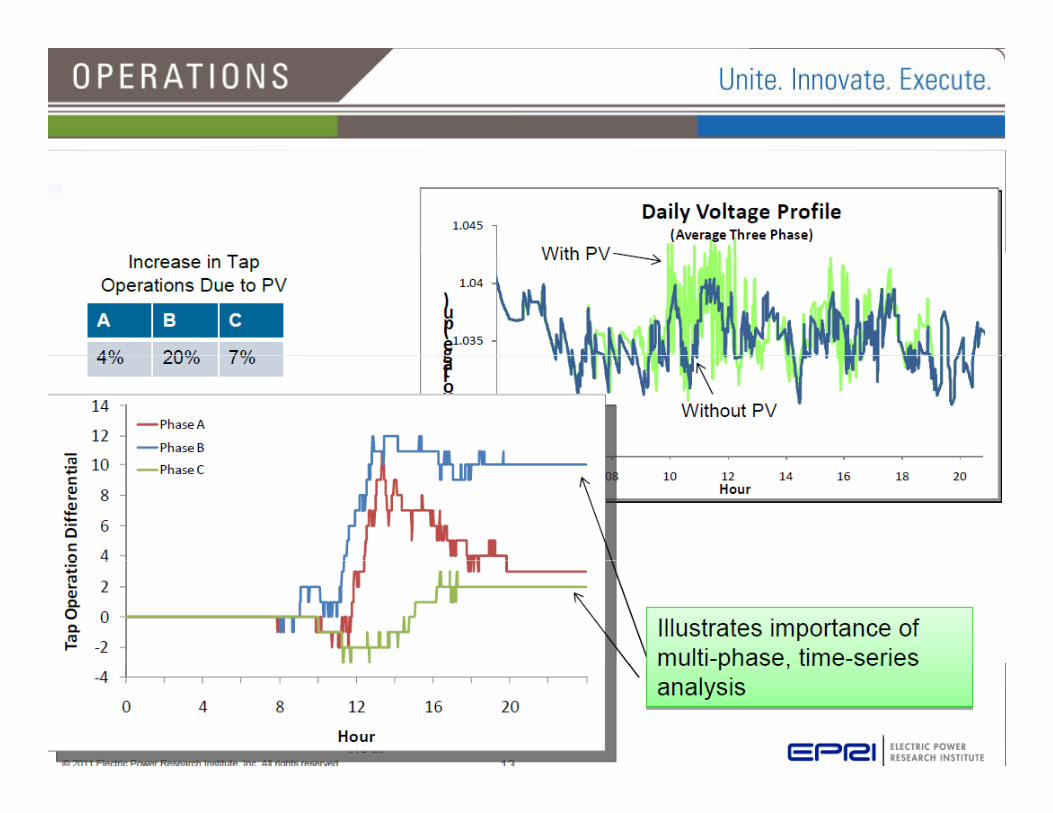
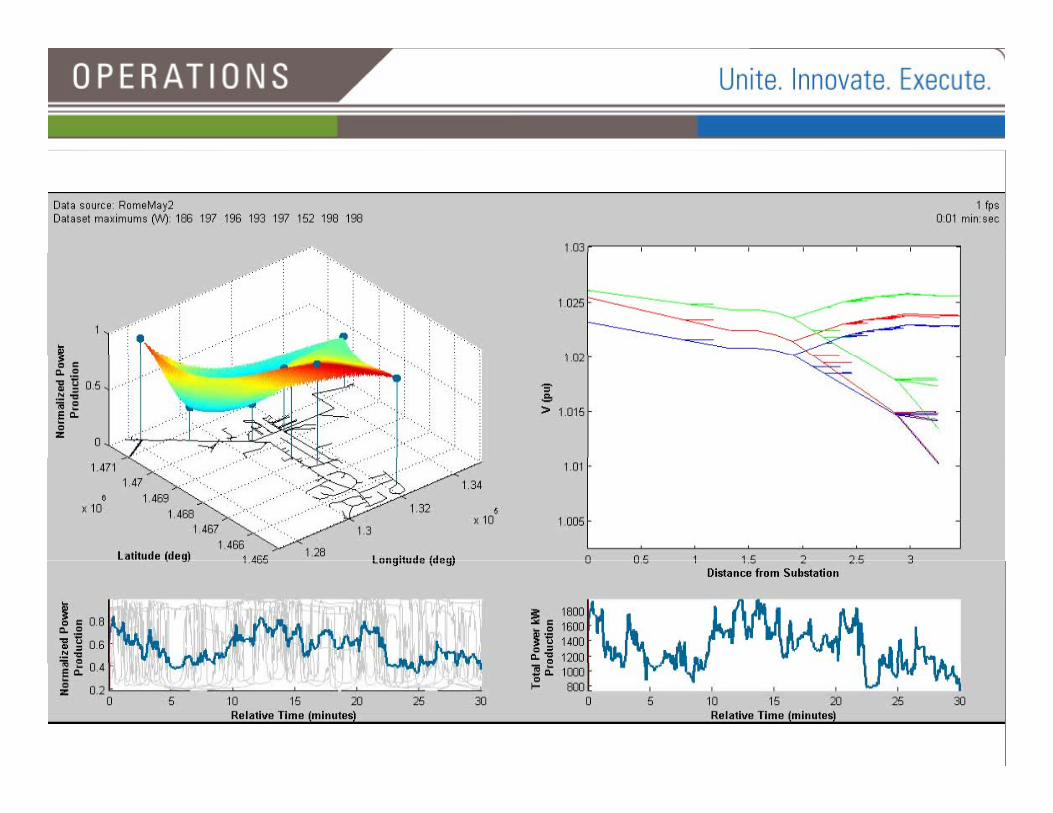
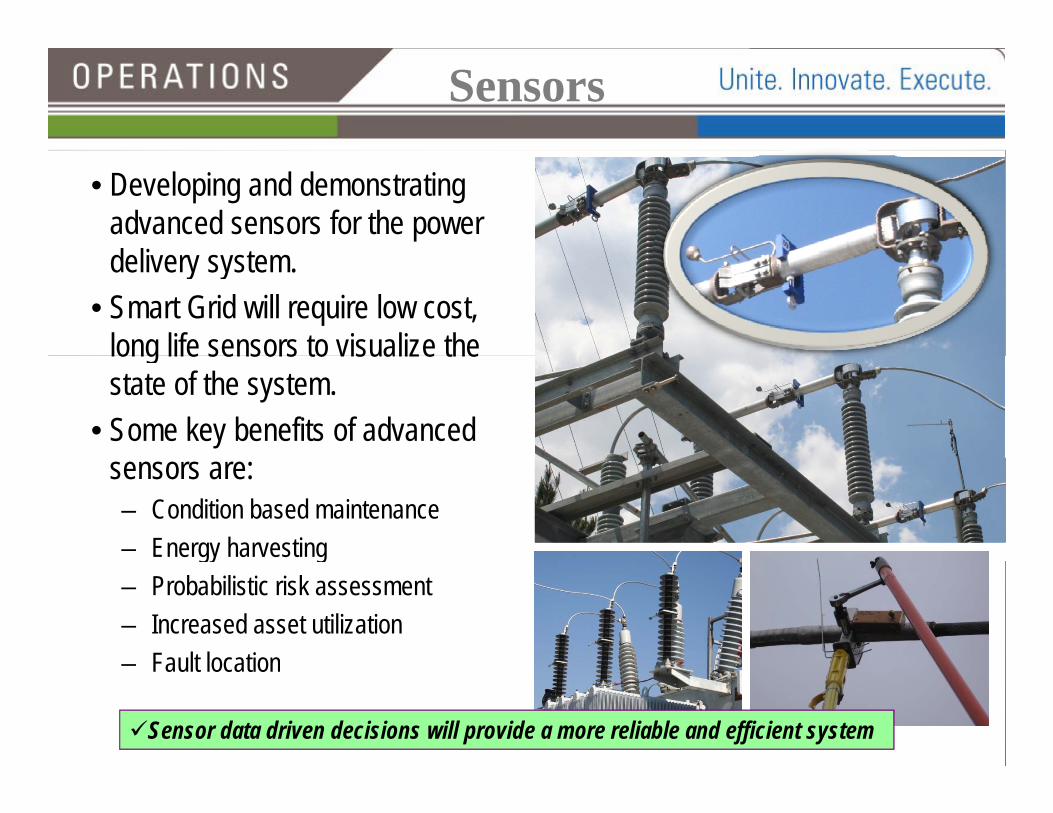
• Developing and demonstrating advanced sensors for the power d li tdelivery system.
• Smart Grid will require low cost, long life sensors to visualize the long life sensors to visualize the state of the system.
• Some key benefits of advanced sensors are:
– Condition based maintenance– Energy harvestinggy g– Probabilistic risk assessment– Increased asset utilization
Fault location– Fault location
Sensor data driven decisions will provide a more reliable and efficient system
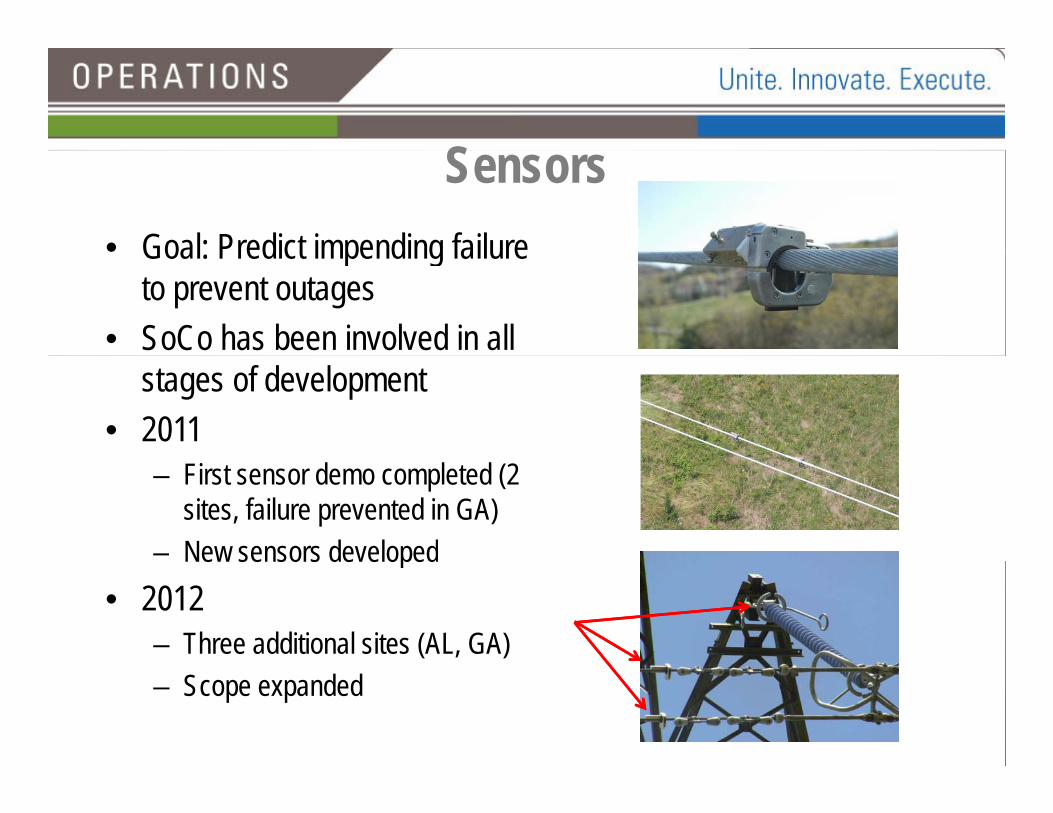
SSensors• Goal: Predict impending failure Goal: Predict impending failure
to prevent outages• SoCo has been involved in all
stages of development• 2011
– First sensor demo completed (2 sites, failure prevented in GA)
– New sensors developedNew sensors developed• 2012
– Three additional sites (AL, GA)– Scope expanded
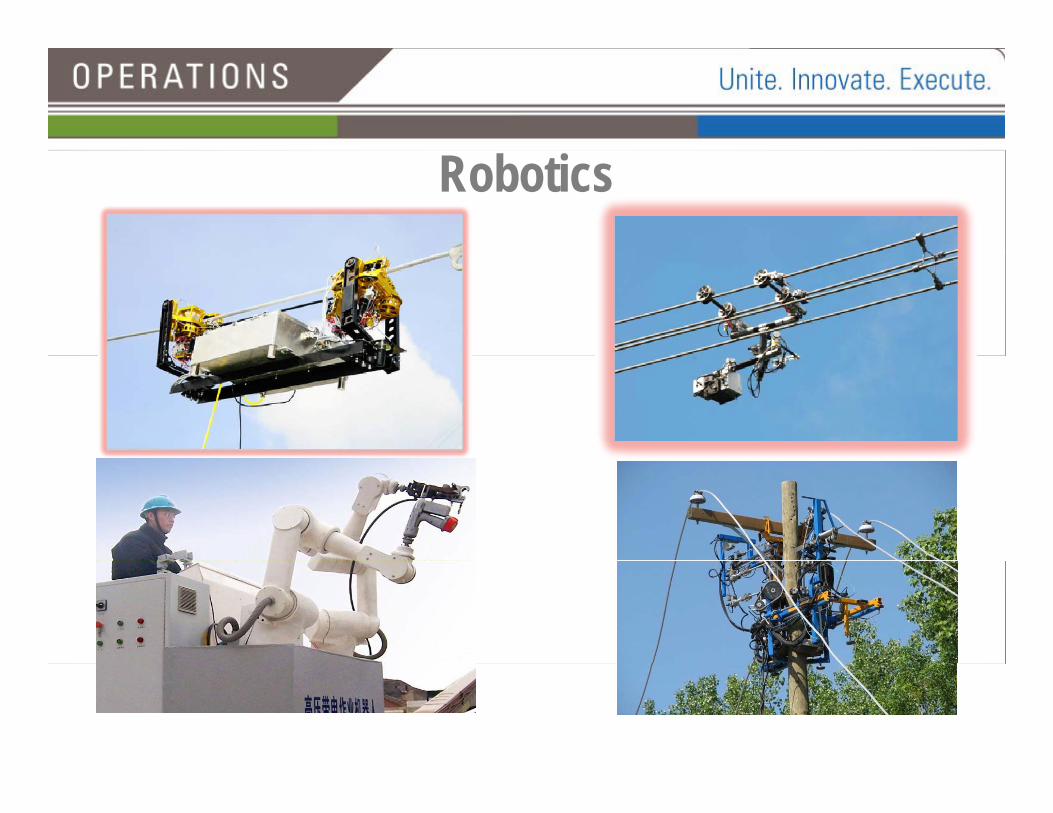
Robotics
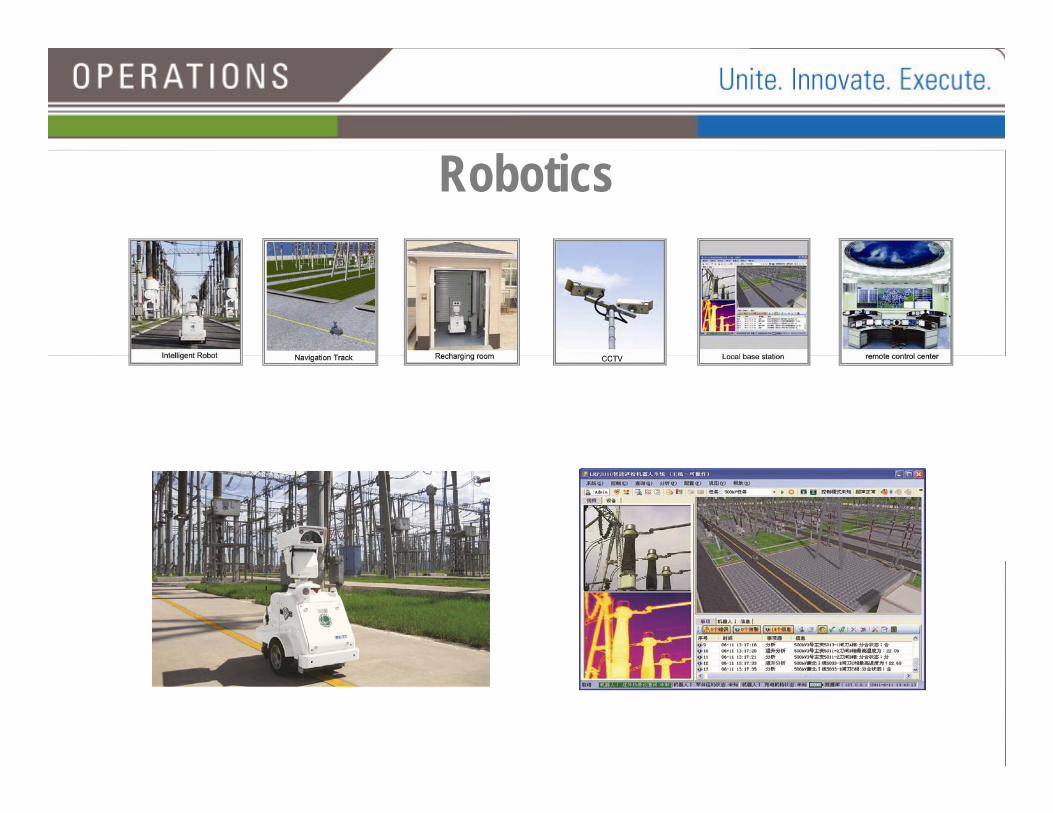
Robotics
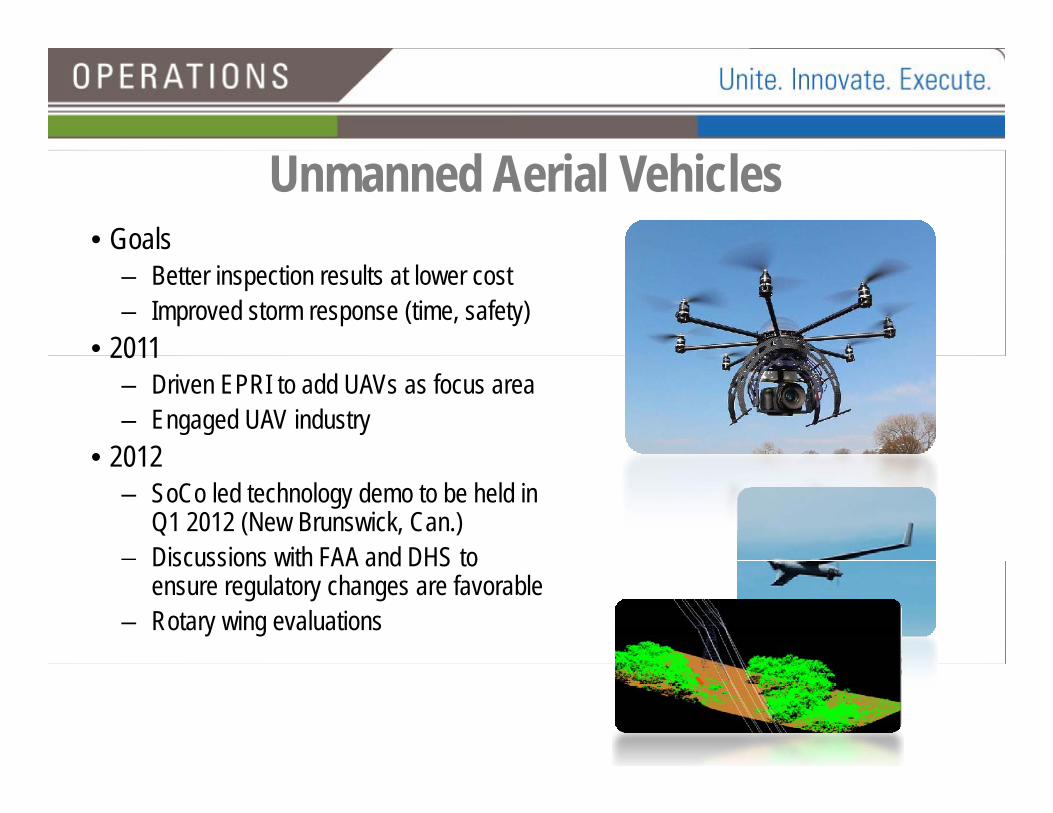
Unmanned Aerial Vehicles• Goals
– Better inspection results at lower cost– Improved storm response (time, safety)
• 20112011– Driven EPRI to add UAVs as focus area– Engaged UAV industry
• 2012• 2012– SoCo led technology demo to be held in
Q1 2012 (New Brunswick, Can.) – Discussions with FAA and DHS to Discussions with FAA and DHS to
ensure regulatory changes are favorable– Rotary wing evaluations
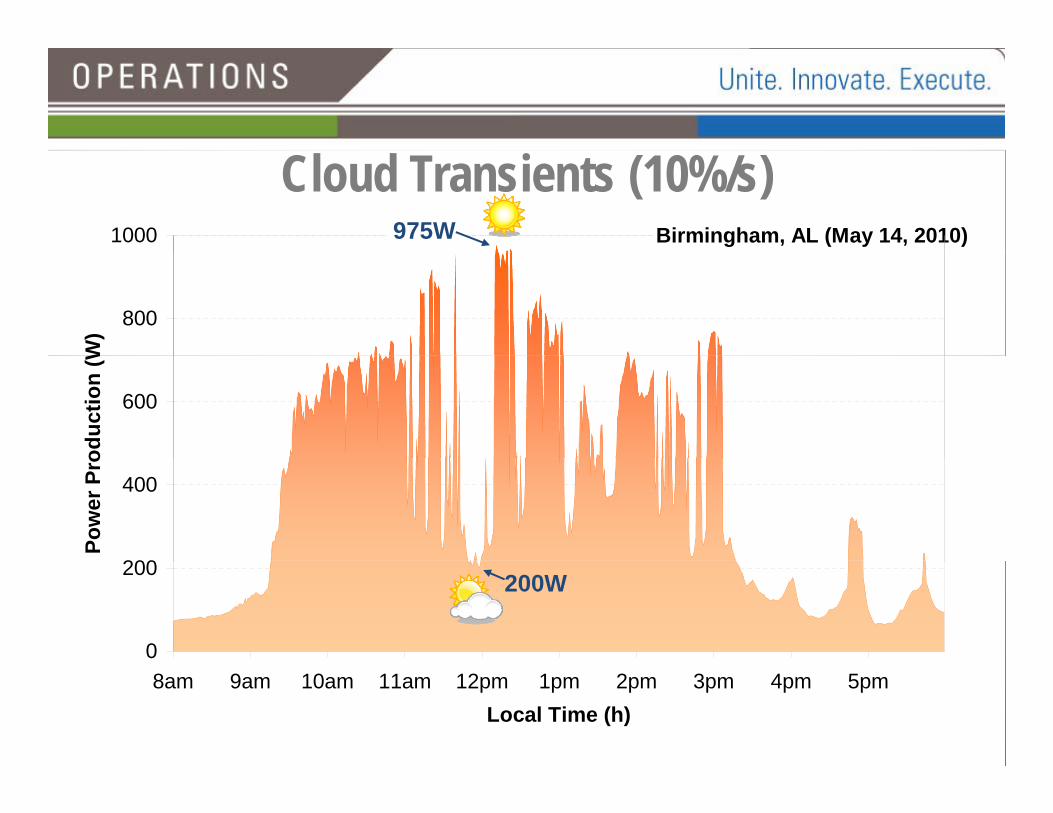
Cloud Transients (10%/s)Birmingham, AL (May 14, 2010)1000 975W
800
W)
600
oduc
tion
(W
200
400
Pow
er P
ro
0
200 200W
8am 9am 10am 11am 12pm 1pm 2pm 3pm 4pm 5pmLocal Time (h)