Embed Size (px)
Citation preview

RISK TAKING AND ACCIDENTS ON IRISH FARMSAN ANALYSIS OF THE 2013 HEALTH AND SAFETY AUTHORITY SURVEYDOROTHY WATSON, OONA KENNY, BERTRAND MAÎTRE AND HELEN RUSSELL
RESEARCH SERIES NUMBER 60 May 2017
EVIDENCE FOR POLICY
RISK TAKING AND ACCIDENTS ON IRISH FARMS
An analysis of the 2013 Health and Safety Authority survey
Dorothy Watson, Oona Kenny, Bertrand Maître, Helen Russell
May 2017
RESEARCH SERIES
NUMBER 60
Available to download from www.esri.ie
© The Economic and Social Research Institute Whitaker Square, Sir John Rogerson’s Quay, Dublin 2
ISBN 978 0 7070 0426 6
ABOUT THE ESRI
The mission of the Economic and Social Research Institute is to advance evidence-
based policymaking that supports economic sustainability and social progress in
Ireland. ESRI researchers apply the highest standards of academic excellence to
challenges facing policymakers, focusing on 12 areas of critical importance to 21st
century Ireland.
The Institute was founded in 1960 by a group of senior civil servants led by
Dr T.K. Whitaker, who identified the need for independent and in-depth research
analysis to provide a robust evidence base for policymaking in Ireland.
Since then, the Institute has remained committed to independent research and its
work is free of any expressed ideology or political position. The Institute publishes
all research reaching the appropriate academic standard, irrespective of its
findings or who funds the research.
The quality of its research output is guaranteed by a rigorous peer review process.
ESRI researchers are experts in their fields and are committed to producing work
that meets the highest academic standards and practices.
The work of the Institute is disseminated widely in books, journal articles and
reports. ESRI publications are available to download, free of charge, from its
website. Additionally, ESRI staff communicate research findings at regular
conferences and seminars.
The ESRI is a company limited by guarantee, answerable to its members and
governed by a Council, comprising 14 members who represent a cross-section of
ESRI members from academia, civil services, state agencies, businesses and civil
society. The Institute receives an annual grant-in-aid from the Department of
Public Expenditure and Reform to support the scientific and public interest
elements of the Institute’s activities; the grant accounted for an average of 30 per
cent of the Institute’s income over the lifetime of the last Research Strategy. The
remaining funding comes from research programmes supported by government
departments and agencies, public bodies and competitive research programmes.
Further information is available at www.esri.ie.

THE AUTHORS
Dorothy Watson is an Associate Research Professor at the ESRI and Adjunct
Professor at the Department of Sociology, Trinity College Dublin. She is joint
coordinator of the ESRI’s research areas of Social Inclusion and Equality.
Oona Kenny is a Research Assistant in the Social Research Division of the ESRI.
Bertrand Maître is a Senior Research Officer at the ESRI and Adjunct at Trinity
College Dublin.
Helen Russell is an Associate Research Professor at the ESRI and an Adjunct
Professor at Trinity College Dublin. She is Deputy Head of the Social Research
division at the ESRI and is the principal investigator on the joint ESRI/HSA research
programme, Health, Safety and Well-being at Work.
ACKNOWLEDGEMENTS
This report is published as part of the ESRI and the Health and Safety Authority’s
(HSA) research programme, Health, Safety and Well-being at Work. The authors
are grateful to the members of the ESRI/HSA research steering group, Nuala Flavin
(HSA), Robert Roe (HSA), Sharon McGuinness (HSA), Anne Drummond (UCD),
James Phelan (UCD and HSA) and Anne Nolan (ESRI), who gave generously of their
time and expertise and provided helpful discussions and comments throughout the
research and drafting process. The final draft of the report was also enhanced by
insightful comments from two ESRI reviewers, an anonymous external reviewer
and staff members of the HSA.
We also thank the two anonymous peer reviewers and our colleagues Emer Smyth
and Alan Barrett, who provided valuable comments.
Neither the HSA nor the ESRI is responsible for the content of the report, which is
the independent work of the authors.
The paper has been accepted for publication by the Institute, which does not itself take institutional
policy positions. All ESRI Research Series reports are peer reviewed. The authors are solely responsible
for the content and the views expressed.

i|Table of contents
TABLE OF CONTENTS
ACRONYMS ............................................................................................................................................. V
GLOSSARY............................................................................................................................................... VI
EXECUTIVE SUMMARY .......................................................................................................................... IX
CHAPTER 1 INTRODUCTION .................................................................................................................. 1
1.1 Background and rationale for this study ............................................................................ 1
1.2 Previous research on the farm sector ................................................................................ 4
1.3 The HSA farm study ............................................................................................................ 8
1.4 Research questions for this study ...................................................................................... 9
1.5 Methodology .................................................................................................................... 10
1.6 Outline of report............................................................................................................... 16
CHAPTER 2 CHARACTERISTICS OF THE FARMER AND THE FARM ....................................................... 17
2.1 Introduction ...................................................................................................................... 17
2.2 Characteristics of HSA farm study of farmers and farms ................................................. 17
2.3 Risk taking ......................................................................................................................... 20
2.4 Experience of farm accidents or near misses ................................................................... 21
2.5 Farmer distress ................................................................................................................. 23
2.6 Stress related to farm work .............................................................................................. 24
2.7 Summary .......................................................................................................................... 25
Chapter 3 PREDICTORS OF RISK TAKING ........................................................................................... 27
3.1 Introduction ...................................................................................................................... 27
3.2 Overall risk taking scale .................................................................................................... 27
3.3 Types of risk taking ........................................................................................................... 31
3.4 Work-related stress and worker distress ......................................................................... 32
3.5 Summary .......................................................................................................................... 33
Chapter 4 FACTORS ASSOCIATED WITH FARM ACCIDENTS .............................................................. 35
4.1 Introduction ...................................................................................................................... 35
4.2 Factors associated with any accident or near miss .......................................................... 36
4.3 Factors associated with different types of accidents and near misses ............................ 38
4.4 Summary .......................................................................................................................... 39

Risk taking and accidents on Irish farms|ii
Chapter 5 CONCLUSIONS AND IMPLICATIONS .................................................................................. 41
5.1 Introduction ...................................................................................................................... 41
5.2 Risk taking ......................................................................................................................... 42
5.3 Farmer distress and work stress ....................................................................................... 43
5.4 Accidents and near misses ............................................................................................... 44
5.5 Limitations and future research ....................................................................................... 45
5.6 Policy discussion ............................................................................................................... 45
REFERENCES .......................................................................................................................................... 48

iii|List of tables and figures
LIST OF TABLES
Table 2.1 Risky work behaviour scale (6 items) descriptive statistics ............................................. 20
Table 2.2 Distress scale (5 items) descriptive statistics ................................................................... 24
Table 2.3 Work-related stress scale (4 items) descriptive statistics ................................................ 25
Table 3.1 Factors associated with risk taking (odds ratios) ............................................................. 30
Table 3.2 Factors associated with types of risk taking (odds ratios) ............................................... 32
Table 3.3 Factors associated with types of risk taking – models including distress (odds ratios) ... 33
Table 4.1 Factors associated with any accident or near miss (odds ratios) ..................................... 37
Table 4.2 Factors associated with different types of accident or near miss (odds ratios) .............. 39
LIST OF FIGURES
Figure 1.1 Worker fatalities per 100,000 workers, selected sectors, average 2009–2015 ................. 1
Figure 1.2 Worker fatalities per 100,000 workers in the Agricultural sector, annual average 2008–
2013 .................................................................................................................................... 2
Figure 1.3 Rate of injury (any days lost) per 1,000 workers, selected sectors, 2010–2014 ................ 3
Figure 1.4 Rate of injuries per 1,000 workers with 4+ days lost, selected sectors, 2010–2014 ......... 3
Figure 1.5 Comparison between surveys of farmers’ age ................................................................. 13
Figure 1.6 Comparison between surveys of farm size ...................................................................... 14
Figure 1.7 Farm type in the unweighted and weighted HSA survey data ......................................... 15
Figure 2.1 Characteristics of farmers and farms ............................................................................... 18
Figure 2.2 Part-time farming by farmer age, farm size and type ...................................................... 19
Figure 2.3 The occurrence of accidents on the farm over the last 10 years ..................................... 22
Figure 2.4 Percentage of farmers reporting accidents leading to work absence of 0–3 days or 4 or
more days ......................................................................................................................... 23
Figure 3.1 Farmers in top decile on risk taking scale by farmer and farm characteristics ................ 28
Figure 4.1 Farmers involved in any accident depending on farmer and farm characteristics .......... 36

Risk taking and accidents on Irish farms|v
ACRONYMS
ANOVA Analysis of variation
CSO Central Statistics Office
ESAW European Statistics on Accidents at Work
FSPAC Farm Safety Partnership Advisory Committee
HSA Health and Safety Authority
LFA Less-favoured areas
NUTS Nomenclature of Territorial Units for Statistics
PTO Power take-off
QNHS Quarterly National Household Survey
WHO World Health Organization
vi|Glossary
GLOSSARY
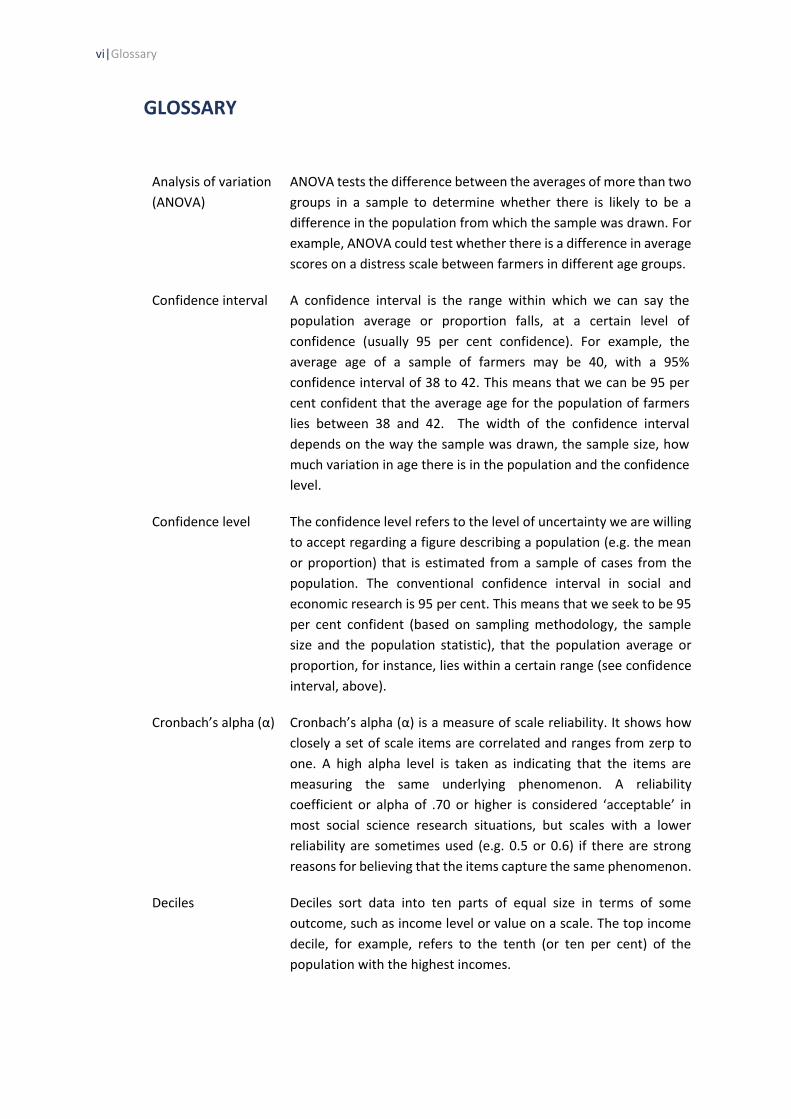
Analysis of variation
(ANOVA)
ANOVA tests the difference between the averages of more than two
groups in a sample to determine whether there is likely to be a
difference in the population from which the sample was drawn. For
example, ANOVA could test whether there is a difference in average
scores on a distress scale between farmers in different age groups.
Confidence interval A confidence interval is the range within which we can say the
population average or proportion falls, at a certain level of
confidence (usually 95 per cent confidence). For example, the
average age of a sample of farmers may be 40, with a 95%
confidence interval of 38 to 42. This means that we can be 95 per
cent confident that the average age for the population of farmers
lies between 38 and 42. The width of the confidence interval
depends on the way the sample was drawn, the sample size, how
much variation in age there is in the population and the confidence
level.
Confidence level The confidence level refers to the level of uncertainty we are willing
to accept regarding a figure describing a population (e.g. the mean
or proportion) that is estimated from a sample of cases from the
population. The conventional confidence interval in social and
economic research is 95 per cent. This means that we seek to be 95
per cent confident (based on sampling methodology, the sample
size and the population statistic), that the population average or
proportion, for instance, lies within a certain range (see confidence
interval, above).
Cronbach’s alpha (α) Cronbach’s alpha (α) is a measure of scale reliability. It shows how
closely a set of scale items are correlated and ranges from zerp to
one. A high alpha level is taken as indicating that the items are
measuring the same underlying phenomenon. A reliability
coefficient or alpha of .70 or higher is considered ‘acceptable’ in
most social science research situations, but scales with a lower
reliability are sometimes used (e.g. 0.5 or 0.6) if there are strong
reasons for believing that the items capture the same phenomenon.
Deciles Deciles sort data into ten parts of equal size in terms of some
outcome, such as income level or value on a scale. The top income
decile, for example, refers to the tenth (or ten per cent) of the
population with the highest incomes.
Risk taking and accidents on Irish farms|vii
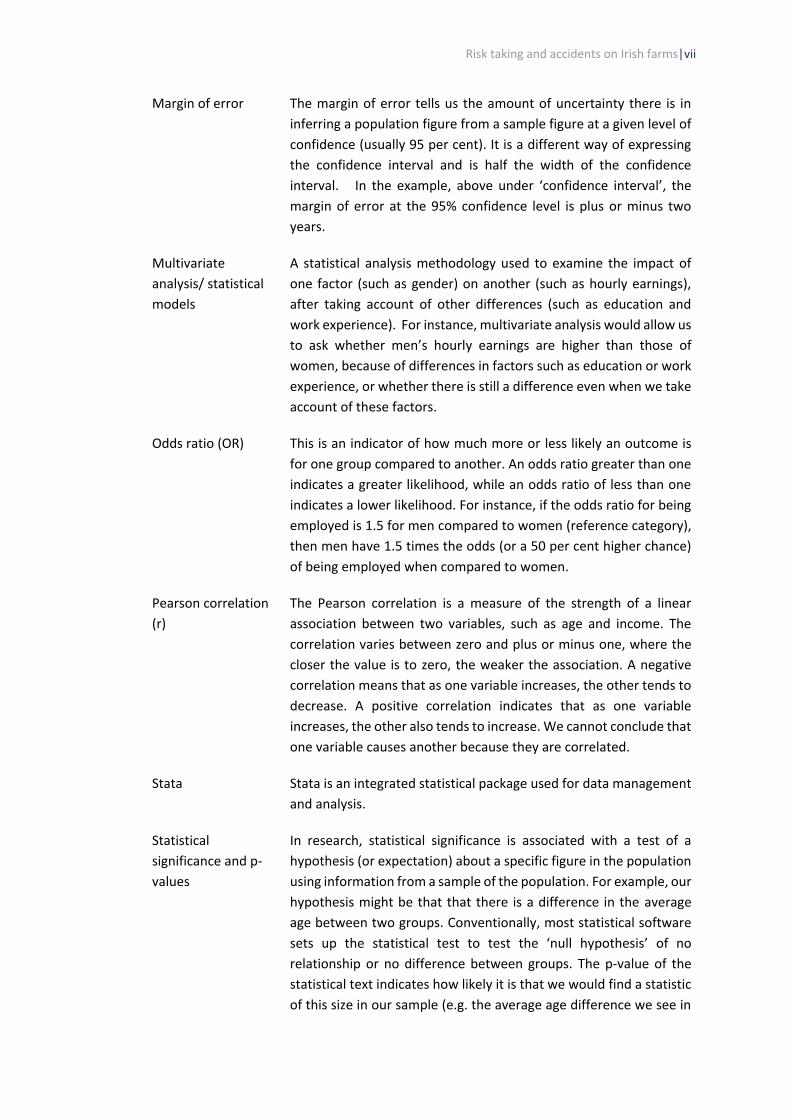
Margin of error The margin of error tells us the amount of uncertainty there is in
inferring a population figure from a sample figure at a given level of
confidence (usually 95 per cent). It is a different way of expressing
the confidence interval and is half the width of the confidence
interval. In the example, above under ‘confidence interval’, the
margin of error at the 95% confidence level is plus or minus two
years.
Multivariate
analysis/ statistical
models
A statistical analysis methodology used to examine the impact of
one factor (such as gender) on another (such as hourly earnings),
after taking account of other differences (such as education and
work experience). For instance, multivariate analysis would allow us
to ask whether men’s hourly earnings are higher than those of
women, because of differences in factors such as education or work
experience, or whether there is still a difference even when we take
account of these factors.
Odds ratio (OR) This is an indicator of how much more or less likely an outcome is
for one group compared to another. An odds ratio greater than one
indicates a greater likelihood, while an odds ratio of less than one
indicates a lower likelihood. For instance, if the odds ratio for being
employed is 1.5 for men compared to women (reference category),
then men have 1.5 times the odds (or a 50 per cent higher chance)
of being employed when compared to women.
Pearson correlation
(r)
The Pearson correlation is a measure of the strength of a linear
association between two variables, such as age and income. The
correlation varies between zero and plus or minus one, where the
closer the value is to zero, the weaker the association. A negative
correlation means that as one variable increases, the other tends to
decrease. A positive correlation indicates that as one variable
increases, the other also tends to increase. We cannot conclude that
one variable causes another because they are correlated.
Stata Stata is an integrated statistical package used for data management
and analysis.
Statistical
significance and p-
values
In research, statistical significance is associated with a test of a
hypothesis (or expectation) about a specific figure in the population
using information from a sample of the population. For example, our
hypothesis might be that that there is a difference in the average
age between two groups. Conventionally, most statistical software
sets up the statistical test to test the ‘null hypothesis’ of no
relationship or no difference between groups. The p-value of the
statistical text indicates how likely it is that we would find a statistic
of this size in our sample (e.g. the average age difference we see in
viii|Glossary
the sample) if there were no difference in the population. The p-
value ranges from zero to one. The lower the value, the less likely it
is that the null hypothesis is true. At the conventional 95%
significance level, a p-value of less than 5 per cent (or .05) is
regarded as statistically significant. It means we can be 95 per cent
confident that we would not find a difference this large in the
sample if the null hypothesis of no difference were true.
The calculation of the p-value takes account of the way the sample
was selected, the sample size and how variable the population is in
terms of the aspect of interest (e.g. age). Conventionally, p-values
are reported in the following form: p <.05 corresponding to the 95
per cent confidence level and p<.01 for the 99 per cent confidence
level.
Teagasc The Agriculture and Food Development Authority is the Irish
national body providing integrated research, advisory and training
services to the agriculture and food industry and rural communities.
T-tests A t-test is commonly used to assess whether we can be confident
that there is a difference between the averages for two groups in a
population, based on what we find in a sample taken from that
population. A p-value (see above) is reported in connection with a t-
test to indicate the likelihood that there is no difference between
the groups in the population given what we observe in the sample.
Executive summary|ix
EXECUTIVE SUMMARY
BACKGROUND
The agricultural, fishing and forestry sector in Ireland has the highest rate of both
fatal and non-fatal work-related injuries compared to other sectors (Health and
Safety Authority (HSA), 2016). The HSA commissioned a 2013 nationwide research
study to examine farm safety issues. That study involved a postal survey of farmers
selected at random from the HSA database of farms, with a small booster sample
of questionnaires completed by face-to-face interview at marts. Findings were
presented in a report focusing on descriptive results regarding intentions to work
safely, published in 2014 (HSA, 2014).
The present study involves an in-depth analysis of the same survey data, but which
goes beyond the original report in calibrating the data to represent all farms and
conducting detailed statistical analysis to identify the most important factors
related to risk taking and how this is linked to the experience of accidents on farms.
RESEARCH QUESTIONS
The main research questions are:
• Does risk taking vary with the characteristics of the farmer (age, marital status, full-time
or part-time work status, number of years farming experience) and of the farm (farm
size, farm type)?
• Do work stress and levels of distress differ by farmer and farm characteristics? Are work
stress and levels of distress associated with risk taking?
• How do farmer and farm characteristics and risk taking influence farm accidents or ‘near
misses’?
RISK TAKING
Risk taking was measured in terms of failing to routinely take six different safety
precautions:
• using safety gear (such as goggles, ear defenders);
• using restraining or handling facilities when treating animals;
• checking that machinery is in good working order;
• using power take-off (PTO) or machinery guards;
• keeping chemicals stored away from access by children; and
• getting help with difficult jobs.
The most common risks taken were ‘not routinely getting help with difficult jobs’
(27 per cent) and ‘not routinely using safety gear’ (26 per cent). About 11 per cent

x|Risk taking and accidents on Irish farms
of farmers did not check machinery before use and 12 per cent did not routinely
use PTO guards. Risks involving animals and improper storage of chemicals were
each taken by fewer than one in ten of the farmer respondents.
An overall indicator identified farmers who were in the highest ten per cent of risk
taking, based on a scale incorporating the six types of risk. Younger farmers and
dairy farmers showed higher levels of risk taking on this scale and risk taking
tended to be lower on the smallest farms. A statistical model (see Chapter 3) that
took account of a number of factors at once pointed to farm type as the main
factor, with a higher probability of being a risk-taker on dairy farms. There was also
a tendency for the younger farmers to be risk-takers, though this was only of
borderline statistical significance when farm type was taken into account.
Different types of risk
We also examined the different types of risk separately in a statistical model that
included farmer age, marital status, presence of children, farm size, farm type
(dairy or not) and whether working part-time or full-time.
Age
Differences by age were small and only borderline statistically significant.
Marital status
Single farmers were more likely to take risks in not checking machinery before use
but did not differ from their married counterparts in taking the other types of risk.
Children
There were no differences between farmers with and without children when we
controlled for marital status, age and farm type.
Farm size
Differences by farm size were statistically significant for two of the six types of risk.
Those farming a higher number of hectares were more likely to not use safety gear
but were less likely to tackle difficult jobs without getting help. For instance,
compared to farms under 20 hectares, the odds of not using safety gear were over
twice as high on farms more than 50 hectares, which could either reflect the
greater amount of work on large farms or the distance from where safety
equipment was stored. On farms more than 100 hectares, the odds of not getting
help were only one about one-third as high as on farms under 20 hectares.
All of the farmers in the study were self-employed with no regular employees.
However, larger farmers may have been better able to afford to hire help, either
on a part-time or seasonal basis.
Executive summary|xi
Employment type
Part-time farmers showed some tendency to have a higher rate of risk taking but
this was only statistically significant for improper storage of chemicals, where the
odds were nearly four times higher than for full-time farmers. It is also in terms of
improper storage of chemicals that dairy farmers stand out, with odds that are over
six times higher than for non-dairy farmers. However, the overall proportion of
farmers taking risks in this respect is low, in both the dairy and non-dairy sectors.
DISTRESS AND STRESS
In general, farmers reported low levels of distress and a medium level of concern
regarding work issues. Distress was measured using the World Health
Organization’s five-item Well-Being Measure (WHO-5). This measure is used to
establish how often in the previous two weeks the farmer had felt cheerful, calm
and relaxed, active and vigorous, rested in the morning and that life was filled with
things of interest. On a scale ranging from 0 (low distress–high well-being) to 5
(high distress–low well-being), the average score was towards the low end of the
scale, at 1.5.
Work-related stress was measured on the basis of level of concern regarding
government regulation, farm paperwork, financial matters and workload. Using
these four items, we constructed a scale to assess farmer’s levels of concern
associated with these areas. A scale ranging from 1 (low stress) to 5 (high stress)
was constructed, with the average score falling towards the middle, at 3.35.
No firm conclusions on relationship between risk taking and distress or
stress
Although some previous research had suggested a link between risk taking and
stress or distress, we did not see this pattern in the present data for the overall
indicator of risk taking, once we took account of farmer and farm characteristics.
However, we found that distress was related to two of the specific types of risk.
Where the farmer had high levels of distress, the odds of improperly storing
chemicals were five times higher and the odds of not getting help with difficult
tasks were nearly three times higher. We cannot draw firm conclusions about the
direction of causation here, since both distress and the ability to get help were
measured at the same point in time. Farmer distress may be due to not having
someone to call on for help or it may be that farmers experiencing distress are
more reluctant to ask for help.
xii|Risk taking and accidents on Irish farms
ACCIDENTS AND NEAR MISSES
Farmers were asked whether they or someone else had experienced an accident
on their own farm in the previous ten years or whether they had personally
experienced a near miss. Overall, 12 per cent of farmers were personally involved
in an accident, 27 per cent had had a near miss and 8 per cent reported that
someone else had been involved in an accident on their farm. Note that because
of the way the farms for the study were selected (including a small booster sample
from regions with a high fatality rate), the rate of accidents or near misses on the
farms may be somewhat higher than the overall rate across all farms.1
In about half of the cases where an accident occurred, the accident resulted in four
or more days lost from work. Although we have no information on the potential
severity of the near misses, the fact that over one-third of the studied farms were
affected by at least one of these types of incident over a ten-year period points to
the dangers inherent in farm work.
What factors are associated with an accident or near miss?
We drew on a statistical model to examine the link between accidents and the
farmer and farm characteristics, as well as risk taking. The clearest results were
found when we distinguished between types of incident and types of risk taking.
Farmer accidents and near misses were both associated with larger farms. In terms
of safety practices, not getting help was strongly associated with both accidents
and near misses involving the farmer. Not checking machinery was significantly
associated with accidents involving others and with near misses involving the
farmer. Since about half of the farmers who had experienced an accident reported
subsequently changing something on the farm, the association between risk taking
and having experienced an accident is weaker than if we had a measure of
behaviour at the time of the accident.
When other factors, including risk taking, are controlled, there was no association
between the occurrence of these incidents (accidents or near misses) and farmer
age, family circumstances and farm type. There was a small tendency for part-time
farmers to be more likely to report near misses but no significant relationship to
actual accidents.
LIMITATIONS AND FURTHER RESEARCH
The main limitation in this research was the cross-sectional design, which warrants
caution in inferring causal relationships. In addition, the need for sample weights
restricted the power of statistical tests to detect patterns as statistically significant.
1 Although the data were reweighted to take account of representativeness by farm type (dairy or not), farm size and farmer age, no reweighting by region was possible because this was not recorded in the survey data.
Executive summary|xiii
However, these weights were necessary due to a low representation of small farms
and non-dairy farms.
POLICY IMPLICATIONS
This study involved re-analysing data on farm practices in order to draw out
insights that may be relevant for policy. It points to a number of possible
implications for health and safety policy and practice on farms.
Getting help with difficult tasks
Given the solitary nature of much farm work, there is clearly a need for a system
that enables farmers to call on additional help during a difficult task. Over one-
quarter of farmers do not routinely get help when tackling difficult tasks and this
form of risk taking is strongly associated with having an accident or near miss. More
information is needed on the type of tasks involved and on their frequency in order
to develop more specific recommendations in this area.
Checking machinery
Safety messages need to continue to emphasise checking machinery before use.
Failure to do so is associated with an increased incidence of accidents involving
others and near misses. Although less common than not getting help, this risk is
taken by about one in eight farmers.
Younger farmers
Younger farmers were more likely to take risks, mainly because of the association
between age and farm size and type. This points to the need to have safety
messages directed towards young farmers in areas such as use of safety gear,
checking machinery, using PTO guards and getting help with difficult tasks. Since
young farmers are likely to have taken agricultural training courses, these aspects
of health and safety might be further emphasised as part of their training.
Storage of chemicals
Safety messages on proper storage of chemicals could usefully be directed to dairy
farmers who are more likely to take risks in this respect.
Larger farms
Larger farms are associated with a greater risk of accidents and near misses
involving the farmer, even controlling for other characteristics and risk taking. The
reasons are not clear from this study and should be examined further. It may be
related to the amount of work to be done on the farm or to the distance that needs
to be travelled to get safety equipment.

xiv|Risk taking and accidents on Irish farms
New ways of reaching farmers
It is worth examining a range of options for disseminating safety messages to
farmers. These include collaborating with farm insurers to make more use of the
insurance discounts that insurers offer to farmers who complete a safety checklist;
linking discounts to taking a farm safety ‘refresher’ course and disseminating
research on farm safety in a non-technical, accessible format.
Introduction|1
CHAPTER 1
Introduction
1.1 BACKGROUND AND RATIONALE FOR THIS STUDY
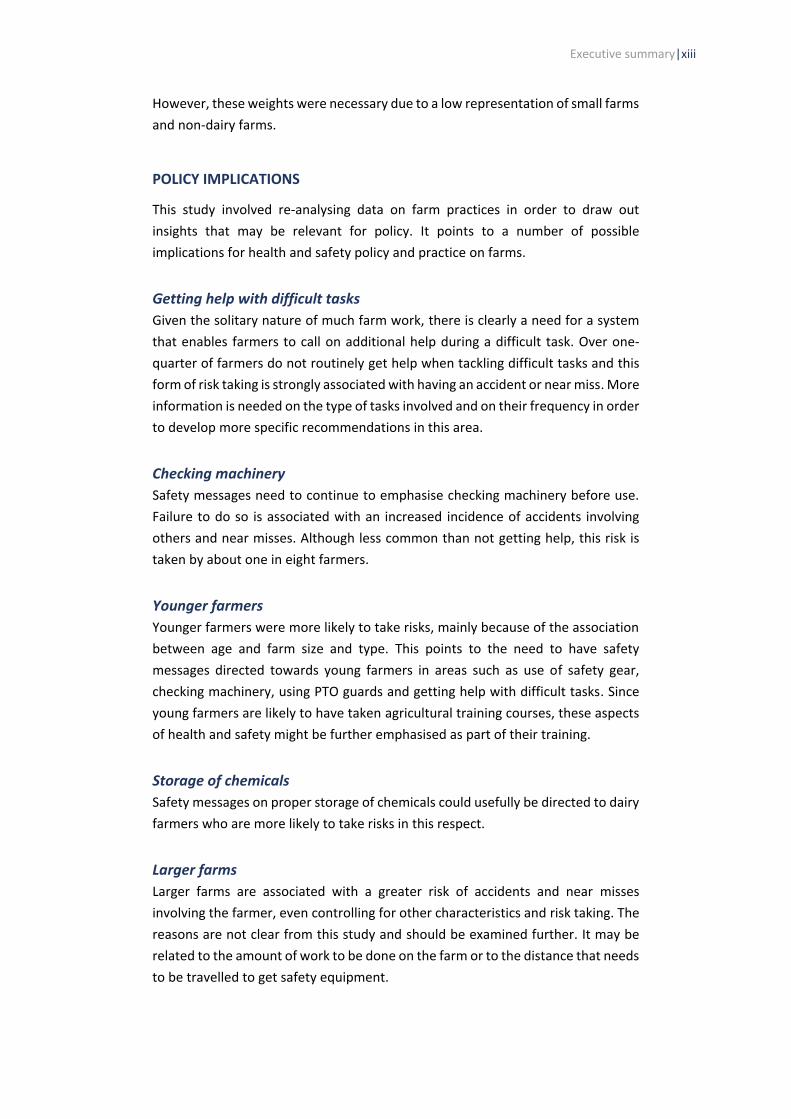
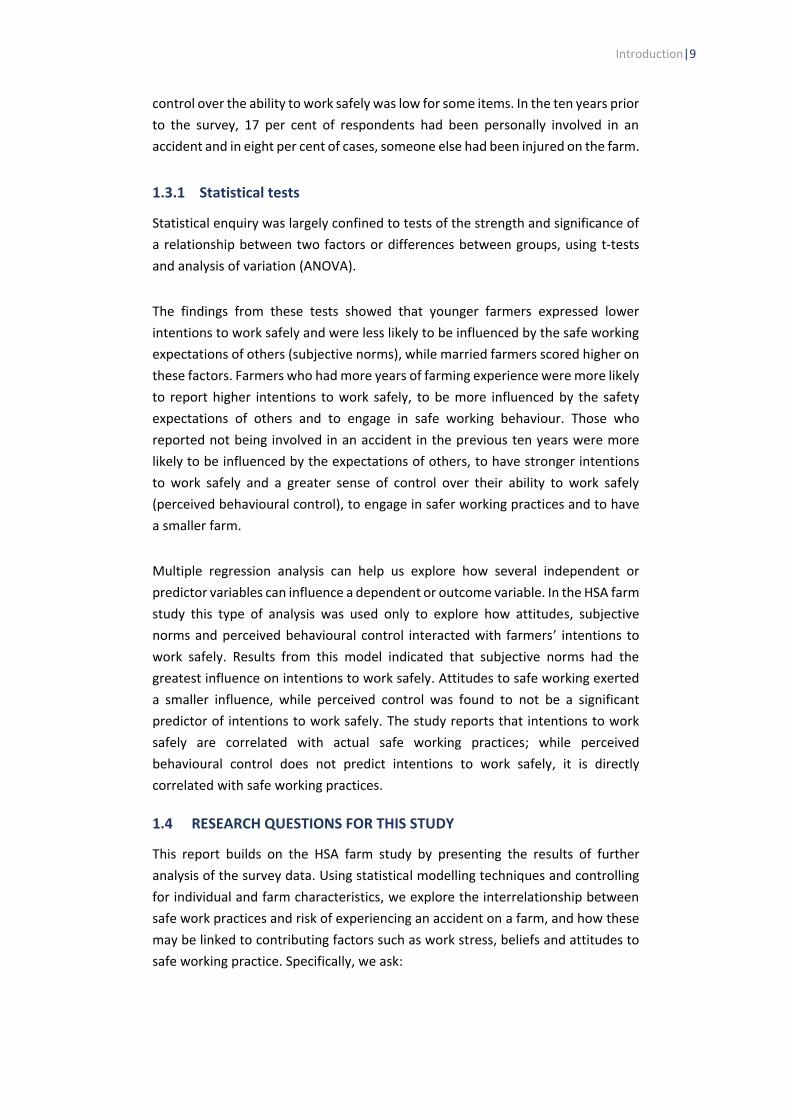
The agricultural, fishing and forestry sector in Ireland has the highest rate of fatal
injuries across sectors, with a rate that is ten times higher than the overall rate
(Health and Safety Authority (HSA), 2016). The rate of work-related fatalities per
100,000 workers across all sectors from 2009 to 2015 was 2.3 but in agriculture,
fishing and forestry this rate was ten times higher, at 23 per 100,000 workers, with
the majority of these occurring in agriculture (Figure 1.1). In 2015, almost one-third
(32 per cent) of all worker fatalities reported to the HSA occurred in the agricultural
sector alone while in 2014, in this regard the worst year for over 25 years, the
proportion was 54 per cent (HSA, 2016).
FIGURE 1.1 WORKER FATALITIES PER 100,000 WORKERS, SELECTED SECTORS, AVERAGE 2009–2015
Source: Authors’ analysis using HSA work-related fatalities dataset. Rates are per 100,000 workers, not adjusted for hours worked.
In their analysis of worker fatality rates, Russell et al. (2015) find that, compared to
the service sector, the risk of fatal injury is more than 24 times higher for the
agricultural sector (p<.000).2 Furthermore, the analysis of trends over time shows
that the rate of fatalities in the agricultural sector has increased significantly
between 2004 and 2011 while the rate in the industry and construction sectors has
not changed significantly.
2 Using data from the Health and Safety Authority (HSA) for the period between 2004 and 2011.
22.9
6.4
4.2
2.3
0 5 10 15 20 25
Agriculture, forestry and fishing
Construction
Transport and storage
All sectors
2|Risk taking and accidents on Irish farms
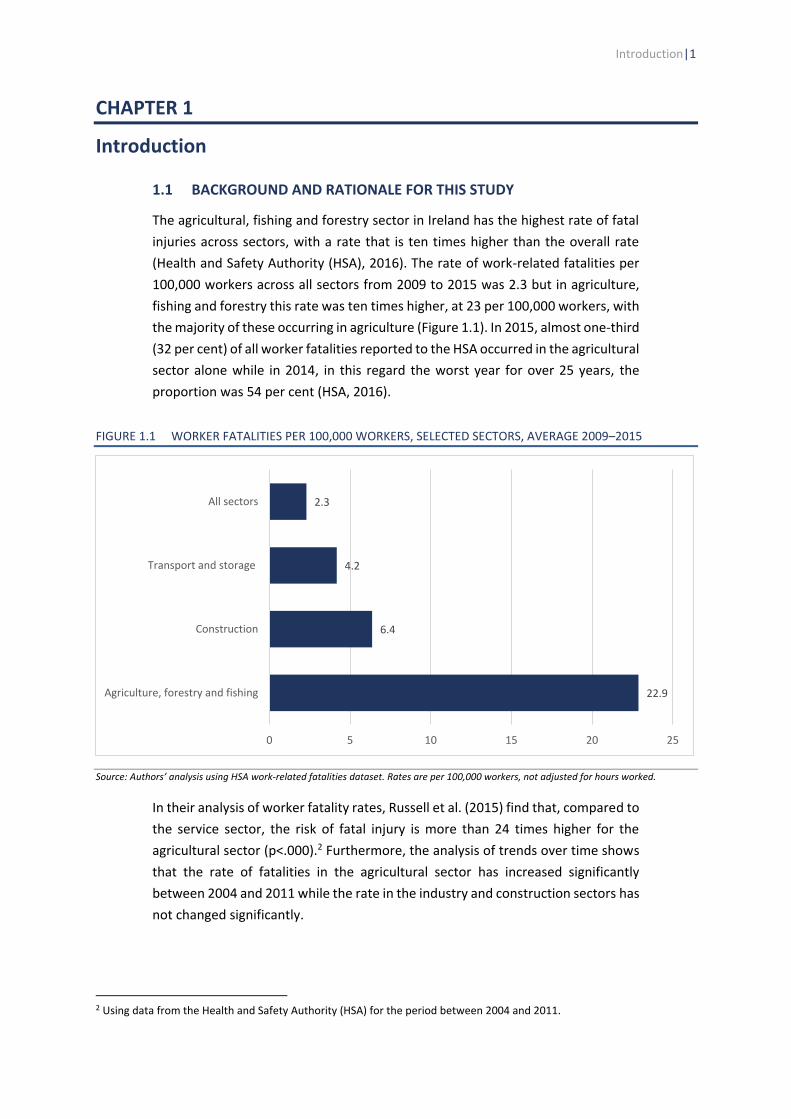
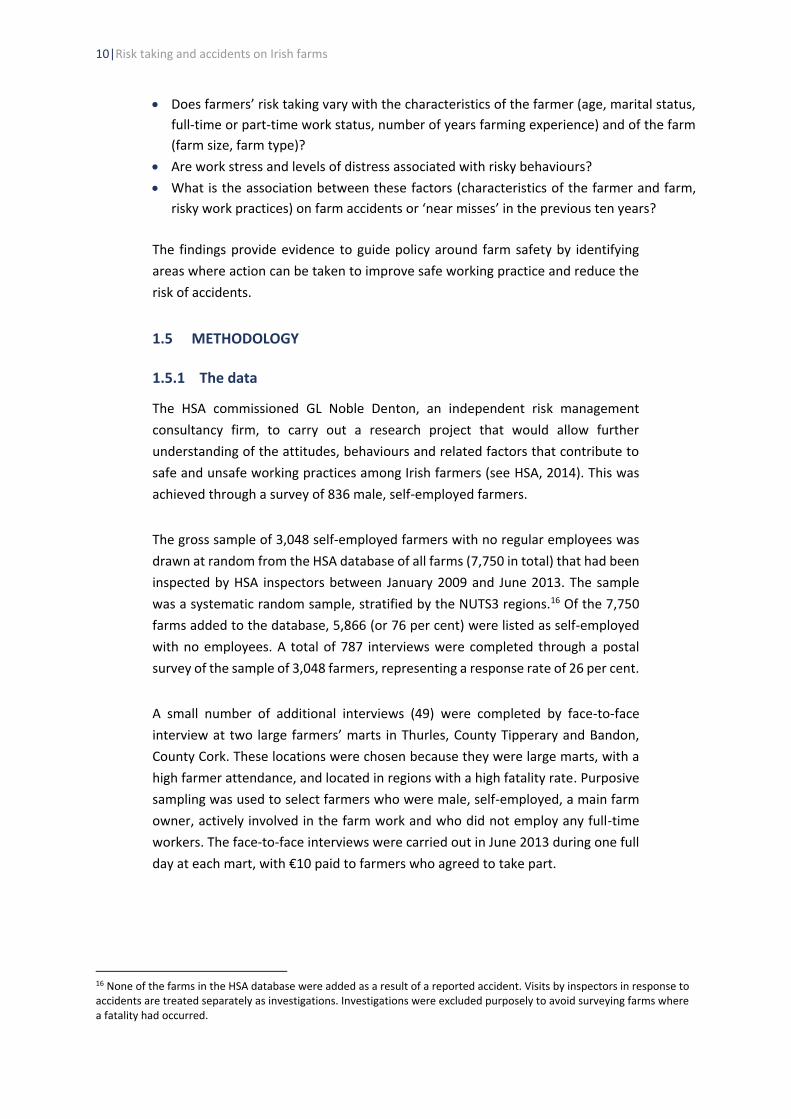
A European comparison, based on Eurostat data on fatalities in the agricultural
sector, is shown in Figure 1.2. The figure focuses on a set of ten EU15 countries for
which we have data for the years 2008 and 2013 and shows the annual average
number of fatalities per 100,000 workers in agriculture over the period. Ireland had
the second highest rate of fatalities in agriculture in the period, at 18.2 per 100,000
workers per year compared to an average figure of 5.7 across the EU15 countries.
FIGURE 1.2 WORKER FATALITIES PER 100,000 WORKERS IN THE AGRICULTURAL SECTOR, ANNUAL AVERAGE 2008–2013
Source: European Statistics on Accidents at Work (ESAW) tabular data from Eurostat website (hsw_n2_02); Crop and animal production, hunting and related service activities; last updated 23 November 2016.
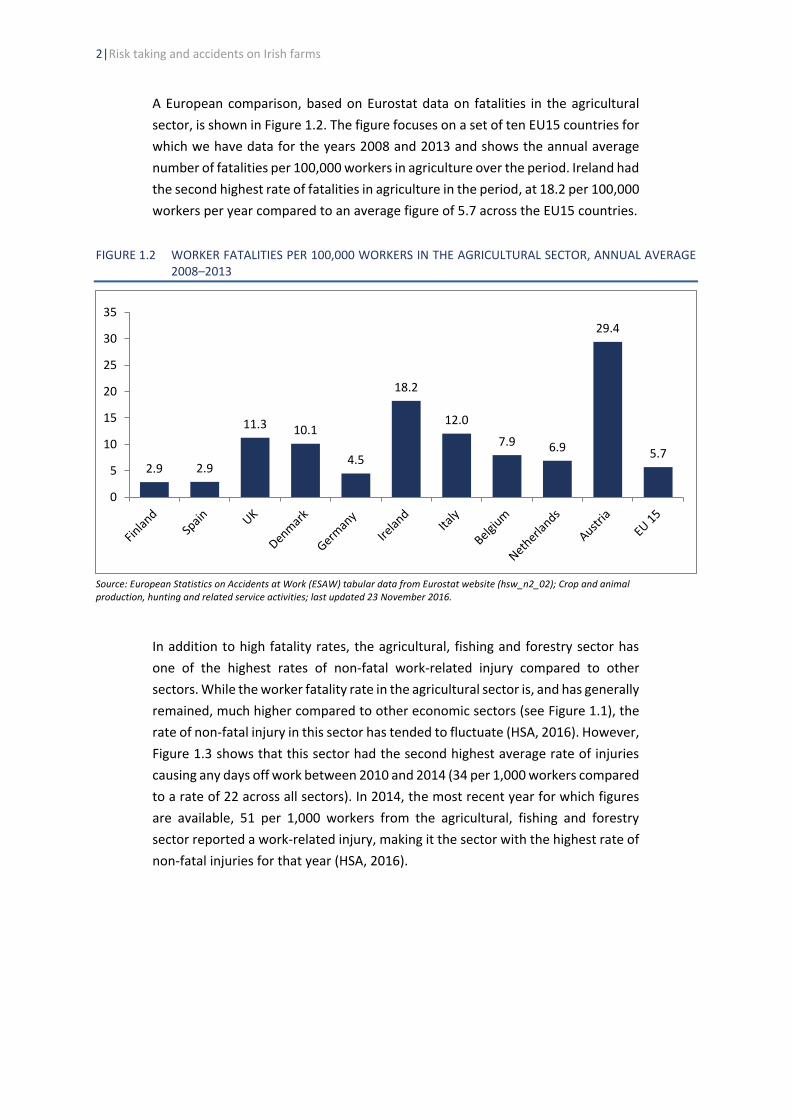
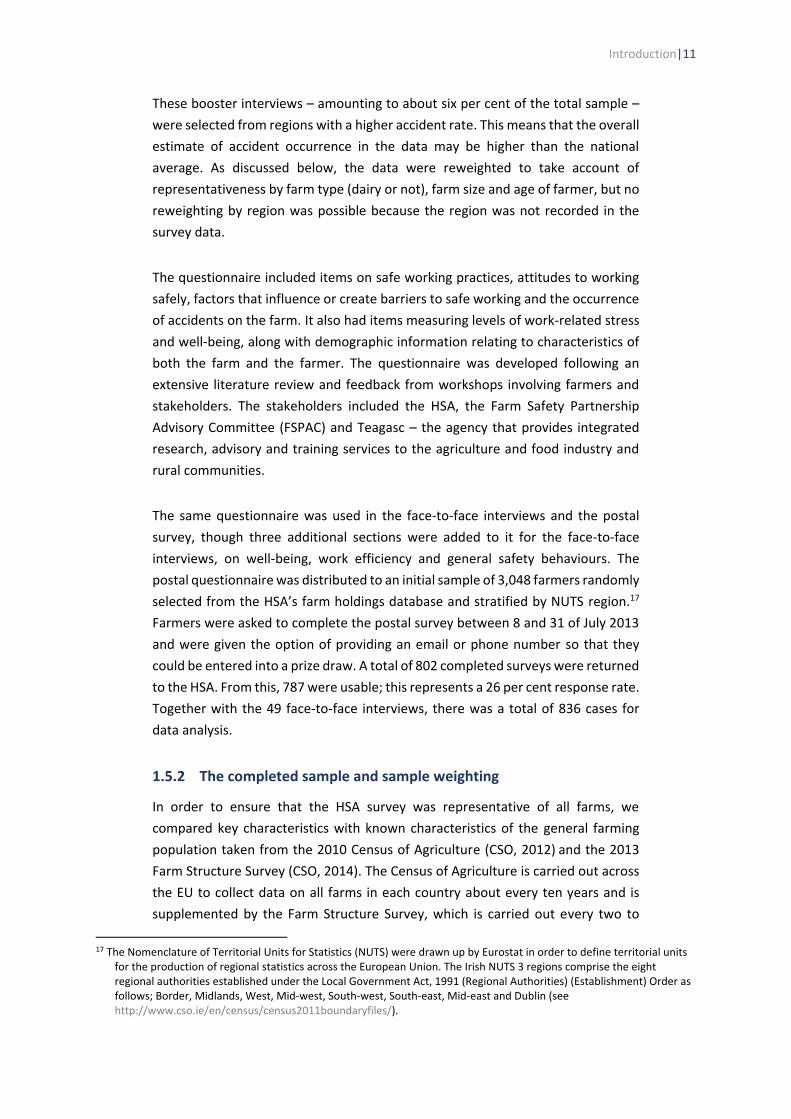
In addition to high fatality rates, the agricultural, fishing and forestry sector has
one of the highest rates of non-fatal work-related injury compared to other
sectors. While the worker fatality rate in the agricultural sector is, and has generally
remained, much higher compared to other economic sectors (see Figure 1.1), the
rate of non-fatal injury in this sector has tended to fluctuate (HSA, 2016). However,
Figure 1.3 shows that this sector had the second highest average rate of injuries
causing any days off work between 2010 and 2014 (34 per 1,000 workers compared
to a rate of 22 across all sectors). In 2014, the most recent year for which figures
are available, 51 per 1,000 workers from the agricultural, fishing and forestry
sector reported a work-related injury, making it the sector with the highest rate of
non-fatal injuries for that year (HSA, 2016).
2.9 2.9
11.3 10.1
4.5
18.2
12.0
7.9 6.9
29.4
5.7
0
5
10
15
20
25
30
35
Introduction|3
FIGURE 1.3 RATE OF INJURY (ANY DAYS LOST) PER 1,000 WORKERS, SELECTED SECTORS, 2010 – 2014
Source: Authors’ analysis of data from the QNHS special module on work-related accidents and illnesses (CSO). Note: The total rate in the chart includes all sectors, not just the selected sectors shown.
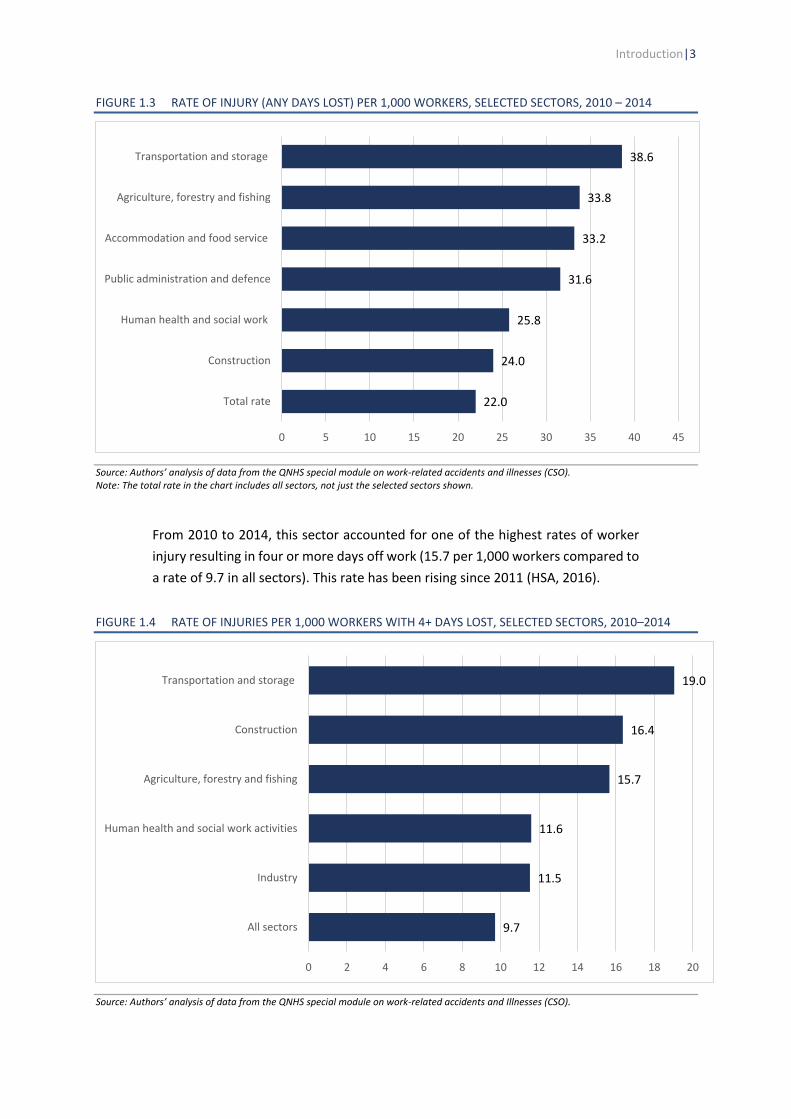
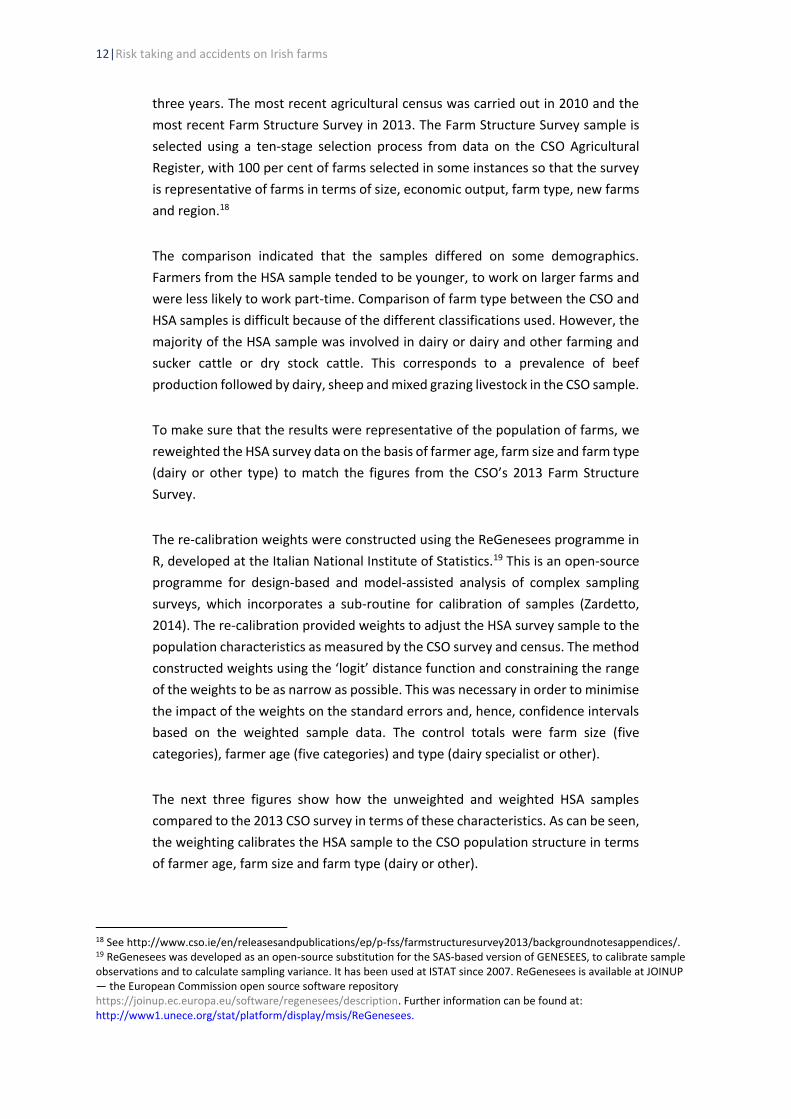
From 2010 to 2014, this sector accounted for one of the highest rates of worker
injury resulting in four or more days off work (15.7 per 1,000 workers compared to
a rate of 9.7 in all sectors). This rate has been rising since 2011 (HSA, 2016).
FIGURE 1.4 RATE OF INJURIES PER 1,000 WORKERS WITH 4+ DAYS LOST, SELECTED SECTORS, 2010–2014
Source: Authors’ analysis of data from the QNHS special module on work-related accidents and Illnesses (CSO).
22.0
24.0
25.8
31.6
33.2
33.8
38.6
0 5 10 15 20 25 30 35 40 45
Total rate
Construction
Human health and social work
Public administration and defence
Accommodation and food service
Agriculture, forestry and fishing
Transportation and storage
9.7
11.5
11.6
15.7
16.4
19.0
0 2 4 6 8 10 12 14 16 18 20
All sectors
Industry
Human health and social work activities
Agriculture, forestry and fishing
Construction
Transportation and storage
4|Risk taking and accidents on Irish farms
The high level of injury and fatalities in the farm sector is the main motivating factor
for this present study. In the remainder of this chapter, we review previous
research on the farm sector, including the HSA’s 2013 survey of farms, which we
re-analyse in the present report. We outline the research questions and discuss the
data and methodology in the present analysis.
1.2 PREVIOUS RESEARCH ON THE FARM SECTOR
1.2.1 Rates and risks
Finnegan and Phelan (2003) and McNamara (2012) report findings from a
nationally representative survey of farms showing that injuries per 100,000 farms
fell from 3,077 in 2001 to 1,815 in 2006, but that there was a 35 per cent increase
between 2006 and 2011, which a rate of 2,459 reported injuries per 100,000 farms
in 2011.3 Analysis by Russell et al. (2015) indicates that the risk of injury for workers
in the agricultural sector is 1.9 times higher (p<.000) compared to those in the
services sector, even when worker characteristics, such as gender, age, nationality
and self-employment, and job factors, such as hours and tenure, are controlled for.
Similarly, Watson et al. (2015) found that across 34 European countries, exposure
to physical risk in the workplace was nearly 1 point higher on a scale of 1 to 10 (.97,
p<0.01) and exposure to physically demanding work was nearly half a point higher
(.41, p<0.05) in the agricultural, forestry and fishing sector than in the retail and
wholesale sectors, controlling for job and worker characteristics. These differences
are substantial compared to the average level of exposure across countries, which
was about 1.3 on the ten-point scale for both physical risk and physically
demanding work.4
1.2.2 Reasons for high injury and fatality rates
The high injury and fatality rates in agriculture can be explained to some extent by
the hazardous nature of agricultural work and potential dangers present in the
farm environment. For example, McNamara and Reidy (1997) point to the high
number of wide-ranging tasks that have to be carried out in various locations of
the farm and the presence of potentially dangerous animals, machinery, farm
buildings and equipment as possible risk factors in injury and fatality. Statistics
from the Health and Safety Authority in Ireland (HSA) show that from 2006 to 2015,
29 per cent of deaths in the agricultural sector were caused by tractors and farm
vehicles and 19 per cent by machinery. A further 17 per cent of fatal accidents are
3 From the 2011 farm safety module carried out every five years as part of the National Farm Survey conducted annually by Teagasc (n=995 farmers representative of the national farming population by farm system and farm size above two acres, but excluding pig and poultry farms). 4 Physical risk includes vibration from tools and machinery, loud noise and extremes of temperature. Physically demanding work includes that requiring a painful or tiring position, lifting or moving people, carrying or moving heavy loads, and repetitive hand or arm movements.
Introduction|5
attributed to falls from a height, falling objects and collapses and a further 14 per
cent to livestock, in particular cows and bulls.5 On average, since 1991, data from
the Teagasc Farm Safety Survey shows that trips and falls constitute the most
common cause of non-fatal injury on farms (at 42 per cent), followed by livestock
(33 per cent) and vehicles and machinery (11 per cent).6 This is consistent with
international findings (Solomon, 2002; McCurdy and Carroll, 2004; Rautiainen et
al., 2004).
1.2.3 Differences in risk within the farm sector
Farmers do not make up a homogenous group, however, and several studies have
pointed to differences in risk within the farm sector by farmer or farm work
characteristics. Several studies from the US have found links between the
incidence of injury and farm characteristics. For example, McCurdy and Carroll
(2000) reviewed a large number of US-based studies showing that injury is more
common on smaller and larger farms. Many of the studies reviewed reported that
beef and dairy farmers and those with more machinery and farm vehicles present
were more likely to be injured.
Similarly, very young and much older farmers reported more injuries, a finding
which suggests a risk for both inexperience and frailty, while older farmers had a
higher risk of work-related fatality. Other findings include an increased chance of
injury for farm owners and resident farmers and those working more or longer
hours. Risk was reported by some studies to rise in the spring and autumn seasons
and participation in safety courses did not lead to a reduction (see McCurdy and
Carroll, 2000).
Sprince et al. (2002) report that more hours per week spent on farm work and
fewer years of farming experience increase the risk of machine-related injury,
while older farmers (aged 40–64 years compared to 22–39 years) were found to
be less likely to sustain an animal-related injury.7 Virtanen et al. (2003) report an
increase in the risk of injury as the number of dairy cows increases. They suggest
that the following factors cause such injuries: the size of the dairy cows,
unanticipated behaviour and the posture required by farmers caring for them.
5 http://www.hsa.ie/eng/Your_Industry/Agriculture_Forestry/Further_Information/Fatal_Accidents/ 6 Based on survey data from the years 1991, 1996, 2001 and 2011. The survey conducted in 2006 is omitted as it included injury reports for one year rather than five years. 7 Working more hours per week is associated with a higher risk of injury and illness in many sectors (Dembe et al., 2005; Russell et al., 2015). However, making an adjustment to account for those who work more or less hours than the standard working week allows an estimate of exposure to workplace risks per hour work. Using this adjustment other studies find that those working a shorter number of hours per week have a higher risk per hour worked (Davies and Jones, 2005; Russell et al., 2015).
6|Risk taking and accidents on Irish farms
In Ireland, Furey et al. (2016) cite McNamara’s (2010) finding that 58 per cent of
farm fatalities between 2000 and 2007 occurred on dairy farms despite these farm
types constituting only 11 per cent of all Irish farms (CSO, 2014). Dairy farming is
typically carried out on medium-sized farms: 74.4 per cent of dairy farms are
between 30 and 99 hectares (Teagasc, 2013).
1.2.4 Specific aspects of work in agriculture
Workers in the agricultural sector are unique compared to those in many other
sectors. CSO QNHS figures for Quarter 1 (Q1) 2015 show that the rate of self-
employment is highest in the agricultural, forestry and fishing sector (74 per cent).
This can be compared to the next highest sector, construction, where the self-
employment rate is 37 per cent, compared to an overall rate of self-employment
across all sectors of 17 per cent (CSO, 2015). According to the CSO Farm Survey
2013, of the 139,600 farms in Ireland, 99.6 per cent were classified as family farms.
Over 88 per cent of family farm-holders were male and while only 5.9 per cent of
these farmers were aged under 35 years, more than half (53 per cent) were aged
55 years or over, with 27 per cent of all family farm-holders aged 65 years or over
(CSO, 2014).
1.2.5 Different attitudes and behaviours
There are concerns that workers in agriculture may have different attitudes and
behaviours in relation to safe working practices. For example, despite having
generally positive attitudes to health and safety and regulation on the farm, studies
have shown a low implementation rate of safety measures among Irish farmers
(Finnegan and Phelan, 2003; McNamara and Reidy, 1997). This finding is also
reported in studies from the UK (Knowles, 2002; HSE, 2009). Farmers may have a
propensity for higher risk taking stemming from a number of factors including: a
culture of ‘masculinity’ (Roy et al., 2014), resistance to change among rural
communities and the nature of self-employment (McNamara, 2014).
1.2.6 Stress and distress among farmers
There is some evidence that farmers are likely to experience higher levels of stress
(Simpson et al., 1995; Deary et al., 1997; Kolstrup et al., 2013; Furey et al., 2016)
and mental or emotional distress (Roberts and Sul Lee, 1993; Wallis and Dollard,
2008; Beseler and Stallones, 2010). This may be linked to work safety outcomes. In
the US, Roberts and Sul Lee (1993) found that compared to executives, farmers
had a 21 per cent higher risk of major depressive illness,8 both in the six months
8 As per the DSM-111 diagnostic criteria. To qualify as a case of major depression, a spell of two or more weeks of sadness had to be reported, accompanied by symptoms in four or more of the following: appetite, sleep, fatigue, slowing of bodily movements/thought, feeling worthless, loss of pleasure, difficulty concentrating and suicidal thoughts/desires/attempts.

Introduction|7
prior to their study and over their lifetime, after taking account of gender, age and
education. A Norwegian study reports that farmers (both full-time and part-time)
had significantly higher levels of depression compared to non-farmers in both
genders, and significantly higher levels of anxiety in male farmers.9 Levels of both
anxiety and depression were highest among male livestock farmers (Sanne et al.,
2004).
Much of the literature on farmer distress and stress focuses on dairy farming. For
example, Wallis and Dollard (2008) found that Australian dairy farmers had
significantly higher levels of psychological distress10 compared to eight other
Australian occupational groups, including correctional officers, private sector
workers, family and community service workers, nurses and Salvation Army
officers, and that almost half of the dairy farmers had at least mild distress. Deary
et al. (1997) found more time-pressure-related stress among dairy farmers
compared to cereal farmers and higher levels of financial stress among ‘less-
favoured areas’ (LFA) cattle and sheep farmers compared to dairy and cereal
farmers.11 Older farmers were found to have lower levels of stress in the areas of
finance, time pressure, isolation, personal hazards and ‘acts of God’.
In a review of international literature, Kolstrup et al., (2013) cite the following as
dairy farm stressors:
• bad weather;
• fluctuating markets;
• government regulations;
• social and environmental responsibilities;
• disease outbreaks;
• taxes related to dairy production; and
• recent negative societal attitudes to farming in general.
The authors also note that higher work demands and expectations, along with less
influence and control over external conditions, demands and lack of social support,
can lead to increased stress levels, poorer mental health and depression, and even
suicide.
1.2.7 Little research on stress or depression and farm safety
Very few studies have investigated the relationship between stress or depression
9 Assessed via the Hospital Anxiety and Depression Scale (HADS), a well-validated scale containing two subscales of seven items, each measuring both anxiety (HADS-A) and depression (HADS-D). 10 Measured using the General Health Questionnaire (GHQ)-12, a validated measure of psychological distress or strain with questions such as “Have you recently been able to concentrate on whatever you’re doing?” 11 ‘Less-favoured areas’ (LFA) is a term used in the European Union for poorer farm areas in terms of climate, soil and terrain (see http://ec.europa.eu/agriculture/rural-development-previous/2007-2013/less-favoured-areas-scheme_en)
8|Risk taking and accidents on Irish farms
and farm safety behaviour. However, a study in Colorado, US, using logistic
regression analysis and controlling for age and gender, shows that depressed
farmers reported significantly higher levels of ‘high-risk’ safety behaviour (Beseler
and Stallones, 2010). 12, 13 This study found that depression was significantly
associated with rarely or never exercising the following safety practices: being calm
around animals; using restraining and handling facilities for treating animals;
reading instruction manuals for farm machinery; keeping moving equipment parts
shielded. The following safety practices were not significantly associated with
depression: replacing protective shields after working on equipment; keeping
chemicals out of the reach of children; keeping passageways clear of slippery
substances and using a respirator; wearing a dust mask; and hearing protection.
On a related issue, Furey et al. (2016) found that Irish dairy farmers with higher
levels of ‘farm stress’ were significantly more likely to express ‘expectations of
injury’.14,15
1.3 THE HSA FARM STUDY
In 2013, the HSA commissioned a research study to examine farm safety issues (see
HSA, 2014). The survey provided data from 836 self-employed male farmers (see
section 1.5 for methodology). Its questionnaire included demographic information
on the farmer and the farm, attitudes, beliefs and behaviour around farm safety,
accident involvement and psychosocial factors (for example well-being, stress and
performance-influencing factors). Analysis of the data collected was mainly
descriptive in that only the percentages and frequencies of responses to items
were reported. Findings showed that having the right tools or equipment and
general tiredness ranked as the highest influencing factors regarding farmers’
ability to work safely and efficiently. In terms of work stress, government
regulations, bad weather and paperwork caused most concern.
While farmers’ well-being was generally good, eight per cent were found to have
‘low mood’ and a further six per cent were depressed in terms of the WHO-5 scale
rating. Mean scores showed that farmers’ attitudes and intentions to work safely,
and their actual safe working behaviour were generally positive. Farmers were
influenced by subjective norms around safety (for example, they felt people
important to them expected them to work safely), but their level of perceived
12 According to the Center for Epidemiologic Studies-Depression (CES-D) scale, which is often used to research the health correlates of depressive symptoms. Respondents were asked how many times over the past week they had experienced symptoms of depression. 13 Respondents were asked to report five possible responses to how often they engaged in specific farm safety practices. These were dichotomised into low risk (‘all of the time’, ‘most of the time’) and high risk (‘sometimes or occasionally’, ‘rarely’, and ‘never’). 14 Measured using the Edinburgh Farming Stress Inventory. (Deary et al., 1997). 15 Measured using the six-item ‘susceptibility to a farm related accident/illness’ subscale, which is a factor of the established Farm Safety and Health Beliefs Scale (FSHBS). Items include, for example, ‘I’m more likely than the average farmer to have a farm-related accident or illness’.
Introduction|9
control over the ability to work safely was low for some items. In the ten years prior
to the survey, 17 per cent of respondents had been personally involved in an
accident and in eight per cent of cases, someone else had been injured on the farm.
1.3.1 Statistical tests
Statistical enquiry was largely confined to tests of the strength and significance of
a relationship between two factors or differences between groups, using t-tests
and analysis of variation (ANOVA).
The findings from these tests showed that younger farmers expressed lower
intentions to work safely and were less likely to be influenced by the safe working
expectations of others (subjective norms), while married farmers scored higher on
these factors. Farmers who had more years of farming experience were more likely
to report higher intentions to work safely, to be more influenced by the safety
expectations of others and to engage in safe working behaviour. Those who
reported not being involved in an accident in the previous ten years were more
likely to be influenced by the expectations of others, to have stronger intentions
to work safely and a greater sense of control over their ability to work safely
(perceived behavioural control), to engage in safer working practices and to have
a smaller farm.
Multiple regression analysis can help us explore how several independent or
predictor variables can influence a dependent or outcome variable. In the HSA farm
study this type of analysis was used only to explore how attitudes, subjective
norms and perceived behavioural control interacted with farmers’ intentions to
work safely. Results from this model indicated that subjective norms had the
greatest influence on intentions to work safely. Attitudes to safe working exerted
a smaller influence, while perceived control was found to not be a significant
predictor of intentions to work safely. The study reports that intentions to work
safely are correlated with actual safe working practices; while perceived
behavioural control does not predict intentions to work safely, it is directly
correlated with safe working practices.
1.4 RESEARCH QUESTIONS FOR THIS STUDY
This report builds on the HSA farm study by presenting the results of further
analysis of the survey data. Using statistical modelling techniques and controlling
for individual and farm characteristics, we explore the interrelationship between
safe work practices and risk of experiencing an accident on a farm, and how these
may be linked to contributing factors such as work stress, beliefs and attitudes to
safe working practice. Specifically, we ask:
10|Risk taking and accidents on Irish farms
• Does farmers’ risk taking vary with the characteristics of the farmer (age, marital status,
full-time or part-time work status, number of years farming experience) and of the farm
(farm size, farm type)?
• Are work stress and levels of distress associated with risky behaviours?
• What is the association between these factors (characteristics of the farmer and farm,
risky work practices) on farm accidents or ‘near misses’ in the previous ten years?
The findings provide evidence to guide policy around farm safety by identifying
areas where action can be taken to improve safe working practice and reduce the
risk of accidents.
1.5 METHODOLOGY
1.5.1 The data
The HSA commissioned GL Noble Denton, an independent risk management
consultancy firm, to carry out a research project that would allow further
understanding of the attitudes, behaviours and related factors that contribute to
safe and unsafe working practices among Irish farmers (see HSA, 2014). This was
achieved through a survey of 836 male, self-employed farmers.
The gross sample of 3,048 self-employed farmers with no regular employees was
drawn at random from the HSA database of all farms (7,750 in total) that had been
inspected by HSA inspectors between January 2009 and June 2013. The sample
was a systematic random sample, stratified by the NUTS3 regions.16 Of the 7,750
farms added to the database, 5,866 (or 76 per cent) were listed as self-employed
with no employees. A total of 787 interviews were completed through a postal
survey of the sample of 3,048 farmers, representing a response rate of 26 per cent.
A small number of additional interviews (49) were completed by face-to-face
interview at two large farmers’ marts in Thurles, County Tipperary and Bandon,
County Cork. These locations were chosen because they were large marts, with a
high farmer attendance, and located in regions with a high fatality rate. Purposive
sampling was used to select farmers who were male, self-employed, a main farm
owner, actively involved in the farm work and who did not employ any full-time
workers. The face-to-face interviews were carried out in June 2013 during one full
day at each mart, with €10 paid to farmers who agreed to take part.
16 None of the farms in the HSA database were added as a result of a reported accident. Visits by inspectors in response to accidents are treated separately as investigations. Investigations were excluded purposely to avoid surveying farms where a fatality had occurred.
Introduction|11
These booster interviews – amounting to about six per cent of the total sample –
were selected from regions with a higher accident rate. This means that the overall
estimate of accident occurrence in the data may be higher than the national
average. As discussed below, the data were reweighted to take account of
representativeness by farm type (dairy or not), farm size and age of farmer, but no
reweighting by region was possible because the region was not recorded in the
survey data.
The questionnaire included items on safe working practices, attitudes to working
safely, factors that influence or create barriers to safe working and the occurrence
of accidents on the farm. It also had items measuring levels of work-related stress
and well-being, along with demographic information relating to characteristics of
both the farm and the farmer. The questionnaire was developed following an
extensive literature review and feedback from workshops involving farmers and
stakeholders. The stakeholders included the HSA, the Farm Safety Partnership
Advisory Committee (FSPAC) and Teagasc – the agency that provides integrated
research, advisory and training services to the agriculture and food industry and
rural communities.
The same questionnaire was used in the face-to-face interviews and the postal
survey, though three additional sections were added to it for the face-to-face
interviews, on well-being, work efficiency and general safety behaviours. The
postal questionnaire was distributed to an initial sample of 3,048 farmers randomly
selected from the HSA’s farm holdings database and stratified by NUTS region.17
Farmers were asked to complete the postal survey between 8 and 31 of July 2013
and were given the option of providing an email or phone number so that they
could be entered into a prize draw. A total of 802 completed surveys were returned
to the HSA. From this, 787 were usable; this represents a 26 per cent response rate.
Together with the 49 face-to-face interviews, there was a total of 836 cases for
data analysis.
1.5.2 The completed sample and sample weighting
In order to ensure that the HSA survey was representative of all farms, we
compared key characteristics with known characteristics of the general farming
population taken from the 2010 Census of Agriculture (CSO, 2012) and the 2013
Farm Structure Survey (CSO, 2014). The Census of Agriculture is carried out across
the EU to collect data on all farms in each country about every ten years and is
supplemented by the Farm Structure Survey, which is carried out every two to
17 The Nomenclature of Territorial Units for Statistics (NUTS) were drawn up by Eurostat in order to define territorial units
for the production of regional statistics across the European Union. The Irish NUTS 3 regions comprise the eight regional authorities established under the Local Government Act, 1991 (Regional Authorities) (Establishment) Order as follows; Border, Midlands, West, Mid-west, South-west, South-east, Mid-east and Dublin (see http://www.cso.ie/en/census/census2011boundaryfiles/).
12|Risk taking and accidents on Irish farms
three years. The most recent agricultural census was carried out in 2010 and the
most recent Farm Structure Survey in 2013. The Farm Structure Survey sample is
selected using a ten-stage selection process from data on the CSO Agricultural
Register, with 100 per cent of farms selected in some instances so that the survey
is representative of farms in terms of size, economic output, farm type, new farms
and region.18
The comparison indicated that the samples differed on some demographics.
Farmers from the HSA sample tended to be younger, to work on larger farms and
were less likely to work part-time. Comparison of farm type between the CSO and
HSA samples is difficult because of the different classifications used. However, the
majority of the HSA sample was involved in dairy or dairy and other farming and
sucker cattle or dry stock cattle. This corresponds to a prevalence of beef
production followed by dairy, sheep and mixed grazing livestock in the CSO sample.
To make sure that the results were representative of the population of farms, we
reweighted the HSA survey data on the basis of farmer age, farm size and farm type
(dairy or other type) to match the figures from the CSO’s 2013 Farm Structure
Survey.
The re-calibration weights were constructed using the ReGenesees programme in
R, developed at the Italian National Institute of Statistics.19 This is an open-source
programme for design-based and model-assisted analysis of complex sampling
surveys, which incorporates a sub-routine for calibration of samples (Zardetto,
2014). The re-calibration provided weights to adjust the HSA survey sample to the
population characteristics as measured by the CSO survey and census. The method
constructed weights using the ‘logit’ distance function and constraining the range
of the weights to be as narrow as possible. This was necessary in order to minimise
the impact of the weights on the standard errors and, hence, confidence intervals
based on the weighted sample data. The control totals were farm size (five
categories), farmer age (five categories) and type (dairy specialist or other).
The next three figures show how the unweighted and weighted HSA samples
compared to the 2013 CSO survey in terms of these characteristics. As can be seen,
the weighting calibrates the HSA sample to the CSO population structure in terms
of farmer age, farm size and farm type (dairy or other).
18 See http://www.cso.ie/en/releasesandpublications/ep/p-fss/farmstructuresurvey2013/backgroundnotesappendices/. 19 ReGenesees was developed as an open-source substitution for the SAS-based version of GENESEES, to calibrate sample observations and to calculate sampling variance. It has been used at ISTAT since 2007. ReGenesees is available at JOINUP — the European Commission open source software repository https://joinup.ec.europa.eu/software/regenesees/description. Further information can be found at: http://www1.unece.org/stat/platform/display/msis/ReGenesees.

Introduction|13
In the HSA farm study, farmers were asked to indicate their age rather than provide
their exact age. Figure 1.5 compares these categories to corresponding ones in the
CSO survey.
FIGURE 1.5 COMPARISON BETWEEN SURVEYS OF FARMERS’ AGE
Source: CSO Farm Structure Survey 2013 Key Findings; Authors’ own analysis of HSA Farm Safety Research Datafile.
In both the unweighted HSA and CSO samples, a minority of farmers were aged
under 35 years (eight per cent of HSA respondents and six per cent of those from
the CSO survey). However, there are more farmers aged over 65 years in the CSO
survey (27 per cent) compared to the unweighted HSA survey (20 per cent) and
slightly less in the 35–44 years age bracket: 16 per cent compared to 21 percent.
Figure 1.6 below shows that the size of land farmed differs between the HSA and
CSO sample. At an average of 61 hectares, the average farm size in the HSA farm
study is almost twice the figure found in the CSO sample (32.5 ha in 2013). It
appears that the farmers who completed and returned the postal survey and those
who agreed to be interviewed at the marts were farmers of larger sized farms; this
suggests that the unweighted HSA sample may underrepresent farmers of smaller
sized farms. The weighting adjusts the distribution by farm size in the HSA sample
to the CSO figures.
8%
21%
26%
25%
20%
6%
16%
25%26%
27%
6%
16%
25%26%
27%
0%
5%
10%
15%
20%
25%
30%
18-34 years 35-44 years 45-54 years 55-64 years Over 65 years
HSA (2013) unweighted HSA (2013) weighted CSO (2013)
14|Risk taking and accidents on Irish farms
FIGURE 1.6 COMPARISON BETWEEN SURVEYS OF FARM SIZE
Source: CSO Farm Structure Survey 2013 Key Findings; Authors’ own analysis of HSA Farm Safety Research Datafile.
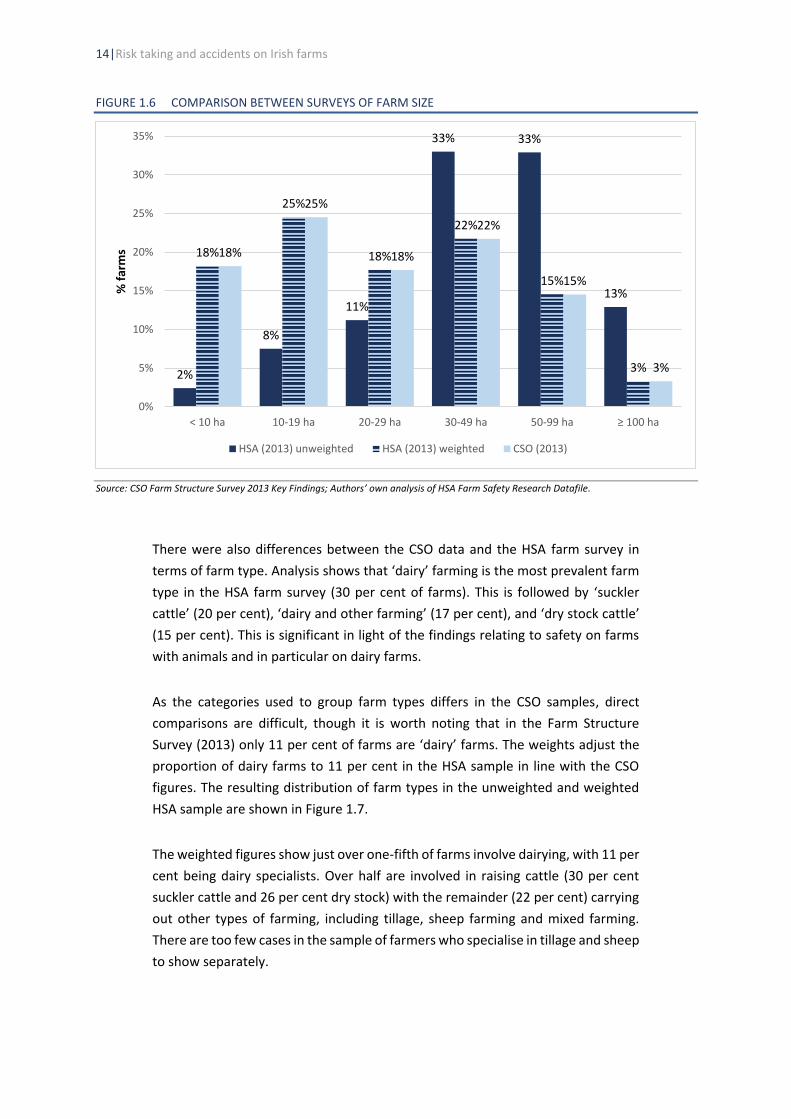
There were also differences between the CSO data and the HSA farm survey in
terms of farm type. Analysis shows that ‘dairy’ farming is the most prevalent farm
type in the HSA farm survey (30 per cent of farms). This is followed by ‘suckler
cattle’ (20 per cent), ‘dairy and other farming’ (17 per cent), and ‘dry stock cattle’
(15 per cent). This is significant in light of the findings relating to safety on farms
with animals and in particular on dairy farms.
As the categories used to group farm types differs in the CSO samples, direct
comparisons are difficult, though it is worth noting that in the Farm Structure
Survey (2013) only 11 per cent of farms are ‘dairy’ farms. The weights adjust the
proportion of dairy farms to 11 per cent in the HSA sample in line with the CSO
figures. The resulting distribution of farm types in the unweighted and weighted
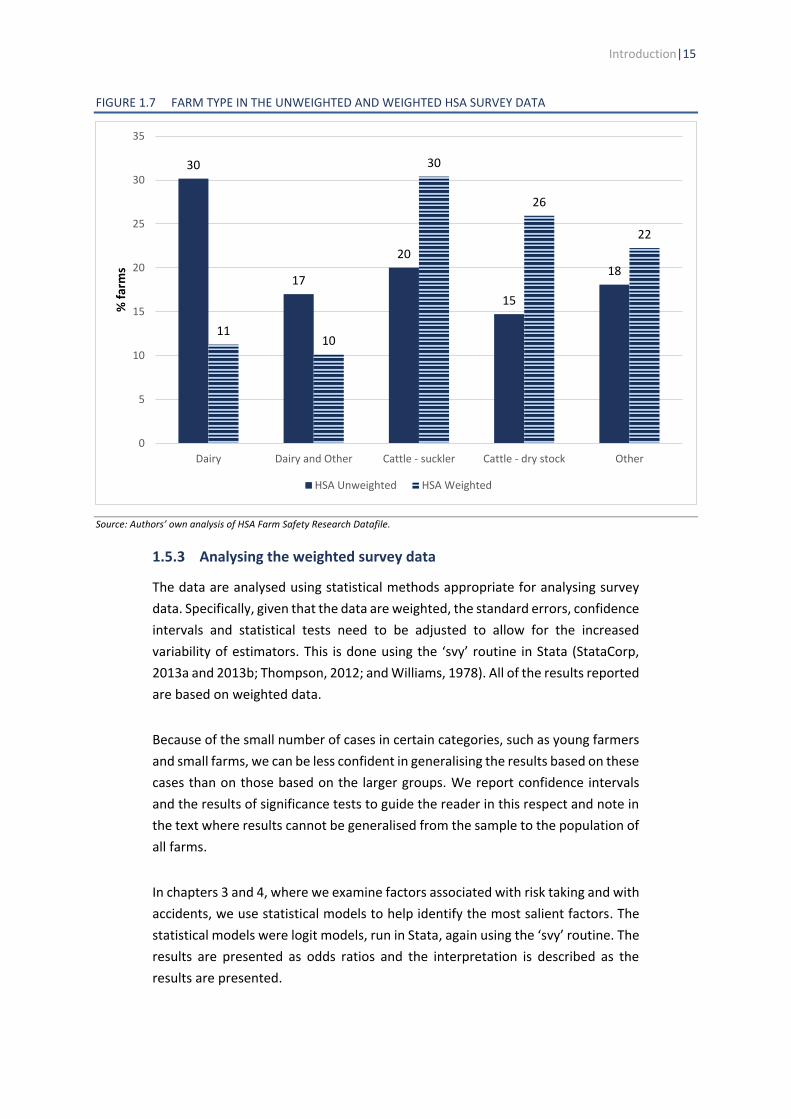
HSA sample are shown in Figure 1.7.
The weighted figures show just over one-fifth of farms involve dairying, with 11 per
cent being dairy specialists. Over half are involved in raising cattle (30 per cent
suckler cattle and 26 per cent dry stock) with the remainder (22 per cent) carrying
out other types of farming, including tillage, sheep farming and mixed farming.
There are too few cases in the sample of farmers who specialise in tillage and sheep
to show separately.
2%
8%
11%
33% 33%
13%
18%
25%
18%
22%
15%
3%
18%
25%
18%
22%
15%
3%
0%
5%
10%
15%
20%
25%
30%
35%
< 10 ha 10-19 ha 20-29 ha 30-49 ha 50-99 ha ≥ 100 ha
% f
arm
s
HSA (2013) unweighted HSA (2013) weighted CSO (2013)
Introduction|15
FIGURE 1.7 FARM TYPE IN THE UNWEIGHTED AND WEIGHTED HSA SURVEY DATA
Source: Authors’ own analysis of HSA Farm Safety Research Datafile.
1.5.3 Analysing the weighted survey data
The data are analysed using statistical methods appropriate for analysing survey
data. Specifically, given that the data are weighted, the standard errors, confidence
intervals and statistical tests need to be adjusted to allow for the increased
variability of estimators. This is done using the ‘svy’ routine in Stata (StataCorp,
2013a and 2013b; Thompson, 2012; and Williams, 1978). All of the results reported
are based on weighted data.
Because of the small number of cases in certain categories, such as young farmers
and small farms, we can be less confident in generalising the results based on these
cases than on those based on the larger groups. We report confidence intervals
and the results of significance tests to guide the reader in this respect and note in
the text where results cannot be generalised from the sample to the population of
all farms.
In chapters 3 and 4, where we examine factors associated with risk taking and with
accidents, we use statistical models to help identify the most salient factors. The
statistical models were logit models, run in Stata, again using the ‘svy’ routine. The
results are presented as odds ratios and the interpretation is described as the
results are presented.
30
17
20
15
18
1110
30
26
22
0
5
10
15
20
25
30
35
Dairy Dairy and Other Cattle - suckler Cattle - dry stock Other
% f
arm
s
HSA Unweighted HSA Weighted
16|Risk taking and accidents on Irish farms
1.6 OUTLINE OF REPORT
In this chapter, we discussed the literature on farm safety, which noted the very
high rate of fatalities in the agriculture sector relative to the numbers working
there. It also pointed to a number of factors associated with a heightened risk of
farm accidents, including use of heavy machinery, working with large livestock,
farm size (with higher risk found in the smallest and largest farms), the dairy sector,
farmer age (with the youngest and oldest farmers at high risk), inexperience,
working long hours and not implementing safety measures. We then described the
HSA Farm Safety Study, conducted in 2013, and the reweighting procedure we
used to ensure that these data are representative of all farms in terms of farmer
age, farm size and type (whether dairy or not).
In the next chapter, we present descriptive results from the HSA survey, using the
weighted data, including characteristics of the farmer and farm, risk taking, farmer
distress, work-related stress and the experience of accidents or near misses.
In Chapter 3 we examine the factors associated with risk taking, based on a
statistical model designed to disentangle the effects of related characteristics such
as farm size and farm type.
In Chapter 4 we explore the association between farmer and farm characteristics
and risk taking and the experience of farm accidents or near misses. Finally, in
Chapter 5 we draw together the results of the study to answer the research
questions and discuss the policy implications of the findings.
Characteristics of the farmer and the farm|17
CHAPTER 2
Characteristics of the farmer and the farm
2.1 INTRODUCTION
In this chapter, we present an overview of the characteristics of the farmers and
farms in the HSA survey, with the data calibrated so that they represent the Irish
population of farms in terms of farmer age, farm size and farm type (whether dairy
or not). We then discuss the measurement of risky behaviour, work-related stress
and distress as well as the indicators of farm accidents or ‘near misses’. These
indicators form the basis of the multivariate analyses in later chapters. This allows
us to examine differences in, for example, safe working practices and the
prevalence of accidents by farm and farmer characteristics.
2.2 CHARACTERISTICS OF HSA FARM STUDY OF FARMERS AND FARMS
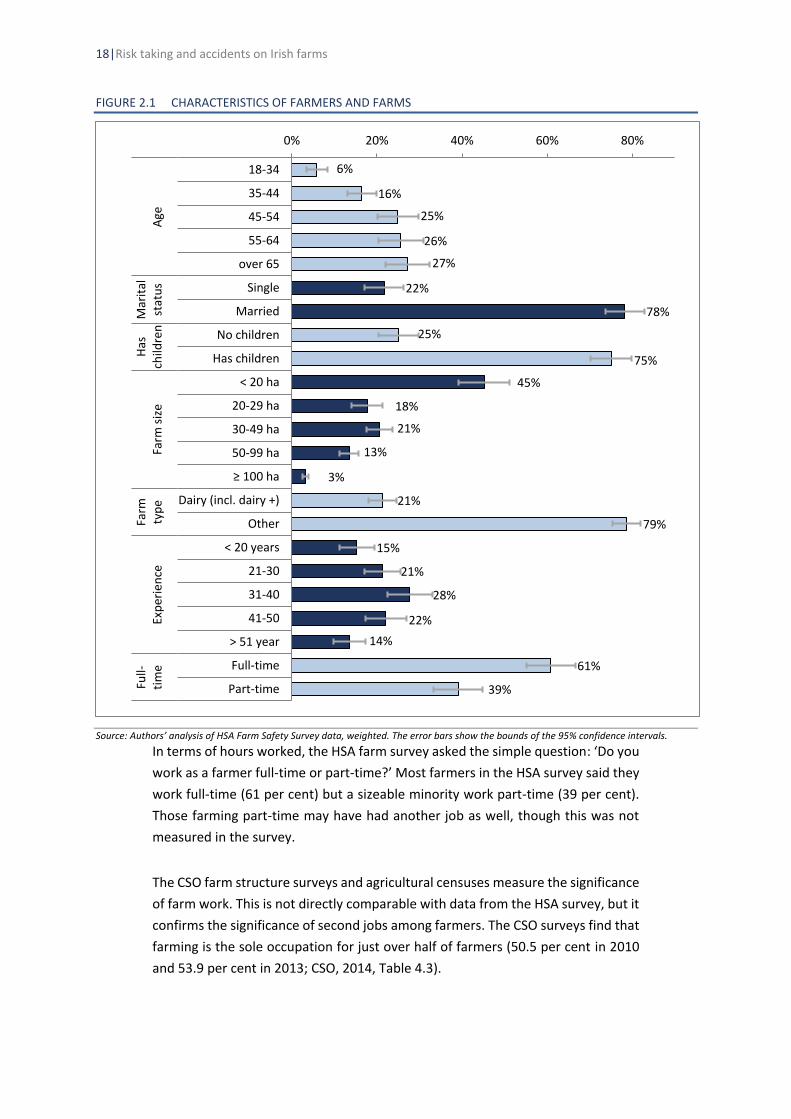
Figure 2.1 summarises the characteristics of the farmers and of the farms,
weighted to represent the population. The figure also shows the error bars
representing the 95 per cent confidence interval around the estimate. The
confidence interval is the range within which we can say with 95 per cent
confidence the population proportion lies. This will depend on how close the
sample percentage is to 50 per cent (the interval gets wider closer to this rate) and
on the sample size. For instance, the interval around the estimate of the
percentage of farms less than 20 hectares is wider than the interval around the
estimate for farms 50 to 99 hectares. This is because the percentage is closer to 50
per cent for the smaller farms and, as we saw in Figure 1.5, the number of cases is
also smaller.
As we saw in the previous chapter, farmers tend to be older, with only 22 per cent
under 45 years and 27 per cent over the age of 65. They are likely to be married
(78 per cent) and to have children (75 per cent). We do not know the ages of the
children, however – given the age profile of farmers, the figure is likely to include
adult children.
Having adjusted according to the CSO figures using weights, as described in the
previous chapter, 45 per cent of farms are under 20 hectares, 39 per cent are
between 20 and 50 hectares and just 18 per cent are over 50 hectares. We
distinguish between farms that involve dairying and other farms since the
literature suggests a higher accident rate on dairy farms. Just over one-fifth of
farms involve some element of dairying (with 11 per cent being dairy specialists, as
seen in the previous chapter). Because of their age profile, most farmers have a
good deal of experience in farming, with more than 85 per cent having at least 20
years’ experience.
18|Risk taking and accidents on Irish farms
FIGURE 2.1 CHARACTERISTICS OF FARMERS AND FARMS
Source: Authors’ analysis of HSA Farm Safety Survey data, weighted. The error bars show the bounds of the 95% confidence intervals.
In terms of hours worked, the HSA farm survey asked the simple question: ‘Do you
work as a farmer full-time or part-time?’ Most farmers in the HSA survey said they
work full-time (61 per cent) but a sizeable minority work part-time (39 per cent).
Those farming part-time may have had another job as well, though this was not
measured in the survey.
The CSO farm structure surveys and agricultural censuses measure the significance
of farm work. This is not directly comparable with data from the HSA survey, but it
confirms the significance of second jobs among farmers. The CSO surveys find that
farming is the sole occupation for just over half of farmers (50.5 per cent in 2010
and 53.9 per cent in 2013; CSO, 2014, Table 4.3).
6%
16%
25%
26%
27%
22%
78%
25%
75%
45%
18%
21%
13%
3%
21%
79%
15%
21%
28%
22%
14%
61%
39%
0% 20% 40% 60% 80%
18-34
35-44
45-54
55-64
over 65
Single
Married
No children
Has children
< 20 ha
20-29 ha
30-49 ha
50-99 ha
≥ 100 ha
Dairy (incl. dairy +)
Other
< 20 years
21-30
31-40
41-50
> 51 year
Full-time
Part-time
Age
Mar
ital
stat
us
Has
child
ren
Farm
siz
eFa
rmty
pe
Exp
erie
nce
Full-
tim
e

Characteristics of the farmer and the farm|19
Figure 2.2 shows that part-time farming is more common on smaller farms, among
younger farmers and outside the dairy sector. This is not surprising, as all else being
equal, larger farms are likely to require more labour while it would not be feasible
to manage the intensive demands of dairy farming on a part-time basis. The figure
also shows whether these differences in the rate of part-time working are
statistically significant. That is, based on the sample size and the magnitude of the
differences we observe in the sample, can we say with 95 per cent confidence that
these differences are also found in the population of all farms? The differences by
age, farm size and sector (dairy or not) are statistically significant.
FIGURE 2.2 PART-TIME FARMING BY FARMER AGE, FARM SIZE AND TYPE
Source: Authors’ analysis of HSA Farm Safety Survey data, weighted. The error bars show the bounds of the 95 per cent confidence intervals for per cent part-time within each group. * indicates a significant difference in the per cent part-time compared to the reference category in each group.
51%
43%
33%
55%
44%
22%
16%
10%
8%
47%
0% 10% 20% 30% 40% 50% 60% 70% 80% 90%
18-44*
45-54
≥ 55 (Ref.)
< 20 ha. (Ref.)
20-29 ha
30-49 ha*
50-99 ha*
≥ 100 ha*
Dairy (incl. dairy +)*
Other (Ref.)
Age
Farm
siz
eFa
rm t
ype

20|Risk taking and accidents on Irish farms
2.3 RISK TAKING
The survey measured farmers’ behaviour in terms of safe working practices on the
farm, using six items (see Table 2.1).20 These items were reverse scored and scaled
in order to get a score for farmers’ level of risky work behaviour.21 Response
categories for individual items ranged as follows; five (never), four (rarely), three
(sometimes), two (most of the time) and one (all of the time’). Therefore, higher
scores indicate a higher level of risky work behaviour. A reliability analysis showed
that the ‘risky work behaviour scale’ had an alpha level of .644, which indicates a
reasonable level of reliability. A scale based on the average across the six items
ranges from one (low risk taking) to five (high risk taking). The mean of 1.63
indicates that the average farmer tends to operate safely most of the time.
TABLE 2.1 RISKY WORK BEHAVIOUR SCALE (6 ITEMS) DESCRIPTIVE STATISTICS
Scale items % never, rarely or sometimes* Margin of error
1. I wear safety gear when
necessary (goggles, ear
defenders, high-vis etc.).
25.9% ±4.5%
2. I use restraining or handling
facilities when treating animals.
8.4% ±3.3%
3. I check that tractors and
machinery are in good working
order before use (e.g. brakes,
lights, PTOs etc.).
11.2% ±3.6%
4. I work with machinery
without a PTO or proper
guarding.*
11.9% ±3.7%
5. I keep chemicals safely
stored away from access by
children.
3.0% ±1.4%
6. I get help when I need to do
difficult jobs.
26.8% ±5.0%
Scale statistics
N valid (missing) = 828 (8); alpha = .644 (std.); scale mean (SE)= 1.63 (.03);
95% confidence intervals = 1.58–1.68; minimum = 0; maximum = 5.
Source: Authors’ analysis of HSA Farm Safety Survey data, weighted. *Risk taking refers to ‘never’, ‘rarely’ or ‘sometimes’ except for item 4 where it refers to ‘all of the time’ or ‘most of the time’ or ‘some of the time’.
Table 2.1 also shows the percentage of farmers who never, rarely or only
sometimes take each safety precaution: that is, they engage in the type of risk
taking in question. The highest prevalence is for not getting help with difficult tasks
20 The original scale contained seven items; however, one item (‘I feel anxious working around animals in close quarters’) was removed as it did not correlate well with the other items and lowered the overall scale alpha level. 21 The scale value was based on the average across the items on which responses were available.
Characteristics of the farmer and the farm|21
and not using safety gear: 27 per cent of farmers do not routinely get help and 26
per cent do not regularly use safety gear. Almost 12 per cent of farmers do not
routinely use guarding for machinery (such as a power take-off system or PTO
guard) and 11 per cent do not routinely check machinery before use. The
percentages who report not routinely using animal restraints when treating
animals is eight per cent, while just three per cent fail to keep chemicals away from
possible access by children.
2.4 EXPERIENCE OF FARM ACCIDENTS OR NEAR MISSES
Three direct questions relating to the occurrence of farm accidents were asked in
the survey. The questions asked were as follows.
1. ‘Have you personally been involved in an accident on your farm in the last ten
years?’ (Yes/No).
2. ‘Has anyone else been involved in an accident on your farm (while you were
the main farm holder/owner) in the last ten years?’ (Yes/No).
3. ‘A ‘near miss’ could be described as a ‘very lucky escape’, in other words, a
near miss is an event that occurred which may have resulted in an accident, but
by pure luck did not. Have you personally been involved in a near miss on your
farm in the last ten years?’ (Yes/No).
Analysis of the responses to these questions reveals that nearly one in eight
farmers (12 per cent) had personally experienced an accident on their farm in the
preceding ten years. About eight per cent of farmers reported that someone else
had had an accident on their farm and over one-quarter (27 per cent) had been
involved in a near miss (see Figure 2.3).22 When these responses were combined it
was found that 17.5 per cent had either been personally involved in an accident
and/or someone else had an accident on their farm, while over one-third of all
farmers had experienced any type of incident: that is, they had personally had an
accident and/or a near miss and/or someone else had had an accident on their
farm.
22 This analysis also used weighed data.

22|Risk taking and accidents on Irish farms
FIGURE 2.3 OCCURRENCE OF ACCIDENT OR NEAR MISS ON THE FARM OVER THE LAST TEN YEARS
Source: Authors’ analysis of HSA Farm Safety Survey data, weighted. The error bars show the bounds of the 95 per cent confidence intervals for each percentage.
The ten-year reference period for farm accidents is very long, and there are likely
to be recall problems leading to an under-reporting of incidents that occurred
farther in the past (Landen and Hendricks, 1995; Warner et al., 2005). However, an
accident or near miss is a significant event, so we might expect the impact of any
recall problems to mainly affect less serious incidents (Murphy, 1981; Napier et al.,
1985).
Figure 2.4 shows the distribution of responses to the question on the severity of
the accident, as measured by indicating the resulting number of days off work. The
information is available only for accidents (not for near misses). On eight per cent
of farms there had been an accident where someone was injured and had to spend
four or more days off work. On nine per cent, an accident involved someone being
injured and as a result spending no time off work or less than four days. By
definition, a fatal accident can only have occurred to someone other than the
farmer responding to the survey. A fatal accident occurred on less than one per
cent of the farms and is not shown in the figure because of the small number of
cases.
88%
12%
92%
8%
73%
27%
83%
17%
64%
36%
0%
20%
40%
60%
80%
100%
Noaccident
Hadaccident
Noaccidentinvolvinganother
Anotherinvolved in
accident
No nearmiss
Had nearmiss
Noaccident
Hadaccident
Noaccident ornear miss
Hadaccident ornear miss
Farmer personallyinvolved in accident
Someone elseinvolved in accident
Farmer personallyinvolved in a near
miss
Farmer AND/ORsomeone else had
accident
Farmer had accidentAND/OR near missAND/OR someoneelse had accident
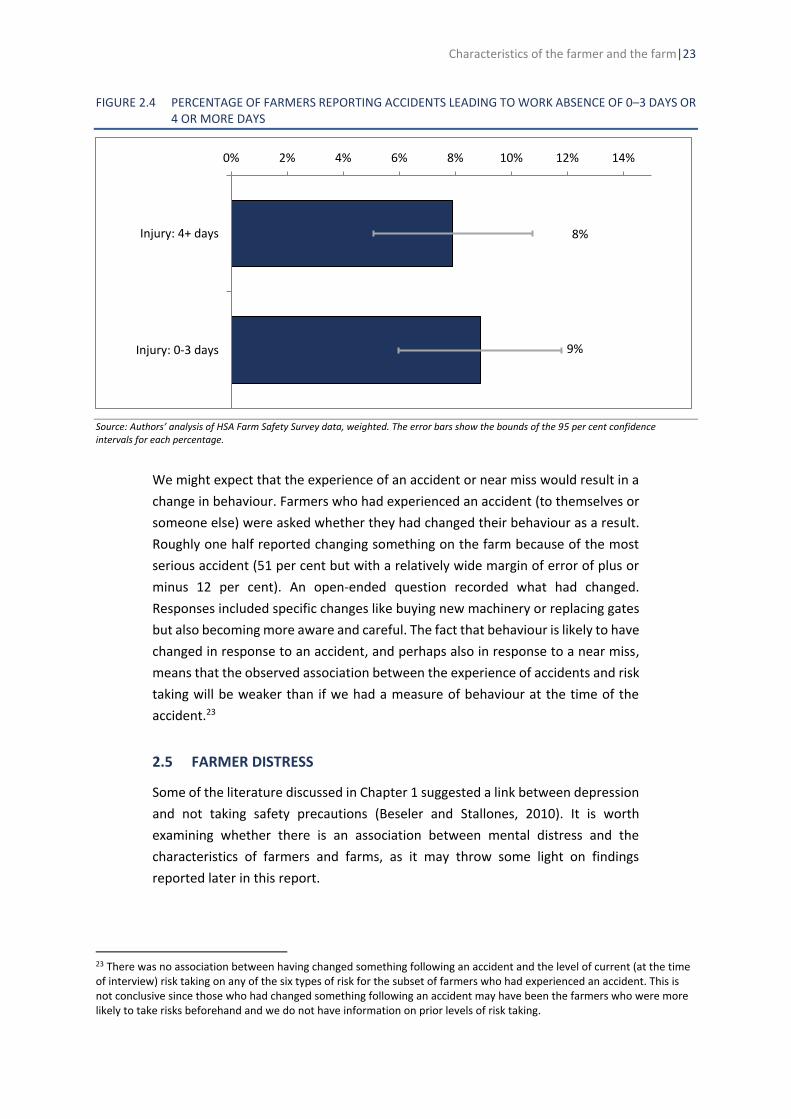
Characteristics of the farmer and the farm|23
FIGURE 2.4 PERCENTAGE OF FARMERS REPORTING ACCIDENTS LEADING TO WORK ABSENCE OF 0–3 DAYS OR 4 OR MORE DAYS
Source: Authors’ analysis of HSA Farm Safety Survey data, weighted. The error bars show the bounds of the 95 per cent confidence intervals for each percentage.
We might expect that the experience of an accident or near miss would result in a
change in behaviour. Farmers who had experienced an accident (to themselves or
someone else) were asked whether they had changed their behaviour as a result.
Roughly one half reported changing something on the farm because of the most
serious accident (51 per cent but with a relatively wide margin of error of plus or
minus 12 per cent). An open-ended question recorded what had changed.
Responses included specific changes like buying new machinery or replacing gates
but also becoming more aware and careful. The fact that behaviour is likely to have
changed in response to an accident, and perhaps also in response to a near miss,
means that the observed association between the experience of accidents and risk
taking will be weaker than if we had a measure of behaviour at the time of the
accident.23
2.5 FARMER DISTRESS
Some of the literature discussed in Chapter 1 suggested a link between depression
and not taking safety precautions (Beseler and Stallones, 2010). It is worth
examining whether there is an association between mental distress and the
characteristics of farmers and farms, as it may throw some light on findings
reported later in this report.
23 There was no association between having changed something following an accident and the level of current (at the time of interview) risk taking on any of the six types of risk for the subset of farmers who had experienced an accident. This is not conclusive since those who had changed something following an accident may have been the farmers who were more likely to take risks beforehand and we do not have information on prior levels of risk taking.
8%
9%
0% 2% 4% 6% 8% 10% 12% 14%
Injury: 4+ days
Injury: 0-3 days
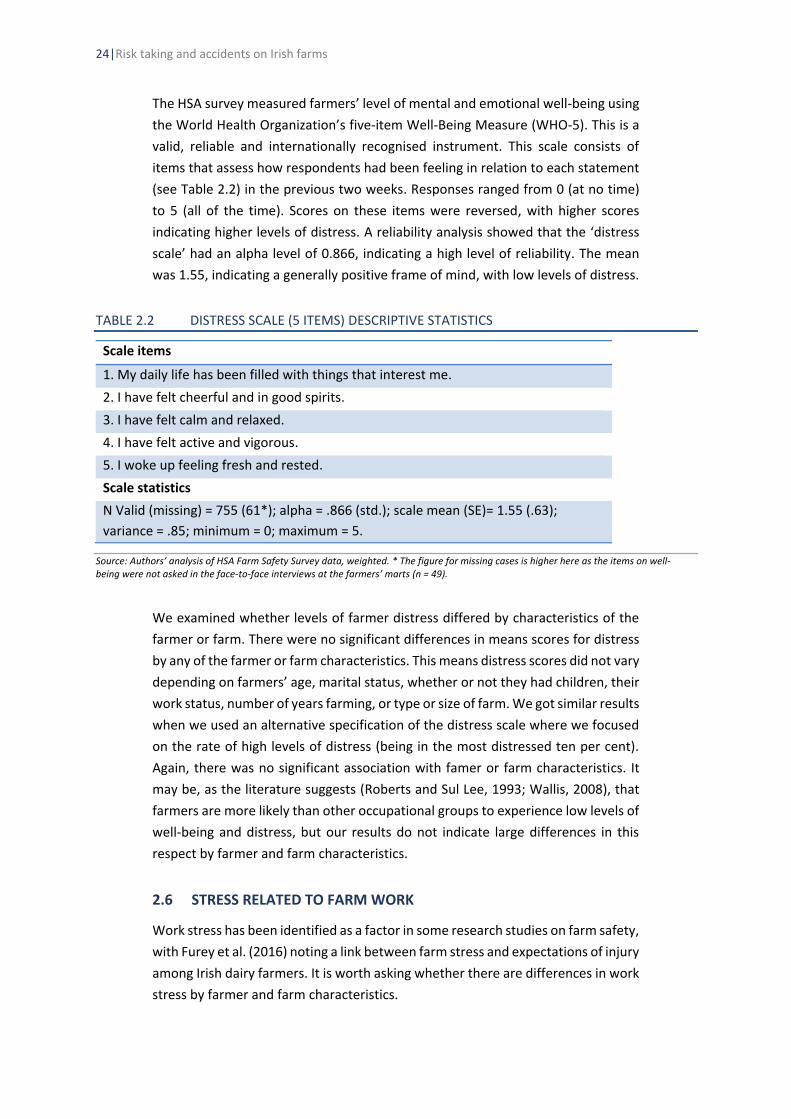
24|Risk taking and accidents on Irish farms
The HSA survey measured farmers’ level of mental and emotional well-being using
the World Health Organization’s five-item Well-Being Measure (WHO-5). This is a
valid, reliable and internationally recognised instrument. This scale consists of
items that assess how respondents had been feeling in relation to each statement
(see Table 2.2) in the previous two weeks. Responses ranged from 0 (at no time)
to 5 (all of the time). Scores on these items were reversed, with higher scores
indicating higher levels of distress. A reliability analysis showed that the ‘distress
scale’ had an alpha level of 0.866, indicating a high level of reliability. The mean
was 1.55, indicating a generally positive frame of mind, with low levels of distress.
TABLE 2.2 DISTRESS SCALE (5 ITEMS) DESCRIPTIVE STATISTICS
Scale items
1. My daily life has been filled with things that interest me.
2. I have felt cheerful and in good spirits.
3. I have felt calm and relaxed.
4. I have felt active and vigorous.
5. I woke up feeling fresh and rested.
Scale statistics
N Valid (missing) = 755 (61*); alpha = .866 (std.); scale mean (SE)= 1.55 (.63);
variance = .85; minimum = 0; maximum = 5.
Source: Authors’ analysis of HSA Farm Safety Survey data, weighted. * The figure for missing cases is higher here as the items on well-being were not asked in the face-to-face interviews at the farmers’ marts (n = 49).
We examined whether levels of farmer distress differed by characteristics of the
farmer or farm. There were no significant differences in means scores for distress
by any of the farmer or farm characteristics. This means distress scores did not vary
depending on farmers’ age, marital status, whether or not they had children, their
work status, number of years farming, or type or size of farm. We got similar results
when we used an alternative specification of the distress scale where we focused
on the rate of high levels of distress (being in the most distressed ten per cent).
Again, there was no significant association with famer or farm characteristics. It
may be, as the literature suggests (Roberts and Sul Lee, 1993; Wallis, 2008), that
farmers are more likely than other occupational groups to experience low levels of
well-being and distress, but our results do not indicate large differences in this
respect by farmer and farm characteristics.
2.6 STRESS RELATED TO FARM WORK
Work stress has been identified as a factor in some research studies on farm safety,
with Furey et al. (2016) noting a link between farm stress and expectations of injury
among Irish dairy farmers. It is worth asking whether there are differences in work
stress by farmer and farm characteristics.

Characteristics of the farmer and the farm|25
The HSA survey presented respondents with ten ‘concerns’ that could be
considered farm-related stressors. We focused on four items of ‘work–related
stress’.24 The descriptive statistics for the ‘work-related stress scale’ are shown in
Table 3.4 below. The response categories for individual items ranged as follows;
one (not at all concerned), two (a little concerned), three (concerned), four (quite
concerned) and five (very concerned). Therefore, when items were scaled, the
scores ranged from one to five, with higher scores indicating higher levels of stress.
A reliability analysis found this scale to have an acceptable alpha level of .727.
TABLE 2.3 WORK-RELATED STRESS SCALE (4 ITEMS) DESCRIPTIVE STATISTICS
Scale items
1. Government regulations and policies
2. Farm paperwork
3. Financial matters
4. Workload
Scale statistics
N valid (missing) = 827 (9); alpha = .727 (std.); mean (SE) = 3.33 (.05);
variance = .89; minimum = 1; maximum = 5. Source: Authors’ analysis of HSA Farm Safety Survey data, weighted.
The mean score on the scale was 3.33, indicating a medium level of work-related
stress. Contrary to expectations, work-related stress tended not to vary by farmer
or farm characteristics. There were no major differences in work-related stress
levels as measured here by broad age group, marital status, presence of children,
part-time working, or type or size of farm. The only significant difference was that
farms between 20 and 30 hectares were associated with a lower level of reported
stress (about 0.3 on the five-point scale) than farms under 20 hectares.
2.7 SUMMARY
In this chapter, we have provided descriptive information on the farmers and farms
in the HSA survey and discussed the measurement of risk taking and farm
accidents. We saw that, when calibrated to the population of farms, most farmers
are over 45 years (78 per cent), married (also 78 per cent) and have children (75
per cent). Because of their age profile, they are generally very experienced, with
85 per cent having 20 or more years’ experience of farm work. Farms under 30
hectares account for 63 per cent of the total and just 16 per cent are over 50
24 Principle components analysis initially resulted in three dimensions but with items grouping in an indistinct pattern. As almost 72 per cent of the sample farmers are over 45 years, the factor analysis was repeated with the sample grouped into those aged over 45 years and those under 45 years. The distribution of responses from the older age group mirrored that of the general sample; however, two distinct components of ‘work stress’ and ‘psychological stress’ were revealed among the younger farmers. As there are five items in the survey that directly measure psychological well-being (see previous section) it was deemed appropriate to retain the four ‘work stress’ items as a measure solely of work related stress.
26|Risk taking and accidents on Irish farms
hectares. About one-fifth of farmers are involved in dairying, with half that number
being dairy specialists. A considerable minority of farmers work part-time (39 per
cent) and part-time farming was more common among young farmers (51 per cent
of the 18–44 age group), on small farms (55 per cent of farms under 20 hectares)
and in farms other than dairy farms (47 per cent).
The indicator of risk taking is based on non-use of six safety procedures: using
safety gear, using animal restraints, checking machinery before use, using guards
or PTO devices on machinery, safely storing chemicals and getting help for difficult
jobs. Of these, the most common forms of risk taking were not routinely getting
help and not routinely using safety gear (27 per cent and 26 per cent).
The experience of farm accidents over the previous ten years was measured. On
about 12 per cent of farms, the farmer had experienced an accident, on eight per
cent of farms someone else had been in an accident and on 27 per cent the farmer
had been involved in a ‘near miss’. At least one of these three types of incident had
occurred on over one-third of farms in the previous ten years.
Since some previous research suggested that mental distress and work stress might
be related to reduced safety, we examined whether these varied by characteristics
of the farmers or farms. In general, they did not, with only small differences found
by farm size for work-related stress.
The next chapter focuses on variations in risk taking on farms.

Predictors of risk taking|27
CHAPTER THREE
Predictors of risk taking
3.1 INTRODUCTION
In this chapter, we focus on the factors associated with risk taking by discussing
the results of a number of multivariate statistical models. These models allow us
to isolate the impact of related factors, such as farm size and farm type, and
identify those that may be most significant in accounting for differences in risk
taking. We first examine high levels of risk taking in general, considering all six
different types of risk. We then examine each type of risky behaviour separately.
For technical reasons, factors that are highly associated with each other cannot
both be included in these models. For instance, marital status and having children
are highly associated; as some preliminary analysis suggested that having children
was less strongly associated with risk taking, this was dropped and marital status
was retained. Similarly, years of experience is very closely associated with farmer
age and farmer age seemed to have the stronger association with risk taking, so
the latter (farmer age) was retained in the models.
3.2 OVERALL RISK TAKING SCALE
The risk taking scale assigned higher scores to farmers who were less likely to take
certain safety precautions. These precautions were measured using the following
six items: wearing safety gear; use of restraining facilities to treat animals; checking
tractors and machinery for good working order; using a PTO or proper guard with
machinery; safe storage of chemicals; and getting help with difficult jobs.
3.2.1 Descriptive results on risk taking
We examine the rate of high risk taking; that is, of being in the top ten per cent on
the risky behaviour scale. This allows us to compare the features of those farmers
who scored highest on the unsafe work behaviour scale with all other farmers. We
did this because we would expect to see the impact of risk taking most clearly in
the contrast between the highest risk-takers and the majority of farmers who
rarely or never take risks. Results, using weighted data, are shown below in Figure
3.1.
These results suggest a tendency for younger farmers to be in the highest risk
taking decile, with a significant difference between the 18–34 years group (26 per
cent) and the 55-64 years group (five per cent). The rate for farmers aged 65 years
and over does not differ significantly from that for those aged 55–64 years.
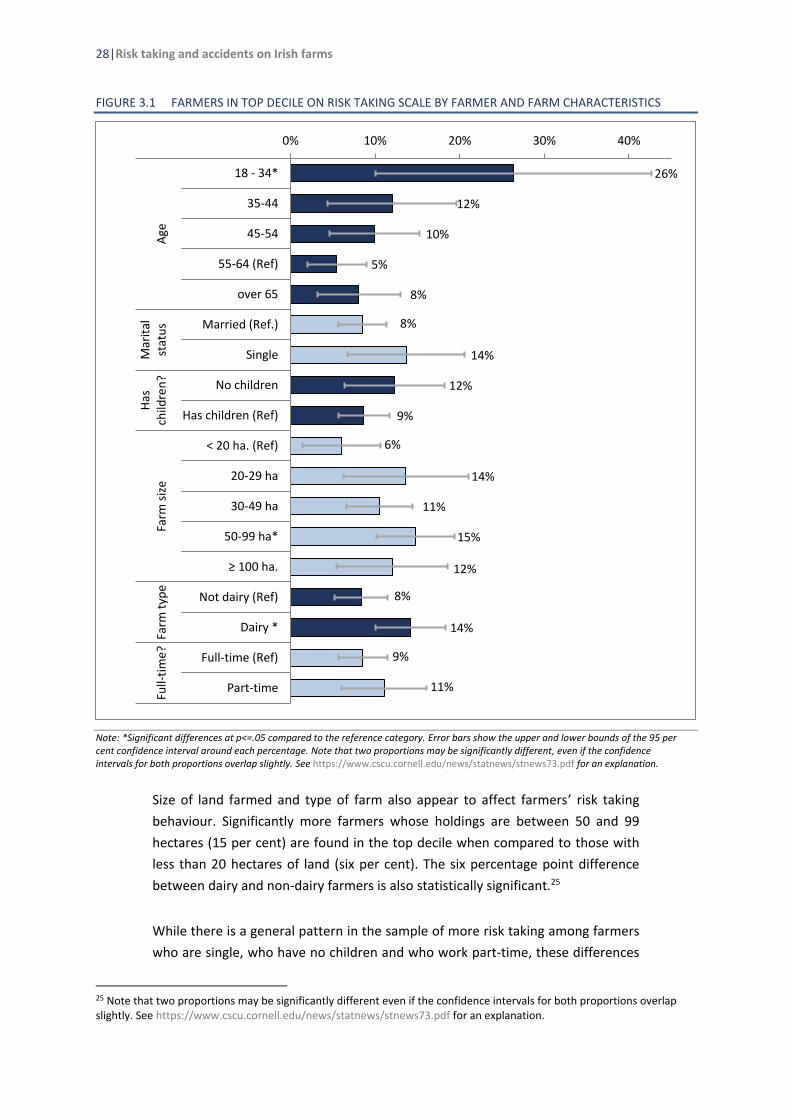
28|Risk taking and accidents on Irish farms
FIGURE 3.1 FARMERS IN TOP DECILE ON RISK TAKING SCALE BY FARMER AND FARM CHARACTERISTICS
Note: *Significant differences at p<=.05 compared to the reference category. Error bars show the upper and lower bounds of the 95 per cent confidence interval around each percentage. Note that two proportions may be significantly different, even if the confidence intervals for both proportions overlap slightly. See https://www.cscu.cornell.edu/news/statnews/stnews73.pdf for an explanation.
Size of land farmed and type of farm also appear to affect farmers’ risk taking
behaviour. Significantly more farmers whose holdings are between 50 and 99
hectares (15 per cent) are found in the top decile when compared to those with
less than 20 hectares of land (six per cent). The six percentage point difference
between dairy and non-dairy farmers is also statistically significant.25
While there is a general pattern in the sample of more risk taking among farmers
who are single, who have no children and who work part-time, these differences
25 Note that two proportions may be significantly different even if the confidence intervals for both proportions overlap slightly. See https://www.cscu.cornell.edu/news/statnews/stnews73.pdf for an explanation.
26%
12%
10%
5%
8%
8%
14%
12%
9%
6%
14%
11%
15%
12%
8%
14%
9%
11%
0% 10% 20% 30% 40%
18 - 34*
35-44
45-54
55-64 (Ref)
over 65
Married (Ref.)
Single
No children
Has children (Ref)
< 20 ha. (Ref)
20-29 ha
30-49 ha
50-99 ha*
≥ 100 ha.
Not dairy (Ref)
Dairy *
Full-time (Ref)
Part-time
Age
Mar
ital
stat
us
Has
child
ren
?Fa
rm s
ize
Farm
typ
eFu
ll-ti
me?
Predictors of risk taking|29
are not statistically significant. In other words, the weak patterns we find in the
sample are not strong enough, given the sample size and structure, for us to be
confident that the differences are also found the general population of farmers.
Box 1: Statistical models
We use statistical models to help identify the most salient factors associated with
risk taking (in Chapter 3) and the experience of accidents and near misses
(Chapter 4). The statistical models were logit models, estimated using statistical
methods appropriate for analysing complex weighted survey data (the ‘svy’
routine in Stata; see StataCorp, 2013a and 2013b; Thompson, 2012; and Williams,
1978).
Logit models are appropriate when the dependent variable is binary, such as
taking risks or experiencing an accident.
The results are presented as odds ratios and the interpretation is as follows. Let’s
say the dependent variable is risk taking and we are examining the odds ratios for
each age group compared to those aged 55 years or older (the reference
category). An odds ratio of 1 for those under age 30, for instance, would indicate
that this age group does not differ at all in terms of risk taking from those aged 55
and over. An odds ratio greater than 1 (for instance, 2) would indicate that those
under 30 are more likely to take risks (twice the odds of risk taking). An odds ratio
less than 1 (for instance 0.25) would indicate that those under 30 years are less
likely to take risks (0.25 would indicate the odds are only one-quarter as high for
those under 30 as for the reference age group).
3.2.2 Model results on risk taking
The previous section focused on the relationship between risk taking and individual
farmer and farm characteristics. We know from Chapter 2, however, that
associations exist between some of these farmer and farm characteristics. For
example, young farmers are more likely to work part-time. In this section, we
report the results of a statistical analysis designed to identify the most salient
factors. For instance, when we account for the fact that young farmers are more
likely to work part-time, do we still see differences in the incidence of risk taking
by age? Technical details on the model are shown in Box 1 (above) and the results
are summarised in Table 3.1.
Table 3.1 shows the results from a statistical model that predicts the likelihood of
a farmer being in this top ten per cent of risk-takers depending on certain farmer
and farm characteristics. These results are reported in the form of odds ratios,
which compare the odds of a particular outcome occurring among one group
against those of a reference group. Where values for the odds ratio are greater
than one we can say that this group are more likely than the reference group to

30|Risk taking and accidents on Irish farms
experience the outcome being tested. However, it should be noted that some of
the patterns observed in this sample are not statistically significant. That is, we
cannot say with 95 per cent confidence that the differences we find in the sample
are also apparent in the general population of farmers. This may be because of the
small sample size in some groups (see Figure 2.1), or the small differences observed
in the sample, or some combination of the two. In the discussion, we emphasise
those differences that are statistically significant, as indicated by the asterisks (*)
in the table.
TABLE 3.1 FACTORS ASSOCIATED WITH RISK TAKING (ODDS RATIOS)
Model 1 (Age, marital
status)
Model 2 (Add farm
size, hours)
Model 3 (Add dairy)
Model 4 (Trimmed)
Age 18–44 vs. 55+
2.47** 1.76 1.64 1.98*
45–54 vs. 55+
1.44 1.3 1.21 1.27
Marital status Single vs. married
1.57 1.68 1.75 1.70
Farm size (hectares)
21–30 ha vs. <20
2.36 2.29
31–50 ha vs. <20
1.99 1.74
51–100 ha vs. <20
2.88* 2.26
100+ ha vs. <20
2.34 1.95
Full-time Part-time vs. full-time
1.62 1.83 1.57
Farm type Dairy vs. other
1.65 2.03**
Constant 0.07*** 0.04*** 0.03*** 0.05***
N cases 823 823 823 823
Note: Weighted results with robust standard errors (Stata svy). Dependent variable is risk taking based on being in the top ten per cent on scale based on five items. *** p<0.01, ** p<0.05, * p<0.10
The results from the first model, when only farmers’ age and marital status are
included, suggest that younger farmers are about 2.5 times more likely to take risks
(Model 1 in Table 3.1). There is no difference in overall risk taking by whether a
farmer is single or married. In a separate piece of analysis, we also tested whether
farmers with children differed significantly from those without children but the
results were not statistically significant.
In Model 2, which controls for farm size and whether the farmer works full-time or
part-time, the age difference becomes non-significant. There is some tendency for
risk taking to be more common on larger farms but the statistical significance of

Predictors of risk taking|31
this pattern is only borderline (p<0.10) and is only found for one of the size
categories (51–100 hectares compared to under 20 hectares). The pattern is no
longer statistically significant in Model 3, where we add a control for being a dairy
farmer.
When we include farm type, we see that dairy farms tend to be associated with
higher odds of risky behaviour but this is not statistically significant. However, in
the final model, which is trimmed to exclude farm size, we see that the influence
of dairy farms is significant, increasing the odds of being in the high-risk group by
about twice those of non-dairy farms. In addition, age becomes significant once
more, though only marginally so. There is no significant difference for marital
status or hours worked (or for having children, which was tested but is not shown
here).
3.3 TYPES OF RISK TAKING
The model above examined the relationship between farmer and farm
characteristics and the odds of being in the group with the highest total scores for
the overall risk taking scale across all six items. We now explore how the same
characteristics affect the odds of taking risks on each of the individual items. In
other words, we are concerned with identifying what types of risky behaviour
might be associated with certain features of the farmer and the farm. This is done
by identifying those farmers who said that they adhered to safety measures never,
rarely or only sometimes. The individual items or types of risky behaviour
examined are: not wearing safety gear; non-use of animal restraint; not checking
tractors and machinery; not using a PTO or machinery guard; unsafe storage of
chemicals; and not getting help with difficult jobs.
3.3.1 Model results for types of risk taking
The results from a statistical model that explores how different types of risk taking
vary according to certain farm and farmer characteristics are shown in Table 3.2.
For several of the types of risk, middle-aged farmers (45–54 years) tend to be less
likely to take risks when compared to younger and older farmers, although this is
only of borderline significance (p<0.1). These age differences are seen in the
following types of risky behaviour: non-use of safety gear; not using animal
restraint; and improper storage of chemicals. The pattern is different for non-use
of a PTO guard, where middle-aged farmers tend to be more likely to take risks,
although, again, the significance level is just borderline.
While there were no significant differences in the model for overall high-risk scores
depending on marital status, we find that single farmers are about twice as likely

32|Risk taking and accidents on Irish farms
to fail to check that machinery is in good working order. We also tested whether
having children was associated with a greater likelihood of taking risks, but there
was no significant relationship.
Farmers from larger farms tend to be between two and three times more likely to
not use safety gear. By contrast, those with the largest farms (>100 hectares) are
less likely to fail to get help for difficult tasks (about one-third as likely). There are
no statistically significant differences between other types of risk depending on
farm size.
TABLE 3.2 FACTORS ASSOCIATED WITH TYPES OF RISK TAKING (ODDS RATIOS)
Non-use of safety gear
Non-use of animal restraint
Not checking machinery
Non-use of PTO guard
Improper storage of chemicals
Not getting help
Age 18–44 vs. 55+
1.15 0.95 1.83 1.74 0.90 1.46
45–54 vs. 55+
0.59* 0.44* 1.01 2.12* 0.33* 0.99
Marital status
Single vs. married
1.37 1.18 2.29** 1.10 0.59 1.58
Farm size (hectares)
21–30 ha vs. < 20
1.62 0.45 1.18 0.94 5.58 0.77
31–50 ha vs. < 20
1.99** 0.88 0.8 1.22 1.02 0.78
51–100 ha vs. < 20
2.71*** 0.43 0.96 1.31 3.42 1.1
100+ ha vs. < 20
2.94*** 0.73 1.10 1.14 1.8 0.37**
Hours Part- vs. full-time
1.33 0.63 1.75 1.36 3.97*** 0.95
Farm type Dairy vs. other
0.75 0.81 1.76 0.67 6.71*** 0.99
Constant 0.22*** 0.17*** 0.06*** 0.08*** 0.01*** 0.34***
N cases 823 823 823 823 823 823
Note: Weighted results with robust standard errors (STATA svy) from logit model. The dependent variable is not taking each of the six safety precautions (i.e. taking safety precautions never, rarely or sometimes). *** p<0.01, ** p<0.05, * p<0.10.
The only significant association for farmers working part-time is a greater
likelihood of not storing chemicals safely. Dairy farms are also found to be less
likely to safely store chemicals; in this instance, the odds are nearly seven times
those for non-dairy farms.
3.4 WORK-RELATED STRESS AND WORKER DISTRESS
Following from the literature reviewed in Chapter 1, we checked whether work-
related stress or farmer distress were associated with the tendency to take risks.
With the other characteristics in the model controlled (as shown in Tables 3.1 and
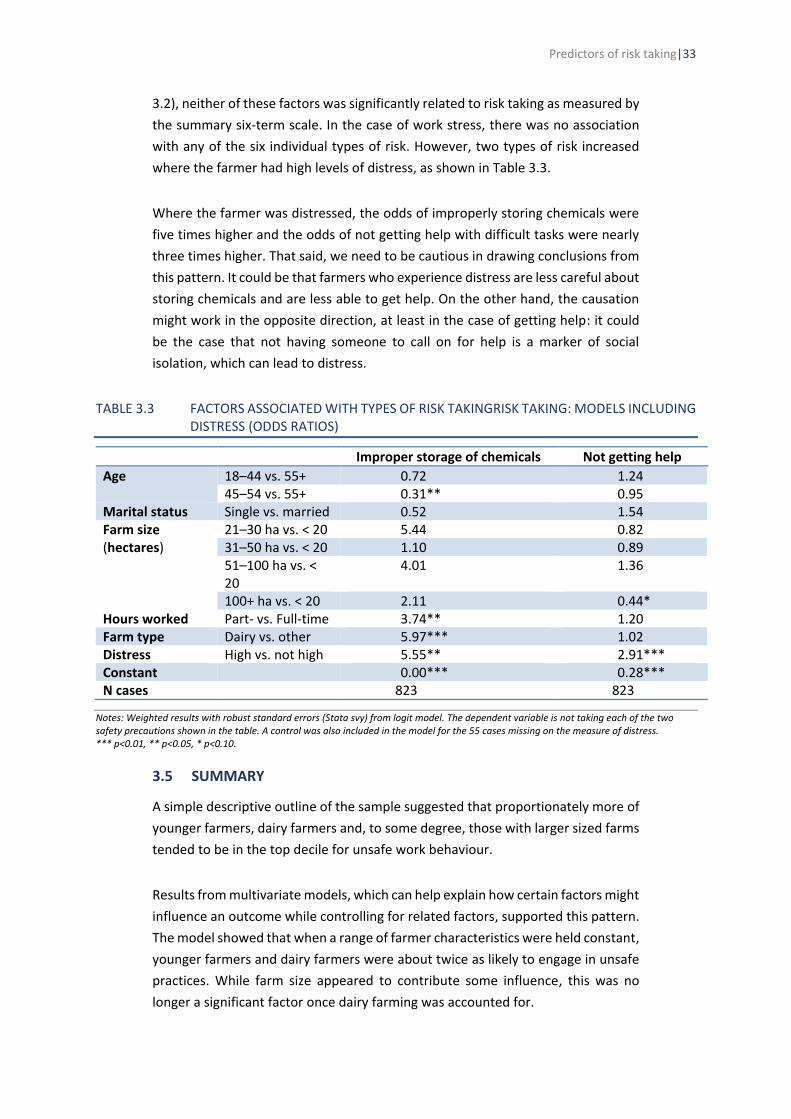
Predictors of risk taking|33
3.2), neither of these factors was significantly related to risk taking as measured by
the summary six-term scale. In the case of work stress, there was no association
with any of the six individual types of risk. However, two types of risk increased
where the farmer had high levels of distress, as shown in Table 3.3.
Where the farmer was distressed, the odds of improperly storing chemicals were
five times higher and the odds of not getting help with difficult tasks were nearly
three times higher. That said, we need to be cautious in drawing conclusions from
this pattern. It could be that farmers who experience distress are less careful about
storing chemicals and are less able to get help. On the other hand, the causation
might work in the opposite direction, at least in the case of getting help: it could
be the case that not having someone to call on for help is a marker of social
isolation, which can lead to distress.
TABLE 3.3 FACTORS ASSOCIATED WITH TYPES OF RISK TAKINGRISK TAKING: MODELS INCLUDING DISTRESS (ODDS RATIOS)
Improper storage of chemicals Not getting help
Age 18–44 vs. 55+ 0.72 1.24 45–54 vs. 55+ 0.31** 0.95
Marital status Single vs. married 0.52 1.54 Farm size (hectares)
21–30 ha vs. < 20 5.44 0.82 31–50 ha vs. < 20 1.10 0.89 51–100 ha vs. < 20
4.01 1.36
100+ ha vs. < 20 2.11 0.44* Hours worked Part- vs. Full-time 3.74** 1.20 Farm type Dairy vs. other 5.97*** 1.02 Distress High vs. not high 5.55** 2.91*** Constant 0.00*** 0.28*** N cases 823 823
Notes: Weighted results with robust standard errors (Stata svy) from logit model. The dependent variable is not taking each of the two safety precautions shown in the table. A control was also included in the model for the 55 cases missing on the measure of distress. *** p<0.01, ** p<0.05, * p<0.10.
3.5 SUMMARY
A simple descriptive outline of the sample suggested that proportionately more of
younger farmers, dairy farmers and, to some degree, those with larger sized farms
tended to be in the top decile for unsafe work behaviour.
Results from multivariate models, which can help explain how certain factors might
influence an outcome while controlling for related factors, supported this pattern.
The model showed that when a range of farmer characteristics were held constant,
younger farmers and dairy farmers were about twice as likely to engage in unsafe
practices. While farm size appeared to contribute some influence, this was no
longer a significant factor once dairy farming was accounted for.

34|Risk taking and accidents on Irish farms
We then examined how farm and farmer characteristics might affect different
types of unsafe work practices. Again, age was significant (although only
marginally), indicating that middle-aged farmers tended to take fewer risks
compared to younger and older farmers on a number of risk types. These farmers
were less likely to say that they did not use safety gear, did not use animal
restraining methods and did not store chemicals correctly. They were more likely,
however, not to use a PTO guard. Single farmers were more than twice as likely to
fail to check that machinery was working properly. Farmers from larger farms were
between two and three times more likely to not use safety gear. Those with the
largest farms were less likely to not get help for difficult tasks. Dairy farmers and
those working part-time were more likely to improperly store chemicals.
Work-related stress was measured in terms of concern about workload,
paperwork, government regulation and bad weather. This was not related to risk
taking, however. Distress, as measured by five questions on how the farmer had
been feeling lately, was related to two types of risk. Where the farmer had high
levels of distress, the odds of improperly storing chemicals were five times higher
and the odds of not getting help with difficult tasks were nearly three times higher.
However, the overall rate of improperly storing chemicals (i.e. storing them where
children may reach them) is very low. We caution that these associations do not
necessarily imply causation. Farmers experiencing distress may be less likely to
seek help with difficult tasks, or it might be that both the experience of distress
and difficulty getting help may be related to another underlying factor, such as
social isolation.

Factors associated with farm accidents|35
CHAPTER 4
Factors associated with farm accidents
4.1 INTRODUCTION
In this chapter, we turn to the occurrence of accidents on farms and use
multivariate modelling to examine how the number of incidents and different
types of farm accidents might vary according to the same farmer and farm
characteristics used in the previous chapter. We include risk taking in these models
as an additional characteristic in order to assess any influence this might have on
farm accidents. Risk taking is added in both forms described in Chapter 3. This
means that both the top-scoring decile and those who scored highest on each of
the six individual indicators are examined. As mentioned, marital status and having
children are highly interrelated; in this instance, initial analysis indicated a slightly
stronger association between having children and accident occurrence so this was
indicator was retained and marital status dropped.
We begin by presenting descriptive results showing the relationship between
accidents and farmer and farm characteristics. We then present the results of some
statistical models designed to isolate the most important factors causing variations
in accident levels. Two sets of models are presented. The first looks at the
characteristics associated with the occurrence of any type of farm accident or near
miss. A second set of models examines the different types of incident separately:
whether the farmer was personally involved in an accident, whether someone else
was involved in an accident on the farm and whether the farmer was involved in a
near miss.
4.1.1 Descriptive relationship between farming accidents or near misses
and farmer or farm demographics
Figure 4.1 shows how different farmer and farm characteristics may affect the
occurrence of ‘any type of accident’ (i.e. farmer personally had an accident and/or
a near miss and/or someone else had an accident on their farm). As with risk taking,
there appears to be an association between accident occurrence and younger
farmers in the sample, although this time the age pattern is not significant.
Accident occurrence also varies by farm type, with 46 per cent of dairy farmers
having experienced any type of accident, compared to 33 per cent of non-dairy
farmers. Finally, land size appears to have a strong effect, with a tendency for more
accidents to occur on larger farms. This difference is significant in respect of farms
from 30–50 hectares (42 per cent) and 50–100 hectares (52 per cent) compared to
the reference group of those less than 20 hectares.
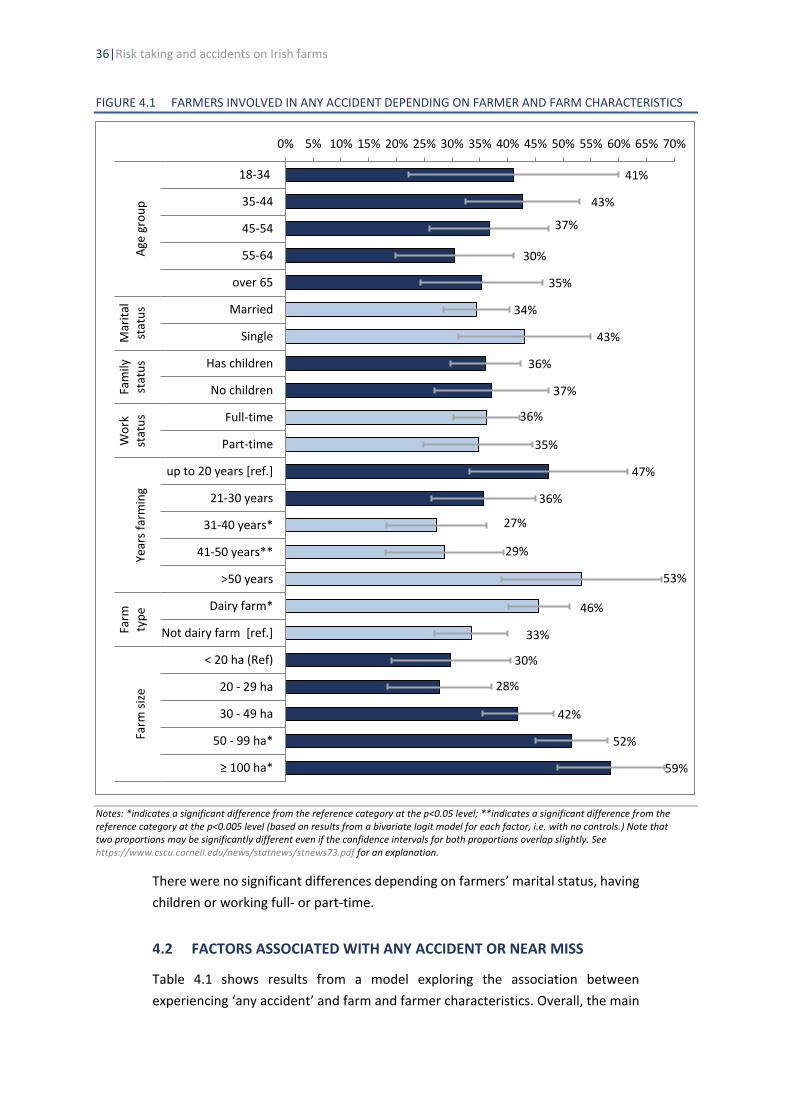
36|Risk taking and accidents on Irish farms
FIGURE 4.1 FARMERS INVOLVED IN ANY ACCIDENT DEPENDING ON FARMER AND FARM CHARACTERISTICS
Notes: *indicates a significant difference from the reference category at the p<0.05 level; **indicates a significant difference from the reference category at the p<0.005 level (based on results from a bivariate logit model for each factor, i.e. with no controls.) Note that two proportions may be significantly different even if the confidence intervals for both proportions overlap slightly. See https://www.cscu.cornell.edu/news/statnews/stnews73.pdf for an explanation.
There were no significant differences depending on farmers’ marital status, having
children or working full- or part-time.
4.2 FACTORS ASSOCIATED WITH ANY ACCIDENT OR NEAR MISS
Table 4.1 shows results from a model exploring the association between
experiencing ‘any accident’ and farm and farmer characteristics. Overall, the main
41%
43%
37%
30%
35%
34%
43%
36%
37%
36%
35%
47%
36%
27%
29%
53%
46%
33%
30%
28%
42%
52%
59%
0% 5% 10% 15% 20% 25% 30% 35% 40% 45% 50% 55% 60% 65% 70%
18-34
35-44
45-54
55-64
over 65
Married
Single
Has children
No children
Full-time
Part-time
up to 20 years [ref.]
21-30 years
31-40 years*
41-50 years**
>50 years
Dairy farm*
Not dairy farm [ref.]
< 20 ha (Ref)
20 - 29 ha
30 - 49 ha
50 - 99 ha*
≥ 100 ha*
Age
gro
up
Mar
ital
stat
us
Fam
ilyst
atu
sW
ork
stat
us
Year
s fa
rmin
gFa
rmty
pe
Farm
siz
e

Factors associated with farm accidents|37
differences are by farm size and risk taking. Model 1 shows that those farming on
larger farms are more likely to have had an accident or near miss when factors
including age, having children, farm type and full- or part-time status are controlled
(odds ratio of between 2.5 and 3.5 times for those farming 51–100 hectares and
over 100 hectares, compared to farmers with land less than 20 hectares). The later
models indicate that this pattern remains significant when we control for being in
the top decile in terms of risk taking (Model 2) and for those scoring highly on each
of the individual risk taking indicators (Model 3).
TABLE 4.1 FACTORS ASSOCIATED WITH ANY ACCIDENT OR NEAR MISS (ODDS RATIOS)
Model 1 Model 2 Model 3
Age Age 18–44 vs. 55+ 1.18 1.15 1.03
Age 45–54 vs. 55+ 1.12 1.12 1.1
Family Has children 1.03 1.06 1.14
Size 21–30 ha vs. < 20 1.05 1 1.1
31–50 ha vs. < 20 1.86* 1.82 2.12*
51–100 ha vs. < 20 2.68** 2.57** 2.86**
≥ 100 ha vs. < 20 3.63*** 3.54*** 4.54***
Hours Part-time vs. full-time 1.23 1.18 1.21
Type farm Dairy vs. other 1.03 0.99 0.98
Risk taking Top 10% on risk scale 2.04*
Non-use of safety gear
1.08
Non-use of animal restraint 0.89
Not checking machinery
2.75*
Not using PTO guard 0.91
Improperly storing chemicals
0.85
Not getting help 2.40**
Constant 0.34** 0.33** 0.22***
N cases 801 801 801
Notes: Weighted results with robust standard errors (STATA svy). The results come from a logit model where the dependent variable is having experienced any accident of near miss in the past ten years. *** p<0.01, ** p<0.05, * p<0.10.
Not getting help when dealing with difficult tasks had the biggest impact (odds
ratio of 2.4). Note that since the farmers in the study are self-employed with no
full-time employees, it may have been difficult for them to call on someone else
for help. Not checking machinery was associated with an increased risk of
borderline statistical significance (p<0.1), compared to farmers who do check
machinery. This is consistent with findings from Belgium of an association between
injury and unsafe use of machinery (Van den Broucke and Colémont, 2011).
38|Risk taking and accidents on Irish farms
The overall risk taking scale was associated with twice the odds of accidents in the
sample for those in the top ten per cent on the risky behaviour scale, but this was
also of only borderline significance (p<0.1).
When controlled for, there was no association between accidents or near misses
and any of these characteristics: farmer age; marital status or having children;
whether the farmer worked full-time or part-time; or whether or not the farm was
a dairy farm.
4.3 FACTORS ASSOCIATED WITH DIFFERENT TYPES OF ACCIDENTS AND
NEAR MISSES
The previous model focused on experiencing a combination of any type of accident
as an outcome. Now we explore variation across each of the three different
accident types: the farmer personally having an accident on the farm; someone
else having an accident on the farm; and the farmer personally having a near miss.
Two models are shown in Table 4.2: Model 1 examines the association with farmer
and farm characteristics and the overall indicator of risk taking, while Model 2
distinguishes the different types of risk taking.
Here, we see again that farm size is the biggest cause of variation, particularly for
having experienced a near miss, with the odds of this more than six times as high
for farming 100 or more hectares, compared to farming less than 20 hectares,
when all the types of risk taking are controlled for. Land size also appears to
influence the odds of a farmer actually experiencing an accident but is not a
significant factor for someone else having an accident on the farm.
Turning to the relationship between accident type and risk taking, we see that
being in the top decile of the overall scale was a factor only for farmers personally
experiencing an accident and that this is only marginally significant (p<=.10).
When the individual indicators of risk taking are analysed separately, again we find
that not checking machinery and not getting help are significant contributors to
the occurrence of different types of accident. Not checking machinery is associated
with four times the odds of someone other than the farmer having an accident and
the chances of the farmer experiencing a near miss. Not getting help increases the
odds of the farmer reporting an accident by 2.5 times and a near miss by 2.3 times
(with the latter of borderline statistical significance).

Factors associated with farm accidents|39
TABLE 4.2 FACTORS ASSOCIATED WITH DIFFERENT TYPES OF ACCIDENT OR NEAR MISS (ODDS RATIOS)
VARIABLES Farmer accident Other accident Near miss
Model 1 Model 2 Model 1 Model 2 Model 1 Model 2
Age Age 18–44 vs. 55+ 0.63 0.57 3.02 2.76 1.52 1.33
Age 45–54 vs. 55+ 1.06 1.03 1.02 0.93 1.91 1.84
Family Children 0.68 0.65 0.71 0.83 1.04 1.18
Size 21–30 ha vs. <20 1.58 1.85 0.32 0.32 1.37 1.54
31–50 ha vs. <20 2.26 2.51 0.37 0.39 2.39* 2.94***
51–100 ha vs. <20 4.15** 4.48** 0.82 0.84 2.98** 3.51***
100+ ha vs. <20 4.14* 5.12*** 1.05 0.99 4.47*** 6.15***
Hours Part-time vs. Full-time 0.65 0.67 0.44 0.38 1.8 1.88*
Type farm Dairy vs. other 0.80 0.85 0.47 0.45 1.22 1.21
Risk taking Top 10% risky behaviour
2.54*
2.03
1.71
Non-use of safety gear
1.49
1.45
0.77
Non-use of animal restraint
1.58
0.97
0.56
Not checking machinery
1.59
4.43**
3.61**
Not using PTO guard
0.83
0.84
1.11
Improperly storing chemicals
1.09
0.62
0.7
Not getting help
2.47**
0.83
2.28*
Constant
0.12** 0.07*** 0.16** 0.13*** 0.07*** 0.07***
N cases
812 812 810 810 807 807
Note: Weighted results with robust standard errors (Stata svy). The results come from a logit model where the dependent variable is having experienced the different types of accident (to the farmer, to others) or near miss in the past ten years. *** p<0.01, ** p<0.05, * p<0.10.
As shown previously, no association was found between the occurrence of
accidents or near misses and farmer age, having children, farm type and whether
the farmer worked full- or part-time.
4.4 SUMMARY
A descriptive account of the link between accidents and farmer and farm
characteristics indicated that age did not significantly affect the proportion of
farmers reporting any type of accident. Dairy farmers and those with larger farms
were more likely to have experienced an accident or near miss on the farm.
The statistical analysis allowed us to identify the most salient factors, controlling
for the fact that characteristics of the farmer and farm were correlated. This
analysis suggested that farm size and risk taking were the most important
predictors of near misses or accidents. Farmers on larger farms were more likely
to have had an accident or near miss. Risk taking also had an independent effect
40|Risk taking and accidents on Irish farms
on the likelihood of experiencing some form of accident, of not getting help with
difficult tasks, of not checking machinery. Being in the top decile of the overall risk
taking scale were all associated with more than twice the odds of experiencing an
accident or near miss (although the latter two factors are only marginally
significant).
When each of the different accident types were examined separately as outcomes,
we found again that farm size and risky work practice were the most salient factors.
Farming 100 or more hectares was associated with odds of having had a near miss
over six times higher when other factors (including risk taking) were controlled for.
The individual indicators of risk point to a link between not checking machinery
and someone other than the farmer having an accident. The farmer experiencing
a near miss while not getting help was associated with the farmer personally having
had an accident.
Although some of the literature suggested a link between inexperience and the risk
of accidents, we were unable to examine this in the statistical models. Level of
experience is strongly correlated with farmer age so it was not possible to include
both in the statistical models. Moreover, the questions asked about the occurrence
of accidents over the previous ten years, so the prevalence of accidents may be
underestimated among farmers with less than ten years’ experience because they
had a shorter period of exposure. In addition, there is no information on how long
ago the accident occurred.
In Chapter 3, we examined the association between risk taking and both stress and
distress. This is because the literature suggested such an association and it might
be reasonable to expect that risk taking would be increased if the farmer was
distracted by work-related stress or by distress. We did not examine the
association between accidents and either stress or distress, however, because it
would be very difficult to say whether the stress and distress were either present
as a result of experiencing the accident, or contributed to the accident occurring.
This is particularly true given that stress and distress were measured at the time of
the interview whereas the accident or near miss might have occurred up to ten
years in the past.

Conclusions and implications|41
CHAPTER 5
Conclusion and implications
5.1 INTRODUCTION
In the context of high fatalities in agriculture, relative to other sectors, this report
sought to draw on a 2013 Health and Safety Authority (HSA) survey to examine the
factors associated with risk taking on farms and with the occurrence of accidents
or near misses. A review of the literature pointed to a number of factors that were
likely to be important, including farm size, farmer age, type of farm (with higher
risks observed for dairy farms). In revisiting the 2013 HSA farm survey, this study
examines risk taking and the experience of accidents and near misses on farms.
The 2013 survey, conducted for the HSA by GL Noble Denton, was completed (in
most cases by post) by 836 self-employed farmers who were primarily contacted
via the HSA’s farm holdings database. It was a random sample, stratified by region,
with a response rate of 26 per cent. The questionnaire included items on safe
working practices, attitudes to working safely, factors that influence or create
barriers to safe working and the occurrence of accidents on the farm. There are
also items measuring levels of work-related stress and well-being along with
demographic information relating to characteristics of both the farm and the
farmer.
The initial report on the survey provided a mainly descriptive analysis, with a
particular emphasis on intentions to work safely (HSA, 2014). The present analysis
went beyond the earlier work in two respects. Firstly, it reweighted the sample
data to better represent the population of all farms in terms of farmer age, farm
size and farm type. Secondly, it went beyond descriptive results to conduct a
statistical analysis of risk taking and of accident experience designed to isolate the
relative importance of related factors such as farmer age and farm size.
The research questions focused on:
• factors associated with risk taking, including characteristics of the farmer (age,
marital status, full- or part-time work, number of years farming experience) and
of the farm (farm size, farm type);
• variations in work stress factors and levels of distress by farmer and farm
characteristics; and
• factors associated with experiencing an accident or near miss, including
characteristics of the farmer (age, marital status, full- or part-time work) and of
the farm (farm size, farm type) as well as risk taking.

42|Risk taking and accidents on Irish farms
The findings are summarised below, followed by an analysis of their implications
for health and safety policy and practices in the agricultural sector.
5.2 RISK TAKING
Six indicators of risk taking were used. Farmers were asked how much of the time
they took each of six precautionary measures: using safety gear (such as goggles,
ear defenders); using restraining or handling facilities when treating animals;
checking that machinery is in good working order; using PTO or guarding with
machinery; keeping chemicals stored away from access by children; and getting
help with difficult jobs. We take risk taking in each of these areas to involve using
the safety measure only ‘sometimes’ or less often. The most common types of risky
behaviour were not getting help with difficult jobs (27 per cent) and not wearing
safety gear (26 per cent). About 12 per cent of farmers took risks in not checking
machinery before use. Each of the other types of risk was taken by fewer than one
in ten of farmer respondents.
An overall indicator identified farmers who were in the highest ten per cent of risk
taking across the six types of risk. In this respect, younger farmers were more likely
than older farmers to take risks. The same was true of dairy farmers compared to
other farmers. Risk taking was lower on the smallest farms. There was no
significant association with marital status, having children or working part-time.
The statistical model that took account of a number of factors at once pointed to
farm type as the main factor, with a higher probability of being a risk-taker on dairy
farms. There was also a tendency for the younger farmers to be risk-takers, though
this was only of borderline statistical significance when farm type was controlled.
We also examined the different types of risk separately. In a number of respects,
middle-aged farmers (45–54 years) showed some tendency to be less likely to be
risk-takers than older and younger farmers. This was true regarding non-use of
safety gear, non-use of animal restraints and not safely storing chemicals. This
group was more likely than older farmers to not use the PTO system on tractors.
However, these age-related differences were only of borderline statistical
significance (p<=.10).
Single farmers were more likely to take risks in not checking machinery before use.
In other respects, they did not differ significantly from their married counterparts.
In some preliminary analysis, we had established that there were no differences
between farmers with and without children when we took account of marital
status, age and farm type.
There were statistically significant differences by farm size for two types of risk:
those farming a higher number of hectares were more likely to not use safety gear

Conclusions and implications|43
but were less likely to not get help with difficult tasks. For instance, compared to
farms under 20 hectares, the odds of not using safety gear were at least twice as
high on farms over 50 hectares. On farms over 100 hectares, the odds of not getting
help were only one-third as high as those for farms under 20 hectares. Although
the farmers in the study did not have any regular employees, it may be that the
larger farms have more part-time or seasonal employees. This might account for
the greater propensity to get help with difficult tasks (about three times higher
than on the smallest farms).
Part-time farmers showed some tendency to have a higher rate of risk taking but
this was only statistically significant for improper storage of chemicals, where the
odds were nearly four times higher than for full-time farmers. It is also in terms of
improper storage of chemicals that dairy farmers stand out, with odds that are over
six times higher than those for non-dairy farmers. (As already noted, the overall
proportion of farmers taking risks in this respect is low.)
5.3 FARMER DISTRESS AND WORK STRESS
We examined work-related stress and the experience of mental distress because
the literature suggested that these may be associated with a greater propensity to
take risks. In general, farmers reported low levels of distress and a medium level
of concern regarding work issues. Distress was measured using the five-item scale
capturing the extent to which the farmer respondent had recently felt cheerful,
calm and relaxed, active and vigorous, feeling rested in the morning and that life
was filled with things of interest. The scale was coded to range from one (low
distress) to five (high distress). The average score was towards the low end of the
spectrum at 1.55.
Work-related stress was measured on the basis of level of concern regarding four
issues: government regulation and policies, farm paperwork, financial matters and
workload. The scale was coded to range from one (low stress) to five (high stress).
The average was towards the middle, at 3.35.
Although some previous research had suggested a link between risk taking and
stress or distress, we did not see this pattern in the present data for work-related
stress, once we controlled for farmer and farm characteristics. Mental distress was
associated with a greater likelihood of improperly storing chemicals (i.e. where
they might be reached by children), however, and also with a greater likelihood of
not getting help with difficult tasks. It should be noted that the overall rate of
storing chemicals where they might be reached by children was very low, however,
so even when the risk was higher in relative terms, the large majority of farmers
did not take this type of risk. In the case of not getting help, it could be that both
mental distress and not getting help are caused by the farmer being relatively

44|Risk taking and accidents on Irish farms
isolated. We cannot, therefore, infer a causal relationship between mental distress
and risk taking.
5.4 ACCIDENTS AND NEAR MISSES
Three indicators of the occurrence of accidents or near misses on a farm over the
previous ten years were identified: whether the farmer had personally been
involved in an accident on the farm, whether someone else had been involved in
an accident on the farm and whether the farmer had been involved in a near miss
or ‘lucky escape’ on the farm. Where an accident actually occurred, in about half
of cases, it resulted in injury leading to four or more days’ absence from work. (By
the very nature of the survey methodology, fatal accidents involving the farmer
would not be covered.)
We conducted a series of statistical analyses to examine the association between
farmer and farm characteristics, including risk taking, and the experience of
accidents.
Turning first to the experience of any accident or near miss, the only significant
association was with farm size. An accident or near miss was more likely to occur
on a larger farm than a smaller one. For instance, the odds of an accident or near
miss were over three times higher on a farm of more than 100 hectares than on a
farm of less than 20 hectares. This pattern remained statistically significant when
risk taking was taken into account, with the relationship tending to be even
stronger (odds more than four times higher for the largest than the smallest farms).
Risk taking was associated with a higher probability of having experienced an
accident or near miss, but the only statistically significant relationship was with not
getting help with difficult tasks. The odds of having an accident or near miss were
over twice as high for those who do not get help than for those who do. There was
also a higher risk in the sample associated with not checking machinery, but we
cannot be sure this reflects a pattern in the general population of farmers.
Having had an accident or near miss was more likely among young farmers and
part-time farmers, but the pattern was weak and not statistically significant.
We then looked separately on accidents or near misses involving the farmer
himself and those accidents involving others. Farmer accidents and near misses
were both associated with larger farms but there was no significant association
with farm size in the case of accidents involving others. In terms of safety practices,
we saw that not getting help was more strongly associated with an accident
involving the farmer than accidents involving others. Not checking machinery was
significantly associated with accidents involving others and near misses.

Conclusions and implications|45
5.5 LIMITATIONS AND FUTURE RESEARCH
Behaviour is likely to have changed in response to an accident or near miss. This
means that the observed association between the experience of accidents and risk
taking will be weaker than if we had a measure of behaviour before the accident.
As a result, the associations in the data between risk taking and accidents are likely
to represent the lower bound estimate of the strength of the causal relationship.
Because the sample departed from the structure of the population of farms in
many respects, including farmer age, farm size and type, we needed to apply
sample weights and use the correct techniques to analyse the weighted data. This
led to a considerable loss of power when it came to statistical tests. As a result,
many of the patterns we saw in the sample could not be generalised to the
population. In other words, even differences that seemed quite marked in the
sample were not statistically significant. The correction to a biased sample using
weights comes at a cost. The standard errors are larger, the confidence intervals
are wider and only large differences can be detected as statistically significant.
In future research on farms or other workplaces, when the intention is to
generalise the results to all farms or workplaces, this loss of statistical power from
a biased sample should be kept in mind.
One issue we could not explore in the current survey was the impact of
inexperience on farm safety. This was affected by the very long reference period
for farm accident experiences (ten years) and the small size of the group that had
recently begun farming. The period of exposure to farm work for young farmers
might well be less than ten years, but without information on when the accident
occurred we could not make an adjustment for period of exposure.
5.6 POLICY DISCUSSION
5.6.1 Help with difficult tasks
The results indicated that over one-quarter of farmers (27 per cent) do not
routinely get help with difficult tasks. This practice is associated with an increased
risk of having an accident. Getting help may be done informally, by asking a family
member, friend or neighbour, or more formally by hiring someone for the job.
Given the solitary nature of much farm work, there is clearly a need for a system
for calling on additional help where there is a difficult task to be accomplished. The
issue seems to be particularly pressing on the smaller farms and is also associated
with high levels of mental distress. As a result, failure to get help may be related to
the capacity to afford to hire help or with farming in relatively isolated
circumstances, or both. More information would be needed on the type of task
involved and on its frequency in order to develop more specific recommendations

46|Risk taking and accidents on Irish farms
in this area. The results of this report point to this as a potentially important factor
in farm safety.
5.6.2 Checking machinery
About one farmer in eight does not routinely check machinery before use and this
practice is associated with an increased risk of accidents involving others, as well
as near misses involving the farmer. This finding could continue to be emphasised
in safety messages directed towards farmers.
5.6.3 Younger farmers
Younger farmers were more likely to take risks. Although the statistical model
suggested that this was due to the association between age and other
characteristics such as farm size and type, the age pattern is consistent with more
general findings on a higher risk of workplace injury among younger workers. It
points to the need to have safety messages directed towards younger farmers in
areas such as use of safety gear, using animal restraints and properly storing
chemicals. Single farmers, who tend to be young, were also more likely to take risks
in not checking machinery. Since young farmers are more likely to have taken
formal agricultural training courses, these aspects of health and safety might
receive even stronger emphasis as part of their training.
5.6.4 Dairy farms
Dairy farmers were more likely to take risks, particularly when it comes to not
storing chemicals out of reach of children. It is worth continuing to emphasise
safety in this respect among dairy farmers.
5.6.5 Larger farms
The only form of risk taking that increased with farm size involved not using safety
gear. A possible explanation is that the safety gear is not near to hand because of
the larger farm size. In this case, it may be worth promoting methods for ensuring
that safety gear is available where it is needed.
Even with risk taking controlled, the incidence of accidents or near misses was
greater on large farms. This is an area worthy of further research. In particular, is
the work pressure on larger farms leading to a faster pace of work that is
contributing to accidents, even where the specific safety precautions are taken?
5.6.6 Dissemination strategies
It is worth expanding the means of disseminating safety messages to farmers. One
way might be to make use of the discounts offered by many insurance companies

Conclusions and implications|47
to farmers who adopt certain safety practices, including having a farm safety
statement. Having a farm safety statement or risk assessment document is
required by law (The Safety, Health and Welfare at Work Act, 2005), but linking it
to the application for renewal of farm insurance is a potential way to reinforce the
content of the statement. The completion of a checklist before commencing or
renewing an insurance policy is a potentially useful tool to raise awareness of the
issues that have emerged as important here.
Other strategies to enhance the dissemination of information about farm safety
might include linking insurance discounts to participation in a farm safety
‘refresher’ course and producing summaries of research findings in an accessible,
non-technical format (as is planned for this report).
48|References
REFERENCES
CSO (2008). Farm structure survey 2007, Stationery Office, Dublin.
CSO (2012). Census of agriculture 2010 – Final results, Stationery Office, Dublin.
CSO (2014). Farm structure survey, 2013: Key findings, available at http://www.cso.ie/en/releasesandpublications/ep/p-fss/farmstructuresurvey2013/keyfindings, accessed 24 May 2016.
CSO (2015). Statistical release 25 June, available at http://www.cso.ie/en/releasesandpublications/er/qnhs-es/qnhsemploymentseriesq12015 accessed 19 September 2016.
CSO (2016). QNHS principle statistics, available at http://www.cso.ie/multiquicktables/quickTables.aspx?id=qnq03, accessed 23 May 2016.
Davies, R. and P. Jones (2005). Trends and context to rates of workplace injury, Research Report 386, Health and Safety Executive (UK).
Deary, I.J., J. Willock and M. McGregor (1997). ‘Stress in farming’. Stress Medicine, Vol. 13, pp. 131–136.
Dembe, A.E., J.B. Erickson, R.G. Delbos and S.M. Banks (2005). ‘The impact of overtime and long work hours on occupational injuries and illnesses: New evidence from the United States’, Occupational and Environmental Medicine, Vol. 62, No. 9, pp. 588–597.
Finnegan, A. and J. Phelan (2003). A survey of health and safety on Irish farms: Implications for extension and education, Paper presented at the 19th annual Conference of the Association for International Agricultural and Extension Education (AIAEE), Raleigh, North Carolina, USA, available at https://www.aiaee.org/attachments/article/1212/Finnegan271.pdf, accessed 19 September 2016.
Furey, E.M, D. O’Hora, J. McNamara, S. Kinsella and C. Noone (2016). ‘The roles of financial threat, social support, work stress, and mental distress in dairy farmers’ expectations of injury’. Front. Public Health, Vol. 4, p. 126.
Health and Safety Authority (HSA) (2014) ‘Determining underlying psycho-social factors influencing famers’ risk-related behaviours in the Republic of Ireland’. Completed by G.L. Noble Denton for the Health and Safety Authority, Ireland, Dublin.
Health and Safety Authority (HSA) (2016). Summary of workplace injury, illness and fatality statistics 2014–2015, HSA, Dublin, available at http://www.hsa.ie/eng/Publications_and_Forms/Publications/Corporate/HSA_Statistics_Report_2014-2015.pdf, accessed 19 September 2016.
Knowles, D. (2002). Risk perception leading to risk taking behaviour amongst farmers in England and Wales, ADAS Consulting Ltd and the Health and Safety Executive (UK).

Risk taking and accidents on Irish farms |49
Kolstrup, C.L., M. Kallioniemi, P., Lundqvist, H-R., Kymäläinen, L., Stallones and S. Brumby (2013). ‘International perspectives on psychosocial working conditions, mental health, and stress of dairy farm operators’. Journal of Agromedicine, Vol. 18, No. 3, pp. 244–255.
Landen, D.D. and S. Hendricks (1995). ‘Effect of recall on reporting of at-work injuries’. Public Health Reports, Vol. 110, No. 3, pp. 350–354.
McCurdy, S.A. and D.J. Carroll (2000). ‘Agricultural Injury’. American Journal of Industrial Medicine, Vol. 38, pp. 463–480.
McNamara, J., (2012) Presentation paper at health and safety conference, Cork, available at https://www.teagasc.ie/publications/?page=20&yearReleased=2012, accessed 19 September 2016.
McNamara, J. and K. Reidy (1997). A survey of farm safety and health on Irish farms, a study carried out by TEAGASC on behalf of the Health and Safety Authority, Teagasc, Dublin.
Murphy, D.J. (1981). ‘Farm safety attitude and accident involvement’. Accident Analysis and Prevention, Vol. 13, No. 4, pp. 331–337.
Napier, T.L., W.R. Goe and A.R. Pugh (1985). ‘Incidence and predictive factors associated with farm accidents in Ohio’. Research Circular of the Ohio Agricultural Research and Development Center, Vol. 287, pp. 1–15.
Rautiainen, R.H., J.L. Lange, C.J. Hodne, S. Schneiders, and K.J. Donham (2004). ‘Injuries in the Iowa certified safe farm study’. Journal of Agricultural Safety and Health, Vol. 10, No. 1, pp. 51–63.
Roberts, R.E. and E.S. Lee (1993). ‘Occupation and the prevalence of major depression, alcohol, and drug abuse in the United States’. Environmental Research, Vol. 61, pp. 266–278.
Roy, P., G. Tremblay and S. Robertson, S. (2014). ‘Help-seeking among male farmers: Connecting masculinities and mental health’. Sociologia Ruralis, Vol. 54, No. 4, pp. 460–476.
Russell, H., B. Maître and D. Watson, D. (2015). Trends and patterns in occupational health and safety in Ireland, ESRI, Dublin.
Sanne, B., A. Mykletun, B.E. Moen, A.A. Dahl and G.S. Tell (2004). ‘Farmers are at risk for anxiety and depression: The Hordaland Health Study’. Occupational Medicine, Vol. 54, pp. 92–100.
Simpson, K., R. Sebastian, T.E. Arbuckle, C. Bancej and W. Pickett, W. (2004). ‘Stress on the farm and its association with injury’. Journal of Agricultural Safety and Health, Vol. 10, No. 3, pp. 141–53.
Solomen, C. (2002). ‘Accidental injuries in Agriculture in the UK’. Occupational Medicine, Vol. 52, pp. 461–466.
Sprince, N.L., H. Park, C. Zwerling, C.F. Lynch, P.S. Whitten, K. Thu, L.F. Burmeister, P.P. Gillette and M.C.R. Alavanja (2003). ‘Risk factors for animal-related

50|References
injury among Iowa large-livestock farmers: A case-control study nested in the Agricultural Health Study.’ The Journal of Rural Health, Vol. 19, No. 2, pp. 165–173.
Sprince, N.L., H. Park, C. Zwerling, C.F. Lynch, P.S. Whitten, K. Thu, P.P Gillette, L.F. Burmeister and M.C.R. Alavanja (2002). ‘Risk factors for machinery-related injury among Iowa farmers: A case-control study nested in the Agricultural Health Study’. International Journal of Occupational and Environmental Health, Vol. 8, No. 4, pp. 332–338.
StataCorp (2013a). Stata: Release 13. Statistical Software, College Station, TX. StataCorp LP.
StataCorp (2013b). Stata survey data reference manual, Release 13, College Station, TX. StataCorp LP.
Teagasc (2013). National Farm Survey Results 2013, available at https://www.teagasc.ie/rural-economy/rural-economy/national-farm-survey/national-farm-survey-results/2013/, accessed 20 September 2016.
Thompson, S.K. (2012) Sampling. 3rd ed., Wiley, Hoboken, NJ.
Van den Broucke, S. and A. Colémont (2011). ‘Behavioral and nonbehavioral risk factors for occupational injuries and health problems among Belgian farmers’. Journal of Agromedicine, Vol. 16, pp. 299–310.
Virtanen, S.V., V. Notkola, R. Luukkonen, E. Eskola and K. Kurppa (2003). ‘Work injuries among Finnish farmers: A national register linkage study 1996–1997’. American Journal of Industrial Medicine, Vol. 43, pp. 314–325.
Wallis A. and M.F. Dollard (2008). ‘Local and global factors in work stress: The Australian dairy farming examplar’. SJWEH Suppl., Vol. 6, pp. 66–74.
Warner, M., N. Schenker, M.A. Heinen and L.A. Fingerhut (2005). ‘The effects of recall on reporting injury and poisoning episodes in the National Health Interview Survey’. Injury Prevention, Vol. 11, No. 5, pp. 282–287.
Williams, B. (1978). A Sampler on sampling, Wiley, New York.

Whitaker Square, Sir John Rogerson’s Quay, Dublin 2Telephone +353 1 863 2000 Email [email protected] www.esri.ieTwitter @ESRIDublinISBN 978-0-7070-0426-6