Embed Size (px)
Citation preview

Rescuing the eurozone: the right prescription?March 8, 2012
1

Rescuing the eurozone: the right prescription?
We view as a banking sector and government debt crisis what is really a balance of payments crisis
The tools being used to address the crisis are therefore badly-suited for the purpose
Only political will, not underlying economics, has so far stood between eurozone survival and collapse but…
…the ECB LTRO and official sector bailouts at best by time, at worst exacerbate the problems
Only restoring competitiveness in the periphery, not the ‘will of policymakers’ alone can make for lasting crisis solution
Source: J.P. Morgan.
2
3
Stresses in larger peripheral bond markets and the eurozone banking system have eased
0
50
100
150
200
250
300
350
400
450
500
550
600
09 10 11 12
Italy
Spain
Eurozone government debt spread Basis points over Germany
Source: Bloomberg, J.P. Morgan. Data as of March 2012.
Euribor-OIS spreadBasis points
0
25
50
75
100
125
150
09 10 11 12
Source: Bloomberg, J.P. Morgan. Data as of March 2012.

The balance of payments: how it adds up
Current Account
(net exports, transfer payments, net factor income)
Source: J.P. Morgan.
4
Capital Account
(Foreign direct investment, portfolio investment, cross-border lending)
Balance of Payments
=
+

5
Iceland’s economy recovering from near-collapse
Source: Bloomberg, Statistics Iceland, J.P. Morgan. Data as of 2012.
Iceland unemployment rateShare of labor force
9.5%
7.2%
0%
1%
2%
3%
4%
5%
6%
7%
8%
9%
10%
11% 2009
Today
Iceland 10-year government bondYield
10.6%
6.5%
0%
2%
4%
6%
8%
10%
12% 2009
Today
Iceland real GDP growthYear-on-year rate
-8.3%
5.1%
-10%
-8%
-6%
-4%
-2%
0%
2%
4%
6%
2009
Today

6
Peripheral eurozone economy continues to collapse
Source: Bloomberg, J.P. Morgan. Data as of 2012. SIPI is Spain, Italy, Ireland, Portugal.
SIPI* unemployment rateShare of labor force
12.9%
14.8%
0%
2%
4%
6%
8%
10%
12%
14%
16%
18% 2009
Today
SIPI* 10-year government bondYield
4.3%
8.0%
0%
2%
4%
6%
8%
10% 2009
Today
SIPI* real GDP growthYear-on-year rate
-3.1%
-0.2%
-5%
-4%
-3%
-2%
-1%
0%
1%
2%
2009
Today

7
Past balance of payments crises have only been solved with major currency devaluations
Source: Bloomberg, J.P. Morgan.
Currency devaluations in past BoP crisesPeak-to-trough
8%27%
59%
124%115%
360%
281%
0%
50%
100%
150%
200%
250%
300%
350%
400%
Eu
rozo
ne
Ca
na
da
Sw
ed
en
Me
xico
Ko
rea
Ru
ssia
Arg
en
tina

The eurozone’s design flaws
Main Criteria for an ‘Optimal Currency Area’:
Free movement of goods, capital and labor (YES/NO)
Flexible wages and prices (NO)
Cross-border fiscal transfer mechanism (NO)
Source: J.P. Morgan. Based on Mundell, R. A. (1961). "A Theory of Optimum Currency Areas".
8
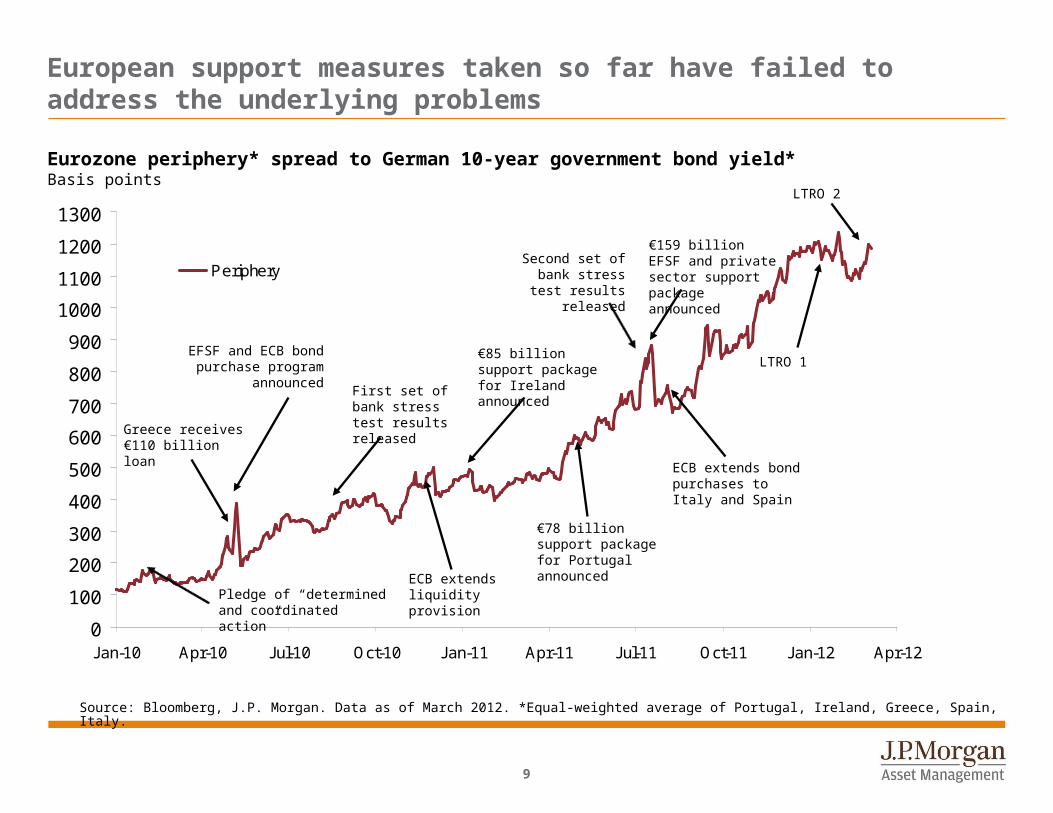
European support measures taken so far have failed to address the underlying problems
0
100
200
300
400
500
600
700
800
900
1000
1100
1200
1300
Jan-10 Apr-10 Jul-10 Oct-10 Jan-11 Apr-11 Jul-11 Oct-11 Jan-12 Apr-12
Periphery
Eurozone periphery* spread to German 10-year government bond yield*Basis points
Source: Bloomberg, J.P. Morgan. Data as of March 2012. *Equal-weighted average of Portugal, Ireland, Greece, Spain, Italy.
Greece receives €110 billion loan
EFSF and ECB bond purchase program
announcedFirst set of bank stress test results released
ECB extends liquidity provisionPledge of “determined and
coordinated action”
€78 billion support package for Portugal announced
€85 billion support package for Ireland announced
Second set of bank stress test results
released
€159 billion EFSF and private sector support package announced
ECB extends bond purchases to Italy and Spain
9
LTRO 1
LTRO 2
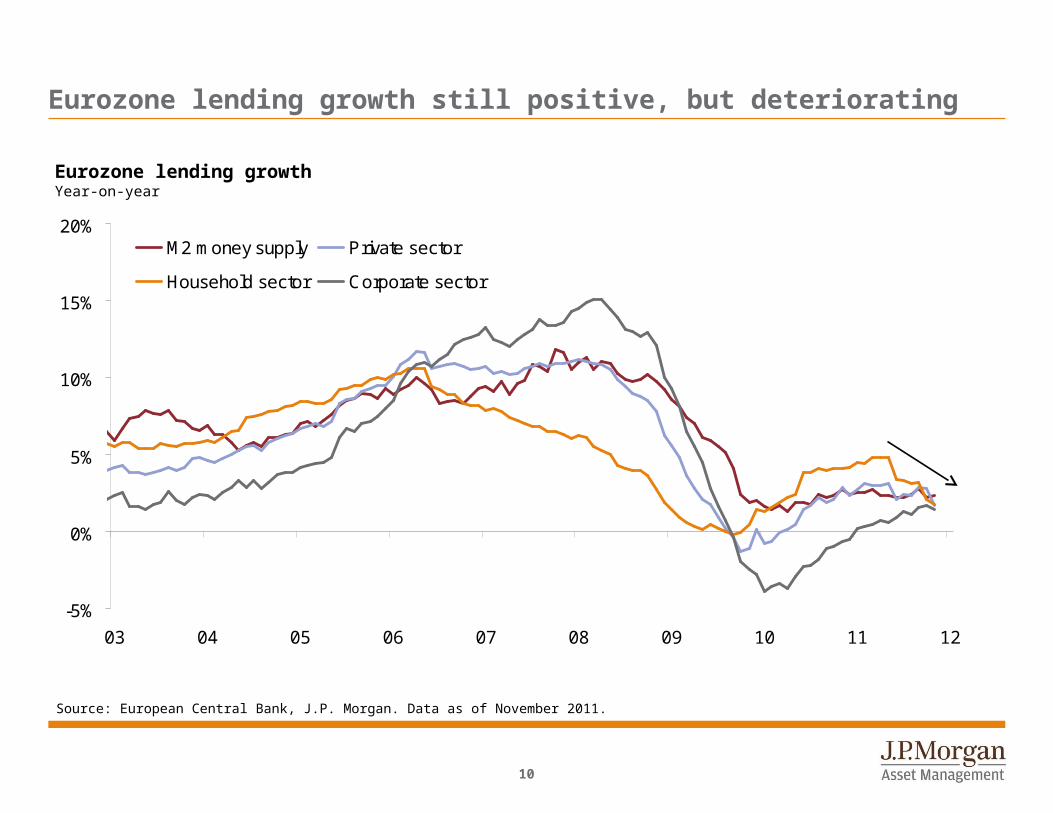
Eurozone lending growth still positive, but deteriorating
Source: European Central Bank, J.P. Morgan. Data as of November 2011.
10
Eurozone lending growthYear-on-year
-5%
0%
5%
10%
15%
20%
03 04 05 06 07 08 09 10 11 12
M2 money supply Private sector
Household sector Corporate sector

Main elements of February’s Greek bailout package
€130 billion of official sector support over next three years
An extra €325m of spending cuts to close past budget gaps
53.5% haircut for private sector creditors with 90% participation
Interest rate cut on existing bailout loans
Public debt/GDP ratio target of 120.5% by 2020.
Source: J.P. Morgan.
11

Have we got the maxim gun?
Source: J.P. Morgan.
12
J.P. Morgan Asset Management
This document is intended solely to report on various investment views held by J.P. Morgan Asset Management. Opinions, estimates, forecasts, and statements of financial market trends that are based on current market conditions constitute our judgment and are subject to change without notice. We believe the information provided here is reliable but should not be assumed to be accurate or complete. The views and strategies described may not be suitable for all investors. References to specific securities, asset classes and financial markets are for illustrative purposes only and are not intended to be, and should not be interpreted as, recommendations. Indices do not include fees or operating expenses and are not available for actual investment. The information contained herein employs proprietary projections of expected returns as well as estimates of their future volatility. The relative relationships and forecasts contained herein are based upon proprietary research and are developed through analysis of historical data and capital markets theory. These estimates have certain inherent limitations, and unlike an actual performance record, they do not reflect actual trading, liquidity constraints, fees or other costs. References to future net returns are not promises or even estimates of actual returns a client portfolio may achieve. The forecasts contained herein are for illustrative purposes only and are not to be relied upon as advice or interpreted as a recommendation.
The value of investments and the income from them may fluctuate and your investment is not guaranteed. Past performance is no guarantee of future results. Please note current performance may be higher or lower than the performance data shown. Please note that investments in foreign markets are subject to special currency, political, and economic risks. Exchange rates may cause the value of underlying overseas investments to go down or up. Investments in emerging markets may be more volatile than other markets and the risk to your capital is therefore greater. Also, the economic and political situations may be more volatile than in established economies and these may adversely influence the value of investments made.
All case studies are shown for illustrative purposes only and should not be relied upon as advice or interpreted as a recommendation. They are based on current market conditions that constitute our judgment and are subject to change. Results shown are not meant to be representative of actual investment results. Past performance is not necessarily indicative of the likely future performance of an investment.
Any securities mentioned throughout the presentation are shown for illustrative purposes only and should not be interpreted as recommendations to buy or sell. A full list of firm recommendations for the past year is available upon request.
J.P. Morgan Asset Management is the marketing name for the asset management business of JPMorgan Chase & Co. Those businesses include, but are not limited to, J.P. Morgan Investment Management Inc., Security Capital Research & Management Incorporated and J.P. Morgan Alternative Asset Management, Inc.
Copyright © 2011 JPMorgan Chase & Co. All rights reserved.
13