Embed Size (px)
Citation preview
REQUIREMENTS AND PERSPECTIVES FOR MW/SUB-MMSOUNDING FROM GEOSTATIONARY SATELLITE
Bizzarro Bizzarri (*) et al 1
(*) Scientific Advisor to the EUMETSAT Director General - Via L. Pigorini 6, 00162 Roma, Italy
ABSTRACT
Planning for an MSG-follow-on programme, has already initiated. After a one-year preparatory work, theEUMETSAT 1st Post-MSG User Consultation Workshop took place on 13-15 November 2001. A majorrequirement emerged for frequent observation of precipitation. This requirement can partially be addressedby improving the VIR/IR imagery and a possible IR sounding missions, but clearly calls for MW radiometry.In addition, there is a strong requirement to have frequent temperature/humidity sounding in overcast areas,which also calls for MW radiometry. However, it is currently felt that affordability and programmaticconstraints are too tight to enable a MW radiometer being baselined for an operational post-MSG satellite.
The paper shows that affordability and feasibility become closer if frequencies higher than usual areexploited (54, 118, 183, 380 and 425 GHz) to reduce antenna size; and a different principle is adopted toobserve precipitation (in absorption channels for temperature and humidity profiling rather than inatmospheric windows). Temperature and humidity profiles retrieved at different frequencies are differentlyaffected by liquid and ice water, drop size and shape, and precipitation; therefore, in principle, simultaneousretrieval of temperature/humidity profiles, cloud ice/liquid water columnar content or gross profile andprecipitation is possible. Being in absorption bands, the observation is equally available over sea and land.Profiles will have coarser vertical resolution than what is achievable in IR, but will be all-weather and asfrequent as dictated by the driving precipitation mission (e.g., at 15-min intervals). These ideas aresupported by several airborne experiments, to continue in the near future.
The paper will dwell on the physical principle highlighting potentials and limitations, and introduce theconcept of GOMAS (Geostationary Observatory for Microwave Atmospheric Sounding) originated from anAmerican concept (GEM, Geostationary Microwave Observatory). It will be shown that, if implemented asa dedicated mission, GOMAS could be a relatively small satellite and that current state-of-the-art technologyis sufficient to make possible a demonstration mission before 2010, the only limitation being that the 15-minrate is possible over a regional scale as wide as 1/12 of the Earth visible disk, abundantly covering Europe.
1. INTRODUCTION
Any meteorologist would be happy if he can have available:• temperature vertical profiles in all-weather conditions and inside clouds• humidity vertical profiles in all-weather conditions and inside clouds• the precipitation field observed as frequently as possible over both land and sea• information on the internal cloud structure in terms of liquid and ice water.
1 Co-authors consist of the members of the GOMAS Science Team: U. Amato, J. Bates, W. Benesch, S. Bühler,M. Capaldo, M. Cervino, V. Cuomo, L. De Leonibus, M. Desbois, S. Dietrich, F. Evans, L. Eymard, A. Gasiewski,N. Gustafsson, G. Heygster, M. Klein, K. Künzi, V. Levizzani, G.L. Liberti, E. Lopez-Baeza, P. Menzel, J. Miao,A. Mugnai, P. Pagano, J. Pailleux, J. Pardo, F. Porcù, C. Prigent, F. Prodi, R. Rizzi, G. Rochard, H.P. Roesli, C. Serio,W. Smith, A. Speranza, D. Staelin, A. Sutera, J.J. Tsou, C. Velden and G. Visconti.
If he can have these observations available with good accuracy, frequency and regularity, by 4-Dassimilation he would be able to derive:• information on the wind vertical profile, probably the most important parameter for weather prediction,
but difficult to be observed directly (from space and from the ground as well).
We will see that all this is possible now:• by a single instrument• embarked on a small satellite in geostationary orbit• each 15 minutes !
The need for all-weather sounding and accurate precipitation calls for microwave sensing. The need forobserving cycles as short as 15 min (driven by precipitation) calls for the geostationary orbit. We will showthat precipitation can be observed by very-high-frequency microwave (MW) and submillimetre-wave (Sub-mm), enabling antennas to be used of affordable size. The observing principle is based on differentialsounding retrievals from absorption bands: therefore, as a “bonus”, temperature and humidity soundings aremeasured, as well as information on cloud liquid and ice water. We will show that all this is feasible bycurrent technology and implies, assuming a dedicated mission, a satellite of the “small” class 2.
2. THE PROBLEM OF MEASURING PRECIPITATION
Precipitation rate estimate from satellite is a long-standing application, based on visible/infrared imagery(particularly from geostationary satellites) associated to conceptual models. It is a rather indirect technique,since VIS and IR radiation only provides information on the cloud top reflectance and temperature, inaddition to the pattern. Because of this, plenty of external information has to be placed when processing thedata, and results are applicable only under circumstances limited to the specific observing conditions, themodel concept adopted for retrieval and the nature of the external information entered in the processingscheme. The EC-supported EuRainSat project, centred on the use of the near-to-come VIS/IR images fromMeteosat Second Generation (MSG), will stretch to a maximum extent the capability of these techniquesand, contextually, assess the ultimate limits of achievable performances.
More direct information is provided in the range of MW, where the cloud interior is penetrated and the signalis controlled by emission and scattering (from ice), and by polarisation and depolarisation effects (over thesea). In addition, if the MW radiation is actively generated by the instrument (radar), measurement ofranging and intensity of the backscattered radiation provide the precipitation vertical profile and appreciationof drop size. However, since radar cannot have a large swath and, if used in an imaging configuration, is ahuge instrument, passive MW radiometry is the basis for global, regular and frequent coverage, whereas useof the radar is limited to process study and as a mean to better calibrate the passive MW observation.
Attempts to measure precipitation from space using MW started in 1972 with ESMR (Electrically ScanningMicrowave Radiometer) on Nimbus V and then VI. In 1997, TRMM was launched (and still is active),associating a passive MW radiometer, TMI (TRMM Microwave Imager) to an active MW instrument, PR(Precipitation Radar). The EC-supported EuroTRMM project, recently terminated, has assessed thefeasibility of retrieving rather accurate precipitation information from space, also fostering the developmentof a large amount of cloud and precipitation modelling and retrieval algorithms, and showing the impact ofassimilating precipitation data in global NWP models. As a follow-on, the idea of a Global PrecipitationMission (GPM) has been conceived, based on a "core" satellite equipped with passive and active MWinstrumentation (a direct follow-on of TRMM), and a number (possibly eight) of "drone" satellitesessentially defined to implement frequent global observing cycle. The European Space Agency has recentlypre-selected EGPM (European contribution to GPM) as an Opportunity Mission to concur to implement thedrone constellation. When the GPM system is fully deployed (starting from 2007), it will provide globalobserving cycle at 3 h intervals, optimal for Global NWP and GCM but also important for Regional NWPand interesting, to a significant extent, for Nowcasting, particularly when MW observation from low orbitingsatellites is merged with frequent VIS/IR imagery from geostationary satellite.
2 Definition: NanoSat < 10 kg; MicroSat 10-100 kg; MiniSat 100-500 kg; SmallSat 500-1000 kg; MediumSat 1-2 tons.
Notwithstanding the highest priority, in the short-medium term, of 1) making best use of frequent VIS/IRimagery from MSG and other geostationary satellites, 2) implementing GPM for more direct 3-hourlyobservation and 3) accepting all optimistic views on the benefit of synergistic use of the two data sources; itis obvious that the true solution of the problem of collecting more direct rain information as frequent asrequired by the nature of this fractal and fast-evolving parameter would be to bring MW radiometry in GEO.
The traditional MW technique attempts to measure precipitation by direct observation of water drops inseveral atmospheric “windows”. Actually, only at lower frequencies (10 GHz and, at most, 19 GHz) andover the sea the relationship between measured radiation and precipitation is conveniently direct. Theobservation is performed under two or more polarisations, both in order to account for sea roughness and toexploit the depolarisation effect induced by precipitation. Use of higher frequencies (37 GHz, 90 GHz, 150GHz) needs to be associated, both to improve the horizontal resolution for a given antenna size, and toenable rain observation over land: the measurement, however, becomes progressively less direct, since itexploits the different scattering properties of liquid and ice water (again exploiting dual polarisation), linkedto precipitation through some cloud/rain model needed for the retrieval process. From the geostationaryorbit, this principle is hard to be applicable. First, the antenna diameter would be impractical: for a 10-kmresolution at nadir the diameter would be 15 m at 90 GHz or 35 m at 37 GHz and 70 m at 19 GHz ! Second,polarisation differentiation at the high zenith angles proper of observing from the geostationary orbit wouldbe impossible. A different observing principle needs therefore to be exploited.
3. THE OBSERVING PRINCIPLE FROM GEO
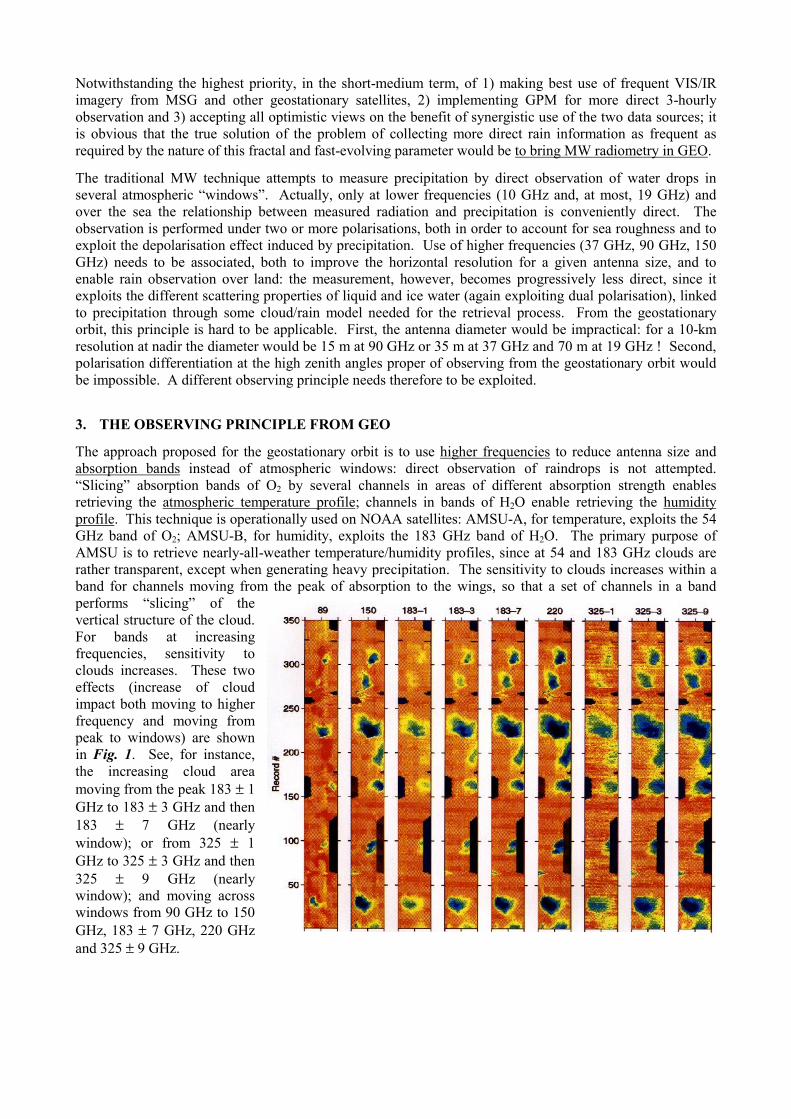
The approach proposed for the geostationary orbit is to use higher frequencies to reduce antenna size andabsorption bands instead of atmospheric windows: direct observation of raindrops is not attempted.“Slicing” absorption bands of O2 by several channels in areas of different absorption strength enablesretrieving the atmospheric temperature profile; channels in bands of H2O enable retrieving the humidityprofile. This technique is operationally used on NOAA satellites: AMSU-A, for temperature, exploits the 54GHz band of O2; AMSU-B, for humidity, exploits the 183 GHz band of H2O. The primary purpose ofAMSU is to retrieve nearly-all-weather temperature/humidity profiles, since at 54 and 183 GHz clouds arerather transparent, except when generating heavy precipitation. The sensitivity to clouds increases within aband for channels moving from the peak of absorption to the wings, so that a set of channels in a bandperforms “slicing” of thevertical structure of the cloud.For bands at increasingfrequencies, sensitivity toclouds increases. These twoeffects (increase of cloudimpact both moving to higherfrequency and moving frompeak to windows) are shownin Fig. 1. See, for instance,the increasing cloud areamoving from the peak 183 ± 1GHz to 183 ± 3 GHz and then183 ± 7 GHz (nearlywindow); or from 325 ± 1GHz to 325 ± 3 GHz and then325 ± 9 GHz (nearlywindow); and moving acrosswindows from 90 GHz to 150GHz, 183 ± 7 GHz, 220 GHzand 325 ± 9 GHz. Fig. 1 - Image strips of convective precipitation cells over ocean obtained by a
multi-channel airborne radiometer. Scenes of 40 km (width) x 200 km (length)(from Gasiewski et al., 1994).
Channels in absorption bandshave already been used toretrieve precipitation, as shownin Fig. 2, from the operationalNOAA/AMSU sounder.
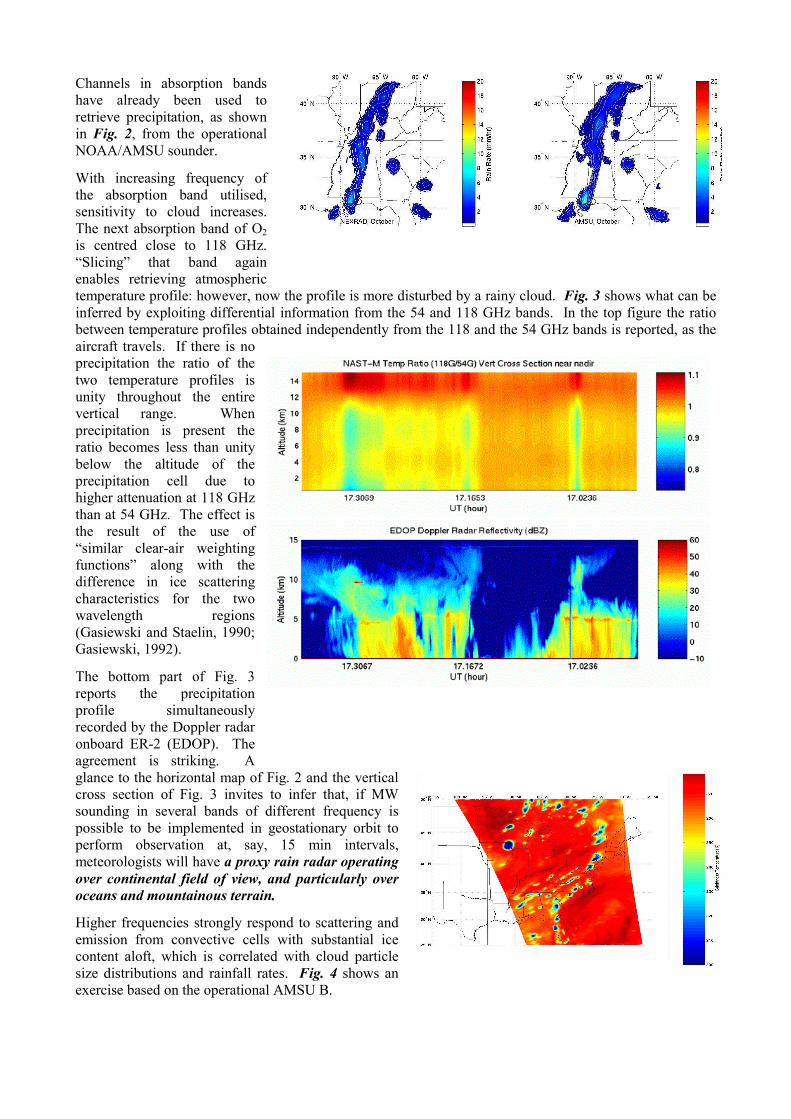
With increasing frequency ofthe absorption band utilised,sensitivity to cloud increases.The next absorption band of O2is centred close to 118 GHz.“Slicing” that band againenables retrieving atmospherictemperature profile: however, now the profile is more disturbed by a rainy cloud. Fig. 3 shows what can beinferred by exploiting differential information from the 54 and 118 GHz bands. In the top figure the ratiobetween temperature profiles obtained independently from the 118 and the 54 GHz bands is reported, as theaircraft travels. If there is noprecipitation the ratio of thetwo temperature profiles isunity throughout the entirevertical range. Whenprecipitation is present theratio becomes less than unitybelow the altitude of theprecipitation cell due tohigher attenuation at 118 GHzthan at 54 GHz. The effect isthe result of the use of“similar clear-air weightingfunctions” along with thedifference in ice scatteringcharacteristics for the twowavelength regions(Gasiewski and Staelin, 1990;Gasiewski, 1992).
The bottom part of Fig. 3reports the precipitationprofile simultaneouslyrecorded by the Doppler radaronboard ER-2 (EDOP). Theagreement is striking. Aglance to the horizontal map of Fig. 2 and the verticalcross section of Fig. 3 invites to infer that, if MWsounding in several bands of different frequency ispossible to be implemented in geostationary orbit toperform observation at, say, 15 min intervals,meteorologists will have a proxy rain radar operatingover continental field of view, and particularly overoceans and mountainous terrain.
Higher frequencies strongly respond to scattering andemission from convective cells with substantial icecontent aloft, which is correlated with cloud particlesize distributions and rainfall rates. Fig. 4 shows anexercise based on the operational AMSU B.
Fig. 2 - Precipitation images from a cold front on October 7, 1998. Left: NEXRADmap smoothed to 15 km resolution; right: NOAA/AMSU map obtained using a neuralnet retrieval technique (from Staelin and Chen, 2000).
Fig. 3 - Comparison between the 118/54 GHz profile ratio from the NAST-Mmicrowave radiometer on the NASA ER-2 aircraft and simultaneous EDOPDoppler radar reflectivity observation. Hurricane Bonnie at 17 GMT on August26, 1998 (from Tsou et al., 2001).
Fig. 4 - NOAA-15 AMSU-B 183+/-7 GHz 15-kmresolution imagery of small rain cells over the EasternU.S on August 2, 2000 (from Staelin and Chen, 2000).

With frequencies such as 54,118 and 183 GHz, however, weare still far from meeting therequirement for antennas ofaffordable size. From thegeostationary orbit, a 10-kmresolution still requiresdiameters of 25, 11 and 7.3 m,respectively. We must move tosubstantially higher frequencies.Fig. 5 shows the atmosphericabsorption spectrum in therange 2 to 1000 GHz. It can beobserved that the next useful O2band is around 425 GHz, andthe next H2O bands are around325 GHz and (preferred) 380GHz. It is noted that, from the geostationary altitude, a resolution of 10 km at 380/425 GHz is achieved bymeans of a 3-m antenna, which is thought to be feasible and affordable.
Fig. 5 also shows that the idea of using very high frequencies to be able to reduce antenna size cannot beexploited indefinitely. It may be appreciated that, with increasing frequency, the N2 continuum and that onefrom H2O make the atmosphere progressively opaque, thus making the troposphere impossible to beobserved. The existence of a strong continuum constitutes a drawback for the use of Sub-mm frequenciesfor temperature/humidity sounding. Fig. 6 shows that, in the bands at 380 and 425 GHz, the lowertroposphere is badly observed. The same figure shows that the bands at 118 and 183 GHz, instead, can beused to observe down to the Earth surface (just as the 54 GHz band, also shown).
Fig. 5 - Atmospheric spectrum in the MW/Sub-mm ranges (from Kleinand Gasiewski, 2000).
Fig. 6 - Incremental weightingfunctions (IWF) for temperature andhumidity in the bands 118, 183, 380and 425 GHz. The numbers attachedto the curves indicate the distance (inMHz) from the frequency of the peak(from Klein and Gasiewski, 2000).The IWF's relative to the 54 GHzband, more familiarly used, also areplotted (courtesy of A. Gasiewski).
−0.05 0 0.05 0.1 0.150
10
20
30
40118.7503 GHz
Altitu
de
(km
)
Temperature IWF (km−1)
15−21
29−41
70−90
150−250300−500500−900
900−1300← 1300−1700
← 1700−2500← 2500−3500
4000−6000↓
0 0.05 0.1 0.15 0.2 0.250
10
20
30
40424.7631 GHz
Altitu
de
(km
)
Temperature IWF (km−1)
25−35
60−80
120−180
250−350500−700800−12001200−1800
3500−4500
−2 0 2 4 60
5
10
15
20150−450
650−11501300−20002500−35004000−6000
← 6000−8000
15000−19000
183.3101 GHz
Altitu
de
(km
)
Water Vapor IWF (K km−1)
−2 −1.5 −1 −0.5 0 0.50
5
10
15
2030−60
300−500
1250−1750
3550−4450
8000−1000017000−19000↑
380.1974 GHz & 340 GHz
Altitu
de
(km
)
Water Vapor IWF (K km−1)
336−344 GHz
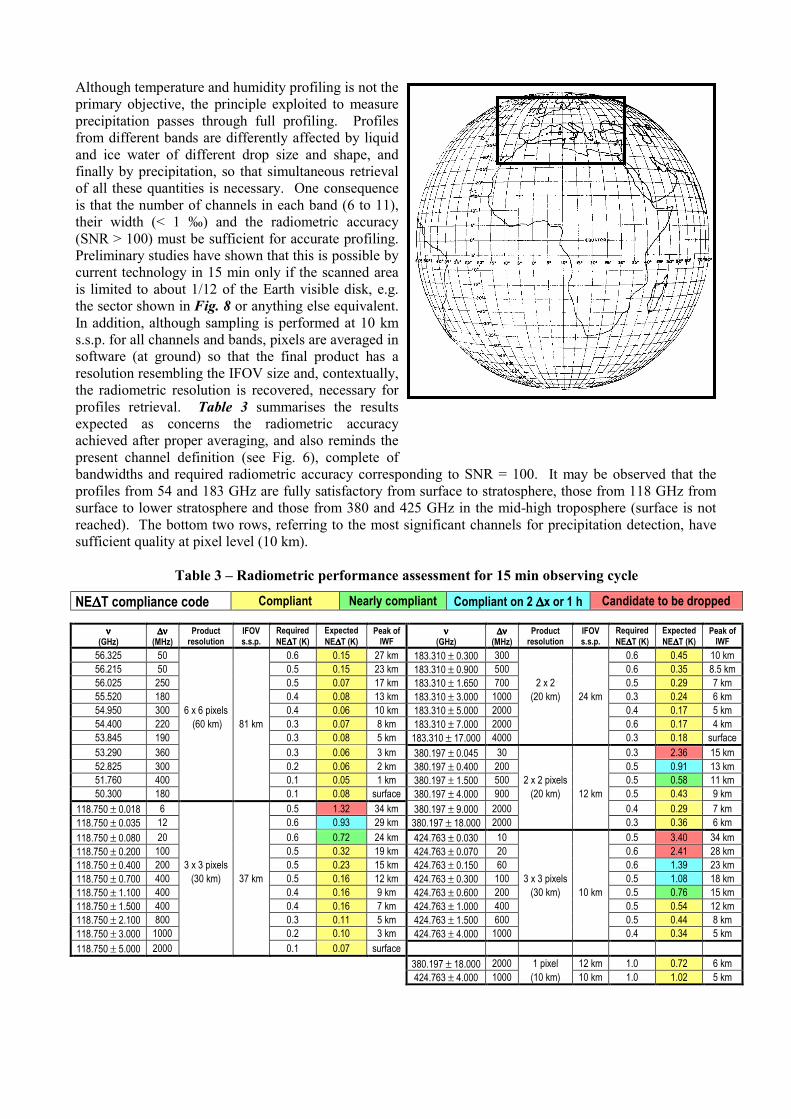
Temperature and humidity profiling is not the primary objective of MW in geostationary obit; however, theexpected results are rather interesting, particularly if measurements are as frequent as dictated by the drivingprecipitation mission (e.g., 15 min). Fig. 7 shows simulated retrieval errors for temperature and humidity.
It may be observed that, for temperature, 118 + 425 GHz as stand-alone are rather good for the highertroposphere and lower stratosphere. When added to an IR sounder of the class of IASI or AIRS (“GAIRS”)the performance is as good as for the reference AIRS + AMSU/A + AMSU/B of EOS-Aqua, except in thelower troposphere. The 54 GHz band therefore continue to be necessary. For humidity, the 380 GHz band(helped by 425) performs better than the 183 GHz band (helped by 118) in the upper troposphere and lowerstratosphere, worse in the medium and low troposphere. The full set 118, 183, 380 and 425 is optimal.
4. THE CONCEPT OF GOMAS
The idea of MW sounding from geostationary orbit dates from Staelin and Rosenkranz ed., 1978. In Europe,MW sounding was placed in 1984 as a requirement for Meteosat Second Generation, and led to an industrialstudy presented in 1988 after a definition study by Chedin et al., 1985. Those early initiatives werepremature because of the technological state-of-the-art at the time. Recently, the idea of MW sounding fromgeostationary orbit has been taken over again in both the USA and Europe. In the U.S., a "GeosynchronousMicrowave Sounder Working Group" carried out a study for NOAA/NESDIS (Staelin et al., 1997) and gaverise to the proposal for GEM (Geostationary Microwave Observatory) (Staelin et al., 1998). In Europe, ananalysis of scenario was prepared for EUMETSAT (Bizzarri, 2000) and finally, in January 2002, a proposalhas been submitted to ESA in the framework of the Earth Explorer Opportunity Missions, for GOMAS(Geostationary Observatory for Microwave Atmospheric Sounding). The GOMAS proposal includes allGEM heritages and was submitted by Bizzarri on behalf of 40 European and U.S. proponents (those listed asco-authors of this paper).
Table 1 reports the reference user requirements adopted for GOMAS. Table 2 shows how the resolution inthe different bands changes function of typical antenna diameters. At least a 3-m antenna is required.
Table 1 – Reference user requirements adopted for GOMAS Table 2 - Resolution v/s frequency and antenna ØGeophysicalparameter
Horizontalresolution
Verticalresolution
Accuracy(r.m.s.)
Observingcycle
Delay ofavailability
AntennaØ 54 GHz 118 GHz 183 GHz 380 GHz 425 GHz
Temperature profile 30 km 2.0 km 1.5 K 1 h 15 min 1 m 242 km 112 km 73 km 35 km 31 kmHumidity profile 20 km 2.0 km 20 % 1 h 15 min 2 m 121 km 56 km 36 km 18 km 16 kmCloud liquid/ice water 20 km 5.0 km 50 % 15 min 5 min 3 m 81 km 37 km 24 km 12 km 10 kmPrecipitation rate 10 km - 5 mm/h 15 min 5 min 4 m 60 km 28 km 18 km 8.8 km 7.8 km
Fig. 7 - Retrieval errors for bands 118, 183, 380 e 425 GHz, stand-alone or associated to an IR sounder of the IASIor AIRS class (“GAIRS”). Temperature on the left hand, humidity on the right. On the left hand, GAIRS + 118 +425 is compared to GAIRS alone and to 118 + 425 alone. For reference, the EOS/Aqua AIRS + AMSU/A +AMSU/B complex also is shown (Blackwell and Staelin, 1996).
Although temperature and humidity profiling is not theprimary objective, the principle exploited to measureprecipitation passes through full profiling. Profilesfrom different bands are differently affected by liquidand ice water of different drop size and shape, andfinally by precipitation, so that simultaneous retrievalof all these quantities is necessary. One consequenceis that the number of channels in each band (6 to 11),their width (< 1 ‰) and the radiometric accuracy(SNR > 100) must be sufficient for accurate profiling.Preliminary studies have shown that this is possible bycurrent technology in 15 min only if the scanned areais limited to about 1/12 of the Earth visible disk, e.g.the sector shown in Fig. 8 or anything else equivalent.In addition, although sampling is performed at 10 kms.s.p. for all channels and bands, pixels are averaged insoftware (at ground) so that the final product has aresolution resembling the IFOV size and, contextually,the radiometric resolution is recovered, necessary forprofiles retrieval. Table 3 summarises the resultsexpected as concerns the radiometric accuracyachieved after proper averaging, and also reminds thepresent channel definition (see Fig. 6), complete ofbandwidths and required radiometric accuracy corresponding to SNR = 100. It may be observed that theprofiles from 54 and 183 GHz are fully satisfactory from surface to stratosphere, those from 118 GHz fromsurface to lower stratosphere and those from 380 and 425 GHz in the mid-high troposphere (surface is notreached). The bottom two rows, referring to the most significant channels for precipitation detection, havesufficient quality at pixel level (10 km).
Table 3 – Radiometric performance assessment for 15 min observing cycle
NE∆∆∆∆T compliance code Compliant Nearly compliant Compliant on 2 ∆∆∆∆x or 1 h Candidate to be dropped
νννν(GHz)
∆∆∆∆νννν(MHz)
Productresolution
IFOVs.s.p.
RequiredNE∆∆∆∆T (K)
ExpectedNE∆∆∆∆T (K)
Peak ofIWF
νννν(GHz)
∆∆∆∆νννν(MHz)
Productresolution
IFOVs.s.p.
RequiredNE∆∆∆∆T (K)
ExpectedNE∆∆∆∆T (K)
Peak ofIWF
56.325 50 0.6 0.15 27 km 183.310 ± 0.300 300 0.6 0.45 10 km56.215 50 0.5 0.15 23 km 183.310 ± 0.900 500 0.6 0.35 8.5 km56.025 250 0.5 0.07 17 km 183.310 ± 1.650 700 2 x 2 0.5 0.29 7 km55.520 180 0.4 0.08 13 km 183.310 ± 3.000 1000 (20 km) 24 km 0.3 0.24 6 km54.950 300 6 x 6 pixels 0.4 0.06 10 km 183.310 ± 5.000 2000 0.4 0.17 5 km54.400 220 (60 km) 81 km 0.3 0.07 8 km 183.310 ± 7.000 2000 0.6 0.17 4 km53.845 190 0.3 0.08 5 km 183.310 ± 17.000 4000 0.3 0.18 surface53.290 360 0.3 0.06 3 km 380.197 ± 0.045 30 0.3 2.36 15 km52.825 300 0.2 0.06 2 km 380.197 ± 0.400 200 0.5 0.91 13 km51.760 400 0.1 0.05 1 km 380.197 ± 1.500 500 2 x 2 pixels 0.5 0.58 11 km50.300 180 0.1 0.08 surface 380.197 ± 4.000 900 (20 km) 12 km 0.5 0.43 9 km
118.750 ± 0.018 6 0.5 1.32 34 km 380.197 ± 9.000 2000 0.4 0.29 7 km118.750 ± 0.035 12 0.6 0.93 29 km 380.197 ± 18.000 2000 0.3 0.36 6 km118.750 ± 0.080 20 0.6 0.72 24 km 424.763 ± 0.030 10 0.5 3.40 34 km118.750 ± 0.200 100 0.5 0.32 19 km 424.763 ± 0.070 20 0.6 2.41 28 km118.750 ± 0.400 200 3 x 3 pixels 0.5 0.23 15 km 424.763 ± 0.150 60 0.6 1.39 23 km118.750 ± 0.700 400 (30 km) 37 km 0.5 0.16 12 km 424.763 ± 0.300 100 3 x 3 pixels 0.5 1.08 18 km118.750 ± 1.100 400 0.4 0.16 9 km 424.763 ± 0.600 200 (30 km) 10 km 0.5 0.76 15 km118.750 ± 1.500 400 0.4 0.16 7 km 424.763 ± 1.000 400 0.5 0.54 12 km118.750 ± 2.100 800 0.3 0.11 5 km 424.763 ± 1.500 600 0.5 0.44 8 km118.750 ± 3.000 1000 0.2 0.10 3 km 424.763 ± 4.000 1000 0.4 0.34 5 km118.750 ± 5.000 2000 0.1 0.07 surface
380.197 ± 18.000 2000 1 pixel 12 km 1.0 0.72 6 km424.763 ± 4.000 1000 (10 km) 10 km 1.0 1.02 5 km
Fig. 8 - Earth's disk observed by Meteosat andreference coverage in 15 min from GOMAS
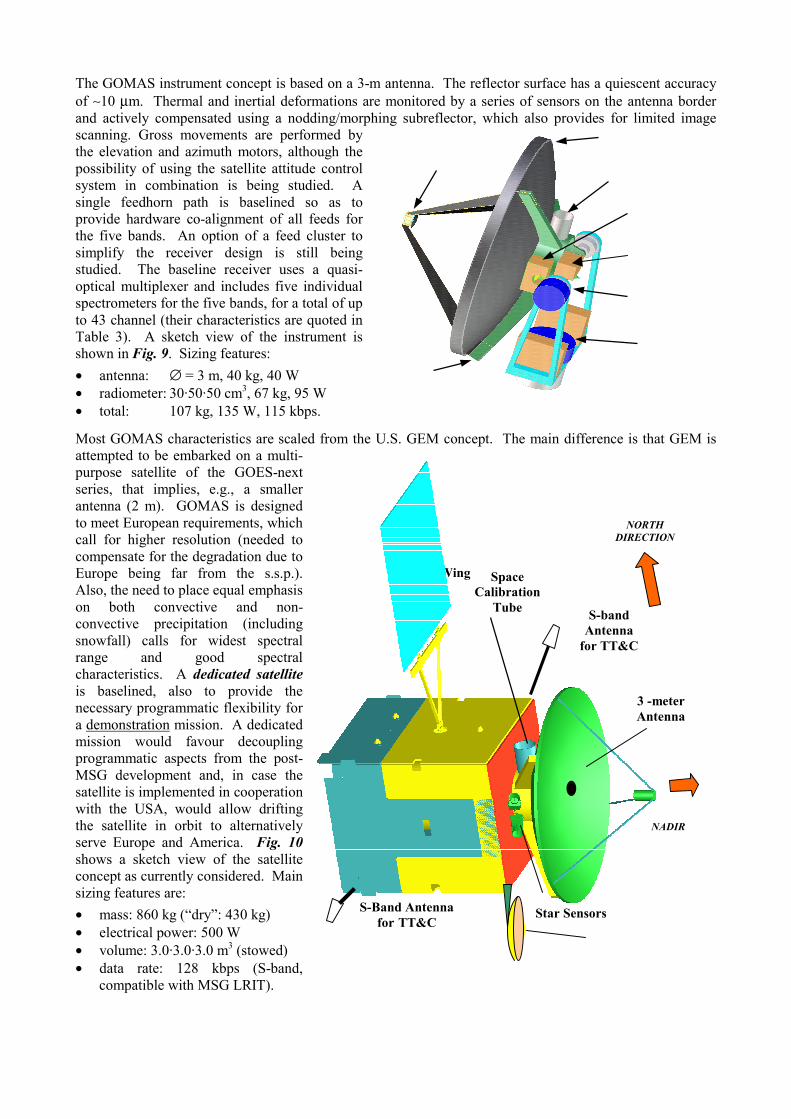
The GOMAS instrument concept is based on a 3-m antenna. The reflector surface has a quiescent accuracyof ∼10 µm. Thermal and inertial deformations are monitored by a series of sensors on the antenna borderand actively compensated using a nodding/morphing subreflector, which also provides for limited imagescanning. Gross movements are performed bythe elevation and azimuth motors, although thepossibility of using the satellite attitude controlsystem in combination is being studied. Asingle feedhorn path is baselined so as toprovide hardware co-alignment of all feeds forthe five bands. An option of a feed cluster tosimplify the receiver design is still beingstudied. The baseline receiver uses a quasi-optical multiplexer and includes five individualspectrometers for the five bands, for a total of upto 43 channel (their characteristics are quoted inTable 3). A sketch view of the instrument isshown in Fig. 9. Sizing features:• antenna: ∅ = 3 m, 40 kg, 40 W• radiometer: 30·50·50 cm3, 67 kg, 95 W• total: 107 kg, 135 W, 115 kbps.
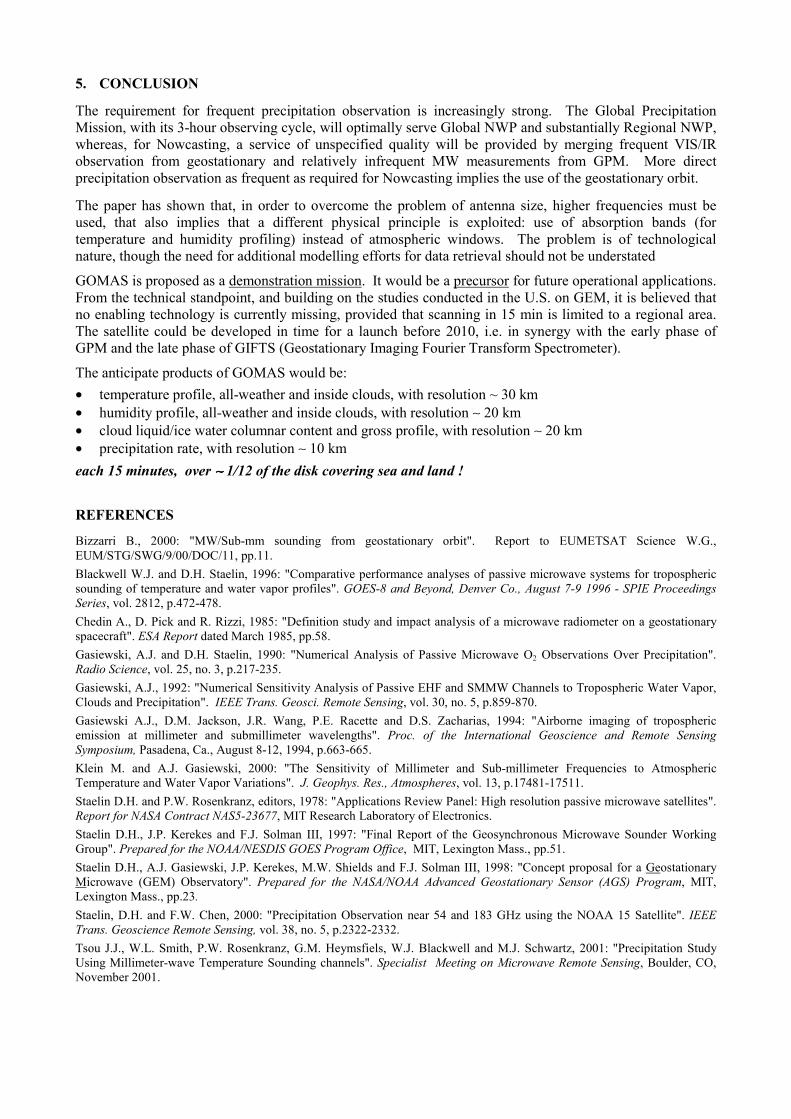
Most GOMAS characteristics are scaled from the U.S. GEM concept. The main difference is that GEM isattempted to be embarked on a multi-purpose satellite of the GOES-nextseries, that implies, e.g., a smallerantenna (2 m). GOMAS is designedto meet European requirements, whichcall for higher resolution (needed tocompensate for the degradation due toEurope being far from the s.s.p.).Also, the need to place equal emphasison both convective and non-convective precipitation (includingsnowfall) calls for widest spectralrange and good spectralcharacteristics. A dedicated satelliteis baselined, also to provide thenecessary programmatic flexibility fora demonstration mission. A dedicatedmission would favour decouplingprogrammatic aspects from the post-MSG development and, in case thesatellite is implemented in cooperationwith the USA, would allow driftingthe satellite in orbit to alternativelyserve Europe and America. Fig. 10shows a sketch view of the satelliteconcept as currently considered. Mainsizing features are:• mass: 860 kg (“dry”: 430 kg)• electrical power: 500 W• volume: 3.0·3.0·3.0 m3 (stowed)• data rate: 128 kbps (S-band,
compatible with MSG LRIT).
Azimuth Motor& Compensator
Elevation Motor& Compensator
Nodding / MorphingSubreflector
ThinStruts
Space Calibration Tube
BackupStructure
3” Thick CompositeReflector
50-430 GHzFeeds
ReceiverPackage
Fig. 9 - Sketch view of the instrument with its 3-m antenna.
NADIR
NORTHDIRECTION
SpaceCalibration
Tube
Solar Wing
3 -meterAntenna
Star Sensors
S-bandAntenna
for TT&C
S-Band Antennafor TT&C
Fig. 10 - Sketch view of the GOMAS satellite.
S-band antennafor LRIT
5. CONCLUSION
The requirement for frequent precipitation observation is increasingly strong. The Global PrecipitationMission, with its 3-hour observing cycle, will optimally serve Global NWP and substantially Regional NWP,whereas, for Nowcasting, a service of unspecified quality will be provided by merging frequent VIS/IRobservation from geostationary and relatively infrequent MW measurements from GPM. More directprecipitation observation as frequent as required for Nowcasting implies the use of the geostationary orbit.
The paper has shown that, in order to overcome the problem of antenna size, higher frequencies must beused, that also implies that a different physical principle is exploited: use of absorption bands (fortemperature and humidity profiling) instead of atmospheric windows. The problem is of technologicalnature, though the need for additional modelling efforts for data retrieval should not be understated
GOMAS is proposed as a demonstration mission. It would be a precursor for future operational applications.From the technical standpoint, and building on the studies conducted in the U.S. on GEM, it is believed thatno enabling technology is currently missing, provided that scanning in 15 min is limited to a regional area.The satellite could be developed in time for a launch before 2010, i.e. in synergy with the early phase ofGPM and the late phase of GIFTS (Geostationary Imaging Fourier Transform Spectrometer).
The anticipate products of GOMAS would be:• temperature profile, all-weather and inside clouds, with resolution ~ 30 km• humidity profile, all-weather and inside clouds, with resolution ∼ 20 km• cloud liquid/ice water columnar content and gross profile, with resolution ∼ 20 km• precipitation rate, with resolution ∼ 10 kmeach 15 minutes, over ∼∼∼∼ 1/12 of the disk covering sea and land !
REFERENCES
Bizzarri B., 2000: "MW/Sub-mm sounding from geostationary orbit". Report to EUMETSAT Science W.G.,EUM/STG/SWG/9/00/DOC/11, pp.11.Blackwell W.J. and D.H. Staelin, 1996: "Comparative performance analyses of passive microwave systems for troposphericsounding of temperature and water vapor profiles". GOES-8 and Beyond, Denver Co., August 7-9 1996 - SPIE ProceedingsSeries, vol. 2812, p.472-478.Chedin A., D. Pick and R. Rizzi, 1985: "Definition study and impact analysis of a microwave radiometer on a geostationaryspacecraft". ESA Report dated March 1985, pp.58.Gasiewski, A.J. and D.H. Staelin, 1990: "Numerical Analysis of Passive Microwave O2 Observations Over Precipitation".Radio Science, vol. 25, no. 3, p.217-235.Gasiewski, A.J., 1992: "Numerical Sensitivity Analysis of Passive EHF and SMMW Channels to Tropospheric Water Vapor,Clouds and Precipitation". IEEE Trans. Geosci. Remote Sensing, vol. 30, no. 5, p.859-870.Gasiewski A.J., D.M. Jackson, J.R. Wang, P.E. Racette and D.S. Zacharias, 1994: "Airborne imaging of troposphericemission at millimeter and submillimeter wavelengths". Proc. of the International Geoscience and Remote SensingSymposium, Pasadena, Ca., August 8-12, 1994, p.663-665.Klein M. and A.J. Gasiewski, 2000: "The Sensitivity of Millimeter and Sub-millimeter Frequencies to AtmosphericTemperature and Water Vapor Variations". J. Geophys. Res., Atmospheres, vol. 13, p.17481-17511.Staelin D.H. and P.W. Rosenkranz, editors, 1978: "Applications Review Panel: High resolution passive microwave satellites".Report for NASA Contract NAS5-23677, MIT Research Laboratory of Electronics.Staelin D.H., J.P. Kerekes and F.J. Solman III, 1997: "Final Report of the Geosynchronous Microwave Sounder WorkingGroup". Prepared for the NOAA/NESDIS GOES Program Office, MIT, Lexington Mass., pp.51.Staelin D.H., A.J. Gasiewski, J.P. Kerekes, M.W. Shields and F.J. Solman III, 1998: "Concept proposal for a GeostationaryMicrowave (GEM) Observatory". Prepared for the NASA/NOAA Advanced Geostationary Sensor (AGS) Program, MIT,Lexington Mass., pp.23.Staelin, D.H. and F.W. Chen, 2000: "Precipitation Observation near 54 and 183 GHz using the NOAA 15 Satellite". IEEETrans. Geoscience Remote Sensing, vol. 38, no. 5, p.2322-2332.Tsou J.J., W.L. Smith, P.W. Rosenkranz, G.M. Heymsfiels, W.J. Blackwell and M.J. Schwartz, 2001: "Precipitation StudyUsing Millimeter-wave Temperature Sounding channels". Specialist Meeting on Microwave Remote Sensing, Boulder, CO,November 2001.