Embed Size (px)
Citation preview

UNITED STATESSECURITIES AND EXCHANGE COMMISSION
Washington, D.C. 20549_________________________________________________________
FORM 10-Q _________________________________________________________
(Mark One)
☑ QUARTERLY REPORT PURSUANT TO SECTION 13 OR 15(d) OF THE SECURITIES EXCHANGE ACT OF 1934
For the quarterly period ended September 30, 2019
or
☐ TRANSITION REPORT PURSUANT TO SECTION 13 OR 15(d) OF THE SECURITIES EXCHANGE ACT OF 1934
For the transition period from to
Commission File Number: 1-14267_________________________________________________________
REPUBLIC SERVICES, INC.(Exact name of registrant as specified in its charter)
_________________________________________________________ Delaware 65-0716904
(State or other jurisdiction ofincorporation or organization)
(I.R.S. EmployerIdentification No.)
18500 North Allied Way85054Phoenix, Arizona
(Address of principal executive offices) (Zip Code)
Registrant’s telephone number, including area code: (480) 627-2700_________________________________________________________
Securities registered pursuant to Section 12(b) of the Act:
Title of each class Trading Symbol(s) Name of each exchange on which registeredCommon Stock, par value $0.01 per share RSG New York Stock Exchange
Indicate by check mark whether the registrant (1) has filed all reports required to be filed by Section 13 or 15(d) of the Securities Exchange Act of 1934 during the preceding 12 months (or for such shorter period that the registrant was required to file such reports), and (2) has been subject to such filing requirements for the past 90 days. Yes þ No ¨
Indicate by check mark whether the registrant has submitted electronically every Interactive Data File required to be submitted pursuant to Rule 405 of Regulation S-T (§232.405 of this chapter) during the preceding 12 months (or for such shorter period that the registrant was required to submit such files). Yes þ No ¨
Indicate by check mark whether the registrant is a large accelerated filer, an accelerated filer, a non-accelerated filer, smaller reporting company, or an emerging growth company. See the definitions of “large accelerated filer,” “accelerated filer,” “smaller reporting company,” and “emerging growth company” in Rule 12b-2 of the Exchange Act.
Large accelerated filer þ Accelerated filer ¨ Smaller reporting company ☐Non-accelerated filer ¨ Emerging growth company ☐If an emerging growth company, indicate by check mark if the registrant has elected not to use the extended transition period for complying with any new or revised financial accounting standards provided pursuant to Section 13(a) of the Exchange Act. ¨
Indicate by check mark whether the registrant is a shell company (as defined in Rule 12b-2 of the Exchange Act). Yes ☐ No þ
As of October 23, 2019, the registrant had outstanding 319,144,722 shares of Common Stock, par value $0.01 per share (excluding treasury shares of 34,111,724).
Table of Contents
REPUBLIC SERVICES, INC.
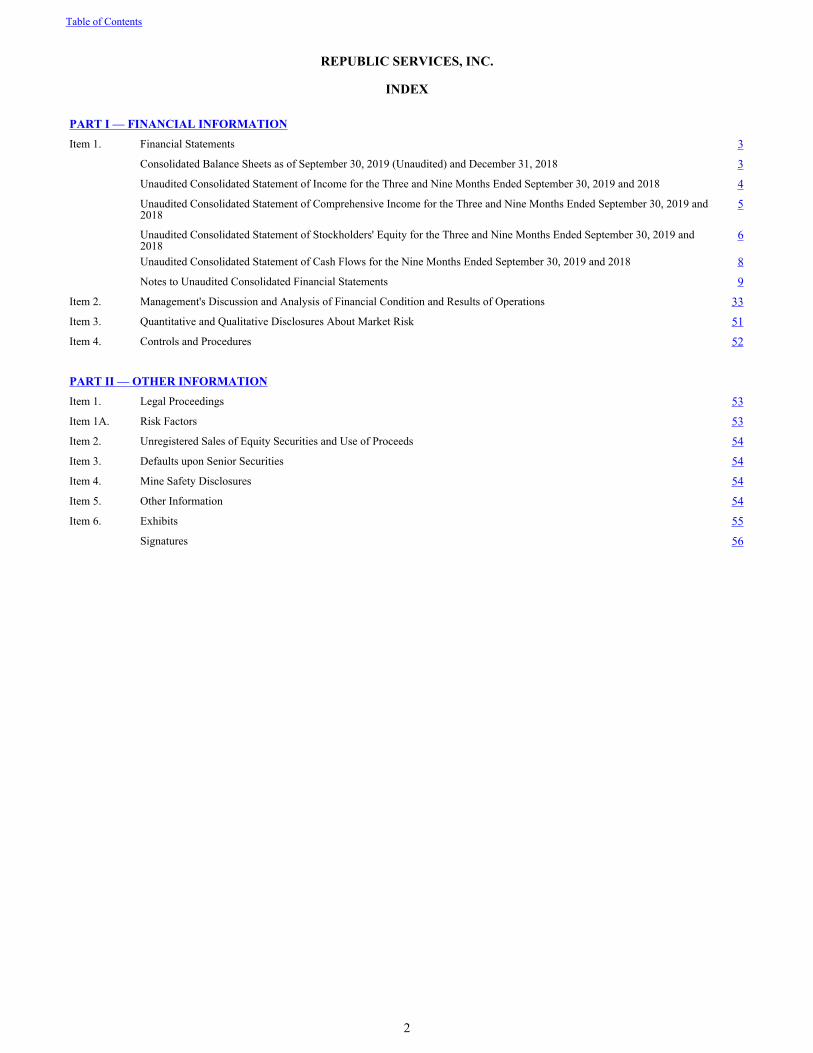
INDEX PART I — FINANCIAL INFORMATIONItem 1. Financial Statements 3
Consolidated Balance Sheets as of September 30, 2019 (Unaudited) and December 31, 2018 3Unaudited Consolidated Statement of Income for the Three and Nine Months Ended September 30, 2019 and 2018 4Unaudited Consolidated Statement of Comprehensive Income for the Three and Nine Months Ended September 30, 2019 and 2018
5
Unaudited Consolidated Statement of Stockholders' Equity for the Three and Nine Months Ended September 30, 2019 and 2018
6
Unaudited Consolidated Statement of Cash Flows for the Nine Months Ended September 30, 2019 and 2018 8Notes to Unaudited Consolidated Financial Statements 9
Item 2. Management's Discussion and Analysis of Financial Condition and Results of Operations 33Item 3. Quantitative and Qualitative Disclosures About Market Risk 51Item 4. Controls and Procedures 52
PART II — OTHER INFORMATIONItem 1. Legal Proceedings 53Item 1A. Risk Factors 53Item 2. Unregistered Sales of Equity Securities and Use of Proceeds 54Item 3. Defaults upon Senior Securities 54Item 4. Mine Safety Disclosures 54Item 5. Other Information 54Item 6. Exhibits 55
Signatures 56
Table of Contents
2

PART I - FINANCIAL INFORMATION
ITEM 1. FINANCIAL STATEMENTS.
REPUBLIC SERVICES, INC.CONSOLIDATED BALANCE SHEETS
(in millions, except per share data)
September 30, December 31,
2019 2018
(Unaudited)
ASSETSCurrent assets:
Cash and cash equivalents $ 55.6 $ 70.5Accounts receivable, less allowance for doubtful accounts and other of $35.7 and $34.3, respectively 1,162.9 1,102.7
Prepaid expenses and other current assets 255.4 391.2Total current assets 1,473.9 1,564.4
Restricted cash and marketable securities 121.3 108.1Property and equipment, net 8,257.6 8,020.1Goodwill 11,650.5 11,400.1Other intangible assets, net 124.1 106.5Other assets 701.7 417.8
Total assets $ 22,329.1 $ 21,617.0
LIABILITIES AND STOCKHOLDERS’ EQUITYCurrent liabilities:
Accounts payable $ 697.2 $ 761.5Notes payable and current maturities of long-term debt 912.8 690.7Deferred revenue 341.1 338.7Accrued landfill and environmental costs, current portion 153.2 130.6Accrued interest 79.7 68.5Other accrued liabilities 813.4 728.6
Total current liabilities 2,997.4 2,718.6Long-term debt, net of current maturities 7,705.8 7,646.8Accrued landfill and environmental costs, net of current portion 1,702.0 1,701.6Deferred income taxes and other long-term tax liabilities, net 1,074.6 1,028.3Insurance reserves, net of current portion 279.3 270.8Other long-term liabilities 591.5 321.4Commitments and contingencies
Stockholders’ equity:
Preferred stock, par value $0.01 per share; 50 shares authorized; none issued — —Common stock, par value $0.01 per share; 750 shares authorized; 353.3 and 351.9 issued and outstanding, respectively 3.5 3.5Additional paid-in capital 4,979.5 4,924.9Retained earnings 5,155.9 4,750.5Treasury stock, at cost; 33.9 and 29.4 shares, respectively (2,153.9) (1,782.6)Accumulated other comprehensive income (loss), net of tax (8.5) 30.8
Total Republic Services, Inc. stockholders’ equity 7,976.5 7,927.1Non-controlling interests in consolidated subsidiary 2.0 2.4Total stockholders’ equity 7,978.5 7,929.5Total liabilities and stockholders’ equity $ 22,329.1 $ 21,617.0
The accompanying notes are an integral part of these statements.
Table of Contents
3

REPUBLIC SERVICES, INC.UNAUDITED CONSOLIDATED STATEMENT OF INCOME
(in millions, except per share data)
Three Months Ended September 30,
Nine Months Ended September 30,
2019 2018 2019 2018Revenue $ 2,646.9 $ 2,565.7 $ 7,722.7 $ 7,510.9Expenses:
Cost of operations 1,631.4 1,577.4 4,754.4 4,624.4Depreciation, amortization and depletion 267.3 262.4 783.1 781.0Accretion 20.5 20.1 61.4 60.7Selling, general and administrative 275.4 260.9 806.3 775.0Gain on disposition of assets and asset impairments, net (24.0) (4.6) (23.5) (5.3)Restructuring charges 8.5 9.2 13.0 22.5Operating income 467.8 440.3 1,328.0 1,252.6
Interest expense (98.0) (96.0) (296.9) (287.3)Loss from unconsolidated equity method investment (4.0) (5.6) (27.2) (5.7)Loss on extinguishment of debt — — — (0.3)Interest income 2.0 0.5 5.4 1.0Other income, net 1.7 1.1 1.6 3.3
Income before income taxes 369.5 340.3 1,010.9 963.6Provision for income taxes 71.5 77.4 227.1 227.1Net income 298.0 262.9 783.8 736.5
Net loss (income) attributable to non-controlling interests in consolidated subsidiary 0.3 0.5 0.2 (0.5)
Net income attributable to Republic Services, Inc. $ 298.3 $ 263.4 $ 784.0 $ 736.0Basic earnings per share attributable to Republic Services, Inc.
stockholders:Basic earnings per share $ 0.93 $ 0.81 $ 2.44 $ 2.25Weighted average common shares outstanding 320.6 325.5 321.5 327.8
Diluted earnings per share attributable to Republic Services, Inc. stockholders:Diluted earnings per share $ 0.93 $ 0.81 $ 2.43 $ 2.23
Weighted average common and common equivalent shares outstanding 321.7 326.9 322.6 329.3Cash dividends per common share $ 0.405 $ 0.375 $ 1.155 $ 1.065
The accompanying notes are an integral part of these statements.
Table of Contents
4
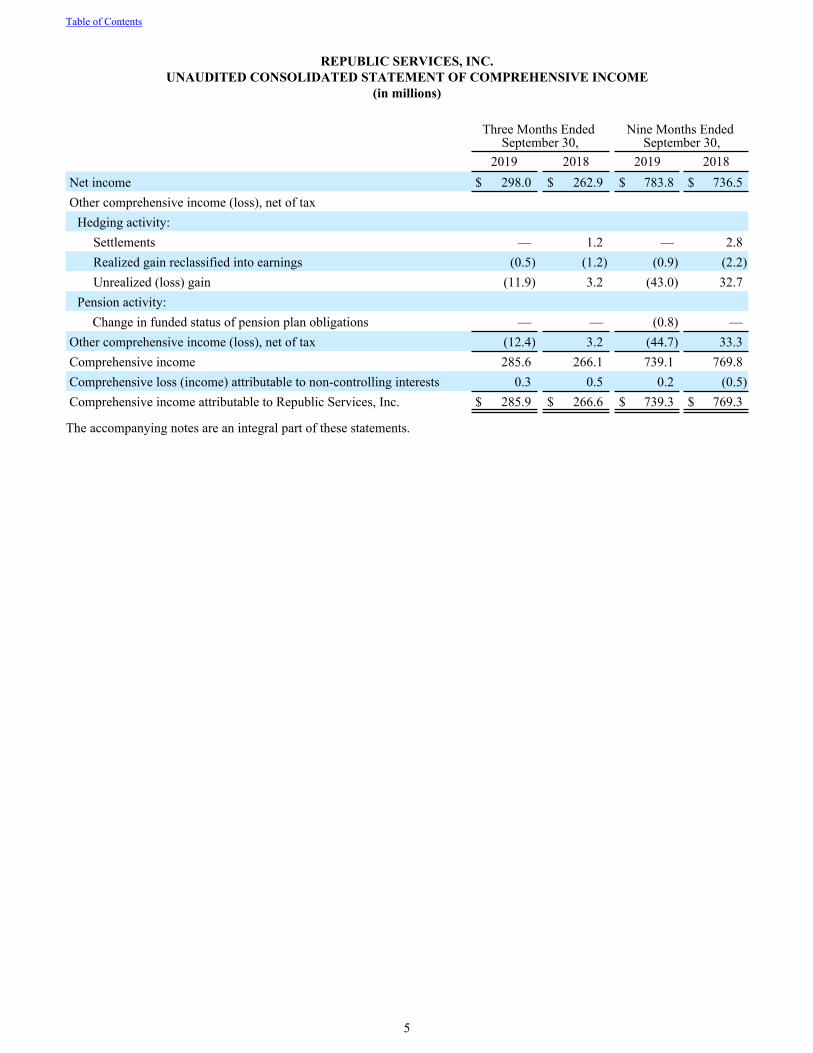
REPUBLIC SERVICES, INC.UNAUDITED CONSOLIDATED STATEMENT OF COMPREHENSIVE INCOME
(in millions)
Three Months Ended
September 30,Nine Months Ended
September 30, 2019 2018 2019 2018Net income $ 298.0 $ 262.9 $ 783.8 $ 736.5Other comprehensive income (loss), net of tax
Hedging activity:Settlements — 1.2 — 2.8Realized gain reclassified into earnings (0.5) (1.2) (0.9) (2.2)Unrealized (loss) gain (11.9) 3.2 (43.0) 32.7
Pension activity: Change in funded status of pension plan obligations — — (0.8) —
Other comprehensive income (loss), net of tax (12.4) 3.2 (44.7) 33.3Comprehensive income 285.6 266.1 739.1 769.8Comprehensive loss (income) attributable to non-controlling interests 0.3 0.5 0.2 (0.5)Comprehensive income attributable to Republic Services, Inc. $ 285.9 $ 266.6 $ 739.3 $ 769.3
The accompanying notes are an integral part of these statements.
Table of Contents
5

REPUBLIC SERVICES, INC.UNAUDITED CONSOLIDATED STATEMENT OF STOCKHOLDERS’ EQUITY
(in millions)
Republic Services, Inc. Stockholders’ Equity
Common Stock Additional Paid-In Capital
Retained Earnings
Treasury Stock
Accumulated Other
Comprehensive Income, Net of
Tax
Non-controllingInterests In
Consolidated SubsidiaryShares Amount Shares Amount Total
Balance as of December 31, 2018 351.9 $ 3.5 $ 4,924.9 $ 4,750.5 (29.4) $ (1,782.6) $ 30.8 $ 2.4 $ 7,929.5Adoption of accounting standard — — — (5.4) — — 5.4 — —
Net income — — — 234.2 — — — 0.7 234.9
Other comprehensive loss — — — — — — (11.4) — (11.4)
Cash dividends declared — — — (120.7) — — — — (120.7)
Issuances of common stock 0.9 — 7.7 — (0.2) (16.8) — — (9.1)
Stock-based compensation — — 12.0 (1.1) — — — — 10.9Purchase of common stock for treasury — — — — (1.5) (111.5) — — (111.5)
Balance as of March 31, 2019 352.8 3.5 4,944.6 4,857.5 (31.1) (1,910.9) 24.8 3.1 7,922.6
Net income — — — 251.5 — — — (0.6) 250.9
Other comprehensive loss — — — — — — (20.9) — (20.9)
Cash dividends declared — — — (120.2) — — — — (120.2)
Issuances of common stock 0.2 — 6.3 — — (0.3) — — 6.0
Stock-based compensation — — 9.8 (0.9) — — — — 8.9Purchase of common stock for treasury — — — — (1.1) (91.9) — — (91.9)
Distributions paid — — — — — — — (0.2) (0.2)
Balance as of June 30, 2019 353.0 3.5 4,960.7 4,987.9 (32.2) (2,003.1) 3.9 2.3 7,955.2
Net income — — — 298.3 — — — (0.3) 298.0
Other comprehensive loss — — — — — — (12.4) — (12.4)
Cash dividends declared — — — (129.3) — — — — (129.3)
Issuances of common stock 0.3 — 8.7 — — (0.3) — — 8.4
Stock-based compensation — — 10.1 (1.0) — — — — 9.1
Purchase of common stock for treasury — — — — (1.7) (150.5) — — (150.5)
Balance as of September 30, 2019 353.3 $ 3.5 $ 4,979.5 $ 5,155.9 (33.9) $ (2,153.9) $ (8.5) $ 2.0 $ 7,978.5
The accompanying notes are an integral part of these statements.
Table of Contents
6
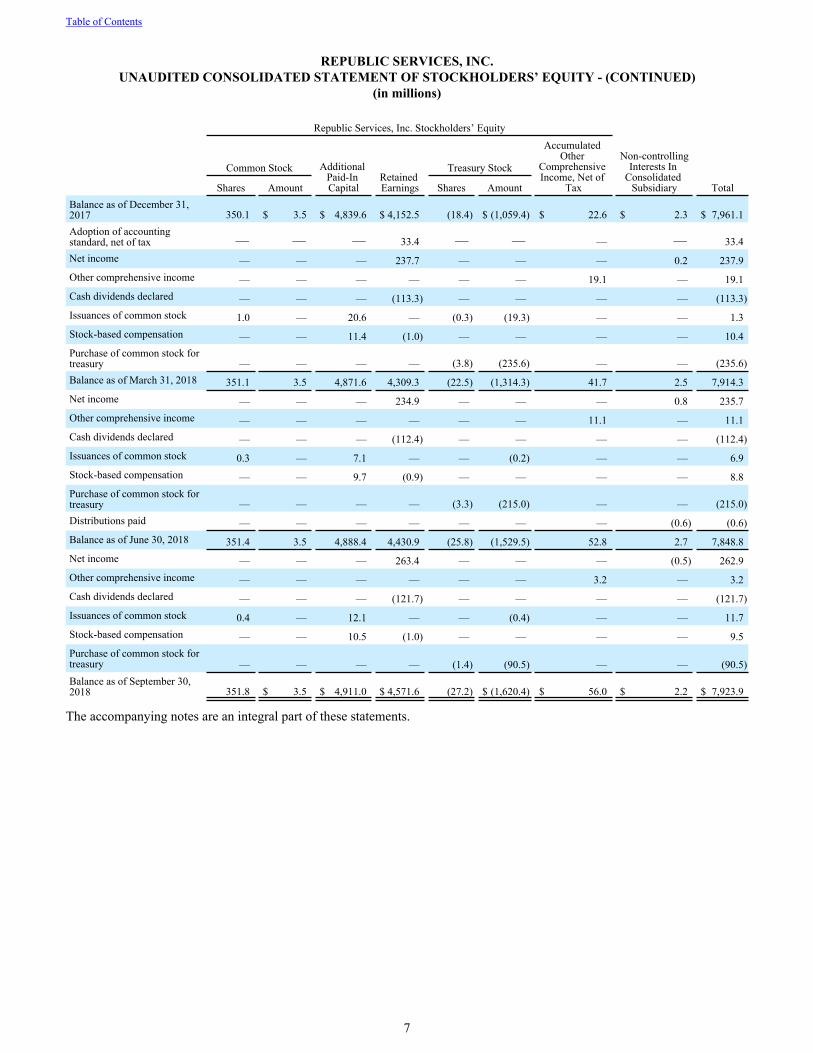
REPUBLIC SERVICES, INC.UNAUDITED CONSOLIDATED STATEMENT OF STOCKHOLDERS’ EQUITY - (CONTINUED)
(in millions)
Republic Services, Inc. Stockholders’ Equity
Common Stock Additional Paid-In Capital
Retained Earnings
Treasury Stock
Accumulated Other
Comprehensive Income, Net of
Tax
Non-controllingInterests In
Consolidated SubsidiaryShares Amount Shares Amount Total
Balance as of December 31, 2017 350.1 $ 3.5 $ 4,839.6 $ 4,152.5 (18.4) $ (1,059.4) $ 22.6 $ 2.3 $ 7,961.1Adoption of accounting standard, net of tax — — — 33.4 — — — — 33.4Net income — — — 237.7 — — — 0.2 237.9Other comprehensive income — — — — — — 19.1 — 19.1Cash dividends declared — — — (113.3) — — — — (113.3)Issuances of common stock 1.0 — 20.6 — (0.3) (19.3) — — 1.3Stock-based compensation — — 11.4 (1.0) — — — — 10.4Purchase of common stock for treasury — — — — (3.8) (235.6) — — (235.6)Balance as of March 31, 2018 351.1 3.5 4,871.6 4,309.3 (22.5) (1,314.3) 41.7 2.5 7,914.3Net income — — — 234.9 — — — 0.8 235.7Other comprehensive income — — — — — — 11.1 — 11.1Cash dividends declared — — — (112.4) — — — — (112.4)Issuances of common stock 0.3 — 7.1 — — (0.2) — — 6.9Stock-based compensation — — 9.7 (0.9) — — — — 8.8Purchase of common stock for treasury — — — — (3.3) (215.0) — — (215.0)Distributions paid — — — — — — — (0.6) (0.6)Balance as of June 30, 2018 351.4 3.5 4,888.4 4,430.9 (25.8) (1,529.5) 52.8 2.7 7,848.8Net income — — — 263.4 — — — (0.5) 262.9Other comprehensive income — — — — — — 3.2 — 3.2Cash dividends declared — — — (121.7) — — — — (121.7)Issuances of common stock 0.4 — 12.1 — — (0.4) — — 11.7Stock-based compensation — — 10.5 (1.0) — — — — 9.5Purchase of common stock for treasury — — — — (1.4) (90.5) — — (90.5)Balance as of September 30, 2018 351.8 $ 3.5 $ 4,911.0 $ 4,571.6 (27.2) $ (1,620.4) $ 56.0 $ 2.2 $ 7,923.9
The accompanying notes are an integral part of these statements.
Table of Contents
7

REPUBLIC SERVICES, INC.UNAUDITED CONSOLIDATED STATEMENT OF CASH FLOWS
(in millions) Nine Months Ended September 30, 2019 2018Cash provided by operating activities:Net income $ 783.8 $ 736.5Adjustments to reconcile net income to cash provided by operating activities:
Depreciation, amortization, depletion and accretion 844.5 841.7Non-cash interest expense 34.9 31.4Restructuring related charges 13.0 22.5Stock-based compensation 29.2 29.4Deferred tax provision 72.9 113.7Provision for doubtful accounts, net of adjustments 23.4 24.4Loss on extinguishment of debt — 0.3Gain on disposition of assets and asset impairments, net (22.4) (1.7)Environmental adjustments (9.6) 3.3Loss from unconsolidated equity method investment 27.2 5.7Other non-cash items (0.9) 0.6
Change in assets and liabilities, net of effects from business acquisitions and divestitures:Accounts receivable (65.3) (72.1)Prepaid expenses and other assets 98.3 (13.5)Accounts payable (9.3) 58.6Restructuring expenditures (7.9) (18.7)Capping, closure and post-closure expenditures (47.7) (42.5)Remediation expenditures (29.4) (30.2)Other liabilities 52.2 26.4
Proceeds from retirement of certain hedging relationships — 31.1Cash provided by operating activities 1,786.9 1,746.9
Cash used in investing activities:Purchases of property and equipment (908.3) (820.5)Proceeds from sales of property and equipment 11.7 7.9Cash used in acquisitions and investments, net of cash and restricted cash acquired (455.9) (130.5)Cash received from business divestitures 41.6 10.6Purchases of restricted marketable securities (9.1) (35.4)Sales of restricted marketable securities 8.6 36.2Other (5.2) —
Cash used in investing activities (1,316.6) (931.7)Cash used in financing activities:
Proceeds from notes payable and long-term debt, net of fees 3,504.8 3,296.7Proceeds from issuance of senior notes, net of discount and fees 891.9 782.0Payments of notes payable and long-term debt and senior notes (4,145.9) (4,032.6)Issuances of common stock, net 5.3 19.9Purchases of common stock for treasury (353.8) (574.9)Cash dividends paid (361.9) (340.0)Distributions paid to non-controlling interests in consolidated subsidiary (0.2) (0.6)Other (15.2) (7.9)
Cash used in financing activities (475.0) (857.4)Decrease in cash, cash equivalents, restricted cash and restricted cash equivalents (4.7) (42.2)Cash, cash equivalents, restricted cash and restricted cash equivalents at beginning of year 133.3 179.1Cash, cash equivalents, restricted cash and restricted cash equivalents at end of period $ 128.6 $ 136.9
The accompanying notes are an integral part of these statements.
Table of Contents
8
REPUBLIC SERVICES, INC.NOTES TO UNAUDITED CONSOLIDATED FINANCIAL STATEMENTS
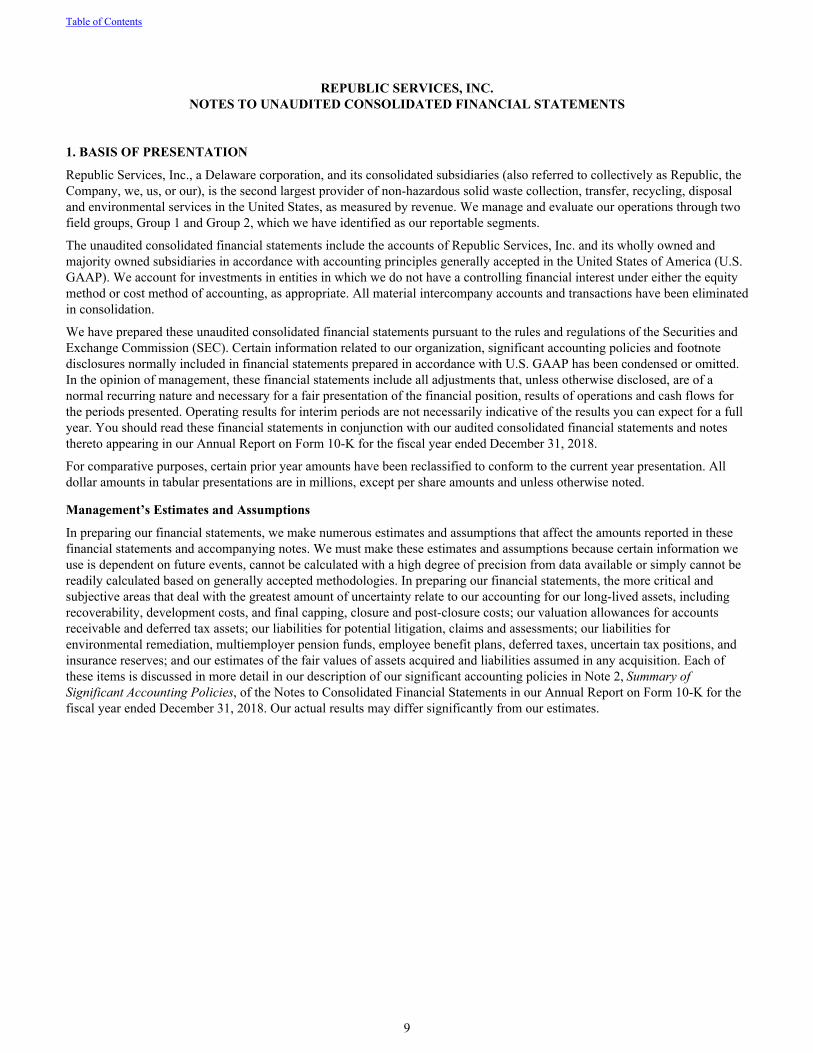
1. BASIS OF PRESENTATION
Republic Services, Inc., a Delaware corporation, and its consolidated subsidiaries (also referred to collectively as Republic, the Company, we, us, or our), is the second largest provider of non-hazardous solid waste collection, transfer, recycling, disposal and environmental services in the United States, as measured by revenue. We manage and evaluate our operations through two field groups, Group 1 and Group 2, which we have identified as our reportable segments.
The unaudited consolidated financial statements include the accounts of Republic Services, Inc. and its wholly owned and majority owned subsidiaries in accordance with accounting principles generally accepted in the United States of America (U.S. GAAP). We account for investments in entities in which we do not have a controlling financial interest under either the equity method or cost method of accounting, as appropriate. All material intercompany accounts and transactions have been eliminated in consolidation.
We have prepared these unaudited consolidated financial statements pursuant to the rules and regulations of the Securities and Exchange Commission (SEC). Certain information related to our organization, significant accounting policies and footnote disclosures normally included in financial statements prepared in accordance with U.S. GAAP has been condensed or omitted. In the opinion of management, these financial statements include all adjustments that, unless otherwise disclosed, are of a normal recurring nature and necessary for a fair presentation of the financial position, results of operations and cash flows for the periods presented. Operating results for interim periods are not necessarily indicative of the results you can expect for a full year. You should read these financial statements in conjunction with our audited consolidated financial statements and notes thereto appearing in our Annual Report on Form 10-K for the fiscal year ended December 31, 2018.
For comparative purposes, certain prior year amounts have been reclassified to conform to the current year presentation. All dollar amounts in tabular presentations are in millions, except per share amounts and unless otherwise noted.
Management’s Estimates and Assumptions
In preparing our financial statements, we make numerous estimates and assumptions that affect the amounts reported in these financial statements and accompanying notes. We must make these estimates and assumptions because certain information we use is dependent on future events, cannot be calculated with a high degree of precision from data available or simply cannot be readily calculated based on generally accepted methodologies. In preparing our financial statements, the more critical and subjective areas that deal with the greatest amount of uncertainty relate to our accounting for our long-lived assets, including recoverability, development costs, and final capping, closure and post-closure costs; our valuation allowances for accounts receivable and deferred tax assets; our liabilities for potential litigation, claims and assessments; our liabilities for environmental remediation, multiemployer pension funds, employee benefit plans, deferred taxes, uncertain tax positions, and insurance reserves; and our estimates of the fair values of assets acquired and liabilities assumed in any acquisition. Each of these items is discussed in more detail in our description of our significant accounting policies in Note 2, Summary of Significant Accounting Policies, of the Notes to Consolidated Financial Statements in our Annual Report on Form 10-K for the fiscal year ended December 31, 2018. Our actual results may differ significantly from our estimates.
Table of Contents
9

New Accounting Pronouncements
Accounting Standards Adopted
Effective January 1, 2019, we adopted the following accounting standard updates (ASUs) as issued by the Financial Accounting Standards Board (FASB):
ASU Effective DateASU 2016-02 Leases (Topic 842) January 1, 2019
ASU 2017-12Derivatives and Hedging (Topic 815): Targeted Improvements to Accounting for Hedging Activities January 1, 2019
ASU 2018-16
Derivatives and Hedging (Topic 815): Inclusion of the Secured Overnight Financing Rate (SOFR) Overnight Index Swap (OIS) Rate as a Benchmark Interest Rate for Hedge Accounting January 1, 2019
ASU 2018-02Income Statement - Reporting Comprehensive Income (Topic 220) Reclassification of Certain Tax Effects from Accumulated Other Comprehensive Income January 1, 2019
ASU 2018-07Compensation—Stock Compensation (Topic 718): Improvements to Nonemployee Share-Based Payment Accounting January 1, 2019
ASU 2018-15
Intangibles - Goodwill and Other - Internal-Use Software (Subtopic 350-40) Customer’s Accounting for Implementation Costs Incurred in a Cloud Computing Arrangement That Is a Service Contract January 1, 2019
Leases
Effective January 1, 2019, we adopted ASU 2016-02, Leases (Topic 842) (ASC 842 or the new leasing standard) using the optional transition method prescribed by ASU 2018-11, Leases (Topic 842): Targeted Improvements. Upon adoption of the new leasing standard, we recognized a right-of-use asset and a right-of-use liability for leases classified as operating leases in our consolidated balance sheet. We applied the package of practical expedients to leases that commenced before the effective date whereby we elected to not reassess the following: (i) whether any expired or existing contracts contain leases; (ii) the lease classification for any expired or existing leases; and (iii) initial direct costs for any existing leases.
To assist in quantifying the impact on our consolidated financial statements and supplementing our existing disclosures, we designed internal controls over the adoption and implemented a software solution to manage and account for our leases. As of January 1, 2019, we recognized a right-of-use liability for our operating leases of $256.3 million classified as other accrued liabilities and other long-term liabilities and a corresponding right-of-use asset of $236.2 million classified as other long-term assets in our consolidated balance sheet. The right-of-use asset reflects adjustments for certain favorable or unfavorable leases recognized through acquisitions, prepaid or accrued rent, asset impairments and lease incentives, including but not limited to cash incentives, rent abatement or leasehold improvements paid by the lessor. We did not recognize a cumulative effect adjustment to retained earnings as of January 1, 2019 as the standard did not have a material impact on our consolidated statement of income. In addition, the standard did not have a material impact on our accounting for finance (capital) leases.
We assessed the disclosure requirements under the new leasing standard as part of our adoption. Refer to Note 4, Other Assets, Note 5, Other Liabilities, and Note 8, Leases, included herein for our enhanced supplemental disclosures.
Derivatives and Hedging
Effective January 1, 2019, we adopted the FASB's ASU 2017-12, Derivatives and Hedging (Topic 815): Targeted Improvements to Accounting for Hedging Activities (ASU 2017-12). We adopted the new guidance over income statement presentation and enhanced disclosures prospectively, and we adopted the guidance over the elimination of the separate measurement of ineffectiveness on a modified retrospective basis to existing hedging relationships as of the date of adoption. Prior to adoption, the net periodic earnings of our fair value hedges were presented within other income, net in our consolidated statement of income and are now presented within interest expense in our consolidated statement of income, i.e. the same line item as the effect of the hedged item. Our adoption of ASU 2017-12 did not have a material impact on our consolidated financial statements.
Effective January 1, 2019, in conjunction with ASU 2017-12, we adopted the FASB's ASU 2018-16, Derivatives and Hedging (Topic 815): Inclusion of the Secured Overnight Financing Rate (SOFR) Overnight Index Swap (OIS) Rate as a Benchmark Interest Rate for Hedge Accounting (ASU 2018-16) on a prospective basis. LIBOR is expected to no longer be published by 2021. Consequently, the FASB added the OIS rate based on SOFR as an eligible benchmark interest rate in order to facilitate the LIBOR to SOFR transition and provide sufficient lead time for entities to prepare for changes to interest rate risk hedging strategies for both risk management and hedge accounting purposes. We are developing a plan to transition our interest rate
Table of ContentsREPUBLIC SERVICES, INC.
NOTES TO UNAUDITED CONSOLIDATED FINANCIAL STATEMENTS - (CONTINUED)
10
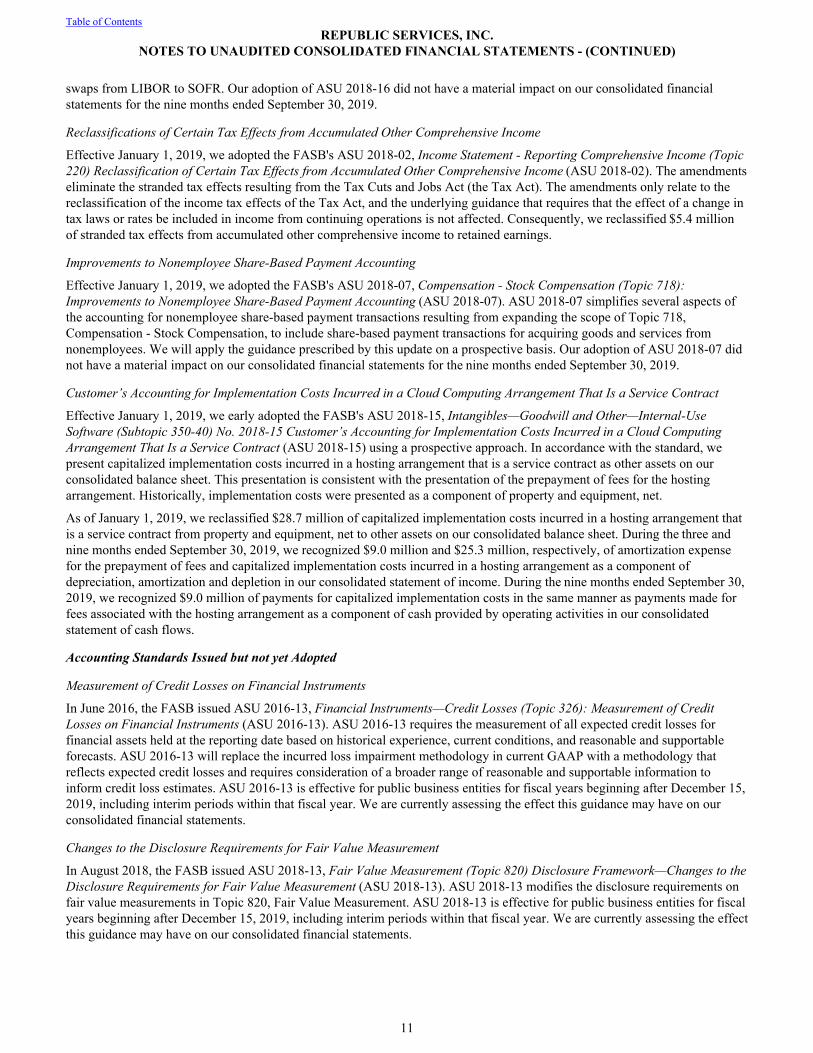
swaps from LIBOR to SOFR. Our adoption of ASU 2018-16 did not have a material impact on our consolidated financial statements for the nine months ended September 30, 2019.
Reclassifications of Certain Tax Effects from Accumulated Other Comprehensive Income
Effective January 1, 2019, we adopted the FASB's ASU 2018-02, Income Statement - Reporting Comprehensive Income (Topic 220) Reclassification of Certain Tax Effects from Accumulated Other Comprehensive Income (ASU 2018-02). The amendments eliminate the stranded tax effects resulting from the Tax Cuts and Jobs Act (the Tax Act). The amendments only relate to the reclassification of the income tax effects of the Tax Act, and the underlying guidance that requires that the effect of a change in tax laws or rates be included in income from continuing operations is not affected. Consequently, we reclassified $5.4 million of stranded tax effects from accumulated other comprehensive income to retained earnings.
Improvements to Nonemployee Share-Based Payment Accounting
Effective January 1, 2019, we adopted the FASB's ASU 2018-07, Compensation - Stock Compensation (Topic 718): Improvements to Nonemployee Share-Based Payment Accounting (ASU 2018-07). ASU 2018-07 simplifies several aspects of the accounting for nonemployee share-based payment transactions resulting from expanding the scope of Topic 718, Compensation - Stock Compensation, to include share-based payment transactions for acquiring goods and services from nonemployees. We will apply the guidance prescribed by this update on a prospective basis. Our adoption of ASU 2018-07 did not have a material impact on our consolidated financial statements for the nine months ended September 30, 2019.
Customer’s Accounting for Implementation Costs Incurred in a Cloud Computing Arrangement That Is a Service Contract
Effective January 1, 2019, we early adopted the FASB's ASU 2018-15, Intangibles—Goodwill and Other—Internal-Use Software (Subtopic 350-40) No. 2018-15 Customer’s Accounting for Implementation Costs Incurred in a Cloud Computing Arrangement That Is a Service Contract (ASU 2018-15) using a prospective approach. In accordance with the standard, we present capitalized implementation costs incurred in a hosting arrangement that is a service contract as other assets on our consolidated balance sheet. This presentation is consistent with the presentation of the prepayment of fees for the hosting arrangement. Historically, implementation costs were presented as a component of property and equipment, net.
As of January 1, 2019, we reclassified $28.7 million of capitalized implementation costs incurred in a hosting arrangement that is a service contract from property and equipment, net to other assets on our consolidated balance sheet. During the three and nine months ended September 30, 2019, we recognized $9.0 million and $25.3 million, respectively, of amortization expense for the prepayment of fees and capitalized implementation costs incurred in a hosting arrangement as a component of depreciation, amortization and depletion in our consolidated statement of income. During the nine months ended September 30, 2019, we recognized $9.0 million of payments for capitalized implementation costs in the same manner as payments made for fees associated with the hosting arrangement as a component of cash provided by operating activities in our consolidated statement of cash flows.
Accounting Standards Issued but not yet Adopted
Measurement of Credit Losses on Financial Instruments
In June 2016, the FASB issued ASU 2016-13, Financial Instruments—Credit Losses (Topic 326): Measurement of Credit Losses on Financial Instruments (ASU 2016-13). ASU 2016-13 requires the measurement of all expected credit losses for financial assets held at the reporting date based on historical experience, current conditions, and reasonable and supportable forecasts. ASU 2016-13 will replace the incurred loss impairment methodology in current GAAP with a methodology that reflects expected credit losses and requires consideration of a broader range of reasonable and supportable information to inform credit loss estimates. ASU 2016-13 is effective for public business entities for fiscal years beginning after December 15, 2019, including interim periods within that fiscal year. We are currently assessing the effect this guidance may have on our consolidated financial statements.
Changes to the Disclosure Requirements for Fair Value Measurement
In August 2018, the FASB issued ASU 2018-13, Fair Value Measurement (Topic 820) Disclosure Framework—Changes to the Disclosure Requirements for Fair Value Measurement (ASU 2018-13). ASU 2018-13 modifies the disclosure requirements on fair value measurements in Topic 820, Fair Value Measurement. ASU 2018-13 is effective for public business entities for fiscal years beginning after December 15, 2019, including interim periods within that fiscal year. We are currently assessing the effect this guidance may have on our consolidated financial statements.
Table of ContentsREPUBLIC SERVICES, INC.
NOTES TO UNAUDITED CONSOLIDATED FINANCIAL STATEMENTS - (CONTINUED)
11
Changes to the Disclosure Requirements for Defined Benefit Plans
In August 2018, the FASB issued ASU 2018-14, Compensation—Retirement Benefits—Defined Benefit Plans—General (Subtopic 715-20) Disclosure Framework—Changes to the Disclosure Requirements for Defined Benefit Plans (ASU 2018-14). ASU 2018-14 removes disclosures that no longer are considered cost beneficial, clarifies the specific requirements of disclosures, and adds disclosure requirements identified as relevant. Although narrow in scope, the amendments are considered an important part of the FASB’s efforts to improve the effectiveness of disclosures in the notes to financial statements. ASU 2018-14 is effective for public business entities for fiscal years beginning after December 15, 2020, including interim periods within that fiscal year. Early adoption is permitted for all entities. We are currently assessing the effect this guidance may have on our consolidated financial statements.
2. BUSINESS ACQUISITIONS, INVESTMENTS AND RESTRUCTURING CHARGES
Acquisitions
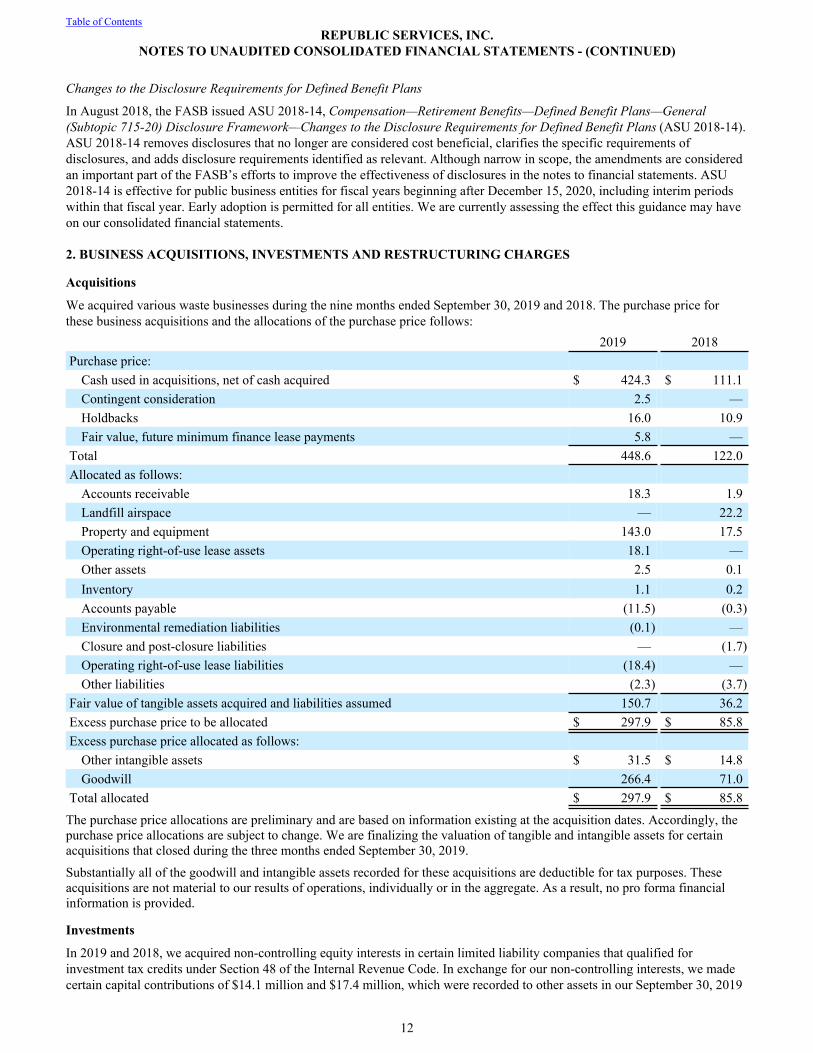
We acquired various waste businesses during the nine months ended September 30, 2019 and 2018. The purchase price for these business acquisitions and the allocations of the purchase price follows:
2019 2018Purchase price:
Cash used in acquisitions, net of cash acquired $ 424.3 $ 111.1Contingent consideration 2.5 —Holdbacks 16.0 10.9Fair value, future minimum finance lease payments 5.8 —
Total 448.6 122.0Allocated as follows:
Accounts receivable 18.3 1.9Landfill airspace — 22.2Property and equipment 143.0 17.5Operating right-of-use lease assets 18.1 —Other assets 2.5 0.1Inventory 1.1 0.2Accounts payable (11.5) (0.3)Environmental remediation liabilities (0.1) —Closure and post-closure liabilities — (1.7)Operating right-of-use lease liabilities (18.4) —Other liabilities (2.3) (3.7)
Fair value of tangible assets acquired and liabilities assumed 150.7 36.2Excess purchase price to be allocated $ 297.9 $ 85.8Excess purchase price allocated as follows:
Other intangible assets $ 31.5 $ 14.8Goodwill 266.4 71.0
Total allocated $ 297.9 $ 85.8
The purchase price allocations are preliminary and are based on information existing at the acquisition dates. Accordingly, the purchase price allocations are subject to change. We are finalizing the valuation of tangible and intangible assets for certain acquisitions that closed during the three months ended September 30, 2019.
Substantially all of the goodwill and intangible assets recorded for these acquisitions are deductible for tax purposes. These acquisitions are not material to our results of operations, individually or in the aggregate. As a result, no pro forma financial information is provided.
Investments
In 2019 and 2018, we acquired non-controlling equity interests in certain limited liability companies that qualified for investment tax credits under Section 48 of the Internal Revenue Code. In exchange for our non-controlling interests, we made certain capital contributions of $14.1 million and $17.4 million, which were recorded to other assets in our September 30, 2019
Table of ContentsREPUBLIC SERVICES, INC.
NOTES TO UNAUDITED CONSOLIDATED FINANCIAL STATEMENTS - (CONTINUED)
12

and 2018 consolidated balance sheets, respectively. During the nine months ended September 30, 2019 and 2018, we also reduced the carrying value of these investments by $27.2 million and $5.7 million, respectively, as a result of tax credits allocated to us, cash distributions and our share of income and loss pursuant to the terms of the limited liability company agreements.
Restructuring Charges
In January 2018, we eliminated certain positions following the consolidation of select back-office functions, including but not limited to the integration of our National Accounts support functions into our existing corporate support functions. These changes include a reduction in administrative staffing and closing of certain office locations.
During the three and nine months ended September 30, 2019, we incurred restructuring charges of $8.5 million and $13.0 million, respectively, that primarily related to upgrades to our back-office software systems. During the three and nine months ended September 30, 2018, we incurred restructuring charges of $9.2 million and $22.5 million, respectively, that primarily consisted of severance and other employee termination benefits and the closure of offices with lease agreements with non-cancelable terms. We paid $7.9 million and $18.7 million during the nine months ended September 30, 2019 and 2018, respectively, related to these restructuring efforts.
In 2019, we expect to incur additional restructuring charges of approximately $3 million to $5 million primarily related to upgrades to our back-office software systems. Substantially all of these restructuring charges will be recorded in our corporate segment.
3. GOODWILL AND OTHER INTANGIBLE ASSETS, NET
Our senior management evaluates, oversees and manages the financial performance of our operations through two field groups, referred to as Group 1 and Group 2.
Goodwill
A summary of the activity and balances in goodwill accounts by reporting segment follows:
Balance as of December 31, 2018 Acquisitions Divestitures
Adjustments to Acquisitions
Balance as of September 30, 2019
Group 1 $ 6,150.6 $ 85.9 $ — $ (1.2) $ 6,235.3Group 2 5,249.5 180.5 (14.6) (0.2) 5,415.2Total $ 11,400.1 $ 266.4 $ (14.6) $ (1.4) $ 11,650.5
Other Intangible Assets, Net
Other intangible assets, net, include values assigned to customer relationships, non-compete agreements and trade names, and are amortized over periods ranging from 1 to 18 years. A summary of the activity and balances by intangible asset type follows:
Gross Intangible Assets Accumulated Amortization Other Intangible Assets, Net
as of September
30, 2019
Balance as of December 31, 2018 Acquisitions
Adjustments and Other (1)
Balance as of
September 30, 2019
Balance as of December 31, 2018
Additions Charged to
ExpenseAdjustments and Other (1)
Balance as of
September 30, 2019
Customer relationships, franchise and other municipal agreements $ 692.4 $ 26.1 $ — $ 718.5 $ (607.2) $ (11.2) $ 0.2 $ (618.2) $ 100.3
Non-compete agreements 37.0 7.0 0.9 44.9 (31.5) (2.9) — (34.4) 10.5
Other intangible assets 64.3 — (6.1) 58.2 (48.5) (0.6) 4.2 (44.9) 13.3Total $ 793.7 $ 33.1 $ (5.2) $ 821.6 $ (687.2) $ (14.7) $ 4.4 $ (697.5) $ 124.1
(1) In accordance with our adoption of the new leasing standard, we transferred $1.9 million of net favorable lease assets recognized through historical acquisitions to other assets as of January 1, 2019.
Table of ContentsREPUBLIC SERVICES, INC.
NOTES TO UNAUDITED CONSOLIDATED FINANCIAL STATEMENTS - (CONTINUED)
13

4. OTHER ASSETS
Prepaid Expenses and Other Current Assets
A summary of prepaid expenses and other current assets as of September 30, 2019 and December 31, 2018 follows:
2019 2018Prepaid expenses $ 88.0 $ 75.6Inventories 55.3 53.1Other non-trade receivables 39.0 34.4Reinsurance receivable 31.4 25.7Income tax receivable 17.6 187.7Prepaid fees for cloud-based hosting arrangements, current 11.8 10.2Other current assets 12.3 4.5Total $ 255.4 $ 391.2
Other Assets
A summary of other assets as of September 30, 2019 and December 31, 2018 follows:
2019 2018Right-of-use lease asset (1) $ 243.1 $ —Deferred compensation plan 110.4 100.0Deferred contract costs and sales commissions 82.4 89.2Reinsurance receivable 78.0 68.0Investments 58.6 73.0Prepaid fees and capitalized implementation costs for cloud-based hosting arrangements (2) 33.6 —Amounts recoverable for capping, closure and post-closure obligations 32.8 30.5Interest rate swaps and locks 13.1 12.8Other derivative assets 4.9 —Deferred financing costs 3.3 4.2Other 41.5 40.1Total $ 701.7 $ 417.8
(1) Refer to Note 1, Basis of Presentation, for discussion regarding our adoption of ASC 842.
(2) In accordance with our adoption of ASU 2018-15, capitalized implementation costs for cloud-based hosting arrangements are presented as other assets as of September 30, 2019. Similar costs are presented as a component of property and equipment, net as of December 31, 2018.
Table of ContentsREPUBLIC SERVICES, INC.
NOTES TO UNAUDITED CONSOLIDATED FINANCIAL STATEMENTS - (CONTINUED)
14

5. OTHER LIABILITIES
Other Accrued Liabilities
A summary of other accrued liabilities as of September 30, 2019 and December 31, 2018 follows:
2019 2018Accrued payroll and benefits $ 206.0 $ 205.1Insurance reserves, current 156.7 152.9Accrued fees and taxes 139.7 124.2Accrued dividends 129.3 121.0Operating right-of-use lease liabilities, current (1) 36.6 —Ceded insurance reserves, current 31.1 25.7Interest rate swap locks 29.1 —Accrued professional fees and legal settlement reserves 9.5 13.1Other 75.4 86.6Total $ 813.4 $ 728.6
(1) Refer to Note 1, Basis of Presentation, for discussion regarding our adoption of ASC 842.
Other Long-Term Liabilities
A summary of other long-term liabilities as of September 30, 2019 and December 31, 2018 follows:
2019 2018Operating right-of-use lease liabilities (1) $ 226.0 $ —Deferred compensation plan liability 112.9 96.0Ceded insurance reserves 79.6 68.0Contingent purchase price and acquisition holdbacks 68.6 73.9Other derivative liabilities 24.2 —Withdrawal liability - multiemployer pension funds 12.1 12.2Legal settlement reserves 10.0 10.0Pension and other post-retirement liabilities 6.1 6.0Interest rate swap locks 1.6 —Other 50.4 55.3Total $ 591.5 $ 321.4
(1) Refer to Note 1, Basis of Presentation, for discussion regarding our adoption of ASC 842.
6. LANDFILL AND ENVIRONMENTAL COSTS
As of September 30, 2019, we owned or operated 190 active landfills with total available disposal capacity of approximately 5.0 billion in-place cubic yards. Additionally, we have post-closure responsibility for 129 closed landfills.
Accrued Landfill and Environmental Costs
A summary of accrued landfill and environmental liabilities as of September 30, 2019 and December 31, 2018 follows:
2019 2018Landfill final capping, closure and post-closure liabilities $ 1,339.6 $ 1,292.0Environmental remediation 515.6 540.2Total accrued landfill and environmental costs 1,855.2 1,832.2Less: current portion (153.2) (130.6)Long-term portion $ 1,702.0 $ 1,701.6
Table of ContentsREPUBLIC SERVICES, INC.
NOTES TO UNAUDITED CONSOLIDATED FINANCIAL STATEMENTS - (CONTINUED)
15
Final Capping, Closure and Post-Closure Costs
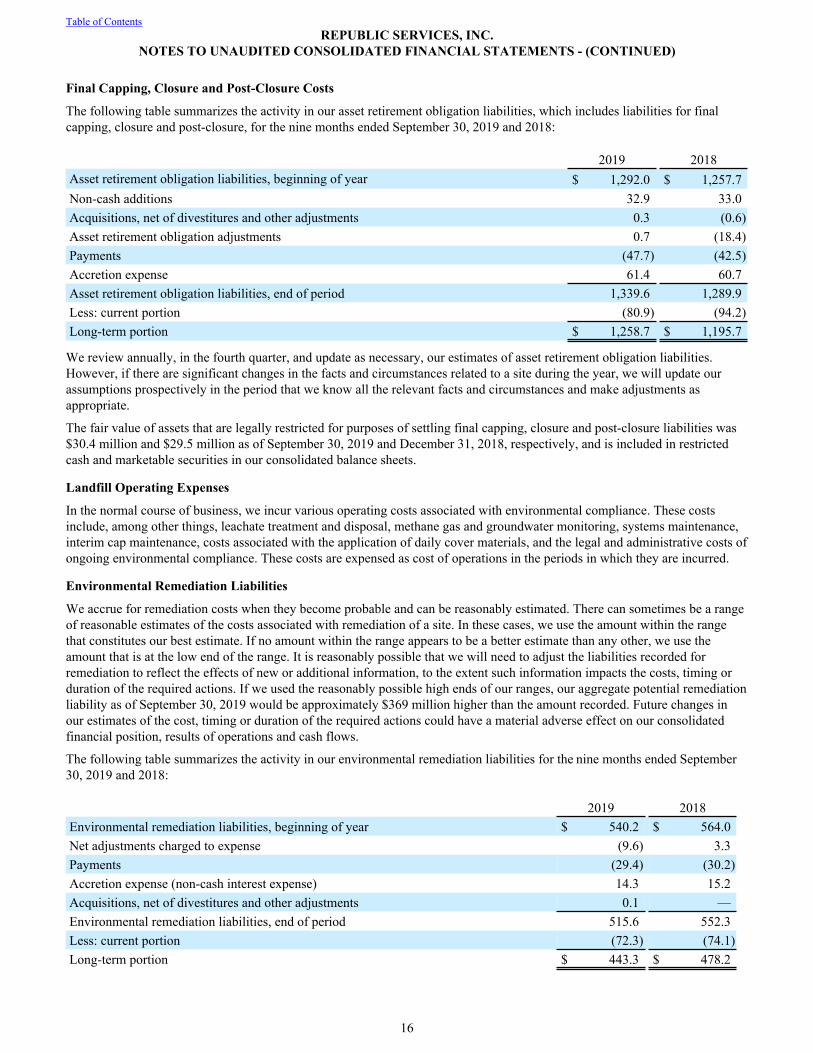
The following table summarizes the activity in our asset retirement obligation liabilities, which includes liabilities for final capping, closure and post-closure, for the nine months ended September 30, 2019 and 2018:
2019 2018Asset retirement obligation liabilities, beginning of year $ 1,292.0 $ 1,257.7Non-cash additions 32.9 33.0Acquisitions, net of divestitures and other adjustments 0.3 (0.6)Asset retirement obligation adjustments 0.7 (18.4)Payments (47.7) (42.5)Accretion expense 61.4 60.7Asset retirement obligation liabilities, end of period 1,339.6 1,289.9Less: current portion (80.9) (94.2)Long-term portion $ 1,258.7 $ 1,195.7
We review annually, in the fourth quarter, and update as necessary, our estimates of asset retirement obligation liabilities. However, if there are significant changes in the facts and circumstances related to a site during the year, we will update our assumptions prospectively in the period that we know all the relevant facts and circumstances and make adjustments as appropriate.
The fair value of assets that are legally restricted for purposes of settling final capping, closure and post-closure liabilities was $30.4 million and $29.5 million as of September 30, 2019 and December 31, 2018, respectively, and is included in restricted cash and marketable securities in our consolidated balance sheets.
Landfill Operating Expenses
In the normal course of business, we incur various operating costs associated with environmental compliance. These costs include, among other things, leachate treatment and disposal, methane gas and groundwater monitoring, systems maintenance, interim cap maintenance, costs associated with the application of daily cover materials, and the legal and administrative costs of ongoing environmental compliance. These costs are expensed as cost of operations in the periods in which they are incurred.
Environmental Remediation Liabilities
We accrue for remediation costs when they become probable and can be reasonably estimated. There can sometimes be a range of reasonable estimates of the costs associated with remediation of a site. In these cases, we use the amount within the range that constitutes our best estimate. If no amount within the range appears to be a better estimate than any other, we use the amount that is at the low end of the range. It is reasonably possible that we will need to adjust the liabilities recorded for remediation to reflect the effects of new or additional information, to the extent such information impacts the costs, timing or duration of the required actions. If we used the reasonably possible high ends of our ranges, our aggregate potential remediation liability as of September 30, 2019 would be approximately $369 million higher than the amount recorded. Future changes in our estimates of the cost, timing or duration of the required actions could have a material adverse effect on our consolidated financial position, results of operations and cash flows.
The following table summarizes the activity in our environmental remediation liabilities for the nine months ended September 30, 2019 and 2018:
2019 2018Environmental remediation liabilities, beginning of year $ 540.2 $ 564.0Net adjustments charged to expense (9.6) 3.3Payments (29.4) (30.2)Accretion expense (non-cash interest expense) 14.3 15.2Acquisitions, net of divestitures and other adjustments 0.1 —Environmental remediation liabilities, end of period 515.6 552.3Less: current portion (72.3) (74.1)Long-term portion $ 443.3 $ 478.2
Table of ContentsREPUBLIC SERVICES, INC.
NOTES TO UNAUDITED CONSOLIDATED FINANCIAL STATEMENTS - (CONTINUED)
16

Bridgeton Landfill. During the nine months ended September 30, 2019, we paid $12.0 million related to management and monitoring of the remediation area for our closed Bridgeton Landfill in Missouri. We continue to work with state and federal regulatory agencies on our remediation efforts. From time to time, this may require us to modify our future operating timeline and procedures, which could result in changes to our expected liability. As of September 30, 2019, the remediation liability recorded for this site was $149.1 million, of which approximately $2 million is expected to be paid during the remainder of 2019. We believe the remaining reasonably possible high end of our range would be approximately $171 million higher than the amount recorded as of September 30, 2019.
West Lake Landfill Superfund Site. Our subsidiary Bridgeton Landfill, LLC is one of several currently designated Potentially Responsible Parties for the West Lake Landfill Superfund site (West Lake) in Missouri. On September 27, 2018, the U.S. Environmental Protection Agency (EPA) issued a Record of Decision Amendment for West Lake that includes a total undiscounted cost estimate of $229 million over a four- to five-year design and construction timeline. On March 11, 2019, the EPA issued special notice letters under the Comprehensive Environmental Response, Compensation and Liability Act of 1980 (CERCLA) to Bridgeton Landfill, LLC and the other currently designated Potentially Responsible Parties to initiate negotiations to implement the remedy. At this time we are neither able to predict the final design of that remedy, nor estimate how much of the future response costs of the site our subsidiary may agree or be required to pay. During any subsequent administrative proceedings or litigation, our subsidiary will vigorously contest liability for the costs of remediating radiologically-impacted materials generated on behalf of the federal government during the Manhattan Project and delivered to the site by an Atomic Energy Commission licensee and its subcontractor. Currently, we believe we are adequately reserved for our expected remediation liability. However, subsequent events related to remedy design, divisibility, or allocation may require us to modify our expected remediation liability.
Table of ContentsREPUBLIC SERVICES, INC.
NOTES TO UNAUDITED CONSOLIDATED FINANCIAL STATEMENTS - (CONTINUED)
17

7. DEBT
The carrying value of our notes payable, finance leases and long-term debt as of September 30, 2019 and December 31, 2018 is listed in the following table, and is adjusted for the fair value of interest rate swaps, unamortized discounts, deferred issuance costs and the unamortized portion of adjustments to fair value recorded in purchase accounting. Original issue discounts and adjustments to fair value recorded in purchase accounting are amortized to interest expense over the term of the applicable instrument using the effective interest method.
September 30, 2019 December 31, 2018
Maturity Interest Rate Principal AdjustmentsCarrying
Value Principal AdjustmentsCarrying
ValueCredit facilities:
Uncommitted Credit Facility Variable $ 12.2 $ — $ 12.2 $ 33.4 $ — $ 33.4June 2023 Variable 170.0 — 170.0 159.0 — 159.0
Senior notes:
September 2019 5.500 — — — 650.0 (0.9) 649.1March 2020 5.000 850.0 (0.4) 849.6 850.0 (1.0) 849.0November 2021 5.250 600.0 (0.8) 599.2 600.0 (1.2) 598.8June 2022 3.550 850.0 (2.9) 847.1 850.0 (3.6) 846.4May 2023 4.750 550.0 4.9 554.9 550.0 (5.5) 544.5August 2024 2.500 900.0 (8.0) 892.0 — — —March 2025 3.200 500.0 (3.7) 496.3 500.0 (4.3) 495.7July 2026 2.900 500.0 (4.0) 496.0 500.0 (4.4) 495.6November 2027 3.375 650.0 (5.4) 644.6 650.0 (5.9) 644.1May 2028 3.950 800.0 (16.1) 783.9 800.0 (17.3) 782.7March 2035 6.086 181.9 (14.1) 167.8 181.9 (14.4) 167.5March 2040 6.200 399.9 (3.7) 396.2 399.9 (3.8) 396.1May 2041 5.700 385.7 (5.3) 380.4 385.7 (5.3) 380.4
Debentures:
May 2021 9.250 35.3 (0.5) 34.8 35.3 (0.7) 34.6September 2035 7.400 148.1 (33.2) 114.9 148.1 (33.8) 114.3
Tax-exempt:
2020 - 2049 1.300 - 1.875 1,072.4 (6.1) 1,066.3 1,042.4 (5.6) 1,036.8Finance leases:
2019 - 2049 3.070 - 12.203 112.4 — 112.4 109.5 — 109.5Total Debt $ 8,717.9 $ (99.3) 8,618.6 $ 8,445.2 $ (107.7) 8,337.5Less: current portion (912.8) (690.7)
Long-term portion $ 7,705.8 $ 7,646.8
Credit Facilities
In June 2018, we entered into a $2.25 billion unsecured revolving credit facility (the Credit Facility), which replaced our $1.0 billion and $1.25 billion unsecured credit facilities that would have matured in May 2021 and June 2019, respectively. The Credit Facility matures in June 2023. We may request two one-year extensions of the maturity date but none of the lenders are committed to participate in such extension. The Credit Facility also includes a feature that allows us to increase availability, at our option, by an aggregate amount of up to $1.0 billion through increased commitments from existing lenders or the addition of new lenders. At our option, borrowings under the Credit Facility bear interest at a Base Rate, or a Eurodollar Rate, plus an applicable margin based on our Debt Ratings (all as defined in the Credit Facility agreement).
The Credit Facility is subject to facility fees based on applicable rates defined in the Credit Facility agreement and the aggregate commitment, regardless of usage. Availability under our Credit Facility totaled $1,710.6 million and $1,694.1 million
Table of ContentsREPUBLIC SERVICES, INC.
NOTES TO UNAUDITED CONSOLIDATED FINANCIAL STATEMENTS - (CONTINUED)
18

as of September 30, 2019 and December 31, 2018, respectively. The Credit Facility can be used for working capital, capital expenditures, acquisitions, letters of credit and other general corporate purposes. The Credit Facility agreement requires us to comply with financial and other covenants. We may pay dividends and repurchase common stock if we are in compliance with these covenants.
As of September 30, 2019 and December 31, 2018, we had $170.0 million and $159.0 million of borrowings under our Credit Facility, respectively. We had $352.0 million and $379.6 million of letters of credit outstanding under our Credit Facility as of September 30, 2019 and December 31, 2018, respectively.
We also have an Uncommitted Credit Facility, which bears interest at LIBOR, plus an applicable margin and is subject to facility fees defined in the agreement, regardless of usage. We can use borrowings under the Uncommitted Credit Facility for working capital and other general corporate purposes. The agreement governing our Uncommitted Credit Facility requires us to comply with certain covenants. The Uncommitted Credit Facility may be terminated by either party at any time. We had $12.2 million of borrowings and $33.4 million of borrowings outstanding under our Uncommitted Credit Facility as of September 30, 2019 and December 31, 2018, respectively.
Senior Notes and Debentures
In August 2019, we issued $900.0 million of 2.500% senior notes due 2024 (the 2.500% Notes). We used the net proceeds from the 2.500% Notes to repay $650.0 million of 5.500% senior notes that matured in September 2019. Any remaining proceeds were used to repay amounts outstanding under our unsecured credit facilities as well as for general corporate purposes. Contemporaneously with this offering, we amended interest rate lock agreements with a notional value of $375.0 million and dedesignated the hedging relationship. There was no ineffectiveness recognized in the termination of these cash flow hedges. In addition, we entered into an offsetting interest rate swap to manage exposure to fluctuations in interest rates associated with the amended agreements. For further detail regarding the effect of our derivative contracts on interest expense, refer to Note 12, Financial Instruments, to our unaudited consolidated financial statements in Item 1 of Part I of this Quarterly Report on Form 10-Q.
In 2018, we issued $800.0 million of 3.950% senior notes due 2028 (the 3.950% Notes). We used the net proceeds from the 3.950% Notes to repay $700.0 million of 3.800% senior notes that matured in May 2018, and any remaining proceeds were used for general corporate purposes. In connection with this offering, we terminated interest rate lock agreements with a notional value of $600.0 million, resulting in net proceeds of $31.1 million. There was no ineffectiveness recognized in the termination of these cash flow hedges.
Our senior notes and debentures are general unsecured obligations. Interest is payable semi-annually.
Tax-Exempt Financings
During the second quarter of 2019, we refinanced $35.0 million of tax-exempt financings and issued $30.0 million of new tax-exempt financings. As of September 30, 2019, we had $1,066.3 million of certain variable rate tax-exempt financings outstanding with maturities ranging from 2020 to 2049. As of December 31, 2018, we had $1,036.8 million of certain variable rate tax-exempt financings outstanding with maturities ranging from 2019 to 2044. Approximately 100% of our tax-exempt financings are remarketed quarterly by remarketing agents to effectively maintain a variable yield. The holders of the bonds can put them back to the remarketing agents at the end of each interest period. To date, the remarketing agents have been able to remarket all of our variable rate unsecured tax-exempt bonds.
Finance Leases
We had finance lease liabilities of $112.4 million and $109.5 million as of September 30, 2019 and December 31, 2018, respectively, with maturities ranging from 2019 to 2049 and 2019 to 2046, respectively.
Interest Rate Swap and Lock Agreements
Our ability to obtain financing through the capital markets is a key component of our financial strategy. Historically, we have managed risk associated with executing this strategy, particularly as it relates to fluctuations in interest rates, by using a combination of fixed and floating rate debt. From time to time, we also have entered into interest rate swap and lock agreements to manage risk associated with interest rates, either to effectively convert specific fixed rate debt to a floating rate (fair value hedges), or to lock interest rates in anticipation of future debt issuances (cash flow hedges).
Table of ContentsREPUBLIC SERVICES, INC.
NOTES TO UNAUDITED CONSOLIDATED FINANCIAL STATEMENTS - (CONTINUED)
19
Fair Value Hedges
During the second half of 2013, we entered into various interest rate swap agreements relative to our 4.750% fixed rate senior notes due in May 2023. The goal was to reduce overall borrowing costs and rebalance our debt portfolio's ratio of fixed to floating interest rates. As of September 30, 2019 and December 31, 2018, these swap agreements had a total notional value of $300.0 million and mature in May 2023, which is identical to the maturity of the hedged senior notes. We pay interest at floating rates based on changes in LIBOR and receive interest at a fixed rate of 4.750%. These transactions were designated as fair value hedges because the swaps hedge against the changes in fair value of the fixed rate senior notes resulting from changes in interest rates.
As of September 30, 2019 and December 31, 2018, the interest rate swap agreements are reflected at their fair value of $13.1 million and $2.5 million, respectively, and are included in other assets in our consolidated balance sheet. To the extent they are effective, these interest rate swap agreements are included as an adjustment to long-term debt in our consolidated balance sheets.
For the three months ended September 30, 2019 and 2018, we recognized a loss of $1.1 million and a gain of $1.9 million, respectively, on the change in fair value of the hedged senior notes attributable to changes in the benchmark interest rate, with an offsetting gain of $1.4 million and an offsetting loss of $2.0 million, respectively, on the related interest rate swaps. For the nine months ended September 30, 2019 and 2018, we recognized a loss of $10.0 million and a gain of $11.1 million, respectively, on the change in fair value of the hedged senior notes attributable to changes in the benchmark interest rate, with an offsetting gain of $10.5 million and an offsetting loss of $11.5 million, respectively, on the related interest rate swaps. The difference of these fair value changes for the nine months ended September 30, 2018 was recorded directly in earnings as other income, net. In accordance with our adoption of ASU 2017-12, the difference of these fair value changes for the nine months ended September 30, 2019 was recorded directly in earnings as an adjustment to interest expense in our consolidated statement of income.
For further detail regarding the effect of our fair value hedging on interest expense, refer to Note 12, Financial Instruments, to our unaudited consolidated financial statements in Item 1 of Part I of this Quarterly Report on Form 10-Q.
Cash Flow Hedges
As of September 30, 2019 and December 31, 2018, our interest rate lock agreements had an aggregate notional value of $575.0 million and $725.0 million, respectively, with fixed interest rates ranging from 1.330% to 3.000% and 1.900% to 3.250%, respectively. We entered into these transactions to manage exposure to fluctuations in interest rates in anticipation of planned future issuances of senior notes in 2019 through 2021. Upon the expected issuance of senior notes, we will terminate the interest rate locks and settle with our counterparties. These transactions were accounted for as cash flow hedges.
The fair value of our interest rate locks was determined using standard valuation models with assumptions about interest rates being based on those observed in underlying markets (Level 2 in the fair value hierarchy). The aggregate fair values of the outstanding interest rate locks as of September 30, 2019 were assets of $1.3 million, which were recorded in prepaid expenses and other current assets in our consolidated balance sheet and liabilities of $30.7 million, which were recorded in other accrued liabilities and other long-term liabilities in our consolidated balance sheet. As of December 31, 2018, the aggregate fair values of the outstanding interest rate locks were assets of $10.3 million and were recorded in other assets in our consolidated balance sheet.
Total unrealized (loss) gain recognized in other comprehensive income for interest rate locks was $(11.9) million and $4.2 million for the three months ended September 30, 2019 and 2018, respectively. Total unrealized (loss) gain recognized in other comprehensive income for interest rate locks was $(43.0) million and $33.1 million for the nine months ended September 30, 2019 and 2018, respectively.
As of September 30, 2019 and December 31, 2018, our previously terminated interest rate locks were recorded as components of accumulated other comprehensive income (loss), net of tax of $(3.5) million and $11.2 million, respectively. The amortization of the terminated interest rate locks is recorded as an adjustment to interest expense over the life of the issued debt using the effective interest method. We expect to amortize approximately $1.9 million of net interest expense, net of tax, over the next 12 months as a yield adjustment of our senior notes.
For detail regarding the effect of our cash flow hedging on interest expense, refer to Note 12, Financial Instruments, to our unaudited consolidated financial statements in Item 1 of Part I of this Quarterly Report on Form 10-Q.
8. LEASES
We lease property and equipment in the ordinary course of business under various lease agreements. The most significant lease obligations are for real property and equipment specific to our industry, including property operated as a landfill or transfer
Table of ContentsREPUBLIC SERVICES, INC.
NOTES TO UNAUDITED CONSOLIDATED FINANCIAL STATEMENTS - (CONTINUED)
20
station and operating equipment. Our leases have varying terms. Some may include renewal or purchase options, escalation clauses, restrictions, penalties or other obligations that we consider in determining minimum lease payments. Our lease terms include options to renew the lease when it is reasonably certain that we will exercise the option.
Certain leases require payments that are variable in nature based on volume measurements, e.g. a fixed rate per ton at our landfills. In addition, certain rental payments are adjusted annually based on changes in an underlying base index such as a consumer price index. Variable lease payments are recognized in our consolidated statement of income in the period incurred. Our lease agreements do not contain any material residual value guarantees or material restrictive covenants. We generally account for lease components separately from non-lease components.
Leases are classified as either operating leases or finance leases, as appropriate. Leases with an initial term of 12 months or less are not recorded on our consolidated balance sheet.
Operating Leases
Many of our leases are operating leases. Operating lease classification generally can be attributed to either (1) relatively low fixed minimum lease payments (including, for example, real property lease payments that are not fixed and vary based on the volume of waste we receive or process), or (2) minimum lease terms that are shorter than the asset's economic useful life. We expect that, in the ordinary course of business, our operating leases will be renewed, replaced by other leases, or replaced with capital expenditures. We recognize rent expense for these leases on a straight-line basis over the lease term.
We recognize a right-of-use liability and right-of-use asset for leases classified as operating leases in our consolidated balance sheet upon lease commencement. The right-of-use liability represents the present value of the remaining lease payments. An implicit rate is often not readily available for these leases. As such, we use our incremental borrowing rate at the commencement date to determine the present value of the lease payments. Our incremental borrowing rate represents the rate of interest that we would have to pay to borrow on a collateralized basis over a similar term in a similar economic environment. In addition, we recognize a corresponding right-of-use asset, which represents our right to use an underlying asset for the lease term. The right-of-use asset is adjusted for certain favorable or unfavorable leases recognized through acquisition, prepaid or accrued rent, asset impairments and lease incentives, including but not limited to cash incentives, rent abatement or leasehold improvements paid by the lessor.
Finance Leases
We capitalize assets acquired under finance leases at lease commencement and amortize them to depreciation expense over the lesser of the useful life of the asset or the lease term on either a straight-line or a units-of-consumption basis, depending on the asset leased. We record the present value of the related lease payments as a debt obligation. Our finance lease liability relates primarily to certain long-term landfill operating agreements that require minimum lease payments with offsetting finance lease assets recorded as part of the landfill development costs.
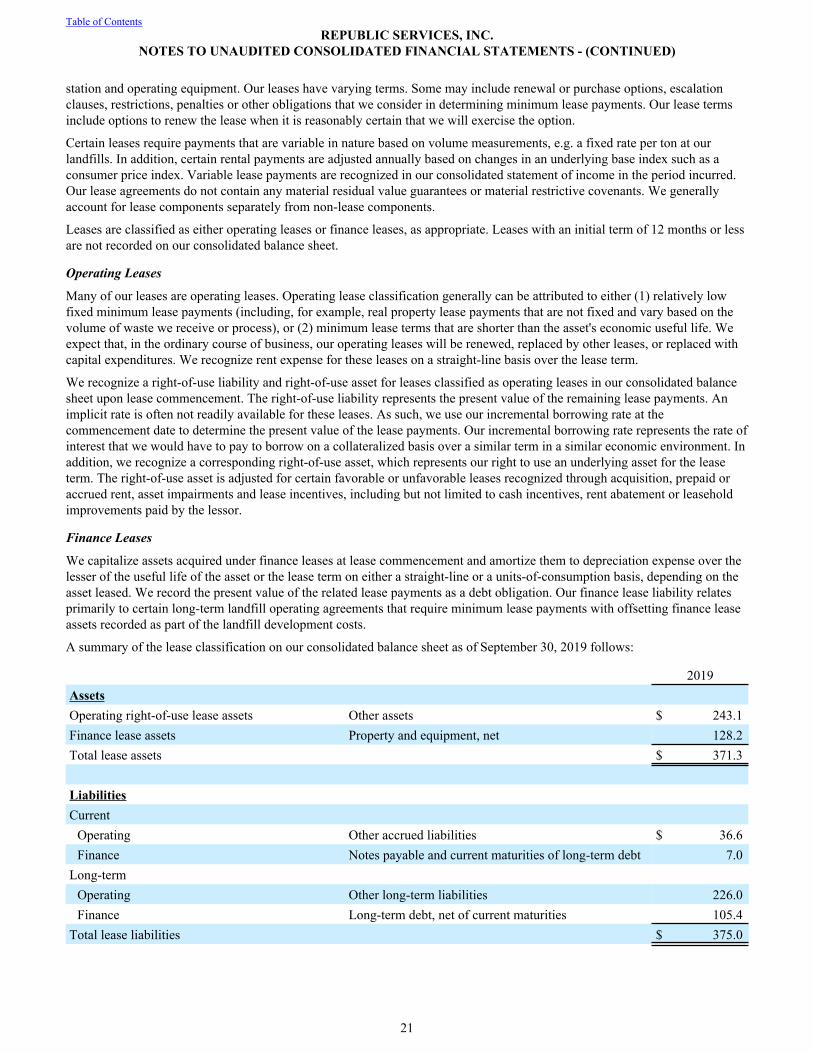
A summary of the lease classification on our consolidated balance sheet as of September 30, 2019 follows:
2019AssetsOperating right-of-use lease assets Other assets $ 243.1Finance lease assets Property and equipment, net 128.2Total lease assets $ 371.3
LiabilitiesCurrent
Operating Other accrued liabilities $ 36.6Finance Notes payable and current maturities of long-term debt 7.0
Long-termOperating Other long-term liabilities 226.0Finance Long-term debt, net of current maturities 105.4
Total lease liabilities $ 375.0
Table of ContentsREPUBLIC SERVICES, INC.
NOTES TO UNAUDITED CONSOLIDATED FINANCIAL STATEMENTS - (CONTINUED)
21

A summary of the lease cost reflected in our consolidated statement of income for the three and nine months ended September 30, 2019 follows:
Three Months Ended September
30, 2019
Nine Months Ended
September 30, 2019
Operating lease costFixed lease cost Cost of operations $ 10.7 $ 31.0Short-term lease cost Cost of operations 9.4 28.4Variable lease cost Cost of operations 4.6 13.3
Finance lease costAmortization of leased assets Depreciation amortization, and depletion 1.4 4.1Interest on lease liabilities Interest expense 1.9 5.6Variable lease cost Interest expense 1.6 4.3
Total lease cost $ 29.6 $ 86.7
As of September 30, 2019, aggregate principal payments for operating and finance leases follows:
Operating Leases Finance Leases Total
2019 (remaining) $ 12.7 $ 3.7 $ 16.42020 42.8 15.6 58.42021 39.5 14.0 53.52022 33.3 13.4 46.72023 31.7 39.2 70.9Thereafter 157.0 129.0 286.0Total lease payments 317.0 214.9 531.9Less: interest (54.4) (102.5) (156.9)Present value of lease liabilities $ 262.6 $ 112.4 $ 375.0
A summary of the weighted-average remaining lease term and weighted-average discount rate as of September 30, 2019 follows:
September 30, 2019Weighted-average remaining lease term (years)
Operating leases 9.0Finance leases 14.7
Weighted-average discount rateOperating leases 3.9 %Finance leases 7.0 %
Table of ContentsREPUBLIC SERVICES, INC.
NOTES TO UNAUDITED CONSOLIDATED FINANCIAL STATEMENTS - (CONTINUED)
22

Supplemental cash flow and other non-cash information for the three and nine months ended September 30, 2019 follows:
Three Months Ended September
30, 2019
Nine Months Ended September
30, 2019
Cash paid for amounts included in the measurement of lease liabilitiesOperating cash flows from operating leases $ 25.0 $ 73.3Operating cash flows from finance leases $ 3.5 $ 9.9Financing cash flows from finance leases $ 1.6 $ 4.4
Leased assets obtained in exchange for new finance lease liabilities $ 6.3 $ 7.1Leased assets obtained in exchange for new operating lease liabilities $ 26.6 $ 36.0
9. INCOME TAXES
Our effective tax rate, exclusive of non-controlling interests, for the three and nine months ended September 30, 2019 was 19.3% and 22.5%, respectively. Our effective tax rate, exclusive of non-controlling interests, for the three and nine months ended September 30, 2018 was 22.7% and 23.6%, respectively. Our effective tax rate, for the three and nine months ended September 30, 2019, was favorably affected by settlements of various state matters and the realization of additional federal and state benefits as well as adjustments to deferred taxes due to the completion of our 2018 tax returns.
Cash paid for income taxes was a net refund of $4.3 million and a net payment of $43.5 million for the nine months ended September 30, 2019 and 2018, respectively. Cash taxes have been favorably impacted from the receipt of funds from amended returns filed during 2018.
We have deferred tax assets related to state net operating loss carryforwards. We provide a partial valuation allowance due to uncertainty surrounding the future utilization of these carryforwards in the taxing jurisdictions where the loss carryforwards exist. When determining the need for a valuation allowance, we consider all positive and negative evidence, including recent financial results, scheduled reversals of deferred tax liabilities, projected future taxable income and tax planning strategies.
As a result of changes in U.S. tax law and our ongoing efforts to evaluate, streamline and maximize the efficiency of our tax footprint, we could adjust our valuation allowance in a future period if there is sufficient evidence to support a conclusion that it is more certain than not that a portion of the state net operating loss carryforwards, on which we currently provide a valuation allowance, would be realized. Future changes in our valuation allowance could have a material effect on our results of operations in the period recorded.
The realization of our deferred tax asset for state loss carryforwards ultimately depends upon the existence of sufficient taxable income in the appropriate state taxing jurisdictions in future periods. The weight given to the positive and negative evidence is commensurate with the extent such evidence can be objectively verified. We continue to regularly monitor both positive and negative evidence in determining the ongoing need for a valuation allowance. As of September 30, 2019, the valuation allowance associated with our state loss carryforwards was approximately $68 million.
We are subject to income tax in the United States and Puerto Rico, as well as in multiple state jurisdictions. Our compliance with income tax rules and regulations is periodically audited by taxing authorities. These authorities may challenge the positions taken in our tax filings. We are currently under examination or administrative review by the Internal Revenue Service, state and local taxing authorities and Puerto Rico for various tax years.
We believe that our recorded liabilities for uncertain tax positions are adequate. However, a significant assessment against us in excess of the liabilities recorded could have a material adverse effect on our consolidated financial position, results of operations and cash flows. As of September 30, 2019, we are unable to estimate the resolution of our gross unrecognized benefits over the next 12 months.
We recognize interest and penalties as incurred within the provision for income taxes in the consolidated statement of income. As of September 30, 2019, we accrued a liability for penalties of $0.3 million and a liability for interest (including interest on penalties) of $11.0 million related to our uncertain tax positions.
10. STOCK REPURCHASES, DIVIDENDS AND EARNINGS PER SHARE
Available Shares
We currently have approximately 12.8 million shares of common stock reserved for future grants under the Republic Services, Inc. Amended and Restated 2007 Stock Incentive Plan.
Table of ContentsREPUBLIC SERVICES, INC.
NOTES TO UNAUDITED CONSOLIDATED FINANCIAL STATEMENTS - (CONTINUED)
23

Stock Repurchases
Stock repurchase activity during the three and nine months ended September 30, 2019 and 2018 follows (in millions, except per share amounts):
Three Months Ended September 30,
Nine Months Ended September 30,
2019 2018 2019 2018Number of shares repurchased 1.7 1.4 4.3 8.5Amount paid $ 151.3 $ 100.9 $ 353.8 $ 574.9Weighted average cost per share $ 86.87 $ 71.83 $ 81.63 $ 67.84
As of September 30, 2019, there were less than 0.1 million repurchased shares pending settlement, resulting in an associated $0.1 million of share repurchases unpaid and included within other accrued liabilities. As of September 30, 2018, there were no repurchased shares pending settlement.
In October 2017, our Board of Directors added $2.0 billion to the existing share repurchase authorization that now extends through December 31, 2020. Share repurchases under the program may be made through open market purchases or privately negotiated transactions in accordance with applicable federal securities laws. While the Board of Directors has approved the program, the timing of any purchases, the prices and the number of shares of common stock to be purchased will be determined by our management, at its discretion, and will depend upon market conditions and other factors. The share repurchase program may be extended, suspended or discontinued at any time. As of September 30, 2019, the remaining authorized purchase capacity under our October 2017 repurchase program was $750.3 million.
Dividends
In July 2019, our Board of Directors approved a quarterly dividend of $0.405 per share. Cash dividends declared were $370.2 million for the nine months ended September 30, 2019. As of September 30, 2019, we recorded a quarterly dividend payable of $129.3 million to shareholders of record at the close of business on October 1, 2019.
Earnings per Share
Basic earnings per share is computed by dividing net income attributable to Republic Services, Inc. by the weighted average number of common shares (including vested but unissued RSUs and PSUs) outstanding during the period. Diluted earnings per share is based on the combined weighted average number of common shares and common share equivalents outstanding, which include, where appropriate, the assumed exercise of employee stock options, unvested RSUs and unvested PSUs at the expected attainment levels. We use the treasury stock method in computing diluted earnings per share.
Earnings per share for the three and nine months ended September 30, 2019 and 2018 are calculated as follows (in thousands, except per share amounts):
Three Months Ended September 30,
Nine Months Ended September 30,
2019 2018 2019 2018Basic earnings per share:
Net income attributable to Republic Services, Inc. $ 298,300 $ 263,400 $ 784,000 $ 736,000Weighted average common shares outstanding 320,633 325,483 321,544 327,830
Basic earnings per share $ 0.93 $ 0.81 $ 2.44 $ 2.25Diluted earnings per share:
Net income attributable to Republic Services, Inc. $ 298,300 $ 263,400 $ 784,000 $ 736,000Weighted average common shares outstanding 320,633 325,483 321,544 327,830Effect of dilutive securities:
Options to purchase common stock 368 673 437 799Unvested RSU awards 276 263 248 241Unvested PSU awards 433 525 415 456Weighted average common and common equivalent shares outstanding 321,710 326,944 322,644 329,326
Diluted earnings per share $ 0.93 $ 0.81 $ 2.43 $ 2.23
Table of ContentsREPUBLIC SERVICES, INC.
NOTES TO UNAUDITED CONSOLIDATED FINANCIAL STATEMENTS - (CONTINUED)
24

There were no antidilutive securities outstanding during the three and nine months ended September 30, 2019 and 2018.
11. CHANGES IN ACCUMULATED OTHER COMPREHENSIVE INCOME BY COMPONENT
A summary of changes in accumulated other comprehensive income (AOCI), net of tax, by component, for the nine months ended September 30, 2019 follows:
Cash Flow Hedges
Defined Benefit Pension Items Total
Balance as of December 31, 2018 $ 16.1 $ 14.7 $ 30.8Other comprehensive loss before reclassifications (43.0) (0.8) (43.8)Amounts reclassified from accumulated other comprehensive income (0.9) — (0.9)Net current period other comprehensive loss (43.9) (0.8) (44.7)Adoption of accounting standard 5.4 — 5.4Balance as of September 30, 2019 $ (22.4) $ 13.9 $ (8.5)
A summary of reclassifications out of accumulated other comprehensive income for the three and nine months ended September 30, 2019 and 2018 follows:
Three Months Ended September 30, Nine Months Ended September 30,2019 2018 2019 2018
Details about Accumulated Other Comprehensive Income Components
Amount Reclassified from Accumulated Other Comprehensive
Income
Amount Reclassified from Accumulated Other
Comprehensive Income
Affected Line Item in the Statement
where Net Income is Presented
Gain (loss) on cash flow hedges:Recyclable commodity hedges $ — $ 0.4 $ — $ 0.7 RevenueFuel hedges — 1.2 — 3.1 Cost of operationsTerminated interest rate locks 0.7 — 1.2 (0.8) Interest expense
Total before tax 0.7 1.6 1.2 3.0Tax expense (0.2) (0.4) (0.3) (0.8)Total gain reclassified into earnings, net of tax $ 0.5 $ 1.2 $ 0.9 $ 2.2
Table of ContentsREPUBLIC SERVICES, INC.
NOTES TO UNAUDITED CONSOLIDATED FINANCIAL STATEMENTS - (CONTINUED)
25

12. FINANCIAL INSTRUMENTS
The effect of our derivative instruments in fair value and cash flow hedging relationships on the consolidated statement of income for the three and nine months ended September 30, 2019 and 2018 follows (in millions):
Classification and Amount of Gain (Loss) Recognized in Income on Fair Value and Cash Flow Hedging Relationships
Three Months Ended September 30, Nine Months Ended September 30,2019 2018 2019 2018
Interest Expense Interest Expense Interest Expense Interest Expense
Total amounts of expense line items presented in the consolidated statement of income in which the effects of fair value or cash flow hedges are recorded $ (98.0) $ (96.0) $ (296.9) $ (287.3)
The effects of fair value and cash flow hedging:Gain (loss) on fair value hedging relationships:
Interest rate swaps:Net swap settlements $ 0.3 $ 0.3 $ 0.5 $ 1.7
Net periodic earnings(1) $ 0.3 $ (0.2) $ 0.5 $ (0.4)Gain (loss) on cash flow hedging relationships:
Interest rate swap locks:Amount of gain (loss) reclassified from AOCI into income, net of tax $ 0.5 $ — $ 0.9 $ (0.6)
(1) During 2018 (prior to adoption of ASU 2017-12), all net periodic earnings for fair value hedges were recorded to other income, net. To align the effect of the hedging relationship with the activity of the hedged item, beginning January 1, 2019, all net periodic earnings on fair value hedges are presented within interest expense in our consolidated statement of income.
Fair Value Measurements
In measuring fair values of assets and liabilities, we use valuation techniques that maximize the use of observable inputs (Level 1) and minimize the use of unobservable inputs (Level 3). We also use market data or assumptions that we believe market participants would use in pricing an asset or liability, including assumptions about risk when appropriate.
The carrying value for certain of our financial instruments, including cash, accounts receivable, accounts payable and certain other accrued liabilities, approximates fair value because of their short-term nature.
Table of ContentsREPUBLIC SERVICES, INC.
NOTES TO UNAUDITED CONSOLIDATED FINANCIAL STATEMENTS - (CONTINUED)
26

As of September 30, 2019 and December 31, 2018, our assets and liabilities that are measured at fair value on a recurring basis include the following:
September 30, 2019 Fair Value
Carrying Amount Total
QuotedPrices inActive
Markets(Level 1)
SignificantOther
ObservableInputs
(Level 2)
SignificantUnobservable
Inputs(Level 3)
Assets:Money market mutual funds $ 42.9 $ 42.9 $ 42.9 $ — $ —Bonds - restricted cash and marketable securities and other assets 50.7 50.7 — 50.7 —Interest rate swaps - other assets 13.1 13.1 — 13.1 —Other derivative assets - other assets 4.9 4.9 — 4.9 —Interest rate locks - prepaid expenses and other current assets 1.3 1.3 — 1.3 —
Total assets $ 112.9 $ 112.9 $ 42.9 $ 70.0 $ —Liabilities:
Other derivative liabilities - other long-term liabilities $ 24.2 $ 24.2 $ — $ 24.2 $ —Interest rate locks - other accrued liabilities and other long-term liabilities 30.7 30.7 — 30.7 —Contingent consideration - other accrued liabilities and other long-term liabilities 72.5 72.5 — — 72.5
Total liabilities $ 127.4 $ 127.4 $ — $ 54.9 $ 72.5
December 31, 2018 Fair Value
Carrying Amount Total
QuotedPrices inActive
Markets(Level 1)
SignificantOther
ObservableInputs
(Level 2)
SignificantUnobservable
Inputs(Level 3)
Assets:Money market mutual funds $ 37.1 $ 37.1 $ 37.1 $ — $ —Bonds - restricted cash and marketable securities and other assets 47.8 47.8 — 47.8 —Interest rate swaps - other assets 2.5 2.5 — 2.5 —Interest rate locks - other assets 10.3 10.3 — 10.3 —
Total assets $ 97.7 $ 97.7 $ 37.1 $ 60.6 $ —Liabilities:
Contingent consideration - other long-term liabilities $ 71.4 $ 71.4 $ — $ — $ 71.4
Total liabilities $ 71.4 $ 71.4 $ — $ — $ 71.4
Total Debt
As of September 30, 2019 and December 31, 2018, the carrying value of our total debt was $8.6 billion and $8.3 billion, respectively and the fair value of our total debt was $9.4 billion and $8.7 billion, respectively. The estimated fair value of our fixed rate senior notes and debentures is based on quoted market prices. The fair value of our remaining notes payable, tax-exempt financings and borrowings under our credit facilities approximates the carrying value because the interest rates are variable. The fair value estimates are based on Level 2 inputs of the fair value hierarchy as of September 30, 2019 and December 31, 2018. See Note 7, Debt, for further information related to our debt.
Table of ContentsREPUBLIC SERVICES, INC.
NOTES TO UNAUDITED CONSOLIDATED FINANCIAL STATEMENTS - (CONTINUED)
27

Derivative Contracts
Contemporaneously with the issuance of our 2.500% Notes in August 2019, we amended interest rate lock agreements with a notional value of $375.0 million, extending the mandatory maturity date from 2019 to 2024 and dedesignated them as cash flow hedges (the Extended Interest Rate Swaps). In addition, we entered into an offsetting interest rate swap to offset future exposures to fair value fluctuations of the Extended Interest Rate Swaps (the Offsetting Interest Rate Swaps). The fair value of these free standing derivatives was determined using standard valuation models with assumptions about interest rates being based on those observed in underlying markets (Level 2 in the fair value hierarchy).
As of September 30, 2019, the fair value of the Extended Interest Rate Swaps was a liability of $24.2 million which was included in other long-term liabilities in our consolidated balance sheet, and the fair value of the Offsetting Interest Rate Swaps was an asset of $4.9 million and was included in other assets in our consolidated balance sheet. For the three and nine months ended September 30, 2019, we recognized a loss of $5.4 million on the change in fair value of the Extended Interest Rate Swaps, with an offsetting gain of $4.9 million on the Offsetting Interest Rate Swaps. The change in fair value was recorded directly in earnings as an adjustment to interest expense in our consolidated statement of income.
Contingent Consideration
In April 2015, we entered into a waste management contract with the County of Sonoma, California to operate the county's waste management facilities. As of September 30, 2019, the Sonoma contingent consideration represents the fair value of $65.9 million payable to the County of Sonoma based on the achievement of future annual tonnage targets through the expected remaining capacity of the landfill, which we estimate to be approximately 30 years. The potential undiscounted amount of all future contingent payments that we could be required to make under the waste management contract is estimated to be between approximately $79 million and $168 million. During the nine months ended September 30, 2019, the activity in the contingent consideration liability included accretion, which was offset by concession payments made in the ordinary course of business. There were no changes to the estimate of fair value. The contingent consideration liability is classified within Level 3 of the fair value hierarchy.
In 2017, we recognized additional contingent consideration associated with the acquisition of a landfill. As of September 30, 2019, the contingent consideration of $4.1 million represents the fair value of amounts payable to the seller based on annual volume of tons disposed at the landfill. During the nine months ended September 30, 2019, the activity in the contingent consideration liability included accretion, which was offset by concession payments made in the ordinary course of business. There were no changes to the estimate of fair value. The contingent consideration liabilities are classified within Level 3 of the fair value hierarchy.
In June 2019, we recognized additional contingent consideration associated with the acquisition of a collection business. As of September 30, 2019, the contingent consideration of $2.5 million represents the fair value of amounts payable to the seller based on annual volume of tons collected from certain customers of the business. The fair value of the contingent consideration was determined using probability assessments of the expected future payments over the estimated customer relationships, and applying a discount rate. The future payments are based on significant inputs that are not observable in the market. Key assumptions include annual collection volumes, which are subject to remeasurement at each reporting date. The contingent consideration liabilities are classified within Level 3 of the fair value hierarchy.
13. SEGMENT REPORTING
Our senior management evaluates, oversees and manages the financial performance of our operations through two field groups, referred to as Group 1 and Group 2. Group 1 primarily consists of geographic areas located in the western United States, and Group 2 primarily consists of geographic areas located in the southeastern and mid-western United States, and the eastern seaboard of the United States. These two groups are presented below as our reportable segments, which provide integrated waste management services consisting of non-hazardous solid waste collection, transfer, recycling, disposal and environmental services.
Table of ContentsREPUBLIC SERVICES, INC.
NOTES TO UNAUDITED CONSOLIDATED FINANCIAL STATEMENTS - (CONTINUED)
28
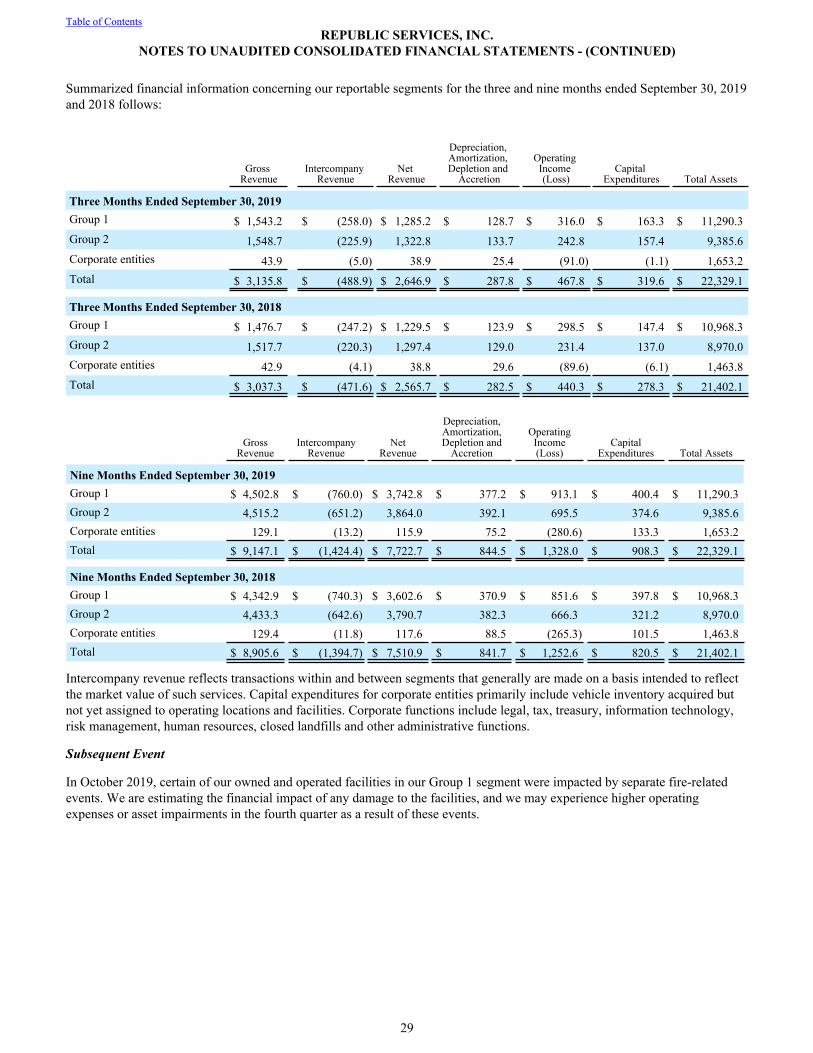
Summarized financial information concerning our reportable segments for the three and nine months ended September 30, 2019 and 2018 follows:
Gross Revenue
Intercompany Revenue
Net Revenue
Depreciation, Amortization, Depletion and
Accretion
Operating Income (Loss)
Capital Expenditures Total Assets
Three Months Ended September 30, 2019Group 1 $ 1,543.2 $ (258.0) $ 1,285.2 $ 128.7 $ 316.0 $ 163.3 $ 11,290.3Group 2 1,548.7 (225.9) 1,322.8 133.7 242.8 157.4 9,385.6Corporate entities 43.9 (5.0) 38.9 25.4 (91.0) (1.1) 1,653.2Total $ 3,135.8 $ (488.9) $ 2,646.9 $ 287.8 $ 467.8 $ 319.6 $ 22,329.1
Three Months Ended September 30, 2018Group 1 $ 1,476.7 $ (247.2) $ 1,229.5 $ 123.9 $ 298.5 $ 147.4 $ 10,968.3Group 2 1,517.7 (220.3) 1,297.4 129.0 231.4 137.0 8,970.0Corporate entities 42.9 (4.1) 38.8 29.6 (89.6) (6.1) 1,463.8Total $ 3,037.3 $ (471.6) $ 2,565.7 $ 282.5 $ 440.3 $ 278.3 $ 21,402.1
GrossRevenue
IntercompanyRevenue
NetRevenue
Depreciation,Amortization,Depletion and
Accretion
OperatingIncome(Loss)
CapitalExpenditures Total Assets
Nine Months Ended September 30, 2019Group 1 $ 4,502.8 $ (760.0) $ 3,742.8 $ 377.2 $ 913.1 $ 400.4 $ 11,290.3Group 2 4,515.2 (651.2) 3,864.0 392.1 695.5 374.6 9,385.6Corporate entities 129.1 (13.2) 115.9 75.2 (280.6) 133.3 1,653.2Total $ 9,147.1 $ (1,424.4) $ 7,722.7 $ 844.5 $ 1,328.0 $ 908.3 $ 22,329.1
Nine Months Ended September 30, 2018Group 1 $ 4,342.9 $ (740.3) $ 3,602.6 $ 370.9 $ 851.6 $ 397.8 $ 10,968.3Group 2 4,433.3 (642.6) 3,790.7 382.3 666.3 321.2 8,970.0Corporate entities 129.4 (11.8) 117.6 88.5 (265.3) 101.5 1,463.8Total $ 8,905.6 $ (1,394.7) $ 7,510.9 $ 841.7 $ 1,252.6 $ 820.5 $ 21,402.1
Intercompany revenue reflects transactions within and between segments that generally are made on a basis intended to reflect the market value of such services. Capital expenditures for corporate entities primarily include vehicle inventory acquired but not yet assigned to operating locations and facilities. Corporate functions include legal, tax, treasury, information technology, risk management, human resources, closed landfills and other administrative functions.
Subsequent Event
In October 2019, certain of our owned and operated facilities in our Group 1 segment were impacted by separate fire-related events. We are estimating the financial impact of any damage to the facilities, and we may experience higher operating expenses or asset impairments in the fourth quarter as a result of these events.
Table of ContentsREPUBLIC SERVICES, INC.
NOTES TO UNAUDITED CONSOLIDATED FINANCIAL STATEMENTS - (CONTINUED)
29

14. REVENUE
Our operations primarily consist of providing collection, transfer and disposal of non-hazardous solid waste, recovering and recycling of certain materials, and environmental services. The following table disaggregates our revenue by service line for the three and nine months ended September 30, 2019 and 2018 (in millions of dollars and as a percentage of revenue):
Three Months Ended September 30, Nine Months Ended September 30,
2019 2018 2019 2018Collection:
Residential $ 574.4 21.7 % $ 563.2 22.0 % $ 1,701.8 22.0 % $1,672.4 22.3 %
Small-container 799.1 30.2 772.5 30.1 2,369.0 30.7 2,286.0 30.4Large-container 583.6 22.1 561.3 21.9 1,688.2 21.9 1,633.5 21.8Other 11.7 0.4 11.0 0.4 34.2 0.4 32.6 0.4
Total collection 1,968.8 74.4 1,908.0 74.4 5,793.2 75.0 5,624.5 74.9Transfer 347.1 322.9 985.8 932.5Less: intercompany (192.2) (180.6) (556.8) (534.6)
Transfer, net 154.9 5.8 142.3 5.5 429.0 5.6 397.9 5.3Landfill 605.3 590.2 1,750.7 1,720.7Less: intercompany (265.5) (258.8) (776.6) (767.5)
Landfill, net 339.8 12.8 331.4 12.9 974.1 12.6 953.2 12.7Environmental services 57.8 2.2 51.5 2.0 143.6 1.8 149.6 2.0Other:Recycling processing and commodity sales 68.6 2.6 76.0 3.0 213.2 2.8 219.9 2.9Other non-core 57.0 2.2 56.5 2.2 169.6 2.2 165.8 2.2
Total other 125.6 4.8 132.5 5.2 382.8 5.0 385.7 5.1Total revenue $2,646.9 100.0 % $2,565.7 100.0 % $ 7,722.7 100.0 % $7,510.9 100.0 %
Other non-core revenue consists primarily of revenue from National Accounts, which represents the portion of revenue generated from nationwide or regional contracts in markets outside our operating areas where the associated waste handling services are subcontracted to local operators. Consequently, substantially all of this revenue is offset with related subcontract costs, which are recorded in cost of operations.
The factors that impact the timing and amount of revenue recognized for each service line may vary based on the nature of the service performed. Generally, we recognize revenue at the time we perform a service. In the event that we bill for services in advance of performance, we recognize deferred revenue for the amount billed and subsequently recognize revenue at the time the service is provided. Substantially all of the deferred revenue recognized as of December 31, 2018 was recognized as revenue during the nine months ended September 30, 2019 when the service was performed.
See Note 13, Segment Reporting, for additional information regarding revenue by reportable segment.
Revenue Recognition
Our service obligations of a long-term nature, e.g., solid waste collection service contracts, are satisfied over time, and werecognize revenue based on the value provided to the customer during the period. The amount billed to the customer is based onvariable elements such as the number of residential homes or businesses for which collection services are provided, the volumeof waste collected, transported and disposed, and the nature of the waste accepted. We do not disclose the value of unsatisfiedperformance obligations for these contracts as our right to consideration corresponds directly to the value provided to thecustomer for services completed to date and all future variable consideration is allocated to wholly unsatisfied performanceobligations.
Additionally, certain elements of our long-term customer contracts are unknown upon entering into the contract, including theamount that will be billed in accordance with annual price escalation clauses, our fuel recovery fee program and commodityprices. The amount to be billed is often tied to changes in an underlying base index such as a consumer price index or a fuel orcommodity index, and revenue can be recognized once the index is established for the period.
Table of ContentsREPUBLIC SERVICES, INC.
NOTES TO UNAUDITED CONSOLIDATED FINANCIAL STATEMENTS - (CONTINUED)
30

Deferred Contract Costs
We incur certain upfront payments to acquire customer contracts which are recognized as other assets in our consolidatedbalance sheet, and we amortize the asset over the respective contract life. In addition, we recognize sales commissions thatrepresent an incremental cost of the contract as other assets in our consolidated balance sheets, and we amortize the asset overthe average life of the customer relationship. As of September 30, 2019 and December 31, 2018, we recognized $82.4 millionand $89.2 million, respectively, of deferred contract costs and capitalized sales commissions. During the three and nine monthsended September 30, 2019, we amortized $2.9 million and $8.9 million of capitalized sales commissions to selling, general andadministrative expenses and $1.6 million and $4.6 million of other deferred contract costs as a reduction of revenue,respectively. During the three and nine months ended September 30, 2018, we amortized $2.8 million and $8.3 million ofcapitalized sales commissions to selling, general and administrative expenses and $1.6 million and $4.4 million of otherdeferred contract costs as a reduction of revenue, respectively.
15. COMMITMENTS AND CONTINGENCIES
Legal Proceedings
We are subject to extensive and evolving laws and regulations and have implemented safeguards to respond to regulatory requirements. In the normal course of our business, we become involved in legal proceedings. Some may result in fines, penalties or judgments against us, or settlements, which may impact earnings and cash flows for a particular period. Although we cannot predict the ultimate outcome of any legal matter with certainty, we do not believe the outcome of any of our pending legal proceedings will have a material adverse impact on our consolidated financial position, results of operations or cash flows.
As used herein, the term legal proceedings refers to litigation and similar claims against us and our subsidiaries, excluding: (1) ordinary course accidents, general commercial liability and workers' compensation claims, which are covered by insurance programs, subject to customary deductibles, and which, together with insured employee health care costs, are discussed in Note 5, Other Liabilities; and (2) environmental remediation liabilities, which are discussed in Note 6, Landfill and Environmental Costs.
We accrue for legal proceedings when losses become probable and reasonably estimable. We have recorded an aggregate accrual of approximately $19 million relating to our outstanding legal proceedings as of September 30, 2019. As of the end of each applicable reporting period, we review each of our legal proceedings and, where it is probable that a liability has been incurred, we accrue for all probable and reasonably estimable losses. Where we can reasonably estimate a range of losses we may incur regarding such a matter, we record an accrual for the amount within the range that constitutes our best estimate. If we can reasonably estimate a range but no amount within the range appears to be a better estimate than any other, we use the amount that is the low end of such range. If we had used the high ends of such ranges, our aggregate potential liability would be approximately $15 million higher than the amount recorded as of September 30, 2019.
Multiemployer Pension Plans
We contribute to 26 multiemployer pension plans under collective bargaining agreements covering union-represented employees. These plans generally provide retirement benefits to participants based on their service to contributing employers. We do not administer these plans.
Under current law regarding multiemployer pension plans, a plan’s termination, our voluntary withdrawal (which we consider from time to time) or the mass withdrawal of all contributing employers from any under-funded multiemployer pension plan (each, a Withdrawal Event) would require us to make payments to the plan for our proportionate share of the plan’s unfunded vested liabilities. During the course of operating our business, we incur Withdrawal Events regarding certain of our multiemployer pension plans. We accrue for such events when losses become probable and reasonably estimable.
Restricted Cash and Marketable Securities
Our restricted cash and marketable securities include, among other things, restricted cash and marketable securities held for capital expenditures under certain debt facilities, restricted cash pursuant to a holdback arrangement, restricted cash and marketable securities pledged to regulatory agencies and governmental entities as financial guarantees of our performance under certain collection, landfill and transfer station contracts and permits, and relating to our final capping, closure and post-closure obligations at our landfills, and restricted cash and marketable securities related to our insurance obligations.
Table of ContentsREPUBLIC SERVICES, INC.
NOTES TO UNAUDITED CONSOLIDATED FINANCIAL STATEMENTS - (CONTINUED)
31

The following table summarizes our restricted cash and marketable securities:
September 30, 2019 December 31, 2018Capping, closure and post-closure obligations $ 30.4 $ 29.5Insurance 90.9 78.6Total restricted cash and marketable securities $ 121.3 $ 108.1
Restricted cash and restricted cash equivalents are included with cash and cash equivalents when reconciling the beginning-of-period and end-of-period total amounts shown on the statement of cash flows. Beginning-of-period and end-of-period cash,cash equivalents, restricted cash and restricted cash equivalents as presented in the statement of cash flows is reconciled asfollows:
September 30, 2019
December 31, 2018
September 30, 2018
December 31, 2017
Cash and cash equivalents $ 55.6 $ 70.5 $ 81.9 $ 83.3Restricted cash and marketable securities 121.3 108.1 99.1 141.1Less: restricted marketable securities (48.3) (45.3) (44.1) (45.3)Cash, cash equivalents, restricted cash and restricted cash equivalents $ 128.6 $ 133.3 $ 136.9 $ 179.1
Off-Balance Sheet Arrangements
We have no off-balance sheet debt or similar obligations, other than short-term operating leases and financial assurances, which are not classified as debt. We have no transactions or obligations with related parties that are not disclosed, consolidated into or reflected in our reported financial position or results of operations. We have not guaranteed any third-party debt.
Table of ContentsREPUBLIC SERVICES, INC.
NOTES TO UNAUDITED CONSOLIDATED FINANCIAL STATEMENTS - (CONTINUED)
32

ITEM 2. MANAGEMENT’S DISCUSSION AND ANALYSIS OF FINANCIAL CONDITION AND RESULTS OF OPERATIONS
You should read the following discussion in conjunction with the unaudited consolidated financial statements and notes thereto included under Item 1 of Part I of this Form 10-Q. In addition, you should refer to our audited consolidated financial statements and notes thereto and related Management’s Discussion and Analysis of Financial Condition and Results of Operations appearing in our Annual Report on Form 10-K for the fiscal year ended December 31, 2018.
Disclosure Regarding Forward-Looking Statements
This Quarterly Report on Form 10-Q contains certain forward-looking information about us that is intended to be covered by the safe harbor for “forward-looking statements” provided by the Private Securities Litigation Reform Act of 1995. Forward-looking statements are statements that are not historical facts. Words such as “guidance,” “expect,” “will,” “may,” “anticipate,” “plan,” “estimate,” “project,” “intend,” “should,” “can,” “likely,” “could,” “outlook” and similar expressions are intended to identify forward-looking statements. In particular, information appearing under this “Management's Discussion and Analysis of Financial Condition and Results of Operations” includes forward-looking statements. These statements include information about our plans, strategies and prospects. Forward-looking statements are not guarantees of performance. These statements are based upon the current beliefs and expectations of our management and are subject to risk and uncertainties that could cause actual results to differ materially from those expressed in, or implied or projected by, the forward-looking information and statements. Although we believe that the expectations reflected in the forward-looking statements are reasonable, we cannot assure you that the expectations will prove to be correct. Among the factors that could cause actual results to differ materially from the expectations expressed in the forward-looking statements are acts of war, riots or terrorism, and the impact of these acts on economic, financial and social conditions in the United States as well as our dependence on large, long-term collection, transfer and disposal contracts. More information on factors that could cause actual results or events to differ materially from those anticipated is included from time to time in our reports filed with the Securities and Exchange Commission, including our Annual Report on Form 10-K for the year ended December 31, 2018, particularly under Part I, Item 1A - Risk Factors. Additionally, new risk factors emerge from time to time and it is not possible for us to predict all such risk factors, or to assess the impact such risk factors might have on our business. We undertake no obligation to update publicly any forward-looking statements whether as a result of new information, future events or otherwise, except as required by law.
33

Overview
Republic is the second largest provider of non-hazardous solid waste collection, transfer, disposal, recycling, and environmental services in the United States, as measured by revenue. As of September 30, 2019, we operated facilities in 41 states and Puerto Rico through 342 collection operations, 211 transfer stations, 190 active landfills, 88 recycling processing centers, 8 treatment, recovery and disposal facilities, 15 salt water disposal wells and 2 deep injection wells. We are engaged in 75 landfill gas to energy and renewable energy projects and had post-closure responsibility for 129 closed landfills.
Revenue for the nine months ended September 30, 2019 increased by 2.8% to $7,722.7 million compared to $7,510.9 million for the same period in 2018. This change in revenue is due to increases in average yield of 2.8%, fuel recovery fees of 0.1%, and acquisitions, net of divestitures of 0.7%, partially offset by the impact of decreased volumes of (0.4)%, environmental services of (0.3)%, and recycling processing and commodity sales of (0.1)%.
The following table summarizes our revenue, expenses and operating income for the three and nine months ended September 30, 2019 and 2018 (in millions of dollars and as a percentage of revenue):
Three Months Ended September 30, Nine Months Ended September 30,2019 2018 2019 2018
Revenue $ 2,646.9 100.0 % $ 2,565.7 100.0 % $ 7,722.7 100.0 % $ 7,510.9 100.0 %Expenses: Cost of operations 1,631.4 61.6 1,577.4 61.5 4,754.4 61.6 4,624.4 61.6 Depreciation, amortization and depletion of property and equipment 253.5 9.6 245.4 9.5 743.4 9.6 730.2 9.7 Amortization of other intangible
assets 4.8 0.2 14.9 0.6 14.4 0.2 45.0 0.6Amortization of other assets 9.0 0.3 2.1 0.1 25.3 0.3 5.8 0.1Accretion 20.5 0.8 20.1 0.8 61.4 0.8 60.7 0.8
Selling, general and administrative 275.4 10.4 260.9 10.2 806.3 10.4 775.0 10.3Gain on disposition of assets and asset impairments, net (24.0) (0.9) (4.6) (0.2) (23.5) (0.3) (5.3) (0.1)Restructuring charges 8.5 0.3 9.2 0.4 13.0 0.2 22.5 0.3
Operating income $ 467.8 17.7 % $ 440.3 17.1 % $ 1,328.0 17.2 % $ 1,252.6 16.7 %
Our pre-tax income was $369.5 million and $1,010.9 million for the three and nine months ended September 30, 2019, respectively, compared to $340.3 million and $963.6 million for the same respective periods in 2018. Our net income attributable to Republic Services, Inc. was $298.3 million and $784.0 million for the three and nine months ended September 30, 2019, or $0.93 and $2.43 per diluted share, respectively, compared to $263.4 million and $736.0 million, or $0.81 and $2.23 per diluted share, for the same periods in 2018, respectively.
During each of the three and nine months ended September 30, 2019 and 2018, we recorded a number of charges, other expenses and benefits that impacted our pre-tax income, net income attributable to Republic Services, Inc. (net income – Republic) and diluted earnings per share as noted in the following table (in millions, except per share data). Additionally, see the Results of Operations discussion of this Management's Discussion and Analysis of Financial Condition and Results of Operations for a discussion of other items that impacted our earnings during the three and nine months ended September 30, 2019 and 2018.
Table of Contents
34

Three Months Ended September 30, 2019 Three Months Ended September 30, 2018
Net Diluted Net Diluted
Pre-tax Income - Earnings Pre-tax Income - Earnings
Income Republic per Share Income Republic per Share
As reported $ 369.5 $ 298.3 $ 0.93 $ 340.3 $ 263.4 $ 0.81
Restructuring charges 8.5 6.3 0.02 9.2 7.4 0.02
Incremental contract startup costs - large municipal contract (2) — — — 0.1 — —
Adoption of the Tax Act (2) — — — — 0.3 —Gain on disposition of assets and asset impairments, net (24.0) (14.3) (0.04) (4.6) (2.1) (0.01)Acquisition integration and deal costs (1) 1.9 1.4 — — — —
Total adjustments (13.6) (6.6) (0.02) 4.7 5.6 0.01
As adjusted $ 355.9 $ 291.7 $ 0.91 $ 345.0 $ 269.0 $ 0.82(1) The aggregate impact to adjusted diluted earnings per share totals to less than $0.01 for the three months ended September 30, 2019.
(2) The aggregate impact to adjusted diluted earnings per share totals to less than $0.01 for the three months ended September 30, 2018.
Nine Months Ended September 30, 2019 Nine Months Ended September 30, 2018Net Diluted Net Diluted
Pre-tax Income - Earnings Pre-tax Income - EarningsIncome Republic per Share Income Republic per Share
As reported $ 1,010.9 $ 784.0 $ 2.43 $ 963.6 $ 736.0 $ 2.23Loss on extinguishment of debt and other related costs (2) — — — 0.3 0.2 —Restructuring charges 13.0 9.6 0.03 22.5 17.1 0.06Incremental contract startup costs - large municipal contract (1) 0.7 0.5 — 5.4 4.1 0.01Adoption of the Tax Act (2) — — — — 0.3 —Gain on disposition of assets and asset impairments, net (23.5) (13.9) (0.04) (5.3) (2.7) (0.01)Acquisition integration and deal costs 4.4 3.2 0.01 — — —
Total adjustments (5.4) (0.6) — 22.9 19.0 0.06As adjusted $ 1,005.5 $ 783.4 $ 2.43 $ 986.5 $ 755.0 $ 2.29
(1) The aggregate impact to adjusted diluted earnings per share totals to less than $0.01 for the nine months ended September 30, 2019.
(2) The aggregate impact to adjusted diluted earnings per share totals to less than $0.01 for the nine months ended September 30, 2018.
We believe that presenting adjusted pre-tax income, adjusted net income – Republic, and adjusted diluted earnings per share, which are not measures determined in accordance with U.S. GAAP, provides an understanding of operational activities before the financial impact of certain items. We use these measures, and believe investors will find them helpful, in understanding the ongoing performance of our operations separate from items that have a disproportionate impact on our results for a particular period. We have incurred comparable charges and costs in prior periods, and similar types of adjustments can reasonably be expected to be recorded in future periods. Our definitions of adjusted pre-tax income, adjusted net income – Republic, and adjusted diluted earnings per share may not be comparable to similarly titled measures presented by other companies. Further information on each of these adjustments is included below.
Loss on extinguishment of debt and other related costs. During the nine months ended September 30, 2018, we incurred a $0.3 million loss on the extinguishment of certain financing arrangements.
Restructuring charges. In January 2018, we eliminated certain positions following the consolidation of select back-office functions, including but not limited to the integration of our National Accounts support functions into our existing corporate support functions. These changes include a reduction in administrative staffing and the closure of certain office locations.
Table of Contents
35
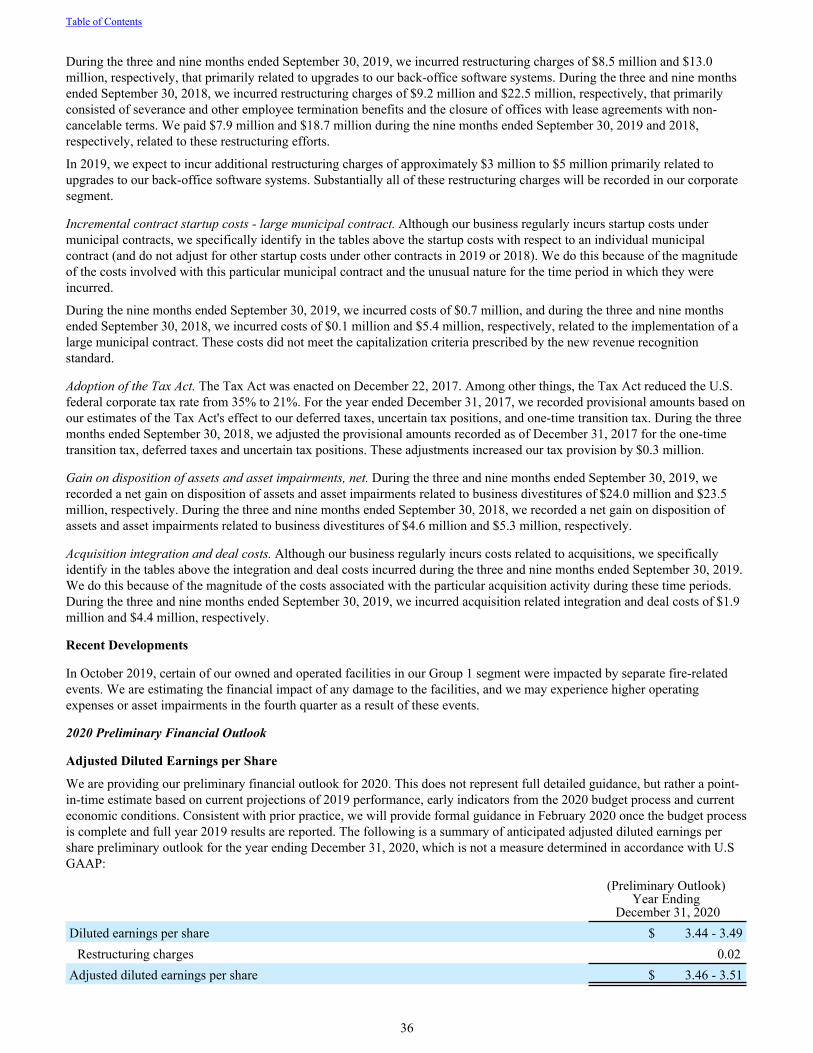
During the three and nine months ended September 30, 2019, we incurred restructuring charges of $8.5 million and $13.0 million, respectively, that primarily related to upgrades to our back-office software systems. During the three and nine months ended September 30, 2018, we incurred restructuring charges of $9.2 million and $22.5 million, respectively, that primarily consisted of severance and other employee termination benefits and the closure of offices with lease agreements with non-cancelable terms. We paid $7.9 million and $18.7 million during the nine months ended September 30, 2019 and 2018, respectively, related to these restructuring efforts.
In 2019, we expect to incur additional restructuring charges of approximately $3 million to $5 million primarily related to upgrades to our back-office software systems. Substantially all of these restructuring charges will be recorded in our corporate segment.
Incremental contract startup costs - large municipal contract. Although our business regularly incurs startup costs under municipal contracts, we specifically identify in the tables above the startup costs with respect to an individual municipal contract (and do not adjust for other startup costs under other contracts in 2019 or 2018). We do this because of the magnitude of the costs involved with this particular municipal contract and the unusual nature for the time period in which they were incurred.
During the nine months ended September 30, 2019, we incurred costs of $0.7 million, and during the three and nine months ended September 30, 2018, we incurred costs of $0.1 million and $5.4 million, respectively, related to the implementation of a large municipal contract. These costs did not meet the capitalization criteria prescribed by the new revenue recognition standard.
Adoption of the Tax Act. The Tax Act was enacted on December 22, 2017. Among other things, the Tax Act reduced the U.S. federal corporate tax rate from 35% to 21%. For the year ended December 31, 2017, we recorded provisional amounts based on our estimates of the Tax Act's effect to our deferred taxes, uncertain tax positions, and one-time transition tax. During the three months ended September 30, 2018, we adjusted the provisional amounts recorded as of December 31, 2017 for the one-time transition tax, deferred taxes and uncertain tax positions. These adjustments increased our tax provision by $0.3 million.
Gain on disposition of assets and asset impairments, net. During the three and nine months ended September 30, 2019, we recorded a net gain on disposition of assets and asset impairments related to business divestitures of $24.0 million and $23.5 million, respectively. During the three and nine months ended September 30, 2018, we recorded a net gain on disposition of assets and asset impairments related to business divestitures of $4.6 million and $5.3 million, respectively.
Acquisition integration and deal costs. Although our business regularly incurs costs related to acquisitions, we specifically identify in the tables above the integration and deal costs incurred during the three and nine months ended September 30, 2019. We do this because of the magnitude of the costs associated with the particular acquisition activity during these time periods. During the three and nine months ended September 30, 2019, we incurred acquisition related integration and deal costs of $1.9 million and $4.4 million, respectively.
Recent Developments
In October 2019, certain of our owned and operated facilities in our Group 1 segment were impacted by separate fire-related events. We are estimating the financial impact of any damage to the facilities, and we may experience higher operating expenses or asset impairments in the fourth quarter as a result of these events.
2020 Preliminary Financial Outlook
Adjusted Diluted Earnings per Share
We are providing our preliminary financial outlook for 2020. This does not represent full detailed guidance, but rather a point-in-time estimate based on current projections of 2019 performance, early indicators from the 2020 budget process and current economic conditions. Consistent with prior practice, we will provide formal guidance in February 2020 once the budget process is complete and full year 2019 results are reported. The following is a summary of anticipated adjusted diluted earnings per share preliminary outlook for the year ending December 31, 2020, which is not a measure determined in accordance with U.S GAAP:
(Preliminary Outlook) Year Ending
December 31, 2020Diluted earnings per share $ 3.44 - 3.49
Restructuring charges 0.02Adjusted diluted earnings per share $ 3.46 - 3.51
Table of Contents
36

We believe that presenting adjusted diluted earnings per share preliminary outlook provides an understanding of operational activities before the financial impact of certain items. We use this measure, and believe investors will find it helpful, in understanding the ongoing performance of our operations separate from items that have a disproportionate impact on our results for a particular period. We have incurred comparable charges and costs in prior periods, and similar types of adjustments can reasonably be expected to be recorded in future periods. Our definition of adjusted diluted earnings per share may not be comparable to similarly titled measures presented by other companies.
Results of Operations
Revenue
We generate revenue primarily from our solid waste collection operations. Our remaining revenue is from other services, including transfer station, landfill disposal, recycling, and environmental services. Our residential, small-container and large-container collection operations in some markets are based on long-term contracts with municipalities. Certain of our municipal contracts have annual price escalation clauses that are tied to changes in an underlying base index such as a consumer price index. We generally provide small-container and large-container collection services to customers under contracts with terms up to three years. Our transfer stations and landfills generate revenue from disposal or tipping fees charged to third parties. Our recycling processing facilities generate revenue from tipping fees charged to third parties and the sale of recycled commodities. Our revenue from environmental services consists mainly of fees we charge for the treatment and disposal of liquid and solid waste derived from the production of oil and natural gas. Other revenue consists primarily of revenue from National Accounts, which represents the portion of revenue generated from nationwide or regional contracts in markets outside our operating areas where the associated waste handling services are subcontracted to local operators. Consequently, substantially all of this revenue is offset with related subcontract costs, which are recorded in cost of operations.
The following table reflects our revenue by service line for the three and nine months ended September 30, 2019 and 2018 (in millions of dollars and as a percentage of revenue):
Three Months Ended September 30, Nine Months Ended September 30,2019 2018 2019 2018
Collection:Residential $ 574.4 21.7 % $ 563.2 22.0 % $ 1,701.8 22.0 % $ 1,672.4 22.3 %Small-container 799.1 30.2 772.5 30.1 2,369.0 30.7 2,286.0 30.4Large-container 583.6 22.1 561.3 21.9 1,688.2 21.9 1,633.5 21.8Other 11.7 0.4 11.0 0.4 34.2 0.4 32.6 0.4
Total collection 1,968.8 74.4 1,908.0 74.4 5,793.2 75.0 5,624.5 74.9Transfer 347.1 322.9 985.8 932.5Less: intercompany (192.2) (180.6) (556.8) (534.6)
Transfer, net 154.9 5.8 142.3 5.5 429.0 5.6 397.9 5.3Landfill 605.3 590.2 1,750.7 1,720.7Less: intercompany (265.5) (258.8) (776.6) (767.5)
Landfill, net 339.8 12.8 331.4 12.9 974.1 12.6 953.2 12.7Environmental services 57.8 2.2 51.5 2.0 143.6 1.8 149.6 2.0Other:Recycling processing and commodity sales 68.6 2.6 76.0 3.0 213.2 2.8 219.9 2.9Other non-core 57.0 2.2 56.5 2.2 169.6 2.2 165.8 2.2
Total other 125.6 4.8 132.5 5.2 382.8 5.0 385.7 5.1Total revenue $ 2,646.9 100.0 % $ 2,565.7 100.0 % $ 7,722.7 100.0 % $ 7,510.9 100.0 %
Table of Contents
37
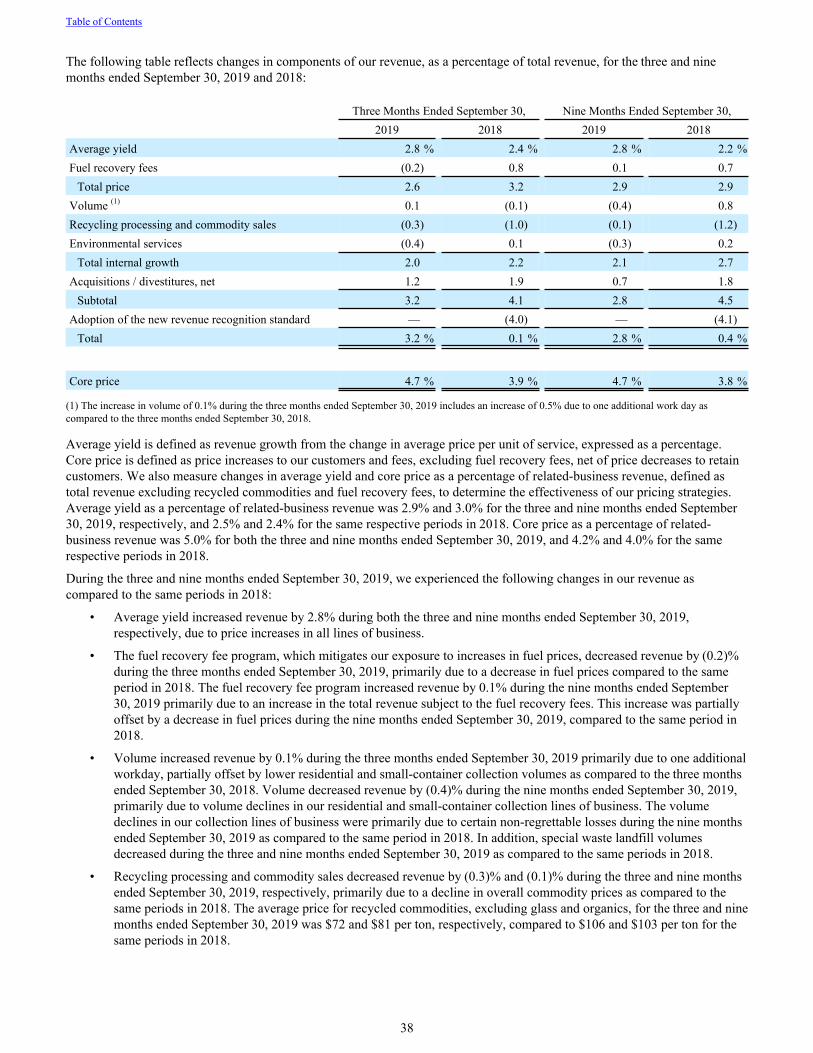
The following table reflects changes in components of our revenue, as a percentage of total revenue, for the three and nine months ended September 30, 2019 and 2018:
Three Months Ended September 30, Nine Months Ended September 30,2019 2018 2019 2018
Average yield 2.8 % 2.4 % 2.8 % 2.2 %Fuel recovery fees (0.2) 0.8 0.1 0.7
Total price 2.6 3.2 2.9 2.9Volume (1) 0.1 (0.1) (0.4) 0.8Recycling processing and commodity sales (0.3) (1.0) (0.1) (1.2)Environmental services (0.4) 0.1 (0.3) 0.2
Total internal growth 2.0 2.2 2.1 2.7Acquisitions / divestitures, net 1.2 1.9 0.7 1.8
Subtotal 3.2 4.1 2.8 4.5Adoption of the new revenue recognition standard — (4.0) — (4.1)
Total 3.2 % 0.1 % 2.8 % 0.4 %
Core price 4.7 % 3.9 % 4.7 % 3.8 %
(1) The increase in volume of 0.1% during the three months ended September 30, 2019 includes an increase of 0.5% due to one additional work day as compared to the three months ended September 30, 2018.
Average yield is defined as revenue growth from the change in average price per unit of service, expressed as a percentage. Core price is defined as price increases to our customers and fees, excluding fuel recovery fees, net of price decreases to retain customers. We also measure changes in average yield and core price as a percentage of related-business revenue, defined as total revenue excluding recycled commodities and fuel recovery fees, to determine the effectiveness of our pricing strategies. Average yield as a percentage of related-business revenue was 2.9% and 3.0% for the three and nine months ended September 30, 2019, respectively, and 2.5% and 2.4% for the same respective periods in 2018. Core price as a percentage of related-business revenue was 5.0% for both the three and nine months ended September 30, 2019, and 4.2% and 4.0% for the same respective periods in 2018.
During the three and nine months ended September 30, 2019, we experienced the following changes in our revenue as compared to the same periods in 2018:
• Average yield increased revenue by 2.8% during both the three and nine months ended September 30, 2019, respectively, due to price increases in all lines of business.
• The fuel recovery fee program, which mitigates our exposure to increases in fuel prices, decreased revenue by (0.2)% during the three months ended September 30, 2019, primarily due to a decrease in fuel prices compared to the same period in 2018. The fuel recovery fee program increased revenue by 0.1% during the nine months ended September 30, 2019 primarily due to an increase in the total revenue subject to the fuel recovery fees. This increase was partially offset by a decrease in fuel prices during the nine months ended September 30, 2019, compared to the same period in 2018.
• Volume increased revenue by 0.1% during the three months ended September 30, 2019 primarily due to one additional workday, partially offset by lower residential and small-container collection volumes as compared to the three months ended September 30, 2018. Volume decreased revenue by (0.4)% during the nine months ended September 30, 2019, primarily due to volume declines in our residential and small-container collection lines of business. The volume declines in our collection lines of business were primarily due to certain non-regrettable losses during the nine months ended September 30, 2019 as compared to the same period in 2018. In addition, special waste landfill volumes decreased during the three and nine months ended September 30, 2019 as compared to the same periods in 2018.
• Recycling processing and commodity sales decreased revenue by (0.3)% and (0.1)% during the three and nine months ended September 30, 2019, respectively, primarily due to a decline in overall commodity prices as compared to the same periods in 2018. The average price for recycled commodities, excluding glass and organics, for the three and nine months ended September 30, 2019 was $72 and $81 per ton, respectively, compared to $106 and $103 per ton for the same periods in 2018.
Table of Contents
38
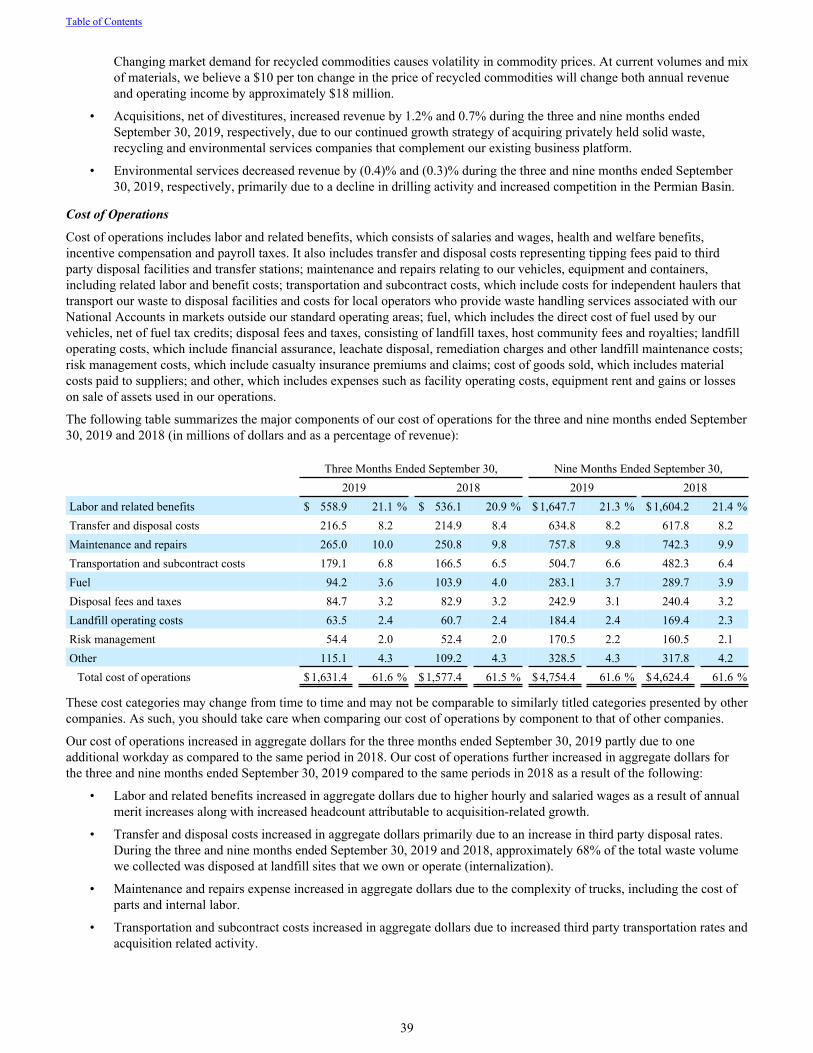
Changing market demand for recycled commodities causes volatility in commodity prices. At current volumes and mix of materials, we believe a $10 per ton change in the price of recycled commodities will change both annual revenue and operating income by approximately $18 million.
• Acquisitions, net of divestitures, increased revenue by 1.2% and 0.7% during the three and nine months ended September 30, 2019, respectively, due to our continued growth strategy of acquiring privately held solid waste, recycling and environmental services companies that complement our existing business platform.
• Environmental services decreased revenue by (0.4)% and (0.3)% during the three and nine months ended September 30, 2019, respectively, primarily due to a decline in drilling activity and increased competition in the Permian Basin.
Cost of Operations
Cost of operations includes labor and related benefits, which consists of salaries and wages, health and welfare benefits, incentive compensation and payroll taxes. It also includes transfer and disposal costs representing tipping fees paid to third party disposal facilities and transfer stations; maintenance and repairs relating to our vehicles, equipment and containers, including related labor and benefit costs; transportation and subcontract costs, which include costs for independent haulers that transport our waste to disposal facilities and costs for local operators who provide waste handling services associated with our National Accounts in markets outside our standard operating areas; fuel, which includes the direct cost of fuel used by our vehicles, net of fuel tax credits; disposal fees and taxes, consisting of landfill taxes, host community fees and royalties; landfill operating costs, which include financial assurance, leachate disposal, remediation charges and other landfill maintenance costs; risk management costs, which include casualty insurance premiums and claims; cost of goods sold, which includes material costs paid to suppliers; and other, which includes expenses such as facility operating costs, equipment rent and gains or losses on sale of assets used in our operations.
The following table summarizes the major components of our cost of operations for the three and nine months ended September 30, 2019 and 2018 (in millions of dollars and as a percentage of revenue):
Three Months Ended September 30, Nine Months Ended September 30,2019 2018 2019 2018
Labor and related benefits $ 558.9 21.1 % $ 536.1 20.9 % $ 1,647.7 21.3 % $ 1,604.2 21.4 %Transfer and disposal costs 216.5 8.2 214.9 8.4 634.8 8.2 617.8 8.2Maintenance and repairs 265.0 10.0 250.8 9.8 757.8 9.8 742.3 9.9Transportation and subcontract costs 179.1 6.8 166.5 6.5 504.7 6.6 482.3 6.4Fuel 94.2 3.6 103.9 4.0 283.1 3.7 289.7 3.9Disposal fees and taxes 84.7 3.2 82.9 3.2 242.9 3.1 240.4 3.2Landfill operating costs 63.5 2.4 60.7 2.4 184.4 2.4 169.4 2.3Risk management 54.4 2.0 52.4 2.0 170.5 2.2 160.5 2.1Other 115.1 4.3 109.2 4.3 328.5 4.3 317.8 4.2
Total cost of operations $ 1,631.4 61.6 % $ 1,577.4 61.5 % $ 4,754.4 61.6 % $ 4,624.4 61.6 %
These cost categories may change from time to time and may not be comparable to similarly titled categories presented by other companies. As such, you should take care when comparing our cost of operations by component to that of other companies.
Our cost of operations increased in aggregate dollars for the three months ended September 30, 2019 partly due to one additional workday as compared to the same period in 2018. Our cost of operations further increased in aggregate dollars for the three and nine months ended September 30, 2019 compared to the same periods in 2018 as a result of the following:
• Labor and related benefits increased in aggregate dollars due to higher hourly and salaried wages as a result of annual merit increases along with increased headcount attributable to acquisition-related growth.
• Transfer and disposal costs increased in aggregate dollars primarily due to an increase in third party disposal rates. During the three and nine months ended September 30, 2019 and 2018, approximately 68% of the total waste volume we collected was disposed at landfill sites that we own or operate (internalization).
• Maintenance and repairs expense increased in aggregate dollars due to the complexity of trucks, including the cost of parts and internal labor.
• Transportation and subcontract costs increased in aggregate dollars due to increased third party transportation rates and acquisition related activity.
Table of Contents
39
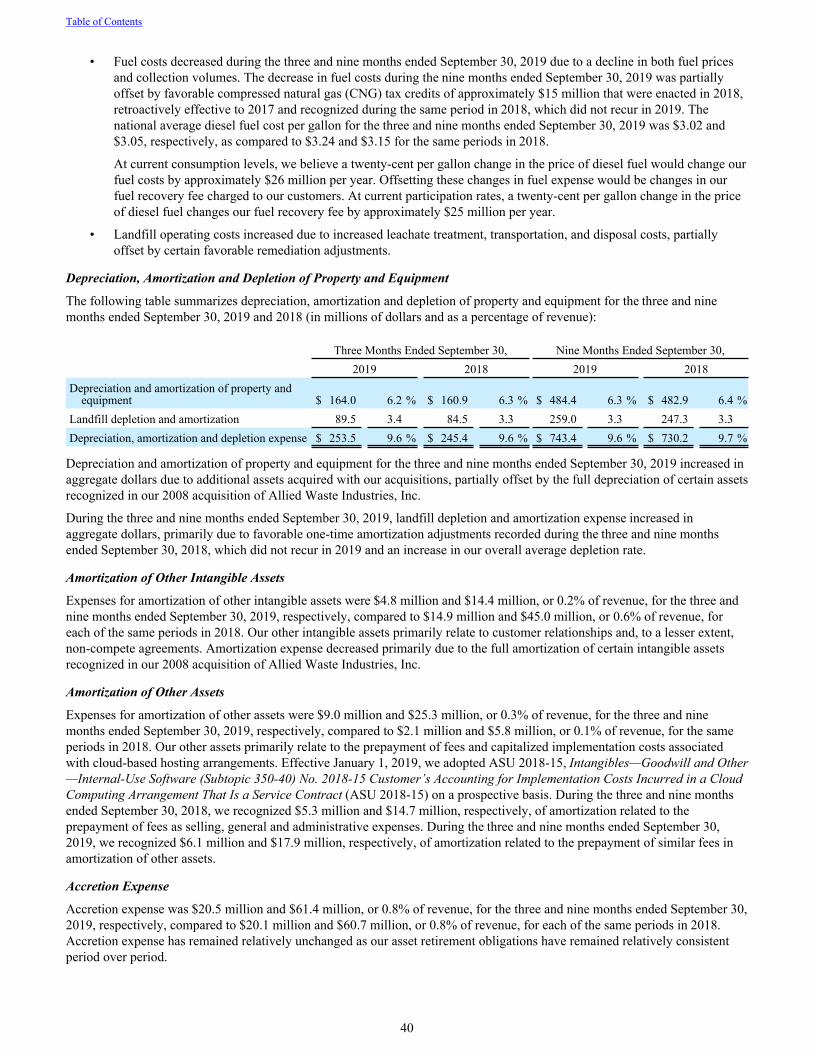
• Fuel costs decreased during the three and nine months ended September 30, 2019 due to a decline in both fuel prices and collection volumes. The decrease in fuel costs during the nine months ended September 30, 2019 was partially offset by favorable compressed natural gas (CNG) tax credits of approximately $15 million that were enacted in 2018, retroactively effective to 2017 and recognized during the same period in 2018, which did not recur in 2019. The national average diesel fuel cost per gallon for the three and nine months ended September 30, 2019 was $3.02 and $3.05, respectively, as compared to $3.24 and $3.15 for the same periods in 2018.
At current consumption levels, we believe a twenty-cent per gallon change in the price of diesel fuel would change our fuel costs by approximately $26 million per year. Offsetting these changes in fuel expense would be changes in our fuel recovery fee charged to our customers. At current participation rates, a twenty-cent per gallon change in the price of diesel fuel changes our fuel recovery fee by approximately $25 million per year.
• Landfill operating costs increased due to increased leachate treatment, transportation, and disposal costs, partially offset by certain favorable remediation adjustments.
Depreciation, Amortization and Depletion of Property and Equipment
The following table summarizes depreciation, amortization and depletion of property and equipment for the three and nine months ended September 30, 2019 and 2018 (in millions of dollars and as a percentage of revenue):
Three Months Ended September 30, Nine Months Ended September 30,2019 2018 2019 2018
Depreciation and amortization of property and equipment $ 164.0 6.2 % $ 160.9 6.3 % $ 484.4 6.3 % $ 482.9 6.4 %
Landfill depletion and amortization 89.5 3.4 84.5 3.3 259.0 3.3 247.3 3.3Depreciation, amortization and depletion expense $ 253.5 9.6 % $ 245.4 9.6 % $ 743.4 9.6 % $ 730.2 9.7 %
Depreciation and amortization of property and equipment for the three and nine months ended September 30, 2019 increased in aggregate dollars due to additional assets acquired with our acquisitions, partially offset by the full depreciation of certain assets recognized in our 2008 acquisition of Allied Waste Industries, Inc.
During the three and nine months ended September 30, 2019, landfill depletion and amortization expense increased in aggregate dollars, primarily due to favorable one-time amortization adjustments recorded during the three and nine months ended September 30, 2018, which did not recur in 2019 and an increase in our overall average depletion rate.
Amortization of Other Intangible Assets
Expenses for amortization of other intangible assets were $4.8 million and $14.4 million, or 0.2% of revenue, for the three and nine months ended September 30, 2019, respectively, compared to $14.9 million and $45.0 million, or 0.6% of revenue, for each of the same periods in 2018. Our other intangible assets primarily relate to customer relationships and, to a lesser extent, non-compete agreements. Amortization expense decreased primarily due to the full amortization of certain intangible assets recognized in our 2008 acquisition of Allied Waste Industries, Inc.
Amortization of Other Assets
Expenses for amortization of other assets were $9.0 million and $25.3 million, or 0.3% of revenue, for the three and nine months ended September 30, 2019, respectively, compared to $2.1 million and $5.8 million, or 0.1% of revenue, for the same periods in 2018. Our other assets primarily relate to the prepayment of fees and capitalized implementation costs associated with cloud-based hosting arrangements. Effective January 1, 2019, we adopted ASU 2018-15, Intangibles—Goodwill and Other—Internal-Use Software (Subtopic 350-40) No. 2018-15 Customer’s Accounting for Implementation Costs Incurred in a Cloud Computing Arrangement That Is a Service Contract (ASU 2018-15) on a prospective basis. During the three and nine months ended September 30, 2018, we recognized $5.3 million and $14.7 million, respectively, of amortization related to the prepayment of fees as selling, general and administrative expenses. During the three and nine months ended September 30, 2019, we recognized $6.1 million and $17.9 million, respectively, of amortization related to the prepayment of similar fees in amortization of other assets.
Accretion Expense
Accretion expense was $20.5 million and $61.4 million, or 0.8% of revenue, for the three and nine months ended September 30, 2019, respectively, compared to $20.1 million and $60.7 million, or 0.8% of revenue, for each of the same periods in 2018. Accretion expense has remained relatively unchanged as our asset retirement obligations have remained relatively consistent period over period.
Table of Contents
40
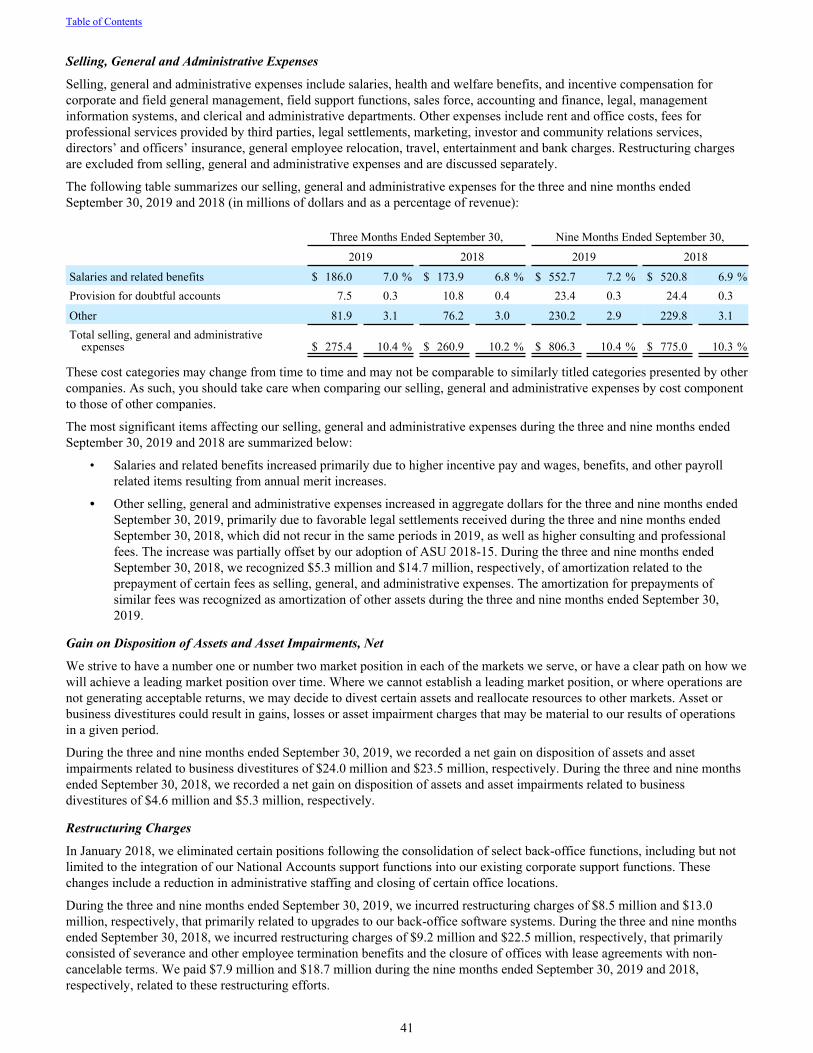
Selling, General and Administrative Expenses
Selling, general and administrative expenses include salaries, health and welfare benefits, and incentive compensation for corporate and field general management, field support functions, sales force, accounting and finance, legal, management information systems, and clerical and administrative departments. Other expenses include rent and office costs, fees for professional services provided by third parties, legal settlements, marketing, investor and community relations services, directors’ and officers’ insurance, general employee relocation, travel, entertainment and bank charges. Restructuring charges are excluded from selling, general and administrative expenses and are discussed separately.
The following table summarizes our selling, general and administrative expenses for the three and nine months ended September 30, 2019 and 2018 (in millions of dollars and as a percentage of revenue):
Three Months Ended September 30, Nine Months Ended September 30,
2019 2018 2019 2018
Salaries and related benefits $ 186.0 7.0 % $ 173.9 6.8 % $ 552.7 7.2 % $ 520.8 6.9 %Provision for doubtful accounts 7.5 0.3 10.8 0.4 23.4 0.3 24.4 0.3
Other 81.9 3.1 76.2 3.0 230.2 2.9 229.8 3.1Total selling, general and administrative
expenses $ 275.4 10.4 % $ 260.9 10.2 % $ 806.3 10.4 % $ 775.0 10.3 %
These cost categories may change from time to time and may not be comparable to similarly titled categories presented by other companies. As such, you should take care when comparing our selling, general and administrative expenses by cost component to those of other companies.
The most significant items affecting our selling, general and administrative expenses during the three and nine months ended September 30, 2019 and 2018 are summarized below:
• Salaries and related benefits increased primarily due to higher incentive pay and wages, benefits, and other payroll related items resulting from annual merit increases.
• Other selling, general and administrative expenses increased in aggregate dollars for the three and nine months ended September 30, 2019, primarily due to favorable legal settlements received during the three and nine months ended September 30, 2018, which did not recur in the same periods in 2019, as well as higher consulting and professional fees. The increase was partially offset by our adoption of ASU 2018-15. During the three and nine months ended September 30, 2018, we recognized $5.3 million and $14.7 million, respectively, of amortization related to the prepayment of certain fees as selling, general, and administrative expenses. The amortization for prepayments of similar fees was recognized as amortization of other assets during the three and nine months ended September 30, 2019.
Gain on Disposition of Assets and Asset Impairments, Net
We strive to have a number one or number two market position in each of the markets we serve, or have a clear path on how we will achieve a leading market position over time. Where we cannot establish a leading market position, or where operations are not generating acceptable returns, we may decide to divest certain assets and reallocate resources to other markets. Asset orbusiness divestitures could result in gains, losses or asset impairment charges that may be material to our results of operationsin a given period.
During the three and nine months ended September 30, 2019, we recorded a net gain on disposition of assets and asset impairments related to business divestitures of $24.0 million and $23.5 million, respectively. During the three and nine months ended September 30, 2018, we recorded a net gain on disposition of assets and asset impairments related to business divestitures of $4.6 million and $5.3 million, respectively.
Restructuring Charges
In January 2018, we eliminated certain positions following the consolidation of select back-office functions, including but not limited to the integration of our National Accounts support functions into our existing corporate support functions. These changes include a reduction in administrative staffing and closing of certain office locations.
During the three and nine months ended September 30, 2019, we incurred restructuring charges of $8.5 million and $13.0 million, respectively, that primarily related to upgrades to our back-office software systems. During the three and nine months ended September 30, 2018, we incurred restructuring charges of $9.2 million and $22.5 million, respectively, that primarily consisted of severance and other employee termination benefits and the closure of offices with lease agreements with non-cancelable terms. We paid $7.9 million and $18.7 million during the nine months ended September 30, 2019 and 2018, respectively, related to these restructuring efforts.
Table of Contents
41

Interest Expense
The following table provides the components of interest expense, including accretion of debt discounts and accretion of discounts primarily associated with environmental and risk insurance liabilities assumed in acquisitions, for the three and nine months ended September 30, 2019 and 2018 (in millions of dollars):
Three Months Ended September 30,
Nine Months Ended September 30,
2019 2018 2019 2018
Interest expense on debt $ 89.0 $ 88.1 $ 266.8 $ 260.3Non-cash interest 11.8 10.0 34.9 31.4Less: capitalized interest (2.8) (2.1) (4.8) (4.4)Total interest expense $ 98.0 $ 96.0 $ 296.9 $ 287.3
Total interest expense for the three and nine months ended September 30, 2019 increased primarily due to the increase in debt outstanding during the period. Cash paid for interest, excluding net swap settlements for our interest rate swaps and locks, was $257.1 million for the nine months ended September 30, 2019 and $255.6 million for the nine months ended September 30, 2018.
Effective January 1, 2019, we adopted ASU 2016-02, Leases (Topic 842) (ASC 842 or the new leasing standard) using the optional transition method prescribed by ASU 2018-11, Leases (Topic 842): Targeted Improvements. Under the new leasing standard, we will present variable lease costs associated with our finance leases as a component of non-cash interest expense. Variable lease costs are recognized in our consolidated statement of income in the period incurred. As such, we expect non-cash interest expense to fluctuate each period as the variable elements of these arrangements become known and the cost is incurred.
Income Taxes
Our effective tax rate, exclusive of non-controlling interests, for the three and nine months ended September 30, 2019 was 19.3% and 22.5%, respectively. Our effective tax rate, exclusive of non-controlling interests, for the three and nine months ended September 30, 2018 was 22.7% and 23.6%, respectively. Our effective tax rate for the three and nine months ended September 30, 2019 was favorably affected by settlements of various state matters and the realization of additional federal and state benefits as well as adjustments to deferred taxes due to the completion of our 2018 tax returns.
Cash paid for income taxes was a net refund of $4.3 million and a net payment of $43.5 million for the nine months ended September 30, 2019 and 2018, respectively. Cash taxes have been favorably impacted from the receipt of funds from amended returns filed during 2018.
For additional discussion and detail regarding our income taxes, see Note 9, Income Taxes, to our unaudited consolidated financial statements included in Item 1 of Part I of this Quarterly Report on Form 10-Q.
Reportable Segments
Our senior management evaluates, oversees and manages the financial performance of our operations through two field groups, referred to as Group 1 and Group 2. Group 1 primarily consists of geographic areas located in the western United States, and Group 2 primarily consists of geographic areas located in the southeastern and mid-western United States, and the eastern seaboard of the United States.
Table of Contents
42
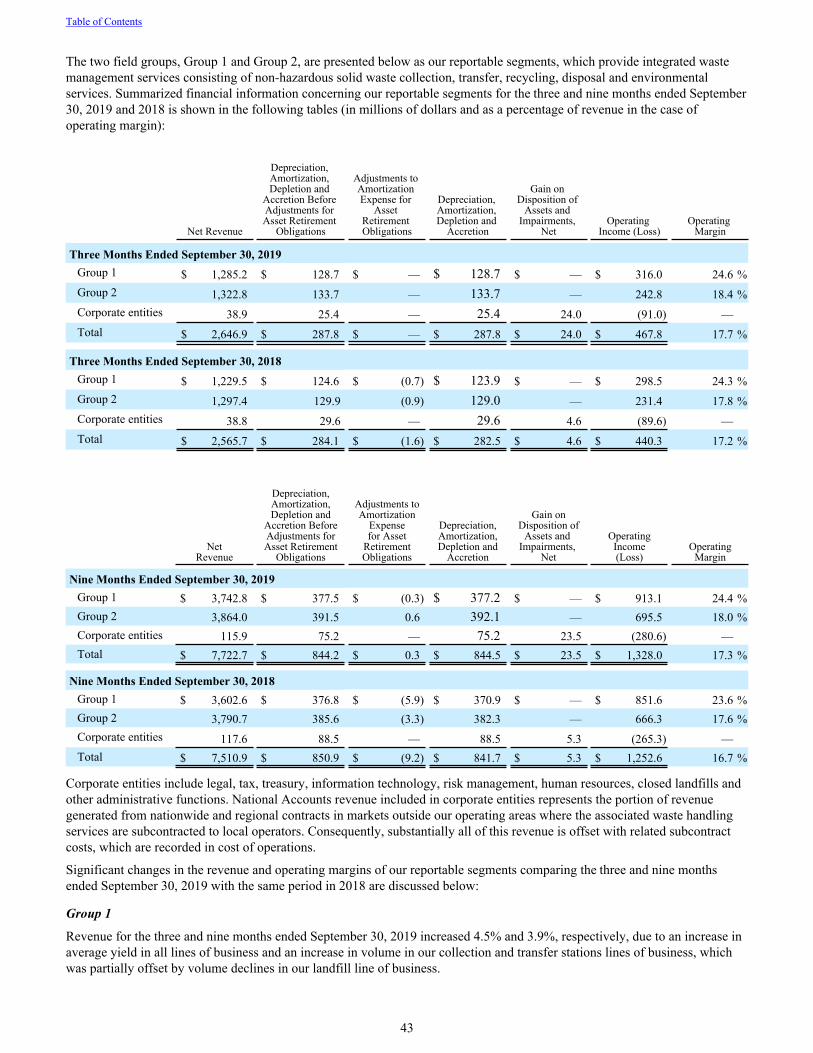
The two field groups, Group 1 and Group 2, are presented below as our reportable segments, which provide integrated waste management services consisting of non-hazardous solid waste collection, transfer, recycling, disposal and environmental services. Summarized financial information concerning our reportable segments for the three and nine months ended September 30, 2019 and 2018 is shown in the following tables (in millions of dollars and as a percentage of revenue in the case of operating margin):
Net Revenue
Depreciation, Amortization, Depletion and
Accretion Before Adjustments for Asset Retirement
Obligations
Adjustments to Amortization Expense for
Asset Retirement Obligations
Depreciation, Amortization, Depletion and
Accretion
Gain on Disposition of
Assets and Impairments,
NetOperating
Income (Loss)Operating
Margin
Three Months Ended September 30, 2019Group 1 $ 1,285.2 $ 128.7 $ — $ 128.7 $ — $ 316.0 24.6 %Group 2 1,322.8 133.7 — 133.7 — 242.8 18.4 %Corporate entities 38.9 25.4 — 25.4 24.0 (91.0) —Total $ 2,646.9 $ 287.8 $ — $ 287.8 $ 24.0 $ 467.8 17.7 %
Three Months Ended September 30, 2018Group 1 $ 1,229.5 $ 124.6 $ (0.7) $ 123.9 $ — $ 298.5 24.3 %Group 2 1,297.4 129.9 (0.9) 129.0 — 231.4 17.8 %Corporate entities 38.8 29.6 — 29.6 4.6 (89.6) —Total $ 2,565.7 $ 284.1 $ (1.6) $ 282.5 $ 4.6 $ 440.3 17.2 %
NetRevenue
Depreciation,Amortization,Depletion and
Accretion BeforeAdjustments forAsset Retirement
Obligations
Adjustments toAmortization
Expensefor Asset
RetirementObligations
Depreciation,Amortization,Depletion and
Accretion
Gain onDisposition of
Assets and Impairments,
Net
OperatingIncome(Loss)
OperatingMargin
Nine Months Ended September 30, 2019Group 1 $ 3,742.8 $ 377.5 $ (0.3) $ 377.2 $ — $ 913.1 24.4 %Group 2 3,864.0 391.5 0.6 392.1 — 695.5 18.0 %Corporate entities 115.9 75.2 — 75.2 23.5 (280.6) —Total $ 7,722.7 $ 844.2 $ 0.3 $ 844.5 $ 23.5 $ 1,328.0 17.3 %
Nine Months Ended September 30, 2018Group 1 $ 3,602.6 $ 376.8 $ (5.9) $ 370.9 $ — $ 851.6 23.6 %Group 2 3,790.7 385.6 (3.3) 382.3 — 666.3 17.6 %Corporate entities 117.6 88.5 — 88.5 5.3 (265.3) —Total $ 7,510.9 $ 850.9 $ (9.2) $ 841.7 $ 5.3 $ 1,252.6 16.7 %
Corporate entities include legal, tax, treasury, information technology, risk management, human resources, closed landfills and other administrative functions. National Accounts revenue included in corporate entities represents the portion of revenue generated from nationwide and regional contracts in markets outside our operating areas where the associated waste handling services are subcontracted to local operators. Consequently, substantially all of this revenue is offset with related subcontract costs, which are recorded in cost of operations.
Significant changes in the revenue and operating margins of our reportable segments comparing the three and nine months ended September 30, 2019 with the same period in 2018 are discussed below:
Group 1
Revenue for the three and nine months ended September 30, 2019 increased 4.5% and 3.9%, respectively, due to an increase in average yield in all lines of business and an increase in volume in our collection and transfer stations lines of business, which was partially offset by volume declines in our landfill line of business.
Table of Contents
43
Operating income in Group 1 increased from $298.5 million for the three months ended September 30, 2018, or 24.3% operating income margin, to $316.0 million for the three months ended September 30, 2019, or a 24.6% operating income margin. Operating income in Group 1 increased from $851.6 million for the nine months ended September 30, 2018, or 23.6% operating income margin, to $913.1 million for the nine months ended September 30, 2019, or a 24.4% operating income margin. The following cost categories impacted operating income margin:
• Cost of operations unfavorably impacted operating income margin for the three months ended September 30, 2019, primarily due to an increase in maintenance and repairs expenses and transportation and subcontract costs, partially offset by a decrease in fuel costs. Cost of operations favorably impacted operating income margin for the nine months ended September 30, 2019, primarily due to a decrease in labor and related benefits and fuel costs as a percentage of revenue, partially offset by an increase in transportation and subcontract costs.
• Selling, general, and administrative expenses favorably impacted operating income margin for the three and nine months ended September 30, 2019, primarily due to a decrease in bad debt expense during the three and nine months ended September 30, 2019.
Group 2
Revenue for the three and nine months ended September 30, 2019 increased 2.0% and 1.9%, respectively, due primarily to increases in average yield in all lines of business, partially offset by volume declines in our collection and transfer stations lines of business.
Operating income in Group 2 increased from $231.4 million for the three months ended September 30, 2018, or a 17.8% operating income margin, to $242.8 million for the three months ended September 30, 2019, or an 18.4% operating income margin. Operating income in Group 2 increased from $666.3 million for the nine months ended September 30, 2018, or a 17.6% operating income margin, to $695.5 million for the nine months ended September 30, 2019, or an 18.0% operating income margin. The following cost categories impacted operating income margin:
• Cost of operations favorably impacted operating income margin for the three and nine months ended September 30, 2019, primarily due to a decrease in transfer and disposal costs, fuel costs, and risk management expenses as a percentage of revenue, partially offset by an increase in landfill operating costs as a percentage of revenue.
• Landfill depletion and amortization unfavorably impacted operating income margin as a result of favorable one-time amortization adjustments recorded during the three and nine months ended September 30, 2018, which did not recur in the same periods in 2019 as well as an increase in our overall average depletion rate. Depreciation favorably impacted operating income margin during the three and nine months ended September 30, 2019, primarily due to the full depreciation of certain assets recognized in our 2008 acquisition of Allied Waste Industries, Inc.
Corporate Entities
Operating loss in our Corporate Entities increased from $89.6 million for the three months ended September 30, 2018 to $91.0 million for the three months ended September 30, 2019. Operating loss in our Corporate Entities increased from $265.3 million for the nine months ended September 30, 2018 to $280.6 million for the nine months ended September 30, 2019. The operating loss for the three and nine months ended September 30, 2019 increased due to favorable CNG tax credits of approximately $15 million that were enacted in 2018, retroactively effective in 2017 and recognized during the three and nine months ended September 30, 2018, favorable legal settlements received during the three and nine months ended September 30, 2018, and higher consulting and professional fees, partially offset by the net gain on disposition of assets and asset impairments related to business divestitures.
For discussion and detail regarding our reportable segments, refer to Note 13, Segment Reporting, to our unaudited consolidated financial statements included in Item 1 of Part I of this Quarterly Report on Form 10-Q.
Table of Contents
44
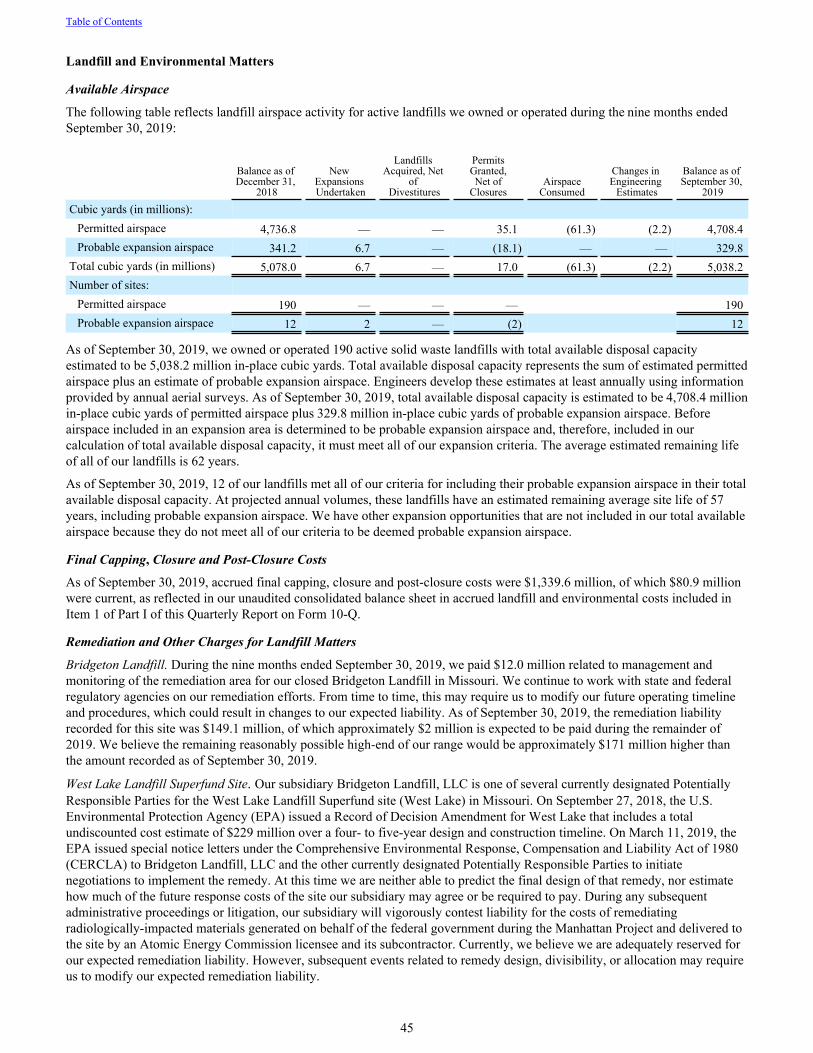
Landfill and Environmental Matters
Available Airspace
The following table reflects landfill airspace activity for active landfills we owned or operated during the nine months ended September 30, 2019:
Balance as of December 31,
2018
New Expansions Undertaken
Landfills Acquired, Net
of Divestitures
PermitsGranted,Net of
ClosuresAirspace
Consumed
Changes in Engineering
Estimates
Balance as of September 30,
2019
Cubic yards (in millions):Permitted airspace 4,736.8 — — 35.1 (61.3) (2.2) 4,708.4Probable expansion airspace 341.2 6.7 — (18.1) — — 329.8
Total cubic yards (in millions) 5,078.0 6.7 — 17.0 (61.3) (2.2) 5,038.2Number of sites:
Permitted airspace 190 — — — 190Probable expansion airspace 12 2 — (2) 12
As of September 30, 2019, we owned or operated 190 active solid waste landfills with total available disposal capacity estimated to be 5,038.2 million in-place cubic yards. Total available disposal capacity represents the sum of estimated permitted airspace plus an estimate of probable expansion airspace. Engineers develop these estimates at least annually using information provided by annual aerial surveys. As of September 30, 2019, total available disposal capacity is estimated to be 4,708.4 million in-place cubic yards of permitted airspace plus 329.8 million in-place cubic yards of probable expansion airspace. Before airspace included in an expansion area is determined to be probable expansion airspace and, therefore, included in our calculation of total available disposal capacity, it must meet all of our expansion criteria. The average estimated remaining life of all of our landfills is 62 years.
As of September 30, 2019, 12 of our landfills met all of our criteria for including their probable expansion airspace in their total available disposal capacity. At projected annual volumes, these landfills have an estimated remaining average site life of 57 years, including probable expansion airspace. We have other expansion opportunities that are not included in our total available airspace because they do not meet all of our criteria to be deemed probable expansion airspace.
Final Capping, Closure and Post-Closure Costs
As of September 30, 2019, accrued final capping, closure and post-closure costs were $1,339.6 million, of which $80.9 million were current, as reflected in our unaudited consolidated balance sheet in accrued landfill and environmental costs included in Item 1 of Part I of this Quarterly Report on Form 10-Q.
Remediation and Other Charges for Landfill Matters
Bridgeton Landfill. During the nine months ended September 30, 2019, we paid $12.0 million related to management and monitoring of the remediation area for our closed Bridgeton Landfill in Missouri. We continue to work with state and federal regulatory agencies on our remediation efforts. From time to time, this may require us to modify our future operating timeline and procedures, which could result in changes to our expected liability. As of September 30, 2019, the remediation liability recorded for this site was $149.1 million, of which approximately $2 million is expected to be paid during the remainder of 2019. We believe the remaining reasonably possible high-end of our range would be approximately $171 million higher than the amount recorded as of September 30, 2019.
West Lake Landfill Superfund Site. Our subsidiary Bridgeton Landfill, LLC is one of several currently designated Potentially Responsible Parties for the West Lake Landfill Superfund site (West Lake) in Missouri. On September 27, 2018, the U.S. Environmental Protection Agency (EPA) issued a Record of Decision Amendment for West Lake that includes a total undiscounted cost estimate of $229 million over a four- to five-year design and construction timeline. On March 11, 2019, the EPA issued special notice letters under the Comprehensive Environmental Response, Compensation and Liability Act of 1980 (CERCLA) to Bridgeton Landfill, LLC and the other currently designated Potentially Responsible Parties to initiate negotiations to implement the remedy. At this time we are neither able to predict the final design of that remedy, nor estimate how much of the future response costs of the site our subsidiary may agree or be required to pay. During any subsequent administrative proceedings or litigation, our subsidiary will vigorously contest liability for the costs of remediating radiologically-impacted materials generated on behalf of the federal government during the Manhattan Project and delivered to the site by an Atomic Energy Commission licensee and its subcontractor. Currently, we believe we are adequately reserved for our expected remediation liability. However, subsequent events related to remedy design, divisibility, or allocation may require us to modify our expected remediation liability.
Table of Contents
45
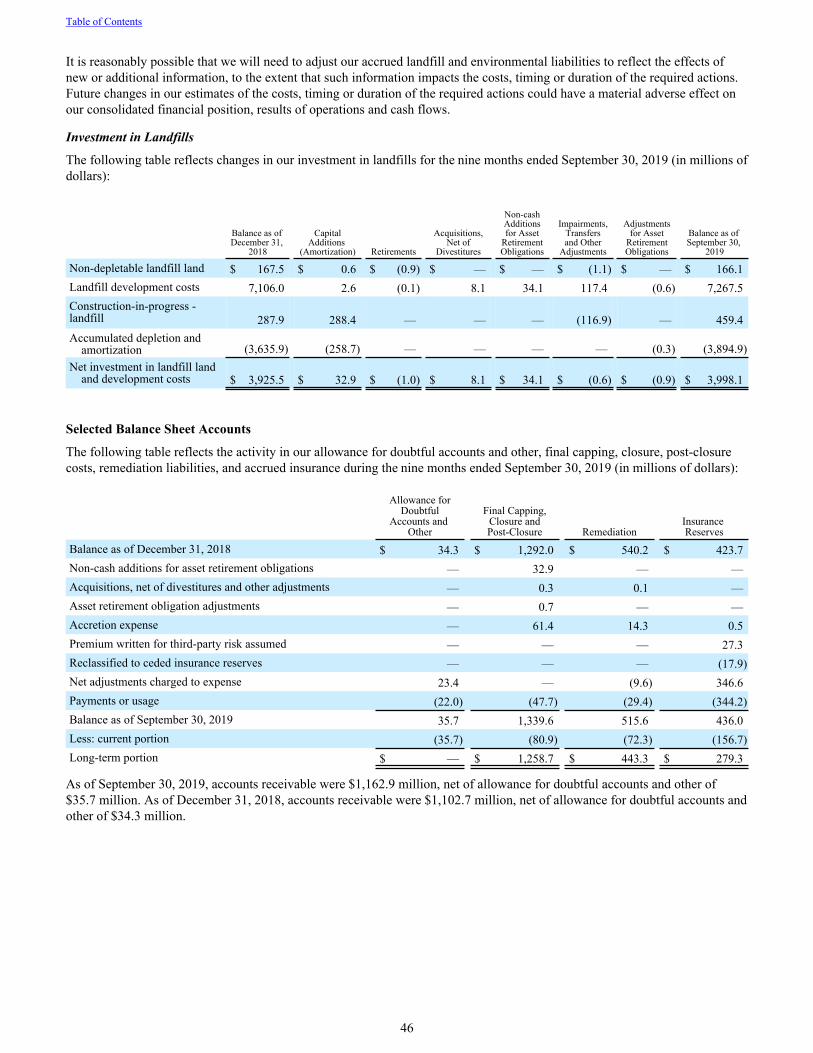
It is reasonably possible that we will need to adjust our accrued landfill and environmental liabilities to reflect the effects of new or additional information, to the extent that such information impacts the costs, timing or duration of the required actions. Future changes in our estimates of the costs, timing or duration of the required actions could have a material adverse effect on our consolidated financial position, results of operations and cash flows.
Investment in Landfills
The following table reflects changes in our investment in landfills for the nine months ended September 30, 2019 (in millions of dollars):
Balance as of December 31,
2018
CapitalAdditions
(Amortization) Retirements
Acquisitions,Net of
Divestitures
Non-cashAdditionsfor Asset
RetirementObligations
Impairments,Transfersand Other
Adjustments
Adjustmentsfor Asset
RetirementObligations
Balance as of September 30,
2019
Non-depletable landfill land $ 167.5 $ 0.6 $ (0.9) $ — $ — $ (1.1) $ — $ 166.1Landfill development costs 7,106.0 2.6 (0.1) 8.1 34.1 117.4 (0.6) 7,267.5Construction-in-progress - landfill 287.9 288.4 — — — (116.9) — 459.4Accumulated depletion and
amortization (3,635.9) (258.7) — — — — (0.3) (3,894.9)Net investment in landfill land
and development costs $ 3,925.5 $ 32.9 $ (1.0) $ 8.1 $ 34.1 $ (0.6) $ (0.9) $ 3,998.1
Selected Balance Sheet Accounts
The following table reflects the activity in our allowance for doubtful accounts and other, final capping, closure, post-closure costs, remediation liabilities, and accrued insurance during the nine months ended September 30, 2019 (in millions of dollars):
Allowance forDoubtful
Accounts and Other
Final Capping,Closure andPost-Closure Remediation
Insurance Reserves
Balance as of December 31, 2018 $ 34.3 $ 1,292.0 $ 540.2 $ 423.7Non-cash additions for asset retirement obligations — 32.9 — —Acquisitions, net of divestitures and other adjustments — 0.3 0.1 —Asset retirement obligation adjustments — 0.7 — —Accretion expense — 61.4 14.3 0.5Premium written for third-party risk assumed — — — 27.3Reclassified to ceded insurance reserves — — — (17.9)Net adjustments charged to expense 23.4 — (9.6) 346.6Payments or usage (22.0) (47.7) (29.4) (344.2)Balance as of September 30, 2019 35.7 1,339.6 515.6 436.0Less: current portion (35.7) (80.9) (72.3) (156.7)Long-term portion $ — $ 1,258.7 $ 443.3 $ 279.3
As of September 30, 2019, accounts receivable were $1,162.9 million, net of allowance for doubtful accounts and other of $35.7 million. As of December 31, 2018, accounts receivable were $1,102.7 million, net of allowance for doubtful accounts and other of $34.3 million.
Table of Contents
46

Property and Equipment
The following tables reflect the activity in our property and equipment accounts for the nine months ended September 30, 2019 (in millions of dollars):
Gross Property and Equipment
Balance as of December 31,
2018Capital
Additions Retirements
Acquisitions,Net of
Divestitures
Non-cashAdditionsfor Asset
RetirementObligations
Adjustmentsfor Asset
RetirementObligations
Impairments,Transfersand Other
Adjustments
Balance as of September 30,
2019
Land $ 443.6 $ 0.2 $ (0.7) $ 8.0 $ — $ — $ 0.2 $ 451.3Non-depletable landfill land 167.5 0.6 (0.9) — — — (1.1) 166.1Landfill development costs 7,106.0 2.6 (0.1) 8.1 34.1 (0.6) 117.4 7,267.5Vehicles and equipment 7,377.3 498.7 (239.9) 117.0 — — (11.1) 7,742.0Buildings and improvements 1,279.8 2.5 (8.9) 4.4 0.1 — 37.4 1,315.3Construction-in- progress - landfill 287.9 288.4 — — — — (116.9) 459.4Construction-in- progress - other 89.9 47.8 — — — — (81.7) 56.0Total $ 16,752.0 $ 840.8 $ (250.5) $ 137.5 $ 34.2 $ (0.6) $ (55.8) $ 17,457.6
Accumulated Depreciation, Amortization and Depletion
Balance as of December 31,
2018
AdditionsCharged
toExpense Retirements
Acquisitions,Net of
Divestitures
Adjustmentsfor Asset
RetirementObligations
Impairments,Transfersand Other
Adjustments
Balance as of September 30,
2019
Landfill development costs $ (3,635.9) $ (258.7) $ — $ — $ (0.3) $ — $ (3,894.9)Vehicles and equipment (4,571.1) (440.1) 234.4 12.1 — 23.4 (4,741.3)Buildings and improvements (524.9) (46.5) 7.1 1.0 — (0.5) (563.8)Total $ (8,731.9) $ (745.3) $ 241.5 $ 13.1 $ (0.3) $ 22.9 $ (9,200.0)
Liquidity and Capital Resources
The following table summarizes our cash flow from operating activities, investing activities and financing activities for the nine months ended September 30, 2019 and 2018 (in millions of dollars):
Nine Months Ended September 30, 2019 2018Cash provided by operating activities $ 1,786.9 $ 1,746.9Cash used in investing activities $ (1,316.6) $ (931.7)Cash used in financing activities $ (475.0) $ (857.4)
Cash Flows Provided by Operating Activities
The most significant items affecting the comparison of our operating cash flows for the nine months ended September 30, 2019 and 2018 are summarized below:
Changes in assets and liabilities, net of effects from business acquisitions and divestitures, decreased our cash flow from operations by $9.1 million during the nine months ended September 30, 2019, compared to a decrease of $92.0 million during the same period in 2018, primarily as a result of the following:
• Our accounts receivable, exclusive of the change in allowance for doubtful accounts and customer credits, increased $65.3 million during the nine months ended September 30, 2019 due to the timing of billings net of collections, compared to a $72.1 million increase in the same period in 2018. As of September 30, 2019, our days sales outstanding were 39.9, or 28.2 days net of deferred revenue, compared to 41.0, or 29.1 days net of deferred revenue, as of September 30, 2018.
Table of Contents
47

• Our prepaid expenses and other assets decreased $98.3 million during the nine months ended September 30, 2019, compared to a $13.5 million increase in the same period in 2018, primarily due to timing of our estimated tax payments. Cash paid for income taxes was a net refund of $4.3 million and a net payment of $43.5 million for the nine months ended September 30, 2019 and 2018, respectively.
• Our accounts payable decreased $9.3 million during the nine months ended September 30, 2019, compared to a $58.6 million increase in the same period in 2018, due to the timing of payments.
• Cash paid for capping, closure and post-closure obligations was $47.7 million during the nine months ended September 30, 2019, compared to $42.5 million in the same period in 2018. The increase in cash paid for capping, closure, and post-closure obligations is primarily due to the timing of capping and post-closure payments at certain of our landfill sites.
• Cash paid for remediation obligations was $0.8 million lower during the nine months ended September 30, 2019, compared to the same period in 2018, primarily due to the timing of obligations.
Cash paid for interest, excluding net settlements for our interest rate swaps and locks, was $257.1 million and $255.6 million for the nine months ended September 30, 2019 and 2018, respectively.
We use cash flows from operations to fund capital expenditures, acquisitions, dividend payments, share repurchases and debt repayments.
Cash Flows Used in Investing Activities
The most significant items affecting the comparison of our cash flows used in investing activities for the nine months ended September 30, 2019 and 2018 are summarized below:
• Capital expenditures during the nine months ended September 30, 2019 were $908.3 million, compared with $820.5 million for the same period in 2018.
• During the nine months ended September 30, 2019 and 2018, we paid $455.9 million and $130.5 million, respectively, for acquisitions and investments.
We intend to finance capital expenditures and acquisitions through cash on hand, restricted cash held for capital expenditures, cash flows from operations, our revolving credit facilities, and tax-exempt bonds and other financings. We expect to primarily use cash and borrowings under our revolving credit facilities to pay for future business acquisitions.
Cash Flows Used in Financing Activities
The most significant items affecting the comparison of our cash flows used in financing activities for the nine months ended September 30, 2019 and 2018 are summarized below:
• Net proceeds from notes payable and long-term debt and senior notes were $250.8 million during the nine months ended September 30, 2019, compared to net proceeds of $46.1 million in the same period in 2018.
• During the nine months ended September 30, 2019, we repurchased 4.3 million shares of our stock for $353.8 million compared to repurchases of 8.5 million shares for $574.9 million during the same period in 2018.
• Dividends paid were $361.9 million and $340.0 million during the nine months ended September 30, 2019 and 2018, respectively.
Financial Condition
Cash and Cash Equivalents
As of September 30, 2019, we had $55.6 million of cash and cash equivalents and $121.3 million of restricted cash deposits and restricted marketable securities, including $30.4 million of restricted cash and marketable securities pledged to regulatory agencies and governmental entities as financial guarantees of our performance related to our final capping, closure and post-closure obligations at our landfills, and $90.9 million of restricted cash and marketable securities related to our insurance obligations.
Debt
For discussion and detail regarding our debt, refer to Note 7, Debt, to our unaudited consolidated financial statements included in Item 1 of Part I of this Quarterly Report on Form 10-Q.
Table of Contents
48

Credit Facilities
In 2018, we entered into a $2.25 billion unsecured revolving credit facility (the Credit Facility), which replaced our $1.0 billion and $1.25 billion unsecured credit facilities that would have matured in May 2021 and June 2019, respectively. The Credit Facility matures in June 2023. We may request two one-year extensions of the maturity date but none of the lenders are committed to participate in such extension. The Credit Facility also includes a feature that allows us to increase availability, at our option, by an aggregate amount of up to $1.0 billion through increased commitments from existing lenders or the addition of new lenders. At our option, borrowings under the Credit Facility bear interest at a Base Rate, or a Eurodollar Rate, plus an applicable margin based on our Debt Ratings (all as defined in the Credit Facility agreement).
The Credit Facility requires us to comply with financial and other covenants. To the extent we are not in compliance with these covenants, we cannot pay dividends or repurchase common stock. Compliance with covenants also is a condition for any incremental borrowings under our Credit Facility, and failure to meet these covenants would enable the lenders to require repayment of any outstanding loans (which would adversely affect our liquidity). As of September 30, 2019, our EBITDA to interest ratio was 7.53 compared to the 3.00 minimum required by the covenants, and our total debt to EBITDA ratio was 2.96 compared to the 3.50 maximum allowed by the covenants. As of September 30, 2019, we were in compliance with the covenants under our Credit Facility, and we expect to be in compliance throughout the remainder of 2019.
EBITDA, which is a non-U.S. GAAP measure, is calculated as defined in our Credit Facility agreement. In this context, EBITDA is used solely to provide information regarding the extent to which we are in compliance with debt covenants and is not comparable to EBITDA used by other companies or used by us for other purposes.
Availability under our Credit Facility totaled $1,710.6 million and $1,694.1 million as of September 30, 2019 and December 31, 2018, respectively. The Credit Facility can be used for working capital, capital expenditures, acquisitions, letters of credit and other general corporate purposes. As of September 30, 2019 and December 31, 2018, we had $170.0 million and $159.0 million of borrowings under our Credit Facility, respectively. We had $352.0 million and $379.6 million of letters of credit outstanding under our Credit Facility as of September 30, 2019 and December 31, 2018, respectively.
We also have an Uncommitted Credit Facility, which bears interest at LIBOR, plus an applicable margin and is subject to facility fees defined in the agreement, regardless of usage. We can use borrowings under the Uncommitted Credit Facility for working capital and other general corporate purposes. The agreement governing our Uncommitted Credit Facility requires us to comply with certain covenants. The Uncommitted Credit Facility may be terminated by either party at any time. We had $12.2 million of borrowings and $33.4 million of borrowings under our Uncommitted Credit Facility as of September 30, 2019 and December 31, 2018, respectively.
Senior Notes and Debentures
In August 2019, we issued $900.0 million of 2.500% senior notes due 2024 (the 2.500% Notes). We used the net proceeds from the 2.500% Notes to repay $650.0 million of 5.500% senior notes that matured in September 2019. Any remaining proceeds were used to repay amounts outstanding under our unsecured credit facilities as well as for general corporate purposes. Contemporaneously with this offering, we amended interest rate lock agreements with a notional value of $375.0 million and dedesignated the hedging relationship. There was no ineffectiveness recognized in the termination of these cash flow hedges. In addition, we entered into an offsetting interest rate swap to manage exposure to fluctuations in interest rates associated with the amended agreements. For further detail regarding the effect of our derivative contracts on interest expense, refer to Note 12, Financial Instruments, to our unaudited consolidated financial statements in Item 1 of Part I of this Quarterly Report on Form 10-Q.
In 2018, we issued $800.0 million of 3.950% senior notes due 2028 (the 3.950% Notes). We used the net proceeds from the 3.950% Notes to repay $700.0 million of 3.800% senior notes that matured in May 2018, and any remaining proceeds were used for general corporate purposes. In connection with this offering, we terminated interest rate lock agreements with a notional value of $600.0 million, resulting in net proceeds of $31.1 million. There was no ineffectiveness recognized in the termination of these cash flow hedges.
Our senior notes and debentures are general unsecured obligations. Interest is payable semi-annually.
Tax-Exempt Financings
During the second quarter of 2019, we refinanced $35.0 million of tax-exempt financings and issued $30.0 million of new tax-exempt financings. As of September 30, 2019, we had $1,066.3 million of certain variable rate tax-exempt financings outstanding with maturities ranging from 2020 to 2049. As of December 31, 2018, we had $1,036.8 million of certain variable rate tax-exempt financings outstanding with maturities ranging from 2019 to 2044. Approximately 100% of our tax-exempt financings are remarketed quarterly by remarketing agents to effectively maintain a variable yield. The holders of the bonds can put them back to the remarketing agents at the end of each interest period. To date, the remarketing agents have been able to remarket all of our variable rate unsecured tax-exempt bonds.
Table of Contents
49

Finance Leases
We had finance lease liabilities of $112.4 million and $109.5 million as of September 30, 2019 and December 31, 2018, respectively, with maturities ranging from 2019 to 2049 and 2019 to 2046, respectively.
Credit Ratings
Our continued access to the debt capital markets and to new financing facilities, as well as our borrowing costs, depend on multiple factors, including market conditions, our operating performance and maintaining strong credit ratings. As of September 30, 2019, our credit ratings were BBB+, Baa2 and BBB by Standard & Poor’s Ratings Services, Moody’s Investors Service and Fitch Ratings, Inc., respectively. If our credit ratings were downgraded, especially any downgrade to below investment grade, our ability to access the debt markets with the same flexibility that we have experienced historically, our cost of funds and other terms for new debt issuances, could be adversely impacted.
Intended Uses of Cash
We intend to use excess cash on hand and cash from operating activities to fund capital expenditures, acquisitions, dividend payments, share repurchases and debt repayments. Debt repayments may include purchases of our outstanding indebtedness in the secondary market or otherwise. We believe our excess cash, cash from operating activities and our availability to draw from our Credit Facility provide us with sufficient financial resources to meet our anticipated capital requirements and maturing obligations as they come due.
We may choose to voluntarily retire certain portions of our outstanding debt before their maturity dates using cash from operations or additional borrowings. We also may explore opportunities in capital markets to fund redemptions should market conditions be favorable. Early extinguishment of debt will result in an impairment charge in the period in which the debt is repaid.
Off-Balance Sheet Arrangements
We have no off-balance sheet debt or similar obligations, other than short-term operating leases and financial assurances, which are not classified as debt. We have no transactions or obligations with related parties that are not disclosed, consolidated into or reflected in our reported financial position or results of operations. We have not guaranteed any third-party debt.
Seasonality and Severe Weather
Our operations can be adversely affected by periods of inclement or severe weather, which could increase the volume of waste collected under our existing contracts (without corresponding compensation), delay the collection and disposal of waste, reduce the volume of waste delivered to our disposal sites, or delay the construction or expansion of our landfills and other facilities. Our operations also can be favorably affected by severe weather, which could increase the volume of waste in situations where we are able to charge for our additional services.
Contingencies
For a description of our commitments and contingencies, see Note 6, Landfill and Environmental Costs, Note 9, Income Taxes, and Note 15, Commitments and Contingencies, to our unaudited consolidated financial statements included in Item 1 of Part I of this Quarterly Report on Form 10-Q.
Critical Accounting Judgments and Estimates
We identified and discussed our critical accounting judgments and estimates in our Annual Report on Form 10-K for the fiscal year ended December 31, 2018. Although we believe our estimates and judgments are reasonable, they are based upon information available at the time the judgment or estimate is made. Actual results may differ significantly from estimates under different assumptions or conditions.
New Accounting Pronouncements
For a description of new accounting standards that may affect us, see Note 1, Basis of Presentation, to our unaudited consolidated financial statements included in Item 1 of Part I of this Quarterly Report on Form 10-Q.
Table of Contents
50

ITEM 3. QUANTITATIVE AND QUALITATIVE DISCLOSURES ABOUT MARKET RISK.
Fuel Price Risk
Fuel costs represent a significant operating expense. When economically practical, we may enter into new fuel hedges, renew contracts, or engage in other strategies to mitigate market risk. As of September 30, 2019, we had no fuel hedges in place. While we charge fuel recovery fees to a majority of our customers, we are unable to charge such fees to all customers.
At current consumption levels, we believe a twenty-cent per gallon change in the price of diesel fuel would change our fuel costs by approximately $26 million per year. Offsetting these changes in fuel expense would result in changes in our fuel recovery fee charged to our customers. At current participation rates, we believe a twenty-cent per gallon change in the price of diesel fuel would change our fuel recovery fee by approximately $25 million per year.
Our operations also require the use of certain petrochemical-based products (such as liners at our landfills) whose costs may vary with the price of petrochemicals. An increase in the price of petrochemicals could increase the cost of those products, which would increase our operating and capital costs. We also are susceptible to increases in indirect fuel recovery fees from our vendors.
Our fuel costs were $283.1 million during the nine months ended September 30, 2019, or 3.7% of revenue, compared to $289.7 million during the comparable period in 2018, or 3.9% of revenue.
Commodities Price Risk
We market recovered materials such as old corrugated containers and old newsprint from our recycling processing centers. Changes in market supply and demand for recycled commodities causes volatility in commodity prices. We have previously entered into derivative instruments such as swaps and costless collars designated as cash flow hedges to manage our exposure to changes in prices of these commodities. As of September 30, 2019, we had no recycling commodity hedges in place.
At current volumes and mix of materials, we believe a $10 per ton change in the price of recycled commodities would change both annual revenue and operating income by approximately $18 million.
Revenue from recycling processing and commodity sales during the nine months ended September 30, 2019 and 2018 was $213.2 million and $219.9 million, respectively.
Interest Rate Risk
We are subject to interest rate risk on our variable rate long-term debt. Additionally, we enter into various interest rate swap agreements with the goal of reducing overall borrowing costs and increasing our floating interest rate exposure, as well as interest rate locks to manage exposure to fluctuations in anticipation of future debt issuances. Our interest rate swap and lock contracts have been authorized pursuant to our policies and procedures. We do not use financial instruments for trading purposes and are not a party to any leveraged derivatives.
As of September 30, 2019, we had $1,254.6 million of floating rate debt and $300.0 million of floating interest rate swap contracts. If interest rates increased or decreased by 100 basis points on our variable rate debt, annualized interest expense and net cash payments for interest would increase or decrease by approximately $16 million. This analysis does not reflect the effect that interest rates would have on other items, such as new borrowings and the impact on the economy. See Note 7, Debt, of the notes to our unaudited consolidated financial statements in Item 1 of Part I of this Form 10-Q for further information regarding how we manage interest rate risk.
Table of Contents
51

ITEM 4. CONTROLS AND PROCEDURES.
Disclosure Controls and Procedures
We carried out an evaluation, under the supervision and with the participation of our management, including our Chief Executive Officer and Chief Financial Officer, of the effectiveness of our disclosure controls and procedures (as defined in Exchange Act Rules 13a-15(e), and 15d-15(e)) as of the end of the period covered by this Form 10-Q. Based upon that evaluation, our Chief Executive Officer and Chief Financial Officer concluded that our disclosure controls and procedures were effective as of the end of the period covered by this Form 10-Q.
Changes in Internal Control Over Financial Reporting
Based on an evaluation, under the supervision and with the participation of our management, including our Chief Executive Officer and Chief Financial Officer, there has been no change in our internal control over financial reporting during the period covered by this Form 10-Q identified in connection with that evaluation, that has materially affected, or is reasonably likely to materially affect, our internal control over financial reporting.
In July 2019, we acquired all of the issued and outstanding shares of Southern Tank Leasing, Inc., Tidal Tank, Inc. and Bealine Service Company, Inc. (collectively Sprint). As permitted by the SEC Staff interpretive guidance for newly acquired businesses, management's assessment of our internal control over financial reporting as of September 30, 2019 did not include an assessment of those disclosure controls and procedures that are subsumed by internal control over financial reporting as it relates to the Sprint acquisition. We will continue the process of implementing internal controls over financial reporting for Sprint. As of September 30, 2019, assets excluded from management's assessment totaled $141.8 million and contributed less than 1% of revenue to our unaudited consolidated financial statements for the three and nine months ended September 30, 2019.
Table of Contents
52

PART II - OTHER INFORMATION
ITEM 1. LEGAL PROCEEDINGS.
General Legal Proceedings
We are subject to extensive and evolving laws and regulations and have implemented safeguards to respond to regulatory requirements. In the normal course of our business, we become involved in legal proceedings. Some may result in fines, penalties or judgments against us, or settlements, which may impact earnings and cash flows for a particular period. Although we cannot predict the ultimate outcome of any legal matter with certainty, we do not believe the outcome of any of our pending legal proceedings will have a material adverse impact on our consolidated financial position, results of operations or cash flows.
As used herein, the term legal proceedings refers to litigation and similar claims against us and our subsidiaries, excluding: (1) ordinary course accidents, general commercial liability and workers' compensation claims, which are covered by insurance programs, subject to customary deductibles, and which, together with self-insured employee health care costs, are discussed in Note 5, Other Liabilities, to our unaudited consolidated financial statements in Item 1 of Part I of this Form 10-Q; and (2) environmental remediation liabilities, which are discussed in Note 6, Landfill and Environmental Costs, to our unaudited consolidated financial statements in Item 1 of Part I of this Form 10-Q.
We accrue for legal proceedings when losses become probable and reasonably estimable. We have recorded an aggregate accrual of approximately $19 million relating to our outstanding legal proceedings as of September 30, 2019. As of the end of each applicable reporting period, we review each of our legal proceedings and, where it is probable that a liability has been incurred, we accrue for all probable and reasonably estimable losses. Where we are able to reasonably estimate a range of losses we may incur with respect to such a matter, we record an accrual for the amount within the range that constitutes our best estimate. If we are able to reasonably estimate a range but no amount within the range appears to be a better estimate than any other, we use the amount that is the low end of such range. If we had used the high ends of such ranges, our aggregate potential liability would be approximately $15 million higher than the amount recorded as of September 30, 2019.
Legal Proceedings over Certain Environmental Matters Involving Governmental Authorities with Possible Sanctions of $100,000 or More
Item 103 of the SEC's Regulation S-K requires disclosure of certain environmental matters when a governmental authority is a party to the proceedings and the proceedings involve potential monetary sanctions unless we reasonably believe the monetary sanctions will not equal or exceed $100,000. We are disclosing the following matters in accordance with that requirement:
Pine Avenue Landfill Matter
On December 20, 2016, the EPA issued a Finding of Violation (FOV) to Allied Waste Niagara Falls Landfill, LLC (Allied-Niagara). The FOV alleges violations of the Clean Air Act and associated regulations relating to operation of Allied-Niagara’s Pine Avenue Landfill in Niagara County, New York. On October 16, 2017, Allied-Niagara received a civil penalty demand from the EPA. The demand proposes a penalty of $0.6 million or $2.5 million, depending on the results of requested sampling analysis at the site. Allied-Niagara is in discussions concerning a resolution to the FOV, including the amount of the penalty.
West Contra Costa Sanitary Landfill Matters
The West Contra Costa Sanitary Landfill is a closed landfill formerly operated by West Contra Costa Sanitary Landfill, Inc. (WCCSL). The top deck area of the closed landfill is being utilized for a composting operation. In 2017, the Contra Costa County Health Department and the Bay Area Air Quality Management District requested that the Contra Costa County District Attorney’s Office (DA) initiate a civil enforcement action against WCCSL with respect to Notices of Violation (NOVs) from 2016 and 2017 for issues including alleged offsite odors from the composting operation and fire events in compost curing piles (the DA matter). In 2017 and 2018, the California State Water Resources Control Board (Water Board) issued three NOVs alleging that operations at the closed landfill violated stormwater and waste discharge requirements permits (the Water Board matter). In September 2018, we received separate penalty demands from the DA and the Water Board, totaling approximately $1.2 million in civil penalties and enforcement costs. WCCSL has settled the DA matter and is in discussions concerning a resolution of the Water Board matter.
ITEM 1A. RISK FACTORS.
Our material risk factors are disclosed in Part I, Item 1A of our Annual Report on Form 10-K for the year ended December 31, 2018. There have been no material changes during the nine months ended September 30, 2019 from or updates to the risk factors discussed in Part I, Item 1A, Risk Factors, of our 2018 Annual Report on Form 10-K.
Table of Contents
53

ITEM 2. UNREGISTERED SALES OF EQUITY SECURITIES AND USE OF PROCEEDS.
Issuer Purchases of Equity Securities
The following table provides information relating to our purchases of shares of our common stock during the three months ended September 30, 2019:
Total Number ofShares
Purchased (a)Average Price Paid
per Share (a)
Total Number ofShares Purchased as Part of Publicly
Announced Program (b)
DollarValue of Shares that
May Yet Be PurchasedUnder the Program (c)
July 1 - 31 77,596 $ 86.65 77,596 $ 894,870,236August 1 - 31 838,889 $ 87.75 838,889 $ 821,258,964September 1 - 30 824,999 $ 86.01 824,999 $ 750,303,067
1,741,484 1,741,484
a. In October 2017, our Board of Directors added $2.0 billion to the existing share repurchase authorization that now extends through December 31, 2020. Share repurchases under the program may be made through open market purchases or privately negotiated transactions in accordance with applicable federal securities laws. While the Board of Directors has approved the program, the timing of any purchases, the prices and the number of shares of common stock to be purchased will be determined by our management, at its discretion, and will depend upon market conditions and other factors. The share repurchase program may be extended, suspended or discontinued at any time. As of September 30, 2019, there were less than 0.1 million repurchased shares pending settlement, resulting in an associated $0.1 million of share repurchases unpaid and included within other accrued liabilities.
a. The total number of shares purchased as part of the publicly announced program were all purchased pursuant to the October 2017 authorization.
b. Shares that may be purchased under the program exclude shares of common stock that may be surrendered to satisfy statutory minimum tax withholding obligations in connection with the vesting of restricted stock units and performance stock units issued to employees.
ITEM 3. DEFAULTS UPON SENIOR SECURITIES.
None.
ITEM 4. MINE SAFETY DISCLOSURES.
None.
ITEM 5. OTHER INFORMATION.
None.
Table of Contents
54
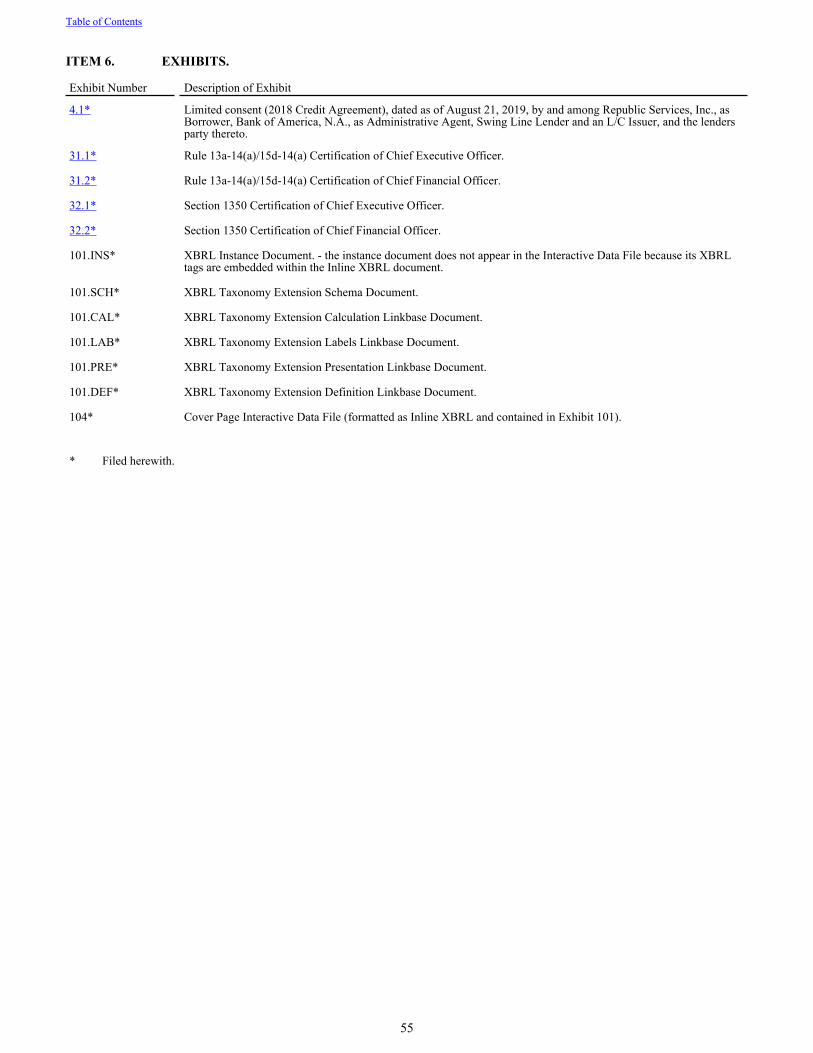
ITEM 6. EXHIBITS.
Exhibit Number Description of Exhibit
4.1* Limited consent (2018 Credit Agreement), dated as of August 21, 2019, by and among Republic Services, Inc., as Borrower, Bank of America, N.A., as Administrative Agent, Swing Line Lender and an L/C Issuer, and the lenders party thereto.
31.1* Rule 13a-14(a)/15d-14(a) Certification of Chief Executive Officer.
31.2* Rule 13a-14(a)/15d-14(a) Certification of Chief Financial Officer.
32.1* Section 1350 Certification of Chief Executive Officer.
32.2* Section 1350 Certification of Chief Financial Officer.
101.INS* XBRL Instance Document. - the instance document does not appear in the Interactive Data File because its XBRL tags are embedded within the Inline XBRL document.
101.SCH* XBRL Taxonomy Extension Schema Document.
101.CAL* XBRL Taxonomy Extension Calculation Linkbase Document.
101.LAB* XBRL Taxonomy Extension Labels Linkbase Document.
101.PRE* XBRL Taxonomy Extension Presentation Linkbase Document.
101.DEF* XBRL Taxonomy Extension Definition Linkbase Document.
104* Cover Page Interactive Data File (formatted as Inline XBRL and contained in Exhibit 101).
* Filed herewith.
Table of Contents
55

SIGNATURES
Pursuant to the requirements of the Securities Exchange Act of 1934, the Registrant, Republic Services, Inc., has duly caused this report to be signed on its behalf by the undersigned thereunto duly authorized.
REPUBLIC SERVICES, INC.
Date: October 30, 2019 By: /S/ CHARLES F. SERIANNICharles F. Serianni
Executive Vice President,Chief Financial Officer
(Principal Financial Officer)
Date: October 30, 2019 By: /S/ BRIAN A. GOEBEL
Brian A. Goebel
Vice President andChief Accounting Officer
(Principal Accounting Officer)
Table of Contents
56