Embed Size (px)
Citation preview

RRReeepppuuubbbllliiiccc ooofff YYYeeemmmeeennn
SSSeeecccooonnnddd NNNaaatttiiiooonnnaaalll CCCooommmmmmuuunnniiicccaaatttiiiooonnn
UUUnnndddeeerrr
TTThhheee UUUnnniiittteeeddd NNNaaatttiiiooonnnsss FFFrrraaammmeeewwwooorrrkkk CCCooonnnvvveeennntttiiiooonnn
ooonnn CCCllliiimmmaaattteee CCChhhaaannngggeee
MMMaaayyy 222000111333

ii
Yemen's Second National Communication under the United Nations Framework Convention on
Climate Change
May 2013

iii
Foreword Yemen recognizes that climate change is a global challenge being a key defining human development issue for the 21st century. Its effect will reach every continent, and its impacts threaten to reverse progress made toward poverty reduction and human development as well as the achievement of the Millennium Development Goals (MDGs). Yemen has been party to the UN Framework Conven on on Climate Change (UNFCCC) since 21 February 1996, and to the Kyoto Protocol since 17 January 2008 as non–Annex I Party. The Environmental Protection Authority is the national focal point for the implementation of the UNFCCC and the Kyoto protocol. Since the ratification and application of the UNFCCC and the Kyoto Protocol, considerable efforts have been made in establishing legislation, institutional and policy frameworks in order to fulfill the requirements of the Convention and the Protocol. There is a set of reasons why Yemen has seriously become concerned about climate change. Climate change concerns have been flagged in the fourth National Plan for Development and Poverty Reduc on (DPPR 2011‐2015), and the Joint Social and Economic Assessment for the Republic of Yemen (2012‐2015). Yemen's economy largely depends on natural resources upon which about 75% of its popula on extract their rural livelihoods that are highly reliant on favorable climatic conditions. Agriculture sector mainly depends on primitive methods and rain steams which make it vulnerable to unfavorable changes in climatic parameters such as temperature rise, and draught. Evidences that could be associated with climate change have already started appearing in Yemen. Over the last decade, the annual average temperature over the country has been noticeably increasing. Yemen has experienced frequent droughts in recent decades which caused food shortages and famine, and destruction of infrastructure and livelihoods. The coastline of Yemen is more than 2300 kilometers long which will likely be affected due to the projected climate change‐induced sea level rise. The spread of malaria into highland areas which have never been experienced before, loss of biodiversity, declining agricultural productivity of key cereal food crops have also been observed. Studies indicate that the projected changes in current climate and its variability would have serious implications on our natural resources, economy and welfare. The recent floods and frequent droughts which are compounding the already challenged human development in the country have also been noticeable. As a Least Developed Country (LDC), Yemen is highly vulnerable to climate change‐related impacts such as drought, extreme flooding, pests, and sudden disease outbreaks, changes of rainfall patterns, increased storm frequency/severity and sea level rise. Although Yemen is not contributing a lot to GHG emissions, it is, on the other hand, highly vulnerable to climate change‐related impacts. Yemen’s historical and current emissions are evidently trivial compared to GHGs emissions from developed countries. On the other hand, the potential impact of climate change on the development in Yemen is expected to make the current sustainability challenges further complicated. With external support, Yemen has initiated fundamental steps to integrate climate change considerations at policy levels. The National Capacity Self Assessment (NCSA) was conducted and national capacities for implementing the commitments under the UNFCCC were identified. Under the Kyoto Protocol, the Clean Development Mechanism (CDM) has been institutionalized, and potentiality promoted. The National Adaptation Programme of Action (NAPA) was prepared, and as a part
iv
of its commitment under the UNFCCC, Yemen has submitted the First National Communication (INC), and this Second National Communication (SNC) will consequently be submitted. The National Strategy for Climate Change Resilience under the Pilot Programme for Climate Resilience (PPCR) has been prepared, and implementation steps already initiated. Climate change is in the process to be mainstreamed into key developmental and sectoral policies including agriculture, water, and fishery sector development strategies. Yemen requires enormous adaptation investments to be adjusted for climate change impacts besides making transition towards low‐emission economic development paths. However, as a Least Developed Country (LDC), Yemen has only limited resources and capacities while experiencing tremendous development challenges. It is unlikely for Yemen with the existing capacities and resources to build up adequate community resilience to project climate change impact. As a party to the UNFCCC, Yemen is willing to contribute to the achievement of the ultimate objective of the Convention despite its low contribution to the global GHG emissions. There is a set of potential mitigation options/ opportunities, which could meet both objectives of socio‐economic development and climate protection. With sufficient support, Yemen for example could contribute to GHG mitigation by perusing renewable, efficient, and clean energy technologies. Ar cles 4 and 12 of the UNFCCC call upon all par es of the Conven on to prepare na onal communications to describe inventories of greenhouse gas emissions and to reduce emissions as well as adapt to potential impacts of climate change. This report represents the second formal communication of Yemen as required under the Convention. The report contains the information required by the UNFCCC form Non‐Annex I Parties as well as a good description of the situation of the country and a framework data that can serve as a basis for future studies on climate change. The report also reflects capacity building needs to implement Yemen’s commitments under the Convention. It is an honor and a great pleasure for us to present, on behalf of the Government of Yemen, the Second National Communication of Yemen to the Conference of Parties through the secretariat of the UNFCCC. Name: Dr. Khalid Al‐Shibani Title: EPA Chairman Environmental Protection Authority Sana’a, Yemen

v
Table of Contents Page
Foreword ........................................................................................................................................ iii Table of Contents……………………………………………………………………………………………………………………….v List of Tables……………………………………………………………………………………………………………………….……vii List of Figures………………………………………………………………………………………………………………………....viii Abbreviations………………………………………………………………………………………………………………….………..ix Contributers………………………………………………………………………………………………………………….…………..xi Excutive Summary…………………………………………………………………………………………………….……………..xii
Chapter 1 National Circumstances .................................................................................................................. 1 1.1 Geography & Topography .......................................................................................... 2 1.2 Climate ....................................................................................................................... 2 1.3 Population .................................................................................................................. 3 1.4 Governance ................................................................................................................ 3 1.5 Economy ..................................................................................................................... 5 1.6 Public Health .............................................................................................................. 6 1.7 Education ................................................................................................................... 6 1.8 Water Supply and Demand ........................................................................................ 7 1.9 Agriculture and Land Use ........................................................................................... 8 1.10 Energy ........................................................................................................................ 9 1.11 Transportation ......................................................................................................... 10 1.12 Climate Change Institutional Arrangements ........................................................... 10 1.13 Development Challenges ......................................................................................... 11 List of References……………………………………………………………………………………………………………12
Chapter 2 Greenhouse Gas Inventory ........................................................................................................... 13 2.1 Methodology ............................................................................................................ 14 2.2 Total GHG Emissions ................................................................................................ 16 2.3 GHG Emission Trends ............................................................................................... 18 2.4 Energy ...................................................................................................................... 21 2.5 Industrial Processes and Other Product Use ........................................................... 24 2.6 Agriculture ............................................................................................................... 25 2.7 Land Use, Land Use Change and Forestry ................................................................ 26 2.8 Waste Sector ............................................................................................................ 27 2.9 Emissions of PFCs, HFCs, and SF6 ............................................................................. 28 2.10 Uncertainty Assessment .......................................................................................... 29 List of References……………………………………………………………………………………………………………31
Chapter 3 Vulnerability and Adaptation ........................................................................................................ 32 3.1 Introduction ............................................................................................................. 33 3.2 Water Resources pilot V&A Sstudy: The case of Wadi Surdud drainage basin ....... 34 3.3 Coastal Zone Pilot V&A study: The Case of Aden Governorate ............................... 40 3.4 Agriculture pilot V&A studies: The Cases of Sorghum and Wheat .......................... 46 List of References ..................................................................................................................... 54

vi
Chapter 4 Greenhouse Gas Mitigation .......................................................................................................... 55 4.1 National Context for GHG Mitigation Activities....................................................... 56 4.2 Potential for GHG Emission Reductions ................................................................... 60 4.3 Reforms to Promote Sustainable Energy Use .......................................................... 63 List of References ..................................................................................................................... 65
Chapter 5 Constraints, Gaps and Needs……………………………………………………………………………….................... 66
5.1 Constraints………………………………………………..…………………………………………………………67 5.2 Gaps….................................................................................................................68 5.3 Needs………………………………………………….……………….………………………………………..…….68
Appendix
A Stakeholder Questionnaire ‐ Water V&A Pilot Study

vii
List of Tables
Page
Table 1‐1 Groundwater level declines in Yemen………………………….………………………………… 7
Table 2‐1 Total GHG Emissions in Yemen……………………………………………………………………… 16
Table 2.2 Sectoral CO2 Emission…………………………………………………………………………………… 18
Table 2‐3 Trends of Total GHG Emissions……………………………………………………………………… 19
Table 2.4 GHG Emissions for Energy Sector …………………………………………………………………. 20
Table 2‐5 Es mated Energy Demand in Yemen……………………………………………………………. 22
Table 2‐6 GHG Emissions from Energy Use…………………………………………………………………… 23
Table 2‐7 GHG Emissions from Industrial Activity……………….……………………….………………. 24
Table 2‐8 GHG Emissions from Agricultural Activity……………………………………………………… 25
Table 2‐9 GHG Emissions from LULUCF ac vity……………………………………………………………. 26
Table 2‐10 GHG Emissions from Waste Management Ac vity……………………………………… 27
Table 2‐11 Uncertainty Assessment of GHG Inventory…………………………………………………. 30
Table 3‐1 Sea Level Rise Scenarios for Aden Governorate……………………………………………. 43
Table 4‐1 Renewable Resource Potential and Installed Fossil Capacity ……………….………. 59
Table 4‐2 Predicted Reduction in GHG Emissions: Mitigation Scenario vs. Baseline
Scenario for Yemen by Source ……………………………………………..……………………….…….……….… 62
Table 4‐3 Predicted Reduc on in GHG Emissions: Mi ga on Scenario vs. Baseline
Scenario for Yemen by Sector ……………………………………………..……………………….…….……….… 62

viii
List of Figures
Figure 1‐ 1 Yemen’s Regional Context Geography & Topography…………………………………. 2
Figure 1‐2 Yemen’s agro‐climatic zones………………………………………………………………………… 2
Figure 1‐3 Popula on Trends in the Arabian Peninsula ………………………………………………… 3
Figure 1 4 Administra ve map of Yemen……………………………………………………………………… 4
Figure 1‐5 Trends in Gross Domes c Product (GDP) in Yemen, 2005‐2009……………………. 4
Figure 0‐6: GDP in Yemen, 2005 …………………………………………………………………………………… 5
Figure 1‐6 Causes of Death for Children under Five………………………………………………………. 6
Figure 1‐7 Government Spending on Educa on, and Literacy Rate………………………………. 6
Figure 1‐8 Crude Oil Produc on Trends in Yemen………………………………………………………… 9
Figure 2‐1 Sectoral breakdown of Yemen’s total GHG emissions………………………………….. 17
Figure 2‐2 Distribu on of GHG Emissions across Gases………………………………………………… 17
Figure 2‐3 The Trend of Sector Contribu on of GHG Emissions……………………………………. 21
Figure 2‐4 Energy Subsector Contribu on of GHG Emission…………………………………………. 23
Figure 2‐5 Agriculture GHG Emissions by Gases…………………………………………………………… 25
Figure 2‐6 Breakdown of Agriculture GHG Emissions……………………………………………………. 26
Figure 3‐1 Case Study Area of Water Resource V&A Assessment…………………………………. 34
Figure 3‐2 Surdud Drainage Basin ………………………………………………………………………………… 34
Figure 3‐3 Distribution of Groundwater Boreholes in Wadi Surdud Basis ……………………. 35
Figure 3‐4 Aden Governorate...……………………………………………………………………………………… 40
Figure 3‐5 Highly Populated Districts in Aden Governorates ………………………………………… 43
Figure 3‐6 Map of Sieyoun……………………………………………………………………………………………. 47
Figure 3‐7 Map of Al‐Hodeida governorate………………………………………………………………….. 47
Figure 3‐8 Map of Al‐Mahweet‐Shibam………………………………………………………………………… 48
Figure 3‐9 Regional Climate change Scenarios‐Agriculture Study………………………………… 50
Figure 4‐1 Forecasts of CO2‐eq Emissions of BAU and Mitigation Scenarios…………………. 63

ix
Abbreviations
BAU Business as Usual CO2 Carbon dioxide CO Carbon monoxide cm Centimeter CD Charter Datum CDM Clean Development Mechanism CO2‐eq CO2‐equivalent CSP Concentrated Solar Power CoP Conference of Parties DIVA Dynamic Interactive Vulnerability Assessment EIA Energy Information Administration EPC Environment Protection Council EPA Environmental Protection Authority ET Evapotranspiration FAO Food and Agriculture Organization 4AR Fourth Assessment Report GAREWS General Authority for Rural Electrification and Water Supply GIS Geographic Information Systems GCM Global Clime Model GEF Global Environment Facility GWP Global Warming Potential GHG Green House Gas SF6 Hexafluoride HHT Highest High Tide HFCs Hydrofluorocarbons INC Initial National Communication ICZM Integrated Coastal Zone Management IPCC Intergovernmental Panel on Climate Change IFAD International Fund for Agricultural Development IMF International Monitory Fund LULUCF Land Use, Land Use Change and Forestry LDC Least Developed Country LNG Liquefied Petroleum Gas ECHAM3TR MAX Plan Institute MSL Mean Sea Level MW Mega Watt m Meter CH4 Methane MENA Middle East and North Africa MDGs Millennium Development Goals MCM Million Cubic Meters MOE Ministry of Electricity MoPIC Ministry of Planning and International Cooperation MoWE Ministry of Water and Environment

x
ACA‐WEAP Multi Criteria Analysis‐ Water Evaluation and Planning Programme NAPA National Adaptation Programme of Action NCSA National Capacity Self Assessment DPPR National Plan for Development and Poverty Reduction NWRA National Water Resources Agency NWSSIP National Water Sector Strategy and Investment Program NIR Net Irrigations Requirements NCAP Netherlands Climate Assistant Programme N2O Nitrous oxide NMVOC Non‐methane volatile organic compounds ODA Official Development Assistance OSU Oregon State University model OECD Organization for Economic Co‐operation and Development OPEC Organization of the Petroleum Exporting Countries NOx Oxides of nitrogen PRA Participatory Rural Appraisal PFCs Perfluorocarbons PPCR Pilot Programme for Climate Resilience PEC Public Electricity Corporation
A Regional Organization for the Conservation of the Environment of the Red Sea and Gulf of Aden SLR Seal Level Rise SNC Second National Communication SO2 Sulphur dioxide UKHI U.K Meteorological Office High Resolution General Circulation UNFCCC United Nation Framework Convention on Climate Change UNCED United Nations Conference on Environment and Development V&A Vulnerability & Adaptation WEAP Water Evaluation and Planning Programme

xi
Contributors
Coordinator of the Second National Communication (SNC) Project Anwar A. Noaman Environmental Protection Authority (EPA) National Greenhouse Gases Inventory Team Team Leader: Tawfic Abdulatif Sana'a University Energy Mitigation Assessment Option Team Team Leader: Tawfic Sufian Sana'a University Climate Change Impact and Adaptation Assessment on Agricultural Production Team Team Leader: Omer Bafadhal Agricultural Research and Extension Authority Climate Change Impact and Adaptation Assessment on Coastal Zone Team Team Leader: Mohammed Abubakr Sana'a University Climate Change Impact on Water Resources of Wadi Surdud Leader: Saif Alhakimi Sana'a University
AKNOWLEDGEMENTS
The preparation of the Second National Communication was funded by the GEF; through its implementing agency, the United Nation Development Programme and their support are gratefully acknowledged. In addition, wero would like to acknowledge the technical support provided by the UNDPin finalizing this report. Also special thanks go to Dr. Saif Alhakim and Ali Adimi, and Dr. Amin Alhakimi for extended cooperation. We would like to extend thanks and appreciation to all of those whose efforts contributed to this report but their names are not mentioned.

xii
Executive Summary The international community adopted the United Nations Framework Convention on Climate Change (UNFCCC) at United Nations Conference on Environment and Development (UNCED) in 1992 held in Rio de Janeiro to combat anthropogenic climate change. Yemen ra fied the UNFCCC in 1996. As per Ar cle 4, paragraph 1, and Ar cle 12, paragraph 1 of the UNFCCC, the Government of Yemen is committed to develop, and periodically update, publish and prepare national inventories of anthropogenic emissions by sources and removal by sinks of all Greenhouse Gases (GHGs) not controlled by the Montreal protocol available to the Conference of the Parties (CoP), using comparable methodologies. In addition, the UNFCCC commits all parties to communicate information on constrains, gaps, and steps taken to implement the Convention at the national level. The Second National Communication (SNC) of Yemen to the UNFCCC has been prepared in compliance with the guidelines of the UNFCCC for the preparation of Non‐Annex I national communications. Yemen is a Non‐Annex I country under the UNFCCC on Climate Change, and it has been also ratified by the Kyoto Protocol in 2003. Yemen is also a signatory to multilateral environmental conventions on Biodiversity, Desertification, Environmental Modification, Hazardous Wastes, and Ozone Layer Protection. As a Least Developed Country (LDC), Yemen lacks adequate financial resources to implement its commitments to the Convention and to prepare its national communications to the CoP on regular basis and funding was necessarily essential for the preparation of its SNC. National Circumstances Yemen is characterized by a semi‐ to arid tropical climate that is typical of the region in which it is located. Yemen occupies an area of about 527,970 square kilometers at the southern end of the Arabian Peninsula. As of 2001, the country consists of 20 governorates and 1 municipality; the capital city of Sana’a. Yemen is one of the poorest countries in the Arab region with approximately 47% of the popula on living on less than $2/day. In 2009, Yemeni total popula on reached 22.5 million, of which 51% are male and 49% female and 71.2% of the total popula on live in rural areas. Yemen has one of the highest annual population growth rates of 3%, pu ng a lot of pressure on the limited basic infrastructure and services such like education, health and access to energy, safe drinking water and proper sanitation. Moreover, 42.8% of the popula on is under the age of 15 years old and youth popula on (15 – 24 years old) account for 23% of the total popula on. The economy is dominated by the oil sector, which accounts for 27% of the Gross Domes c Product and 70% of export revenues1. The recent steep decline in oil revenues associated with the gradual depletion of oil reserves is causing severe fiscal difficul es; with the budget deficit growing to about 10% of Gross
1 GoY Na onal Accounts, 2009

xiii
Domestic Product (GDP) in 20092. Yemen also has the lowest Official Development Assistance (ODA) of per capita at $12.7 or just 2.2% of GDP, compared to $33.4 per capita (18.7% of GDP) for other LDCs in the world. Agriculture is the backbone of Yemen’s labor economy although it accounts for just about 12.9 %of GDP. In contrast, oil is an important source of revenue for the Yemeni government, accoun ng for approximately 75% of government revenue and 85% of exports. Agriculture sector in Yemen is labeled a traditional one. It mainly depends on primitive methods and rain steams which make it vulnerable to extreme climate changes such as drought and floods. The sector also faces various challenges the most important of all is the scarcity of water resources. It absorbs almost 30% of the work force and accounts for 11.4% of GDP (current prices) in the average during the period 2001‐08. However, its exports did not exceed 1.2% of the gross non‐oil exports in 2008. Arable land is estimated at around 1.6 million hectares, of which the cul vated area is estimated at about 1.3 million hectares. The agriculture land represents 2% of the total area of Yemen. Moreover, rapidly growing popula on at the rate of 3% annually is increasing the demand of the scarce natural resources ‐ on water resources, foodstuff and other products. People exploit soil, vegetation and water without paying adequate attention to the sustainability of these resources. Unplanned expansion of urban centers in some areas exceeds the capacities of the available resources to meet new demands. It is also causing sanitation and waste management problems and putting pressure on civic/municipal services, in addition to loss of biodiversity and agricultural land. Yemen is one of the most water‐scarce countries in the world and this scarcity is exacerbated by rising temperatures, persistent drought, an expanding population and poor water management. The water sector in Yemen faces formidable challenges, and water table is declining in average by about 6‐7 meters annually due to groundwater over‐abstraction. The capital Sana’a is one of top ten water scarce cities in the word and its groundwater is being drastically depleted. The increasingly growing water crisis in Yemen has severe socio‐economic and environmental consequences including decreased agriculture productivity, reduced food security, increased conflict over resources and accelerated land degradation, and increased livelihood vulnerability. With the current weak adaptive and institutional capacity, climate change associated impacts including more frequent, and prolonged droughts under specific climatic sceneries will push livelihood vulnerability of the poor into further declines, leading to further environmental resource degradation, increased ecological scarcities, and hardship, and hence increased poverty expansion. Geographically, Yemen in general is characterized by five major ecological systems, as follows: Hot and humid coastal plain; Temperate Highlands; High Plateaus; Desert interior; and Islands. Some of Yemen’s ecological zones are confined to small areas (e.g., islands), with human communities, flora and fauna highly adapted to subsist within them. Other zones are much
2 Na onal Budget, 2011

xiv
larger (e.g., Temperate Highlands) and support the majority of the country’s agricultural production. In both cases, climate change poses major threats. Greenhouse Gas Emission Inventory An update of Yemen’s GHG inventory by sources and removal by sinks for the year of 2000 has been compiled, and the following outlines key findings:
The total GHG emissions in 2000 were es mated about 25,684 Gg CO2‐equivalent, which includes: 17,795 Gg CO2‐eq from energy; 734 Gg CO2‐eq from industrial processes; 5941Gg CO2‐eq from agriculture and 1,214 Gg from waste. However, the aforemen oned total GHG emissions exclude estimation of carbon removal by sinks. CO2 sequestration by the forestry and land use sector in 2000 amounted to about 1,501 Gg. When removals are taken into account, emission total is sequestered by 1,501 Gg CO2‐eq, resulting into net emissions of about 24,184 Gg CO2‐eq. Also, it was found that the GHG emissions which include: perfluorocarbons (PFCs); hydrofluorocarbons (HFCs); and sulfur hexafluoride (SF6) are negligible in Yemen as the products containing these gases are not produced in the country. It is clear that CO2 is accounted for the largest and dominant portion of Yemen’s GHG emissions at a share of 68.3% (17, 548 Gg CO2‐eq), followed by CH4 and N2O with shares of 17.3 % (4,432 Gg CO2 ‐eq) and 14.4% (3,704 Gg CO2‐eq) respectively. The largest share of 95.8 % (16,814 Gg CO2) of the total anthropogenic CO2 emissions in Yemen is produced in the energy sector; that is accounted for by fossil fuel combustion (mainly Mazot and Diesel) for electricity production and consumption, and road transportations (mainly Gasoline, and Diesel) with approximate share of 28.2% each. The other sectors sub‐sector contributed 22.5% (3946 Gg.) of na onal anthropogenic CO2 total emissions, while the manufacturing Industry and fugitive su b‐categories accounted for 9.8%(1711 Gg) and 7.3%(1279 Gg) respec vely. The CO2 emissions from LULUCF sectors were es mated to be around 9,856 Gg. These emissions were not included in the na onal total GHG. However if included it would be represen ng 38.4% of the na onal GHGs or 56.2% of the country CO2 emissions in 2000. These emissions were fully produced from cul va on of about 134,407 hectar of croplands. On the other hand, GHG emissions have increased by about 33%; from 19,346 Gg CO2‐equivalent in 1995 to about 25,684 Gg CO2‐equivalent in 2000, or roughly 7%/year. On a net CO2‐equivalent basis, emissions in Yemen increased almost by about 3 mes over this period, from 8,211 Gg to 24,191 Gg, or about 24% per year. Energy emissions increased in 2000 by 35% (4622 Gg CO2‐eq) against the 1995 emissions level. Over longer‐terms (1995‐2005), emissions of the “Energy ac vity category” have further increased to reach 21,351 Gg CO2‐eq in 2000. Vulnerability and Adaptation According to Ini al Na onal Communica on (INC, 2000) and Na onal Adaptation Programme of Ac on (NAPA, 2009), three sectors were iden fied as the highest vulnerable to climate

xv
change: these are: water, agriculture, and coastal areas. The SNC has carried out three thematic V&A assessment including water, agriculture, and coastal studies. The findings and conclusions of the three thematic V&A studies across the pilot areas are outlined below: Water Sector V&A (Wadi Surdud‐pilot Area)
Different levels of vulnerabilities were found across the coastal and mountainous areas of Surdud drainage basin. However, and given current patterns, the existing groundwater storage in the study area, water will be depleted within about 70 and 90 years. On the other hand, the groundwater storage in the Quaternary aquifer of the costal lower catchments is projected to likely experience further deterioration by the year of 2033. Therefore, it is concluded that water availability in the coastal lower catchment zone is relatively more vulnerable to changes in temperature and rainfall patterns compared to the mountainous upper catchment of the pilot area of Wadi Surdud.
Appropriate climate change adaptation measures were proposed to suit the context for each of the indicated areas, due to the different vulnerabilities across the coastal and mountainous areas of Surdud drainage basin. For instance, the coastal area the implementation of drip irrigation was identified as the best strategy in terms of water savings and application of water on farmlands followed by conveying irrigation water through closed conduits. As for the mountainous area of the catchment, improved efficiencies through drip irrigation and improved water distribution systems will have demonstrable effects when combined with other supporting adaptation initiatives such as water harvesting/diverting structures (e.g. dams, cisterns etc.).
Coastal Zone Pilot V&A study: The Case of Aden Governorate
Two scenarios project climate change induced Seal Level Rise (SLR) in Aden Governorate for for the years of 2020, 2050, 2080, and 2100. Rela ve to the Mean Sea Level (MSL) in 2008, Scenario #1 projected 0.04 meters, 0.14 meters, 0.24 meters, and 0.30 meters SLR in Aden for the years of 2020, 2050, 2080, and 2100 respec vely. Whereas, Scenario #2 projected higher levels of sea rise compara ve to Scenario #1; about 0.06 meters, 0.25 meters, 0.42 meters, and 0.54 meters SLR were projected in Aden for the years of 2020, 2050, 2080, and 2100 respec vely under in scenario #2. Most of Aden Governorate sandy coastal beaches, ecological systems (i.e. wetlands, and underground aquifers) are considered sensitive to the indicated accelerated SLR projections.
The indicated parts of Aden Governorate are likely projected to be exposed to the projected SLR. Because of lacking adaptive capacity including adequate protective measures, and the interaction between its sensitivity and exposure, most of Aden governorates can be classified as highly vulnerable to the projected climate change SLR. The varied adaptation strategies including for instance Integrated Coastal Zone Management (ICZM) were proposed to suit the different needs from the areas vulnerable to SLR impacts. The following highlights the various adaptation needs across the pilot area of Aden.

xvi
Agriculture Pilot V&A Studies: The cases of Sorghum and Wheat
Three scenarios were used by the agriculture V&A study including warm and dry scenario. The three scenarios have projected future changes in climatic parameters including likely temperature rise, and fluctuation in precipitation patterns in Yemen. Taking hot and dry scenario into a context, Wheat yield is projected to decline dras cally by 2030 in Sieyoun due to reliance of local farmers on improved cul vars which are extremely sensitive to hot and dry conditions.
In such a reference scenario, the impact on Wheat yields due to sensitivity, and exposure as well as lack of adaptive capacity is projected to be substantial. On the other hand, Wheat which is grown on the rain‐fed highlands of Al‐Mahweet will likely be less vulnerable in reference scenarios owning to the enormous genetic variability of indigenous varieties which more often composes relatively hot and dry‐tolerant cultivars. Having such genetic variability of Wheat, exposure to the projected climatic changes is reduced.
As such, relatively higher sensitivity but lesser exposure is expected to keep vulnerability at reasonably lower levels. Yet, rain‐fed Sorghum in Al‐Mahweet will likely be more vulnerable to the projected climatic changes due to several reasons which include plausible changes in agricultural season’s calendar, and lack of sufficient endogenous genetic variability under the reference scenarios.
In other words, although Sorghum is less sensitive, the projected high exposure will likely increase its vulnerability under the reference scenarios in which weak adaptive capacity is prevailing. Putting Sorghum exposure into context, the vulnerability of the crop in rain‐fed areas is relatively high and will likely result in severe loss of crop yields under the projected changes in rainfall, and temperature by 2030. Appropriate adaptation actions including maintaining of local crop varieties of Sorghum and Wheat, and improving drought‐resistant varieties were recommended to ensure that yield reductions are minimized particularly under the warm and dry scenario.
Greenhouse Gas Mitigation Yemen is not an industrial country, and the livelihoods of the majority of people in Yemen mainly rely on access and use of natural resources. As such, industries do not contribute much into GHG emission. The trend in GHG emissions from the industrial processes is not expected to rise significantly in Yemen over the indicated period of 2025 due to the weak socio‐economic development, and inadequate conducive governance for rapid economic growth. Nevertheless, it was noted that the energy use accounts for the majority of GHG emissions in Yemen, and expected to dominate un l 2025. For 2000, the combus on of fossil fuels in energy supply, transport, and industrial opera ons accounted for about 69% of total GHG emissions in the country. Notably, this share is significantly more than the energy use share of GHG emission in 1995 which was about 57%. More specifically, the Transport Sector; the Household Sector; and the Commercial Sector are those which consume most of the energy. They consume almost 90.58% of the total energy demand in the year 2000 and almost 94.74% of the total energy demand in the year 2025 (the Baseline Scenario). This implies that the main sources of anthropogenic GHG emissions in

xvii
Yemen are due to three sectors. Thus, such implications were considered as a basis with priority for consideration for the development of effective for Mitigation measures. Furthermore, the energy sources such as fuel wood in rural areas, and the fossil fuels such as the Mazot used in Cement Industries, and the Diesel used in other Industries, and those used the Power Sector for energy generation and consumptions were also considered for developing such effective mitigation measures. From the demand‐side perspective, household, commercial, industrial, transport, and agriculture sectors have been considered being the contributors to GHG Emission in Yemen. The most viable mitigation options recommended for consideration across these sectors are energy efficiency and fuel switching. The estimated energy demands for Yemen based on the baseline scenario over the me horizon sectors are: 201.8 Million GJ in 2000 and 201.8 Million GJ in 2025. However, the es mated energy demands for Yemen based on the developed mi ga on scenario op ons over the me horizon sectors are: 201.8 Million GJ in 2000 and 475.2 Million GJ in 2025. It can be noted that the mi ga on scenario has decreased the total demands for the Yemen to about 11% by 2025. It can be concluded that significant GHG reduction potentials are technically possible in Yemen through a reliance on indigenous energy resources and technology transfer of renewable energy and energy efficient technologies. In general, the GHG emissions in the mitigation scenario are about 14% less in 2025 than projected emissions in the baseline scenario. Cumula ve emission reduc ons over this period are over 42 million tones of CO2‐equivalent. The indicated GHG emission reduction potential if the mitigation options are taken in to account and implemented, are reasonable and encouraging. Therefore, renewable energy and energy efficiency are considered to be strategic national options for meeting future demands of energy. However, at present, renewable energies make a negligible contribution to primary energy supply. There are several types of reforms needed to improve this situation. These include strengthening institutional capacity, develop a national framework for promoting renewable energy and energy efficiency, enhancing coordination among stakeholders, and developing a sustainable national market for renewable energy. Constrains, Gaps, and Needs Yemen is not contributing a lot into the anthropogenic GHG emissions but stands highly vulnerable to climate change‐related impacts because of its fragile socio‐economic development and inadequate adaptive capacity. With the existing hindering circumstances, it is unlikely for Yemen to build up adequate climate change resilience, and ensure low‐emission development trajectories unless sufficient support has been provided to enable compliance with commitments under the UNFCCC on regular basis. Several capacity constrains have been identified, and weak governance and institutional structures are among the key ones that impedes Yemen from achieving its commitment under the UNFCCC convention. Strengthening the institutional and technical capacities in addition to promoting and enforcing of renewable energy strategy and energy efficiency are among the major capacity development needs to ensure enhanced implementation of climate change adaptation, and mitigation strategies in Yemen.

1
3. National Circumstances
National Circumstances
Chapter 1:

2
This chapter provides a description of Yemen’s national circumstances, together with an overview of its development priorities and objectives on the basis of which it will address climate change and its adverse impacts. This chapter also includes information on features of Yemen’s geography, demography, climate and economy to describe the overall national context in which climate change challenges are being addressed. 1.1 Geography & Topography Yemen is located in the Middle East, at the southern tip of the Arabian Peninsula. It is located between la tudes 12‐19° to the north and longitudes 42‐53° to the east (see Figure 1‐1). In addition to sharing a northern border with Saudi Arabia (1,458 km) and a north‐eastern border with Oman (288 km), it has a 2,200 km coastline along the Gulf of Aden, the Arabian Sea and the Red Sea and a total land mass of 527,970 square kilometers (see Figure 1‐1). Due to its strategic loca on at the entrance of the Bab el Mandeb straight, which links the Red Sea to the Indian Ocean through the Gulf of Aden, Yemen is at the center of one of the most active intercontinental shipping hubs in the world (Bifadle, 2010). Yemen’s interior is occupied by high plateaus, surrounded by hot and humid coastal plains to the west, south and east. To the north, it has a long desert border with Saudi Arabia. The temperate western highlands support the majority of the population and agricultural production. While there are no permanent rivers, the mountainous interior contains numerous river valleys that have steady flows during the winter and run dry during the summer. Yemen also includes over 200 islands, including the Kamaran and Hanish Islands, located in the Red Sea, as well as Perim Island, in the Bab el‐Mandeb Straight. 1.2 Climate While Yemen is characterized by a semi‐arid to arid tropical climate that is typical of the region in which it is located, topographical variance influences its climate. While there are 14 agro‐climatic zones (see Figure 1‐2), there are three major climatic sub‐regions: the coastal plains, the western highlands, and the northeastern desert plain. Average annual temperatures in the western coastal plains are between 24°C and 35°C although temperatures in excess of 50°C are common. Humidity ranges from 50‐70%,
Figure 3‐1 Yemen’s Regional Context Geography &
Topography (source: CCMEP)
Figure 3‐2 Yemen’s Agro‐climatic Zones (source: EPA)

3
and rainfall averages between 10‐100 mm/yr. The northeastern desert plain has an average temperature range of 19‐33° C, low humidity, and rainfall averages between 50‐100 mm/year. In contrast, the temperate western highlands have an annual average temperature range of between 10°C and 22°C and enjoy a cool, dry winter with temperatures occasionally reaching below freezing. In this region average rainfall ranges between 100‐600 mm/yr except for certain areas, such Ibb city and Sana’a, which can average as much as 1,000 mm/year (Bafadle, 2010). Seasons are determined by monsoon climate patterns. Winter coincides with the northeast monsoon known as “Gilal” (December‐March) and the summer season coincides with the southwest monsoon known as “Hagai” (June‐September). The spring (April‐May) and fall (October‐November) seasons are considered transition periods that separate monsoon seasons. Recent studies indicate that climatic patterns are gradually changing. Mean annual temperature has increased by 1.8°C since 1960, exceeding the global average rate of increase. Precipita ons have also been decreasing at a rate of 1.2 mm per month per decade since 1960 and are expected to continue late into this century (McSweeney, et al, 2008). 1.3 Population In 2009, the Yemeni popula on reached 23.6 million, making Yemen the second most populous country in the Arabian Peninsula, just behind Saudi Arabia as shown in Figure 1‐3.
The population is growing at about a rate of 3% per year, one of the highest in the world. As a result, the population is young, with 44% being below 15 years of age, over 54% being between 15 and 64 years of age, and 2% living past 65 (World Bank Development Indicators). There is a near 50‐50 gender distribu on and the population is mostly Arabic. The population is also mostly rural, with only 30% living in major urban areas such as
the capital Sana’a (about 2.4 million es mated in 2005), Taiz (0.6 million), and Al‐Hodeida (0.5 million). During recent years the country has experienced a growing immigrant community of South Asians, Europeans and Africans. In 2007, there were an es mated 300,000 Somalis refugees residing in Yemen. 1.4 Governance In 1990, the Republic of Yemen was created through the unifica on of the Yemen Arab Republic in the North and the People’s Democratic Republic of Yemen in the South. These entities themselves were recent nation states, with North Yemen gaining independence from the O oman Empire in 1918 and South Yemen seceding from Bri sh control in 1967.
Figure 3‐3 Population Trends in the Arabian Peninsula (source: World Bank)

4
Since unifica on in 1990, the Republic of Yemen has been a democra c republic, making it the only democratic state in the Arabian Peninsula. The President is head of state and the Prime Minister (who is appointed by the President) is head of government.
As of 2001, Yemen consists of 20 governorates and 1 municipality; the capital city of Sana’a
(Central Statistical Organization of Yemen, 2005). The governorates are organized into a total of 333 districts, which are then divided into 2,210 sub‐districts and then into 38,284 villages.
Figure 1‐4 shows an administra ve map of the country which identifies the total number of governorates. All laws are based on a combination of sharia (Islamic law), old Egyptian laws, and Napoleonic tradition. The legislature is bicameral and consists of an elected 301‐seat House of Representatives (Parliament) and an appointed Shura Council. The judicial system follows a three‐tiered structure in which the courts of first instance oversee all cases, the next level is the court of appeal, and the highest court is the Supreme Court, which settles jurisdiction disputes between lower courts, hears cases brought against government
officials, acts as the final court of appeal for all lower court decisions, and determines the constitutionality of laws and regulations. In 2007, a number of reforms were enacted to democratize the voting process and empower local governing bodies. The Local Authority Law called for locally elected district and governorate councils, which were previously controlled by government‐appointed governors. In 2008, governors were directly elected for the first time. Tribes play a significant role in the Yemeni political system. Rural regions are controlled by tribal confederations which act as quasi‐autonomous sub‐states and enjoy a considerable amount of influence. The government engages tribal associations through an extensive set of formal and informal political networks.
Figure 3‐5 GDP Trends in Yemen, 2005‐2009 (Source: World Bank)
Figure 3‐4 Administrative Map of Yemen

5
1.5 Economy Yemen is one of the poorest countries in the Arab region. In 2005, approximately 47% of the popula on lived on less than $2.00/day. Another large por on of the popula on lives marginally above the poverty line but is acutely vulnerable to minor economic or natural shocks. The majority of the labor force is engaged by the agricultural sector, while oil, though the largest sector in the Yemeni economy, generates relatively few jobs (IFAD, 2007). In the late 1990s, the country experienced a period of rapid growth driven by its expanding oil sector. However, growth peaked around 2008 and has since leveled out (see Figure 1‐5). In 2009, the GDP was approximately $26.4 billion while the budget deficit was 10% of GDP (World Bank Development Indicators). Expenditures continue to outpace revenue, preventing the government from providing essential social services and addressing widespread poverty. There are several factors contributing to Yemen’s fragile economic profile. The most important is the increasing demand for product import. Outside of fuel, Yemen imports every major commodity, including food, livestock, processed materials, machinery and transport equipment. Even as GDP has been declining, demand has been rising with total imports increasing from US$4.7 billion in 2005 to US$9.33 billion in 2008. Another factor is falling oil revenues. In 2006, oil accounted for 27% of GDP and 90% of merchandise exports and was the government’s main source of revenue (World Bank, 2010). Over the last decade, Yemen has steadily been depleting its oil reserves, which has adversely impacted the economy. This sharp decline has been somewhat offset by a combination of foreign aid and economic reforms designed to diversify the economy away from oil. For the period of 2007‐2010, Yemen’s development partners pledged US$5 billion in grants and concessional loans to fund projects in Yemen’s five‐year Development Plan for Poverty Reduc on (2006‐2010) (DPPR). As of December 2007, 70% of the pledged funds had been allocated. The DPPR is designed to stimulate growth in non‐oil sectors, such as agriculture, fisheries, natural gas and tourism. Between 2004 and 2008, Yemen averaged about a 5.5%/yr growth rate in non‐hydrocarbon sectors (IMF, 2010). This growth was driven by expanding agriculture, urban services and construc on. In 2005 agriculture accounted for 14% of GDP, services accounted at 45%, followed by industry & manufacturing at 14% (see Figure 1‐6). A more diversified economy is intended to help the DPPR meet its overarching goal of 7% GDP growth rate per year.
Figure 3‐6: GDP in Yemen, 2005 (Source: World Bank)

6
1.6 Public Health Compared to other countries in the Middle East & North Africa region, Yemen has poor healthcare indicators. Life expectancy is approximately 62, with less than 4% of the popula on living past 64. Infant mortality rate is 107 per 1000 live births, maternal mortality rate is 350 per 100,000 live births, and undernourishment is a pervasive problem (World Health Organization, 2008). As shown in Figure 1‐8, causes of death for children under five include some readily treatable conditions (e.g., diarrhea). Health care access is a major issue particularly among rural popula ons. While 70% of the Yemeni popula on lives in rural areas, only 25% of the rural population receives health care, compared to 80% of the urban popula on (World Bank, 2009; World Health Organiza on, 2008). From 1990 to 2003, primary health care units increased from 916 to 2,048, health centers increased from 298 to 543, and district hospitals and centers increased from 168 to 232 (World Health Organization, date not given). However, public healthcare expenditures accounted for just 1.5% of the GDP in 2008 (World Bank Development Indicators) and the per capita expenditure for health care is low compared with other Middle East and North Africa (MENA) countries. Emergency services, such as blood banks and ambulance services do not exist. Available facilities suffer from medical staff shortages and insufficient funding, rendering them unable to provide adequate services. In 2004, there were 0.3 physicians available per 1,000 persons (World Bank Development Indicators). 1.7 Education
Yemeni laws provide for universal, compulsory, free educa on for children ages 6 – 15. However, compulsory education is not enforced and school fees act as a deterrent among Yemen’s impoverished population. In addition, there is an overall shortage of school facilities, educational materials, and teaching faculty. As a result, Yemen has an overall adult literacy rate of 61%, on par with the 62% average for low‐income countries. Illiteracy is par cularly prevalent among the adult female popula on, which has a 43% literacy rate compared to 79% for adult males (see Figure 1‐8).
Figure 1‐7: Causes of Death for Children under Five (source: WHO, 2008)
Figure 1‐8 Government Spending on Education, and Literacy Rate (Source: World
Bank, 2008 )

7
In 2004, the World Bank approved a US$121 million, six‐year project to raise the quality of basic education in grades one through nine. With this funding, classroom facilities will be expanded and upgraded, educational materials improved, and the Ministry of Education’s ins tu onal capacity will be strengthened. In addi on, in March 2008, the World Bank approved a US$103 million, seven‐year project to improve gender equity in secondary education, focusing on girls in rural areas. Under this program, school facilities will be upgraded to provide learning equipment as well as school community grants. 1.8 Water Supply and Demand
Water is a critical issue in Yemen; it is one of the most water‐scarce countries in the world. Water scarcity is exacerbated by rising temperatures, persistent drought, an expanding population and poor water management. One third of the country does not have access to safe water supplies (World Bank). Due to the expansion of groundwater pumping and overconsumption, water supply and
demand patterns are becoming critical. The National Water Resources Agency (NWRA) estimates that the sustainable rate of water use in Yemen is about 2,500 Mm³/year for the country as a whole. In contrast, water is extracted at a rate of about 3,400 Mm³/year, leaving an annual deficit of about 900 Mm³ of water (Al‐Asbahi et al, 2005). Moreover, the situation is worsening with every year. The situation is particularly critical in certain basins in the western part of the country where the risk of total depletion of available groundwater within the next generation is a conclusion of several recent studies.
Agriculture accounts for most of water consump on, about 90%, with the remainder being divided between the industrial and residen al. Of Yemen’s nearly 1.6 million hectares of cul vated land approximately 45% relies on rainfall while 55% is irrigated by groundwater (67%) or season water floods i.e. “spate irriga on” (23%). Spate irriga on systems feed 120‐150,000 ha in the low lands and there are approximately 800 dams for rainfall water harvesting in the highlands. (Al‐Asbahi et al, 2005). At present, the 900 Mm³/yr gap between the current rate of water use and the sustainable rate of water use is overcome by extracting water from fossil water supplies in deep aquifers. However, the present rate of extraction is greatly exceeding recharge rates. Ground water surfaces are declining at between 1 and 8 meters per year, depending on loca on (see Table 1‐9).
Table 3‐1 Averages of Groundwater Level
Decline in Yemen (source: NWRA)
Groundwater
basin
Decline Level (meters
per year)
Sana’a 6.0‐8.0
Ta’iz 1.5‐2.0
Amran 3.0
Sa’adah 5.0‐6.0
Rada’a 5.0
Tuban‐Abyan .02‐1.0
Tihama 1.0‐3.0

8
Additionally, the over exploitation of groundwater aquifers causes water quality to deteriorate, a condition that is particularly evident in salt water intrusion in the coastal plains. In the north side of country where extraction rates are extremely high, some of the basins are so depleted that agricultural activities have been curtailed and in some cases stopped. The National Water Resource Authority oversees water resources management and law enforcement in Yemen. In 2003, it created the Ministry of Water and Environment and since then has increasingly focused on developing policies and legislation that target improving water resource management. In 2002, Parliament approved the new Water Law followed by the National Water Sector Strategy and Investment Program (NWSSIP) in 2004. Recent years have seen greater regulation of well drilling and illegal well drilling is subject to increasingly strict enforcement. The Land and Water Conservation Project is a national project that is improving Yemen’s irrigation techniques (current irrigation efficiency is low, around 30‐40%). By reducing irriga on water use through pipe delivery and localized irriga on systems, the Land Water Conservation Project (LWCP) has already saved about 20 million m3/year (MoWE, 2006). 1.9 Agriculture and Land Use Outside of oil, agriculture is the backbone of Yemen’s economy; although it accounted for just 12.9% of GDP in 2005, the sector employs more than half of the ac ve labor force (World Bank Development Indicators). Agricultural production is concentrated in the western highlands and is supported mainly by rainfall (45%) and irriga on (55%). Crops include cereals, fodder, fruits, vegetables, and legumes. In addition, qat, a mild locally legal narco c, is widely cul vated. Studies indicate that the produc on of qat accounts for 8% of GDP and consumes 30% of irrigated water. Around 20 million hectares is designated grazing land and is grazed by about 14 million sheep and 1.4 million ca le. In addi on the country has considerable fishery resources (IFAD, 2007). The agricultural system is dominated by small farm holdings that are one hectare on average. Production is typified by the terrace system, a traditional Yemeni system of soil conservation and water harvesting where crops are planted in the rainy season (June‐August), after which livestock are allowed to graze. However, the terrace system is slowly deteriorating and agricultural productivity is low for both regional and international standards (1 ton/hectare for cereals) (FAO, no date provided). While the DPPR aims to expand the agricultural sector, this is challenged by the increasing frequency of drought, as well as deforestation, soil erosion, water scarcity and low agricultural productivity. Despite agriculture’s strong presence in the national economy, Yemen is a food‐deficient country that grows less than a third of its food needs. The country has self‐sufficiency rates of 16% for wheat and 50% for other cereals. Nearly one third of the popula on is food insecure. Yemen imports most food items at $US2billion/year (FAO, 2008). Given the country’s dependence on food imports, declining oil revenues, and overall economic fragility, food security will remain a future concern.

9
1.10 Energy Despite its location in the oil rich Arabian Peninsula, Yemen has limited oil reserves and does not belong to the Organiza on of the Petroleum Expor ng Countries (OPEC). As of 2010, the country had proven crude oil reserves of 3 billion barrels, down from 4.4 billion barrels in 2006. Produc on fell from about 440,000 barrels per day (bbl/day) in 2001 and is expected to drop to 260,000 bbl/day in 2010 (EIA, 2010) (see Figure 1‐9). Oil is an important source of revenue for the Yemeni government. It consistently accounts for approximately 75% of government revenue and 85% of exports. In 2009, the government share of oil exports was 56.9 million bbl/day, earning the government US$3.5 billion (EIA, 2010). Yemen’s main oil export markets are China and India, with Asian countries accoun ng for 76% of Yemeni exports in 2008. Yemen is a small oil producing country and does not belong to the Organization of the Petroleum Exporting Countries (OPEC) Oil production in Yemen is concentrated on five oil
regions which includes: Jannah and Iyad in central Yemen; Shabwa and Masila in the south and Ma’rib; and Jawf in the north. To offset declining production, exploration activities have been intensified along the Saudi Arabian border and in offshore locations. To date, very little additional oil resources have been discovered and efforts to explore offshore areas have been hampered by escalating Somali piracy around the Gulf of Aden. On the other hand, Yemen has two Oil Refineries which are actively refining crude Oil to its byproducts. One of these is in Aden with a refining capacity of 110,000bbl/day and the other in Marib with a refining capacity of 10,000bbl/day
In addition to oil, there are limited natural gas reserves. As of 2010, there was a total of 16.9 trillion cubic feet (Tcf) of proven natural gas reserves. Reserves are located in the Marib‐Jawf fields. Falling oil production is expected to be partially offset by increasing natural gas explora on and produc on. In 2009, an es mated 365 billion cubic feet (Bcf) was produced of which 36.5 Bcf was consumed domestically. Much investment in coming years is expected to be directed to the country's natural gas infrastructure. For example, the Yemen Gas City Company is planning a US$20 billion industrial city in Hodiedah, one of the largest construction projects in Yemen’s history. The industrial city will be powered by gas and will house petrochemical and heavy manufacturing plants, as well as cement plants and power stations.
Figure 31‐9 Crude Oil Production Trends in Yemen (Source: EIA)

10
Regarding electricity production, the Public Electricity Corporation (PEC) is the sole national public utility with a mandate for the generation, transmission, distribution and sale of electricity in the country. In 2002, the General Authority for Rural Electrifica on and Water Supply (GAREWS) was dismantled and the rural electrification activities of GAREWS were merged with PEC. The bulk of PEC’s activities are concentrated around the three main systems of Sana’a (Northern interconnected system), Aden and Hadramawt. Areas away from PEC’s network are supplied mostly by diesel engine driven generators, either owned by PEC (comprising PEC’s isolated systems), by cooperatives or by the private sector. Yemen has the lowest population access to electricity in the region in which it is located, with only 40% of the total popula on having access – compared to the regional average of about 85%. Of the country’s rural popula on (72% of the total), only 23% have access to electricity; this compares unfavorably with 85% of the urban popula on (28% of the total) that have access to electricity. Of the rural population with access to electricity, only one‐half are connected to the national grid system and the rest are estimated to have some access from other sources, typically a diesel generator that operates only a few hours in the evening. 1.11 Transportation
In 2005, there were about 71,300 km of roads of which only 8.7% (6,200km) were paved (World Bank Development Indicators). Roads connecting the capital of Sana’a with neighboring Taizz and Al Hudaydah are in good condition and support intercity bus services. However, roads in the south are in poor condition and there is no railway system. Efforts are underway to develop Yemen’s limited transportation infrastructure. The Gulf Cooperation Council is developing a regional rail network that will link Yemen and Oman. In 2005, the World Bank approved a five‐year, US$50 million project to upgrade approximately 200 kilometers of intermediate rural roads and approximately 75 kilometers of village roads. Plans are well advanced to build an es mated US$1.6 billion highway linking Aden in the south and Amran in the north. The road will include more than 10 tunnels and halve the travel time between the southern seacoast and the northern border with Saudi Arabia. Yemen is home to four international airports and strategic shipping centers. Main ports are Aden, Al Hudaydah, Al Mukalla, and Mocha; Aden is the primary port. In addition, Ras Isa serves as the loading point for oil exports, and a small amount of cargo passes through Nishtun. 1.12 Climate Change Institutional Arrangements
Following unifica on in 1990, the government created the Environment Protection Council (EPC) an inter‐ministerial council which manages the nation's environment. In 2003, the Environment Protection Authority (EPA) was established to replace the EPC with a broader mandate covering setup of environmental policies and strategies, enforces standards for air and water pollution and land degradation, monitors environment, implement environment related activities, programs and projects, and coordinates national, regional and

11
international action on environment protection in Yemen. As the UNFCCC Operational Focal Point, EPA is responsible for all climate change related activities. Yemen is also a Non‐Annex I country under the United Nations Framework Convention on Climate Change, ra fied it in 1996 and ratified the Kyoto Protocol in 2003, obtaining access to development funding through Kyoto’s Clean Development Mechanism. Yemen is also signatory to multilateral environmental conventions on Biodiversity, Desertification, Environmental Modification, Hazardous Wastes, and Ozone Layer Protection. As a Least Developed Country (LDC), Yemen lacks adequate financial resources to implement its commitments to the Convention and to prepare its national communications to the CoP, Yemen had requested the Global Environment Facility (GEF) to provide financial support for the preparation of its Second National Communication (SNC). Under the project entitled as "Enabling Yemen to prepare its Second National Communication on climate change”, Yemen was provided with financial support by the Global Environment Facility (GEF) through the United Nations Development Program, to carry out update of GHG inventory, update of GHG abatement analysis, vulnerability assessment and adaptation analysis for agriculture (selected crops in targeted areas, Bajil, Syon and Shibam)), vulnerability assessment and adaptation analysis for water resources (targeted site, Wadi Surdud), and vulnerability assessment and adaptation analysis for coastal zone ( targeted site, Aden city).
Under the project Netherlands Climate Assistant Programme (NCAP), Yemen also, received financial support from the Netherlands to carry out three case studies on adapting to water scarcity for Yemen’s vulnerable communities (Sana’a Basin, Sadah Basin and Aden city). Findings of the three case studies were also incorporated into the SNC report. In general National Communications (NC) has enhanced awareness raising about climate change in Yemen. In addition, NC provided a source of knowledge on Yemen’s GHG emissions across sectors, besides outlining vulnerability to climate change impacts. Additionally, NC served as a policy framework for national GHG mitigation and long‐term adaptation. 1.13 Development Challenges Yemen has experienced significant growth since the country’s unifica on in 1990. However, further development is challenged by widespread poverty, poor infrastructure, water and food scarcity, illiteracy and an expanding population. Combined, these challenges place Yemen near the bottom of the Human Development Index. In the near term, national priorities are focused on improving infrastructure, social services, and governance systems. Over the long term, the government intends to continue to diversify the economy away from oil as well as address water scarcity through enhanced irrigation and efficiency practices. On the other hand, Yemen is one of the countries which have been affected by the recent poli cal unrest in the region since the last quarter of 2010. The socio‐economic, and security situations has deteriorated further due to the political unrest experienced by the country leading to additional human development challenges.

12
List of References
Al‐Asbahi, Qahtan. 2005. Water Resources Information in Yemen. National Integrated Water Resources Management Program. Presented at the IWG‐Env, International Work Session on Water Sta s cs, Vienna, June 20‐22 2005
Al‐Asbahi, Qahtan. Integrated Water Resources Management Program Presentation. National Water Resources Authority
Bafadle, Omar. 2010. A Study on Agriculture Vulnerability and Adaptation to Climate Change in the Republic of Yemen. Environment Protection Authority, Republic of Yemen.
McSweeney, New, and Lizcano. 2008. UNDP Climate Change Country Profiles: Yemen. School of Geography and Environment, University of Oxford and Tyndall Centre for Climate Change Research.
IFAD. 2007. Republic of Yemen: Country Strategic Opportunities Programme.
Republic of Yemen, Central Sta s cal Organisa on. 2005. Sta s c Yearbook of Yemen 2005: General Population Housing and Establishment Census.
Republic of Yemen, Ministry of Water and Environment. 2006. A Partnership Approach to Sustainable Groundwater Management in Yemen. Presented at 4WWF Mexico, March 2006.
U.S. Energy Informa on Administra on. 2010. Country Analysis Briefs: Yemen.
World Bank. 2010. Yemen Country Brief.
World Health Organization, Regional Office for the East Mediterranean. Yemen: Trade in Health Related Services and GATS. h p://gis.emro.who.int/HealthSystemObservatory/PDF/Trade%20And%20Health%20Services/Yemen.pdf

13
4. Greenhouse Gas Inventory
National Greenhouse Gas Inventory
Chapter 2:

14
This chapter presents estimates of national anthropogenic greenhouse gas emissions by sources and removal by sinks for the year of 2000 besides the me series for 1995‐2000 following the new guidelines adopted by CoP. The GHG inventory exercise was carried out to estimate the following emissions which include: carbon dioxide (CO2), methane (CH4), nitrous oxide (N2O), carbon monoxide (CO), and oxides of nitrogen (NOx), non‐methane volatile organic compounds (NMVOC) and sulphur dioxide (SO2). The Yemen’s inventory of GHG consists of emission estimations from the following five IPCC’s categorical sectors which include: energy; industrial processes; agriculture; land use, land use change and forestry (LULUCF) and waste. Major sectors contributing to GHG emissions in Yemen were identified. 2.1 Methodology The methodology used to develop the inventory is based on the Revised 1996 IPCC Guidelines for National Greenhouse Gas Inventories and the IPCC Good Practice Guidance and Uncertainty Management in National Greenhouse Gas Inventories (Good Practice Guidance) prepared by the Intergovernmental Panel on Climate Change (IPCC). As recommended by the IPCC Guidelines, country specific methods have been used as appropriate for certain GHG emitting sectors. In the following subsections, GHG emissions are reported both in absolute units of carbon dioxide, methane and nitrogen oxide emissions, as well as in units of CO2‐equivalent by applying 100‐year GWPs of 1 for CO2, 21 for CH4, and 310 for nitrogen oxide, as recommended by the IPCC in its Second Assessment Report. Unless, as noted, generic emission factors from the IPCC guidelines have been used. The following will explore the methodology in more details: As per Ar cle 4, paragraph 1, and Ar cle 12, paragraph 1 of the UNFCCC, the Government of Yemen is committed to develop, periodically update, publish and make available to the conference of the parties (COP), national inventories of anthropogenic emissions by sources and removal by sinks of all Greenhouse Gases not controlled by the Montreal protocol, using comparable methodologies. To proceed with development of Yemen second submission of GHG inventory for the calendar year of 2000, the developer of Yemen’s GHG inventory has first collected, examined and assessed activity data and emission factors and based on finding of the assessment, the 1996 IPCC revised Guidelines was applied. The core elements of the national communications for both Annex I and non‐Annex I Parties encompass information on emissions and removals of greenhouse gases (GHGs), as well as details of the activities undertaken to implement the Convention. The data and procedures need to be consistent, transparent and well documented to the most possible extent. In the methodology for the current GHG inventory, the data received from the sources are reliable with minimum uncertainty. Processing is based on the considered IPCC default methodologies and default emission factors (IPCC, 1996; IPCC, 2000). Es ma ng the GHG emissions in all sections of this chapter is carried out following the default methodology of the “Revised 1996 IPCC Guidelines for Na onal Greenhouse Gas Inventories” (IPCC, 1996) and the ”Good Practice Guidance and Uncertainty Management in National Greenhouse Gas Inventories” (IPCC, 2000). GHG emissions due to energy used in any sector including industry are calculated in the energy sector.
15
It worth‐mentioning that examination and assessment of activity data has shown that the 1996 IPCC revised guidelines is feasible and largely suitable for estimating GHG emissions for all category sectors as recommended by the revised IPCC Guidelines. Assessment of activity data on the other hand has pointed out notable limitations for using the new update of 2006 par cularly for the Agriculture, Forestry and other Land Use Change (LULUCF) Sector. Owing to a number of limitations encountered which hindered the full use of 2006 IPCC update including of the following: Lack of activity data in industrial sector including fuel consumption figures; lack of disaggregated activity data categorized in terms of transport modes of road transportation, local aviation and marine; lack of activity data disaggregated in terms of energy use for agriculture, forestry, manufacturing industries, and fishing sub‐sectors; and difficulties in finding activity data categorized for municipal, hazardous, clinical and sewage sludge. More importantly, the data assessment highlighted the lack of disaggregated activity data for GHG estimates for LULUCF sector as one of the most critical limitations which hindered the use of 2006 IPCC Guidelines. For example, lack of data on forest and non forest annual growth rates, land use categorizations, soil classification, soil types and their carbon content and land‐use patterns and conversions, among others are among the specific limitations which were encountered. Noting the mentioned‐above difficulties facing the use of the updated methodologies of 2006 IPCC Guidelines for Na onal Greenhouse Gas Inventories (IPCC 2006), and recalling that the new guidelines have not yet been adopted by the UNFCCC, Yemen's National Greenhouse Gas Inventory, for the year 2000, have been performed using the IPCC methodologies, default emissions factors and reporting formats described in the Revised 1996 IPCC Guidelines for Na onal Greenhouse Gas Inventories (IPCC/OECD/IEA 1997). This includes estimation of GHG emissions and removals for all source categories as described in the Revised 1996 IPCC Guidelines. In addition, it includes the application of key category analysis and use of the IPCC Good Practice Guidance for National Greenhouse Gas Inventories. Accordingly, as a Non‐Annex I country Par es, Yemen GHG inventory for 2000 has been developed to provide emissions estimates for carbon dioxide (CO2), methane (CH4), nitrous oxide (N2O), carbon monoxide (CO), and oxides of nitrogen (NOx), non‐methane volatile organic compounds (NMVOC) and sulphur dioxide (SO2) produced from the following IPCC category sectors: Energy; Industrial processes; Agriculture; Land‐Use Change and Forestry; and Waste. In line with UNFCCC decision 17/CP.8, GHG es mates have been developed using common repor ng formats as recommended by UNFCCC decision 17/CP.8 tables 1 and 2. As recommended by IPCC revised guideline 1996, GHG emissions from bunker fuels have also been estimated and reported as a memo item (these emissions are not included in the national total). In addition to the sectoral approach, the reference approach has also been used for the estimation of CO2 emissions from overall fuel consumption sources for the time series of 1995‐2005. Yemen GHG inventory provides emission estimates for CO2, CH4 and N2O in terms of Gg CO2‐equivalent (Gg CO2 ‐eq). Expression of GHG estimates in terms of Gg CO2‐eq. have been calculated using the 100‐year GWPs, provided by the IPCC in its Second Assessment Report consistent with Decision 2/CP.3. These are CO2=1, CH4=21and N2O=310.
16
The GHG inventory has been compiled by five teams of local experts specialized in the five IPCC categories areas listed above. The designated teams have consulted a wide range of local official statistical institutions including research centers, Ministry of Industry, Ministry of Planning and Development, Ministry of Oil and Mineral Resources, Ministry of Agriculture, Aden Refinery, Civil Aviation Authority and other specialized agencies. In the cases where there was no reliable data from national sources, data from FAO, UNFCCC, IPCC, OECD Energy Statistics and UNDATA had been used after being reviewed, assessed and judged by national experts. However, in few cases, the missing data were responsible for incomplete estimates of greenhouse gas emissions for some sectors, particularly for land‐ use change and forestry sector. This situation is likely to persist for long time unless a new comprehensive soil and forest surveys are conducted to address the issues of data unavailability as regards forest and non forest annual growth rates, soil types, classification, carbon content and land‐use patterns etc. It is worth recalling that the latest land use and soil survey was in 1973 and was only for the northern part of Yemen. Apart from soil and forestry issues, there is lack of disaggregated activity data and emission factors needed for the GHG inventory estimation methodology for both IPCC guidelines. This includes, among others, lack of activity data on industrial products, local aviation and marine data and energy use by sub‐sectors. 2.2 Total GHG Emissions
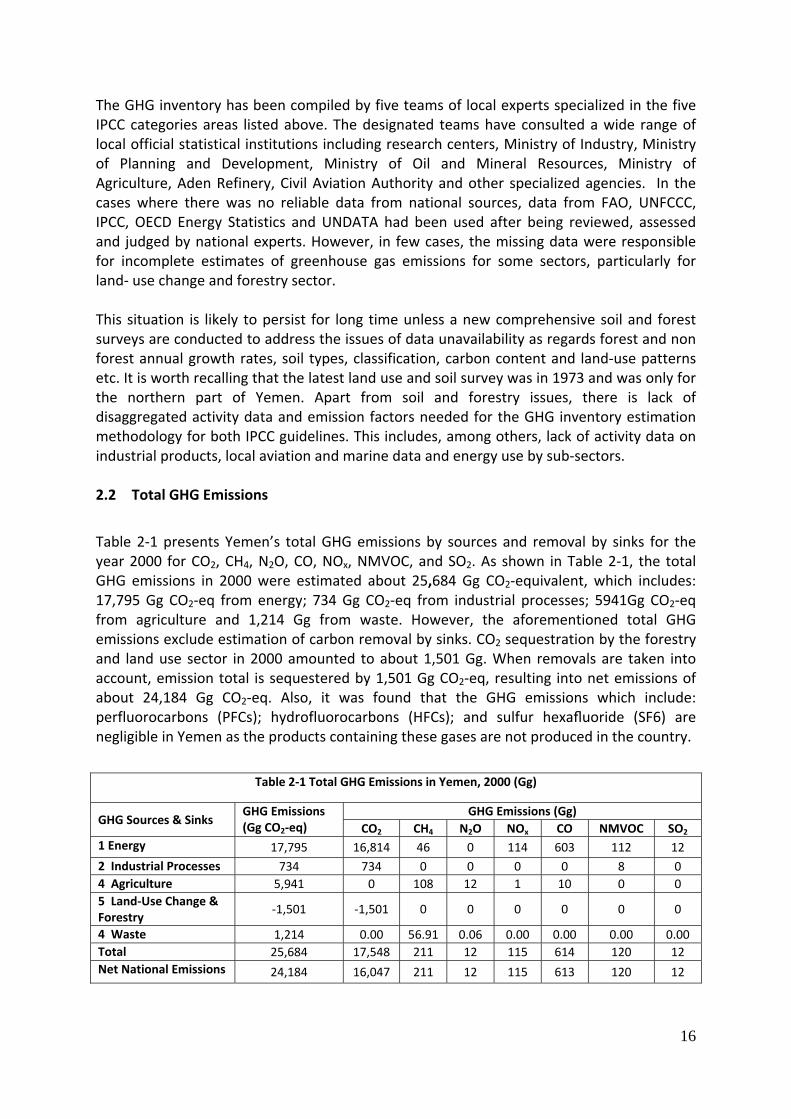
Table 2‐1 presents Yemen’s total GHG emissions by sources and removal by sinks for the year 2000 for CO2, CH4, N2O, CO, NOx, NMVOC, and SO2. As shown in Table 2‐1, the total GHG emissions in 2000 were estimated about 25,684 Gg CO2‐equivalent, which includes: 17,795 Gg CO2‐eq from energy; 734 Gg CO2‐eq from industrial processes; 5941Gg CO2‐eq from agriculture and 1,214 Gg from waste. However, the aforementioned total GHG emissions exclude estimation of carbon removal by sinks. CO2 sequestration by the forestry and land use sector in 2000 amounted to about 1,501 Gg. When removals are taken into account, emission total is sequestered by 1,501 Gg CO2‐eq, resulting into net emissions of about 24,184 Gg CO2‐eq. Also, it was found that the GHG emissions which include: perfluorocarbons (PFCs); hydrofluorocarbons (HFCs); and sulfur hexafluoride (SF6) are negligible in Yemen as the products containing these gases are not produced in the country.
Table 2‐1 Total GHG Emissions in Yemen, 2000 (Gg)
GHG Sources & Sinks GHG Emissions (Gg CO2‐eq)
GHG Emissions (Gg)
CO2 CH4 N2O NOx CO NMVOC SO2
1 Energy 17,795 16,814 46 0 114 603 112 12
2 Industrial Processes 734 734 0 0 0 0 8 0
4 Agriculture 5,941 0 108 12 1 10 0 0
5 Land‐Use Change & Forestry
‐1,501 ‐1,501 0 0 0 0 0 0
4 Waste 1,214 0.00 56.91 0.06 0.00 0.00 0.00 0.00
Total 25,684 17,548 211 12 115 614 120 12
Net National Emissions 24,184 16,047 211 12 115 613 120 12

17
Figure 2‐1 presents the sectoral breakdown of Yemen’s total GHG emissions for energy, industrial processes, agriculture, and waste along with their shares to the national total in terms of Gg CO2‐eq. It was found that the sectoral breakdown of Yemen’s total GHG emissions and their shares are as follows: Energy (17,795 Gg CO2‐
eq) at a share of 69.3 percent;
Indus. Processes (7,34 Gg CO2‐eq), 2.9 percent;
Agriculture 5941 (5,948 Gg CO2‐eq), 23.1 %; and
Waste (1,214 Gg CO2‐eq), 4.7 percent
As illustrated in Figure 2‐2, it is clear that CO2 is accounted for the largest and dominant portion of Yemen’s GHG emissions at a share of 68.3% (17, 548 Gg CO2‐eq), followed by CH4 and N2O with shares of 17.3 % (4,432 Gg CO2 ‐eq) and 14.4% (3,704 Gg CO2‐eq) respectively. Also, as shown in Table 2‐2, the largest share of 95.8 % (16,814 Gg CO2) of the total anthropogenic CO2 emissions in Yemen is produced in the energy sector; that is accounted for by fossil fuel combustion (mainly Mazot and Diesel) for electricity production and consumption, and road transportations (mainly Gasoline, and Diesel) with approximate share of 28.2% each. The other sectors sub‐sector contributed 22.5% (3946 Gg.) of national anthropogenic CO2
total emissions, while the manufacturing Industry and fugitive su b‐categories accounted for 9.8%(1711 Gg) and 7.3%(1279 Gg) respec vely. The CO2 emissions from LULUCF sectors were estimated to be around 9,856 Gg. These emissions were not included in the na onal total GHG. However if included it would be represen ng 38.4% of the national GHGs or 56.2% of the country CO2 emissions in 2000. These emissions were fully produced from cul va on of about 134,407 hectar of croplands.

18
Table 2‐2 Sectoral Emission and Contribution of CO2 Total Emission and National GHG
Sectors CO2 Emission (Gg) Sector Contribution (%) Compared with National
CO2 Emission, 2000
1 Energy 16,814 95.8%
A Fuel Combustion 15,535 88.5%
1.1 Energy Industries 4,943 28.2%
1.2 Manufacturing Industries and Construction
1,711 9.8%
2.3 Transport 4,935 28.1%
2.4 Other Sectors 3,946 22.5%
B Fugitive Emissions from Fuels 1,279 7.3%
2 Industrial Processes 734 4.2%
4 Agriculture 0 0
5 Land‐Use Change & Forestry 9,856 56.2%
4 Waste 0 0
Total 17,548 100.0%
From above, it can be concluded that, the energy‐related activities accounted for the dominant portion of anthropogenic GHG emissions in Yemen in terms of CO2‐eq in the reference year of 2000, followed by the agricultural, waste and industrial sectors. In addition, under the energy sector, the fossil fuel combustion for electricity production and consumption, road transportations are the largest anthropogenic CO2 emitting sub‐sectors in the year of 2000. As shown in Table 2‐2, it can be noted that Yemen is not contributing a lot to Global GHG emissions if the aforementioned figures are compared with high GHG emitting countries or even countries at the regional levels. 2.3 GHG Emission Trends This sub‐section presents Yemen’s GHG emissions for the calendar year of 2000 in addi on to emission trends, elabora ng temporal changes of GHG emissions over the years 1995 & 2005. Table 2‐3 present the trend in total GHG emissions for 1995 (the year of the initial GHG inventory), and 2000 (the year of the current GHG inventory). As shown in Table 2‐3, emissions have increased by about 33%; from 19,346 Gg CO2‐equivalent in 1995 to about 25,684 Gg CO2‐equivalent in 2000, or roughly 7%/year. On a net CO2‐equivalent basis, emissions in Yemen increased almost by about 3 mes over this period, from 8,211 Gg to 24,191 Gg, or about 24% per year. As illustrated in table 2‐3, Energy emissions increased in 2000 by 35% (4622 Gg CO2‐eq) against the 1995 emissions level. Over longer‐terms (1995‐2005), emissions of the “Energy ac vity category” have further increased to reach 21,351 Gg CO2‐eq in 2000, which represents an emissions growth of 62% compared with the 1995 emissions level (see Table 2‐3).

19
Within the energy sector, GHG emissions from the Other Sectors sub‐category has grown by 52% between 1995 and 2000, which is much higher than the energy sector average of 35 %. Over the long term period (1995‐2005), the emissions of this source have increased by 107 %, which is nearly three times higher the average growth of the energy sector emissions. GHG emissions of the Manufacturing Industry category have grown by 68% and 103% over the long‐terms and short terms periods respectively. GHG emissions in the Energy Generation category have increased by 31% between 1995 and 2000; refer to Table 2‐3.
Table 2‐3 Short and Long and Term Trends of Total GHG Emissions in Gg CO2 Eq and Percentage
Sectors
GHG Emission (Gg CO2 ‐Eq.)
Emission Change Emission Emission Change
1995 2000 1995‐2000 2005 1995‐2005
Emission Increase (Gg CO2‐ eq) Compared with 1995
Percentage Growth (%) Compared with 1995
Emission Increase (Gg CO2‐eq) Compared with 1995
Percentage Increase (%) Compared with 1995
1. Energy 13,173 17,795 4,622 35 21,351 8,178 62%
A. Fuel Combustion 11,608 15,871 4,263 37 19,559 7,951 68%
1.1 Energy Industries 3,782 4,943 1,161 31 6,160 2,378 63%
1.2 Manufacturing lnd 1,017 1,711 694 68 2,060 1,043 103%
1.3 Transport 4,014 4,956 942 23 5,541 1,527 38%
1.4 Other Sectors 2,795 4,261 1,466 52 5,798 3,003 107%
B. Fugitive 1,565 1,924 359 23 1,792 227 14%
2. Industrial Processes 544 734 190 35 755 211 39%
3. Agriculture 4,976 5,941 966 19 14,121 9,145 184%
4. Land‐Use Change & Forestry
9,123 9,856 733 8 9,856 733 8%
5. Waste 653 1,214 560 86 1,451 798 122%
Total 19,346 25,684 6,338 33 37,678 18,332 95%

20
Table 2‐ 4 Emissions and Percentage Contribu ons of GHG Emissions for Energy Sector for 1995, 2000 and 2005
Energy sector
1959 2000 2005
Emission Gg CO2 ‐Eq
Percentage Contribution
Emission Gg CO2 ‐Eq
Percentage Contribution
Emission Gg CO2 ‐Eq
Percentage Contribution
Energy Ind 3,782 29% 4,943 28% 6,160 29%
Manufacturing Industries
1,017 8% 1,711 10% 2,060 10%
Transport 4,014 30% 4,956 28% 5,541 26%
Other Sectors 2,795 21% 4,261 24% 5,798 27%
Fugitive 1,565 12% 1,924 11% 1,792 8%
Total 13,173 17,795 21,351
In 2000, the Energy Industries sub‐sector accounted for 4,943 Gg CO2 eq, at 28%of the energy industries, compared with 29% in 1995 (see Table 2‐4 above). GHG emissions from the Manufacturing Industries and Construction sub‐sector contributed about 1711 Gg CO2‐eq (or 10 %) to the 2000 energy sector emissions, compared with 1017 Gg CO2‐eq (or 8%) in 1995. On na onal basis these emissions represented 6.7 % of the country GHG emissions in 2000, compared with 5.3% of the sector emissions in 1995. In 2005, emissions Energy Industries contributed 29% (6160 Gg CO2‐eq) to the energy sector emissions, which were equivalent to 16.3% of the national GHG emissions. In terms of growth rate, GHG emissions of Energy Industries have increased by 1,161 Gg CO2‐ eq in 2000, being 31% of 1995 emissions (Figure 2‐3). In the long run (across the year 1995 to 2005) this sector emissions have grown at a rate of 63%, which represents 2378 Gg CO2‐eq (table 2‐3). This implies that total GHG‐Emission’s trends in Yemen over the indicated me horizon of 1995&2000 are increasing.
On a sectoral basis, the GHG emissions of the energy sector for instance, have increased from 13,173 Gg CO2‐eq in 1995 to 17,795 Gg CO2‐eq in 2000. As illustrated in the Figure 2‐3, emissions in 2000 increased by 35% (4622 Gg CO2‐eq) against the 1995 emissions level. GHG emissions from the Manufacturing Industries and Construction sub‐sectors contributed about 1,711 Gg CO2‐eq in the year 2000, compared with 1,017 Gg CO2‐eq in 1995; resul ng in a 68 % increase on emissions from this category.

21
On the other hand, in order to identify the main components of the trend in GHG emissions of CO2‐equivalent, and CO2 removal in Yemen, a comparison between the sectoral GHG emissions for time series of 1995 and 2000 was carried out. Figure 2‐3 compares GHG emissions across the time horizon of 1995‐2000 for each of the following sectors, which includes: Energy; Industrial; Agriculture; LULUSF, and Waste. As illustrated in Figure 2‐3, it can be noted that, the energy and LULUCF sectors are the main components accounted for the overall increasing trend in GHG emissions in Yemen. Over the period, CO2‐eq emissions from energy use have increased by 76%, or about 12% per year. This is primarily due to increases in energy use for power generation and process heat in manufacturing industries. Also over this period, CO2 sinks have decreased significantly by about 84%, or just over 30% per year between 1995 and 2000. This is mostly due to larger tracts of grasslands that have been converted to cropland. 2.4 Energy As mentioned earlier, the energy‐related activities are the largest contributors to the total anthropogenic GHG emission of Yemen in the year 2000. The Energy Sector in Yemen is divided into the following four categories (the supply side) which include: Oil and Gas; Electrical Power; Renewable Energy (Solar, Geothermal, Biomass, Landfills and Wind); Wood and Charcoal. In urban Yemen, about 89.74% of urban household have access to the main electricity grid and use electricity for lighting, heating, cooling and other purposes. Nevertheless, about 80.39% of the rural households use wood stoves for cooking. Whereas, in rural areas of Yemen where almost about 75% of the total popula on lives, about 27.31% of the households are connected to the electricity grid and use electricity for lighting and other related purposes. The remainder majority non‐electrified rural households (about 72.69% of rural households) use two types of ligh ng devices, kerosene Lamps and LPG Lamps. About 67% of the rural households use wood stoves for cooking. Fuel Wood and Charcoal are still the biggest source of energy for most of rural and for a few urban areas of Yemen.

22
On the other hand, there are five main Sectors that can be classified as major consumers of energy (the demand side) in Yemen and these are: Household Sector; Transport Sector; Commercial Sector; Industrial Sector; and the Agricultural Sector. These sectors consume primary fuels and do not produce any secondary fuels except the power stations used in the industrial and commercial sectors. The only sector that consumes primary fuels as an input and produces electricity (secondary fuels) to be used by other sectors is the electrical power sector. In the year 2000, more than 82% of the energy demand in Yemen is accounted for by Household and Transport Sectors. The transport sector alone accounts for by about 52% of the total energy demand in Yemen for the year 2000. Lighting and refrigeration are the major household’s uses of the electrical power in Yemen with 64.10%, and 31.22 shares respec vely in the year of 2000. It is expected that the Transport and Household Sectors will dominate the impact on the energy map during the period of study and indeed together with the Power Sector they will constitute the major players in the energy scenario (See table 2‐5). It is clear at transport Sector demands most of the energy (about 52% of total in 2000 rising to about 56% of total in 2025) and thus burns the largest quan ty of fuels. The Household Sector comes next in consuming energy with about 30% of total in 2000 falling to about 28.6% of total in 2025. Commerce and Industrial sectors share almost the rest of the demand with about 1.5% of total, which is the lowest, demanded by the Agriculture Sector. The Transport and Household Sectors can be said to be the main contributors to the GHG emission and thus air pollutions. Petro Products and Wood are the main and largest fuels burned. The Petro Products cons tute about 79% of total fuel burned in 2000 increasing to about 83% of total in 2025. The Wood Fuel burned on the other hand falls from about 17% of total in 2000 to about 13% of total in 2025. Table 2‐6 summarizes GHG emissions associated with energy ac vity in 2000. Rela ve to overall anthropogenic GHG emissions, the 17,795 Gg CO2‐equivalent represents about 69% of the total national emissions. GHG emissions from electrical power production and consumption activities are due to fossil fuel combustion and fugitive emissions from oil and gas exploration activities. Fuel combustion emissions are associated with the use of a variety of petroleum products such as diesel, residual oil, and LPG. For the 2000 inventory year, natural gas was not consumed for either power or heat production. All of the diesel and gasoline are consumed in road transport, with negligible relatively small quantities used for industrial processes. LPG is used in the residential and commercial/institutional sectors for cooking and other purposes.
Table 2‐5 Estimated Energy Demand in (Million GJ)
Baseline Scenario for Yemen by Sectors,
(2000 ‐ 2025)
Sector 2000 2005 2010 2015 2020
Households 60.3 96.1 116.5 130.0 143.6
Commerce 17.0 20.3 26.3 32.3 41.1
Industry 15.5 16.1 17.6 20.4 20.5
Transport 105.5 149.6 186.6 213.3 250.2
Agriculture 3.1 3.5 4.1 4.7 5.5
Total Energy 201.8 285.7 351.1 400.7 460.9

23
Table 2‐6 GHG Emissions from Energy Use, 2000 (Gg)
GHG Source Categories CO2‐eq CO2 CH4 N2O NOx CO NMVOC SO2
All energy emissions 17,795 16,814 46 0 114 603 112 12
A. Fuel Combustion Activities
15871 15535 16 0 114 603 97 8
1. Energy Industries 4,943 4,943 0 0 13 1 0 5
2. Manufacturing Industries & Construction
1,711 1,711 0 0 5 0 0 0
3. Transport 4,956 4,935 1 0 44 338 64 3
4. Other Sectors 4,261 3,946 15 0 52 264 33 0
B. Fugitive Emissions from Fuels
1,924 1,279 30 0 0 0 15 4
1. Solid Fuels 0 0 0 0 0 0 0 0
2. Oil and Natural Gas 1,924 1,279 30 0 0 0 15 4
Memo Items 284 284 0 0 4 3 1 0
1. International Bunkers 73 73 0 0 0 0 0 0
2. CO2 Emissions from Biomass
211 211 0 0 4 3 1 0
Figure 2‐4 illustrates the breakdown in energy‐related GHG emissions in 2000 by consuming activity. Transport emissions associated with road transport showed the highest share of GHG emissions in 2000, about 28%. Fuel use is mainly gasoline and diesel fuel. Power production is based overwhelmingly on the use of residual oil and diesel oil and accounted for about 28% of total emissions from energy‐consuming activities in Yemen. Other sectors (i.e., residential, commercial, and agricultural) accounted for 24%. The manufacturing sector (mostly food/dairy and cement) is relatively small in Yemen and accounted for about 9% of all energy‐related emissions in 2000. Notably, fugitive emissions of methane, a gas that has a high global warming potential, accounted for about 11% of all GHG emissions in the energy industries sector.

24
2.5 Industrial Processes and Other Product Use All industries in Yemen are grouped into three main categories as follows: Cement Industry; Food Industry; Other Industry. Table 2‐7 summarizes GHG emissions associated with industrial processes and product use in 2000. Industrial processes are the fourth largest emi er of anthropogenic GHG emissions in Yemen, accoun ng for 734 Gg of CO2–equivalent, or about 2.9% of national CO2–equivalent emissions in 2000. Ac vity data for the industrial sector were based on Trade Statistics and surveys of key industries.
Table 2 7: GHG Emissions from Industrial Ac vity, 2000 (Gg)
GHG Source Categories CO2‐eq CO2 CH4 N2O NOx CO NMVOC SO2
All industry emissions 734 734 0 0 0 0 8 0
Industrial Processes 734 734 0 0 0 0 8 0
A Mineral Products 734 734 0 0 0 0 6 0
B Chemical Industry 0 0 0 0 0 0 0 0
C Metal Production 0 0 0 0 0 0 0 0
D Other Production 0 0 0 0 0 0 2 0
E
Production of
Halocarbons and
Sulphur Hexafluoride
0 0 0 0 0 0 0 0
F
Consumption of
Halocarbons and
Sulphur Hexafluoride
0 0 0 0 0 0 0 0
Total Solvent and Other
Product Use 0 0 0 0 0 0 0 0
A Paint Application 0 0 0 0 0 0 0 0
B Degreasing and Dry
Cleaning 0 0 0 0 0 0 0 0
C
Chemical Products,
Manufacture and
Processing
0 0 0 0 0 0 0 0
D Other 0 0 0 0 0 0 0 0
Other than for mineral products, there is negligible industrial activity in Yemen that produces process‐related emissions. Cement production is the dominant source of industrial GHG emissions, accoun ng for over 99% of emissions. Lime produc on, asphalt for road paving, and food and drink accounted for the remainder of emissions.

25
2.6 Agriculture
Agricultural practices are the second largest emitter of anthropogenic GHG emissions in Yemen, accounting for 5941 Gg of CO2–equivalent, or about 23% of na onal CO2–equivalent emissions in 2000. As given in Figure 2‐5, GHG Emissions from this sector were emi ed as N2O and CH4 at contribu ons of 62% (3,680 Gg CO2eq) and 38% (2,261 Gg CO2‐eq) respectively. Activity data for the agriculture sector was based on the Agricultural Statistics Yearbook published by the Ministry of Agriculture and Irrigation. Given that rice cultivation and savanna categories are not applicable to Yemen, the agriculture sector provides GHG estimates for the following sub‐sectors: Enteric fermentation; Manure management; Agricultural soils; and Field burning of agricultural residues. Table 2‐8 summarizes GHG emissions associated with agriculture in 2000.
Table 2.8 GHG Emissions from Agricultural Ac vity, 2000
GHG Source Categories
CO2‐equiv
CO2 CH4
Gg
N2O NOx CO NMVOC SO2
Emission Gg
Gg Gg Gg Gg Gg
Agriculture 5,941 108 12 1 10
A Enteric Fermentation 2,144 102 0
B Manure Management 122 5 0.1
C Rice Cultivation 0 0 0
D Agricultural Soils 3,660 0 12
E Prescribed Burning of Savannas
0 0 0 0 0
F Field Burning of Agricultural Residues
15 0.49 0 1 10
G Other (please specify) 0 0 0
Figure 2‐6 illustrates the breakdown in agriculture‐related GHG emissions in 2000 by activity. Emissions associated with agricultural soils showed the highest share of GHG emissions in 2000, about 62%. These emissions are associated with nitrogen applica ons to cultivatable soils through the use of synthetic fertilizers, animal excreta, and crop residues. Emissions from enteric fermentation accounted for the second highest share, about 36%. Collectively, cattle, goats, and sheep account for the overwhelming majority of such emissions, nearly 90%, with the balance from camels, horses, mules, and donkeys.

26
The remaining sources of GHG in the agricultural sector (i.e., manure management and field burning of crop residues) accounted for the balance of 2%. Emissions from manure management are mostly from dairy farms, poultry farms, and beef feedlots where animals are managed in confined spaces. GHG emissions from field burning of crop residues are negligible (i.e., less than 0.2%) and are associated with the burning of sorghum, wheat and millet crop wastes after each harvest cycle. 2.7 Land Use, Land Use Change and Forestry The Land Use, Land‐Use Change and Forestry (LULUCF) Sector reports GHG from managed lands, as well as those associated with land‐use changes. Table 2‐9 summarizes GHG emissions associated with land use, land use change and forestry in 2000. The 1,501 Gg CO2‐equivalent sequestered through changes in forested lands is roughly 6% of Yemen’s overall anthropogenic GHG emissions. Annual activity data was obtained from both national and international statistics and were considered adequate to establish emission estimates inventories for only a few of the IPCC categories, namely changes in forest and biomass stock as well as CO2 uptake associated with land use change and management. Annual activity for other categories such as land conversion and abandoned lands was either unavailable or outdated for purposes of the GHG inventory update. As noted later in this chapter, the availability of better national documentation on forested areas, afforested areas, and tree plantation/removals would reduce the uncertainty of the current inventory significantly.
Table 2‐9 GHG Emissions from LULUCF ac vity, 2000 (Gg)
GREENHOUSE GAS SOURCE AND SINK CO2 Emissions
CO2 Emissions
CH4 N2O NOx CO
CATEGORIES Gg CO2‐eq Gg Gg Gg Gg Gg
5 Land‐Use Change & Forestry ‐1,501 ‐1,501 0 0 0 0
A Changes in Forest and Other Woody Biomass Stocks
‐11,357 ‐11,357.32
B Forest and Grassland Conversion 0 0 0 0 0
C Abandonment of Managed Lands 0
D CO2 Emissions and Removals from Soil 9,856 9,856
E Other (please specify) 0 0 0 0 0 0

27
Changes in forest stocks accounted for a net 11,357 Gg CO2‐eq sequestered in Yemen. This amount is associated with roughly an addi onal 2,342 thousand hectares planted with various acacia species as well as a small amount of managed non‐forested areas. Sequestered amounts are offset by roughly 134.4 thousand hectares that have been converted to cropland, leading to emissions of 9,856 Gg CO2‐eq. Combining these sources and sinks, there is a net sequestered amount of 1,501 Gg CO2‐eq. 2.8 Waste Sector This sector consists of the following category sub‐sectors for which GHG emissions were estimated: Solid Waste Disposal (Managed Waste Disposal Sites); Domestic Wastewater Treatment and Discharge; and Industrial Wastewater Treatment and Discharge, mainly for food industries. It is worth‐noting that: First, there is no technological incineration for any type of wastes, including hazardous, medical waste and sludge. Hazardous wastes are collected and transferred outside of the country for incineration; Second, all other types of waste (domestic, medical and industrial) are collected and transferred to the landfills distributed in the country, where they are burned in open air; Third, light fraction shredder waste is disposed of at landfills, where in some governorates collected by scavenger and sold to companies which transfer it to outside Yemen for recycling. The combustion occurs in the open partly accidentally and partly intentionally by scavengers who look for metals and other materials which are of use for them. Waste wood and waste biomass are disposed of at the landfill; fourth, there is no use for biogas for power generation in Yemen. In Yemen there are 36 landfills of which only 23 sites receive large amount of waste. Table 2‐10 summarizes GHG emissions associated with waste management ac vity in 2000. Rela ve to overall anthropogenic GHG emissions, the 1,214 Gg CO2‐eq represented about 5% of total na onal emissions. Sources for waste management data included the Statistical Yearbook, as well as data contained in feasibility and other reports from the Environment Protection Authority and the Ministry of Water and Irrigation.
Table 2‐10 GHG Emissions from Waste Management Ac vity, 2000 (Gg)
Waste
CO2 CO2 CH4 N2O NOx CO NMVOC
Gg CO2‐eq
Gg
1,214 0 57 0.1 0 0 0
A. Solid waste disposal on land
1,097
52 0 0 0 0
B. Waste‐water handling 117 5 0.06 0 0 0
C. Waste incineration 0 0 0 0 0 0
D. Other (please specify) 0 0 0 0 0 0
Landfills operations in Yemen are significant sources of CH4 emissions. Solid waste disposal is the main source of GHGs within Yemen’s waste sector. Emissions in 2000 were es mated to be around 52.2 Gg CH4 (1,097 Gg CO2‐eq). This value represents 25% of the nation's total GHG emissions and 92% of the methane emitted from waste sector. Domestic and

28
commercial wastewater handling in a total of nine wastewater treatment facilities accounted for the balance of waste‐related emissions. It worth‐mentioning that It was found that the data collected for estimating GHG emissions from the waste sector is available in reliable records for the years of 2000 as well as for 2003, 1995 and 2005. It was also found that data are available for es ma ng GHG emission from domestic wastewater industrial wastewater. However, the wastewater data is scattered but not valid for time series analysis. Data records on solid waste were taken from the Ministry of Public Works and Road, the Statistical Year Books for the Republic of Yemen for the years 2000, 1995, 2003 and 2005 and Environmental status report for 2000. Alternatively, in the cases of unavailability of reliable data from national sources, data from internationally recognized agencies were applied after being reviewed, assessed and judged by national experts. This includes the use of the IPCC default methodology and default emission factors. Based on data and quality analysis, GHG es mates for the years 2000, 1995 and 2005 covering the following category sub‐sectors including: Solid Waste Disposal (Managed Waste Disposal Sites); Domestic Wastewater Treatment and Discharge; and Industrial Wastewater Treatment and Discharge, mainly for food industries. In general, the methodology has been used for estimating Waste GHG emission in Yemen was based on the IPCC methodology as given by the revised 1996 IPCC guidelines. For instance, the methodology used for es ma ng 2000 CH4 emission from landfills was based on the IPCC methodology as given by the revised 1996 IPCC guidelines. Based on the indicated methodology, the following terms were used as input data:
The amount of waste disposed to SWDSs;
The fraction of degradable organic carbon and the amount which actually degrades; and
The frac on of CH4 in landfill gas. The first term was taken from local sources, and the others were taken from IPCC recommended default values. Nevertheless, uncertainties in these estimates were thought to be high due to unavailability of country specific data regarding landfill size, waste composition, landfill practices and other factor affecting decomposition process and consequently methane generation. In this case, emission estimates were performed based on broad approximation of activity data and not on actual one causing high level of uncertainty. 2.9 Emissions of PFCs, HFCs, and SF6 According to the Revised IPCC Guidelines, the major emission sources of PFCs, HFCs, and SF6 gases are related to the following activities: replacement of ozone‐depleting substances; HCFC‐22 produc on; electric power transmission; produc on of primary aluminum; production of semiconductors; and production and processing of magnesium. Only the third activity occurs in Yemen (power transmission). PFCs and HFCs were not produced or imported/consumed as substitutes for ozone depleting substances in refrigeration and fire

29
extinguishers because ozone‐deple ng substances were not banned in Yemen in 2000. The es ma on of SF6 emissions associated with electric power transmission proved to be a significant challenge due to data constraints and was assumed to be negligible. 2.10 Uncertainty Assessment An uncertainty assessment was considered to be an essential element of the GHG emission inventory update to help prioritize efforts to improve the accuracy of future inventories. In Yemen, uncertainties are associated with data access/constraints, potential unsuitability of generic emission factors, and an incomplete understanding of the processes associated with emissions. Some of the current estimates, such as those for CO2 emissions from energy‐related activities and cement processing are considered to have minimal uncertainty associated with them. For some other categories of emissions such as afforested areas, however, a lack of information increases the uncertainty surrounding the estimates presented. Table 2‐11 summarizes the uncertainty assessment for Yemen GHG inventory. Based on expert judgment of specialists participating in the development of the inventory, the confidence in the results for each source/sink category was evaluated relative to the uncertainty associated with data quality and emission factor suitability. Less than 10% uncertainty was considered to be low; uncertainty between 10% and 50% was considered medium; and uncertainty greater than 50% was considered high. Attention to two areas could help reduce uncertainty in Yemen GHG inventory. First, enhancing the availability of detailed and high quality activity data will increase confidence in the inventory results. The availability of such information would help in developing GHG inventory of wider temporal coverage by including sub‐sources and regions that have been uncovered by the current inventory update. With respect to land use change and forestry, the availability of such informa on would help in addressing CO2 offse ng by re‐growing biomass through better information on dispersed trees and date palms. The same would apply to informa on on forestland and grassland converted to croplands over the last 20 years. Addressing these areas through additional capacity strengthening and development of dedicated observation networks will enhance the quality and accuracy of future emission inventories. Second, improving the accuracy of emission factors to calculate emissions from a variety of sources is vital. Most of the emission factors noted in the above table are classified as having medium uncertainty (i.e., uncertainty between 10% and 50%). For example, the accuracy of current emission factors for enteric fermentation by animals at low altitude and subject to high temperatures throughout the year remains uncertain in the absence of local sampling and testing activities.

30
Table 4‐11 Uncertainty Assessment Associated with Yemen GHG Inventory, 2000
Sector Activity Uncertainty Confidence
in Inventory emission factor data quality
Energy
Public Electricity and Heat Production
low uncertainty good quality High
Domestic Aviation low uncertainty medium quality
Medium
Road transport low uncertainty Poor quality Low
Commercial/Institutional low uncertainty medium quality
Medium
Residential low uncertainty medium quality
Medium
Agriculture/Forestry/Fishing low uncertainty poor quality Low
International aviation (bunkers)
low uncertainty medium quality
Medium
Industrial
Processes
Cement production low uncertainty good quality High
Lime production medium
uncertainty good quality Medium
Limestone and Dolomite Use medium
uncertainty good quality Medium
Agriculture
Enteric fermentation High uncertainty Poor quality Low
Manure management High uncertainty Poor quality Low
Agricultural Soils High uncertainty poor quality Low
LULUCF Changes in Forest and Other Woody Biomass Stocks
High uncertainty Poor quality Low
Waste
CH4 emissions from SWD sites
medium uncertainty
poor quality Low
CH4 emission from Domes c and Commercial Waste water
medium uncertainty
poor quality Low
N2O emissions from human waste
medium uncertainty
Poor quality Low

31
List of References
Food and Agriculture Organiza on (FAO), 2005. Global Forest Resources Assessment 2005 ‐ Country Report Yemen, Rome.
Intergovernmental Panel on Climate Change (IPCC), 1996. Revised 1996 IPCC Guidelines for National Greenhouse Gas Inventories
Intergovernmental Panel on Climate Change, 2000. IPCC Good Practice Guidance and Uncertainty Management in National Greenhouse Gas Inventories
Na onal symposium on Deser fica on Report (work paper), 1996.
Republic of Yemen, 2001. Ini al Na onal Communica ons, Environmental Protec on Council
Republic of Yemen, 2005. Environmental Status Report
Yemen Ministry of Electricity, Renewable Energy Strategy and Action Plan
Yemen Ministry of Water and Environment, Feasibilty Study for Effluent & Sludge Reuse in ADEN other 5 ci es, Kreditanstalt für Wiederau au, Voume 1‐6.

32
5. Vulnerability and adaptation
Vulnerability and Adaptation
Chapter 3:

33
3.1 Introduction Vulnerability in the present context refers to the extent to which climate change may damage or harm a system (IPCC, 1996). Also, the IPCC defines adaptation as “adjustment in natural or human systems in response to actual or expected climatic stimuli or their effects, which moderates harm or exploits beneficial opportunities”. In climate change context, adaptation has extensively been used to refer to a range of activities including management, technological, financial and institutional arrangements to cope with and adapt to changing climate. Yemen's natural and socio‐economic systems generally suffer from structural problems which contribute to make the country more vulnerable to climate change. Among the key socio‐economic sectors which are highly vulnerable to climate change are water, agriculture, and coastal areas. These three sectors were identified as the highest vulnerable sectors in the Ini al Na onal Communica on (INC, 2000) as well as in the Na onal Adapta on Programme of Ac on (NAPA, 2009). This chapter will present findings and conclusions of the three thematic V&A studies across the pilot areas. The pilot areas were selected in stakeholder consultation workshops based on specific criteria including urgency of interventions, magnitude of the potential risks, and socio‐economic implications. Firstly, Wadi Surdud drainage basin which forms one part of the western drainage basins area of Yemen was selected as a pilot area to assess climate change impacts on water resources. Secondly, two pilot areas were selected for assessing the climate change vulnerability of the agricultural sector (two main food cereals crops including Sorghum, and Wheat, where applicable). Each of the tow areas has specific climatic characteristics which are typical relative to the three major agro‐climatic zones of Yemen. For instance, Shibam district in Al‐Mahweet governorate was selected to represent the rain‐fed highland agro‐ecological zone. The Wadi in Syoun represents the Plateau zone and Bajil in Al‐Hodiedah for the coastal zone. Thirdly, the coastal zone of Aden Governorate was identified under the SNC as priority areas for assessing its vulnerability to the sea level rise (SLR), besides exploring possible adaptation options. A scenario approach was used to compare a Business‐as‐Usual case without adaptation and a Case which included the integration of future adaptation measures. In addition, proper and applicable adaptation measures to suit specific context across the areas of study based on the vulnerability assessment under each of specified climatic change scenarios were discussed. To facilitate readability, this Chapter is outlined into three sections each of which has been devoted for a specific thematic V&A study, and results. The first section deals with the water sector pilot V&A. The second on the agricultural sector pilot V&A, and third on the coastal area pilot V&A. Structurally, each V&A Section is comprised of four sub‐sections. Each sub‐section will contain relevant information about the study area, methodology of the study, vulnerability to potential climate change impacts, and adaptation measures.
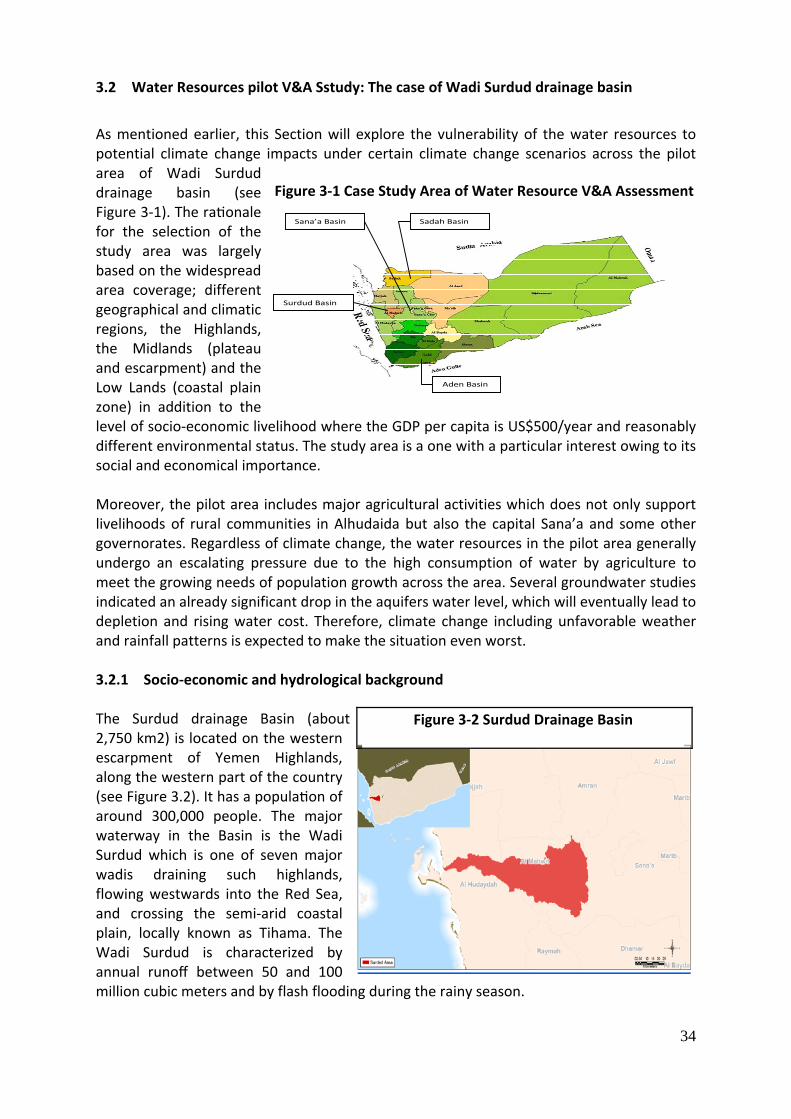
34
Sadah BasinSana’a Basin
Aden Basin
Surdud Basin
3.2 Water Resources pilot V&A Sstudy: The case of Wadi Surdud drainage basin
As mentioned earlier, this Section will explore the vulnerability of the water resources to potential climate change impacts under certain climate change scenarios across the pilot area of Wadi Surdud drainage basin (see Figure 3‐1). The ra onale for the selection of the study area was largely based on the widespread area coverage; different geographical and climatic regions, the Highlands, the Midlands (plateau and escarpment) and the Low Lands (coastal plain zone) in addition to the level of socio‐economic livelihood where the GDP per capita is US$500/year and reasonably different environmental status. The study area is a one with a particular interest owing to its social and economical importance. Moreover, the pilot area includes major agricultural activities which does not only support livelihoods of rural communities in Alhudaida but also the capital Sana’a and some other governorates. Regardless of climate change, the water resources in the pilot area generally undergo an escalating pressure due to the high consumption of water by agriculture to meet the growing needs of population growth across the area. Several groundwater studies indicated an already significant drop in the aquifers water level, which will eventually lead to depletion and rising water cost. Therefore, climate change including unfavorable weather and rainfall patterns is expected to make the situation even worst. 3.2.1 Socio‐economic and hydrological background The Surdud drainage Basin (about 2,750 km2) is located on the western escarpment of Yemen Highlands, along the western part of the country (see Figure 3.2). It has a popula on of around 300,000 people. The major waterway in the Basin is the Wadi Surdud which is one of seven major wadis draining such highlands, flowing westwards into the Red Sea, and crossing the semi‐arid coastal plain, locally known as Tihama. The Wadi Surdud is characterized by annual runoff between 50 and 100 million cubic meters and by flash flooding during the rainy season.
Figure 3‐1 Case Study Area of Water Resource V&A Assessment
Figure 3‐2 Surdud Drainage Basin

35
The average annual temperatures in the upper catchment and lower catchment were approximately 18 and 30oC, respec vely. The average annual precipita on ranges from 300 mm to 600 mm in the upper catchment region (mountainous), and 50 mm to 100 mm in the lower catchment area, at the coastal region near the Red Sea. There are three aquifers in the study area which includes the Mesozoic aquifer in the mountainous area, the Shallow aquifer along Wadi Surdud reaches and the Quaternary aquifer in the costal area. The shallow aquifer is recharged by wadi bed infiltration from wadi flood and baseflow as interflow from Mesozoic aquifer. In the mountainous area, there are six sub‐catchments that drain into six wadi tributaries which constitute the Wadi Surdud headflow, which are reflected in the Weap Model (see figure 3.3). In the coastal area, there are thirteen agriculture lands or sub‐catchments. For each sub‐catchment, based on Van der Gun and Wesseling (1991) and field investigations, data on the area, land uses, crop patterns, crop coefficient values, kc (FAO, 1989) and crop produc on costs were modeled. It was assumed that there is 1.5% annual increase in agriculture area. Regarding municipal water, it is represented by two demand nodes, one in the mountainous region and the other in the coastal region. While groundwater availability in the Surdud Basin is currently plentiful, groundwater overexploitation varies widely from one zone to another as evidenced by the distribution in groundwater boreholes (refer to Figure 3.3 above). The total groundwater storage for the aquifers is es mated to be around 3,700 million cubic meters (Adnan, 2002; Van der Gun, year?? and Aziz, 1995). There is also another less important aquifer that extends along Wadi Surdud tributaries that is highly dependent on annual runoff for recharge; its groundwater storage capacity is around 500 million cubic meters. 3.2.2 Methodology To achieve the water V&A study’s objective, socio‐economic situation of the study area was explored. Data related to the pilot area including hydrological, climatic, geological, and land‐use, topographic description, have been collected from available reports, maps and other sources. In addition, sensitivity analysis of water resource availability in the pilot area under specific climatic scenarios was carried out. Moreover, impact of climate change on livelihoods of local communities in the pilot area was assessed. Current water demand and supply data and the estimated future trends in water use which are obtained from a number of Yemeni and international data sources, were incorporated into a scenario‐driven water balance modelling platform, known as Water Evaluation and
Figure 5‐3 Distribu on of Groundwater Boreholes in Wadi Surdud Basis

36
Planning software (WEAP). WEAP was used for the case study (see Figure 3.1) to analyze water availability for a number of climate change scenarios, including a reference scenario (herein referred to as ‘Reference’). The reference scianrioe projected existing trends in water supply and demand into the future (2033), in the absence of adapta on measures. In the Reference scenario, the climate sequence for future years was developed by repeating the sequence of available historical data and assuming a similar periodicity into the future period (2008‐2033). In other words, the reference scienario is based on projecting of seasonable and periodical historic climate events into the future. This scenario has assumed that such seasonable and periodical historic climate events will deveop similar trends in the future. The average change in precipitation/temperature predicted by regional downscaling of global climate models was applied. The Water Year Method, as applied by WEAP, allows the use of historical data in a simplified form and easily explores the effects of future changes in hydrological patterns. It describes very wet relative to normal, very dry relative to normal, etc, then defines a sequence of climate years (i.e, four years of dry conditions, followed by a normal year, then another dry year, etc) using the historical average precipitation and temperature as well as ratios for modification. In the reference scenario, a number of key assumptions such as demographic and economic growth parameters were projected. For instance, urban population is assumed to con nue growing at an expected rate of 3.5% annually, whereas rural population growth are expected to decline due to migration to major cities. Agricultural production is expected to grow proportionally with expected population growth rates. On the other hand, three climate change scenarios which incorporats changes in precipita on and temperature through 2033 were used. These are, firstly, the the Oregon State University model (OSU Core) and secondly, the U.K Meteorological Office High Resolution General Circulation model (UKHI), and the MAX Plan Institute model (ECHAM3TR). Such scenarioes have been previously used in Yemen during an earlier project known as Netherlands Climate Change Studies Assistance Program (NCCSAP: 1996‐2000) to support climate change impact assessment in some pilot areas in the country. The OSU Core model represents an ‘expected’ climate trajectory. However, to reflect the range of local rainfall over Yemen, which may occur, other GCM scienarioes, were therefore selected. The UKHI model representes a ‘worst case’, drier trajectory, wherease, the ECHAM3TR represents the wet scenario. Notably, the two alternative GCMs were not selected, and this not because they were performed using necessarily the ‘best’ models, but because they respectively show greater wetting and drying characteristcs than the ‘core’ which is relatively more typical to the local climate condi ons over Yemen. The indicated climate change scenarios, the UKHI dry, ECHAM3TR wet, and OSU Core were downscaled to local conditions in the study area either the mountainous or the coastal region. Also, extensive stakeholder consultations were conducted to characterize current water availability, future water resource vulnerability, and possible adaptation strategies to mitigate water scarcity. Stakeholder consultations were undertaken using rapid rural appraisal techniques and focused on local perceptions of water scarcity, climatic change factors, and development challenges; overall strategy preferences of various interest groups

37
(e.g., farmers, policy makers, and water utilities officials) were collected based on perceived feasibility, cost, and value in terms of water savings. These structured stakeholder discussions were then synthesized into a set of inputs for water resource modelling and prioritizing adaptation initiatives using MCA‐WEAP, an Excell based tool, summarizing responses of structured questions, which are based on the used indormal and rapid appraisal questionnaire. A copy of the stakeholder questionnaire is given as appendix A. 3.2.3 Key Findings and Conclusions The three scienarioes used in this study, projected an increase in temprature but differing projections of rainfall. They have illusterated the three modeling results at the end of the simulaion period. The UKHI scenario projected a decrease in rainfall by end of simulation period in the pilot area; the mountainous and coastal areas, by about ‐23%, and ‐27%, respectively. Wherease, the the OSU Core scenario projected an increase in rainfall by about +5%, and +9% in the mountainous and coastal areas, respectively. Taking the worst scenario into considerations, the water resource availability by the end of the simulation period, will likely be exposed to extreme changes in climatic parameter including tempartature increase and rainfall decrease across the three aquifers of the basin catchment area. However, the coastal lower catchment zone is relatively more exposed to changes in temperature and rainfall patterns compared to the mountainous upper catchment zone, due to the corresponding spatial characteristics which include socio‐economic, geographic, and hydrological characterization of the area. All aquifers are sensitive to changes in climatic parameters, including rainfall drop, and temperature rise. However, owing to its spatial characteristics, the water availability for use in the mountainous upper catchment zone is likely to be relatively less sensitive to the projected changes in temperatures and rainfall patterns. The temperature in the mountainous zone is relatively lower, and rainfall patterns are more frequent compared to the coastal zone. In addition, the community livelihoods across the mountainous upper catchment of the Surdud drainage basin area depends mainly on rain‐fed agriculture under which groundwater is nearly stable due to higher rainfall as the main source for agriculture , and less use of groundwater, as a supplementary source compared to the coastal area. Whereas, the key livelihoods across the lower catchment water drainage basin rely heavily on irrigated agriculture which has already over‐used the groundwater resources. The dominant water use in the coastal area was agriculture consuming about 97% of the abstracted ground water, and only about 3% for domestic use. Currently, there are more than 5,000 boreholes in the coastal area alone, which even ully has caused overexploitation of groundwater in the coastal and upper catchment of Surdud drainage basin area. As such, the water availability for use in the lower coastal upper catchment zone is likely to be extremely sensitive to the projected changes in temperatures and rainfall drops under the UKHI‐worst climate change scenario. As projected in the Model, the excess surface water infiltrates to the quaternary aquifer which even could not cope with the annual decrease in water storage which is about 288.62 MCM/year (0.23m annual drop in water level). Thus, the exis ng storage will be depleted

38
within 93 years during the Reference Scenario and within 70 years during the UKHI Scenario (0.26m annual drop). For the mountainous region, the Model surface flow result was found to be very close to the observed values, while the groundwater abstraction and recharge result was about 21% and 12% representing more than the estimated values by Adnan (2002) and Van der Gun and Wesseling (1991), respec vely, which are based on water balance method but not on real measurements. Data that could be used to determine the recharge from precipitation is not available for the upper Wadi Surdud catchment. Also, information on irrigation losses is scarce. Most studies were found to be more focused on the coastal plain, and thus a detail study on the upper catchment of Wadi Surdud is vitally needed, especially on groundwater abstraction and infiltra on parameters. Regarding groundwater storage, it is nearly stable with just about 1 to 2cm annual drop in groundwater level during the Reference Scenario and will be more stable with no drop in storage in the OSU Scenario but it will be affected during the UKHI Scenario especially in the Mesozoic aquifer where the annual water storage drop will reach 10cm. Given current patterns, the existing groundwater storage in the study area, water will be depleted within about 70 and 90 years. Nevertheless, the groundwater table shows an annual increase up to about 10 cm, in certain loca ons. Four adapta on strategies were considered to improve the irrigation efficiency in the study area; those are the drip irrigation, use of closed conduits, rehabilitation of traditional irrigation channels, and changing crop patterns (i.e., replacing bananas with sorghum and qat with coffee). When these strategies are considered in all catchments, the most effective strategy was found to be the drip irrigation, followed by closed conduits then traditional irrigation channels. Owing to the current water use patterns, the annual withdrawals from the lower catchment aquifers exceed the renewable resources where the annual drop in water depth reaches 0.3 meter and this will likely to continue into the future, in the absence of a vigorous interventions. In the reference scenario, the adaptive capacity of water resources will likely continue at points below insufficient levels. In other words, the level of rainwater harvesting to secure additional sources of water for use and/or aquifer re‐charge across the pilot area in general, and the lower coastal basin aquifer in particular, is projected to continue to be rather low. Under such conditions, the groundwater storage in the Quaternary aquifer of the costal lower catchments is projected to likely experience further deteriora on by the year of 2033. Therefore, it is concluded that water availability in the coastal lower catchment zone is relatively more vulnerable to changes in temperature and rainfall patterns compared to the mountainous upper catchment of the pilot area of Wadi Surdud. 3.2.4 Proposed Adaptation Measures Due to the different vulnerabilities across the coastal and mountainous areas of Surdod drainage basin, appropriate climate change adaptation measures were proposed to suit the context for each of the indicated areas. The choice of adaptation strategy depends on the influencing conditions of the particular case study region, including both physical and stakeholder inputs. For the coastal area the implementation of drip irrigation was identified as the best strategy in terms of water savings and application of water on farmlands

39
followed by conveying irrigation water through closed conduits. As the majority of farmers are poor and barely coping with existing living costs, subsidization or donor support would be needed for implementation. The stakeholder consultation was highly valuable in identifying the best options for adaptation. The simulation period in this study was twenty five years (2008‐2033) and the adapted strategies and measures were, Rehabilitation of traditional irrigation channels, conveying irrigation water through closed conduits, and the use of drip irrigation method and changing crop patterns. The simulation results showed that improving irrigation efficiency through using drip irrigation technique is found to be the best strategy to be adopted, followed by the strategy of using closed conduits for conveying irrigation water to farms, and then the least preferred strategy, the rehabilitation of traditional irrigation channels while changing crop pattern, which was found to have little impact on water savings for our case. The amount of water saved for the adapted strategies, drip irrigation and closed conduits, are 157.3 MCM/y and 91 MCM/y, respec vely
In nutshell:
The pilot area generally suffers from escalating water pressures due to intensive agricultural production.
The dominant water consumption in the coastal area of the catchment is agriculture which consumes 97 percent of the abstracted ground water and only 3 percent for municipal use. Up to date, there is more than 5000 borehole in the coastal area of the catchment alone which eventfully leads to over‐exploitation of groundwater unless some strategies to stabilize water supply and demand patterns are introduced.
At the present time, annual withdrawals from the Quaternary aquifer exceed renewable resources where the annual drop in water depth reaches 0.3 meter and will likely to continue into the future in the absence of a vigorous policy intervention.
In the mountainous region, the groundwater is nearly stable due to higher rainfall compared to the coastal area of the catchment. Inhabitants of the mountainous area of the catchment rely on rainfall as a main source for agriculture, while groundwater as a supplementary source of which about 66 percent is used for agriculture and 33 percent for domestic purposes.
The climate variability and climate change was concluded to be less influential compared to the current and predicted agricultural and household water consumption patterns.
Therefore, the choice of adaptation strategy is proposed to be area‐specific and suits the existing water use patterns of the area in addition to inhabitant main source of waters. As such, for the coastal area of the catchment, implementation of drip irrigation has been identified as the best strategy in terms of water savings and application of water on farmlands followed by conveying irrigation water through closed conduits. As the majority of farmers are poor and barely coping with existing living costs, subsidization or donor support would be needed for implementation.
As for the mountainous area of the catchment, improved efficiencies through drip irrigation and improved water distribution systems will have demonstrable effects

40
when combined with other supporting adaptation initiatives such as water harvesting/diverting structures (e.g. dams, cisterns etc.).
Improving of indigenous methods (e.g. rehabilitation of traditional irrigation channels) for wadie flow use was concluded to be the most feasible adaptation strategy option for farmers along the Wadi. The farming communities along this wadie were found to be well aware of the need to harvest wadie storm flows.
3.3 Coastal Zone Pilot V&A study: The Case of Aden Governorate Under the SNC, the priority area targeted in the coastal area V&A stud was Aden Governorate, as a new area of study relative to the INC which targeted Hodeida Governorate. The coastal area V&A study carried out a vulnerability analysis to assess the impact of sea level rise (SLR) on the coastal area of the Governorate of Aden, and discuss the possible adaptation options. With the identification of the scenarios for accelerated SLR, the study also identified the possible impacts on both the coastal habitats and socio‐economic. This includes identification of biophysical impact of SLR on the coastal area and the socio‐economic impacts. Aden Governorate was selected as a case study for coastal V&A in the SNC for many reasons including its social, economical importance in addition to its huge low‐lying coastal areas. 3.3.1 Socio‐economic and Topography Governorate of Aden (see figure 3‐4) is one of the important governorates in Yemen as it represents the main harbor of Yemen. Aden Harbor is located only 4km from the international navigation rout. It is one of the largest natural harbors in the world with an area of about 70 km2 of sheltered water. According to the 2004 Census, the population of Aden Governorate is 598,419. The average number of families of Aden Governorate is 90,667, and number of dwellings is 97,408 households.
Figure 3.4 Aden Governerata
Aden consists of two parts, the mountainous region and coastal plateau. The southern part consists of two peninsulas, Aden and Little Aden, and an intervening stretch of the mainland. The two peninsulas of Aden are connected by sandy and muddy encircling Gulf of

41
Al Tawahi. The volcanic rock formation of Ras Umran and the island of Jabal Aziz is similar in structures and formation to that of Aden and Little Aden, although erosion great impact had been aggravated from the marine side. Aden Governorate’s coastal area extends from Qa'awa in the west to Al Alam in the east. The Coastal Plateau is located in the northern part of Aden, which starts by linking the two peninsulas to the mainland, then ascends gradually towards the north. This Plateau is flat, mostly covered with sand dunes and includes two wadies (Wadi Al Kabeer and Wadi Al Sageer). The two wadies are considered as extensions of Tuban Wadi, which is located in Lahj Governorate, and include Tuban Delta in between. These two wadies are terminated at Al Tawahi Bay. Aden Governorate has 21 islands and rocky heads mainly found around Little Aden and Ras Umran and Gulf of Al Tawahi, in addition to Perim Island in Bab el Mandab. Offshore islands around Aden is a rocky islands supporting a scattered coral reefs and are mostly fishing areas in addition to many other activities. The Gulf of Aden takes up about two thirds of total coastline of Yemen. The landmasses surrounding the Gulf of Aden are characterized by hot and dry climates with little vegetation. Strong winds blowing across these areas often carry sand and dust. The Gulf of Aden coast is dominated by the Indian Ocean monsoon system. The topographic structure of the coastal plain of Aden comprises of three classes as described by MEP (1995). The rocky sub‐littoral coasts, this includes Crater and Buraiqah, medium energy sandy coastal plains with fine sands, this type mainly located from Khormaksar east to Shuqra, and the same from Ras Umran to Qa’awa. The third type is also fine substrates of low energy of mud/fine sands; this type is located along the sheltered Al Tawahi Bay between the headlands of Little Aden and Crater, as well as the sheltered sandy bay to the west of Ras Foqm. The second and third classes are more vulnerable to sea level rise and climate change as the coastal slope is less the 5º. 3.3.2 Methodology To accomplish the coastal V&A study’s objective, relevant data was collected. Data collected, and used in the study includes the following:
Socio‐economic;
Climatologically data for the past 18 years;
Monthly air temperature, wind speed, and sea level pressure, for the period from 1992 through 2009;
Historical de gauge data for about 60 years, from 1880 through 1969 with some gaps; and
Topographical maps of D38‐114 and D38‐115 covering Aden Governorate with scale of 1:100,000.
The study’s approach adopted a range of assessment methods including stakeholder’s involvement, and expert judgment. Stakeholders were involved in the assessment through discussions and questionnaire surveys about the vulnerability and adaptation to sea level

42
rise (SLR) in Aden Governorate. On the other hand, readily appropriate modeling tools such as geographic information systems (GIS) and Dynamic Interactive Vulnerability Assessment (DIVA) were used to obtain a sense of the magnitude of the potential impacts associated with SLR scenarios were used.
Two plausible future Sea Level Rise (SLR) scenarios were assumed. SLR projections were assumed based on the following:
Locally observed MSL rise rate of 3.3 mm/year for Aden (Woodworth et al., 2009)‐ observed scenario; and
Gglobally extreme MSL rise rate of 5.9 mm /year (derived from IPCC (2007) at the Highest High Tide (HHT) ‐ extreme scenario.
Scenarios for sea levels were estimated in meters above MSL, using the following formula.
SWL = {(rate/1000) x (year ‐ 2008)} + HHT – MSL
SLR for Aden Governorate for 2020, 2050, 2080 and 2100 were projected as metres above MSL, which is 1.4 m above Charter Datum (CD) for Aden, relative to the baseline year of 2008. On the other hand, methods as outlined by Nicholls (2006) were used for calculation of inundated areas induced by climate change SLR, and coastal storm surges. As a general approach, the Global Vulnerability Assessment (GVA) was used to determine the Population at Risk (PaR) in each of the two scenarios. It worth‐mentioning that the first scenarios is consistent with findings of the IPCC fourth assessment report which suggests a rise in sea level globally by 18‐59cm by the end of this century. In addition, it is also consistent with a number of regional reports including for instance a study by Unnikrishnan and Shankar (2007) using sta ons from the northern Indian Ocean which has indicated that the SLR at Aden coasts is about 2 mm/year. In addi on, Woodworth et al. (2009) indicated that the SLR at Aden is similar to that of other places in the globe. Furthermore, the scenario is consistent with an extrapolation of past trends evident in the region (IPCC’s Fourth Assessment Report, 2007). Additionally, the second scenario has assumed a mean sea level rise rate of 5.9 mm/year which is consistent with the reported IPCCC Fourth Assessment Report’s projections of deglaciation acceleration rates. In nutshell, the two scenarios have adapted minimum and maximum expected rise in sea level given the findings of IPCC’s Fourth Assessment Report. Afterward, the sea level rise rates were then integrated into local highest high tide estimates which then used to estimate the maximum sea level rise for the years 2020, 2050, 2080 and 2100. 3.3.3 Key Findings and Conclusions The IPCC Fourth Assessment Report (4AR) suggested globally average SLR by 18‐59 cm by the end of this century. Regionally, Unnikrishnan and Shankar (2007), using sta ons from the northern Indian Ocean, showed that the sea level at Aden rises by about 2 mm/year, which is similar to that of the global es mate. Woodworth et al. (2009) showed that SLR at Aden is similar to that of other places in the globe. These studies confirm that sea level is rising in Aden and will continue in future.
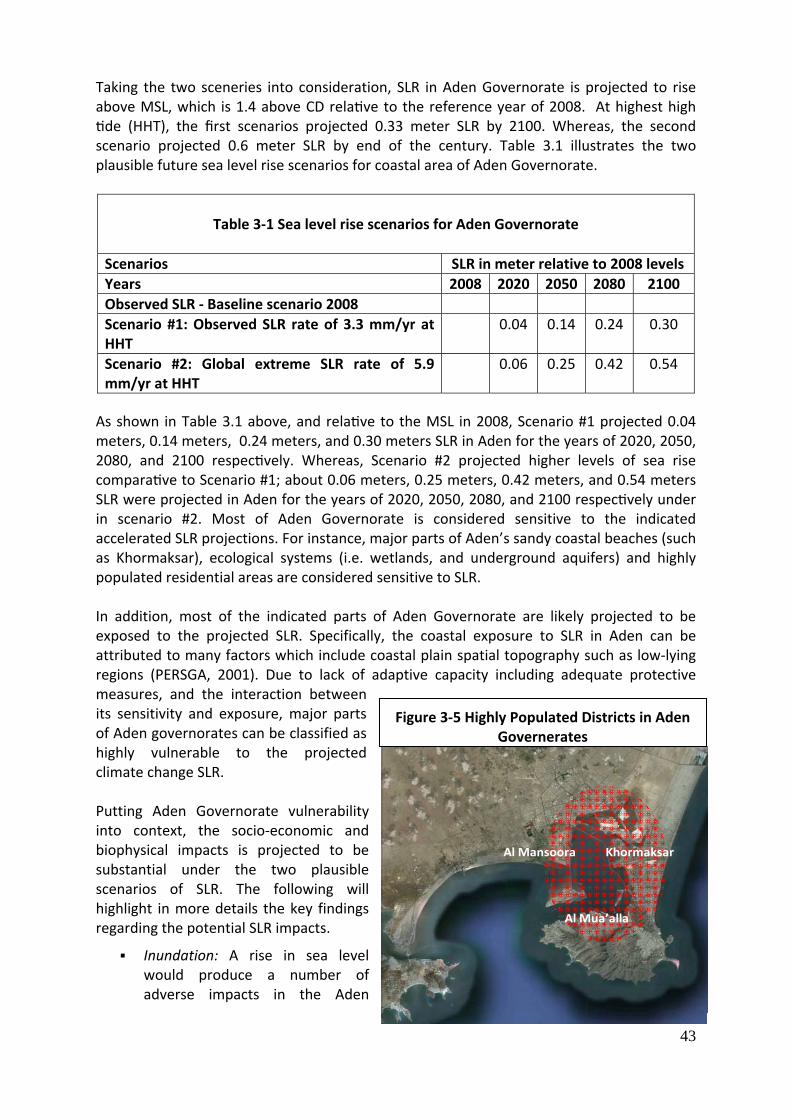
43
Taking the two sceneries into consideration, SLR in Aden Governorate is projected to rise above MSL, which is 1.4 above CD rela ve to the reference year of 2008. At highest high de (HHT), the first scenarios projected 0.33 meter SLR by 2100. Whereas, the second
scenario projected 0.6 meter SLR by end of the century. Table 3.1 illustrates the two plausible future sea level rise scenarios for coastal area of Aden Governorate.
Table 3‐1 Sea level rise scenarios for Aden Governorate
Scenarios SLR in meter relative to 2008 levels
Years 2008 2020 2050 2080 2100
Observed SLR ‐ Baseline scenario 2008
Scenario #1: Observed SLR rate of 3.3 mm/yr at HHT
0.04 0.14 0.24 0.30
Scenario #2: Global extreme SLR rate of 5.9 mm/yr at HHT
0.06 0.25 0.42 0.54
As shown in Table 3.1 above, and rela ve to the MSL in 2008, Scenario #1 projected 0.04 meters, 0.14 meters, 0.24 meters, and 0.30 meters SLR in Aden for the years of 2020, 2050, 2080, and 2100 respec vely. Whereas, Scenario #2 projected higher levels of sea rise compara ve to Scenario #1; about 0.06 meters, 0.25 meters, 0.42 meters, and 0.54 meters SLR were projected in Aden for the years of 2020, 2050, 2080, and 2100 respec vely under in scenario #2. Most of Aden Governorate is considered sensitive to the indicated accelerated SLR projections. For instance, major parts of Aden’s sandy coastal beaches (such as Khormaksar), ecological systems (i.e. wetlands, and underground aquifers) and highly populated residential areas are considered sensitive to SLR. In addition, most of the indicated parts of Aden Governorate are likely projected to be exposed to the projected SLR. Specifically, the coastal exposure to SLR in Aden can be attributed to many factors which include coastal plain spatial topography such as low‐lying regions (PERSGA, 2001). Due to lack of adaptive capacity including adequate protective measures, and the interaction between its sensitivity and exposure, major parts of Aden governorates can be classified as highly vulnerable to the projected climate change SLR. Putting Aden Governorate vulnerability into context, the socio‐economic and biophysical impacts is projected to be substantial under the two plausible scenarios of SLR. The following will highlight in more details the key findings regarding the potential SLR impacts.
Inundation: A rise in sea level would produce a number of adverse impacts in the Aden
Al Mua’alla
Al Mansoora Khormaksar
Figure 3‐5 Highly Populated Districts in Aden Governerates

44
Governorate. For instance, with the projected sea level rise of 33 cm, the percentage of the inundated area is 43 Km2, which represents about 5.7% of the total area of Aden Governorate (about 750 km2). The inundated area would increase to about 45 km2 (6%) for SLR of 60 cm. Inunda on will unevenly affect Aden Governorate coastal area. Khormaksar, Al Tawahi Bay, the coastal beach between Khormaksar and Al Alam (Abyan Coastal Beach), Aden lagoons and wetlands are the most affected regions. About 3.90 km2 will be inundated in the dens populated area of Khormaksar, Al Mansoora, and Al Mua’alla Districts for SLR of 33 cm, while 4.35 km2 would be inundated for SLR of 60 cm. For the upper range of sea level rise, inundated areas are expected to cover a total land area of about 43 km2, or less than 6% of the total area of Aden Governorate. Khormaksar, Al Tawahi Bay, coastal beaches, lagoons and wetlands would be the most impacted. About 4 km2 would be inundated in the densely populated area of Khormaksar, Al Mansoora, and Al Mua’alla Districts (see red‐shaded are on Figure 3‐5). The number of structures which would be inundated represents about 12% of the total number of buildings in the governorate, would likely impact almost 100,000 people, and result in property losses around $2 billion in today’s year dollars.
Erosion: For the upper range of sea level rise, it is expected that erosion associated with increased wave energy will be significant. The recession of the shoreline was determined to be about 23 meters along the eastern part of the study area (i.e., Khormaksar up through Al Alam). For the western part of the study area around Foqm Bay, the shoreline recession would be around 18 meters. For the en re coastline of the study area, the additional land loss due to erosion (i.e., over and above the land loss from inunda on) would amount to an addi onal 48 hectares.
Saltwater intrusion: As sea level rises, fresh groundwater and surface water is expected to be further displaced by saline water, which will have substantial adverse impacts on drinking‐water supply and agriculture. Currently, the Aden governorate obtains freshwater supplies from 4 major aquifers. Two of these aquifers, Bir Ahmed and Abyan, which account for about 50% of total supply, have been determined to be highly vulnerable to saltwater intrusion. The Bir Ahmed aquifer is the only groundwater source located within the Aden Governorate and has annual extraction levels that are already higher than sustainable levels. With sea level rise, it is expected that the interface between the freshwater and saltwater will migrate inland significantly. For the Abyan aquifer, a major water supply source northwest of the Aden governorate, it is expected that the interface between saltwater and freshwater will extend inland by 160 meters in Scenario 1 and by about 240 meters in Scenario 2. The implica on of these findings is that boreholes will become increasingly brackish and unproductive in time.
Flood frequency and damage: Yemen has long lived with the threat of intense cyclones, with the 2008 Yemen cyclone causing severe flooding, leaving about 180 dead in the governorates of Hadhramaut, Lahij, Al Mahrah and Ta'izz. With climate change, more intense tropical storms are expected to affect Yemen’s coastal areas making communities even more vulnerable to storm surges and the ensuing flooding. With sea level rise, the additional wave height associated with storm surges was determined to be about 1.4 meters greater than current baseline for Scenario 1 and about 1.7 meters greater for Scenario 2. The area vulnerable to storm surges is

45
expected to extend to cover most of the coastal plain of Aden Governorate, including Khormaksar, Al Mansoorah, Al Mua’alla, Al Buraiqah, and the beach between Ras Umran and Foqm. This would affect about 50% of the popula on in an area where popula on density is projected increase nearly threefold to 2,100 people per km2 by 2030. The coastal V&A study indicated that the coastal area would become more vulnerable to flooding due to mainly four reasons: (i) A higher sea level would provide a higher base for storm surges to build upon; (ii) Beach erosion would leave particular properties more vulnerable to storm waves; (iii) Higher water would reduce the coastal drainage and hence increase the risks of flooding due to rainstorms; and (iv) a rise in sea level would raise water tables.
Ecological impacts: Much of Aden’s rocky shore habitats are exposed between high and low tide and provide a hard substrate for many marine species which will become at risk as the intertidal zone shifts with sea level rise. Organisms that are slow growing or are essentially sessile, such as the limpet during maturity, may not adapt quickly enough to the pace of a shifting intertidal zone and subsequently decline in number. The rise in the sea level would also threaten sandy coastal habitats and the species that are dependent on it, such as Ghost crabs, birds and Hawksbill turtle (Eretomchelys imbricate) which use beaches as foraging and reproduction areas. The intensification in storm activity will adversely affect breeding grounds as hiding places for juvenile fish are washed away before they have a chance to grow to maturity. Increased wind and wave action could also strip the shore of photosynthesizing flora and therefore affect the entire food web dependent on them. Regarding coral reefs, bleaching incidents similar to the 1997 – 1998 incidents in the reefs of Red Sea, Gulf of Aden and Socotra Archipelago will be at risk from rising seawater temperatures. Finally, the acidification of seawater will negatively affect marine crustaceans’ fauna, due to its negative on their calcium carbonate external skeletons, which could eventually impact the entire sea ecosystem in the region.
3.3.4 Proposed Adaptation Strategies The varied adaptation strategies were proposed to suit the different needs from the areas vulnerable to SLR impacts. The following highlights the various adaptation needs across the pilot area of Aden.
First, a fundamental strategy that needs to be implemented without delay is integrated coastal zone management (ICZM). This is a synergetic approach that can be applied among national level development partners for promoting sustainable development in the face of climate change. Currently, various national institutions have enacted environmental action plans to address environmental degradation. Several strategies and plans are already underway in this direction including national environmental action plans, biodiversity plans, coastal management plans and wetland conservation strategies. International support for more action is urgently needed.
Second, awareness‐raising among the range of stakeholders, especially policymakers, is essential to effective adaptation planning. Such programs are currently lacking in Yemen and there is a significant gap between the threat of
46
climate change and knowledge about the strategies and measures necessary to build local resilience. Effective capacity strengthening is required to inform planners in Yemen to the range in technologies and polices that are proving effective in other parts of the world for protecting vital coastal resources and vulnerable populations.
3.4 Agriculture pilot V&A studies: The Cases of Sorghum and Wheat As indicated in NAPA, the agriculture is among the most vulnerable sectors to climate change in Yemen. Consequently, agriculture V&A assessment were carried out under the SNC thematic studies. Agriculture V&A assessment under the SNC have covered two cereal food crops namely Sorghum and Wheat across three pilot areas. The three pilot areas included selection of a coastal area (Al‐Hodeida Governorate ‐Bajil district), a mountainous area (Al‐Mahweet Governorate ‐Shiban district), and the Wadies (Siyuon sub‐ Governorate ‐ Wadi district). The selection of the pilot areas was made based on several factors but mainly to represent the key agro‐climatic zones in Yemen. Sorghum and Wheat were selected because of that they represent the major cereal crops in terms of production, and area of cultivation in Yemen. Moreover, Sorghum in particular has indispensible value for rural farmers because of that residual leftover of plants are mainly used as forage/silage for livestock. 3.4.1 Socio‐economic, and Crop Background There are three key agro‐ecosystems in Yemen which mainly depends on favorable climatic conditions including temperature, and rain‐fall. These agro‐ecosystems are namely: rain‐fed; rangelands; and irrigated. The rain‐fed agriculture in the highlands represents more than half of the total cultivated area of Yemen. In other words, the livelihoods of a large portion of Yemeni population depend mainly on dry‐land farming systems. The area of the Wadi of Sieyoun in Hadhramout (see Figure 3‐6) is about 2 million hectare. The popula on of Wadi was es mated by 447,000 according to 1995 census. Wheat is considered as one of the most important crops in the Wadi, and cultivated in an area of about 6000 hectare annually. Sorghum in the Wadi is also considered as one of the most cereal crops which is cultivated in a large area and planted for seed production and fodder. The most dominants varieties of sorghum used by the farmers are the local ones. There are three main water resources in the Wadi including surface water which is es mated by about 144 million cubic meters. Ground water is es mated at 10 billion cubic meters. Spring water like Wadi‐Alainis es mated about 24 million cubic meters, and Wadi‐Adim is around 36 million cubic meters.

47
Figure 3‐6 Map of Sieyoun
The district of Bajil covers an area of about 1,644 square kilometer and lies almost in the center part of Al‐Hodeida governorate (see Figure 3.7 below). The total population of Bajil district is estimated at around169, 884 inhabitants. The annual Rainfall is characterized by high variability (spatial and temporal) in the context of semi‐arid climate because the catchment is drought‐prone especially towards the west part of the study site. There are two major resources surface water and groundwater. Surface water is the major water sources in the district. Five different farming systems can be distinguished in the district in accordance with the irrigation system that applied: Irrigated farming system by floods; irrigated farming system by deep wells; irrigated farming system by shallow wells; Rain‐fed farming system; and rain‐fed farming system with water harvesting. The most important crops grown in the district of Bajil are cereals with an estimated cultivated area of about 24,227 hectares. The percentage of sorghum is about 67.53% of the total cereal crops.
Figure 3‐7 Map of Hodiedah‐Bajil The district of Shibam is located in southern part of Mahweet governorate (see figure 3.7). There are two main farming systems in Shibam: Rain‐fed and irrigated. In the high plateau region, the cropping pattern is characterized by the dominance of wheat, barley, legumes, and little sorghum. The percentage of cultivated area of Wheat and Sorghum from the total arable land of the district is about 26%, and 24% respec vely.

48
Figure 3‐8 Map of Al‐Mahweet‐Shibam
3.4.2 Methodology To achieve the objective of the study, two perspectives were undertaken: The socio‐economic; and the biophysical. The quantitative socio‐economic perspective aimed at estimating the vulnerability and potential losses that may arise from climate change impacts. The assessment was carried out through stakeholder involvement. In general, formal questionnaire and informal discussion groups with local communities including farmers across the three different agro‐ecological zones in Yemen were used. The study targeted a wide spectrum of stakeholders including local communities and farmers who retain indigenous knowledge pertaining to management of natural resources. The local knowledge was utilized as an input to the study. In each study area, structured interviews, questionnaires and observation methods were used to identify how farmers were coping with climatic variability already in evidence and explore potential strategies for future adaptation. The feedback was instrumental in validating national data on agricultural productivity, benchmarking anecdotal evidence to the observed meteorological patterns. They were also helpful in establishing a framework for assessment of potential adaptation strategies and measures relevant to the specific needs of each of the respective pilot case study areas. The formal questionnaires focused on specific topics of selected crops, agro‐biodiversity importance and indigenous knowledge which are held by local communities though different geographical landscapes. Participatory Rural Appraisal (PRA) tool was particularly relevant for the purpose of group discussion or adapted to the specific concerned notions. The appraisal process included field observations, discussion groups involving farmers specifically dedicated to diagnoses of agriculture vulnerability to climate change, traditional farming, land and water resources as well as community socio‐economic profiles. Feedback from communities has been interpolated at the end of each discussion sessions, associated to team meetings and brainstorming. The community feedback helped the team of experts to discuss, re‐adapt and finalize indicators to vulnerability and adaptation across the selected areas. In particular, to relate to collected preliminary data on agriculture, agro
49
biodiversity conservation, natural resources managements and local knowledge, and with regard to the socioeconomic situation. Appropriate statistical and analytical tools and models (i.e. Descriptive statistics, Quantitative analysis, simple regression, probabilistic modeling, and FAO CROPWAT and AQUACROP models) were used to estimate the relationship between changes in climate change parameters and their corresponding impacts on wheat, and sorghum yields across the three pilot areas under certain climate change scenarios. On the other hand, the biophysical perspective aimed at estimating the vulnerability of the two key crops under certain climate change scenarios across the three pilot areas based on the net irrigations requirements (NIR) for those irrigated areas, and the water, and heat requirements for those in rain‐fed areas. Assessment of productivity was performed through expected deficiency of irrigation water using CROPWAT and AQUACROP models. Assessment of yield losses owing to irrigation deficiency the information on current irrigation system was used. For more authentic vulnerability assessment of agriculture, for instance, supplementary irrigation requirements and yield losses, the data on new varieties of agricultural crops were essential, as well as, their characteristics as to draught‐ and salt‐resistance, more differentiated registration of reclamation state of lands. In general, the Wallingford (2009) approach was adapted. However, owing to lack of sufficient authentic statistic information on number of cattle and grazing pressure, livestock farming sector, the vulnerability assessment has not as comprehensive as possible. The approach basically set out a rationale for carrying out climate change impact assessment through: Application of simple sensitivity test to national scale; estimation of climate change effects on agriculture; impacts assessment approach; and establishing a climate baseline. In general, three scenarios were selected: the core scenario (OSU), the wet scenario (ECHAM3TR) and the dry scenario (UKH1). These scenarios are based on the Global Climate Model (GCM) which are very course but at least can provide a basis for prediction. 3.4.3 Key Findings, and Conclusions The three climate change scenarios were used under the SNC. The three scenarios are coarse and represent regional projections as downscaled from Global Climate Models (GCM). In general, the three scenarios have projected future changes in climatic parameters including likely temperature rise, and fluctuation in precipitation patterns in Yemen. The following outline the outputs of the three regional scenarios (see Figure 3‐9) by projecting climatic parameters for the years of 2030, 2050, and 2080.
Warm and wet: Rela ve to the reference year of 2009, this scenario projected temperature rise of about 1oC in 2030. On the other hand, it also projected increase in rainfall by about 25 % in 2030.
Mid: In this scenario about 1.6oC temperature rise was project by 2030, and li le increase in rainfall by about 2 % about 2030 was also projected.
Hot and dry: The scenario projected temperature rise of about 2oC in 2030. However, it projected decrease in rainfall by about 3 % in 2030.

50
Figure 3‐9 Regional Climate Change Scenarios ‐Agriculture Study
The study indicates that Sorghum is less sensitive to climatic changes in terms of rainfall decrease, and temperature rise than Wheat. In other words, Wheat is more sensitive to temperature rise than sorghum does. Typically, Sorghum is a crop that has a number of features which make it tolerant to hot and dry conditions. In dry areas with low and/or erratic rainfall, Sorghum can respond very favorably to supplemental irrigation. However, considerable differences exist amongst varieties in their response to irrigation and those that are considered very drought‐resistant respond slightly while others produce high yields under irrigation but are poor yielding when water is limiting. Sorghum across the pilot areas is extensively grown under rain‐fed conditions for grain and forage production. But many local varieties of Sorghum which used to adapt to the local environment have already disappeared. Compared to Sorghum, many local farmers have maintained indigenous varieties of Wheat for cultivation year by year in Al‐Mahweet‐Shibam pilot area of the study. Using the FAO model CROPWAT (Smith 1992), the Wheat and Sorghum yields under the indicated climate change scenarios for the years of 2030 were projected. In generally, rain‐fed sorghum is more exposed to the projected climatic changes in rainfall and temperature than Wheat. Sorghum which is grown in rain‐fed areas will likely be more exposed to the projected climate changes. In contrast, Sorghum which is grown in irrigated areas will likely be less exposed to the projected climate changes. Although wheat is more sensitive to unfavorable climatic changes than sorghum, it will likely be less exposed to the projected changes than Sorghum. The reason for that can be attributed to the varying spatial characteristics of the pilot areas, and locally conserved indigenous genetic variability of Wheat compared to Sorghum. Absence of sufficient genetic variability of Sorghum increases the extent to which it will likely be exposed to the projected changes in climate parameters under the three climate change scenarios. In the semi‐arid pilot area of Al‐Mahweet, changes in the temperature and precipitation given under the three scenarios was found to introduce lesser Sorghum yield reductions compared with the observed values which may indicate that favorable climatic conditions for Sorghum growth in this high‐rainfall region. It should be noted that Sorghum yield reductions under the wet scenario is expected to be more than twice as much as under the

51
other two scenarios. This could be due to potentially poor soil drainage induced by wetter climatic conditions which characterizes the pilot area. On the other hand, wheat yield showed no response to climatic changes; as both the observed and predicted yield reductions were zero. This result may not indicate that the vulnerability of wheat farming systems to expected climate change scenarios. Now and in the future, crops like wheat and Sorghum may not show vulnerability, in terms of heat and water requirements under prevailing climatic conditions of the Yemen highlands. On the contrary, wheat and Sorghum growing in the semi‐arid highlands (Mahweet‐Shibam) will experience higher future crop yield reductions than present (except under the wet scenario). Summer wheat, however, growing in this semi‐arid region will maintain present or slightly higher yield reduc on (< 25%) except under the wet scenario (ECHAM3TR), when wheat yield reduction will sustain only a third of the yield reduction present levels. It is obvious to conclude that higher wheat yield would be obtained, now and in the future, by practicing supplemental irrigation; unless wetter climatic conditions were prevailing. Regional differences are evident for vulnerability of both crops to expected changes in temperature and precipitation. Basically, spring wheat growing in the desert plateau will require less irriga on (< 0%) than it uses at present; the increased NIR in Sieyoun, as given by the core and wet scenarios is barely going to exceed2%. It is demonstrated by the CROPWAT that the expected actual water use (ETC) by wheat would show almost no vulnerability to climate change. This finding may support the idea that wheat production in the plateau area will have substantial potential. Unlike in Sieyoun, wheat ETC is going to decrease (by all scenarios) which may be indicative of either efficient water use or probably lower crop yield. This matter remains to be further investigated, along with predic ons of CO2 concentra on. Other signs of vulnerability in crop production, under expected changes in temperature and precipitation, could be related to the incidence of pests and soil conditions. Increased temperatures, coupled with the same or higher precipitation, generally provide better conditions for the development of diseases and other pests, including weeds. It can be concluded, the vulnerability of the two cereal food crops to climate change of rainfall and temperature varies from crop to another and from agro‐ecosystem to another in addition to the scenario under which yield reductions or increase occurs. Taking hot and dry scenario into a context, Wheat yield is projected to decline drastically by 2030 in Sieyoun due to reliance of local farmers on improved cultivars which are extremely sensitive to hot and dry conditions. In such a reference scenario, the impact on Wheat yields due to sensitivity, and exposure as well as lack of adaptive capacity is projected to be substantial. On the other hand, Wheat which is grown on the rain‐fed highlands of Al‐Mahweet will likely be less vulnerable in reference scenarios owning to the enormous genetic variability of indigenous varieties which more often composes relatively hot and dry‐tolerant cultivars. Having such genetic variability of Wheat, exposure to the projected climatic changes is reduced. As such, relatively higher sensitivity but lesser exposure is expected to keep vulnerability at reasonably lower levels.
52
Yet, rain‐fed Sorghum in Al‐Mahweet will likely be more vulnerable to the projected climatic changes due to several reasons which include plausible changes in agricultural season’s calendar, and lack of sufficient endogenous genetic variability under the reference scenarios. In other words, although Sorghum is less sensitive, the projected high exposure will likely increase its vulnerability under the reference scenarios in which weak adaptive capacity is prevailing. Putting Sorghum exposure into context, the vulnerability of the crop in rain‐fed areas is relatively high and will likely result in severe loss of crop yields under the projected changes in rainfall, and temperature by 2030. 3.4.4 Proposed Adaptation Measures For each case, appropriate adaptation actions should be put in place to ensure that yield reductions are minimized particularly under the warm and dry scenario. Specific adaptation measures which were combined with the outputs of policy discussions within the Ministry of Agriculture are recommended. Altogether, the following are concluded as recommendations for adaptation:
Crop varieties: The development of new crop types and enhanced seed banks should be prioritized. Seed banks that maintain a variety of seed types provide could provide farmers with new opportunities for diversifying crops that will allow them to both counter some of the climate change threats and develop a profitable specialization.
Drought‐resistant seeds: Heat and drought resistant crops should be integrated into farming communities to improve production in marginal rain‐fed areas. This is critical given the continuing trends in the growth of farm community populations.
Mono‐cultivation: Mono‐culture should be avoided. Instead, a variety of heat and drought resistant crops should be encouraged. Cultivation of single crops such as maize increase farmer’s vulnerability to climate variability. Planting a wider variety of crops will serve as a hedge for the risk of crop failure. Agricultural extension services should be in the lead for assisting farmers to operationalize such a strategy.
Tax policy: Tying subsides or taxes to the type of crop and acreage should be avoided. This is because commodity support programs or tax policies may discourage switching from a vulnerable cropping system to a more resilient one. Such a strategy will tend to improve the efficiency of farming practices while also increasing the ability of the system to recover from annual impacts of climate change.
Water use efficiency: Many farming technologies such as efficient irrigation systems provide opportunities to reduce dependence on natural factors such as rainfall and runoff. Efficiency improvements allow greater flexibility by reducing water consumption without reducing crop yields. This will also help in adapting water resources.
Awareness‐raising: Many practices such as conservation tillage furrow, terracing, contouring and planting vegetation to act as windbreaks will protect fields from water and wind erosion and can help retain moisture by reducing evaporation and increasing water infiltration. Raising awareness on the advantages of such

53
management practices that reduce dependence on irrigation will reduce water consumption without reducing crop yields.
Trade policy: Lowering trade barriers will result in higher levels of global agricultural production both under the current climate and under climate change scenarios. Farmers will receive information on changes on global market conditions in a timely manner with lower trade barriers.
Early warning systems: It will be important to promote agriculture drought management. This should be accomplished by encouraging management practices that recognize drought as part of highly variable climate rather than treating drought as a natural disaster. An integrated early warning system should be developed by which farmers can be given information on climate conditions. Moreover, incentives can be offered to adapt sound practices of drought management.

54
List of References
Abubakr, M., Al Saafani, M., Nagi, H., Hajer, A., and Alhababy, A., 2010. “Coastal Zone Vulnerability and Adaptation Assessment, Aden Governorate, Republic of Yemen”
Alhakimi, S., Noaman, A., and Haidera, M., 2010. “Water Resources Vulnerability and Adaptation to Climate Change in Yemen Republic: The Case Study of Wadi Surdud with its Contributing Catchments”, Sana’a University, Republic of Yemen.
Ali, O., 2007. “Adapting to Water Scarcity for Yemen’s Vulnerable Communities: the Case Study of Sadah Basin”, Water and Environment Center (WEC), Sana’a University, Republic of Yemen.
Bafadle, O., 2010. “A Study on Agriculture Vulnerability and Adaptation to Climate Change in the Republic of Yemen”.
Haidera, M., 2007. “Adapting to Water Scarcity for Yemen’s Vulnerable Communities: Case Study: Aden City”, Water and Environment Center (WEC), Sana’a University, Republic of Yemen.
Noaman, A., 2007. “Adapting to Water Scarcity for Yemen’s Vulnerable Communities: Case Study, Sana’a City”, Water and Environment Center (WEC), Sana’a University, Republic of Yemen.

55
6. Greenhouse Gas Mitigation
Greenhouse Gas Mitigation
Chapter 4:

56
As a non‐annex I country that is also an LDC, Yemen is not required to meet greenhouse gas reduction targets under the UNFCCC or the Kyoto protocol. Nevertheless, sustainable energy policies, programs, and projects are being increasingly prioritized in Yemen as a way to exploit its ample renewable energy resources, meet fast‐growing energy demands, and at the same time reduce the environmental impacts of energy use. This chapter provides a description of Yemen’s efforts in reducing greenhouse gas emissions within the context of key sustainable development initiatives. It also provides an overview of the reductions that could be achieved in critical emitting sectors and a forward‐looking set of recommendations for overcoming current challenges and barriers. 4.1 National Context for GHG Mitigation Activities To provide a relevant national context for GHG mitigation in Yemen, a number of considerations were highlighted. First, the socio‐economic context was analyzed. Second, the trends in anthropogenic GHG emissions over a specific period of time were modeled, and analyzed. Third, the recommended GHG mitigation measures were drown based on the concluded policy implications. Following this approach, two scenarios were explored: The Baseline and the Mitigation Scenario for the GHG emission and Energy Balance were developed based on the modified data already developed for the Base Year 2000. The two Scenarios spanned over the me frame of 25 years star ng with the base year 2000. The two scenarios were modeled based on changes in socio‐economic context in Yemen over the indicated period, and changes in the microeconomic, energy demand, and supply parameters. However, the Baseline Scenario is basically grounded on modeling GHG emission trends in the absence of mitigation policy measures. Whereas, the Mitigation Scenario was grounded on putting proposed mitigation measures in place. With respect to the Mitigation Scenario, the proposed mitigation measures were underlined in light of implications explored while mapping out and analyzing the anthropogenic GHG emitting sectors. The following provides a meaningful context for the GHG mitigation in Yemen, a related socio‐economic and energy supplying & consuming sectors will be explored as follows:
Population: Yemen’s popula on has doubled in size since 1990 and with an annual growth rate of 3.0 %is set to almost double again by 2025 (from 19.7m in 2004 to 38m in 2025). In the year 2000, which is the Base Year for this study, the population reached 17.9 million inhabitants margin living in 2.66 million household, which makes an average density of 6.7persons/household. 25.16% of the total country’s households were urban and the rest, 74.84% cons tute the rural households which are scatter around the country in small clusters of villages.
Economy Sector: Yemen is a low income country with GDP of US$300 per capita in 1995 which have grown to US$900 in the year 2006. The GDP growth rate in the year 2006 reached +3.2%. The GDP (Gross Domes c Product) for the Base Year 2000 was projected to be YER 1,539,386 million Yemeni Rials (US$ 9561.404 million US dollars)

57
[1]. The corresponding GDP per capita was US$ 533.31 with an infla on rate (CPI) of 10.3%.
The Energy Sector: The Energy Sector in Yemen is divided into the following four categories: Oil and Gas; Electrical Power; Renewable Energy (Solar, Geothermal, Biomass, Landfills and Wind); Wood and Charcoal. On this regard, the following sub‐sectors will be highlighted to provide more contextual bearing:
Oil and Gas: Yemen is a small oil producing country and does not belong to the Organization of the Petroleum Exporting Countries (OPEC). Income from oil produc on cons tutes 70% to 75% of Government Revenue and about 90% of its exports. Currently (up to year 2008) crude Oil is the main primary source of energy in Yemen. Oil produc on has reduced from 404,110bbl/day in 2004, to 364,384bbl/day in the year 2006. Yemen has two Oil Refineries which are ac vely refining crude Oil to its by‐products. One of these is in Aden with a refining capacity of 110,000bbl/day and the other in Marib with a refining capacity of 10,000bbl/day. In the early 90’s large quan ty of Natural Gas reserve were discovered. The estimated quantity of the reserves amounts to 17 trillion cubic feet (480 million cubic meters) [1]. In 1997, in order to commercially develop this large quantity of fuel energy, Yemen Gas Company joined with various private companies to establish Yemen Liquefied Natural Gas (YLNG). The country’s first Liquefaction Plant at Balhaf on the Arabian Sea Coast is expected to deliver a total of 6.7 million tons of LNG per year [1], initial shipments for export was started by early 2010 as destined for overseas markets through the Balhaf’s Liquefied Petroleum Gas (LNG) plant on the Arabian Sea Coast. Based on this, Natural Gas will not be considered as a source of energy in the Baseline analysis but will be considered as a fuel that will be used to run electrical generators in the coming years.
Electrical Power: The state owned Public Electricity Corporation (PEC) is the body responsible for the generation, transmission and distribution of electricity in Yemen. PEC operates three thermal power plants with heavy oil (mazot) fired boilers and a number of diesel power stations, with the former being the major source of genera on (49.29% of total generated for the year 2000 ), interconnected in a power network system of about 1161 km, 132 kV transmission lines [3]. The total installed capacity in the year 2000 amounted to 882.47 MW and 3414.3 GWH of total energy generated. The total fuel consumed in the year 2000 was 903,640 tons of Mazot for the thermal genera on and 118,842 tons of Diesels for the Diesel Fuel Genera on.
Renewable Energy (Solar, Geothermal, Biomass and Wind Energy): Four main sources of renewable energies are available in abundance in Yemen and most of them can be harnessed and utilized. Recent study for the “Renewable Energy Strategy” for Yemen carried by the Ministry of Electricity and PEC [4] showed that Yemen has very high potential of renewable energy which can be obtained from Solar, Wind, Biomass and Geothermal sources. The average solar radiation is about 18 ‐ 26 MJ/m2/day over 3,000 hours per year clean blue sky [5] and the

58
theoretical potential for solar electric using concentrated solar power (CSP) reaches about 2.5 million MW [4]. Wind energy on the other hand reaches a poten al of 308,000 MW and Geothermal poten al of about 304,000 MW.
Wood and Charcoal Energy: Fuel Wood and Charcoal are still the biggest source of energy for most of rural and for a few urban areas of Yemen. This fuel has the most serious environmental impact. The base year 2000 consump on is es mated to be 34.68 Million GJ which is equivalent to 2.168 Million Metric Tons.
Energy Consuming Sectors: There are five main Sectors that can be classified as major consumers of energy in Yemen and these are: The Household Sector; The Transport Sector; The Commercial Sector; The Industrial Sector; The Agricultural Sector. In the year 2000 [6] more than 82% of the energy consumed in Yemen goes to the Household and Transport Sectors. This is expected to increase with time since both sectors are directly related to the population growth whereas the other sectors are dominantly related to the economic growth. The transport sector alone consumed an es mated 52% of the total energy consump on in Yemen for the year 2000. In terms of fuels, four major fuels are used in the transport sector and these are Gasoline, Diesel, Fuel Oil and Jet Fuel. Land transportations (including private and public transport vehicles and freight vehicles) are the main consumers of Gasoline and Diesel fuels where as Sea and Air freights consumes most of the Oil and Jet Fuel. It is expected that the Transport and Household Sectors will dominate the impact on the energy map during the period of study and indeed together with the Power Sector they will constitute the major players in the energy scenario.
Total Energy Consumption in Yemen: With the estimated 34.68 Million GJ Wood fuel and 159.21 Million GJ of Oil products consumed in the year 2000 puts the total primary energy consump on in the Republic of Yemen at 194.39 Million GJ, which in terms of fuel volume to be about 5.841 Million Metric Tons of fuels.
In nutshell, Yemen is not an industrial country, and the socio‐economic development of the country is extremely is poor. In addition, the Livelihoods of the majority of people in country mainly rely on access and use of natural resources. To put this national context perspective, As such, Yemen does not contribute much into GHG emissions. Nevertheless, as noted previously, the energy use accounts for the majority of GHG emissions in Yemen, and expected to dominate un l 2025. For 2000, the combus on of fossil fuels in energy supply, transport, and industrial opera ons accounted for about 69% of total GHG emissions in the country. Notably, this share is significantly more than the energy use share of GHG emission in 1995 which was about 57%. This trend is consistent with economic development and figures to intensify in the years ahead. More specifically, as indicated earlier in Chapter II, the Transport Sector; the Household Sector; and the Commercial Sector are those which consume most of the energy. They consume almost 90.58% of the total energy demand in the year 2000 and almost 94.74% of the total energy demand in the year 2025 (the Baseline Scenario).

59
This implies that the main sources of anthropogenic GHG emissions in Yemen are due to three sectors. Thus, such implications were considered as a basis with priority for consideration for the development of effective for Mitigation measures. Furthermore, the energy sources such as fuel wood in rural areas, and the fossil fuels such as the Mazot used in Cement Industries , and the Diesel used in other Industries, and those used the Power Sector for energy generation and consumptions were also considered for developing such effective mitigation measures. Following this understanding that energy use dominates the largest share of the anthropogenic GHG emissions in Yemen over the period between 2000 through 2025, renewable and clean energy, and energy efficiency are considered to be strategic national options for meeting future demands for energy besides offering viable options for GHG mitigation. At present, renewable energies make a negligible contribution to primary energy supply. Only about 130 kW of solar PV systems have so far been installed in Yemen though some additional installations are planned for the near future. Most of these belong to the national TV centers and telecommunication authorities. Nevertheless, Yemen in endowed with large levels of solar, wind, and geothermal resources. According to Renewable Energy Strategy Study by the MoE, average solar radiation is up to 26 MJ/m2 per day with over 3,000 cloudless sunshine hours per year. Comprehensive wind data is lacking but individual studies show high potential along coastal regions and in the highlands. Geothermal hot springs exist in Dhamar and several other locations and show high heat flows. A conservative estimate of renewable resource potential shows total capacities that are equal to many mes the installed fossil capacity (see Table 4‐1). The renewable energy options are also considered a viable choice for rural electrification which will potentially reduce emissions from wood fuel combustion being the major source for energy in rural areas. At the time of conducting the studies on GHG inventory under INC, there was no integrated renewable energy policy in Yemen. However, at present, the Ministry of Electricity (MoEE) has formulated such a National Strategy for Renewable Energy in 2009) as a way of systematically developing alternative sources of energy and promoting a renewable energy industry, and energy efficiency in Yemen. Some of the more noteworthy initiatives are briefly described in the bullets below.
Table 4‐1 Renewable Resource Potential And
Installed Fossil Capacity (Source: Sufian and Asaad,
2010)
Resource
Installed
Potential
(MW)
Practical
Potential
(MW)
Wind 0.0 34,286
Solar – electric PV systems 0.1 18,600
Solar – thermal hot water
systems 0.0 278
Geothermal 0.0 2,900
Fossil‐based electric
generating capacity in 2000 883
‐

60
Rural Energy Access Project: This is a $256 million project which has among its principal aims to initiate a national‐scale off‐grid renewable energy electrification program, including support for the integration of Solar Home Systems.
Makha city windfarm: Yemen is proceeding with plans to build its first wind farm in Makha City in the Ta’izz governorate along the Red Sea in a location where wind speeds average about 8 meters per second. When complete, installed capacity will be 60 MW and will demonstrate the operational feasibility of wind power connected to the national grid.
Clean development project office: Yemen has established a designated national authority within the Environment Protection Authority (EPA) to support project development within the clean development mechanism (GEF, 2004). The EPA has investigated investment modalities and barriers as well as the potential of the CDM to promote national sustainable development goals. A strategy has been put in place to identify promising renewable energy and energy efficiency projects to achieve GHG emission reductions.
4.2 Potential for GHG Emission Reductions To explore the potential for renewable energy, energy efficiency, and fuel switching a comprehensive GHG mitigation analysis was conducted for the energy sector (Sufian and Asaad, 2010). The focus of the assessment was twofold. First, prac cal GHG mi ga on strategies were considered that could be readily implemented within the current energy policy framework in Yemen at either low or modest cost. Second, a number of longer‐term options, particularly focusing on grid‐based renewable electricity generation, were also considered within the framework of substantial international assistance as well as national reform initiatives to reduce barriers to the penetration of renewable energy throughout the Yemeni economy. The Base Year of the study was 2000, the same year as the updated GHG inventory. A planning horizon of 25 years was assumed. A scenario approach was adopted in which Business‐as‐usual projections (i.e., the BAU Scenario) of future energy use and GHG emissions at the sectoral level were assembled from available national databases and sources. An alternative projection (i.e., the Mitigation Scenario) was developed that examined the GHG reduction benefits of a number of attractive near‐ and long‐term strategies that are gradually phased in over the next 15 years. These strategies were developed through a series of consultative meetings with key stakeholders within government and modeled using LEAP, a widely used energy planning tool developed by the Stockholm Environment Institute. A brief overview of the key options and measure considered in the assessment is provided in the bullets below:
Energy efficiency: This involved the introduction and widespread penetration of efficient compact fluorescent lighting and efficient refrigeration in the household sector; the introduction of fuel economy standards for light and heavy duty vehicles (11% and 10% improvement in fuel economy by 2025, respec vely), and a scrappage policy for old gas‐guzzling vehicles.
61
Fuel switching: This involved switching from diesel and residual fuel oil to natural gas in power genera on (1,000 MW by 2025), commercial bakeries, cement factories and small industrial applications. It also involved switching from diesel to gasoline for heavy duty trucks and buses (85% and 90% shares by 2025, respec vely).
Renewable energy: This involved the introduction of large‐scale, grid connected geothermal (450 MW by 2025), wind (800 MW by 2025), and solar sta ons (100 MW by 2025) as well as the widespread introduc on of solar water pumps to replace diesel pumps in shallow wells (65% share by 2025).
It is worth‐noting to highlight the potential reductions in GHG emissions that can be gained from considering the mitigation options compared to the baseline scenarios. As noted earlier, energy use is the major GHG emitting sector. As such, the potential reduction in GHG emissions will be considered for the energy use from supply and demand‐side perspectives. From the supply‐side perspective, the Electrical Power Generation Sector has only been considered being one of the largest contributors to GHG Emission in Yemen. The most viable mitigation options recommended for consideration across this sector are using Natural Gas and Renewable Energy technologies for generation of electrical power. In other words the switching options translate to a gradual replacement of the Mazot and Diesel Generating Plants by the Natural Gas Generating Plants. Furthermore Geothermal, Wind, Biomass and Solar Power Generating Plants are also recommended to be gradually introduced to meet future demands. This gradual replacement and new installments will reduce the quantity of Mazot and Diesel fuels burnt and thus lead to a great reduction in GHG emission. The GHG Emission of the Baseline Scenario reached a value of 34.2 Billion Kg CO2 Eq. in the year 2025 while the GHG Emission resulted from the Mi ga on Scenario developed reached 29.5 Billion Kg CO2 Eq. for the same year. This is a clear reduc on of about 4.7 Billion Kg CO2‐eq of GHG Emission in the year 2025. In fact, the models employed by the current study have shown that; substantial reduction in GHG emissions can be reached provided that the recommended mitigation options are taken into account and implemented. For instance, the GHG emission is projected to decline gradually star ng by about 3% in the year of 2012, and further reduc ons can be achieved by 10%, and 14% in the years of 2020, and 2025. The magnitudes of these reductions in emission are believed reasonable and encouraging. A similar reduction in GHG emissions on the supply‐ side, are shown in Table 4‐2, but with a be er percentage reduc on star ng with 6.67% reduc on in 2012 and reaching 33.33% in 2025. This is due to the introduc on of Natural Gas Turbines for the genera on of Electrical Energy as well as introducing Renewable Energy Sources for the same purpose which are GHG emission free. The overall reduction achievement in GHG emission however, is shown in Table 4.2. The combined percentage reduction for both the Demand Side and Supply Side is clearly illustrated and starts with about 3% in the year 2012 and gradually increasing to reach about 14% in the year 2025. This is a reasonably reachable level providing the options suggested are considered and taken seriously for implementation.

62
Table 4‐2 Predicted Reduc on in GHG Emissions: Mi ga on Scenario vs. Baseline
Scenario for Yemen by Source, All Fuels, as (%), Year (2000 – 2025)
Source 2000 2005 2010 2012 2015 2020 2025
Demands 0.0 0.0 2.58 2.43 4.89 8.71 11.44
Electricity generation 0.0 0.0 6.9 6.67 12.90 25.00 33.33
Total of Combined 0.0 0.0 1.35 2.97 5.86 10.07 13.74
From the demand‐side perspective, household, commercial, industrial, transport, and agriculture sectors have been considered being the contributors to GHG Emission in Yemen. The most viable mitigation options recommended for consideration across these sectors are energy efficiency and fuel switching. The estimated energy demands for Yemen based on the baseline scenario over the me horizon sectors are: 201.8 Million GJ in 2000 and 201.8 Million GJ in 2025. However, the es mated energy demands for Yemen based on the developed mitigation scenario options over the me horizon sectors are: 201.8 Million GJ in 2000 and 475.2 Million GJ in 2025. It can be noted that the mi ga on scenario has decreased the total demands for the Yemen to about 11% by 2025. A comparison between the total emissions for the baseline scenario and the mitigation scenario is given in percentage reductions by sector in Table 4.3. A gradual achievement in reduction of GHG emissions is clear star ng with about 2.43% in 2012 and reaching almost 11.5% in the year 2025 in the demand‐side GHG emissions. For be er visualiza on, Figure 4‐1 bellow illustrates forecasts of CO2‐eq emissions in Yemen under the BAU and Mitigation Scenarios un l 2025.
Table 4‐3 Predicted Reduc on in GHG Emissions: Mi ga on Scenario vs.
Baseline Scenario for Yemen by Sector, All Fuels, as (%), Year (2000 – 2025)
Sector 2000 2005 2010 2012 2015 2020 2025
Household 0.0 0.0 6.90 6.45 8.57 9.52 7.84
Commerce 0.0 0.0 0.0 0.0 4.76 7.69 9.38
Industry 0.0 0.0 0.0 7.69 7.14 7.14 7.14
Transport 0.0 0.0 1.50 1.43 4.61 8.43 11.76
Agriculture 0.0 0.0 0.0 25 25 25 40
Total 0.0 0.0 2.58 2.43 4.89 8.71 11.44

63
Based on the aforementioned discussion, it can be concluded that significant GHG reduction potentials are technically possible in Yemen through a reliance on indigenous energy resources and technology transfer of renewable energy and energy efficient technologies. In general, the GHG emissions in the mi ga on scenario are about 14% less in 2025 than projected emissions in the baseline scenario. Cumulative emission reductions over this period are over 42 million tons of CO2‐eq. The indicated GHG emission reduction potential if the mitigation options are taken in to account and implemented, are reasonable and encouraging.
4.3 Reforms to Promote Sustainable Energy Use There are several types of reforms needed to realize the GHG emission reductions described in the previous section, and briefly outlined in the bullets that follow:
Strengthen institutional capacity: The limited human resource capacity at the Ministry of Electricity (MOE) and in stakeholder groups will need to be strengthened in order to facilitate the development of a comprehensive renewable energy strategy. This includes on‐the‐job training, promoting the role of the private sector, increasing the number of renewable energy technicians, building an information database on technologies, and developing a process to systematically review issues pertaining to policy, regulation and codes of practice.
Promote and enforce renewable energy strategy and energy efficiency: Despite Yemen’s expressed commitment to exploit its renewable energy sources and promote energy efficiency by enacting the national strategy on renewable energy in 2009, efforts to promote and enforce the implementa on of the strategy s ll lacking and needed . In the absence of enforcement of such a policy mandate, serious barriers and disincentives for market development will continue. To promote the
Figure 4‐2 Forecasts of CO2‐eq Emissions in Yemen under the BAU and Mitigation
Scenarios (Source: Sufian and Asaad, 2010)
0
10,000
20,000
30,000
40,000
50,000
2000 2005 2010 2015 2020 2025
(Gg)
BAU Scenario
Mitigation Scenario

64
types of grid‐connected renewable energy such as wind, geothermal, and solar as assessed in the GHG mitigation study, a supportive means of enforcement and implementation of the policy framework will need to be put in place, including mechanisms to encourage local investment in renewable energy. To promote the types of energy efficient technologies such as hybrid electric vehicles and compact florescent lighting, a supportive set of new regulations and standards will need to be developed, including mechanisms to incentives purchases of high efficiency equipment.
Enhance coordination among stakeholders: Currently, government agencies, donors, NGOs, the private sector, and the financial sector act in relative isolation regarding renewable energy initiatives. Coordination efforts are required to enlist a range of stakeholders in national strategy development, development of informational resources, and the implementation of pilot demonstration projects showing the viability of renewable to potential investors/donors.
Develop a sustainable national market for renewable: The capital intensive nature of renewable energy technologies represents a continuing barrier to their dissemination. A systematic appraisal of options is needed to overcoming this barrier including options such as the introduction of financial/fiscal incentives, assessment of market characteristics, increasing the awareness of renewable energy cost and performance characteristics reduce/abolish taxes on certain types of equipment, and introduction of micro‐finance reforms for decentralized applications.

65
List of References
Sufian T. and Asaad, A., 2010. “Updating Existing and Developing New Programs that include Measures to Abate GHG Emission ‐ A Study Submitted by the Mitigation Team as Part of the Yemen Second National Communication (YSNC) Project on Climate Change”
NECRA, Lmt, 2010. “Planning the Consolidation of Rural Electrification Activities in Yemen ‐ Interim Report”, Submitted to the Government of Yemen, Ministry of Electricity and Energy.
Global Environment Facility (GEF), 2004. “Rural Electrification and Renewable Energy Development”, Request for GEF Funding

66
Constraints, Gaps and Needs
Chapter 5:

67
As indicated earlier, Yemen is not contributing a lot into the anthropogenic GHG emissions but stands highly vulnerable to climate change‐related impacts because of its fragile socio‐economic development and inadequate adaptive capacity. The Yemen's INC in 2001 as well as this report of the SNC 212 to the UNFCCC has included findings concerning the vulnerability of the social and biophysical environment to climate variability and climate change. The potential impact of climate change on the development in Yemen is expected to make the current sustainability challenges further complicated. Rural livelihoods are expected to decline due to decreasing water access and agriculture productivity, or even asset destruction. On the other hand, as an LDC, Yemen is a resource‐constrained country and has only limited resources and capacities while experiencing tremendous development challenges. Yemen also has the lowest ODA of per capita at $12.7 or just 2.2% of GDP, compared to $33.4 per capita (18.7% of GDP) for other least developed countries in the world. An effective response to climate change must combine both mitigation, to avoid the unmanageable, and adaptation, to manage the unavoidable. To do so, Yemen requires enormous adaptation investments to adjust to the anticipated climate change impacts. In addition, numerous mitigation actions are proposed in order for Yemen to reduce the current, and predicted increasing trend of GHG emissions. However, several constrains and gaps have been identified which would impede an effective climate change action in Yemen. Altogether, with the existing hindering capacity circumstances, it is unlikely for Yemen to build up adequate climate change resilience, and ensure low‐emission development trajectories unless sufficient support has been provided to enable compliance with commitments under the UNFCCC on regular basis. Therefore, this section will outline the key constrains, gaps which impede effective climate change action in Yemen. In addition, this section will highlight the country needs in order to strengthen actions on climate change adaptation, and mitigation, and hence facilitate contribution towards compliance with UNFCCC requirements. 5.1 Constraints Several capacities constrains of various types (i.e. technical, institutional, and financial) across various levels have been identified hindering implementation of climate change adaptation, and mitigation in Yemen as a requirement under the UNFCCC convention, and these include the following:
Weak governance and institutional structures
Weak rule of law
Weak partnership and private sector engagement
Low human development, with deep gender disparities
Numerous development challenges including high poverty prevalence, and lack of access to basic services such as safe drinking water, proper sanitations, health, education, finance compounded by poor infrastructure like roads, and electricity networks
Inadequate information and data collection, analysis and dissemination

68
Lack of financial resources
Weak political leadership
Scattered rural settlements across varying topographical settings including hard mountainous region accessibility
5.2 Gaps The following outlines the key capacity gaps with respect to implementation of climate change adaptation and mitigation as a requirement under the UNFCCC convention:
Lack of access to climate information
Lack of accurate climate information and uncertainties about climate change projections on Yemen
Low quality GHG emission inventories
Limited reporting capacity to regularly update national communication meeting overall all needs and covering all areas as stated by the UNFCCC conventions.
Lack of awareness among community and policy‐makers regarding climate change;
Inadequate institutional, technical and financial capacity to plan and implement climate change adaptation, and mitigation actions
Lack of funding to implement climate change adaptation, and mitigation measures;
Limited climate change related Research.
5.3 Needs As discussed earlier, several capacity development needs were identified in order to strengthen actions on climate change adaptation, and mitigation, and hence facilitate contribution towards compliance with UNFCCC requirements. The following are among the key needs:
Promote information and knowledge management;
Strengthen institutional and technical capacities;
Fund raising and resources mobilization;
Build public , and policy‐maker awareness on climate change;
Promote and enforce renewable energy strategy and energy efficiency;
Enhance coordination among stakeholders;
Enhance climate change and GHG data collection, analysis, and monitoring, reporting capacities
Strengthening and development of dedicated observation networks to enhance the quality and accuracy of future emission inventories
Integrate climate change consideration into sectoral development planning and budgeting processes;

69
Strengthen research centers on climate change;
Enhance collaboration between educational, training and research institutions to enable exchange of experiences and lessons learned among different institutions of the respective regions; and
Promote Involvement of media in awareness raising of climate change impacts and risks
In nutshell, weak governance and institutional structures are among the key constrains that impedes Yemen from achieving its commitment under the UNFCCC convention. Low quality GHG emission inventories, and lack of funding are among the key capacity gaps to implement climate change adaptation, and mitigation measures in Yemen. On the other hand, strengthening the institutional and technical capacities in addition to promoting and enforcing of renewable energy strategy and energy efficiency are among the major capacity development needs to ensure enhanced implementation of climate change adaptation, and mitigation strategies in Yemen.

70
Appendix (A) Stakeholder Questionnaire
Questionnaire Name: Age: Current Profession: Duration in the current profession: Address: Telephone:
Water Problems issues
I. GENERAL LEVEL (PUBLIC LEVEL)
Are you aware of the water problems in your area? Do you know what kind they are? Do you know that groundwater is a resource that could be totally depleted? Do you know that water level is dropping very quickly in the basin? Do you know that if this continues there will no water left for the next generations? What do you think has caused the problems? Do you think the problems are getting worse with time? What are the water problems in your area/village? Which of these problems are you most affected by? What do you think the solution for such problem? How do you feel about water transfers to provide drinking water to others? To a neighboring village? To a village outside your tribal area? To a city outside your area such as ADEN? Do you see any danger in this to you? To the village? If so, how do you think this conflict should be resolved? (Through Sheiks, local farmer’s organization, etc.)
II. FARMER’S USE LEVEL
a. Agricultural water Use and indication of water dwindling
How much land do you own? How much is cultivated? How much is rainfed? How much is irrigated? From the wadi? By well? How many wells you own/share? How much land do you cultivate from this well? What is the total depth of the well? How many 3-m pipes installed since drilling? How many 3-m pipes in place now? Has there been any change in the quality? How and when? What do you think will happen if these problems continue?

71
How many hours a day do you pump water? What irrigation method do you use and by which mean? Have you tried to improve this method? Are you aware of any other farmers in your village using improved irrigation methods? Do you think it more efficient in conserving water than yours? Why you do not using it?
a. Water Management issues
How do you normally try to solve your own water-related problems? How does the village solve such problems? Is there any cooperation with neighboring villages in such issues? Which? Has this cooperation worked so far? Do you think a better arrangement is required because the water problems are becoming more critical? Do you think the government should play a role in this regard? How? Did you or the village as a whole approach the any government body for solutions? Which? Do you know think the Government should decide who uses the groundwater and what for? Do you know which Government body is responsible for the management of all water resources in the country? Do you agree they should manage the water in your village together with representatives from your side? If so would you accept and abide to their decisions? Did you or the village get any support related to water use? Dams? Other irrigation schemes? Agr. Credit Loan for pump, motor, etc.? How was such support organized? Do you think they should get more support in the future? How? (through Sheiks, local farmers organization, etc.)
b. Poverty indication on village and household level
How many families are in the village? How many persons from each family work outside the village? Total? How much land do they have? How much is cultivated? How many wells do they have (approximately)? How many persons in your family? What is the total area of the land you own? You cultivate? What crop type do you grow? Do think the return from your land is reasonable and enough to feed your family? If no, how do you think you could improve it? Any additional income from outside (eg. Son working in city, etc.) If you are offered treated wastewater for irrigation would you use it?
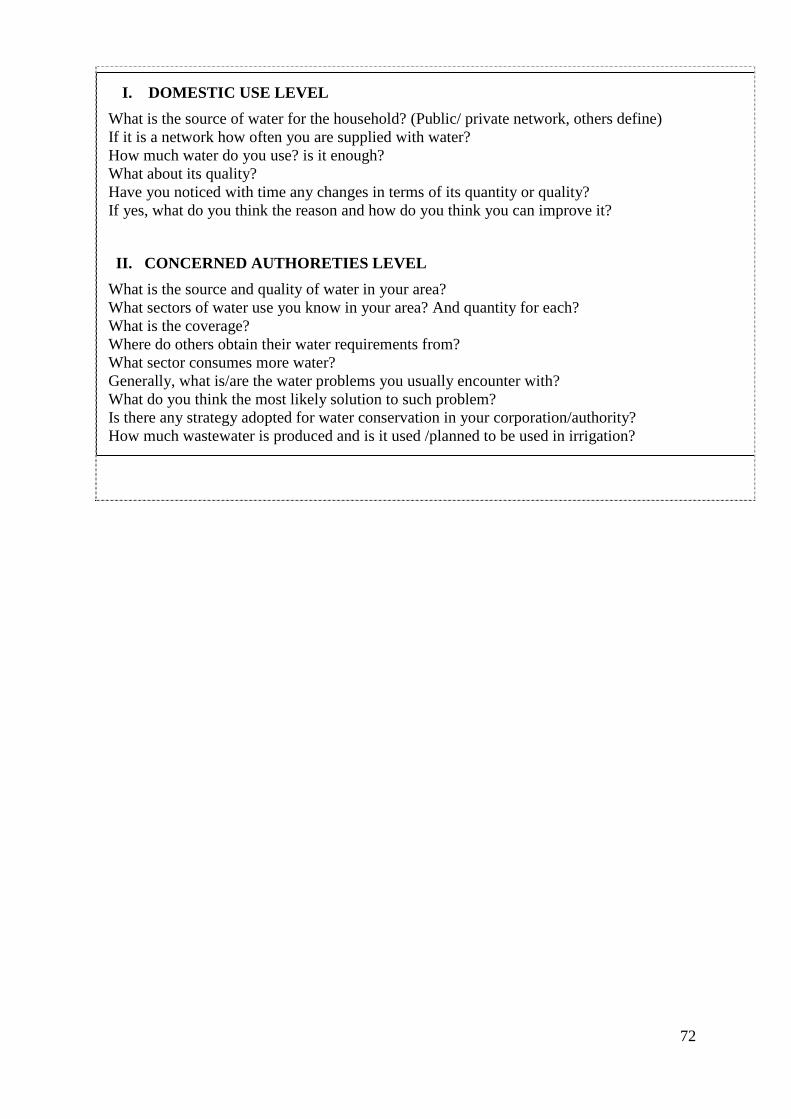
72
I. DOMESTIC USE LEVEL
What is the source of water for the household? (Public/ private network, others define) If it is a network how often you are supplied with water? How much water do you use? is it enough? What about its quality? Have you noticed with time any changes in terms of its quantity or quality? If yes, what do you think the reason and how do you think you can improve it?
II. CONCERNED AUTHORETIES LEVEL
What is the source and quality of water in your area? What sectors of water use you know in your area? And quantity for each? What is the coverage? Where do others obtain their water requirements from? What sector consumes more water? Generally, what is/are the water problems you usually encounter with? What do you think the most likely solution to such problem? Is there any strategy adopted for water conservation in your corporation/authority? How much wastewater is produced and is it used /planned to be used in irrigation?