Embed Size (px)
Citation preview
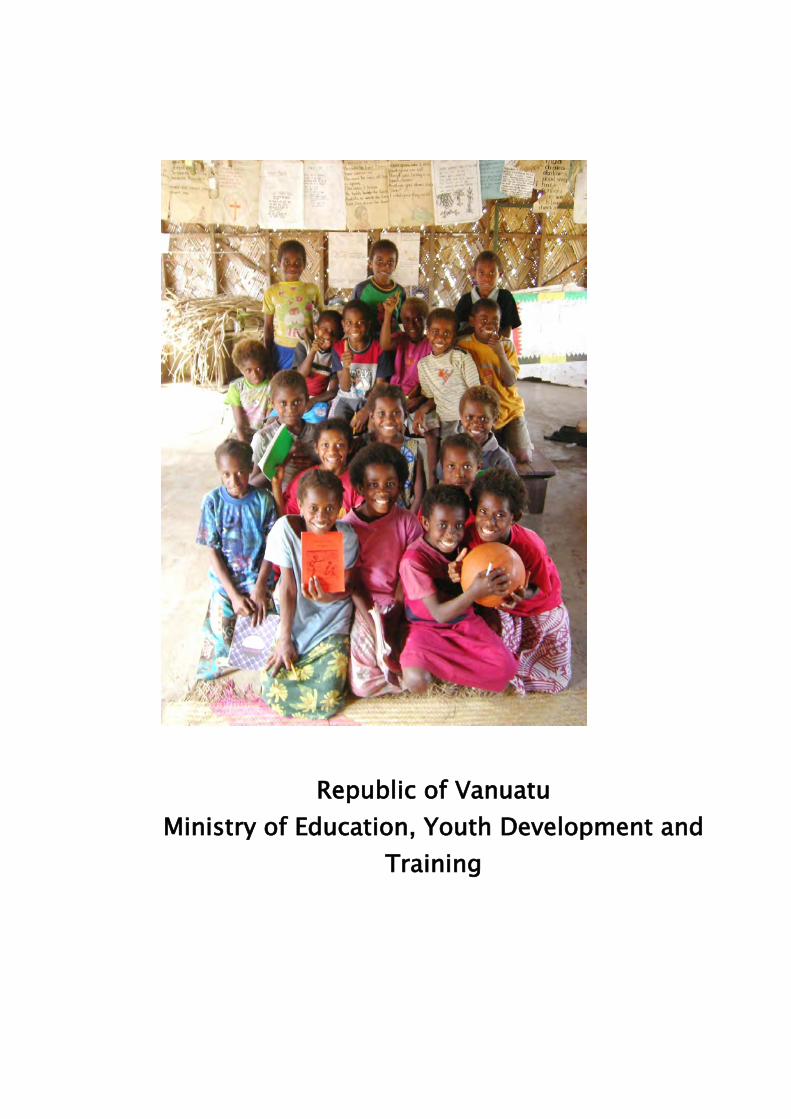
Republic of Vanuatu
Ministry of Education, Youth Development and
Training

Digest of Education Statistics 2008
Republic of Vanuatu
Ministry of Education,
Youth Development and Training
Digest of Education Statistics 2008
A publication of the MEYDT Planning and Policy Unit
© MEYDT 2008
v
Abbreviations
DoE Department of Education
ECE Early ChildHood Education /Pre-School
EFA Education for All
FBEAP Forum Basic Education Action Plan
GDP Gross Domestic Product
GER Gross Enrolment Ratio
GIR Gross Intake Rate
GoV Government of Vanuatu
GPI Gender Parity Index
JS Junior Secondary
MDA Millennium Development Agenda
MDG Millennium Development Goals
MEYDT Ministry of Education, Youth Development and Training
MoE Ministry of Education
NER Net Enrolment Ratio
NIR Net Intake Rate
NZ Aid New Zealand Aid
PEO Provincial Education Office
PS/PRI Primary School
PSSC Pacific Senior Secondary Certificate
PTR Pupil Teacher Ratio
SS/SEC Secondary School
SWAP Sector Wide Aproach Program
VEMIS Vanuatu Education Management Information System
VESAP Vanuat Education Support Action Plan
VESS Vanuatu Education Sector Stratergy
vi
Table of Contents List of Tables ................................................................................................................... 8
Message from the Minister for Education ....................................................................... 15
Foreword by the Director General .................................................................................. 16
Chapter One: Introduction ............................................................................................. 17
Education in Vanuatu .................................................................................................. 17
Aims of Education ................................................................................................... 17
The Annual School Census.......................................................................................... 18
Chapter Two: National Summary Statistics ..................................................................... 22
Schools ...................................................................................................................... 22
Enrolments ................................................................................................................. 23
Early Childhood Education ....................................................................................... 23
Primary School ........................................................................................................ 24
Junior Secondary School .......................................................................................... 26
Senior Secondary School .......................................................................................... 27
Teachers ................................................................................................................. 29
Chapter Three: Vanuatu Education Sector Strategy ......................................................... 30
Vision ......................................................................................................................... 30
Mission ...................................................................................................................... 30
Goals .......................................................................................................................... 30
Goal One ................................................................................................................. 30
Goal Two ................................................................................................................. 36
Goal Three .............................................................................................................. 37
Goal Four ................................................................................................................ 38
Goal Five ................................................................................................................. 46
Goal Six ................................................................................................................... 48
Goal Seven .............................................................................................................. 50
Chapter Four: Provincial Statistics .................................................................................. 54
Torba ......................................................................................................................... 54
Schools ................................................................................................................... 54
Enrolments .............................................................................................................. 54
vii
Teachers ................................................................................................................. 55
Malampa .................................................................................................................... 55
Schools ................................................................................................................... 55
Enrolments .............................................................................................................. 56
Teachers ................................................................................................................. 57
Penama ...................................................................................................................... 57
Schools ................................................................................................................... 57
Enrolments .............................................................................................................. 57
Teachers ................................................................................................................. 58
Sanma ........................................................................................................................ 58
Schools ................................................................................................................... 58
Enrolments .............................................................................................................. 59
Teachers ................................................................................................................. 60
Shefa .......................................................................................................................... 60
Schools ................................................................................................................... 60
Enrolments .............................................................................................................. 60
Teachers ................................................................................................................. 61
Tafea .......................................................................................................................... 62
Schools ................................................................................................................... 62
Enrolments .............................................................................................................. 62
Teachers ................................................................................................................. 63

viii
List of Tables Survey Return Rates by School Type and Province 2008. .................................................................................... 19
Number of schools by level of Education, 2006 - 2008 ..................................................................................... 22
Number of Schools level of Education and Province, 2008. ................................................................................ 22
Number of Schools by Education Authority Type and level of Education, 2008. .................................................. 22
Total ECE Enrolments by Province, 2008. .......................................................................................................... 23
ECE Enrolments by Age and Gender, 2008. ....................................................................................................... 23
Total Primary Enrolments by Province, 2008. .................................................................................................... 24
Primary Enrolments by Age, Level and Gender, 2008. ........................................................................................ 25
Total Junior Secondary Enrolments by year level, 2008. ..................................................................................... 26
Junior Secondary Enrolments by Age, Level and Gender, 2008. .......................................................................... 26
Total Senior Secondary Enrolments by year level, 2008. .................................................................................... 27
Senior Secondary Enrolments by Age, Level and Gender, 2008. ......................................................................... 28
Enrolments by Sector and Percentage of Female Enrolments, 2005 - 2007. ....................................................... 28
Number of Teachers by Sector and Medium of Instruction,2008 ........................................................................ 29
Early Childhood Education Gross and Net Enrolment Ratios by Gender, and Gender Parity Index 2005 -
2007. (Age 3-5) ........................................................................................................................................ 32
Primary Gross and Net Enrolment Ratios by Gender, and Gender Parity Index 2005 - 2007.Year 1-6 (Age
6-12) ....................................................................................................................................................... 32
Junior Secondary Gross and Net Enrolment Ratios by Gender, and Gender Parity Index, 2005 - 2007. Year
7-10 (Age 13-16) ..................................................................................................................................... 32
Senior Secondary Gross and Net Enrolment Ratios by Gender, and Gender Parity Index, 2005 - 2007. Year
11-14 (Age 17-20) ................................................................................................................................... 32
Secondary, (Yr 7-14) Gross and Net Enrolment by Gender, and Gender Parity Index, 2006 - 2008. Year 7-
14 (Age 13-20) ......................................................................................................................................... 32
Gross and Net Intake Rates into Primary School by Gender, 2005 - 2007. ......................................................... 33
Repetition, Promotion, Drop Out and Cumulative Survival Rates by Year Level, 2006. ........................................ 34
GPI for Repetition, Promotion, Drop Out and Cumulative Survival Rates, by Year Level, 2006. ............................ 34
Number of ECE pupil with a disability who are enrolled in school, by Gender, 2008 ........................................... 35
Number of PS pupil with a disability who are enrolled in school, by Gender, 2008 ............................................. 35
Number of SS pupil with a disability who are enrolled in school, by Gender, 2008 ............................................. 35
Number of SS pupil with a disability who are enrolled in school, by Gender, 2008 ............................................. 35
Percentage of Year One Students who have attended ECE, by Gender and by Province........................................ 35
Enrolments by Education Level and Medium of Instruction, 2008....................................................................... 36
Average Total Annual Funds Received at Anglophone and Francophone Primary and Secondary Schools,
2008. ....................................................................................................................................................... 37
ix
Primary School Pupil-to-Textbook Ratios by Core Subject Area, 2008. .............................................................. 37
Number of teachers in each sector, by Gender and Province, 2008 .................................................................... 38
Percentage of teachers in each sector, by Gender, Province, 2008 ..................................................................... 38
Number of teachers by medium of English and French, in Primary and Secondary, and by Province, 2008 .......... 39
Eealy Childhood Pupil to Teacher Ratio, Pupil to Certified Teacher Ratio, Pupil to Qualified Teacher Ratio by
Province,2008 .......................................................................................................................................... 39
Primary School Pupil to Teacher Ratio, Pupil to Certified Teacher Ratio, Pupil to Qualified Teacher Ratio by
Province,2008 .......................................................................................................................................... 39
Secondary School Pupil to Teacher Ratio, Pupil to Certified Teacher Ratio, Pupil to Qualified Teacher Ratio
by Province, 2008 ..................................................................................................................................... 40
Pupil Teacher Ratio by Authority in each Province, 2008.................................................................................... 40
ECE Pupil Teacher Ratio, Pupil Certified Ratio and Pupil Qualified Ratio, by Authority type, 2008 ........................ 41
PS Pupil Teacher Ratio, Pupil Certified Ratio, and Pupil Qualified Ratio, by Authority type, 2008 ......................... 41
SS Pupil Teacher Ratio, Pupil Certified Ratio, and Pupil Qualified Ratio, by Authority type, 2008 ......................... 41
Total number of ECE Teachers, numbers not qualified, and numbers qualified, by Province,2008 ...................... 42
Total number of PS Teachers, numbers not qualified, numbers qualified, by Province, 2008 .............................. 42
Total number of government PS teachers, numbers qualified, number not qualified, by Province, 2008 ............. 43
Total number of SS Teachers, numbers not qualified, numbers qualified, by Province, 2008 .............................. 43
Number of government teachers, numbers qualified (Y), numbers not qualified (N), by Province, 2008 .............. 43
Total ECE Teachers, numbers not certified, numbers certified, by province, 2008 .............................................. 44
Total PS Teachers, numbers not certified, numbers certified, by Province, 2008 ................................................ 44
Total Primary government teachers, numbers not certified, numbers certified, by Province, 2008 ...................... 44
Total SS Teachers, numbers not certified, numbers certified, by Province, 2008 ................................................ 45
Number of Secondary government teachers, numbers certified (Y), and numbers not certified (N), by
Province, 2008 ......................................................................................................................................... 45
Number of techers who have had In-service Training within the last five years by Sector and Province,
2008 ........................................................................................................................................................ 45
Number of Schools with a Staff Room by Buiding Materials Type and School Type, 2008. ................................... 46
Number and Percentage of Schools with a Staff Room, by Condition of Building and School Type, 2008. ............ 46
Number and Percentage of Classrooms Made out of Permanent, Semi-permanent and Traditional Building
Materials by Sector, 2008.......................................................................................................................... 47
Number and Percentage of Classrooms Reported to be in Good, Fair or Poor Condition, by Sector, 2008. .......... 47
Percentage of classroom reported to be in Good, Fair or Poor Condition, by Sector, 2008 .................................. 47
Number and Percentage of Primary and Secondary Schools that have a Library by Province, 2008. ..................... 47
Number and Percentage of Schools with Access to a Reliable Water Supply, by Water Supply Type and
School Type, 2008. ................................................................................................................................... 47
Pupil to Toilet Ratios by School Type and Province, 2008. ................................................................................. 47
Pupil to Toilet Ratios by School Type and Province, 2008. ................................................................................. 47
Common Toilet Types in Vanuatu Schools, by School Type 2008. ...................................................................... 47
x
Number and Percentage of Schools with Access to Communications Resources, by Resource Type and
School Type, 2008. ................................................................................................................................... 47
Number and Percentage of Schools with Access to Power, by Power Supply Type and School Type, 2008. .......... 47
Percentage of Public Expenditure that is spent on Education, 2005 - 2007. ....................................................... 48
Education Sector Expenditure as a Percentage of GDP, 2005 - 2007. ................................................................. 48
Expenditure on ECE, Primary and Secondary Sectors, as a Percentage of Total Education Sector Expenditure,
2005 - 2007............................................................................................................................................. 49
Public(Government) Cost per Pupil of Education by Sector, 2005 - 2007............................................................ 49
Community Support Ratings As Reported by School Principals and Head Teachers, 2008. .................................. 50
Number and Percentage of Schools with a Parents Teacher Associaton by School Type, 2008. ........................... 51
Number of Enrolments by Education Authority Type and School Type, 2008. ..................................................... 52
Number of Schools by School Type, 2005 - 2007. ............................................................................................. 54
Enrolments by Sector and Gender, 2005 - 2007. ............................................................................................... 54
Enrolments by Island, 2008. ............................................................................................................................. 55
Number of Teachers, Number Qualified, and Number Certified, by Teaching Sector and Gender, 2008. ............. 55
Pupil to Teacher Ratios by Island and Sector, 2008............................................................................................ 55
Number of Schools By School Type, 2005 - 2007. ............................................................................................. 55
Enrolments by Sector and Gender, 2005 - 2007. ............................................................................................... 56
Enrolments by Island, 2008. ............................................................................................................................. 56
Number of Teachers, Number Qualified, and Number Certified, by Teaching Sector and Gender, 2008. ............. 57
Pupil to Teacher Ratios by Island and Sector, 2008............................................................................................ 57
Number of Schools By School Type, 2005 - 2007. ............................................................................................. 57
Enrolments by Sector and Gender, 2005 - 2007. ............................................................................................... 57
Enrolments by Island, 2008. ............................................................................................................................. 58
Proportion of Enrolmetns by Island, 2008. ........................................................................................................ 58
Number of Teachers, Number Qualified, and Number Certified, by Teaching Sector and Gender, 2008. ............. 58
Pupil to Teacher Ratios by Island and Sector, 2008............................................................................................ 58
Number of Schools By School Type, 2005 - 2007. ............................................................................................. 58
Enrolments by Sector and Gender, 2005 - 2007. ............................................................................................... 59
Enrolments by Island, 2008. ............................................................................................................................. 59
Proportion of Enrolments by Island, 2008. ........................................................................................................ 59
Number of Teachers, Number Qualified, and Number Certified, by Teaching Sector and Gender, 2008. ............. 60
Percentage of Qualified Teachers, by Teaching Sector and Gender, 2008. .......................................................... 60
Pupil to Teacher Ratios by Island and Sector, 2008............................................................................................ 60
Number of Schools by School Type, 2005 - 2007. ............................................................................................. 60
Enrolments by Sector and Gender, 2005 - 2007. ............................................................................................... 60
Enrolments by Island, 2008. ............................................................................................................................. 61
xi
Number of Teachers, Number Qualified, and Number Certified, by Teaching Sector and Gender, 2008. ............. 61
Pupil to Teacher Ratios by Island and Sector, 2008............................................................................................ 61
Number of Schools By School Type, 2005 - 2007. ............................................................................................. 62
Number of Schools by School Type and Island, 2008. ........................................................................................ 62
Enrolments by Sector and Gender, 2005 - 2007. ............................................................................................... 62
Enrolments by Island, 2008. ............................................................................................................................. 62
Proportion of Enrolments by Island, 2008. ........................................................................................................ 63
Number of Teachers, Number Qualified, and Number Certified, by Teaching Sector and Gender, 2008. ............. 63
Pupil to Teacher Ratios by Island and Sector, 2008............................................................................................ 63
xii
List of Figures Extent of Estimated ECE Enrolment Data Used in Statistical Digest Production, 2008. ........................................ 19
Extent of Estimated ECE Teacher Data Used in Statistical Digest Production, 2008. ............................................ 20
Extent of Estimated Primary School Enrolment Data Used in Statistical Digest Production, 2008. ........................ 20
Extent of Estimated Primary School Teacher Data Used in Statistical Digest Production, 2008. ........................... 20
Extent of Estimated Secondary School Enrolment Data Used in Statistical Digest Production, 2008. .................... 21
Extent of Estimated Secondary School Teacher Data Used in Statistical Digest Production, 2008. ....................... 21
Percentage of ECE Enrolments in Each Province, 2008. ...................................................................................... 23
Proportion of Overage and Underage Enrolments in ECE, 2008. ......................................................................... 24
Percentage of Primary Enrolments by Province, 2008. ....................................................................................... 24
Proportion of Overage and Underage Enrolments in Primary School, 2008. ........................................................ 25
Percentage of Junior Secondary Enrolments by Year Level, 2008. ....................................................................... 26
Proportion of Overage and Underage Enrolments in Junior Secondary School, 2008. .......................................... 27
Percentage of Senior Secondary Enrolments in by Year Level, 2008. .................................................................. 27
Proportion of Overage and Underage Enrolments in Senior Secondary, 2008. .................................................... 28
Chart of Trends in Enrolments by Sector 2005 - 2007. ..................................................................................... 28
Chart showing number of teachers by medium of instruction ............................................................................ 29
Gross Enrolment Ratio (GER) Trend, 2005 - 2007 by Education Level. ............................................................... 31
Net Enrolment Ratio (NER) Trend, 2005 - 2007 by Education Level .................................................................... 31
GER and NER Gender Parity Index by Education Level, 2008............................................................................... 33
Percentage of ECE disability type, 2008............................................................................................................. 35
Percentage of PS disability type, 2008 .............................................................................................................. 35
Proportion of Pupils Studying in English, French and Vernacular Languages at Each Education Level, 2008. ....... 36
Chart of Primary Pupil-to-Textbook Ratios by Core Subject Area, 2008. ............................................................ 37
Percentage of qualified and not qualified ECE teacher, by Province, 2008 .......................................................... 42
Percentage of qualified and not qualified PS teacher by province, 2008 ............................................................. 42
Percentage of qualified and not qualified Government PS teachers by Province, 2008 ........................................ 43
Percentage of qualified and not qualified SS teacher by Province, 2008 ............................................................. 43
Percentage of qualified and not qualified SS government teachers by Province, 2008 ......................................... 43
Percentage of certified and not certified ECE teachers, by province, 2008 .......................................................... 44
Percentage of certified and not certified PS teachers, by province, 2008 ............................................................ 44
Percentage of certified and not certified, government PS teachers, by Province, 2008 ........................................ 44
Percentage of certified and not certified SS teachers, by Province, 2008 ............................................................ 45
Percentage of certified and not certified Government SS teachers, by Province, 2008 ......................................... 45
Overall percentage of ECE qualified and certified teachers, by Province, 2008.................................................... 45
xiii
Overall percentage of PS qualified and certified teachers, by Province, 2008 ...................................................... 45
Overall percentage of SS qualified and certified teachers, by Province, 2008 ...................................................... 45
Percentage of teacher who have had in-service training in the last 5 years, by sector, by Province, 2008 ........... 46
Percentage of classroom reported to be in Good, Fair or Poor Condition, by Sector ............................................ 47
Expenditure on ECE, Primary and Secondary Sectors, as a Percentage of Total Education Sector Expenditure,
2005 - 2007............................................................................................................................................. 49
Rating of Community Support to ECEs, as reported by ECE Head Teachers, 2008. .............................................. 50
Rating of Community Support to Primary Schools, As Reported by Primary Head Teachers, 2008. ...................... 51
Rating of Community Support to Secondary Schools, As Reported by Secondary Principals, 2008. ...................... 51
Percentage of Schools with a Parents Teacher Association, 2008. ...................................................................... 52
Proportion of Enrolments in ECEs According to Education Authority Type, 2008. ............................................... 52
Proportion of Enrolments in Primary Schools According to Education Authority Type, 2008. .............................. 53
Proportion of Enrolments in Secondary Schools According to Education Authority Type, 2008. .......................... 53
Chart of Schools by School Type, 2005 - 2007. ................................................................................................ 54
Proportion of Enrolments by Island, 2008. ........................................................................................................ 55
Percentage of Qualified Teachers, by Teaching Sector and Gender, 2008. .......................................................... 55
Percentage of Certified Teachers by Teaching Sector and Gender, 2008. ........................................................... 55
Chart of Schools by School Type, 2005 - 2007. ................................................................................................ 56
Proportion of Enrolments by Island, 2008. ........................................................................................................ 56
Percentage of Qualified Teachers, by Teaching Sector and Gender, 2008. .......................................................... 57
Percentage of Certified Teachers by Teaching Sector and Gender, 2008. ........................................................... 57
Chart of Schools by School Type, 2005 - 2007. ................................................................................................ 57
Percentage of Qualified Teachers, by Teaching Sector and Gender, 2008. .......................................................... 58
Percentage of Certified Teachers by Teaching Sector and Gender, 2008. ........................................................... 58
Chart of Schools by School Type, 2005 - 2007. ................................................................................................ 59
Percentage of Qualified Teachers, by Teaching Sector and Gender, 2008 ........................................................... 60
Percentage of Certified Teachers by Teaching Sector and Gender, 2008. ........................................................... 60
Chart of Schools by School Type, 2005 - 2007. ................................................................................................ 60
Proportion of Enrolments by Island, 2008. ........................................................................................................ 61
Percentage of Qualified Teachers, by Teaching Sector and Gender, 2008. .......................................................... 61
Percentage of Certified Teachers by Teaching Sector and Gender, 2008. ........................................................... 61
Chart of Schools by School Type, 2005 - 2007. ................................................................................................ 62
Percentage of Qualified Teachers, by Teaching Sector and Gender, 2008. .......................................................... 63
Percentage of Certified Teachers by Teaching Sector and Gender, 2008. ........................................................... 63

Message from the Minister for Education
Error! No text of specified style in document. 15
Message from the Minister for Education
The Government of Vanuatu has endorsed in early 2006, the Sector Wide Approach Planning
Strategy leading to the development of “Vanuatu Education Sector Strategy (VESS) 2007 –
2016. The Vanuatu Education Sector Strategy builds on the strengths of previous plans and
also moves into a new future where Ni-Vanuatu people take full responsibility in managing
the development of education in the country.
The Ministry of Education Corporate Plan and the Vanuatu Education Support Action Plan
(VESAP) for 2007-2009 was developed as a collective commitment to action, urging the
Government to broad-based partnership with the civil society and Aid-donors, to provide
the Vanuatu Education Sector Strategy (VESS) the greatest political and fiscal support.
One of the biggest achievements in the 2007 VESS priority initiatives was the 2007 Schools
information update and the development of the Vanuatu Education Management Information
System (VEMIS), which is being managed and coordinated by the Planning Unit through the
VEMIS Taskforce committtee. The programme has been jointly financed by the New-Zealand
Government Assistance Programme NZAid and the Vanuatu Government.
The 2007 School Digest provides dissaggregated detail schools information to be use as
baseline for monitoring and evaluating VESS progress in the next ten years. This report will
be of a great use to the Ministry of Education and especially to the decision-making people,
policy makers, researchers within the government departments and the private sectors.
Monitoring and evaluation of other Education development initiatives as the MDG, EFA and
FBEAP will benefit greatly from this document.
Therefore, I hereby publish this report as part of VESS progressing achievements strongly
believing that issues flagged by the report is “everyone‟s business” and that we all shall
cooperate to address these needs by 2016.
Hon. Leinavau Thompson Tasso
MINISTER OF EDUCATION
Foreword by the Director General
16 Republic of Vanuatu
Foreword by the Director General
The Vanuatu Education Sector Strategy (VESS) 2007 – 2016, was developed through an intensive
consultation process spearheaded by the National Education Summit for Education in 2006. This
strategy has been approved by the Development Committee of Officials and by the council of
Ministers.
The strategy is based on facts and research. DoE staff undertook a comprehensive analysis of
existing data and reports about Vanuatu education. VESS recognizes that the education sector must
aim at:
Alleviating poverty and achieving universal primary education completion for all young people
Developing the human resources of the nation to enable young ni-Vanuatu to build sustainable
self-reliant futures and to participate in the productive sectors in both rural and urban settings.
Supporting and teaching history, culture and traditional knowledge
Opening up the door to the knowledge, new technologies, and opportunities of the world.
These are some principles that have contributed in the implementation of the key strategies of VESS
which is the establishment and strengthening of the Vanuatu Education Management Information
System. This has involved:
1. Rationalization of data collection systems and templates,
2. More rapid 2007 data entry, analysis and reporting
3. Complete the school census to establish 2006 as the baseline data year for VESS
4. Adapting VEMIS to meet information needs across the Education sector, able to monitor VESS
indicators, and to link with an expanded school-based system
5. Strengthen VEMIS staff at DoE and PEO levels
6. Network all PEOs
7. Work with other GoV agencies to improve population data and projections
8. Integrate the MDG and EFA/MDA indicators
9. Take a thorough approach to the mid-term review of Education for All in 2007
This Statistics Digest will be an essential tool to assess the VESS progress. Therefore we strongly
believe that this report will be the basis of future planning and decision making for the provision of
education development, in faith that VESS, EFA MDA and FBEAP Goals are met by 2015.
The Ministry of Education would like to thank all the Schools that have submitted their school survey
forms in 2007, the information that has been provided is important for the further growth and
development of the education system.
Daniel Lamoureux
Director General of Education
MINISTRY OF EDUCATION,
Chapter One: Introduction
Error! No text of specified style in document. 17
Chapter One: Introduction
Education in Vanuatu
The Government puts education sector as one of the strategic priorities in its national
development therefore it is the first Government Ministry to engage in and lead a Sector-
Wide Approach (SWAp). The government wants to see improvements in access to education
(especially for rural people), to raise the quality and relevance of education, education
attainment and standards, and to improve planning, fiscal, financial and results-based
managements in the sector.
Aims of Education
The primary aim of the education system is to empower children and young people to
exercise appropriate choices in their personal and work lives and to become proactive
individuals and valuable members of the community. In order to achieve this, Education
aims at:
Developing initiative and inquisitiveness and fostering analytical and creative thinking
in young people.
Raising the spirit of entrepreneurship and positive competitiveness
Maintaining community spirit and a sense of togetherness
Strengthening national cultural inheritance and cultural consciousness
Employability
Children learning to respect each other and adults in their various roles.
Children learning to respect and protect their natural environment.
Ensuring that every individual obtains a good level of literacy and numeracy.
Ensuring that every individual, besides knowing his/her mother tongue, will become
bi-lingual in English and French.
Supporting the children‟s spiritual growth.
Achievement of VESS
One of the achievements of VESS this year was the establishment of the Vanuatu Education
Management Information System (VEMIS). The overall objective of VEMIS is to assist the
Ministry of Education to underpin its VESS by collecting, validating and analyzing essential
reliable data regarding quality and effectiveness of education in Vanuatu.
These began with the training of all primary ECE key teachers, school heads and principals
on how to fill in the survey forms correctly. This was followed by the school stock
Chapter One: Introduction
18 Republic of Vanuatu
management training. Another set of training aimed at improving record keepings at the
school level.
The 2007 schools census took place in July in the six provinces. According to the VEMIS
school registration, 97% of the primary schools have sent in their survey forms as compared
to 97% for pre-schools and 95% for the secondary schools. That‟s a big initiative done from
the Ministry level to complement the Vanuatu Sector Strategy 2007-2016.
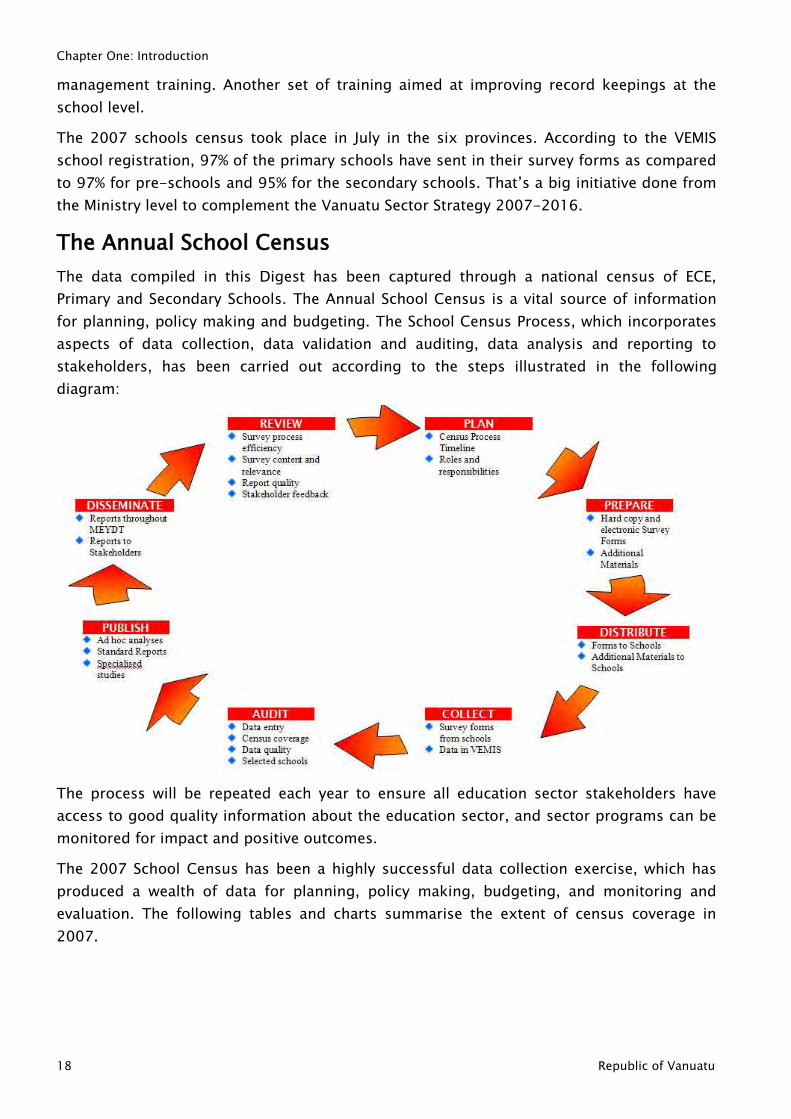
The Annual School Census
The data compiled in this Digest has been captured through a national census of ECE,
Primary and Secondary Schools. The Annual School Census is a vital source of information
for planning, policy making and budgeting. The School Census Process, which incorporates
aspects of data collection, data validation and auditing, data analysis and reporting to
stakeholders, has been carried out according to the steps illustrated in the following
diagram:
The process will be repeated each year to ensure all education sector stakeholders have
access to good quality information about the education sector, and sector programs can be
monitored for impact and positive outcomes.
The 2007 School Census has been a highly successful data collection exercise, which has
produced a wealth of data for planning, policy making, budgeting, and monitoring and
evaluation. The following tables and charts summarise the extent of census coverage in
2007.
Chapter One: Introduction
Error! No text of specified style in document. 19
Survey Return Rates by School Type and Province 2008.
ECE PS SS
2011 No. Sent
%
Received No. Sent % Received No. Sent % Received
Malampa 107 87% 89 100% 14 100%
Penama 78 73% 63 100% 12 100%
Sanma 146 90% 98 100% 15 100%
Shefa 76 89% 83 96% 25 88%
Tafea 99 99% 75 100% 13 100%
Torba 36 100% 25 100% 3 100%
Total 542 89% 433 99% 82 96%
The 2007 survey return rate is 91 percent which is one of the best records after MOE has
put more emphasis both financially and in training for all school heads in the all the
provinces. Torba Province, though the most remote and difficult areas in terms of
transportation and telecommunication access, was the first to make sure all survey forms
were submitted on time. Shefa province on the other hand was one of the most difficult
provinces to submit their return on time. In particular the urban schools, and this was
because of a number of reasons and one of which is that, most of the schools are privately
operating.
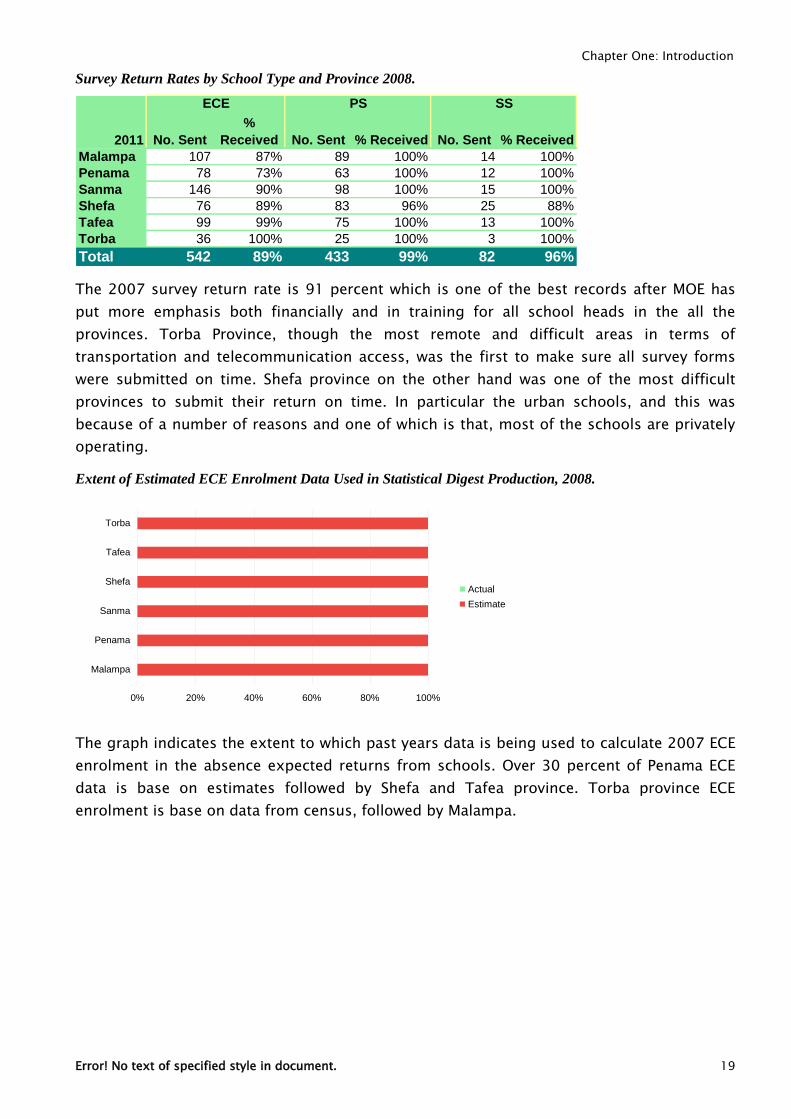
Extent of Estimated ECE Enrolment Data Used in Statistical Digest Production, 2008.
0% 20% 40% 60% 80% 100%
Malampa
Penama
Sanma
Shefa
Tafea
Torba
Actual
Estimate
The graph indicates the extent to which past years data is being used to calculate 2007 ECE
enrolment in the absence expected returns from schools. Over 30 percent of Penama ECE
data is base on estimates followed by Shefa and Tafea province. Torba province ECE
enrolment is base on data from census, followed by Malampa.
Chapter One: Introduction
20 Republic of Vanuatu
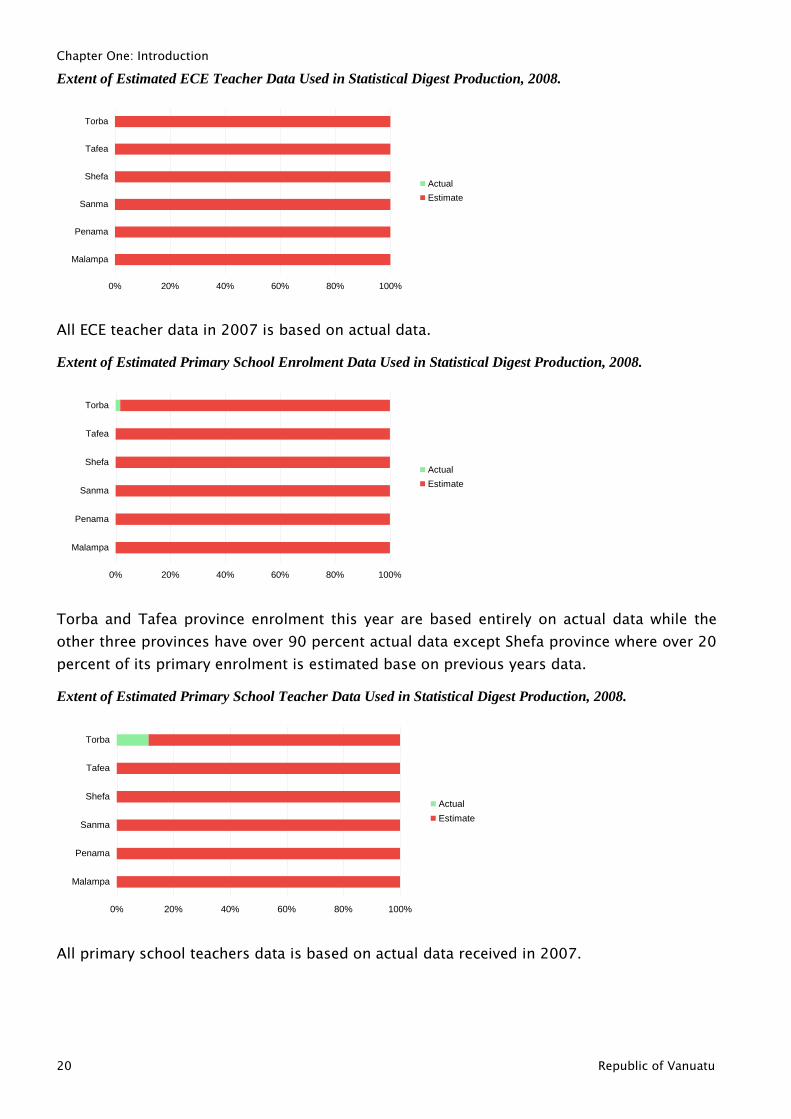
Extent of Estimated ECE Teacher Data Used in Statistical Digest Production, 2008.
0% 20% 40% 60% 80% 100%
Malampa
Penama
Sanma
Shefa
Tafea
Torba
Actual
Estimate
All ECE teacher data in 2007 is based on actual data.
Extent of Estimated Primary School Enrolment Data Used in Statistical Digest Production, 2008.
0% 20% 40% 60% 80% 100%
Malampa
Penama
Sanma
Shefa
Tafea
Torba
Actual
Estimate
Torba and Tafea province enrolment this year are based entirely on actual data while the
other three provinces have over 90 percent actual data except Shefa province where over 20
percent of its primary enrolment is estimated base on previous years data.
Extent of Estimated Primary School Teacher Data Used in Statistical Digest Production, 2008.
0% 20% 40% 60% 80% 100%
Malampa
Penama
Sanma
Shefa
Tafea
Torba
Actual
Estimate
All primary school teachers data is based on actual data received in 2007.
Chapter One: Introduction
Error! No text of specified style in document. 21
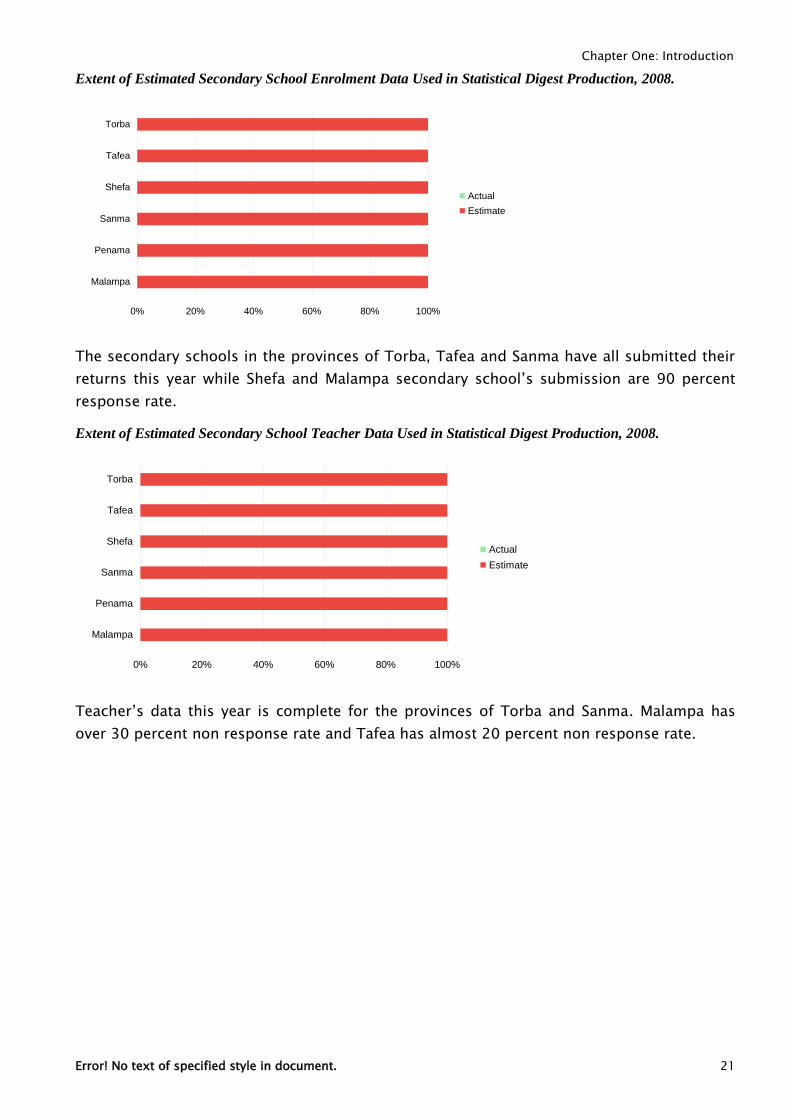
Extent of Estimated Secondary School Enrolment Data Used in Statistical Digest Production, 2008.
0% 20% 40% 60% 80% 100%
Malampa
Penama
Sanma
Shefa
Tafea
Torba
Actual
Estimate
The secondary schools in the provinces of Torba, Tafea and Sanma have all submitted their
returns this year while Shefa and Malampa secondary school‟s submission are 90 percent
response rate.
Extent of Estimated Secondary School Teacher Data Used in Statistical Digest Production, 2008.
0% 20% 40% 60% 80% 100%
Malampa
Penama
Sanma
Shefa
Tafea
Torba
Actual
Estimate
Teacher‟s data this year is complete for the provinces of Torba and Sanma. Malampa has
over 30 percent non response rate and Tafea has almost 20 percent non response rate.
Chapter Two: National Summary Statistics
22 Republic of Vanuatu
Chapter Two: National Summary Statistics
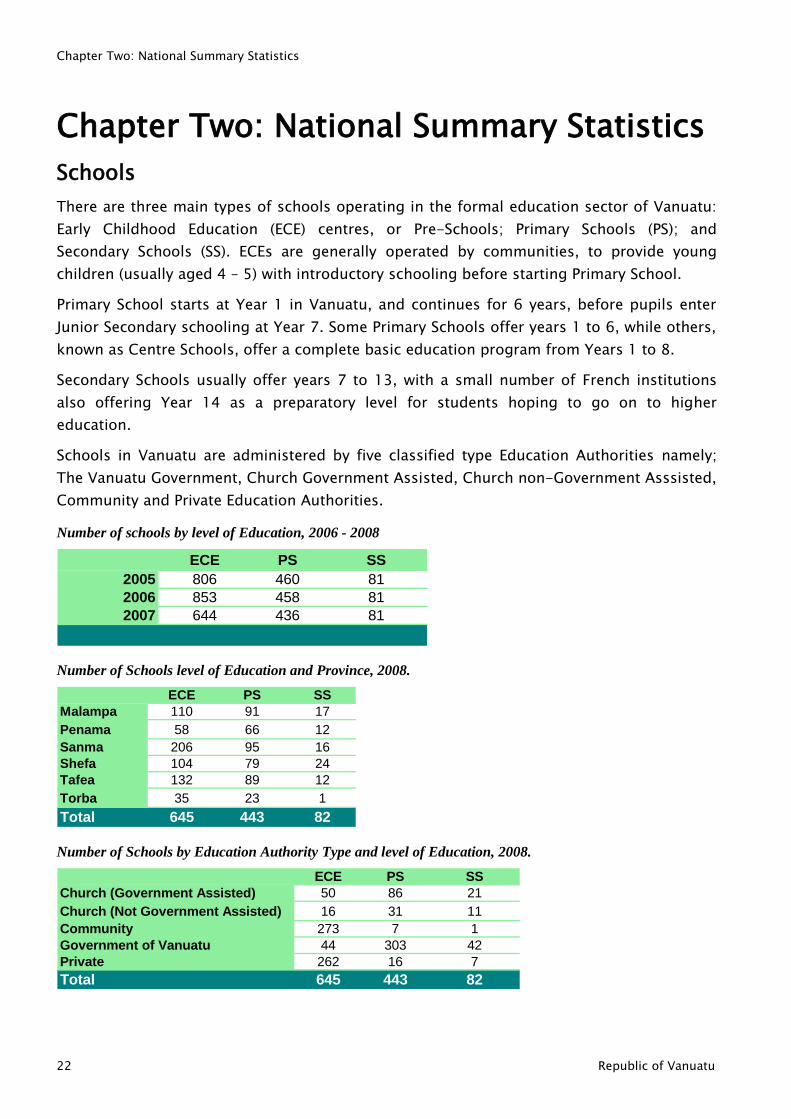
Schools
There are three main types of schools operating in the formal education sector of Vanuatu:
Early Childhood Education (ECE) centres, or Pre-Schools; Primary Schools (PS); and
Secondary Schools (SS). ECEs are generally operated by communities, to provide young
children (usually aged 4 – 5) with introductory schooling before starting Primary School.
Primary School starts at Year 1 in Vanuatu, and continues for 6 years, before pupils enter
Junior Secondary schooling at Year 7. Some Primary Schools offer years 1 to 6, while others,
known as Centre Schools, offer a complete basic education program from Years 1 to 8.
Secondary Schools usually offer years 7 to 13, with a small number of French institutions
also offering Year 14 as a preparatory level for students hoping to go on to higher
education.
Schools in Vanuatu are administered by five classified type Education Authorities namely;
The Vanuatu Government, Church Government Assisted, Church non-Government Asssisted,
Community and Private Education Authorities.
Number of schools by level of Education, 2006 - 2008
ECE PS SS
2005 806 460 81
2006 853 458 81
2007 644 436 81
Number of Schools level of Education and Province, 2008.
ECE PS SS
Malampa 110 91 17
Penama 58 66 12
Sanma 206 95 16
Shefa 104 79 24
Tafea 132 89 12
Torba 35 23 1
Total 645 443 82
Number of Schools by Education Authority Type and level of Education, 2008.
ECE PS SS
Church (Government Assisted) 50 86 21
Church (Not Government Assisted) 16 31 11
Community 273 7 1
Government of Vanuatu 44 303 42
Private 262 16 7
Total 645 443 82
Chapter Two: National Summary Statistics
Error! No text of specified style in document. 23
Enrolments
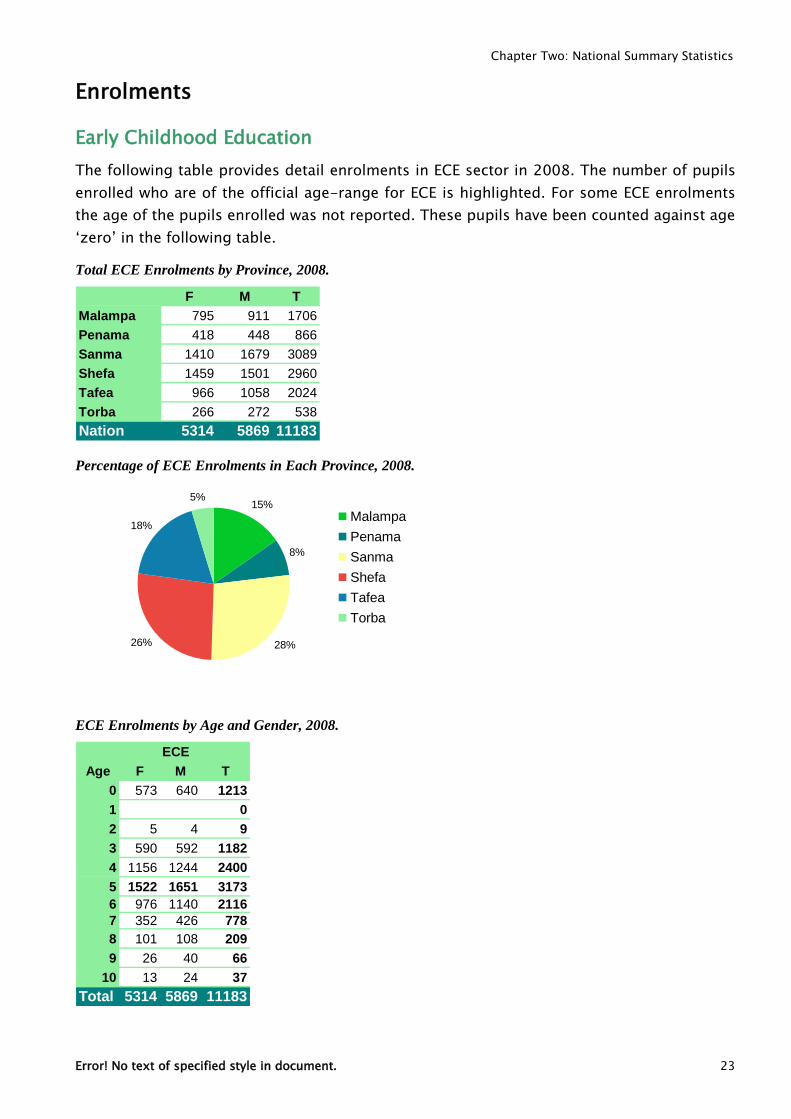
Early Childhood Education
The following table provides detail enrolments in ECE sector in 2008. The number of pupils
enrolled who are of the official age-range for ECE is highlighted. For some ECE enrolments
the age of the pupils enrolled was not reported. These pupils have been counted against age
„zero‟ in the following table.
Total ECE Enrolments by Province, 2008.
F M T
Malampa 795 911 1706
Penama 418 448 866
Sanma 1410 1679 3089
Shefa 1459 1501 2960
Tafea 966 1058 2024
Torba 266 272 538
Nation 5314 5869 11183
Percentage of ECE Enrolments in Each Province, 2008.
15%
8%
28%26%
18%
5%
Malampa
Penama
Sanma
Shefa
Tafea
Torba
ECE Enrolments by Age and Gender, 2008.
ECE
F M T
0 573 640 1213
1 0
2 5 4 9
3 590 592 1182
4 1156 1244 2400
5 1522 1651 3173
6 976 1140 2116
7 352 426 778
8 101 108 209
9 26 40 66
10 13 24 37
Total 5314 5869 11183
Age
Chapter Two: National Summary Statistics
24 Republic of Vanuatu
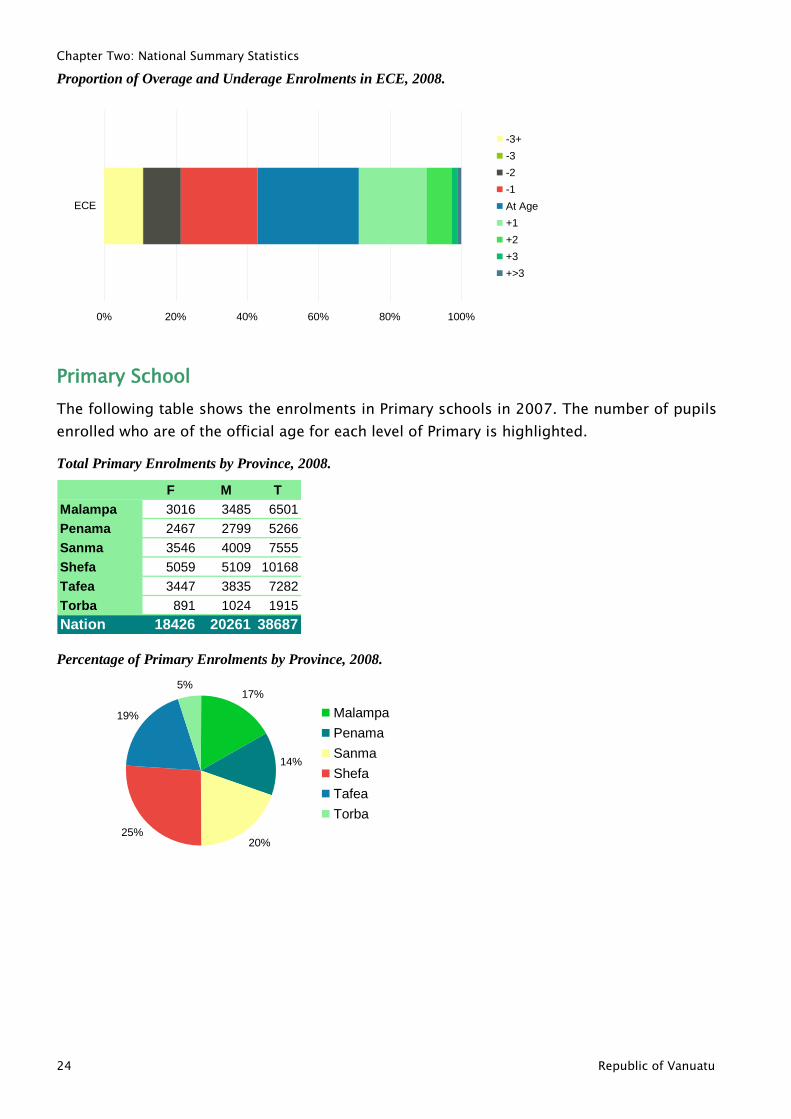
Proportion of Overage and Underage Enrolments in ECE, 2008.
0% 20% 40% 60% 80% 100%
ECE
-3+
-3
-2
-1
At Age
+1
+2
+3
+>3
Primary School
The following table shows the enrolments in Primary schools in 2007. The number of pupils
enrolled who are of the official age for each level of Primary is highlighted.
Total Primary Enrolments by Province, 2008.
F M T
Malampa 3016 3485 6501
Penama 2467 2799 5266
Sanma 3546 4009 7555
Shefa 5059 5109 10168
Tafea 3447 3835 7282
Torba 891 1024 1915
Nation 18426 20261 38687
Percentage of Primary Enrolments by Province, 2008.
17%
14%
20%25%
19%
5%
Malampa
Penama
Sanma
Shefa
Tafea
Torba
Chapter Two: National Summary Statistics
Error! No text of specified style in document. 25
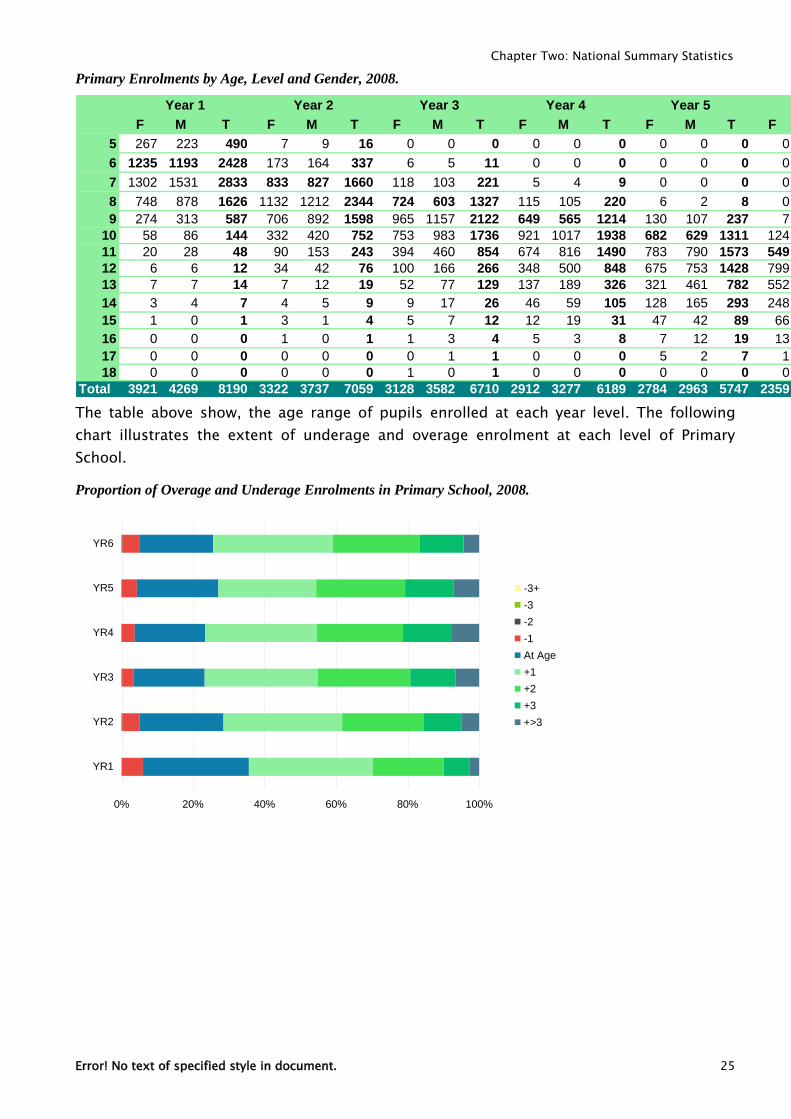
Primary Enrolments by Age, Level and Gender, 2008.
F M T F M T F M T F M T F M T F M T
5 267 223 490 7 9 16 0 0 0 0 0 0 0 0 0 0 0 0
6 1235 1193 2428 173 164 337 6 5 11 0 0 0 0 0 0 0 0 0
7 1302 1531 2833 833 827 1660 118 103 221 5 4 9 0 0 0 0 0 0
8 748 878 1626 1132 1212 2344 724 603 1327 115 105 220 6 2 8 0 1 1
9 274 313 587 706 892 1598 965 1157 2122 649 565 1214 130 107 237 7 5 12
10 58 86 144 332 420 752 753 983 1736 921 1017 1938 682 629 1311 124 101 225
11 20 28 48 90 153 243 394 460 854 674 816 1490 783 790 1573 549 440 989
12 6 6 12 34 42 76 100 166 266 348 500 848 675 753 1428 799 802 1601
13 7 7 14 7 12 19 52 77 129 137 189 326 321 461 782 552 619 1171
14 3 4 7 4 5 9 9 17 26 46 59 105 128 165 293 248 336 584
15 1 0 1 3 1 4 5 7 12 12 19 31 47 42 89 66 105 171
16 0 0 0 1 0 1 1 3 4 5 3 8 7 12 19 13 21 34
17 0 0 0 0 0 0 0 1 1 0 0 0 5 2 7 1 2 3
18 0 0 0 0 0 0 1 0 1 0 0 0 0 0 0 0 1 1
Total 3921 4269 8190 3322 3737 7059 3128 3582 6710 2912 3277 6189 2784 2963 5747 2359 2433 4792
Year 1 Year 2 Year 3 Year 4 Year 5 Year 6
The table above show, the age range of pupils enrolled at each year level. The following
chart illustrates the extent of underage and overage enrolment at each level of Primary
School.
Proportion of Overage and Underage Enrolments in Primary School, 2008.
0% 20% 40% 60% 80% 100%
YR1
YR2
YR3
YR4
YR5
YR6
-3+
-3
-2
-1
At Age
+1
+2
+3
+>3
Chapter Two: National Summary Statistics
26 Republic of Vanuatu
Junior Secondary School
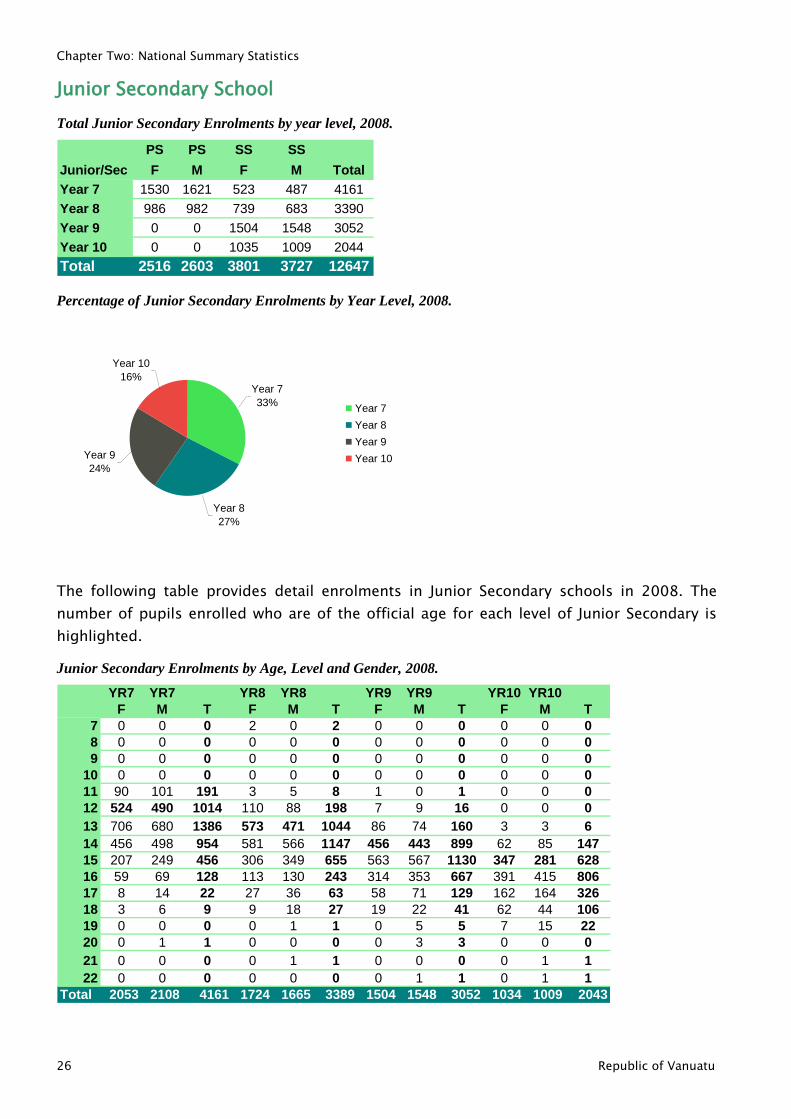
Total Junior Secondary Enrolments by year level, 2008.
PS PS SS SS
Junior/Sec F M F M Total
Year 7 1530 1621 523 487 4161
Year 8 986 982 739 683 3390
Year 9 0 0 1504 1548 3052
Year 10 0 0 1035 1009 2044
Total 2516 2603 3801 3727 12647
Percentage of Junior Secondary Enrolments by Year Level, 2008.
Year 10
16%Year 7
33%
Year 8
27%
Year 9
24%
Year 7
Year 8
Year 9
Year 10
The following table provides detail enrolments in Junior Secondary schools in 2008. The
number of pupils enrolled who are of the official age for each level of Junior Secondary is
highlighted.
Junior Secondary Enrolments by Age, Level and Gender, 2008.
YR7 YR7 YR8 YR8 YR9 YR9 YR10 YR10
F M T F M T F M T F M T
7 0 0 0 2 0 2 0 0 0 0 0 0
8 0 0 0 0 0 0 0 0 0 0 0 0
9 0 0 0 0 0 0 0 0 0 0 0 0
10 0 0 0 0 0 0 0 0 0 0 0 0
11 90 101 191 3 5 8 1 0 1 0 0 0
12 524 490 1014 110 88 198 7 9 16 0 0 0
13 706 680 1386 573 471 1044 86 74 160 3 3 6
14 456 498 954 581 566 1147 456 443 899 62 85 147
15 207 249 456 306 349 655 563 567 1130 347 281 628
16 59 69 128 113 130 243 314 353 667 391 415 806
17 8 14 22 27 36 63 58 71 129 162 164 326
18 3 6 9 9 18 27 19 22 41 62 44 106
19 0 0 0 0 1 1 0 5 5 7 15 22
20 0 1 1 0 0 0 0 3 3 0 0 0
21 0 0 0 0 1 1 0 0 0 0 1 1
22 0 0 0 0 0 0 0 1 1 0 1 1
Total 2053 2108 4161 1724 1665 3389 1504 1548 3052 1034 1009 2043
Chapter Two: National Summary Statistics
Error! No text of specified style in document. 27
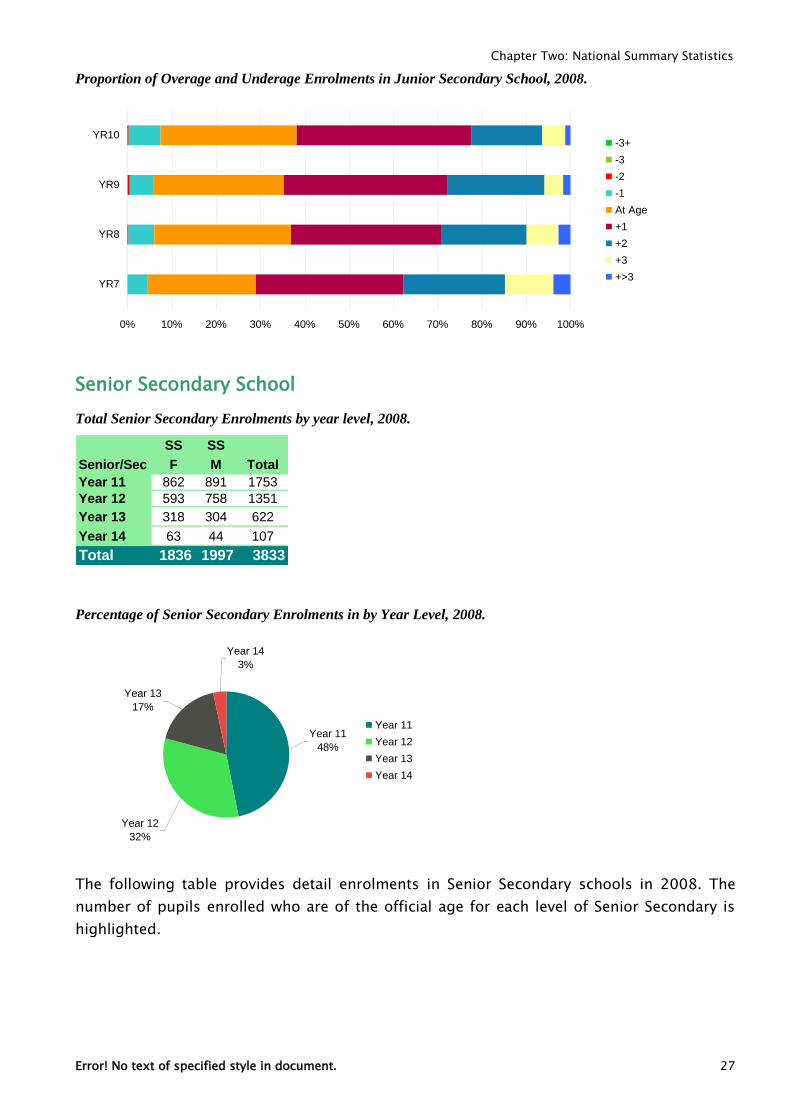
Proportion of Overage and Underage Enrolments in Junior Secondary School, 2008.
0% 10% 20% 30% 40% 50% 60% 70% 80% 90% 100%
YR7
YR8
YR9
YR10-3+
-3
-2
-1
At Age
+1
+2
+3
+>3
Senior Secondary School
Total Senior Secondary Enrolments by year level, 2008.
SS SS
Senior/Sec F M Total
Year 11 862 891 1753
Year 12 593 758 1351
Year 13 318 304 622
Year 14 63 44 107
Total 1836 1997 3833
Percentage of Senior Secondary Enrolments in by Year Level, 2008.
Year 12
32%
Year 11
48%
Year 14
3%
Year 13
17%
Year 11
Year 12
Year 13
Year 14
The following table provides detail enrolments in Senior Secondary schools in 2008. The
number of pupils enrolled who are of the official age for each level of Senior Secondary is
highlighted.
Chapter Two: National Summary Statistics
28 Republic of Vanuatu
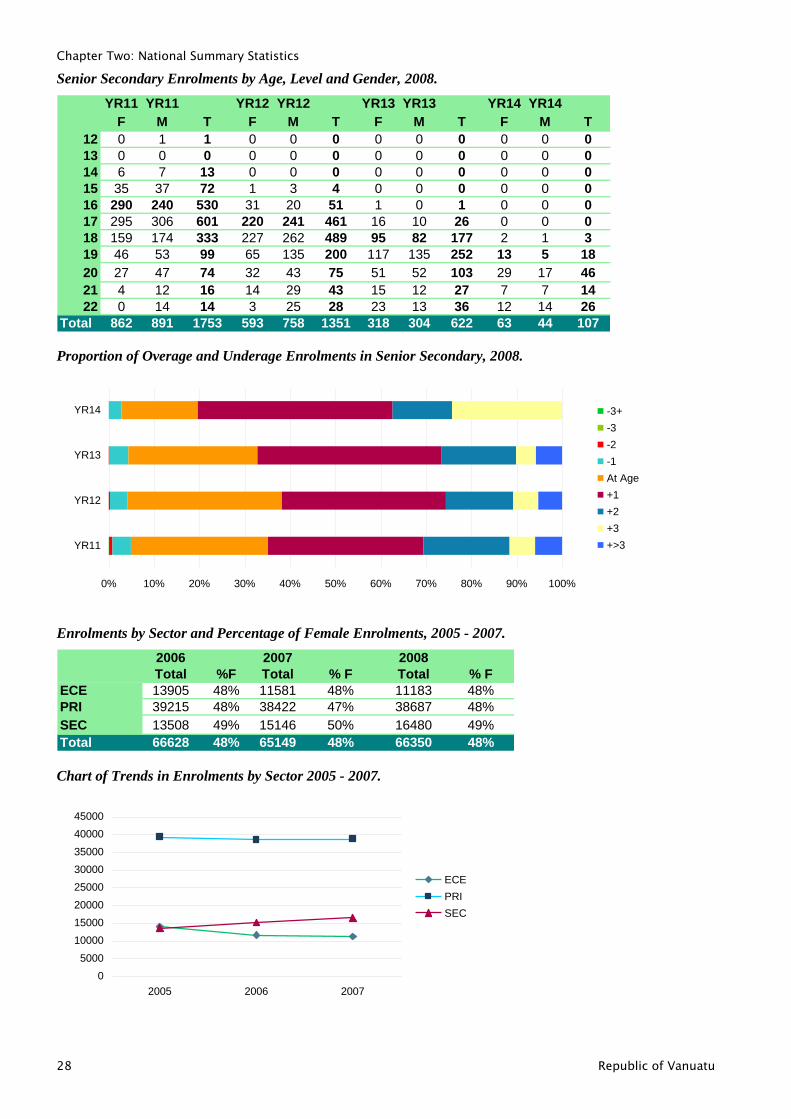
Senior Secondary Enrolments by Age, Level and Gender, 2008.
YR11 YR11 YR12 YR12 YR13 YR13 YR14 YR14
F M T F M T F M T F M T
12 0 1 1 0 0 0 0 0 0 0 0 0
13 0 0 0 0 0 0 0 0 0 0 0 0
14 6 7 13 0 0 0 0 0 0 0 0 0
15 35 37 72 1 3 4 0 0 0 0 0 0
16 290 240 530 31 20 51 1 0 1 0 0 0
17 295 306 601 220 241 461 16 10 26 0 0 0
18 159 174 333 227 262 489 95 82 177 2 1 3
19 46 53 99 65 135 200 117 135 252 13 5 18
20 27 47 74 32 43 75 51 52 103 29 17 46
21 4 12 16 14 29 43 15 12 27 7 7 14
22 0 14 14 3 25 28 23 13 36 12 14 26
Total 862 891 1753 593 758 1351 318 304 622 63 44 107
Proportion of Overage and Underage Enrolments in Senior Secondary, 2008.
0% 10% 20% 30% 40% 50% 60% 70% 80% 90% 100%
YR11
YR12
YR13
YR14 -3+
-3
-2
-1
At Age
+1
+2
+3
+>3
Enrolments by Sector and Percentage of Female Enrolments, 2005 - 2007.
2006 2007 2008
Total %F Total % F Total % F
ECE 13905 48% 11581 48% 11183 48%
PRI 39215 48% 38422 47% 38687 48%
SEC 13508 49% 15146 50% 16480 49%
Total 66628 48% 65149 48% 66350 48%
Chart of Trends in Enrolments by Sector 2005 - 2007.
0
5000
10000
15000
20000
25000
30000
35000
40000
45000
2005 2006 2007
ECE
PRI
SEC
Chapter Two: National Summary Statistics
Error! No text of specified style in document. 29
Teachers
Note that the table below only shows the total number of teachers by medium of instruction;
English, French, and vernacular. Quite a number of teachers also indicated to teach either in
Bislama, Tannese, East Ambae and even Billingual, are not captured in this table.
Number of Teachers by Sector and Medium of Instruction,2008
Error! Not a valid link.
Chart showing number of teachers by medium of instruction
Error! Not a valid link.
Chapter Three: Vanuatu Education Sector Strategy
30 Republic of Vanuatu
Chapter Three: Vanuatu Education Sector
Strategy
Vision
Our vision is for a caring education system which provides every young person with the
lifelong skills, values, and confidence to be self-reliant and to contribute to the
development of Vanuatu, and which works in partnership with all stakeholders to provide
well-managed schools.
Mission
Our mission is to provide student-centred education that is accessible, relevant,
sustainable, responsive, and of good quality, to guarantee every young person:
Pre-school and basic education to year 8, including literacy, numeracy, life skills, and
livelihood skills, respect for our history and culture, and respect for human rights;
Expanded opportunities for secondary, technical, tertiary and higher education;
Support for parents and communities to participate in and manage their schools;
A well-managed and accountable education system which focuses on building the
human resources of Vanuatu, improving learning, living, and working opportunities, and
enabling young people to contribute to the productive sectors in both rural and urban
areas.
Goals
Based on these vision and mission statements, 7 core goals for education sector expansion
and development have been identified. The tables and charts that have been compiled in the
following section help to illustrate recent trends and current status of several key indicators
of achievement in respect of the VESS goals. Monitoring these indicators over time will
enable MEYDT to monitor progress towards the achievement of VESS goals, and assess the
impact of VESS programs on these highlighted areas for investment and reform.
Goal One
Goal 1: Achieve universal Primary Education completions, strengthen literacy,
languages and numeracy, and develop a national pre-school curriculum and pre-
school training program.
Access to School and Universal Primary Completion
A starting point for the achievement of this goal is to ensure that all children in Vanuatu
have access to school. The Ministry of Education monitors access to education using
Chapter Three: Vanuatu Education Sector Strategy
Error! No text of specified style in document. 31
indicators such as Gross Enrolment Ratios (GER) and Net Enrolment Ratios (NER). GER and
NER can be defined as follows:
GER: Total enrolment in ECE, Primary or Secondary education expressed as a percentage of the total population
of children who are of the official age group for that level of education.
NER: Total enrolment of pupils of the official age group for ECE, Primary or Secondary education expressed as a
percentage of the total population of children who are of the official age group for that level of education.
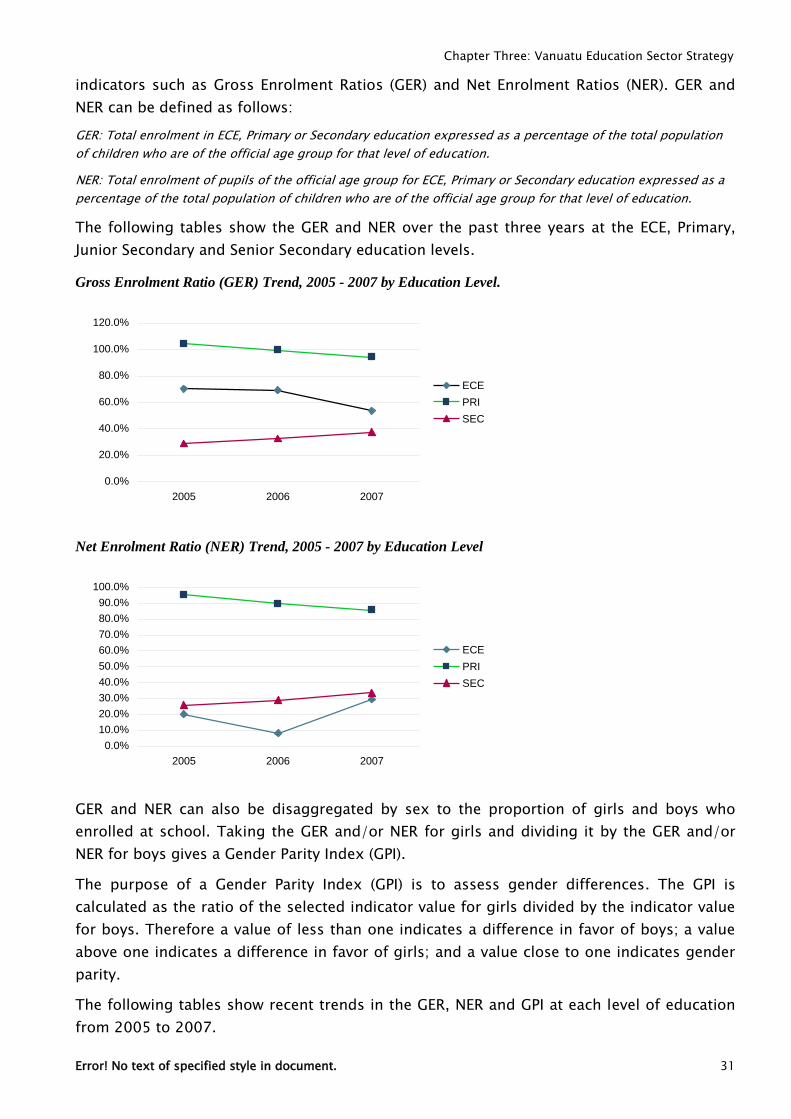
The following tables show the GER and NER over the past three years at the ECE, Primary,
Junior Secondary and Senior Secondary education levels.
Gross Enrolment Ratio (GER) Trend, 2005 - 2007 by Education Level.
0.0%
20.0%
40.0%
60.0%
80.0%
100.0%
120.0%
2005 2006 2007
ECE
PRI
SEC
Net Enrolment Ratio (NER) Trend, 2005 - 2007 by Education Level
0.0%
10.0%
20.0%
30.0%
40.0%
50.0%
60.0%
70.0%
80.0%
90.0%
100.0%
2005 2006 2007
ECE
PRI
SEC
GER and NER can also be disaggregated by sex to the proportion of girls and boys who
enrolled at school. Taking the GER and/or NER for girls and dividing it by the GER and/or
NER for boys gives a Gender Parity Index (GPI).
The purpose of a Gender Parity Index (GPI) is to assess gender differences. The GPI is
calculated as the ratio of the selected indicator value for girls divided by the indicator value
for boys. Therefore a value of less than one indicates a difference in favor of boys; a value
above one indicates a difference in favor of girls; and a value close to one indicates gender
parity.
The following tables show recent trends in the GER, NER and GPI at each level of education
from 2005 to 2007.
Chapter Three: Vanuatu Education Sector Strategy
32 Republic of Vanuatu
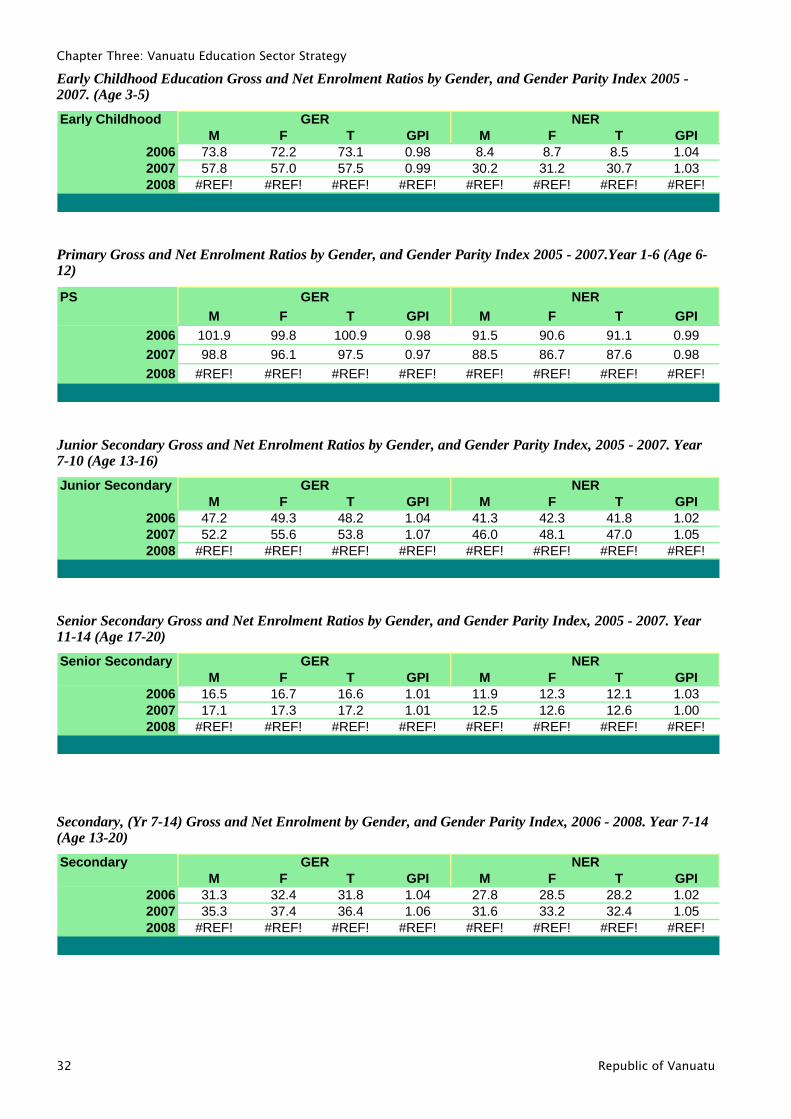
Early Childhood Education Gross and Net Enrolment Ratios by Gender, and Gender Parity Index 2005 - 2007. (Age 3-5)
Early Childhood GER NER
M F T GPI M F T GPI
2006 73.8 72.2 73.1 0.98 8.4 8.7 8.5 1.04
2007 57.8 57.0 57.5 0.99 30.2 31.2 30.7 1.03
2008 #REF! #REF! #REF! #REF! #REF! #REF! #REF! #REF!
Primary Gross and Net Enrolment Ratios by Gender, and Gender Parity Index 2005 - 2007.Year 1-6 (Age 6-12)
PS GER NER
M F T GPI M F T GPI
2006 101.9 99.8 100.9 0.98 91.5 90.6 91.1 0.99
2007 98.8 96.1 97.5 0.97 88.5 86.7 87.6 0.98
2008 #REF! #REF! #REF! #REF! #REF! #REF! #REF! #REF!
Junior Secondary Gross and Net Enrolment Ratios by Gender, and Gender Parity Index, 2005 - 2007. Year 7-10 (Age 13-16)
Junior Secondary GER NER
M F T GPI M F T GPI
2006 47.2 49.3 48.2 1.04 41.3 42.3 41.8 1.02
2007 52.2 55.6 53.8 1.07 46.0 48.1 47.0 1.05
2008 #REF! #REF! #REF! #REF! #REF! #REF! #REF! #REF!
Senior Secondary Gross and Net Enrolment Ratios by Gender, and Gender Parity Index, 2005 - 2007. Year 11-14 (Age 17-20)
Senior Secondary GER NER
M F T GPI M F T GPI
2006 16.5 16.7 16.6 1.01 11.9 12.3 12.1 1.03
2007 17.1 17.3 17.2 1.01 12.5 12.6 12.6 1.00
2008 #REF! #REF! #REF! #REF! #REF! #REF! #REF! #REF!
Secondary, (Yr 7-14) Gross and Net Enrolment by Gender, and Gender Parity Index, 2006 - 2008. Year 7-14 (Age 13-20)
Secondary GER NER
M F T GPI M F T GPI
2006 31.3 32.4 31.8 1.04 27.8 28.5 28.2 1.02
2007 35.3 37.4 36.4 1.06 31.6 33.2 32.4 1.05
2008 #REF! #REF! #REF! #REF! #REF! #REF! #REF! #REF!
Chapter Three: Vanuatu Education Sector Strategy
Error! No text of specified style in document. 33
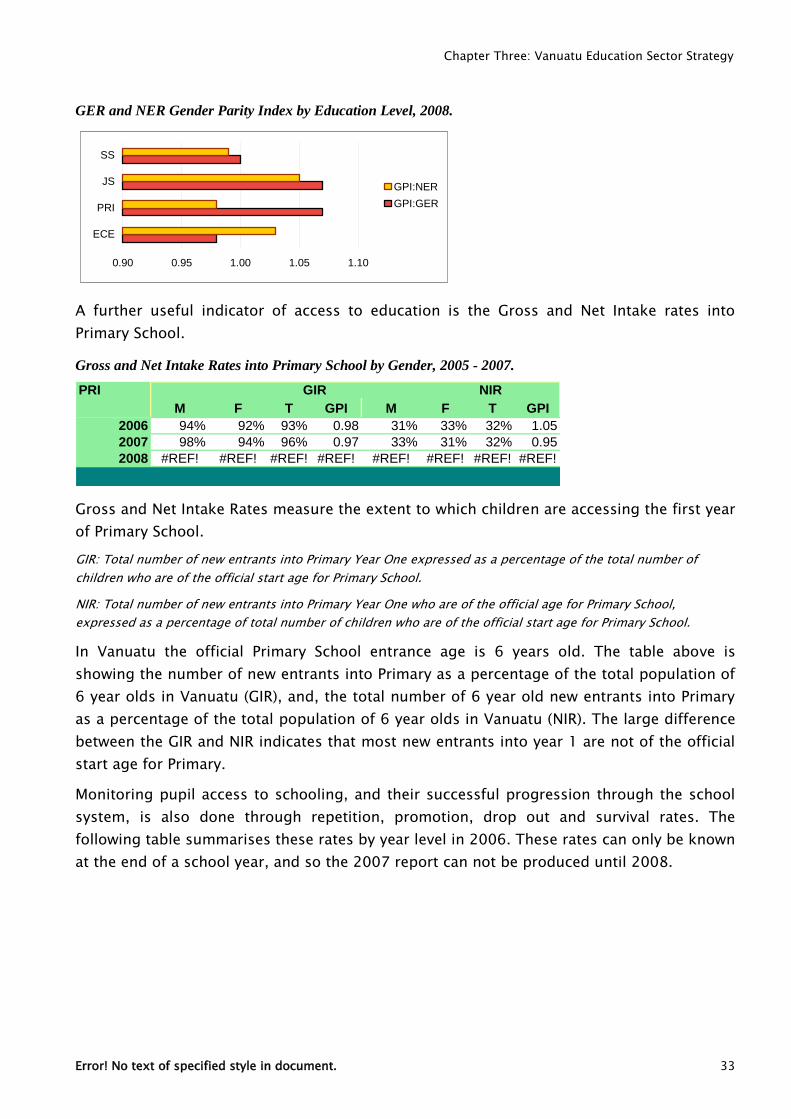
GER and NER Gender Parity Index by Education Level, 2008.
0.90 0.95 1.00 1.05 1.10
ECE
PRI
JS
SS
GPI:NER
GPI:GER
A further useful indicator of access to education is the Gross and Net Intake rates into
Primary School.
Gross and Net Intake Rates into Primary School by Gender, 2005 - 2007.
PRI GIR NIR
M F T GPI M F T GPI
2006 94% 92% 93% 0.98 31% 33% 32% 1.05
2007 98% 94% 96% 0.97 33% 31% 32% 0.95
2008 #REF! #REF! #REF! #REF! #REF! #REF! #REF! #REF!
Gross and Net Intake Rates measure the extent to which children are accessing the first year
of Primary School.
GIR: Total number of new entrants into Primary Year One expressed as a percentage of the total number of
children who are of the official start age for Primary School.
NIR: Total number of new entrants into Primary Year One who are of the official age for Primary School,
expressed as a percentage of total number of children who are of the official start age for Primary School.
In Vanuatu the official Primary School entrance age is 6 years old. The table above is
showing the number of new entrants into Primary as a percentage of the total population of
6 year olds in Vanuatu (GIR), and, the total number of 6 year old new entrants into Primary
as a percentage of the total population of 6 year olds in Vanuatu (NIR). The large difference
between the GIR and NIR indicates that most new entrants into year 1 are not of the official
start age for Primary.
Monitoring pupil access to schooling, and their successful progression through the school
system, is also done through repetition, promotion, drop out and survival rates. The
following table summarises these rates by year level in 2006. These rates can only be known
at the end of a school year, and so the 2007 report can not be produced until 2008.
Chapter Three: Vanuatu Education Sector Strategy
34 Republic of Vanuatu
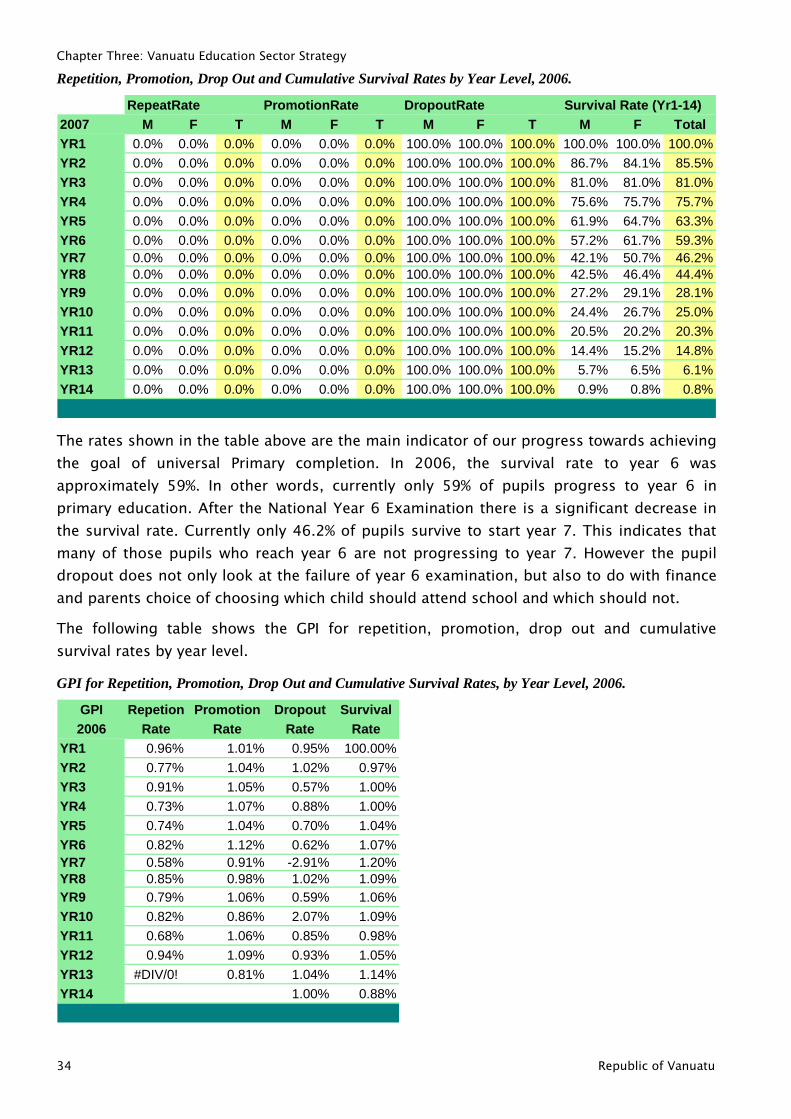
Repetition, Promotion, Drop Out and Cumulative Survival Rates by Year Level, 2006.
RepeatRate PromotionRate DropoutRate Survival Rate (Yr1-14)
2007 M F T M F T M F T M F Total
YR1 0.0% 0.0% 0.0% 0.0% 0.0% 0.0% 100.0% 100.0% 100.0% 100.0% 100.0% 100.0%
YR2 0.0% 0.0% 0.0% 0.0% 0.0% 0.0% 100.0% 100.0% 100.0% 86.7% 84.1% 85.5%
YR3 0.0% 0.0% 0.0% 0.0% 0.0% 0.0% 100.0% 100.0% 100.0% 81.0% 81.0% 81.0%
YR4 0.0% 0.0% 0.0% 0.0% 0.0% 0.0% 100.0% 100.0% 100.0% 75.6% 75.7% 75.7%
YR5 0.0% 0.0% 0.0% 0.0% 0.0% 0.0% 100.0% 100.0% 100.0% 61.9% 64.7% 63.3%
YR6 0.0% 0.0% 0.0% 0.0% 0.0% 0.0% 100.0% 100.0% 100.0% 57.2% 61.7% 59.3%
YR7 0.0% 0.0% 0.0% 0.0% 0.0% 0.0% 100.0% 100.0% 100.0% 42.1% 50.7% 46.2%
YR8 0.0% 0.0% 0.0% 0.0% 0.0% 0.0% 100.0% 100.0% 100.0% 42.5% 46.4% 44.4%
YR9 0.0% 0.0% 0.0% 0.0% 0.0% 0.0% 100.0% 100.0% 100.0% 27.2% 29.1% 28.1%
YR10 0.0% 0.0% 0.0% 0.0% 0.0% 0.0% 100.0% 100.0% 100.0% 24.4% 26.7% 25.0%
YR11 0.0% 0.0% 0.0% 0.0% 0.0% 0.0% 100.0% 100.0% 100.0% 20.5% 20.2% 20.3%
YR12 0.0% 0.0% 0.0% 0.0% 0.0% 0.0% 100.0% 100.0% 100.0% 14.4% 15.2% 14.8%
YR13 0.0% 0.0% 0.0% 0.0% 0.0% 0.0% 100.0% 100.0% 100.0% 5.7% 6.5% 6.1%
YR14 0.0% 0.0% 0.0% 0.0% 0.0% 0.0% 100.0% 100.0% 100.0% 0.9% 0.8% 0.8%
The rates shown in the table above are the main indicator of our progress towards achieving
the goal of universal Primary completion. In 2006, the survival rate to year 6 was
approximately 59%. In other words, currently only 59% of pupils progress to year 6 in
primary education. After the National Year 6 Examination there is a significant decrease in
the survival rate. Currently only 46.2% of pupils survive to start year 7. This indicates that
many of those pupils who reach year 6 are not progressing to year 7. However the pupil
dropout does not only look at the failure of year 6 examination, but also to do with finance
and parents choice of choosing which child should attend school and which should not.
The following table shows the GPI for repetition, promotion, drop out and cumulative
survival rates by year level.
GPI for Repetition, Promotion, Drop Out and Cumulative Survival Rates, by Year Level, 2006.
GPI Repetion Promotion Dropout Survival
2006 Rate Rate Rate Rate
YR1 0.96% 1.01% 0.95% 100.00%
YR2 0.77% 1.04% 1.02% 0.97%
YR3 0.91% 1.05% 0.57% 1.00%
YR4 0.73% 1.07% 0.88% 1.00%
YR5 0.74% 1.04% 0.70% 1.04%
YR6 0.82% 1.12% 0.62% 1.07%
YR7 0.58% 0.91% -2.91% 1.20%
YR8 0.85% 0.98% 1.02% 1.09%
YR9 0.79% 1.06% 0.59% 1.06%
YR10 0.82% 0.86% 2.07% 1.09%
YR11 0.68% 1.06% 0.85% 0.98%
YR12 0.94% 1.09% 0.93% 1.05%
YR13 #DIV/0! 0.81% 1.04% 1.14%
YR14 1.00% 0.88%
Chapter Three: Vanuatu Education Sector Strategy
Error! No text of specified style in document. 35
Access and equity in school are key cross cutting issues therefore inclusive education
programs are being developed to ensure pupils with disabilities are able to access education.
The pupils though may have not gone through a proper disability test; however teachers
assess their pupils through physical appearance, inside classroom learning assessment;
their accedmic performance and records of pupils‟ medical reports.
The following tables below shows the number of pupil enrolled, by disability type, gender
and by sector.
Number of ECE pupil with a disability who are enrolled in school, by Gender, 2008
Error! Not a valid link.
Percentage of ECE disability type, 2008
Error! Not a valid link.
Number of PS pupil with a disability who are enrolled in school, by Gender, 2008
Error! Not a valid link.
Percentage of PS disability type, 2008
Error! Not a valid link.
Number of SS pupil with a disability who are enrolled in school, by Gender, 2008
Error! Not a valid link.
Number of SS pupil with a disability who are enrolled in school, by Gender, 2008
Error! Not a valid link.
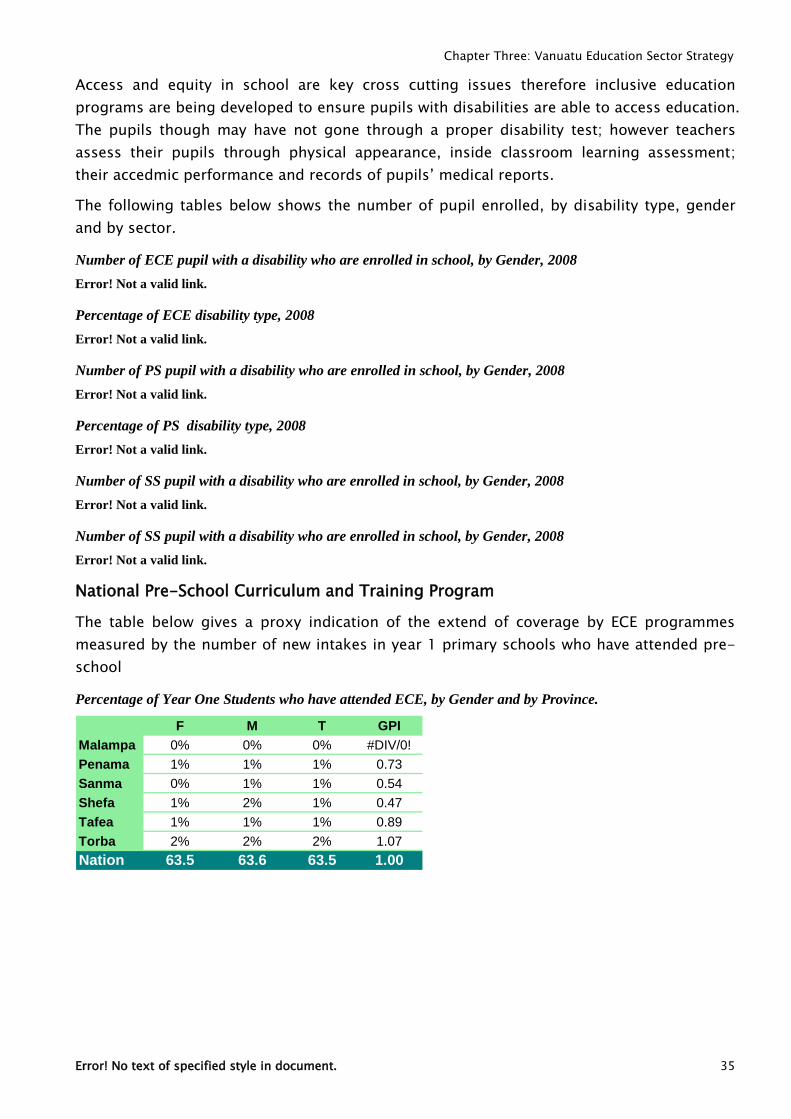
National Pre-School Curriculum and Training Program
The table below gives a proxy indication of the extend of coverage by ECE programmes
measured by the number of new intakes in year 1 primary schools who have attended pre-
school
Percentage of Year One Students who have attended ECE, by Gender and by Province.
F M T GPI
Malampa 0% 0% 0% #DIV/0!
Penama 1% 1% 1% 0.73
Sanma 0% 1% 1% 0.54
Shefa 1% 2% 1% 0.47
Tafea 1% 1% 1% 0.89
Torba 2% 2% 2% 1.07
Nation 63.5 63.6 63.5 1.00
Chapter Three: Vanuatu Education Sector Strategy
36 Republic of Vanuatu
Goal Two
Goal 2: Continue to expand and improve affordable bi-lingual secondary, technical
and higher education which meet national and international standards.
Bi-lingual schooling is available at all levels in the Vanuatu education system. Expanding
and improving bi-lingual education is a core goal of the VESS. The following tables and
charts illustrate the current scope of bi-lingual education in Vanuatu.
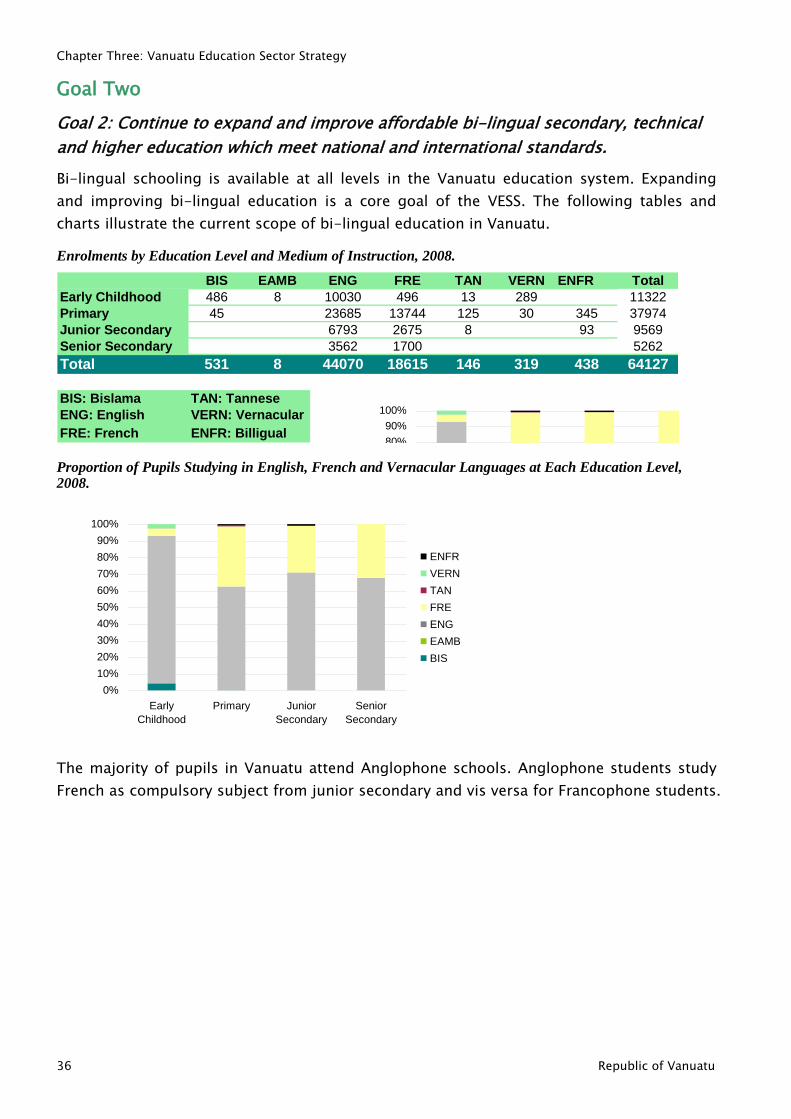
Enrolments by Education Level and Medium of Instruction, 2008.
BIS EAMB ENG FRE TAN VERN ENFR Total
Early Childhood 486 8 10030 496 13 289 11322
Primary 45 23685 13744 125 30 345 37974
Junior Secondary 6793 2675 8 93 9569
Senior Secondary 3562 1700 5262
Total 531 8 44070 18615 146 319 438 64127
BIS: Bislama TAN: Tannese
ENG: English VERN: Vernacular
FRE: French ENFR: Billigual
0%
10%
20%
30%
40%
50%
60%
70%
80%
90%
100%
Early
Childhood
Primary Junior
Secondary
Senior
Secondary
ENFR
VERN
TAN
FRE
ENG
EAMB
BIS
Proportion of Pupils Studying in English, French and Vernacular Languages at Each Education Level, 2008.
0%
10%
20%
30%
40%
50%
60%
70%
80%
90%
100%
Early
Childhood
Primary Junior
Secondary
Senior
Secondary
ENFR
VERN
TAN
FRE
ENG
EAMB
BIS
The majority of pupils in Vanuatu attend Anglophone schools. Anglophone students study
French as compulsory subject from junior secondary and vis versa for Francophone students.
Chapter Three: Vanuatu Education Sector Strategy
Error! No text of specified style in document. 37
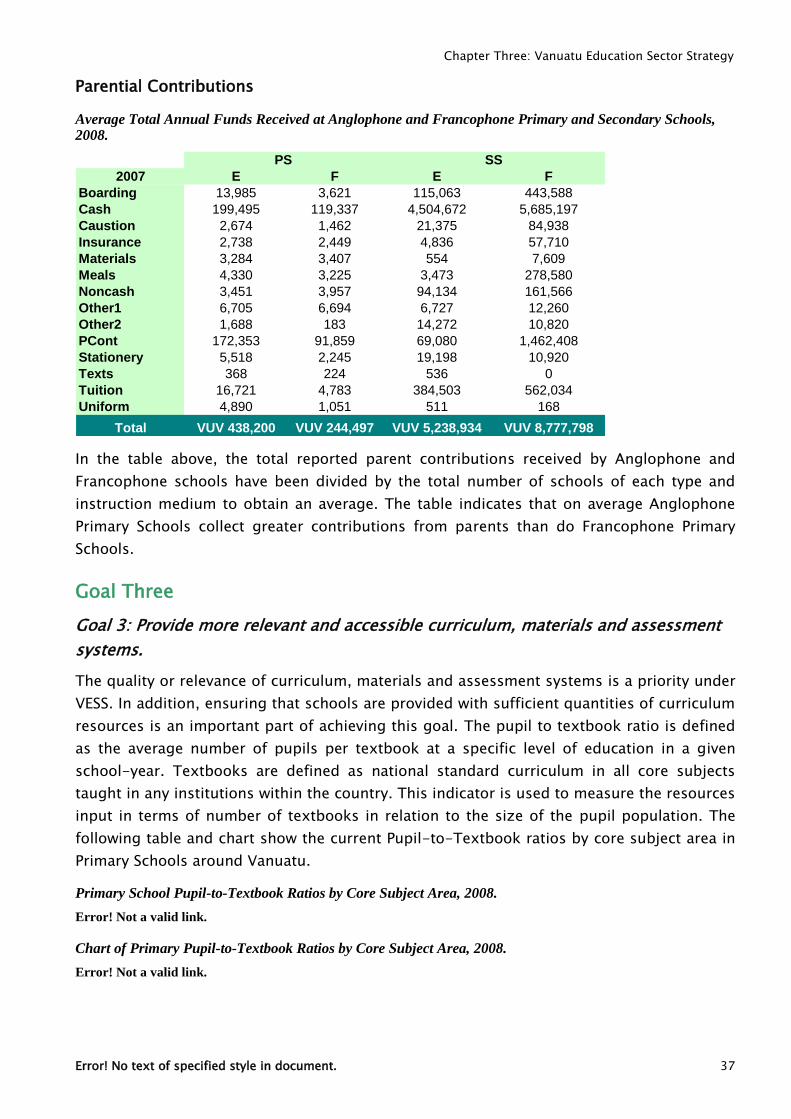
Parential Contributions
Average Total Annual Funds Received at Anglophone and Francophone Primary and Secondary Schools, 2008.
2007 E F E F
Boarding 13,985 3,621 115,063 443,588
Cash 199,495 119,337 4,504,672 5,685,197
Caustion 2,674 1,462 21,375 84,938
Insurance 2,738 2,449 4,836 57,710
Materials 3,284 3,407 554 7,609
Meals 4,330 3,225 3,473 278,580
Noncash 3,451 3,957 94,134 161,566
Other1 6,705 6,694 6,727 12,260
Other2 1,688 183 14,272 10,820
PCont 172,353 91,859 69,080 1,462,408
Stationery 5,518 2,245 19,198 10,920
Texts 368 224 536 0
Tuition 16,721 4,783 384,503 562,034
Uniform 4,890 1,051 511 168
Total VUV 438,200 VUV 244,497 VUV 5,238,934 VUV 8,777,798
PS SS
In the table above, the total reported parent contributions received by Anglophone and
Francophone schools have been divided by the total number of schools of each type and
instruction medium to obtain an average. The table indicates that on average Anglophone
Primary Schools collect greater contributions from parents than do Francophone Primary
Schools.
Goal Three
Goal 3: Provide more relevant and accessible curriculum, materials and assessment
systems.
The quality or relevance of curriculum, materials and assessment systems is a priority under
VESS. In addition, ensuring that schools are provided with sufficient quantities of curriculum
resources is an important part of achieving this goal. The pupil to textbook ratio is defined
as the average number of pupils per textbook at a specific level of education in a given
school-year. Textbooks are defined as national standard curriculum in all core subjects
taught in any institutions within the country. This indicator is used to measure the resources
input in terms of number of textbooks in relation to the size of the pupil population. The
following table and chart show the current Pupil-to-Textbook ratios by core subject area in
Primary Schools around Vanuatu.
Primary School Pupil-to-Textbook Ratios by Core Subject Area, 2008.
Error! Not a valid link.
Chart of Primary Pupil-to-Textbook Ratios by Core Subject Area, 2008.
Error! Not a valid link.
Chapter Three: Vanuatu Education Sector Strategy
38 Republic of Vanuatu
Goal Four
Goal 4: Provide qualified, productive and well-supported teachers for every school
and strengthen the professional competence of teachers.
The contribution that teachers make each year to the society, by educating and caring for
our children, is important. Training and supporting teachers in this important role is a main
priority of the VESS. The following series of tables and charts show the key indicators being
used to monitor teaching conditions and the support being given to teachers at each level of
the education system.
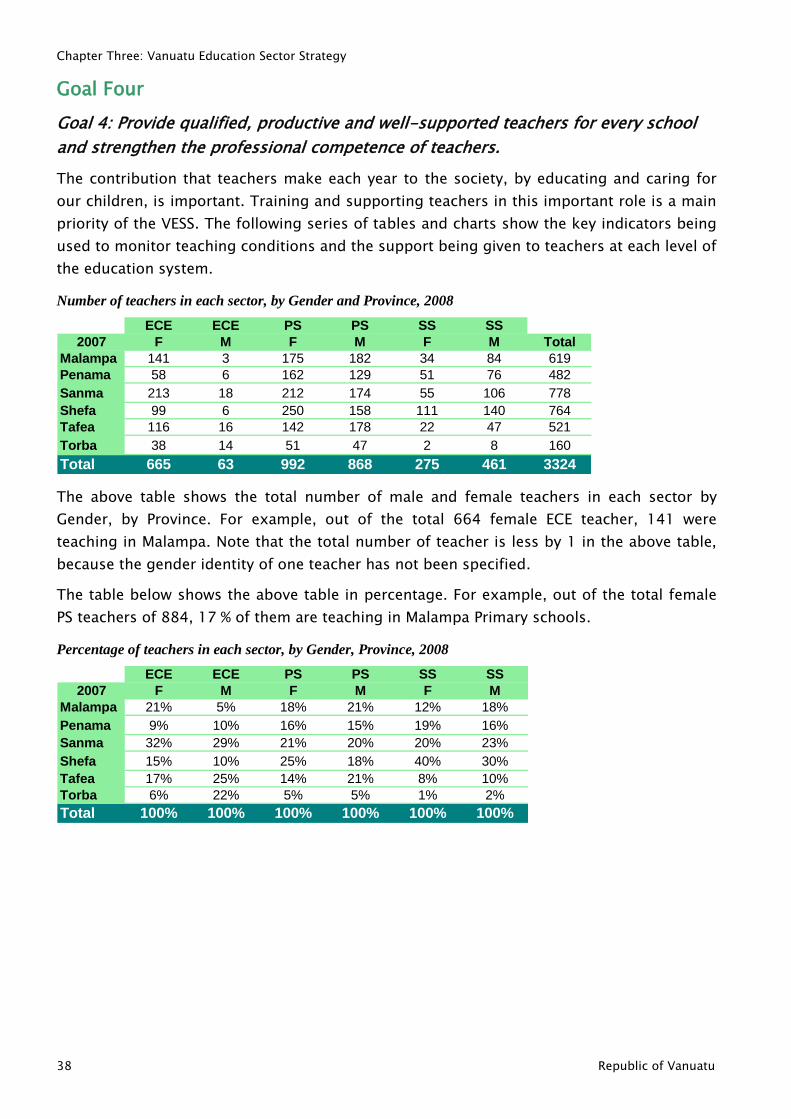
Number of teachers in each sector, by Gender and Province, 2008
ECE ECE PS PS SS SS
2007 F M F M F M Total
Malampa 141 3 175 182 34 84 619
Penama 58 6 162 129 51 76 482
Sanma 213 18 212 174 55 106 778
Shefa 99 6 250 158 111 140 764
Tafea 116 16 142 178 22 47 521
Torba 38 14 51 47 2 8 160
Total 665 63 992 868 275 461 3324
The above table shows the total number of male and female teachers in each sector by
Gender, by Province. For example, out of the total 664 female ECE teacher, 141 were
teaching in Malampa. Note that the total number of teacher is less by 1 in the above table,
because the gender identity of one teacher has not been specified.
The table below shows the above table in percentage. For example, out of the total female
PS teachers of 884, 17 % of them are teaching in Malampa Primary schools.
Percentage of teachers in each sector, by Gender, Province, 2008
ECE ECE PS PS SS SS
2007 F M F M F M
Malampa 21% 5% 18% 21% 12% 18%
Penama 9% 10% 16% 15% 19% 16%
Sanma 32% 29% 21% 20% 20% 23%
Shefa 15% 10% 25% 18% 40% 30%
Tafea 17% 25% 14% 21% 8% 10%
Torba 6% 22% 5% 5% 1% 2%
Total 100% 100% 100% 100% 100% 100%
Chapter Three: Vanuatu Education Sector Strategy
Error! No text of specified style in document. 39
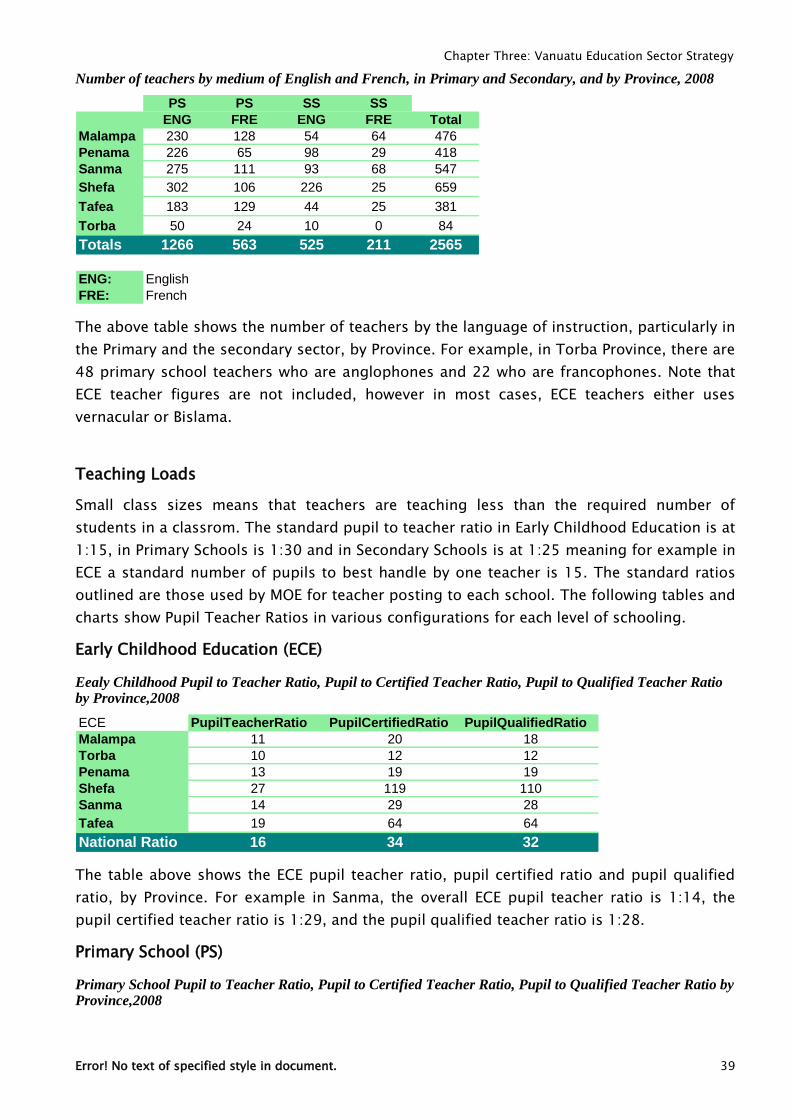
Number of teachers by medium of English and French, in Primary and Secondary, and by Province, 2008
PS PS SS SS
ENG FRE ENG FRE Total
Malampa 230 128 54 64 476
Penama 226 65 98 29 418
Sanma 275 111 93 68 547
Shefa 302 106 226 25 659
Tafea 183 129 44 25 381
Torba 50 24 10 0 84
Totals 1266 563 525 211 2565
ENG: English
FRE: French
The above table shows the number of teachers by the language of instruction, particularly in
the Primary and the secondary sector, by Province. For example, in Torba Province, there are
48 primary school teachers who are anglophones and 22 who are francophones. Note that
ECE teacher figures are not included, however in most cases, ECE teachers either uses
vernacular or Bislama.
Teaching Loads
Small class sizes means that teachers are teaching less than the required number of
students in a classrom. The standard pupil to teacher ratio in Early Childhood Education is at
1:15, in Primary Schools is 1:30 and in Secondary Schools is at 1:25 meaning for example in
ECE a standard number of pupils to best handle by one teacher is 15. The standard ratios
outlined are those used by MOE for teacher posting to each school. The following tables and
charts show Pupil Teacher Ratios in various configurations for each level of schooling.
Early Childhood Education (ECE)
Eealy Childhood Pupil to Teacher Ratio, Pupil to Certified Teacher Ratio, Pupil to Qualified Teacher Ratio by Province,2008
ECE PupilTeacherRatio PupilCertifiedRatio PupilQualifiedRatio
Malampa 11 20 18
Torba 10 12 12
Penama 13 19 19
Shefa 27 119 110
Sanma 14 29 28
Tafea 19 64 64
National Ratio 16 34 32
The table above shows the ECE pupil teacher ratio, pupil certified ratio and pupil qualified
ratio, by Province. For example in Sanma, the overall ECE pupil teacher ratio is 1:14, the
pupil certified teacher ratio is 1:29, and the pupil qualified teacher ratio is 1:28.
Primary School (PS)
Primary School Pupil to Teacher Ratio, Pupil to Certified Teacher Ratio, Pupil to Qualified Teacher Ratio by Province,2008
Chapter Three: Vanuatu Education Sector Strategy
40 Republic of Vanuatu
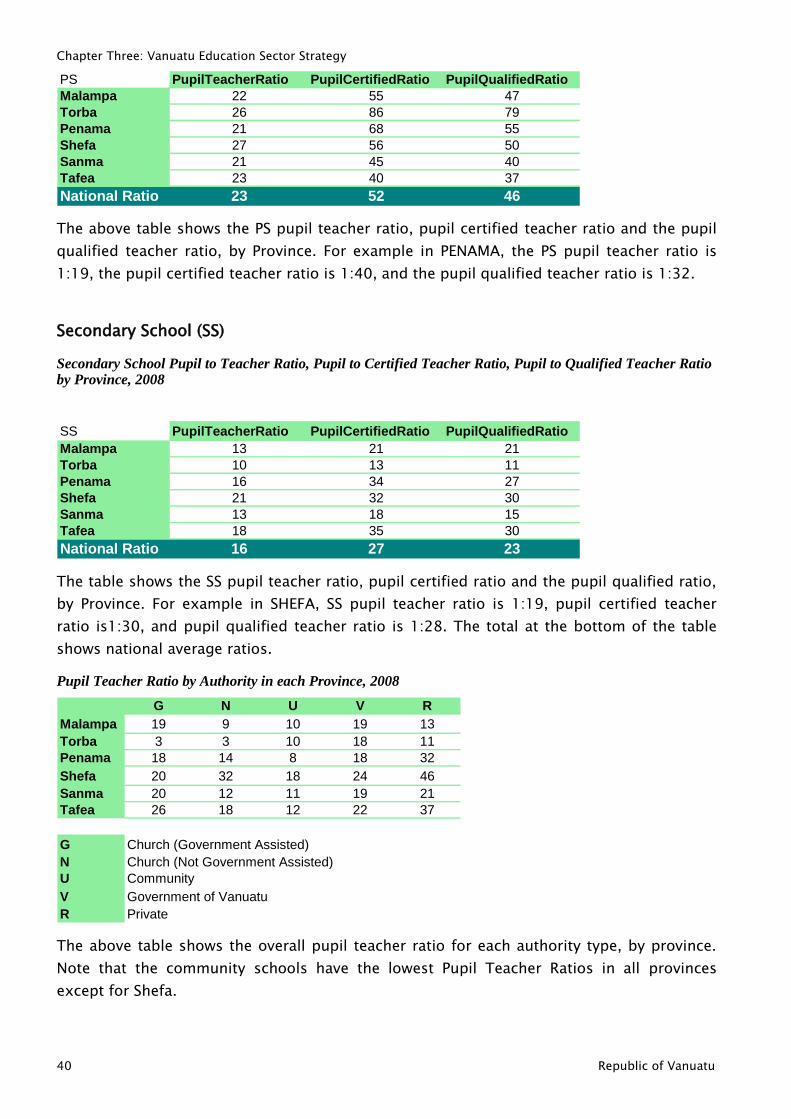
PS PupilTeacherRatio PupilCertifiedRatio PupilQualifiedRatio
Malampa 22 55 47
Torba 26 86 79
Penama 21 68 55
Shefa 27 56 50
Sanma 21 45 40
Tafea 23 40 37
National Ratio 23 52 46
The above table shows the PS pupil teacher ratio, pupil certified teacher ratio and the pupil
qualified teacher ratio, by Province. For example in PENAMA, the PS pupil teacher ratio is
1:19, the pupil certified teacher ratio is 1:40, and the pupil qualified teacher ratio is 1:32.
Secondary School (SS)
Secondary School Pupil to Teacher Ratio, Pupil to Certified Teacher Ratio, Pupil to Qualified Teacher Ratio by Province, 2008
SS PupilTeacherRatio PupilCertifiedRatio PupilQualifiedRatio
Malampa 13 21 21
Torba 10 13 11
Penama 16 34 27
Shefa 21 32 30
Sanma 13 18 15
Tafea 18 35 30
National Ratio 16 27 23
The table shows the SS pupil teacher ratio, pupil certified ratio and the pupil qualified ratio,
by Province. For example in SHEFA, SS pupil teacher ratio is 1:19, pupil certified teacher
ratio is1:30, and pupil qualified teacher ratio is 1:28. The total at the bottom of the table
shows national average ratios.
Pupil Teacher Ratio by Authority in each Province, 2008
G N U V R
Malampa 19 9 10 19 13
Torba 3 3 10 18 11
Penama 18 14 8 18 32
Shefa 20 32 18 24 46
Sanma 20 12 11 19 21
Tafea 26 18 12 22 37
G Church (Government Assisted)
N Church (Not Government Assisted)
U Community
V Government of Vanuatu
R Private
The above table shows the overall pupil teacher ratio for each authority type, by province.
Note that the community schools have the lowest Pupil Teacher Ratios in all provinces
except for Shefa.
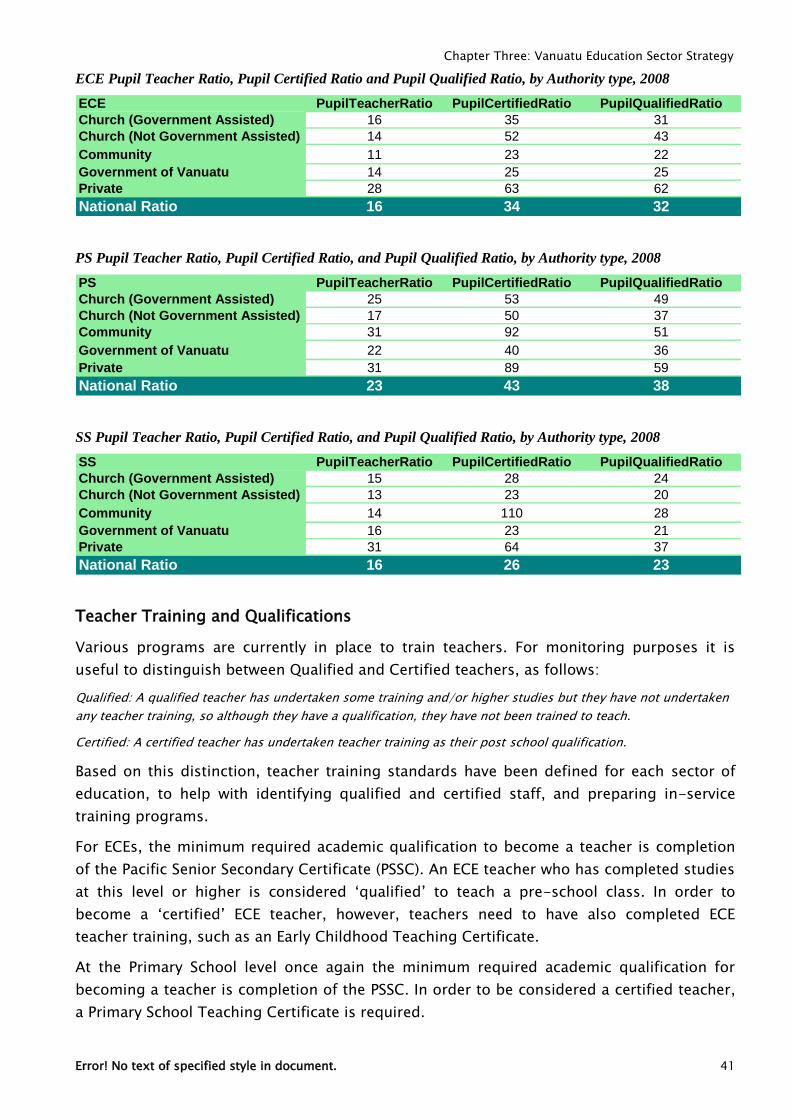
Chapter Three: Vanuatu Education Sector Strategy
Error! No text of specified style in document. 41
ECE Pupil Teacher Ratio, Pupil Certified Ratio and Pupil Qualified Ratio, by Authority type, 2008
ECE PupilTeacherRatio PupilCertifiedRatio PupilQualifiedRatio
Church (Government Assisted) 16 35 31
Church (Not Government Assisted) 14 52 43
Community 11 23 22
Government of Vanuatu 14 25 25
Private 28 63 62
National Ratio 16 34 32
PS Pupil Teacher Ratio, Pupil Certified Ratio, and Pupil Qualified Ratio, by Authority type, 2008
PS PupilTeacherRatio PupilCertifiedRatio PupilQualifiedRatio
Church (Government Assisted) 25 53 49
Church (Not Government Assisted) 17 50 37
Community 31 92 51
Government of Vanuatu 22 40 36
Private 31 89 59
National Ratio 23 43 38
SS Pupil Teacher Ratio, Pupil Certified Ratio, and Pupil Qualified Ratio, by Authority type, 2008
SS PupilTeacherRatio PupilCertifiedRatio PupilQualifiedRatio
Church (Government Assisted) 15 28 24
Church (Not Government Assisted) 13 23 20
Community 14 110 28
Government of Vanuatu 16 23 21
Private 31 64 37
National Ratio 16 26 23
Teacher Training and Qualifications
Various programs are currently in place to train teachers. For monitoring purposes it is
useful to distinguish between Qualified and Certified teachers, as follows:
Qualified: A qualified teacher has undertaken some training and/or higher studies but they have not undertaken
any teacher training, so although they have a qualification, they have not been trained to teach.
Certified: A certified teacher has undertaken teacher training as their post school qualification.
Based on this distinction, teacher training standards have been defined for each sector of
education, to help with identifying qualified and certified staff, and preparing in-service
training programs.
For ECEs, the minimum required academic qualification to become a teacher is completion
of the Pacific Senior Secondary Certificate (PSSC). An ECE teacher who has completed studies
at this level or higher is considered „qualified‟ to teach a pre-school class. In order to
become a „certified‟ ECE teacher, however, teachers need to have also completed ECE
teacher training, such as an Early Childhood Teaching Certificate.
At the Primary School level once again the minimum required academic qualification for
becoming a teacher is completion of the PSSC. In order to be considered a certified teacher,
a Primary School Teaching Certificate is required.
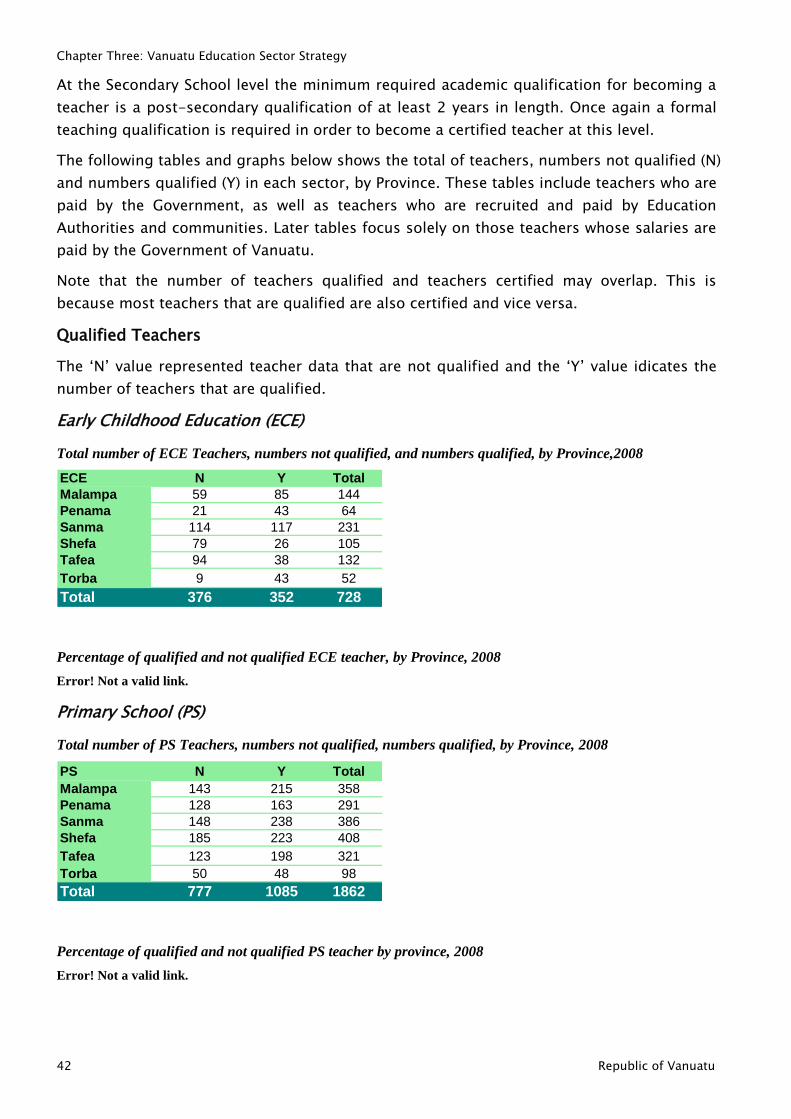
Chapter Three: Vanuatu Education Sector Strategy
42 Republic of Vanuatu
At the Secondary School level the minimum required academic qualification for becoming a
teacher is a post-secondary qualification of at least 2 years in length. Once again a formal
teaching qualification is required in order to become a certified teacher at this level.
The following tables and graphs below shows the total of teachers, numbers not qualified (N)
and numbers qualified (Y) in each sector, by Province. These tables include teachers who are
paid by the Government, as well as teachers who are recruited and paid by Education
Authorities and communities. Later tables focus solely on those teachers whose salaries are
paid by the Government of Vanuatu.
Note that the number of teachers qualified and teachers certified may overlap. This is
because most teachers that are qualified are also certified and vice versa.
Qualified Teachers
The „N‟ value represented teacher data that are not qualified and the „Y‟ value idicates the
number of teachers that are qualified.
Early Childhood Education (ECE)
Total number of ECE Teachers, numbers not qualified, and numbers qualified, by Province,2008
ECE N Y Total
Malampa 59 85 144
Penama 21 43 64
Sanma 114 117 231
Shefa 79 26 105
Tafea 94 38 132
Torba 9 43 52
Total 376 352 728
Percentage of qualified and not qualified ECE teacher, by Province, 2008
Error! Not a valid link.
Primary School (PS)
Total number of PS Teachers, numbers not qualified, numbers qualified, by Province, 2008
PS N Y Total
Malampa 143 215 358
Penama 128 163 291
Sanma 148 238 386
Shefa 185 223 408
Tafea 123 198 321
Torba 50 48 98
Total 777 1085 1862
Percentage of qualified and not qualified PS teacher by province, 2008
Error! Not a valid link.
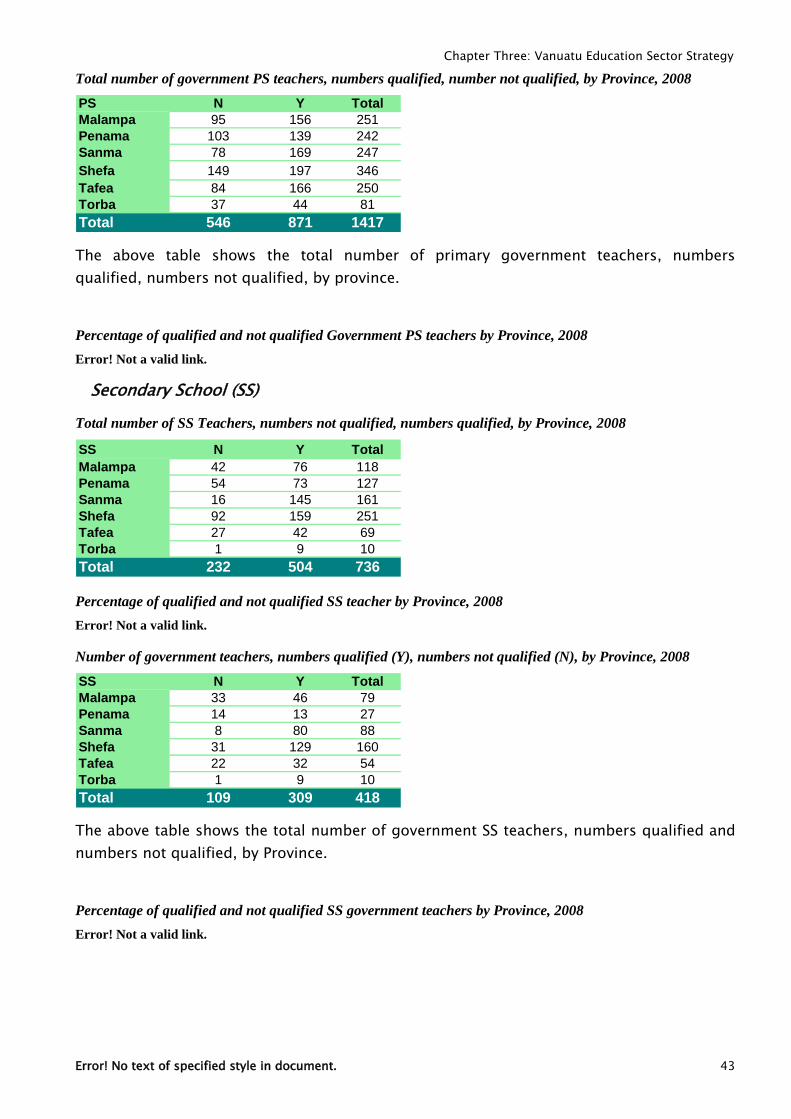
Chapter Three: Vanuatu Education Sector Strategy
Error! No text of specified style in document. 43
Total number of government PS teachers, numbers qualified, number not qualified, by Province, 2008
PS N Y Total
Malampa 95 156 251
Penama 103 139 242
Sanma 78 169 247
Shefa 149 197 346
Tafea 84 166 250
Torba 37 44 81
Total 546 871 1417
The above table shows the total number of primary government teachers, numbers
qualified, numbers not qualified, by province.
Percentage of qualified and not qualified Government PS teachers by Province, 2008
Error! Not a valid link.
Secondary School (SS)
Total number of SS Teachers, numbers not qualified, numbers qualified, by Province, 2008
SS N Y Total
Malampa 42 76 118
Penama 54 73 127
Sanma 16 145 161
Shefa 92 159 251
Tafea 27 42 69
Torba 1 9 10
Total 232 504 736
Percentage of qualified and not qualified SS teacher by Province, 2008
Error! Not a valid link.
Number of government teachers, numbers qualified (Y), numbers not qualified (N), by Province, 2008
SS N Y Total
Malampa 33 46 79
Penama 14 13 27
Sanma 8 80 88
Shefa 31 129 160
Tafea 22 32 54
Torba 1 9 10
Total 109 309 418
The above table shows the total number of government SS teachers, numbers qualified and
numbers not qualified, by Province.
Percentage of qualified and not qualified SS government teachers by Province, 2008
Error! Not a valid link.
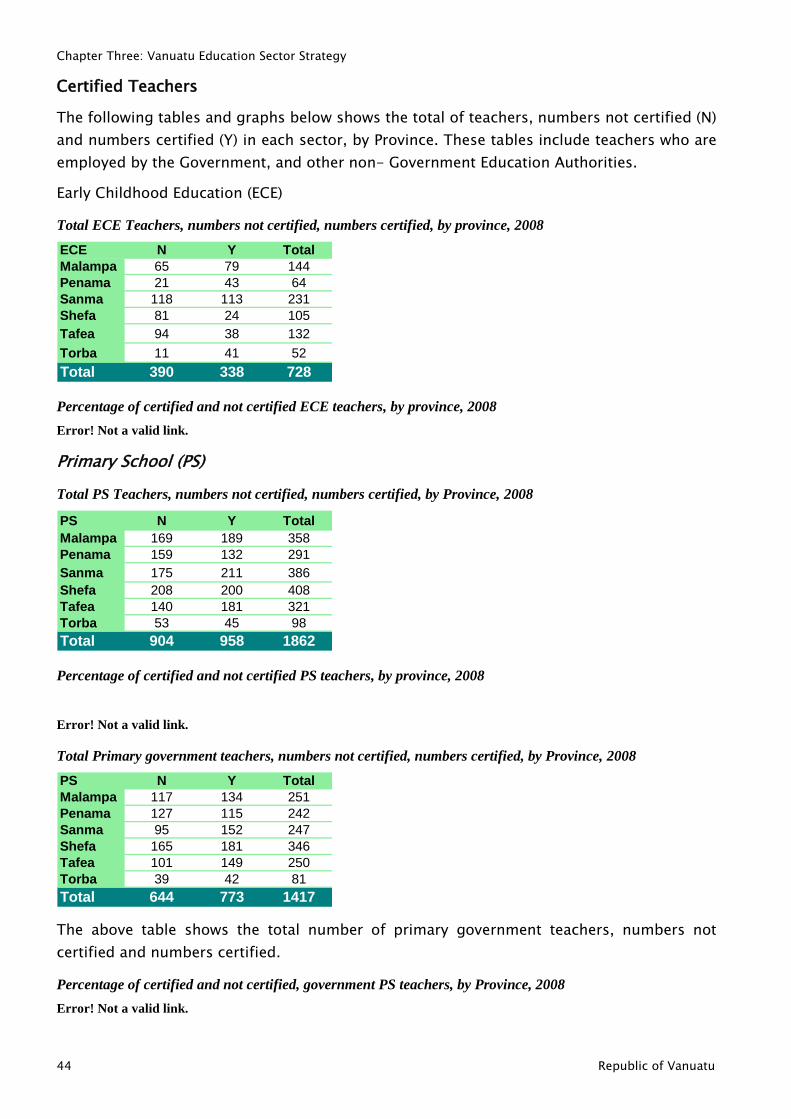
Chapter Three: Vanuatu Education Sector Strategy
44 Republic of Vanuatu
Certified Teachers
The following tables and graphs below shows the total of teachers, numbers not certified (N)
and numbers certified (Y) in each sector, by Province. These tables include teachers who are
employed by the Government, and other non- Government Education Authorities.
Early Childhood Education (ECE)
Total ECE Teachers, numbers not certified, numbers certified, by province, 2008
ECE N Y Total
Malampa 65 79 144
Penama 21 43 64
Sanma 118 113 231
Shefa 81 24 105
Tafea 94 38 132
Torba 11 41 52
Total 390 338 728
Percentage of certified and not certified ECE teachers, by province, 2008
Error! Not a valid link.
Primary School (PS)
Total PS Teachers, numbers not certified, numbers certified, by Province, 2008
PS N Y Total
Malampa 169 189 358
Penama 159 132 291
Sanma 175 211 386
Shefa 208 200 408
Tafea 140 181 321
Torba 53 45 98
Total 904 958 1862
Percentage of certified and not certified PS teachers, by province, 2008
Error! Not a valid link.
Total Primary government teachers, numbers not certified, numbers certified, by Province, 2008
PS N Y Total
Malampa 117 134 251
Penama 127 115 242
Sanma 95 152 247
Shefa 165 181 346
Tafea 101 149 250
Torba 39 42 81
Total 644 773 1417
The above table shows the total number of primary government teachers, numbers not
certified and numbers certified.
Percentage of certified and not certified, government PS teachers, by Province, 2008
Error! Not a valid link.
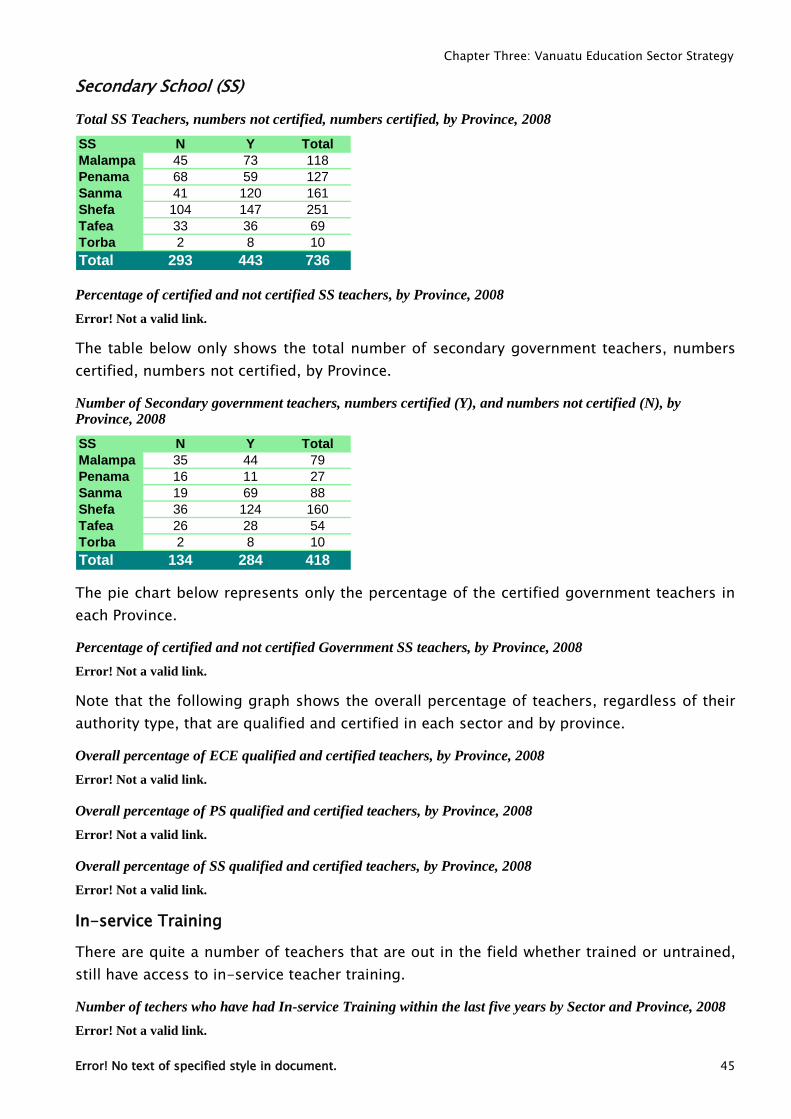
Chapter Three: Vanuatu Education Sector Strategy
Error! No text of specified style in document. 45
Secondary School (SS)
Total SS Teachers, numbers not certified, numbers certified, by Province, 2008
SS N Y Total
Malampa 45 73 118
Penama 68 59 127
Sanma 41 120 161
Shefa 104 147 251
Tafea 33 36 69
Torba 2 8 10
Total 293 443 736
Percentage of certified and not certified SS teachers, by Province, 2008
Error! Not a valid link.
The table below only shows the total number of secondary government teachers, numbers
certified, numbers not certified, by Province.
Number of Secondary government teachers, numbers certified (Y), and numbers not certified (N), by Province, 2008
SS N Y Total
Malampa 35 44 79
Penama 16 11 27
Sanma 19 69 88
Shefa 36 124 160
Tafea 26 28 54
Torba 2 8 10
Total 134 284 418
The pie chart below represents only the percentage of the certified government teachers in
each Province.
Percentage of certified and not certified Government SS teachers, by Province, 2008
Error! Not a valid link.
Note that the following graph shows the overall percentage of teachers, regardless of their
authority type, that are qualified and certified in each sector and by province.
Overall percentage of ECE qualified and certified teachers, by Province, 2008
Error! Not a valid link.
Overall percentage of PS qualified and certified teachers, by Province, 2008
Error! Not a valid link.
Overall percentage of SS qualified and certified teachers, by Province, 2008
Error! Not a valid link.
In-service Training
There are quite a number of teachers that are out in the field whether trained or untrained,
still have access to in-service teacher training.
Number of techers who have had In-service Training within the last five years by Sector and Province, 2008
Error! Not a valid link.
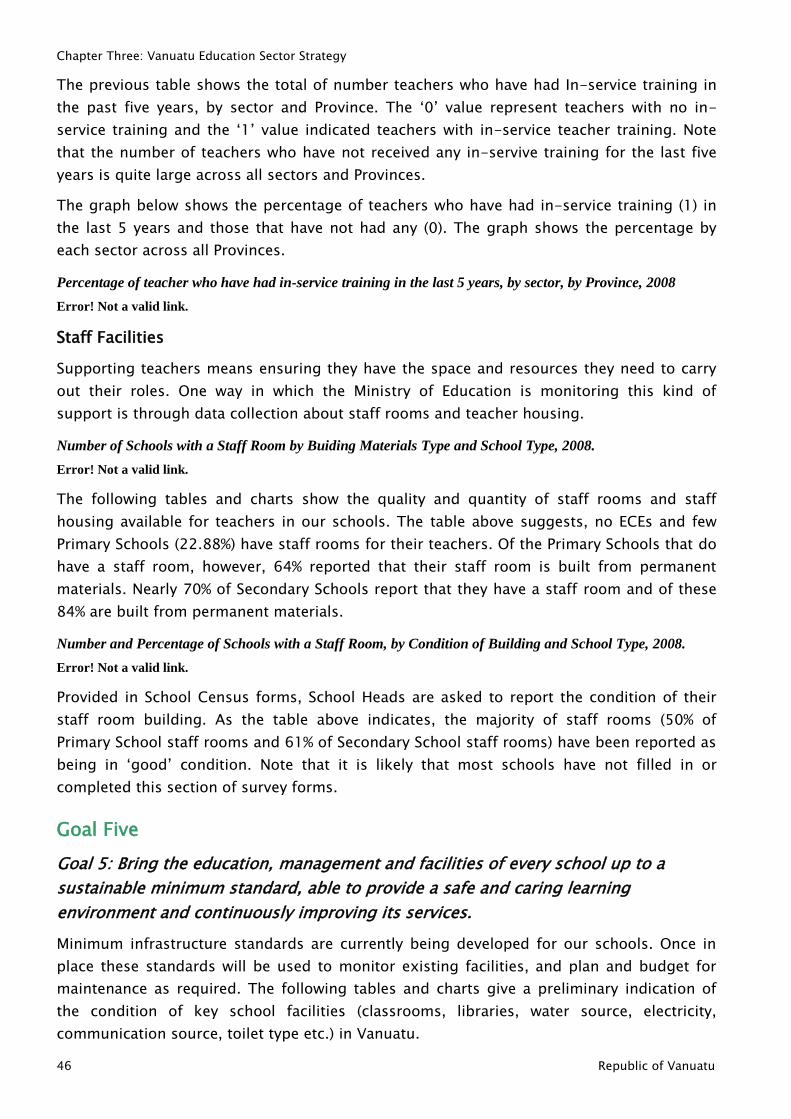
Chapter Three: Vanuatu Education Sector Strategy
46 Republic of Vanuatu
The previous table shows the total of number teachers who have had In-service training in
the past five years, by sector and Province. The „0‟ value represent teachers with no in-
service training and the „1‟ value indicated teachers with in-service teacher training. Note
that the number of teachers who have not received any in-servive training for the last five
years is quite large across all sectors and Provinces.
The graph below shows the percentage of teachers who have had in-service training (1) in
the last 5 years and those that have not had any (0). The graph shows the percentage by
each sector across all Provinces.
Percentage of teacher who have had in-service training in the last 5 years, by sector, by Province, 2008
Error! Not a valid link.
Staff Facilities
Supporting teachers means ensuring they have the space and resources they need to carry
out their roles. One way in which the Ministry of Education is monitoring this kind of
support is through data collection about staff rooms and teacher housing.
Number of Schools with a Staff Room by Buiding Materials Type and School Type, 2008.
Error! Not a valid link.
The following tables and charts show the quality and quantity of staff rooms and staff
housing available for teachers in our schools. The table above suggests, no ECEs and few
Primary Schools (22.88%) have staff rooms for their teachers. Of the Primary Schools that do
have a staff room, however, 64% reported that their staff room is built from permanent
materials. Nearly 70% of Secondary Schools report that they have a staff room and of these
84% are built from permanent materials.
Number and Percentage of Schools with a Staff Room, by Condition of Building and School Type, 2008.
Error! Not a valid link.
Provided in School Census forms, School Heads are asked to report the condition of their
staff room building. As the table above indicates, the majority of staff rooms (50% of
Primary School staff rooms and 61% of Secondary School staff rooms) have been reported as
being in „good‟ condition. Note that it is likely that most schools have not filled in or
completed this section of survey forms.
Goal Five
Goal 5: Bring the education, management and facilities of every school up to a
sustainable minimum standard, able to provide a safe and caring learning
environment and continuously improving its services.
Minimum infrastructure standards are currently being developed for our schools. Once in
place these standards will be used to monitor existing facilities, and plan and budget for
maintenance as required. The following tables and charts give a preliminary indication of
the condition of key school facilities (classrooms, libraries, water source, electricity,
communication source, toilet type etc.) in Vanuatu.
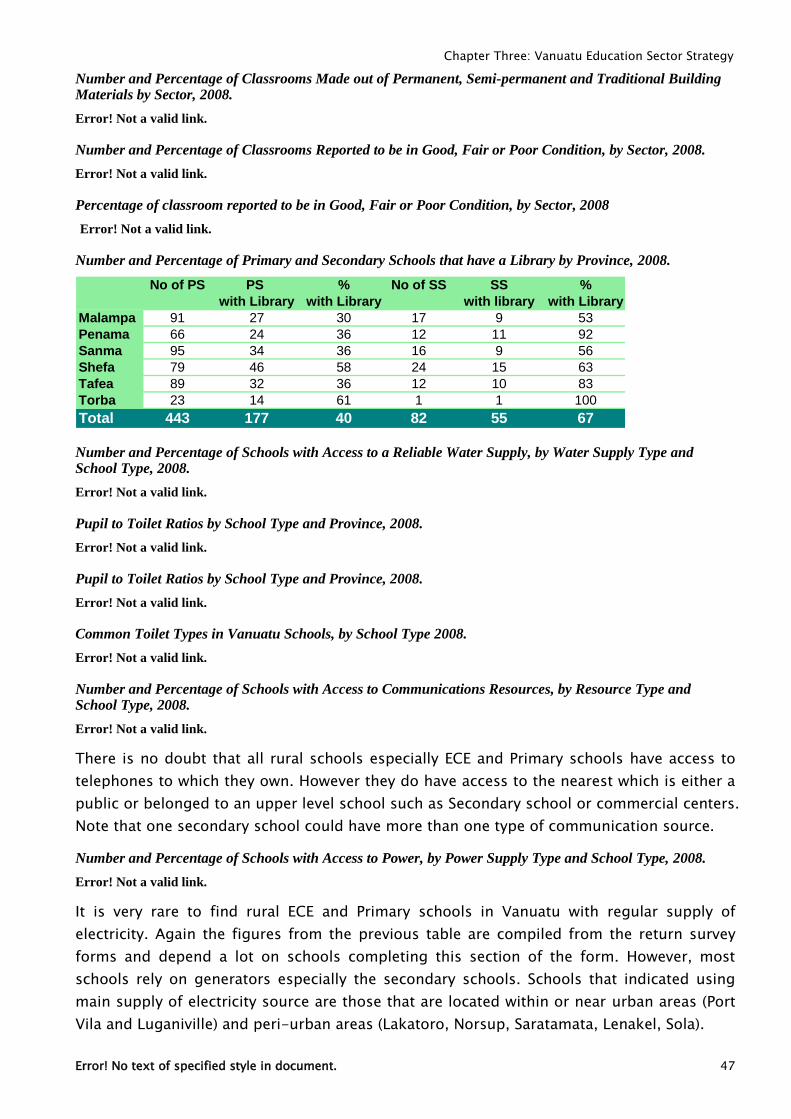
Chapter Three: Vanuatu Education Sector Strategy
Error! No text of specified style in document. 47
Number and Percentage of Classrooms Made out of Permanent, Semi-permanent and Traditional Building Materials by Sector, 2008.
Error! Not a valid link.
Number and Percentage of Classrooms Reported to be in Good, Fair or Poor Condition, by Sector, 2008.
Error! Not a valid link.
Percentage of classroom reported to be in Good, Fair or Poor Condition, by Sector, 2008
Error! Not a valid link.
Number and Percentage of Primary and Secondary Schools that have a Library by Province, 2008.
No of PS PS % No of SS SS %
with Library with Library with library with Library
Malampa 91 27 30 17 9 53
Penama 66 24 36 12 11 92
Sanma 95 34 36 16 9 56
Shefa 79 46 58 24 15 63
Tafea 89 32 36 12 10 83
Torba 23 14 61 1 1 100
Total 443 177 40 82 55 67
Number and Percentage of Schools with Access to a Reliable Water Supply, by Water Supply Type and School Type, 2008.
Error! Not a valid link.
Pupil to Toilet Ratios by School Type and Province, 2008.
Error! Not a valid link.
Pupil to Toilet Ratios by School Type and Province, 2008.
Error! Not a valid link.
Common Toilet Types in Vanuatu Schools, by School Type 2008.
Error! Not a valid link.
Number and Percentage of Schools with Access to Communications Resources, by Resource Type and School Type, 2008.
Error! Not a valid link.
There is no doubt that all rural schools especially ECE and Primary schools have access to
telephones to which they own. However they do have access to the nearest which is either a
public or belonged to an upper level school such as Secondary school or commercial centers.
Note that one secondary school could have more than one type of communication source.
Number and Percentage of Schools with Access to Power, by Power Supply Type and School Type, 2008.
Error! Not a valid link.
It is very rare to find rural ECE and Primary schools in Vanuatu with regular supply of
electricity. Again the figures from the previous table are compiled from the return survey
forms and depend a lot on schools completing this section of the form. However, most
schools rely on generators especially the secondary schools. Schools that indicated using
main supply of electricity source are those that are located within or near urban areas (Port
Vila and Luganiville) and peri-urban areas (Lakatoro, Norsup, Saratamata, Lenakel, Sola).
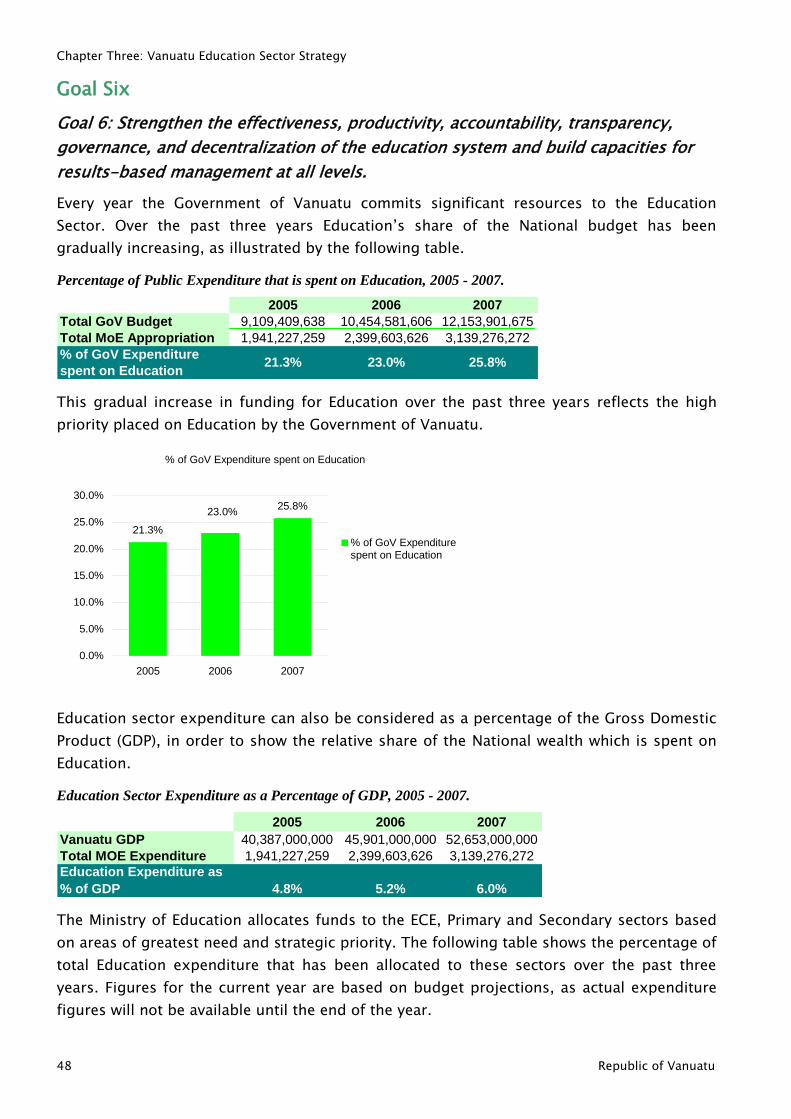
Chapter Three: Vanuatu Education Sector Strategy
48 Republic of Vanuatu
Goal Six
Goal 6: Strengthen the effectiveness, productivity, accountability, transparency,
governance, and decentralization of the education system and build capacities for
results-based management at all levels.
Every year the Government of Vanuatu commits significant resources to the Education
Sector. Over the past three years Education‟s share of the National budget has been
gradually increasing, as illustrated by the following table.
Percentage of Public Expenditure that is spent on Education, 2005 - 2007.
2005 2006 2007
Total GoV Budget 9,109,409,638 10,454,581,606 12,153,901,675
Total MoE Appropriation 1,941,227,259 2,399,603,626 3,139,276,272
% of GoV Expenditure
spent on Education21.3% 23.0% 25.8%
This gradual increase in funding for Education over the past three years reflects the high
priority placed on Education by the Government of Vanuatu.
% of GoV Expenditure spent on Education
21.3%
25.8%23.0%
0.0%
5.0%
10.0%
15.0%
20.0%
25.0%
30.0%
2005 2006 2007
% of GoV Expenditurespent on Education
Education sector expenditure can also be considered as a percentage of the Gross Domestic
Product (GDP), in order to show the relative share of the National wealth which is spent on
Education.
Education Sector Expenditure as a Percentage of GDP, 2005 - 2007.
2005 2006 2007
Vanuatu GDP 40,387,000,000 45,901,000,000 52,653,000,000
Total MOE Expenditure 1,941,227,259 2,399,603,626 3,139,276,272
Education Expenditure as
% of GDP 4.8% 5.2% 6.0%
The Ministry of Education allocates funds to the ECE, Primary and Secondary sectors based
on areas of greatest need and strategic priority. The following table shows the percentage of
total Education expenditure that has been allocated to these sectors over the past three
years. Figures for the current year are based on budget projections, as actual expenditure
figures will not be available until the end of the year.
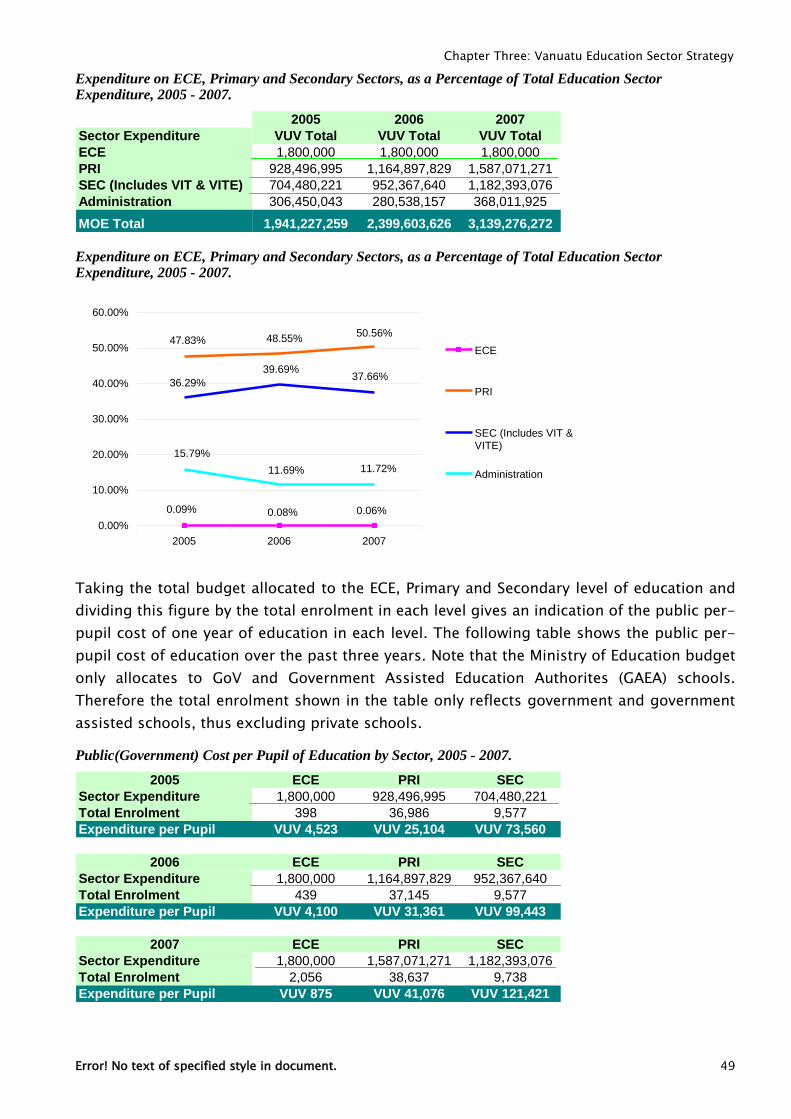
Chapter Three: Vanuatu Education Sector Strategy
Error! No text of specified style in document. 49
Expenditure on ECE, Primary and Secondary Sectors, as a Percentage of Total Education Sector Expenditure, 2005 - 2007.
2005 2006 2007
Sector Expenditure VUV Total VUV Total VUV Total
ECE 1,800,000 1,800,000 1,800,000
PRI 928,496,995 1,164,897,829 1,587,071,271
SEC (Includes VIT & VITE) 704,480,221 952,367,640 1,182,393,076
Administration 306,450,043 280,538,157 368,011,925
MOE Total 1,941,227,259 2,399,603,626 3,139,276,272
Expenditure on ECE, Primary and Secondary Sectors, as a Percentage of Total Education Sector Expenditure, 2005 - 2007.
0.08%0.09% 0.06%
47.83% 48.55%50.56%
36.29%
39.69%37.66%
15.79%
11.69% 11.72%
0.00%
10.00%
20.00%
30.00%
40.00%
50.00%
60.00%
2005 2006 2007
ECE
PRI
SEC (Includes VIT &VITE)
Administration
Taking the total budget allocated to the ECE, Primary and Secondary level of education and
dividing this figure by the total enrolment in each level gives an indication of the public per-
pupil cost of one year of education in each level. The following table shows the public per-
pupil cost of education over the past three years. Note that the Ministry of Education budget
only allocates to GoV and Government Assisted Education Authorites (GAEA) schools.
Therefore the total enrolment shown in the table only reflects government and government
assisted schools, thus excluding private schools.
Public(Government) Cost per Pupil of Education by Sector, 2005 - 2007.
2005 ECE PRI SEC
Sector Expenditure 1,800,000 928,496,995 704,480,221
Total Enrolment 398 36,986 9,577
Expenditure per Pupil VUV 4,523 VUV 25,104 VUV 73,560
2006 ECE PRI SEC
Sector Expenditure 1,800,000 1,164,897,829 952,367,640
Total Enrolment 439 37,145 9,577
Expenditure per Pupil VUV 4,100 VUV 31,361 VUV 99,443
2007 ECE PRI SEC
Sector Expenditure 1,800,000 1,587,071,271 1,182,393,076
Total Enrolment 2,056 38,637 9,738
Expenditure per Pupil VUV 875 VUV 41,076 VUV 121,421
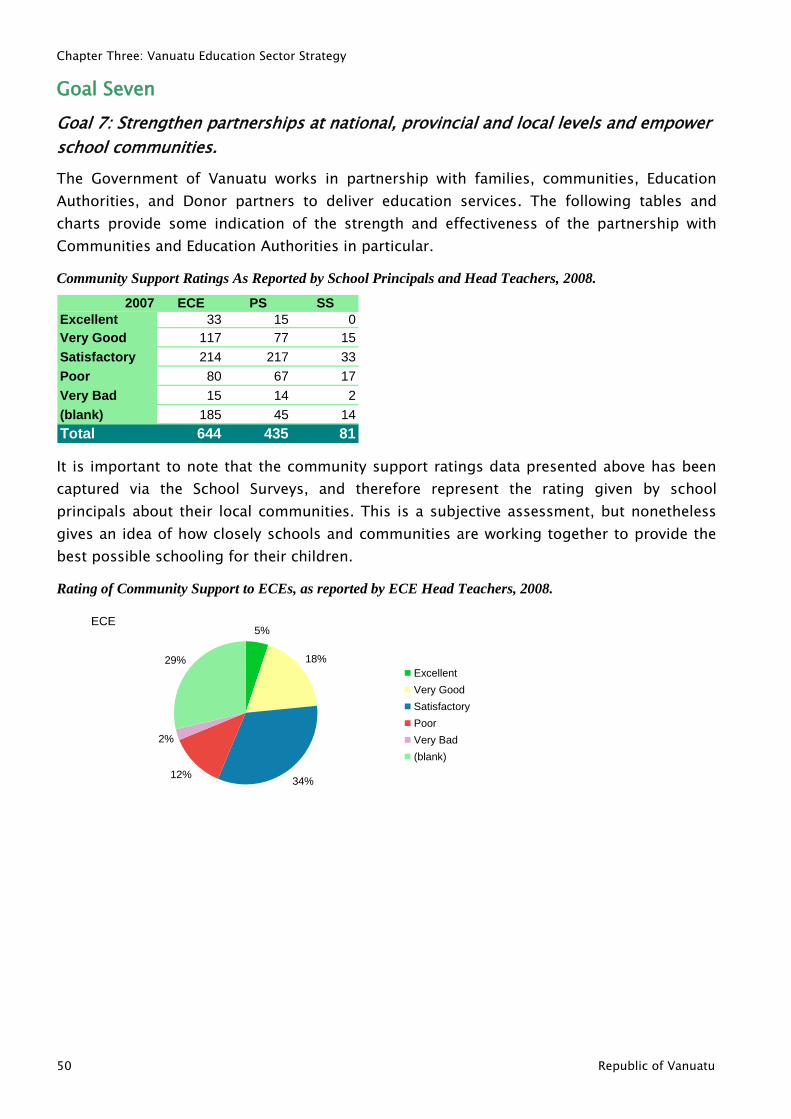
Chapter Three: Vanuatu Education Sector Strategy
50 Republic of Vanuatu
Goal Seven
Goal 7: Strengthen partnerships at national, provincial and local levels and empower
school communities.
The Government of Vanuatu works in partnership with families, communities, Education
Authorities, and Donor partners to deliver education services. The following tables and
charts provide some indication of the strength and effectiveness of the partnership with
Communities and Education Authorities in particular.
Community Support Ratings As Reported by School Principals and Head Teachers, 2008.
2007 ECE PS SS
Excellent 33 15 0
Very Good 117 77 15
Satisfactory 214 217 33
Poor 80 67 17
Very Bad 15 14 2
(blank) 185 45 14
Total 644 435 81
It is important to note that the community support ratings data presented above has been
captured via the School Surveys, and therefore represent the rating given by school
principals about their local communities. This is a subjective assessment, but nonetheless
gives an idea of how closely schools and communities are working together to provide the
best possible schooling for their children.
Rating of Community Support to ECEs, as reported by ECE Head Teachers, 2008.
ECE5%
18%
34%12%
2%
29%
Excellent
Very Good
Satisfactory
Poor
Very Bad
(blank)
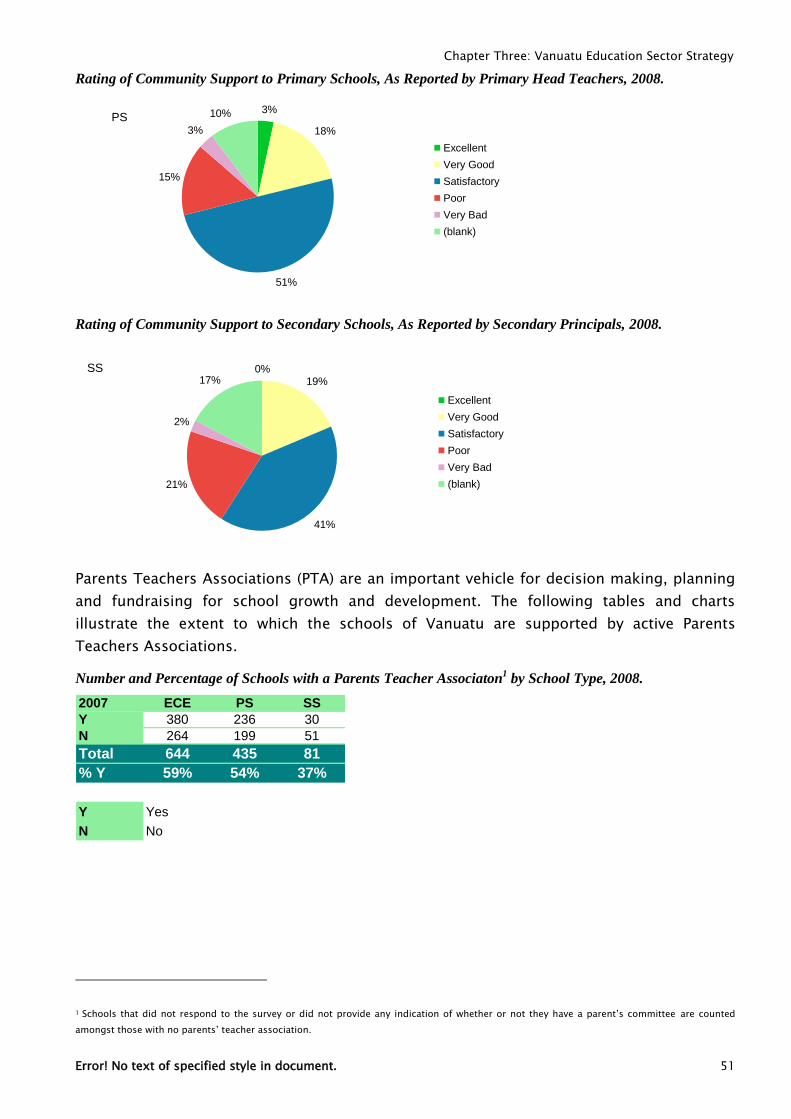
Chapter Three: Vanuatu Education Sector Strategy
Error! No text of specified style in document. 51
Rating of Community Support to Primary Schools, As Reported by Primary Head Teachers, 2008.
PS3%
18%
51%
15%
3%
10%
Excellent
Very Good
Satisfactory
Poor
Very Bad
(blank)
Rating of Community Support to Secondary Schools, As Reported by Secondary Principals, 2008.
SS 0%19%
41%
21%
2%
17%
Excellent
Very Good
Satisfactory
Poor
Very Bad
(blank)
Parents Teachers Associations (PTA) are an important vehicle for decision making, planning
and fundraising for school growth and development. The following tables and charts
illustrate the extent to which the schools of Vanuatu are supported by active Parents
Teachers Associations.
Number and Percentage of Schools with a Parents Teacher Associaton1 by School Type, 2008.
2007 ECE PS SS
Y 380 236 30
N 264 199 51
Total 644 435 81
% Y 59% 54% 37%
Y Yes
N No
1 Schools that did not respond to the survey or did not provide any indication of whether or not they have a parent‟s committee are counted
amongst those with no parents‟ teacher association.
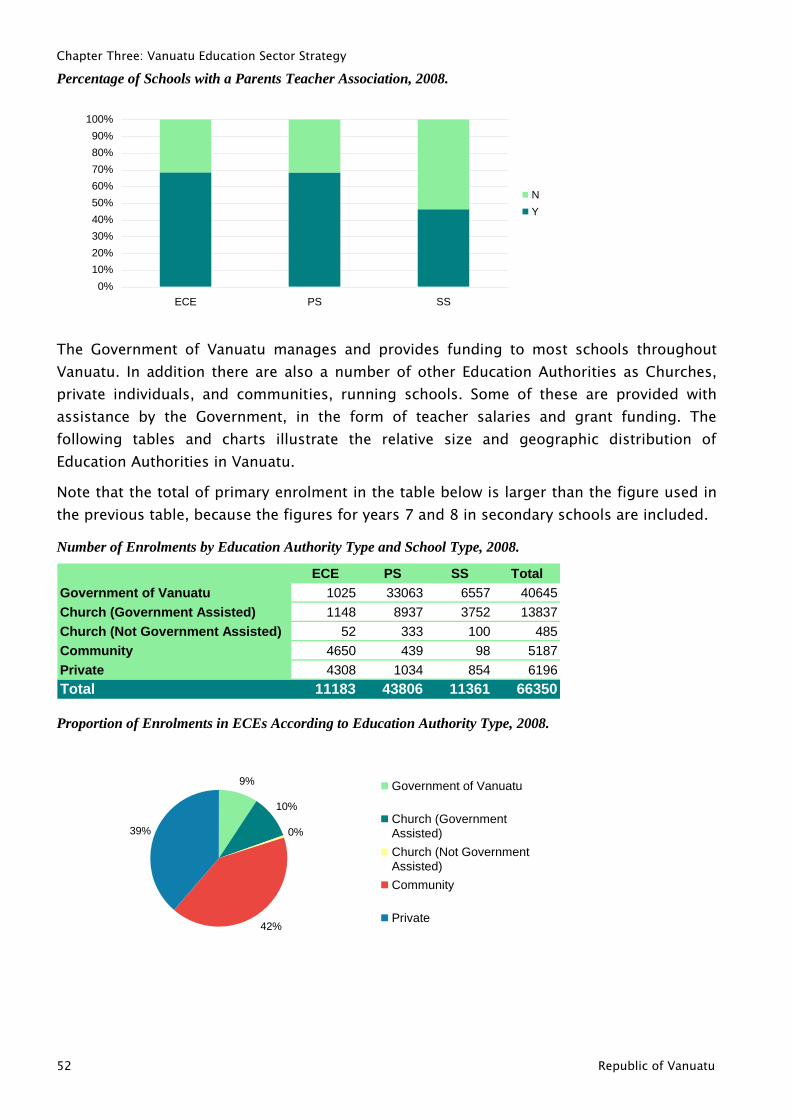
Chapter Three: Vanuatu Education Sector Strategy
52 Republic of Vanuatu
Percentage of Schools with a Parents Teacher Association, 2008.
0%
10%
20%
30%
40%
50%
60%
70%
80%
90%
100%
ECE PS SS
N
Y
The Government of Vanuatu manages and provides funding to most schools throughout
Vanuatu. In addition there are also a number of other Education Authorities as Churches,
private individuals, and communities, running schools. Some of these are provided with
assistance by the Government, in the form of teacher salaries and grant funding. The
following tables and charts illustrate the relative size and geographic distribution of
Education Authorities in Vanuatu.
Note that the total of primary enrolment in the table below is larger than the figure used in
the previous table, because the figures for years 7 and 8 in secondary schools are included.
Number of Enrolments by Education Authority Type and School Type, 2008.
ECE PS SS Total
Government of Vanuatu 1025 33063 6557 40645
Church (Government Assisted) 1148 8937 3752 13837
Church (Not Government Assisted) 52 333 100 485
Community 4650 439 98 5187
Private 4308 1034 854 6196
Total 11183 43806 11361 66350
Proportion of Enrolments in ECEs According to Education Authority Type, 2008.
9%
10%
0%
42%
39%
Government of Vanuatu
Church (GovernmentAssisted)
Church (Not GovernmentAssisted)
Community
Private
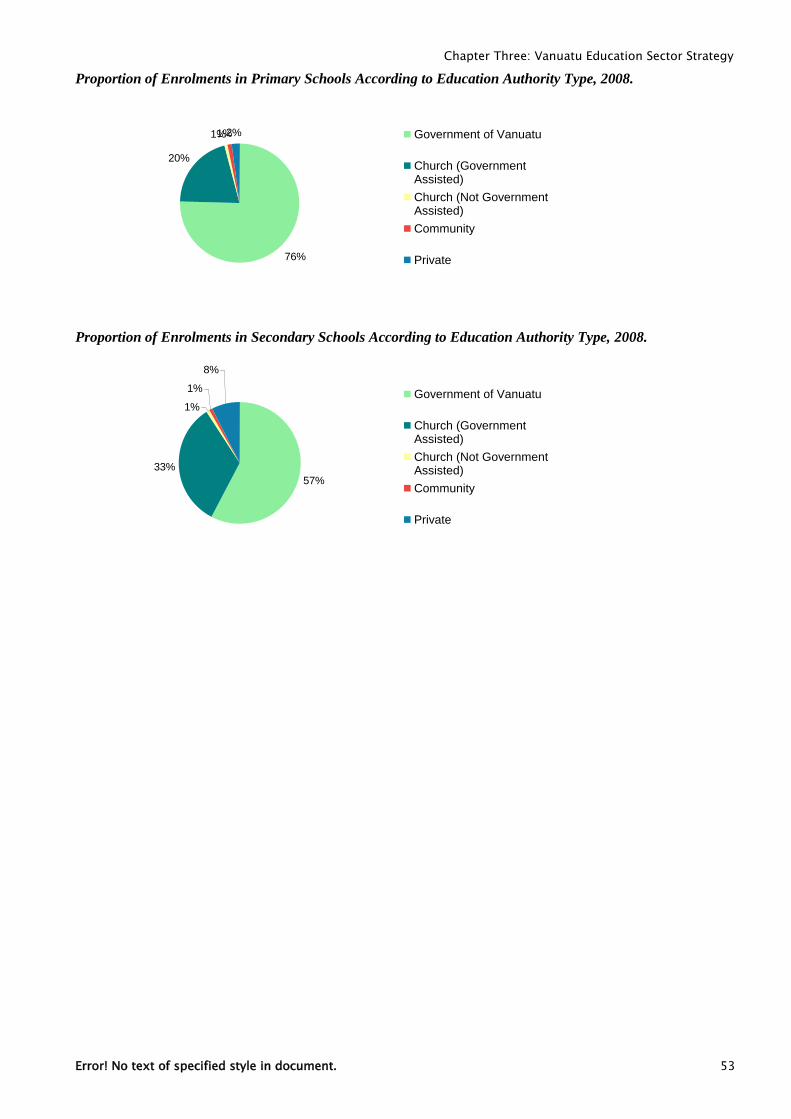
Chapter Three: Vanuatu Education Sector Strategy
Error! No text of specified style in document. 53
Proportion of Enrolments in Primary Schools According to Education Authority Type, 2008.
76%
20%
1%1%2% Government of Vanuatu
Church (GovernmentAssisted)
Church (Not GovernmentAssisted)
Community
Private
Proportion of Enrolments in Secondary Schools According to Education Authority Type, 2008.
57%
33%
1%
1%
8%
Government of Vanuatu
Church (GovernmentAssisted)
Church (Not GovernmentAssisted)
Community
Private
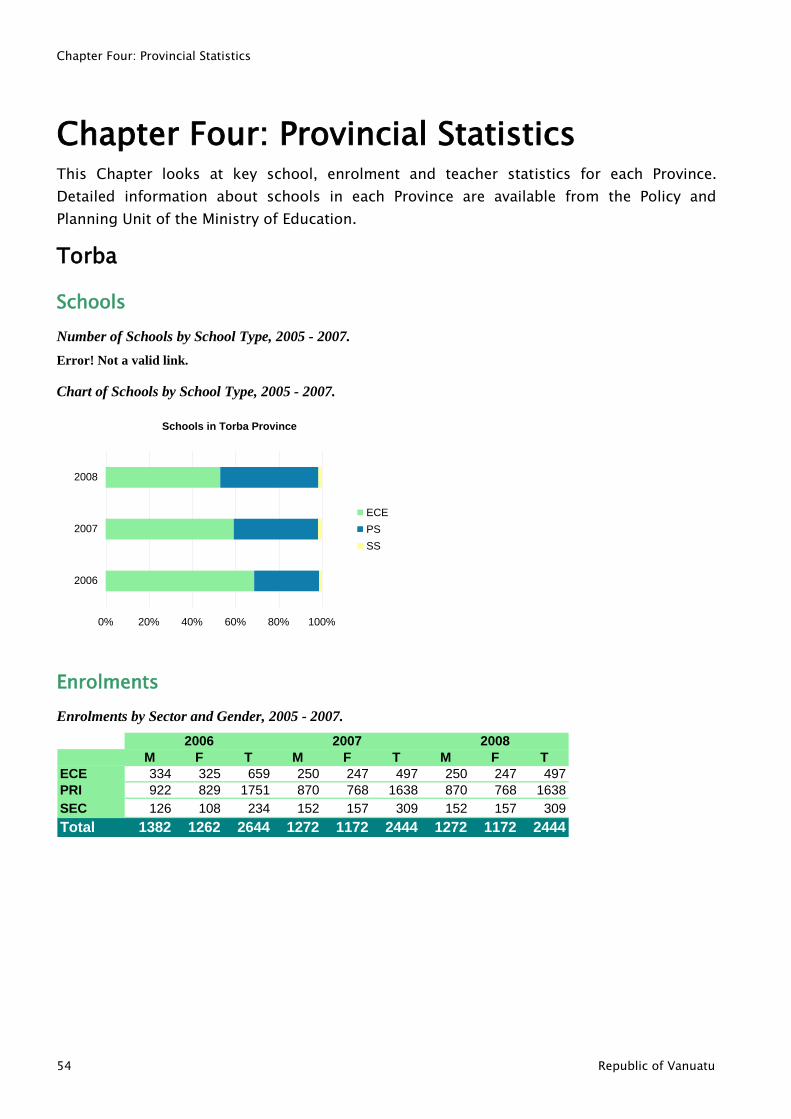
Chapter Four: Provincial Statistics
54 Republic of Vanuatu
Chapter Four: Provincial Statistics This Chapter looks at key school, enrolment and teacher statistics for each Province.
Detailed information about schools in each Province are available from the Policy and
Planning Unit of the Ministry of Education.
Torba
Schools
Number of Schools by School Type, 2005 - 2007.
Error! Not a valid link.
Chart of Schools by School Type, 2005 - 2007.
Schools in Torba Province
0% 20% 40% 60% 80% 100%
2006
2007
2008
ECE
PS
SS
Enrolments
Enrolments by Sector and Gender, 2005 - 2007.
2006 2007 2008
M F T M F T M F T
ECE 334 325 659 250 247 497 250 247 497
PRI 922 829 1751 870 768 1638 870 768 1638
SEC 126 108 234 152 157 309 152 157 309
Total 1382 1262 2644 1272 1172 2444 1272 1172 2444
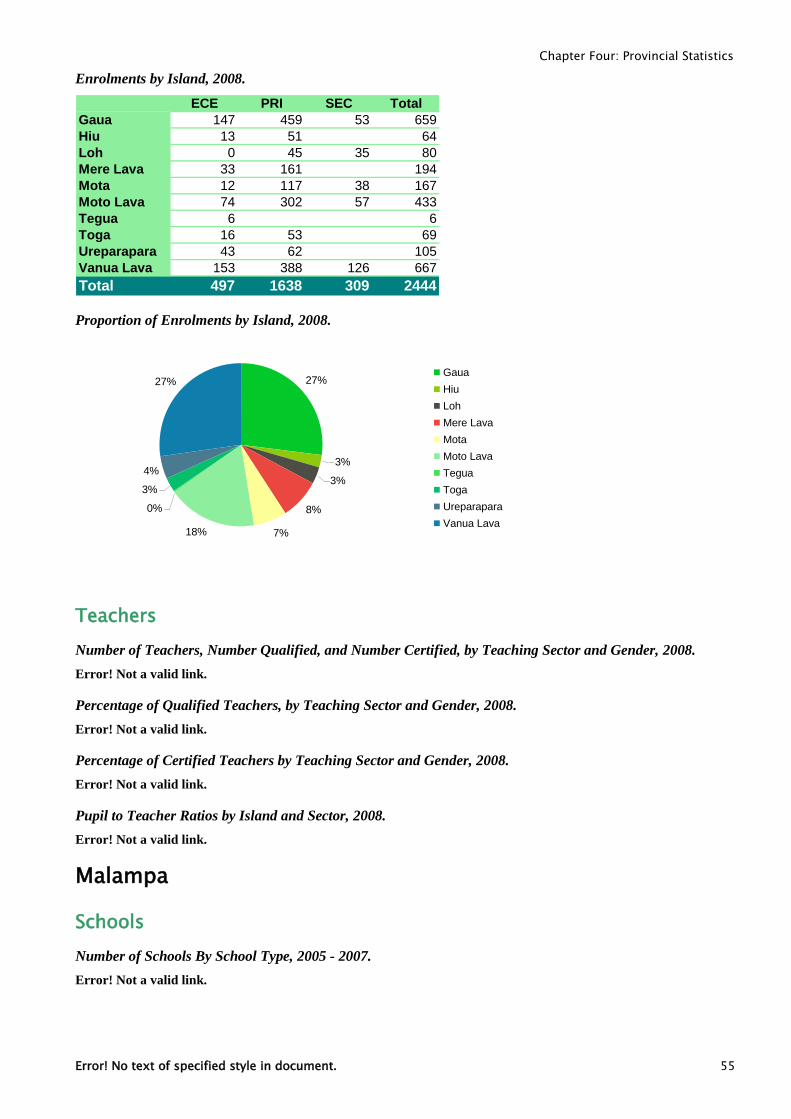
Chapter Four: Provincial Statistics
Error! No text of specified style in document. 55
Enrolments by Island, 2008.
ECE PRI SEC Total
Gaua 147 459 53 659
Hiu 13 51 64
Loh 0 45 35 80
Mere Lava 33 161 194
Mota 12 117 38 167
Moto Lava 74 302 57 433
Tegua 6 6
Toga 16 53 69
Ureparapara 43 62 105
Vanua Lava 153 388 126 667
Total 497 1638 309 2444
Proportion of Enrolments by Island, 2008.
27%
3%
3%
8%
7%18%
0%
3%
4%
27%Gaua
Hiu
Loh
Mere Lava
Mota
Moto Lava
Tegua
Toga
Ureparapara
Vanua Lava
Teachers
Number of Teachers, Number Qualified, and Number Certified, by Teaching Sector and Gender, 2008.
Error! Not a valid link.
Percentage of Qualified Teachers, by Teaching Sector and Gender, 2008.
Error! Not a valid link.
Percentage of Certified Teachers by Teaching Sector and Gender, 2008.
Error! Not a valid link.
Pupil to Teacher Ratios by Island and Sector, 2008.
Error! Not a valid link.
Malampa
Schools
Number of Schools By School Type, 2005 - 2007.
Error! Not a valid link.
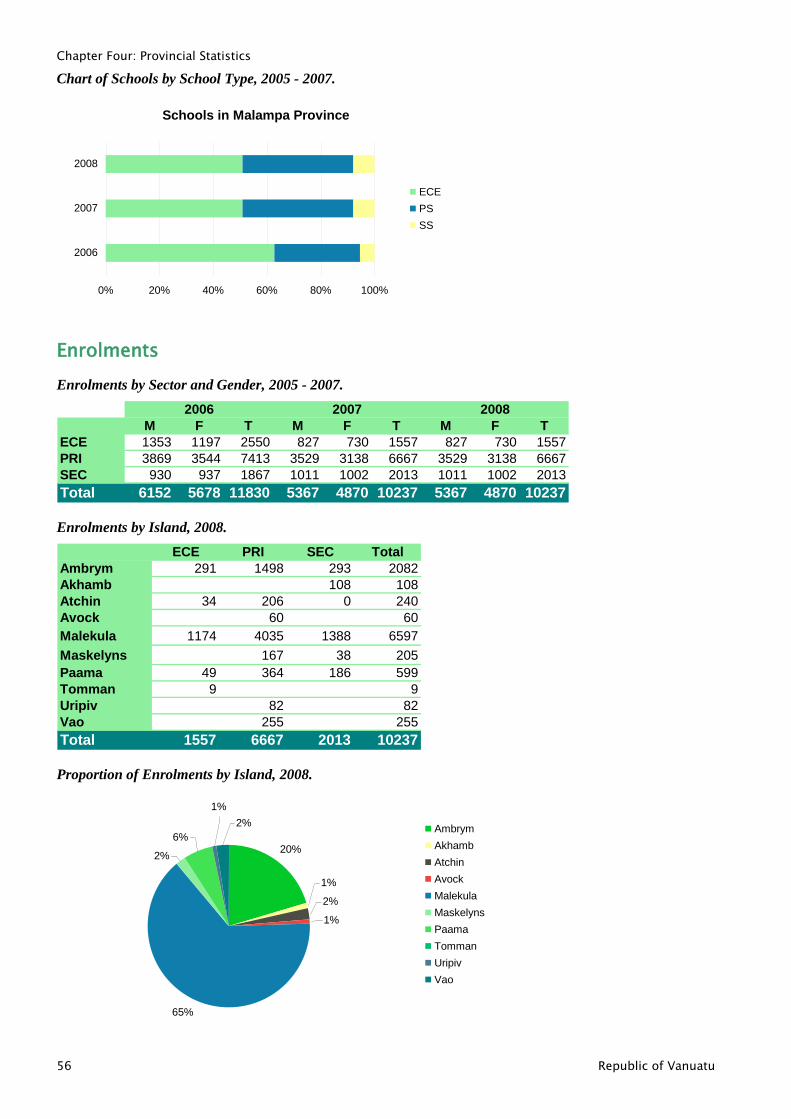
Chapter Four: Provincial Statistics
56 Republic of Vanuatu
Chart of Schools by School Type, 2005 - 2007.
Schools in Malampa Province
0% 20% 40% 60% 80% 100%
2006
2007
2008
ECE
PS
SS
Enrolments
Enrolments by Sector and Gender, 2005 - 2007.
2006 2007 2008
M F T M F T M F T
ECE 1353 1197 2550 827 730 1557 827 730 1557
PRI 3869 3544 7413 3529 3138 6667 3529 3138 6667
SEC 930 937 1867 1011 1002 2013 1011 1002 2013
Total 6152 5678 11830 5367 4870 10237 5367 4870 10237
Enrolments by Island, 2008.
ECE PRI SEC Total
Ambrym 291 1498 293 2082
Akhamb 108 108
Atchin 34 206 0 240
Avock 60 60
Malekula 1174 4035 1388 6597
Maskelyns 167 38 205
Paama 49 364 186 599
Tomman 9 9
Uripiv 82 82
Vao 255 255
Total 1557 6667 2013 10237
Proportion of Enrolments by Island, 2008.
20%
1%
2%
1%
65%
6%
1%
2%
2%
Ambrym
Akhamb
Atchin
Avock
Malekula
Maskelyns
Paama
Tomman
Uripiv
Vao
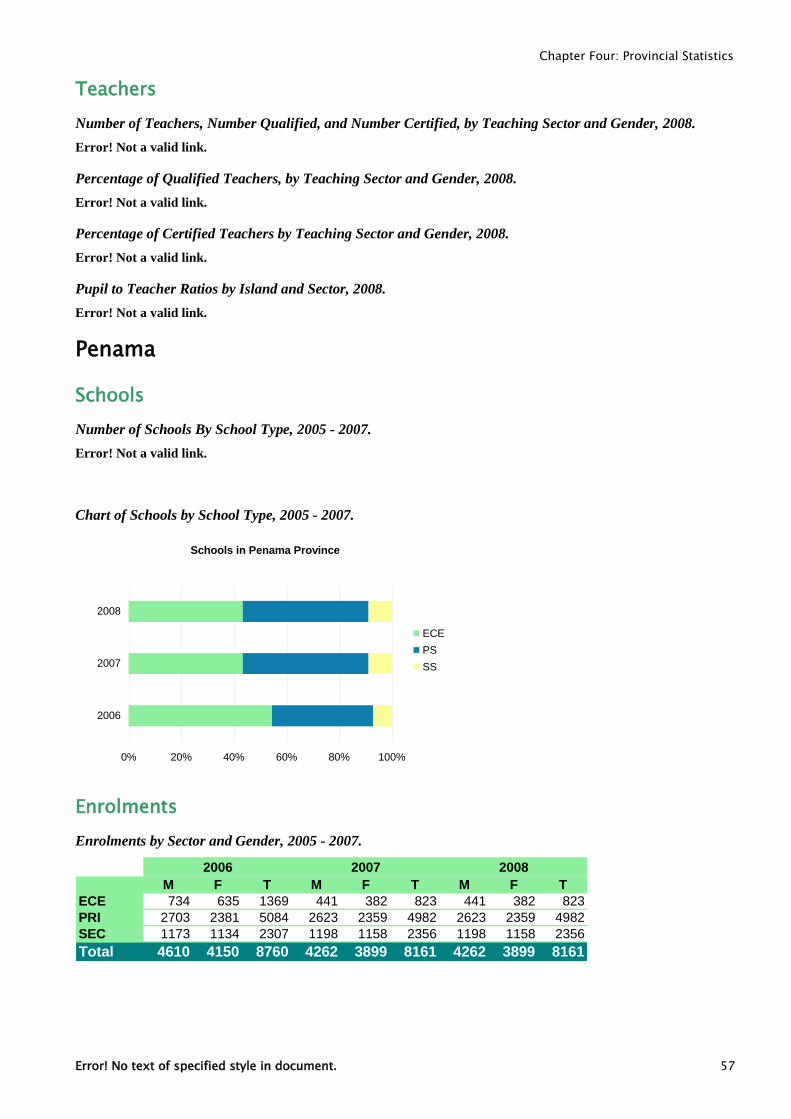
Chapter Four: Provincial Statistics
Error! No text of specified style in document. 57
Teachers
Number of Teachers, Number Qualified, and Number Certified, by Teaching Sector and Gender, 2008.
Error! Not a valid link.
Percentage of Qualified Teachers, by Teaching Sector and Gender, 2008.
Error! Not a valid link.
Percentage of Certified Teachers by Teaching Sector and Gender, 2008.
Error! Not a valid link.
Pupil to Teacher Ratios by Island and Sector, 2008.
Error! Not a valid link.
Penama
Schools
Number of Schools By School Type, 2005 - 2007.
Error! Not a valid link.
Chart of Schools by School Type, 2005 - 2007.
Schools in Penama Province
0% 20% 40% 60% 80% 100%
2006
2007
2008
ECE
PS
SS
Enrolments
Enrolments by Sector and Gender, 2005 - 2007.
2006 2007 2008
M F T M F T M F T
ECE 734 635 1369 441 382 823 441 382 823
PRI 2703 2381 5084 2623 2359 4982 2623 2359 4982
SEC 1173 1134 2307 1198 1158 2356 1198 1158 2356
Total 4610 4150 8760 4262 3899 8161 4262 3899 8161
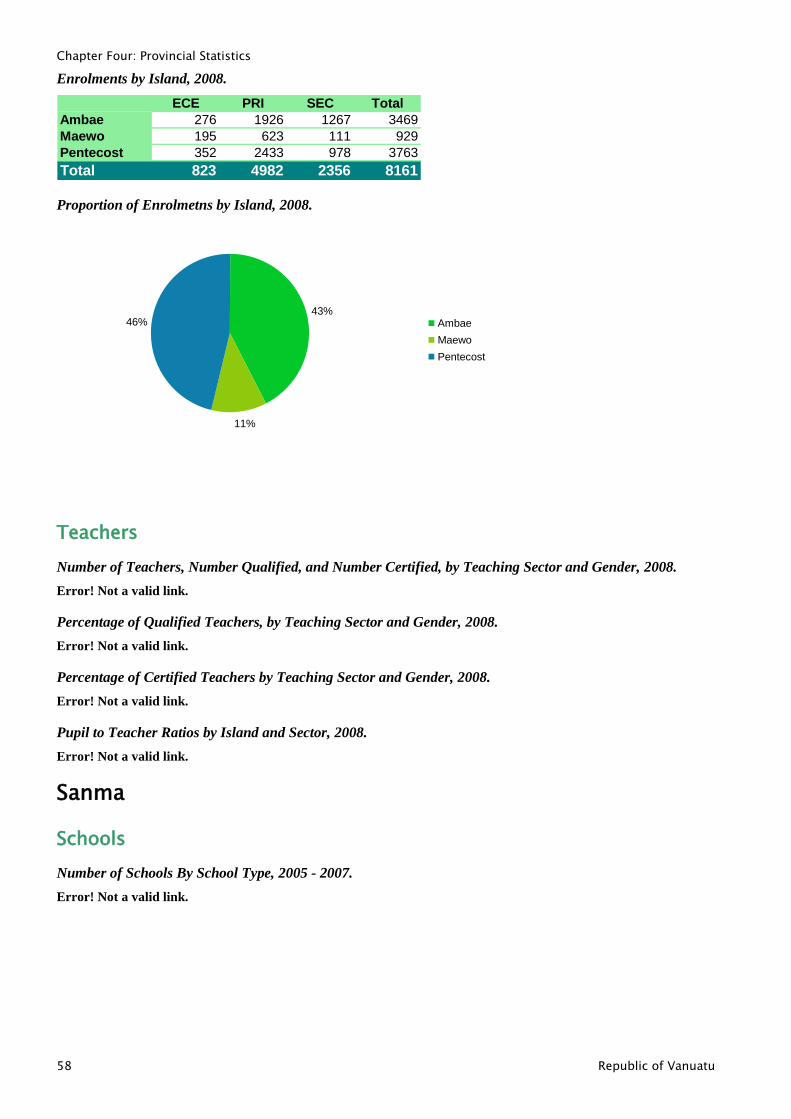
Chapter Four: Provincial Statistics
58 Republic of Vanuatu
Enrolments by Island, 2008.
ECE PRI SEC Total
Ambae 276 1926 1267 3469
Maewo 195 623 111 929
Pentecost 352 2433 978 3763
Total 823 4982 2356 8161
Proportion of Enrolmetns by Island, 2008.
43%
11%
46% Ambae
Maewo
Pentecost
Teachers
Number of Teachers, Number Qualified, and Number Certified, by Teaching Sector and Gender, 2008.
Error! Not a valid link.
Percentage of Qualified Teachers, by Teaching Sector and Gender, 2008.
Error! Not a valid link.
Percentage of Certified Teachers by Teaching Sector and Gender, 2008.
Error! Not a valid link.
Pupil to Teacher Ratios by Island and Sector, 2008.
Error! Not a valid link.
Sanma
Schools
Number of Schools By School Type, 2005 - 2007.
Error! Not a valid link.
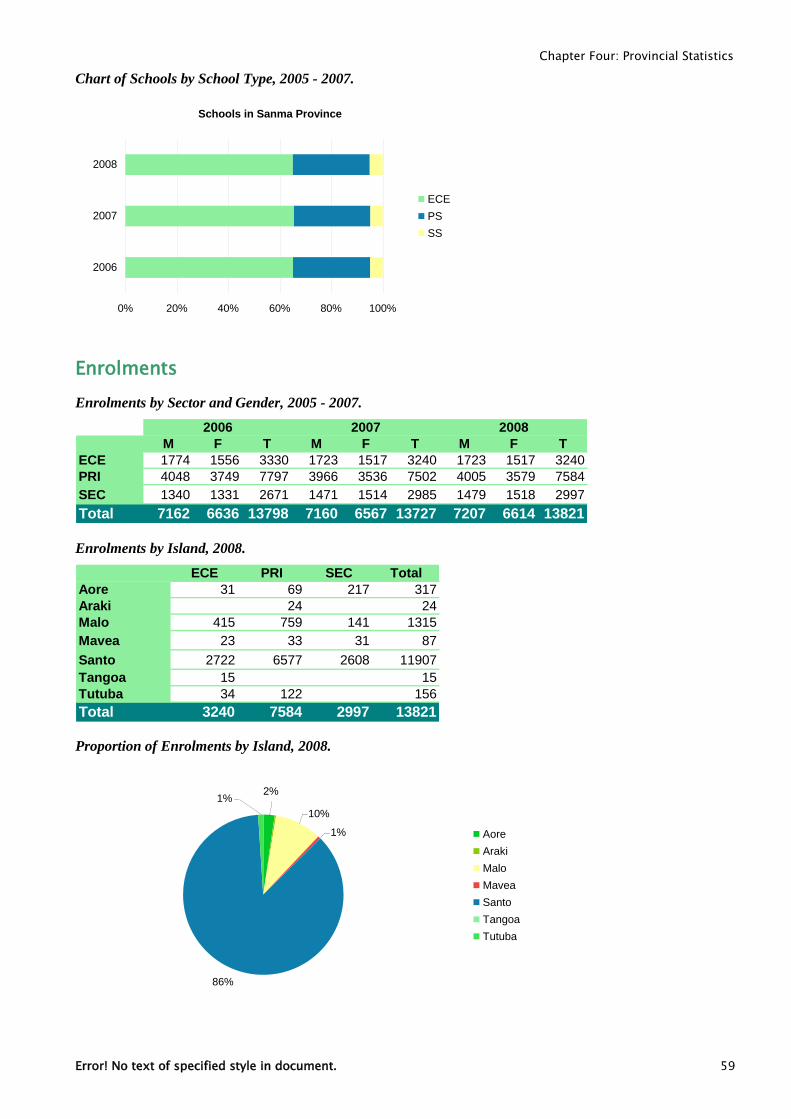
Chapter Four: Provincial Statistics
Error! No text of specified style in document. 59
Chart of Schools by School Type, 2005 - 2007.
Schools in Sanma Province
0% 20% 40% 60% 80% 100%
2006
2007
2008
ECE
PS
SS
Enrolments
Enrolments by Sector and Gender, 2005 - 2007.
2006 2007 2008
M F T M F T M F T
ECE 1774 1556 3330 1723 1517 3240 1723 1517 3240
PRI 4048 3749 7797 3966 3536 7502 4005 3579 7584
SEC 1340 1331 2671 1471 1514 2985 1479 1518 2997
Total 7162 6636 13798 7160 6567 13727 7207 6614 13821
Enrolments by Island, 2008.
ECE PRI SEC Total
Aore 31 69 217 317
Araki 24 24
Malo 415 759 141 1315
Mavea 23 33 31 87
Santo 2722 6577 2608 11907
Tangoa 15 15
Tutuba 34 122 156
Total 3240 7584 2997 13821
Proportion of Enrolments by Island, 2008.
10%
1%
86%
2%1%
Aore
Araki
Malo
Mavea
Santo
Tangoa
Tutuba
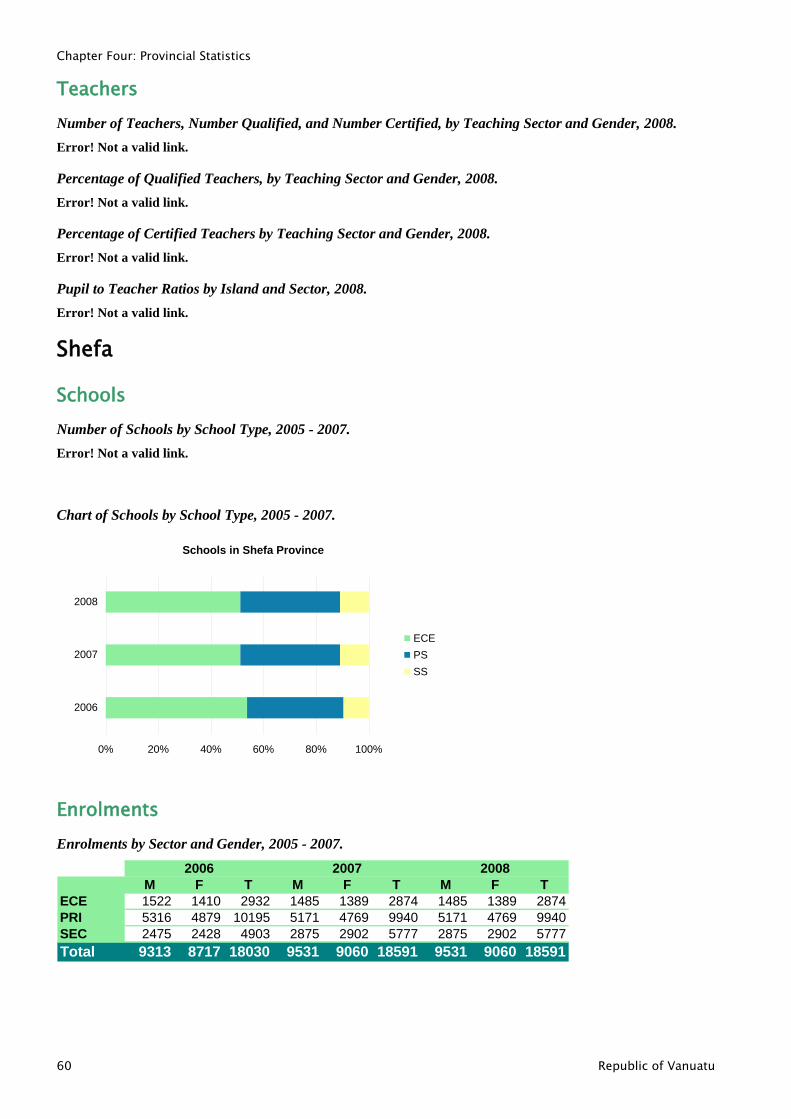
Chapter Four: Provincial Statistics
60 Republic of Vanuatu
Teachers
Number of Teachers, Number Qualified, and Number Certified, by Teaching Sector and Gender, 2008.
Error! Not a valid link.
Percentage of Qualified Teachers, by Teaching Sector and Gender, 2008.
Error! Not a valid link.
Percentage of Certified Teachers by Teaching Sector and Gender, 2008.
Error! Not a valid link.
Pupil to Teacher Ratios by Island and Sector, 2008.
Error! Not a valid link.
Shefa
Schools
Number of Schools by School Type, 2005 - 2007.
Error! Not a valid link.
Chart of Schools by School Type, 2005 - 2007.
Schools in Shefa Province
0% 20% 40% 60% 80% 100%
2006
2007
2008
ECE
PS
SS
Enrolments
Enrolments by Sector and Gender, 2005 - 2007.
2006 2007 2008
M F T M F T M F T
ECE 1522 1410 2932 1485 1389 2874 1485 1389 2874
PRI 5316 4879 10195 5171 4769 9940 5171 4769 9940
SEC 2475 2428 4903 2875 2902 5777 2875 2902 5777
Total 9313 8717 18030 9531 9060 18591 9531 9060 18591
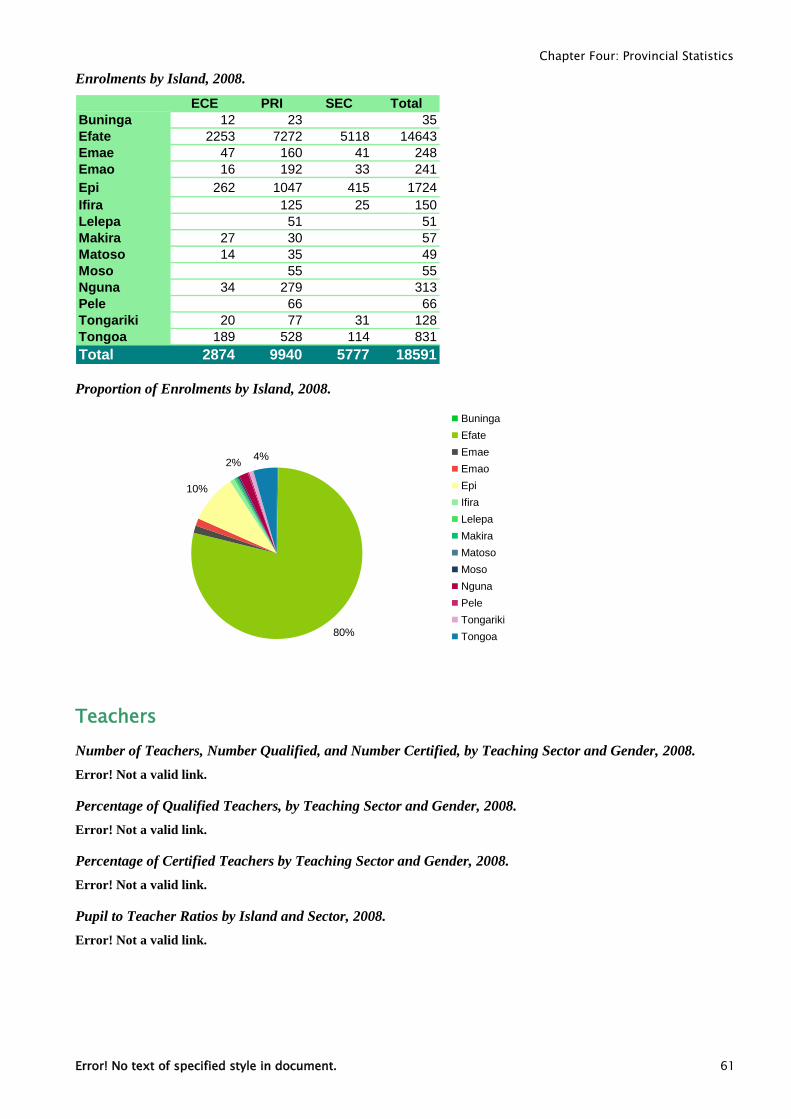
Chapter Four: Provincial Statistics
Error! No text of specified style in document. 61
Enrolments by Island, 2008.
ECE PRI SEC Total
Buninga 12 23 35
Efate 2253 7272 5118 14643
Emae 47 160 41 248
Emao 16 192 33 241
Epi 262 1047 415 1724
Ifira 125 25 150
Lelepa 51 51
Makira 27 30 57
Matoso 14 35 49
Moso 55 55
Nguna 34 279 313
Pele 66 66
Tongariki 20 77 31 128
Tongoa 189 528 114 831
Total 2874 9940 5777 18591
Proportion of Enrolments by Island, 2008.
2%4%
10%
80%
Buninga
Efate
Emae
Emao
Epi
Ifira
Lelepa
Makira
Matoso
Moso
Nguna
Pele
Tongariki
Tongoa
Teachers
Number of Teachers, Number Qualified, and Number Certified, by Teaching Sector and Gender, 2008.
Error! Not a valid link.
Percentage of Qualified Teachers, by Teaching Sector and Gender, 2008.
Error! Not a valid link.
Percentage of Certified Teachers by Teaching Sector and Gender, 2008.
Error! Not a valid link.
Pupil to Teacher Ratios by Island and Sector, 2008.
Error! Not a valid link.
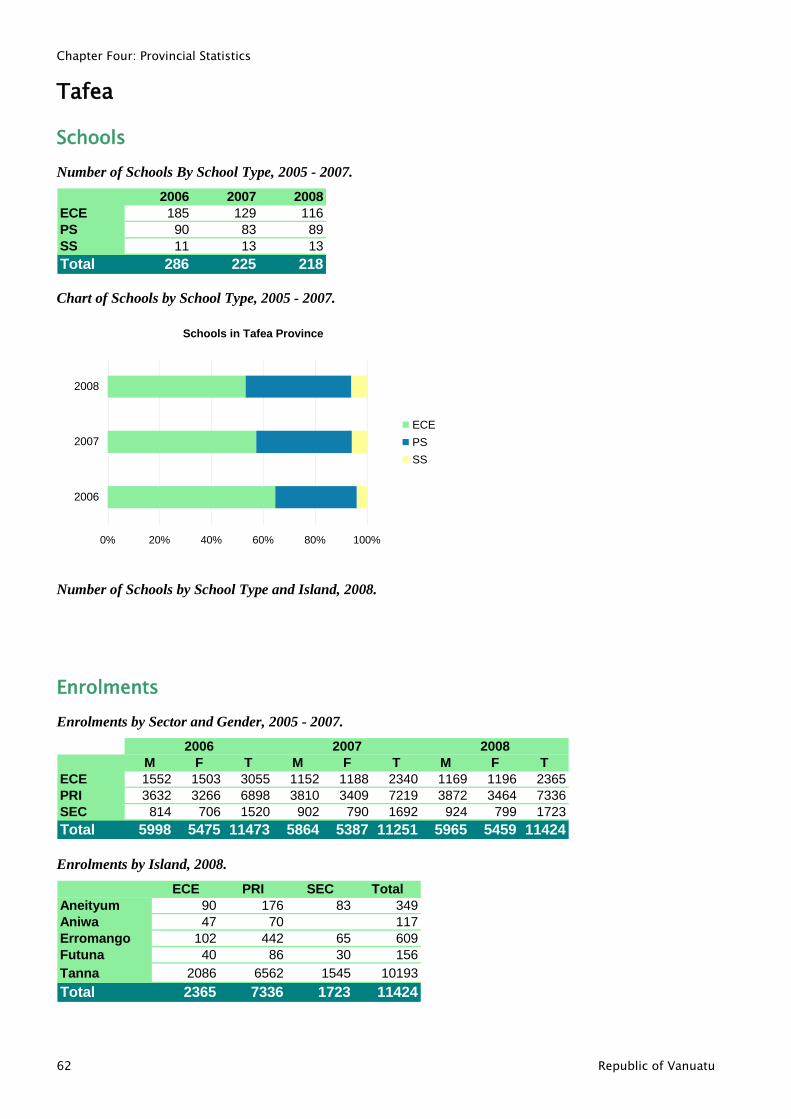
Chapter Four: Provincial Statistics
62 Republic of Vanuatu
Tafea
Schools
Number of Schools By School Type, 2005 - 2007.
2006 2007 2008
ECE 185 129 116
PS 90 83 89
SS 11 13 13
Total 286 225 218
Chart of Schools by School Type, 2005 - 2007.
Schools in Tafea Province
0% 20% 40% 60% 80% 100%
2006
2007
2008
ECE
PS
SS
Number of Schools by School Type and Island, 2008.
Enrolments
Enrolments by Sector and Gender, 2005 - 2007.
2006 2007 2008
M F T M F T M F T
ECE 1552 1503 3055 1152 1188 2340 1169 1196 2365
PRI 3632 3266 6898 3810 3409 7219 3872 3464 7336
SEC 814 706 1520 902 790 1692 924 799 1723
Total 5998 5475 11473 5864 5387 11251 5965 5459 11424
Enrolments by Island, 2008.
ECE PRI SEC Total
Aneityum 90 176 83 349
Aniwa 47 70 117
Erromango 102 442 65 609
Futuna 40 86 30 156
Tanna 2086 6562 1545 10193
Total 2365 7336 1723 11424
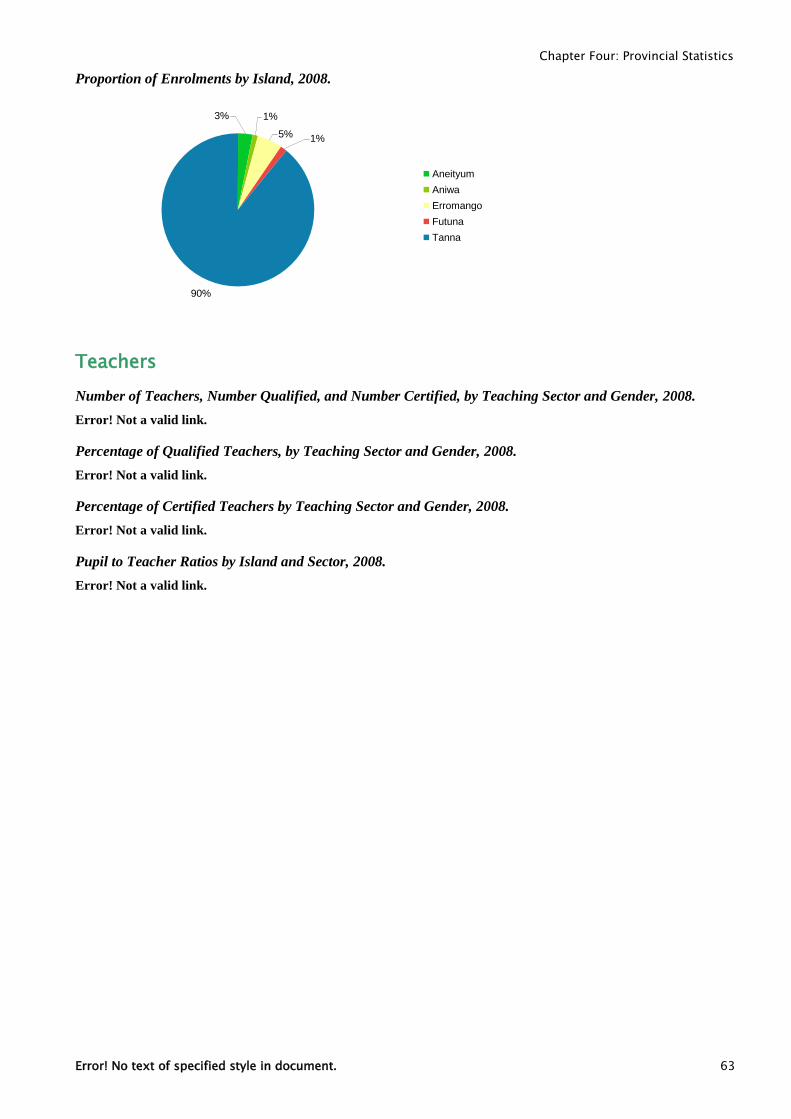
Chapter Four: Provincial Statistics
Error! No text of specified style in document. 63
Proportion of Enrolments by Island, 2008.
1%
5%
90%
3%
1%
Aneityum
Aniwa
Erromango
Futuna
Tanna
Teachers
Number of Teachers, Number Qualified, and Number Certified, by Teaching Sector and Gender, 2008.
Error! Not a valid link.
Percentage of Qualified Teachers, by Teaching Sector and Gender, 2008.
Error! Not a valid link.
Percentage of Certified Teachers by Teaching Sector and Gender, 2008.
Error! Not a valid link.
Pupil to Teacher Ratios by Island and Sector, 2008.
Error! Not a valid link.
![Government of Vanuatu Ministry of Climate Change ... · [MEND] Mission in Vanuatu May 30 till June 15 , 2016 NDMO October 2 2015 National Disaster Management Office International](https://img.pdfslide.us/doc/110x75/5f3b6e2d3b3e1853bc20bab1/government-of-vanuatu-ministry-of-climate-change-mend-mission-in-vanuatu-may.jpg)