Embed Size (px)
Citation preview

Myanmar Ministry of Commerce
REPUBLIC OF THE UNION OF MYANMAR
NATIONAL EXPORT STRATEGYBEANS, PULSES AND OILSEEDSSECTOR STRATEGY 2015-2019

The National Export Strategy (NES) of Myanmar is an official document of the Government of the Republic of the Union of Myanmar.
For any queries about the NES, please contact :
The Department of Trade PromotionMinistry of Commerce
Office No.3, Zeya Htani RoadNay Pyi Taw
Phone : + 95 67 408495 / + 95 67 408266Fax : + 95 67 408256E-mail : [email protected]
The reproduction, publishing or transmission in any form or by any means of all or any part of the publication is prohibited without the permission of the Ministry of Commerce of the Republic of the Union of Myanmar.
The National Export Strategy of the The Republic of the Union of Myanmar was developed on the basis of the process, methodology and technical assistance of the ITC. The views expressed herein do not reflect the official opinion of the ITC. This document has not been formally edited by the ITC.
Layout : Jesús Alés – www.sputnix.esPhotos: © ITC
The International Trade Centre ( ITC ) is the joint agency of the World Trade Organization and the United Nations
Street address: ITC 54-56, rue de Montbrillant 1202 Geneva, Switzerland
Postal address: ITC Palais des Nations 1211 Geneva 10, Switzerland
Telephone: +41-22 730 0111
Fax: +41-22 733 4439
E-mail: [email protected]
Internet: http://www.intracen.org

Myanmar Ministry of Commerce
THE REPUBLIC OF THE UNION OF MYANMAR NATIONAL EXPORT STRATEGY BEANS, PULSES AND OILSEEDS SECTOR STRATEGY 2015-2019


IIITHE REPUBLIC OF THE UNION OF MYANMAR NATIONAL EXPORT STRATEGY
ACKNOWLEDGEMENTS
The following Beans, Pulses and Oilseeds sector strategy forms an integral part of Myanmar’s National Export Strategy ( NES ). The NES was made possible with the support of the Government of the Republic of the Union of Myanmar ( GRUM ), under the leadership of Myanmar Ministry of Commerce ( MoC ), the financial support from Germany’s Federal Ministry for Economic Cooperation and Cooperation ( BMZ ) in collaboration with the Deutsche Gesellschaft für Internationale Zusammenarbeit ( GIZ ) and the technical assistance of the International Trade centre ( ITC ).
The coordination support of the Ministry of Commerce – Department of Trade Promotion : � Mr. Aung Soe
Deputy Director General, NES Navigator, Department of Trade Promotion, Ministry of Commerce
� Dr. Maung Aung Economist, Advisor to the Minister of Commerce, Ministry of Commerce
� Ms. Naw MutaKapaw Director, Department of Trade Promotion, Ministry of Commerce
� Ms. Thidar Win Htay Assistant Director, Department of Trade Promotion, Ministry of Commerce
� Ms. Mya Mya Sein Assistant Director, Department of Trade Promotion, Ministry of Commerce
The Directorate of Trade : � Ms. Shwe Zin Ko
Assistant Director, Department of Trade Promotion, Ministry of Commerce
The strategy team leader : � Mr. Soe Win Maung
Advisor, Myanmar Pulse, Beans and Sesame seeds Merchants Association
Technical facilitation and support from the International Trade Centre ( ITC ) : � Mr. Charles Roberge
Associate Advisor, Export Strategy � Mr. Robert Kafafian
International consultant � Mr. Daniel Ramage
Intern � Ms. Marnie McDonald
Editor
The members of the strategy team : � Daw Cho Cho Win
Deputy Director General, DICA � U Than Aung Kyaw
Director, MOC � U Win Myint
Director, MOC � U Kyaw Thu
Deputy Director, MOC � U Myo Thu
Deputy Director, MOC � Daw Hnin Sandar
Deputy Director, MOC � U Kyaw Zarni Win
Deputy Director, DICA � Daw Khin Mar Mar Nwe
Deputy Director, MOAI � Daw Aye Aye Win
Assistant Director, MOAI � Dr. San San Yi
Assistant Director, MOAI � U Zaw Win
Assistant Director, MOAI � Daw Than Than Nu
Staff Officer
� U Sai Ba Nyan Vice Chairman, MPBSMA
� U Tin Myint Vice Chairman, MPBSMA
� U Soe Paing Joint Secretary, MPBSMA
� U Tin Htut CEC Member, MPBSMA
� Dr. Min Zaw Vice President ( 3 )- Yangon
� Dr. Myo Lwin Vice President ( 4 )- Yangon, Region-CCI
� U Aung Thein Vice President ( 1 )- Yangon, Region-CCI
� U Soe Mya Auditor, Yangon, Region-CCI
� U Van Lian Cung Lawyer, HRMR
� U Myint Kyu Auditor ( 1 ), MPBSMA
� Dr. Aung Kyaw Nyunt EC, Yangon, Region-CCI
� Daw Su Win Myat Assistant General Manager, Myanmar Citzens Bank
� U Tin Maung Soe CEC, Yangon, Region-CCI
� Daw Khin Moe Myint Observer, TTI
� Daw San San Win AGM, MITS
� U Zaw Min Htike Director, Kan lynn International Trading Co, Ltd
� Dr. Myat Soe Information Manager, MPBSMA
� Dr.Myint Oo Joint Secretary ( 3 ), MPBSMA
� U San Thein CEC Member, Yangon, Region-CCI
� Daw Hla Hla Yee Secretary-1, MIFFA
� Dr. Kyaw Win Joint Secretary, YRCCI

IV THE REPUBLIC OF THE UNION OF MYANMAR NATIONAL EXPORT STRATEGY
ACRONYMS
AEC ASEAN Economic Community
ASEAN Association of Southeast Asian Nations
CEXC Crop Exchange Centre
DAR Department of Agricultural Research
DICA Directorate of Investment and Company Administration
DOA Department of Agriculture
FAO Food and Agriculture Organization of the United Nations
FDA Food and Drug Administration
GAP Good Agricultural Practices
GDP Gross Domestic Product
GMP Good Management Practices
HACCP Hazard Analysis and Critical Control Points
HS Harmonized System
IFAD International Fund for Agriculture and Development
IMF International Monetary Fund
ISO International Organization for Standardization
ITC International Trade Centre
LIFT Livelihood and Food Security Trust Fund
MIC Myanmar Investment Commission
MNPED Ministry of National Planning and Economic Development
MOAG Myanmar Organic Agriculture Group
MoAI Ministry of Agriculture and Irrigation
MoC Ministry of Commerce
MoH Ministry of Health
MPBSMA Myanmar Pulses, Beans and Sesame Seeds Merchants Association
MSTRD Myanmar Scientific and Technological Research Department
MTDC Myanmar Trade Development Commitee
NES National Export Strategy
OECD Organisation for Economic Cooperation and Development
PoA Plan of Action
PPD Plant Protection Division
R&D Research & Development
RUMFCCI Republic of the Union of Myanmar Federation of Chambers of Commerce and Industry
SEZ Special Economic Zone
THC Terminal Handling Charges
TSI Trade Support Institution
TT Telegraphic Transfers
UAE United Arab Emirates

VTHE REPUBLIC OF THE UNION OF MYANMAR NATIONAL EXPORT STRATEGY
EXECUTIVE SUMMARY 1
INTRODUCTION 5
WHERE WE ARE NOW 9
CURRENT CONTEXT . . . . . . . . . . . . . . . . . . . . . . . . . . . . . . . . . . . . . . . . . . . . . . 9
PRODUCTION . . . . . . . . . . . . . . . . . . . . . . . . . . . . . . . . . . . . . . . . . . . . . . . . . . . . 15
VALUE CHAIN OPERATIONS . . . . . . . . . . . . . . . . . . . . . . . . . . . . . . . . . . . . . . . 26
IMPORTS . . . . . . . . . . . . . . . . . . . . . . . . . . . . . . . . . . . . . . . . . . . . . . . . . . . . . . . . 30
GLOBAL PERSPECTIVE . . . . . . . . . . . . . . . . . . . . . . . . . . . . . . . . . . . . . . . . . . . . 31
EXPORT PERFORMANCE . . . . . . . . . . . . . . . . . . . . . . . . . . . . . . . . . . . . . . . . . . 35
THE INSTITUTIONAL PERSPECTIVE . . . . . . . . . . . . . . . . . . . . . . . . . . . . . . . . . 38
DEVELOPMENT INITIATIVES . . . . . . . . . . . . . . . . . . . . . . . . . . . . . . . . . . . . . . . 43
LEGAL AND LEGISLATIVE FRAMEWORK . . . . . . . . . . . . . . . . . . . . . . . . . . . . . 44
EXPORT COMPETITIVENESS ISSUES . . . . . . . . . . . . . . . . . . . . . . . . . . . . . . . . 45
WHERE WE WANT TO GO 58
VISION . . . . . . . . . . . . . . . . . . . . . . . . . . . . . . . . . . . . . . . . . . . . . . . . . . . . . . . . . . 58
MARKET IDENTIFICATION . . . . . . . . . . . . . . . . . . . . . . . . . . . . . . . . . . . . . . . . . 61
OILSEEDS MARKET OVERVIEW . . . . . . . . . . . . . . . . . . . . . . . . . . . . . . . . . . . . . 67
STRUCTURAL IMPROVEMENTS TO THE VALUE CHAIN . . . . . . . . . . . . . . . . . 73
ROLE OF INVESTMENT TO MOVE INTO NEW VALUE CHAINS . . . . . . . . . . . 77
CONTENTS

VI THE REPUBLIC OF THE UNION OF MYANMAR NATIONAL EXPORT STRATEGY
HOW TO GET THERE 82
STRATEGIC OBJECTIVES . . . . . . . . . . . . . . . . . . . . . . . . . . . . . . . . . . . . . . . . . . 82
IMPORTANCE OF COORDINATED IMPLEMENTATION . . . . . . . . . . . . . . . . . . 83
IMPLEMENTATION PARTNERS – LEADING AND SUPPORTING INSTITUTIONS . . . . . . . . . . . . . . . . . . . . . . . . . . . . . . . . . . . . . . . . . . . . . . . . . . . 83
PLAN OF ACTION 85
BIBLIOGRAPHY 97
APPENDIX 1: SECTOR STRATEGY TEAM 100

VIITHE REPUBLIC OF THE UNION OF MYANMAR NATIONAL EXPORT STRATEGY
LIST OF FIGURES
Figure 1 : Myanmar pulses exports since 1980 . . . . . . . . . . . . . . . . . . . . . . . . . . . . . . . . . . . 6
Figure 2 : Myanjmar exports of sesame between 1995 and 2006 . . . . . . . . . . . . . . . . . . . 6
Figure 3 : Myanmar’s pulse and oilseed production areas ( ha ), 1990–2012 . . . . . . . . . 9
Figure 4 : Pulses produced by state / region ( 2008 / 2009 ). . . . . . . . . . . . . . . . . . . . . . . . . . . 10
Figure 5 : Production trends for beans and pulses in Myanmar 2000-2012 . . . . . . . . . . 15
Figure 6 : Trends in yield of beans and pulses production( hg / ha ), 2000-2012 . . . . . . . 16
Figure 7 : Production of pulses in Myanmar ( tons ), 2007-2012 . . . . . . . . . . . . . . . . . . . . . 16
Figure 8 : Pulses and beans product map . . . . . . . . . . . . . . . . . . . . . . . . . . . . . . . . . . . . . . . 18
Figure 9 : Trends in Myanmar oilseed production 2000–2012 . . . . . . . . . . . . . . . . . . . . . . 18
Figure 10 : Area harvested, select oilseeds in Myanmar, 2007–2012 . . . . . . . . . . . . . . . 19
Figure 11 : Trends in sesame seed yields ( hg / ha ) 2000–2011 . . . . . . . . . . . . . . . . . . . . . . 21
Figure 12 : Trends in groundnut yields ( hg / ha ) 2000–2012 . . . . . . . . . . . . . . . . . . . . . . . . . 21
Figure 13 : Oilseed production in Myanmar 2007–2012 . . . . . . . . . . . . . . . . . . . . . . . . . . . 22
Figure 14 : Trends in soya bean production in Myanmar 2000–2012. . . . . . . . . . . . . . . . 23
Figure 15 : Trends in soya bean yields ( hg / ha ) 2000–2012. . . . . . . . . . . . . . . . . . . . . . . . . 23
Figure 16 : Soya beanproduct map . . . . . . . . . . . . . . . . . . . . . . . . . . . . . . . . . . . . . . . . . . . . . 24
Figure 17 : Oilseed product map . . . . . . . . . . . . . . . . . . . . . . . . . . . . . . . . . . . . . . . . . . . . . . . 25
Figure 18 : Current oilseeds value chain . . . . . . . . . . . . . . . . . . . . . . . . . . . . . . . . . . . . . . . . 27
Figure 19 : Current pulses value chain . . . . . . . . . . . . . . . . . . . . . . . . . . . . . . . . . . . . . . . . . . 28
Figure 20 : Estimated GDP per capita by district ( 2009 ) . . . . . . . . . . . . . . . . . . . . . . . . . . . 56
Figure 21 : Future value chain – pulses and beans subsector . . . . . . . . . . . . . . . . . . . . . 59
Figure 22 : Future value chain – oilseeds subsector . . . . . . . . . . . . . . . . . . . . . . . . . . . . . . 60
Figure 23 : Fertilizer consumption Myanmar, Viet Nam and Thailand . . . . . . . . . . . . . . 74
Figure 24: Possible evolution of a foreign investor’s activities in a given location . . . 79
VIII THE REPUBLIC OF THE UNION OF MYANMAR NATIONAL EXPORT STRATEGY
TABLES
Table 1 : Comparative yields ( hg / ha ) ( 2012 ) . . . . . . . . . . . . . . . . . . . . . . . . . . . . . . . . . . . . . 17
Table 2 : Comparative yields of oilseeds( hg / ha ) ( 2012 ) . . . . . . . . . . . . . . . . . . . . . . . . . . . 19
Table 3 : Pulses and beans imports 2012 . . . . . . . . . . . . . . . . . . . . . . . . . . . . . . . . . . . . . . . . 31
Table 4 : Pulses and beans exports 2012 . . . . . . . . . . . . . . . . . . . . . . . . . . . . . . . . . . . . . . . . 32
Table 5 : Oilseed imports 2012 . . . . . . . . . . . . . . . . . . . . . . . . . . . . . . . . . . . . . . . . . . . . . . . . . 33
Table 6 : Oilseed exports 2012 . . . . . . . . . . . . . . . . . . . . . . . . . . . . . . . . . . . . . . . . . . . . . . . . . 34
Table 7 : Myanmar’s pulses and beans exports ( 2012 ) . . . . . . . . . . . . . . . . . . . . . . . . . . . 35
Table 8 : Myanmar’s oilseeds exports ( 2012 ) . . . . . . . . . . . . . . . . . . . . . . . . . . . . . . . . . . . . 36
Table 9 : Myanmar’s groundnut exports ( 2012 ) . . . . . . . . . . . . . . . . . . . . . . . . . . . . . . . . . . 37
Table 10 : Myanmar’s soya bean exports ( 2012 ) . . . . . . . . . . . . . . . . . . . . . . . . . . . . . . . . . 37
Table 11 : Policy support network for the Myanmar pulses, beans and oilseeds sector 39
Table 12 : Trade services network for the Myanmar pulses, beans and oilseeds sector 41
Table 13 : Business services network for the Myanmar pulses, beans and oilseeds sector . . . . . . . . . . . . . . . . . . . . . . . . . . . . . . . . . . . . . . . . . . . . 42
Table 14 : Civil society network for the pulses, beans and oilseeds sectors . . . . . . . . . 43
Table 15 : Beans and pulses : short-term ( 1-3 years ) . . . . . . . . . . . . . . . . . . . . . . . . . . . . . . 63
Table 16 : Beans and pulses : medium-to-long term ( 3+ years ) . . . . . . . . . . . . . . . . . . . . 66
Table 17 : Oilseeds : short-term ( 1–3 years ) . . . . . . . . . . . . . . . . . . . . . . . . . . . . . . . . . . . . . . 69
Table 18 : Oilseeds : medium-to-long term ( 3+ years ) . . . . . . . . . . . . . . . . . . . . . . . . . . . . 70
Table 19: Value chain segments needing FDI and likely sources . . . . . . . . . . . . . . . . . . 78
Table 20: Leading Asian producers and exporters of gram beans, groundnuts, and sesame seeds (production figures in million metric tons) . . . . . . . . . . . . 79
Table 21: Percent of surveyed foreign investors citing an issue as the “biggest obstacle” to doing business in countries competing with Myanmar for sector-related FDI . . . . . . . . . . . . . . . . . . . . . . . . . . . . . . . . . . . . . . . . . . . . . . . . . 80

IXTHE REPUBLIC OF THE UNION OF MYANMAR NATIONAL EXPORT STRATEGY
BOXES
Box 1 : Methodological note . . . . . . . . . . . . . . . . . . . . . . . . . . . . . . . . . . . . . . . . . . . . . . . . . . . . 4
Box 2 : Agricultural land and cropping patterns in Myanmar . . . . . . . . . . . . . . . . . . . . . 11
Box 3 : Research and development in Myanmar . . . . . . . . . . . . . . . . . . . . . . . . . . . . . . . . . 11
Box 4 : Crop Exchange Centres . . . . . . . . . . . . . . . . . . . . . . . . . . . . . . . . . . . . . . . . . . . . . . . . 12
Box 5 : Certifying Laboratories in Myanmar . . . . . . . . . . . . . . . . . . . . . . . . . . . . . . . . . . . . . 14
Box 6 : Note on reliability of official statistics . . . . . . . . . . . . . . . . . . . . . . . . . . . . . . . . . . . . . 14
Box 7 : Trends in sesame and groundnut yields . . . . . . . . . . . . . . . . . . . . . . . . . . . . . . . . . . 20
Box 8 : Important oilseed crops . . . . . . . . . . . . . . . . . . . . . . . . . . . . . . . . . . . . . . . . . . . . . . . . . 22
Box 9 : Soya beans . . . . . . . . . . . . . . . . . . . . . . . . . . . . . . . . . . . . . . . . . . . . . . . . . . . . . . . . . . . . 23
Box 10 : Palm oil . . . . . . . . . . . . . . . . . . . . . . . . . . . . . . . . . . . . . . . . . . . . . . . . . . . . . . . . . . . . . . 24
Box 11 : Oil mills . . . . . . . . . . . . . . . . . . . . . . . . . . . . . . . . . . . . . . . . . . . . . . . . . . . . . . . . . . . . . . 30
Box 12 : Overview of supply-side issues related to the pulses, beans and oilseeds sector . . . . . . . . . . . . . . . . . . . . . . . . . . . . . . . . . . . . . . . . . . . . 45
Box 13 : Overview of business environment issues related to the pulses, beans and oilseeds sector . . . . . . . . . . . . . . . . . . . . . . . . . . . . . . . . . . . . . . . . . . . . 50
Box 14 : Overview of market entry issues related to the pulses, beans and oilseeds sector . . . . . . . . . . . . . . . . . . . . . . . . . . . . . . . . . . . . . . . . . . . . 53
Box 15 : Overview of development issues related to the pulses, beans and oilseeds sector . . . . . . . . . . . . . . . . . . . . . . . . . . . . . . . . . . . . . . . . . . . . 55
Box 16 : Overview of structural changes to the pulses, beans and oilseeds sector . . 73

1EXECUTIVE SUMMARY
EXECUTIVE SUMMARY
Myanmar’s pulses, beans and oilseeds sector is impor-tant because of its employment generation, contribution to gross domestic product ( GDP ), and export potential. It has long played a key role in both the national food chain and international trade, accounting for a large portion of household expenditure as well as over 10 % of Myanmar’s total exports.
CURRENT CONTEXT
Sector enterprises rely upon smallholder landowners as the main source of labour. While this has provided the sector with an abundant labour supply, it has perpetuated a reliance upon labour-intensive farming and hindered the development of more mechanized processes. As a result, traditional cropping methods persist and there has been little uptake of the modern techniques and equipment re-quired for enhanced export competitiveness.
Sector production has experienced significant growth since the turn of the century thanks to increased yields as well as an expansion of agricultural land dedicated to pulses, beans and oilseeds. It is important to note, however, that the persistence of government controls in the oilseeds sector has diminished the incentive for farm-ers to enhance capacities. Accordingly, both the output and yield of beans and pulses has far exceeded that of oilseeds.
EXPORT PERFORMANCE
Global pulses and oilseeds imports are valued at US $ 9.6 billion and US $ 3.4 billion respectively, having expe-rienced steady growth of 8 % and 4 % per annum from 2008 to 2012. While the biggest importers of pulses are India ( which accounts for 23 % of total imports ), China and the United States of America, exports are dominated by Canada, Australia and China. The largest markets for oilseed imports are China ( 19 % of total imports ), Japan and the United States of America, and the most important exporters are India, Ethiopia and Australia.
In 2012 Myanmar exported US $ 804 million of pulses and US $ 54 million of oilseeds, making it the fifth largest ex-porter of pulses and representing 8.9 % and 1.4 % of world exports respectively. Pulse exports rely heavily upon black gram and green gram and are destined largely for neigh-bouring markets. Exports are extremely concentrated, with over 74 % of pulse exports being sold to India. While less concentrated than pulses, oilseeds exports are still reliant upon a few key markets including Japan, China and Chinese Taipei. Over 91 % of total oilseeds exports are destined for these three markets. The most impor-tant product in the subsector is sesame seeds, which accounts for roughly 94 % of Myanmar’s oilseeds exports.
Despite the healthy growth experienced globally by the sector over recent years, Myanmar’s exports of pulses have stagnated and its exports of oilseeds have declined dramatically. Of particular note has been Myanmar’s in-ability to further penetrate the growing Indian market for pulses, in conjunction with its loss of market share in China for both pulses and oilseeds. Nevertheless, Myanmar enjoys a strategic geographical position in the heart of emerging Asia, bordering on some of the largest target markets in the sector. There are thus a number of opportunities to diversify into emerging import markets such as the Philippines, Indonesia, Malaysia, Thailand, Japan and Chinese Taipei by increasing the quality and processing content of exported goods.

2 THE REPUBLIC OF THE UNION OF MYANMAR NATIONAL EXPORT STRATEGY BEANS, PULSES AND OILSEEDS SECTOR STRATEGY 2015-2019
KEY COMPETITIVENESS ISSUES AFFECTING THE SECTOR’S EXPORT VALUE CHAIN
The following challenges have been identified for the puls-es, beans and oilseeds sector’s export value chains :
� Supply-side challenges : lack of quality seed supply ; scarce finance mechanisms ; limited production plan-ning and support ; low uptake of modern cultivation techniques ; inadequate harvest and post-harvest tech-niques ; and low value addition.
� Business environment challenges : high and volatile transport costs ; poor management of container depots ; limited contractual knowledge ; inconsistent proce-dures ; limited resources and competencies at support institutions ; and inadequate sector organization.
� Market entry challenges : inadequate export finance mechanisms ; inefficient promotion ; lack of trade infor-mation ; and limited structured investment promotion.
� Development-based challenges : limited decentraliza-tion of services ; and heightened risk of product-borne illness.
OPTIONS FOR FUTURE DEVELOPMENT
The following vision has been developed to guide the sec-tor and export development efforts of the pulses, beans and oilseeds sector.
“ Contribute to the socioeconomic development of Myanmar
by being a global provider of environmentally sustainable and value added products based on modern farming
and trading techniques. ”To achieve this vision, the strategy will reduce binding constraints on trade competitiveness and capitalize on strategic options identified for the sector. The strategic orientations for the next five years aim at developing key markets in the short and medium terms for Myanmar’s exporters and facilitating structural changes in the value chain to increase its efficiency and value generation.
The sector strategy vision will be achieved through the implementation of the Plan of Action ( PoA ) for the sec-tor. This PoA revolves around the following five strategic objectives, each spelling out specific sets of activities in-tended to address both challenges and opportunities fac-ing the pulses, beans and oilseeds sector in Myanmar :
� Increase the sector’s production and productivity through enhanced farming techniques, upgrading of farmers’ capacities, improved infrastructure and a reli-able supply of quality inputs ;
� Enable compliance to international standards by mod-ernizing and developing quality management systems ;
� Strengthen cooperation and efficiency by enhanc-ing inter-institutional collaboration and private–public partnerships ;
� Strengthen the sector’s ability to add value to its product through enhancing business management capacities and modernizing processing facilities and techniques ;
� Ensure continuous growth and global reach of the sector through reliable market information, efficient export procedures, targeted branding and improved promotion efforts.
ROADMAP FOR SECTOR EXPORT DEVELOPMENT
The market opportunities identified in this strategy reflect areas in which Myanmar exporters can build the strengths and capacities needed to achieve broader market de-velopment of the sector. Exposure to world markets will play a critical role in ensuring greater efficiency, competi-tiveness and innovation among domestic firms. Targeted improvements to the pulses, beans and oilseeds sector will thus play a key role in facilitating improvements to overall sector capacity, triggering a cascade of improve-ments throughout the country’s agri-food sector and the broader economy.

3EXECUTIVE SUMMARY
To achieve efficiency gains in the sector, key structural changes to the value chain will include the following :
� Increase organic and non-organic fertilizer production and imports in order to boost yields ;
� Increase quality and quantity of production through the implementation of Association of Southeast Asian Nations Good Agricultural Practices ( ASEAN GAP ) ;
� Improve quality management of processing through certification ( Hazard Analysis and Critical Control Points ( HACCP ), International Organization for Standardization ( ISO ), Good Management Practices ( GMP ) ) ;
� Promote the development of organic production for accessing niche target markets ;
� Set up alternative energy production such as agricul-tural waste gasifiers at field level for irrigation, or at processing cluster level for electricity production ;
� Obtain import authorizations for oilseeds and enriched flours ( with a focus on organics ) to increase the pro-duction of edible oil, oilseed cake and animal feed ;
� Increase coordination with other value chains ( rice, livestock, fisheries ) to build synergies and collabora-tion for sector development.
IMPLEMENTATION MANAGEMENT
The achievement of these ambitious targets will require continuous and coordinated efforts from all relevant pri-vate and public stakeholders as well as support from key financial and technical partners, donors and investors. Several institutions are designated to play a leading role in the implementation of the sector PoA and bear the over-all responsibility for successful execution of the strategy. They will be assisted by a range of support institutions which are active in the sector. Each institution mandated to support the export development of the sector is clearly identified in the strategy PoA.
Moreover, the proposed Myanmar Trade Development Committee ( MTDC ) and its Executive Secretariat will play a coordinating and monitoring role in the implementa-tion of the strategy in the overall framework of the NES. In particular, the MTDC will be tasked with coordinating the implementation of activities in order to optimize the allocation of both resources and efforts across the wide spectrum of stakeholders.

4 THE REPUBLIC OF THE UNION OF MYANMAR NATIONAL EXPORT STRATEGY
Box 1 : Methodological note
The approach used by ITC in the strategy design process relies on a number of analytical elements such as value chain analysis, trade support network ( TSN ) analysis, problem tree and strategic options selection, all of which form major building blocks of this sector export strategy document.
Value chain analysis : A comprehensive analysis of the sector’s value chain is an integral part of the strategy development process. This analysis results in the identification of all players, processes and linkages within the sector. The process served as the basis for analysing the current performance of the value chain and for deliberating on options for the future development of the sector.
TSN analysis : The TSN comprises the support services available to the primary value chain players discussed above. It is constituted of policy institutions, trade support organizations, business services providers and civil society. An analysis of the quality of service delivery and constraints affecting the constituent trade support institutions ( TSIs ) is an important input to highlight gaps in service delivery relative to specific sector needs. A second analysis of TSIs assessed their level of influence ( i.e. their ability to influence public policy and other development drivers in the country and therefore make things happen or change ) and their level of capacity to respond to the sector’s needs.
Problem tree analysis : The problem tree analysis used is based on the principles of root causes analysis. The problem tree provides a deeper understanding of what is causing the sector’s constraints and where solution-seeking activities should be directed. As a critical step in the analytical phase of the sector’s performance, the problem tree guides the design of realistic activities in the strategy’s PoA.
Strategic orientations : The strategic options for the development of the sector are reflected in the future value chain, which is the result of consultations, surveys and analysis conducted as part of the sector strategy design process. The future perspective has two components :
• A market-related component involving identification of key markets in the short and medium- to-long terms for Myanmar exporters ;
• Structural changes to the value chain that result in either strengthening of linkages or introduction of new linkages.
Realistic and measurable PoA : The definition of recommendations and strategic directions for the development of the sector is essential to guide its development, but is not enough. It is important to clearly define the actions to be implemented to stimulate growth. The development of a detailed action plan, defining which activities need to be undertaken by sector stakeholders, is necessary to the effective implementation of the strategy. An action plan, developed with the support of ITC, includes performance indicators to ensure effective monitoring and evaluation of the strategy’s implementation.
5THE REPUBLIC OF THE UNION OF MYANMAR NATIONAL EXPORT STRATEGY
INTRODUCTION
HISTORICAL OVERVIEW
Myanmar has long relied upon agricultural activity as a key component of its economy. With the exception of rice, pulses, beans and oilseeds have been the most impor-tant crops. These commodities have traditionally played a significant role in foreign trade while at the same time serving as a staple in domestic dietary habits.
PULSES AND BEANS
Pulses and beans have historically been one of Myanmar’s most important export products, playing a key role in trade throughout centuries past. The production and trading of pulses and beans has its roots in the early periods of British rule, which catalysed the migration of Indian grow-ers to Burma. These farmers brought with them not only the tradition of pulse and bean production but also a con-nection to the Indian market, where these products were widely used in traditional cuisine. Myanmar was thus able to engage in direct trade with India. Although Myanmar’s independence in 1948 and the eventual coup d’état of 1962 forced many Indians to leave, the tradition of pulse and bean production continued.1
The socialist period that lasted from 1962 to 1987 saw the implementation of planned economic policies geared at self-sufficiency.2 These were characterized by strict trade restrictions and controls on foreign exchange. Within this framework the state-controlled agricultural marketing sys-tem governed crop production and trade. The govern-ment’s trading corporations procured all major crops at fixed prices and were the sole entities authorized to en-gage in import and export operations.3 Violations of state
1. Thura Swiss ( August 2013 ). Myanmar’s Beans and Pulses Trade : Risks and Prospects, p. 1.2. FAO / WFP ( January 2009 ). Special Report : FAO / WFP Crop and Food Security Assessment Mission to Myanmar, p. 10.3. Ibid. : pp. 9-10.
restrictions were severe and private traders of black gram ( matpe ), for example, could receive the death penalty.4
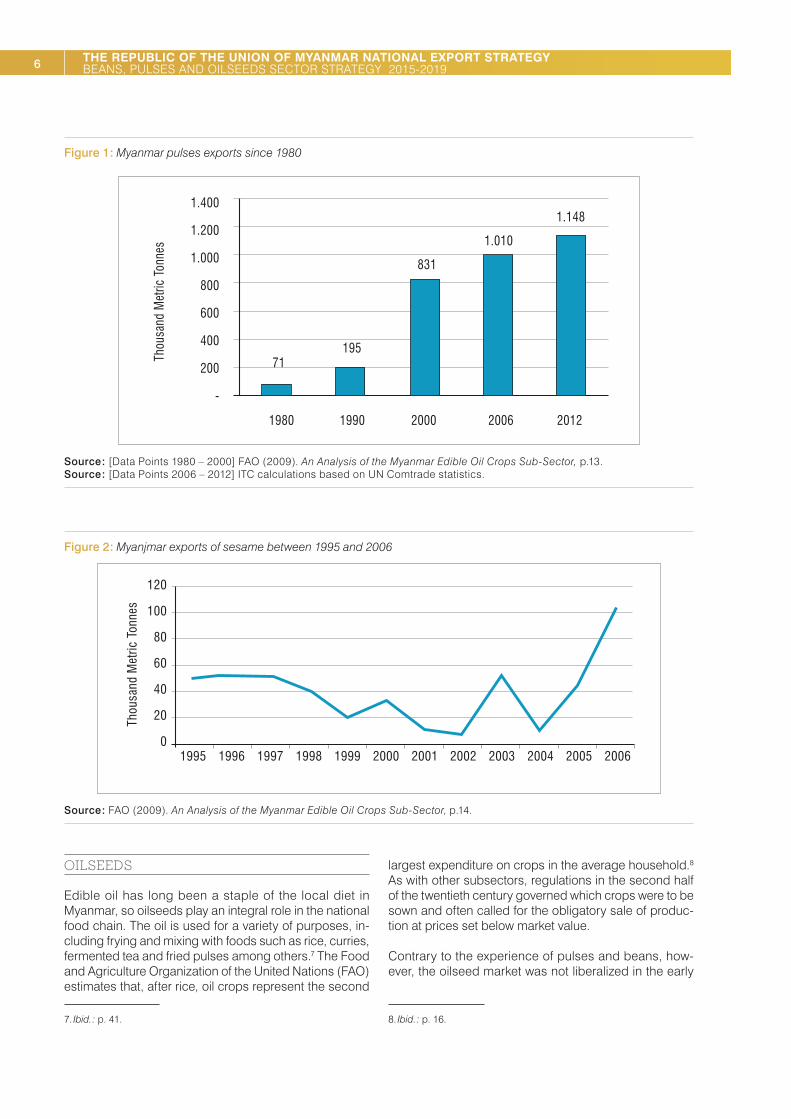
With the introduction of market-oriented policies the trading of pulses and beans was gradually liberalized. Although the government’s Myanmar Agricultural Produce Trading organization continued to be involved, private sector traders began to take on more important roles. A number of developments – including the foundation of the Myanmar Pulses, Beans, and Sesame Seeds Merchants Association ( MPBSMA ) in 1992 and the 1990 establishment of Bayinnaung Market, the only legal whole-sale centre for beans and pulses – contributed to the ad-vancement of private sector participation.5 As illustrated in figure 1, the liberalization of the market has resulted in impressive gains in yields, sown area, production and exports, thereby solidifying the subsector’s importance to Myanmar’s economic development.6
4. Thura Swiss ( August 2013 ). Myanmar’s Beans and Pulses Trade : Risks and Prospects, p. 1.5. Myanmar Pulses, Beans and Sesame Seeds Merchants Association ( 2013 ). Website Available from http : / / www.mpbsma.org / .6. FAO ( 2009 ).An Analysis of the Myanmar Edible Oil Crops Sub-Sector, p.13.
6 THE REPUBLIC OF THE UNION OF MYANMAR NATIONAL EXPORT STRATEGY BEANS, PULSES AND OILSEEDS SECTOR STRATEGY 2015-2019
Figure 1 : Myanmar pulses exports since 1980
1.400
1.200
1.000
800
600
400
200
-
1980
71195
831
1.010
1.148
Thou
sand
Met
ric T
onne
s
1990 2000 2006 2012
Source : [Data Points 1980 – 2000] FAO ( 2009 ). An Analysis of the Myanmar Edible Oil Crops Sub-Sector, p.13. Source : [Data Points 2006 – 2012] ITC calculations based on UN Comtrade statistics.
Figure 2 : Myanjmar exports of sesame between 1995 and 2006
1995
120
Thou
sand
Met
ric T
onne
s 100
80
60
40
20
01996 1997 1998 1999 2000 2001 2002 2003 2004 2005 2006
Source : FAO ( 2009 ). An Analysis of the Myanmar Edible Oil Crops Sub-Sector, p.14.
OILSEEDS
Edible oil has long been a staple of the local diet in Myanmar, so oilseeds play an integral role in the national food chain. The oil is used for a variety of purposes, in-cluding frying and mixing with foods such as rice, curries, fermented tea and fried pulses among others.7 The Food and Agriculture Organization of the United Nations ( FAO ) estimates that, after rice, oil crops represent the second
7. Ibid. : p. 41.
largest expenditure on crops in the average household.8 As with other subsectors, regulations in the second half of the twentieth century governed which crops were to be sown and often called for the obligatory sale of produc-tion at prices set below market value.
Contrary to the experience of pulses and beans, how-ever, the oilseed market was not liberalized in the early
8. Ibid. : p. 16.

7INTRODUCTION
1990s.9 As the reason for continued regulation was that edible oil is a key component of the domestic diet, the government’s two policy objectives for the sector were to ( i ) achieve self-sufficiency in edible oil, and ( ii ) avoid price fluctuations through price controls.10 Through its free mar-ket restrictions, the government sought to ensure that the local population could access adequate supply at stable prices. The cornerstone of this edible oil self-sufficiency strategy was a ban on oilseed exports, which could only be lifted once domestic demand had been met. In its at-tempt to stimulate a low and stable price on the domestic market, however, the government allowed for the import of inexpensive palm oil. This resulted in artificially low prices that discouraged expansions in domestic production.
Developments in the subsector over the last 20 years have therefore been complicated. Sesame exports, for
9. Ibid. : p. 13.10. Ibid. : p. 14.
example, were initially liberalized but then subjected to a new export ban from 1998 to 2006.11
Other restrictions included volume and price controls for palm oil ( lifted ) ;a ban on the import of oilseeds ( lifted ) ; control of oilcake imports and exports ( import restrictions lifted ) ; the prohibition on crude oil imports such as crude palm oil ( remains in force ) ; and a ban on groundnut and oilcake exports.
The edible oil self-sufficiency policy remains in place and its overall effect has been to restrict the growth of capaci-ties in the subsector. The controls and attempts to main-tain stable prices have resulted in depressed returns for domestic producers. This in turn has caused those pro-ducers to reduce the amount of inputs they dedicate to the subsector, there by resulting in reduced crop intensity, stagnant yields and low uptake of capacity-enhancing technologies.12
11. Ibid. : p. 14.12. Ibid. : p. 15.

9WHERE WE ARE NOW
WHERE WE ARE NOW
CURRENT CONTEXTMyanmar boasts an area of 676,577 square kilometres of diverse topography that shares borders with some of Asia’s fastest growing economies.13 Its 2,832 kilometres of coastline taper into roughly 500,000 hectares of coastal mangrove swamps, and the Ayeyarwady and Sittoung riv-ers support a vast delta region.14 While parts of Myanmar’s southern tip are characterized by an equatorial climate, the centre of the country is comprised largely of alluvial lowlands interspersed with forested hills. Reaching an al-titude of over 1,000 metres, this area is known as the ‘dry zone’ for its semi-arid climate and protracted dry season,
13. Republic of the Union of Myanmar Ministry of Hotels and Tourism ( June 2013 ). Myanmar : Tourism Master Plan 2013-2020. Final Draft Report, p. 3.14. FAO ( 2009 ). An Analysis of the Myanmar Edible Oil Crops Sub-Sector, p. 11.
making it one of the more favourable areas for agricultural production. Stretching north of the delta region for roughly 800 kilometres, the dry zone is contained by highlands in the north, east, and west.
As of 2010, agriculture contributed to 32 % of GDP and 17.5 % of export earnings.15 According to the FAO, Myanmar had roughly 12,560,000 hectares ( ha ) of agri-cultural land and 10,790,000ha of arable land in 2011.16 With the exception of cereals, pulse and oilseed cultiva-tion accounts for the most significant portion of agricul-tural activity in Myanmar today. Approximately 4,030,000 and 3,570,000ha of land were sown with pulses and oil-seeds respectively in 2012, representing 32 % and 28 % of total agricultural land.
15. FAO ( 2013 ). Country Profile Myanmar. Available from : http : / / coin.fao.org / cms / world / myanmar / CountryInformation.html16. FAOSTAT.
Figure 3 : Myanmar’s pulse and oilseed production areas ( ha ), 1990–2012
4.500.000
4.000.000
3.500.000
3.000.000
2.500.000
2.000.000
1.500.000
1.000.000
500.000
-
1990
1992
1994
1996
1998
2000
2002
2004
2006
2008
2010
2012
Oilcrops
Pulses
Source : FAOSTAT.

10 THE REPUBLIC OF THE UNION OF MYANMAR NATIONAL EXPORT STRATEGY BEANS, PULSES AND OILSEEDS SECTOR STRATEGY 2015-2019
Figure 4 : Pulses produced by state / region ( 2008 / 2009 )
25%20%15%10%
5%0%
Kayan
Chin
Tanint
haryi
Kachin
Kayin
Mon
Rakhine
Shan (
East)
Shan (
South)
Shan (
North)
Yango
n
Bago (
West)
Bago (
East)
Manda
lay
Magwe
Ayeyarw
ady
Sagain
g
Source : FAO / WFP ( January 2009 ). Special Report : FAO / WFP Crop and Food Security Assessment Mission to Myanmar, p. 16.
Due to the greater degree of liberalization experienced by pulses in the 1990’s, their production has overtaken that of oilseeds.17 Myanmar produces over 20 varieties of pulses and beans that include black-eyed peas, black gram, lab lab bean, lima bean, bamboo bean, garden pea, lima beans, butter beans, chick peas, green gram, cow pea, lentils, red kidney beans, soya beans, sultani beans and pigeon peas.18 Important oilseed crops in-clude sesame, groundnut, mustard, sunflower and niger. Other essential crops for the edible oil sector include soya beans and oil palm.
GEOGRAPHY AND CROP PATTERNS
The three principal agro-climatic zones of Myanmar are leveraged for pulse and bean cultivation.19 Paddy-pulses-paddy patterns dominate the irrigated areas ; the inter-cropping of pigeon peas with sesame, groundnutor other pulse patterns are practised in the dry zone ; and pulses are also grown in the mountain areas. The most impor-tant areas for pulse cultivation are Sagaing, Ayeyarwady, and Magway, which together account for over 58 % of total production.20
The vast majority of oilseeds are grown in the lowland and dry zone region.21 An estimated 82 % of production oc-curs in these areas, where sesame and groundnut are the dominant crops. Another 15 % of oilseeds, including soya bean, groundnut, niger, and mustard, are grown in the hills. The remaining 3.5 % are grown in the coastal region.
17. FAO ( 2009 ). An Analysis of the Myanmar Edible Oil Crops Sub-Sector, p. 13.18. Myanmar Pulses, Beans and Sesame Seeds Merchants Association ( 2013 ).Website.Available from http : / / www.mpbsma.org / .19. FAO / WFP ( January 2009 ). Special Report : FAO / WFP Crop and Food Security Assessment Mission to Myanmar, p. 9.20. Ibid. :p. 16.21. FAO ( 2009 ).An Analysis of the Myanmar Edible Oil Crops Sub-Sector, p. 68.
STRUCTURE AND CAPACITIES
According to the FAO, landless households that have less than one acre of land account for 20 % to 50 % of total households.22 The availability of a large labour source in these smallholders has perpetuated a reliance upon labour-intensive farming and hindered the development of more mechanized processes. Production relies on tra-ditional equipment, manpower and draught animals. As a result, land preparations remain time-consuming and irrigation techniques are poor. Enhanced sector com-petitiveness will require the introduction of modern farm-ing techniques and machinery. Efforts must therefore be made not only to facilitate access to mechanized farm equipment but also to diffuse knowledge regarding its use and best farming practices among sector stakeholders.
22. FAO ( 2009 ).An Analysis of the Myanmar Edible Oil Crops Sub-Sector,p. 76.

11WHERE WE ARE NOW
Box 2 : Agricultural land and cropping patterns in Myanmar 23
YarMye Crops in the lowlands rely upon monsoon rains, late rainfall, and residual moisture in the cold season. Risks are considerable due to the varying degree and distribution of rainfall, leading to a focus on low cost and low yield crops. Cropping patterns are varied according to the three main soil types : ( i ) light texture white soil : generally cultivates one crop of monsoon sesame per year, although 30 % can be used for a second crop ( green or black gram ) ; ( ii ) medium texture yellow / red soil : two crops per year, such as monsoon sesame followed by groundnut or groundnut followed by black gram or sesame, ( iii ) heavier texture dark / black soil : similar to medium soil cropping patterns, but greater yields.The Shan hills benefit from greater and more regular rainfall. Although practices are still sub-optimal, better land preparation and fertilizer use have led to increasing yields. Much of the land, however, remains fallow. Two crop patterns dominate this area : ( i ) three year rotational cultivation followed by 3 to 5 years fallow ( year 1 : monsoon groundnut followed by cool season niger ; year 2 : monsoon corn followed by fallow period ; year 3 : monsoon groundnut )l ( ii ) continuous cultivation ( monsoon groundnut followed by wheat or niger during the cool season, or maize or potato followed by a fallow period ).
Le Mye This is an area of level plain that includes both irrigated and non-irrigated areas. The irrigated areas ( 25 % of agricultural land is irrigated in Myanmar ) can be cultivated all year, and although the land’s high clay content makes it unsuitable for some crops, those that are grown there ( such as sesame ) have produced some of the best margins. Farmers in the non-irrigated area decide what crops to plant late in the season after observing the monsoon rainfall. As a result, this land is generally cultivated only once a year. With adequate rainfall paddy is the preferred crop, while more disappointing monsoon seasons will see farmers switch to pulses such as green gram.In the delta region, paddy is the main crop, and more than half of the land remains fallow in the cold season. Some areas, however, have attractive soil for cool season pulse and oilseed cultivation. Recent years have seen an increase in bean and pulse cultivation at the expense of oilseed cultivation, as farmers seek to capitalize upon opportunities in international markets.
KaingMye Flood recession farming is practiced in the lowlands surrounding the Irrawaddy and Sittoung rivers. High value crops are sewn during the post-monsoon season on the fertile lands. Although groundnut has been a staple of farming in this region, it has been losing ground to the more profitable pulses and beans farmed for export and tobacco and vegetables for the domestic market.
Box 3 : Research and development in Myanmar
The Department of Agricultural Research ( DAR ) under the Ministry of Agriculture and Irrigation ( MoAI ) is the focal point of research and development ( R&D ) for Myanmar’s agricultural sector. DAR’s six divisions engage in research aimed at improving crop production through the enhancement of seed quality, crop management capacities, and crop protection techniques, while at the same time diffusing best practices among producers so that they may optimize farming according to their respective agro-ecological zones. Employing 40 % of Myanmar’s agricultural research staff, DAR accounts for 30 % of research expenditure.Expenditures on agricultural research have nonetheless been stagnant : inflation-adjusted spending on R&D has declined despite an increase in staff through the turn of the century. Moreover, Myanmar’s R&D staff have only a small percentage of postgraduate degree holders. The low salaries associated with the civil service support sector have been insufficient to attract large numbers of qualified researchers. Compounding the issues, the private sector has yet to engage R&D in a meaningful way.
Source : Stads,G.,andKam, P.S.( 2007 ). Myanmar : Agricultural Science and Technology Indicators. ASTI Country Brief No. 38, June.
23. Ibid. : pp. 69-76.
12 THE REPUBLIC OF THE UNION OF MYANMAR NATIONAL EXPORT STRATEGY BEANS, PULSES AND OILSEEDS SECTOR STRATEGY 2015-2019
Box 4 : Crop Exchange Centres
Crop Exchange Centres ( CEXCs ) are voluntary membership associations whose role is to facilitate business transactions, mainly for pulses, beans and oil crops.* While members display samples of their products, buyers negotiate and transaction prices are displayed publicly in order to stimulate a more open and efficient market. Up to 400 copies of price records are sold daily within the premises, information is distributed to marketing centres throughout the country, and traders communicate market information via cell phone and e-trade services. Although the CEXC in Mandalay is the most important, and therefore the price setter, other centres exist in Yangon, Pathein, Monywa, Pakokku, Magway, Myingyan, Pyi, Hinthada, Aunglan, and Taunggyi.These centres also offer dispute resolution services for on-premises transactions. Resolutions are facilitated by a working group investigation, whose analysis may be confirmed or amended by the executive committee. Non-compliance with decisions results in a member’s removal from the association. Despite CEXC involvement in arbitration, as well as Republic of Union of Myanmar Federation of Chambers of Commerce and Industry ( RUMFCCI ) intervention, both the limited knowledge of contractual arrangements and the frequent use of informal agreements make fair conflict resolution difficult to attain.
* Ibid.: pp. 121–122.
Seed production in Myanmar is carried out by DAR at 32 seed farms. 24 DAR produces breeder seeds, while both DAR and the Department of Agriculture ( DoA ) Seed Division produce foundation seed. The DoA-Seed Division then multiplies seed from the foundation seeds, while the DoA-Extension Division distributes these seeds to farmers. Stakeholders note that the quality controls cur-rently in place are insufficient, as seeds are not cleaned, sorted or labelled. Moreover, seed breeding and multi-plication capacities remain largely insufficient to satisfy the national demand for seeds. Although there is some informal importation of seed supplies, most farmers main-tain a low seed replacement rate and mix varieties, which has had a negative impact on yields. Upgrading of seed provision capacities is necessary in order to guarantee an adequate supply of certified seeds, minimize farmer reliance upon farm-saved seeds, and improve production yield and quality.
MARKET INFORMATION
In addition to the CEXCs, the pulses & beans and oil-seeds subsectors rely on other sources of market informa-tion. With the support of the FAO, the government Market Information System collects prices on various crops on a daily or weekly basis depending on location.25 Weekly prices are then distributed to the private sector through local Myanmar Agricultural Services offices and the Agriculture Business News journal. It should be noted, however, that the delays in releasing this price information diminishes its usefulness to the private sector.
24. Ibid. : pp. 85-86.25. Ibid. :p. 125.
The gaps in these services have been partially filled by the private sector, which has been engaging in e-trade since 2003.26 Customers of these services are provid-ed with regular updates of CEXC prices through instant messages to their mobile phones. Information may also be accessed via the e-trade website, http : / / www.etrad-emyanmar.com.mm / . In addition to price information and trends, the service’s roughly 2,000 customers gain access to intelligence on important markets such as the pulse market in Mumbai. Prices for this service vary depending on the level of information desired by a customer, and the instant messaging service is priced between 5,000 and 25,000 kyats per month.
STANDARDS AND QUALITY MANAGEMENT
Myanmar has been slow to adopt an adequate level of weight and measurement standards, and the markets are flush with a wide assortment of measurement sys-tems that vary depending on the commodity type, geog-raphy, and stage of the value chain.27 Some CEXCs have introduced standards, including limits on the amount of foreign matter as well as standards relating to physical characteristics, variety, and origin. Nevertheless, impor-tant factors such as moisture content, protein content, and contamination are not considered. The absence of nationally agreed upon standards diminishes the useful-ness of CEXCs specific standards.
26. Ibid. : p. 125.27. FAO. An Analysis of the Myanmar Edible Oil Crops Sub-Sector. 2009. Pgs. 137-138.
13WHERE WE ARE NOW
Quality standards and food safety control mechanisms are also lacking.28 Those standards that do exist are large-ly voluntary, linked to individual associations, and based on physically observable characteristics. Most proces-sors do not have in-house laboratories to facilitate regular quality controls, and judgments are made based on es-timates or varying clients requirements. Exporters whom are therefore responsible for assuring their products con-form with clients requirements, may be assisted by private certification enterprises such as SGS 46 who help a cli-ent conform a product to the specifications of a contract.
The responsibility of food quality and safety is delegated to the Food and Drug Administration ( FDA ) under the Ministry of Health ( MoH ), who’s Food Quality Control Laboratory ( FQCL ) is able to perform micro and chemi-cal analysis. The FDA uses the FAO / WHO codex as a reference for standards and guidelines, and tests are per-formed every three to six months in the Yangon wholesale markets. It should be noted however that tests are not performed in other cities.29 The FDA performs identifica-tion ( iodine value, fatty acid, saponisation value ), quality ( FFA, peroxide value ), and safety ( moisture, soap content, mineral oils, gas chromatography ) tests.30 Nevertheless, the lack of systematically implemented control systems means that product adulteration is widespread.
The Ministry of Commerce is also involved in quality management, as its Commodity Testing and Quality Management ( CTQM ) laboratory is tasked with testing grains and pulses for chemical composition, pesticides and mycotoxins. Nonetheless, capacities at PTAC are lim-ited, and inadequate equipment is currently reflected in its inability to perform pesticide analyses.31 Under the MOC, the MITS is accredited to ISO 9001-2008 quality manage-ment systems, and it is charged with providing certificates and verifying the quality of imported and exported agricul-tural products through a series of pre-export and import inspections, sampling, testing, and agro-product fumi-gation services.32 It should be noted that MITS does not operate its own laboratory, but instead leverages those of other agencies. MITS inspection parameters are based on international standards, commercial trading requirements and specifications, and Myanmar Agricultural Produce
28. FAO. An Analysis of the Myanmar Edible Oil Crops Sub-Sector. 2009. Pg. 138.29. FAO. An Analysis of the Myanmar Edible Oil Crops Sub-Sector. 2009. Pg. 139.30. FAO. An Analysis of the Myanmar Edible Oil Crops Sub-Sector. 2009. Pg. 139.31. UNIDO ( Myanmar Standards Department ). Myanmar : Strengthening the National Quality Infrastructure for Trade ( Mission Report ). January, 2013. Pg. 14.32. UNIDO ( Myanmar Standards Department ). Myanmar : Strengthening the National Quality Infrastructure for Trade ( Mission Report ). January, 2013. Pgs. 16-17.
Trading / MOC specifications.33 UNIDO was unable to de-termine if MITS certificates are truly required for exported goods or if they are only used as a commercial service by exporters wishing to obtain certification.34
Other government bodies involved in quality management involve the MOAI, which operates a laboratory capable of analyzing pesticides and mycotoxins and providing fumi-gation certificates.35 The MOAI is also responsible for issu-ing Phytosanitary certificates. The Myanmar Scientific and Technological Research Department ( MSTRD ) mean-while maintains a newly renovated laboratory ( National Analytical Laboratory ) with the capacity to test for addi-tives, macro, and micro nutrients in food.36 Government laboratories are further supported by the private Food Industries Development Supporting Laboratory ( FIDSL ), which conducts quality and safety tests on food and wa-ter under the auspices of the Myanmar Food Processors and Exporters Association ( MFPEA ).37
33. UNIDO ( Myanmar Standards Department ). Myanmar : Strengthening the National Quality Infrastructure for Trade ( Mission Report ). January, 2013. Pgs. 16-17.34. UNIDO ( Myanmar Standards Department ). Myanmar : Strengthening the National Quality Infrastructure for Trade ( Mission Report ). January, 2013. Pgs. 16-17.35. UNIDO ( Myanmar Standards Department ). Myanmar : Strengthening the National Quality Infrastructure for Trade ( Mission Report ). January, 2013.36. UNIDO ( Myanmar Standards Department ). Myanmar : Strengthening the National Quality Infrastructure for Trade ( Mission Report ). January, 2013. Pgs. 11-12.37. UNIDO ( Myanmar Standards Department ). Myanmar : Strengthening the National Quality Infrastructure for Trade ( Mission Report ). January, 2013. Pgs. 10-11.
14 THE REPUBLIC OF THE UNION OF MYANMAR NATIONAL EXPORT STRATEGY BEANS, PULSES AND OILSEEDS SECTOR STRATEGY 2015-2019
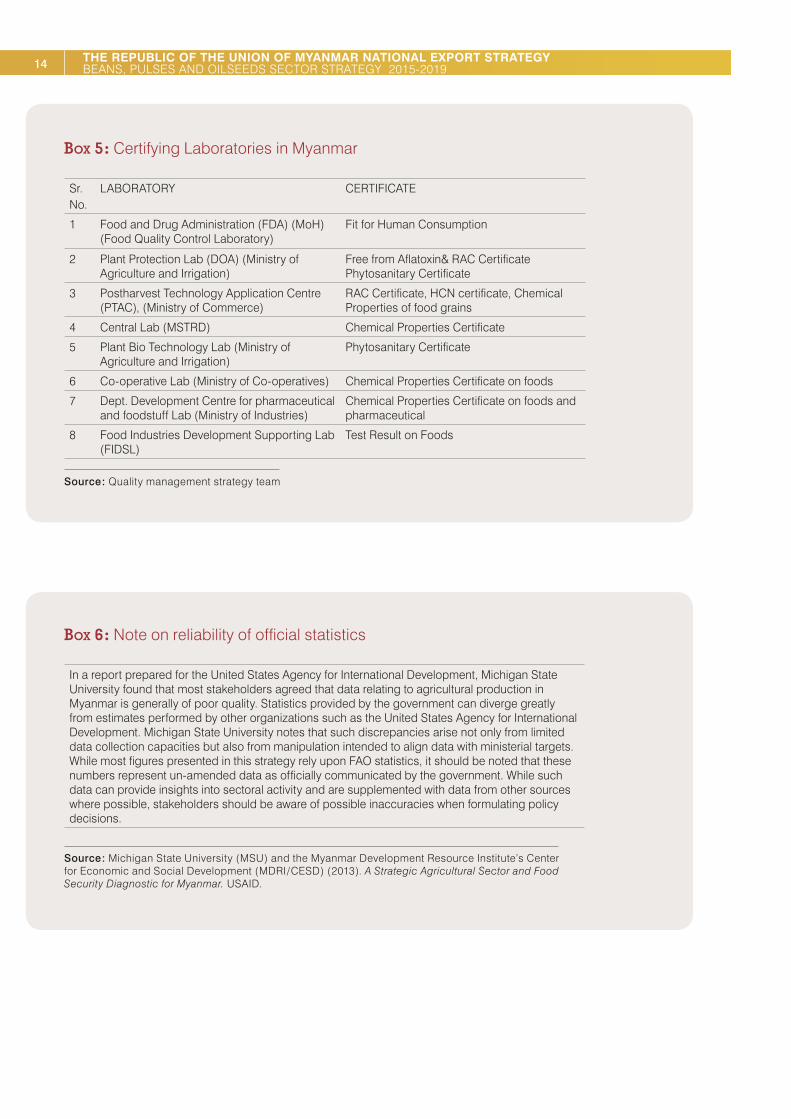
Box 5 : Certifying Laboratories in Myanmar
Sr.No.
LABORATORY CERTIFICATE
1 Food and Drug Administration ( FDA ) ( MoH ) ( Food Quality Control Laboratory )
Fit for Human Consumption
2 Plant Protection Lab ( DOA ) ( Ministry of Agriculture and Irrigation )
Free from Aflatoxin& RAC Certificate Phytosanitary Certificate
3 Postharvest Technology Application Centre ( PTAC ), ( Ministry of Commerce )
RAC Certificate, HCN certificate, Chemical Properties of food grains
4 Central Lab ( MSTRD ) Chemical Properties Certificate
5 Plant Bio Technology Lab ( Ministry of Agriculture and Irrigation )
Phytosanitary Certificate
6 Co-operative Lab ( Ministry of Co-operatives ) Chemical Properties Certificate on foods
7 Dept. Development Centre for pharmaceutical and foodstuff Lab ( Ministry of Industries )
Chemical Properties Certificate on foods and pharmaceutical
8 Food Industries Development Supporting Lab ( FIDSL )
Test Result on Foods
Source : Quality management strategy team
Box 6 : Note on reliability of official statistics
In a report prepared for the United States Agency for International Development, Michigan State University found that most stakeholders agreed that data relating to agricultural production in Myanmar is generally of poor quality. Statistics provided by the government can diverge greatly from estimates performed by other organizations such as the United States Agency for International Development. Michigan State University notes that such discrepancies arise not only from limited data collection capacities but also from manipulation intended to align data with ministerial targets. While most figures presented in this strategy rely upon FAO statistics, it should be noted that these numbers represent un-amended data as officially communicated by the government. While such data can provide insights into sectoral activity and are supplemented with data from other sources where possible, stakeholders should be aware of possible inaccuracies when formulating policy decisions.
Source : Michigan State University ( MSU ) and the Myanmar Development Resource Institute’s Center for Economic and Social Development ( MDRI / CESD ) ( 2013 ). A Strategic Agricultural Sector and Food Security Diagnostic for Myanmar. USAID.

15WHERE WE ARE NOW
Despite the presence of such testing capabilities, im-proved export competitiveness will require enhanced laboratory capacities, especially with regards to food pro-cessing. Although the current level of standards and con-trols has been adequately able to facilitate the domestic market, it has certainly diminished the sector’s ability to expand exports in line with its full potential.
PRODUCTIONBEANS AND PULSES
Cultivation of beans and pulses is seasonal and gener-ally concentrated in the winter months.38 By beginning in November, growers can make use of the residual mois-ture left in the ground following the sowing of rice crops. The three to four month cultivation period for these crops is short when compared with that of others such as rice. As a result, winter crops planted in November can be harvested in January, while later batches are generally harvested in February and March.
As one of the largest cultivators of beans and pulses in the world, Myanmar harvested roughly 5.3 million tons of crops in 2012.39 This represents a staggering 221 % increase with respect to the production values at the turn of the millennium. Of note is the fact that this growth is the result of both significant gains in yield as well as an ex-
38. Thura Swiss ( August 2013 ). Myanmar’s Beans and Pulses Trade : Risks and Prospects, p. 2.39. FAOSTAT.
panded portion of arable land that is dedicated to beans and pulses.
Yields increased by 87 % during this period, reaching 13,237 hectograms / hectare, while the area of land culti-vated with beans and pulses increased by 72 %, reaching 4,030,000ha. Both of these developments, together with the eventual expansion of the sector, were stimulated by the liberalization of the market. As more resources were dedicated to the subsector farmers were able to increase yields. The heightened yields would have provided even more incentive to dedicate further land to bean and pulse cultivation.
With respect to capacities, it should be noted that the yield of 13,237 hg / ha achieved by the subsector in Myanmar is significantly above the world average ( 9,077 hg / ha ). Moreover, it remains higher than the average realized by Southeastern Asia ( 12,469 hg / ha ). As illustrated in fig-ure 6, Myanmar’s dramatic improvement is not simply a matter of catching up. Although average yields were sig-nificantly below world levels in 2000, Myanmar’s farmers have succeeded in continuously improving results while world yields have remained relatively flat.
Sectoral production over the last five years has been led by dry beans ( black gram and green gram ) and pigeon peas.
As detailed in table 1, Myanmar enjoys a comparatively attractive yield for all of its most important varieties of pulses, including dry beans and pigeon peas.
Figure 5 : Production trends for beans and pulses in Myanmar 2000-2012
6.000.000 14.000
Area (ha) [lhs]
Production (tons) [lhs]
Yield (hg/ha) [rhs]
12.000
10.000
8.000
6.000
2.000
0
5.000.000
4.000.000
3.000.000
2.000.000
1.000.000
0
2000
2001
2002
2003
2004
2005
2006
2007
2008
2009
2010
2011
2012
Source : FAOSTAT.

16 THE REPUBLIC OF THE UNION OF MYANMAR NATIONAL EXPORT STRATEGY BEANS, PULSES AND OILSEEDS SECTOR STRATEGY 2015-2019
Figure 6 : Trends in yield of beans and pulses production( hg / ha ), 2000-2012
14.000
13.000
12.000
11.000
10.000
9.000
8.000
7.000
6.000
5.000
2000
2001
2002
2003
2004
2005
2006
2007
2008
2009
2010
2011
2012
South-Eastern AsiaMyanmarWord
Source : FAOSTAT.
Figure 7 : Production of pulses in Myanmar ( tons ), 2007-2012
4.000.000
3.500.000
3.000.000
2.500.000
2.000.000
1.500.000
1.000.000
500.000
02007
2814000
329700
150400
2200
55900
645000
Beans, dry
Chick peas
Cow peas, dry
Lentils
Peas, dry
Pigeon peas
2008
3218000
347900
175900
1500
59800
719000
2009
3375000
403947
212612
1469
57500
765000
2010
3000000
441493
214789
1708
61000
772999
2011
3721919
473102
172836
1403
65000
848823
2012
37211919
473102
172836
1403
66000
9000000
Tons
Source : FAOSTAT.

17WHERE WE ARE NOW
Table 1 : Comparative yields ( hg / ha ) ( 2012 )
Myanmar Southeast Asia
Yield relative to Southeast
AsiaWorld Yield relative
to the world
Organisation for Economic Cooperation
and Development
( OECD )
Yield relative to OECD
Beans,dry 13079.38 12355.30 5.9 % 8040.30 63.0 % 12452.11 5.0 %
Chick peas 14205.05 14205.05 0.0 % 9311.67 53.0 % 14528.67 -2.2 %
Cow peas,dry
11718.49 11752.06 -0.3 % 5368.16 118.0 % 18657.53 -37.2 %
Lentils 7985.20 7985.20 0.0 % 10707.42 -25.0 % 16056.25 -50.3 %
Peas, dry 12571.43 12571.38 0.0 % 15586.78 -19.0 % 23262.30 -46.0 %
Pigeon peas 13846.15 13848.22 0.0 % 8132.16 70.0 % n.a. n.a.
Pulsesn.e.s. 13237.42 9576.40 38.2 % 8553.96 55.0 % 18120.68 -26.9 %
Source : FAOSTAT. * OECD yields calculated by ITC from FAOSTAT data.
Much of the demand in this subsector is domestic, as pulses are consumed almost daily in most areas of Myanmar. Although in general this has led to a much larg-er portion of production being sold locally rather than ex-ported ( roughly 1 million tons exported out of 5.5 million tons produced ), certain varieties of pulses are cultivated almost exclusively for export.40, 41
Pulses in Myanmar are produced in three quality grades : first quality, special quality, and fair average quality.42 While most fair average quality exports are destined for India, the higher quality production is sent to more de-manding markets such as China, the Republic of Korea and Japan.
BEAN AND PULSE PROCESSING
The processing of beans and pulses requires two steps.43 The first is to receive, clean and sort the quality of seeds. Only then can processors continue with secondary pro-cessing. This involves preparing the goods for consump-tion and may consist of dry packaging, canning, soup production, powder production, and flour production. Myanmar’s domestic processing capacities are limited, however, and beans and pulses generally only undergo primary processing and perhaps dry packaging. In fact, only 5 % to 10 % of beans and pulses are subject to any processing whatsoever.44
40. FAO / WFP ( January 2009 ). Special Report : FAO / WFP Crop and Food Security Assessment Mission to Myanmar, p. 18.41. Thura Swiss ( August 2013 ). Myanmar’s Beans and Pulses Trade : Risks and Prospects, p. 1.42. Ibid. : pp. 1–2.43. Ibid. : p. 5.44. Ibid. : p. 5.
Processing companies and large wholesalers have been eager to implement technological upgrades that reduce labour costs. As a result, these enterprises have access to modern sorting machinery and factories. Nevertheless, a lack of capacities in identifying appropriate markets has resulted in an underutilization of this equipment.45 Cleaning and sorting is also sometimes performed direct-ly by farmers. However, the lack of assistance and funds to farmers means that they rely upon inadequate equip-ment and have been slow to upgrade their capacities. As a result, raw crops are often sold directly to the traders without undergoing any type of processing, leading to a lower onward selling price.
PULSES PRODUCT MAP
Myanmar’s enterprises are currently engaged in selling bagged whole and split pulses and producing animal feeds and ground pulse flours. They are also partially in-volved in prepared extruded pulses such as pastas and meat substitutes. Nevertheless, a number of product de-velopments remain unexploited. They are not involved in the further processing of ground pulses to create special-ty dough mixes, nor do they process fractionated pulses into starches and proteins. Another overlooked product category is that of whole processed pulses. These include canned, micronized and toasted pulses, and they may be processed even further into a wide variety of products including dried soup mixes, canned soups, canned re-fried beans, canned curries, canned chilies, retort pouch packaged entrees, frozen entrées and snack mixes. As a result, a multitude of opportunities exist for enterprises to grow the sector through product development and value addition.
45. NES second consultation.

18 THE REPUBLIC OF THE UNION OF MYANMAR NATIONAL EXPORT STRATEGY BEANS, PULSES AND OILSEEDS SECTOR STRATEGY 2015-2019
Figure 8 : Pulses and beans product map
Animal feeds
Legend: Green = Produced nationallyYellow = Small scale productionRed= No production
Ground pulsesflours
Bagged pulses -whole and split pulses
Products of groundpulsespappadums androtis, specialtydough mixes
Products of processed pusesdried soup mixes,canned soups,canned refriedbeans, cannedcurries, cannedchilies, retor t pouchpackaged entrees,frozen entrees,snack mixes
Whole processedpulsescanned pulses,micronized pulsestoasted pulses
Extruded pulsespastas, meatsubstitutes
Fractionated pulsesstarches andproteins
Source : MPBSMA, NES consultation.
Figure 9 : Trends in Myanmar oilseed production 2000–2012
5.000.000
4.500.000
4.000.000
3.500.000
3.000.000
2.500.000
2.000.000
1.500.000
1.000.000
500.000
0
3.500
3.000
2.500
2.000
1.500
1.000
500
0
2000
2001
2002
2003
2004
2005
2006
2007
2008
2009
2010
2011
2012
Area (ha) [lhs]
Production (tons) [lhs]
Yield (hg/ha) [rhs]
Source : FAOSTAT.

19WHERE WE ARE NOW
Table 2 : Comparative yields of oilseeds( hg / ha ) ( 2012 )
Myanmar Southeast Asia Yield relative to Southeast Asia
World Yield relative to the world
OECD Yield relative to OECD
Coconuts 101176.47 52372.16 93 % 49976.16 102 % 63253.01 60 %
Groundnuts, with shell
15585.23 15333.87 2 % 16758.98 -7 % 43512.70 -64 %
Mustard seed 8662.42 8662.42 0 % 8150.36 6 % 9424.27 -8 %
Seed cotton 13500.00 13082.17 3 % 22318.28 -40 % 29306.73 -54 %
Sesame seed 3949.04 4248.08 -7 % 5175.55 -24 % 6148.00 -36 %
Soya beans 12275.45 14870.73 -17 % 23740.82 -48 % 26656.83 -54 %
Sunflower seed 6481.48 6572.44 -1 % 14823.15 -56 % 18000.38 -64 %
Oilcrops,primary + ( total )
2743.29 23637.68 -88 % 6385.26 -57 % 5779.34 -53 %
Source : FAOSTAT. * OECD yields calculated by ITC from FAOSTATdata.
Figure 10 : Area harvested, select oilseeds in Myanmar, 2007–2012
1.800.000
1.600.000
1.400.000
1.200.000
1.000.000
800.000
600.000
400.000
200.000
-2007
755.500
75.000
1.367.000
585.000
Groundnuts, with shell
Mustard seed
Sesame seed
Sunflower seed
2008
815.000
92.000
1.431.000
881.150
2009
844.267
97.807
1.569.179
881.150
2010
866.499
99.859
1.632.363
882.940
2011
887.034
71.745
1.594.051
543.112
2012
880.000
78.500
1.570.000
540.000
Area
Har
vest
ed (H
a)
Source : FAOSTAT.
20 THE REPUBLIC OF THE UNION OF MYANMAR NATIONAL EXPORT STRATEGY BEANS, PULSES AND OILSEEDS SECTOR STRATEGY 2015-2019
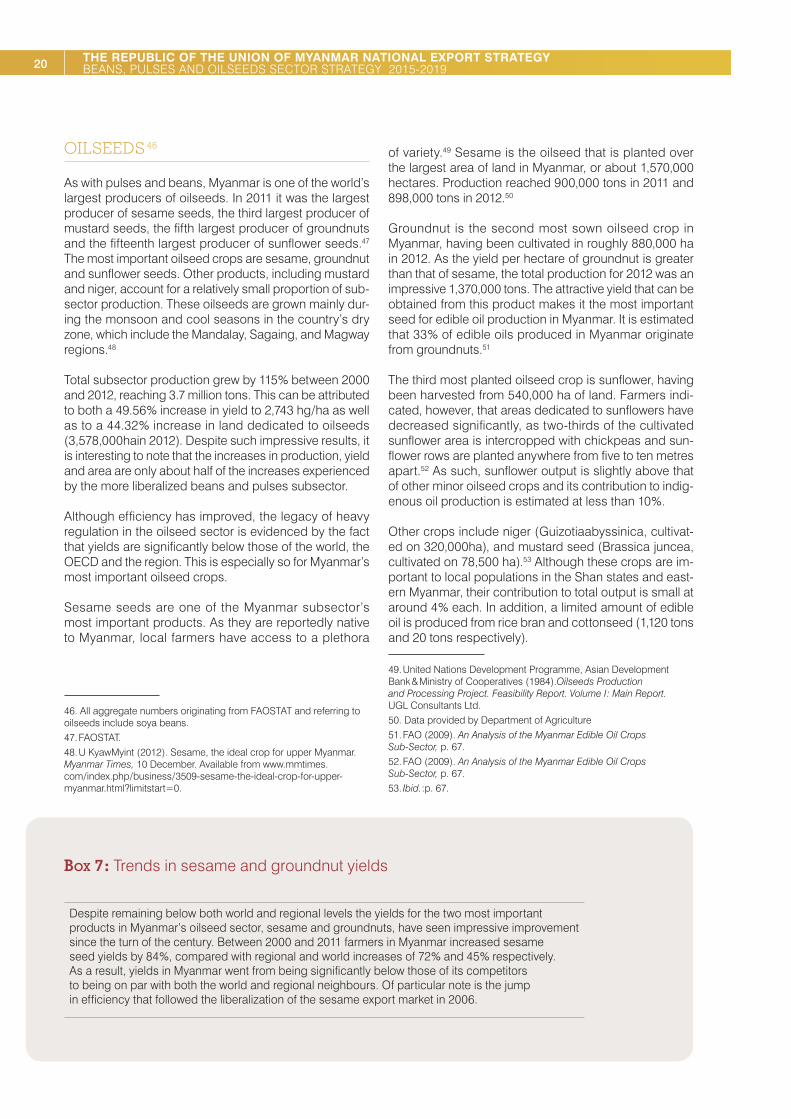
OILSEEDS 46
As with pulses and beans, Myanmar is one of the world’s largest producers of oilseeds. In 2011 it was the largest producer of sesame seeds, the third largest producer of mustard seeds, the fifth largest producer of groundnuts and the fifteenth largest producer of sunflower seeds.47 The most important oilseed crops are sesame, groundnut and sunflower seeds. Other products, including mustard and niger, account for a relatively small proportion of sub-sector production. These oilseeds are grown mainly dur-ing the monsoon and cool seasons in the country’s dry zone, which include the Mandalay, Sagaing, and Magway regions.48
Total subsector production grew by 115 % between 2000 and 2012, reaching 3.7 million tons. This can be attributed to both a 49.56 % increase in yield to 2,743 hg / ha as well as to a 44.32 % increase in land dedicated to oilseeds ( 3,578,000hain 2012 ). Despite such impressive results, it is interesting to note that the increases in production, yield and area are only about half of the increases experienced by the more liberalized beans and pulses subsector.
Although efficiency has improved, the legacy of heavy regulation in the oilseed sector is evidenced by the fact that yields are significantly below those of the world, the OECD and the region. This is especially so for Myanmar’s most important oilseed crops.
Sesame seeds are one of the Myanmar subsector’s most important products. As they are reportedly native to Myanmar, local farmers have access to a plethora
46. All aggregate numbers originating from FAOSTAT and referring to oilseeds include soya beans.47. FAOSTAT.48. U KyawMyint ( 2012 ). Sesame, the ideal crop for upper Myanmar. Myanmar Times, 10 December. Available from www.mmtimes.com / index.php / business / 3509-sesame-the-ideal-crop-for-upper-myanmar.html?limitstart=0.
of variety.49 Sesame is the oilseed that is planted over the largest area of land in Myanmar, or about 1,570,000 hectares. Production reached 900,000 tons in 2011 and 898,000 tons in 2012.50
Groundnut is the second most sown oilseed crop in Myanmar, having been cultivated in roughly 880,000 ha in 2012. As the yield per hectare of groundnut is greater than that of sesame, the total production for 2012 was an impressive 1,370,000 tons. The attractive yield that can be obtained from this product makes it the most important seed for edible oil production in Myanmar. It is estimated that 33 % of edible oils produced in Myanmar originate from groundnuts.51
The third most planted oilseed crop is sunflower, having been harvested from 540,000 ha of land. Farmers indi-cated, however, that areas dedicated to sunflowers have decreased significantly, as two-thirds of the cultivated sunflower area is intercropped with chickpeas and sun-flower rows are planted anywhere from five to ten metres apart.52 As such, sunflower output is slightly above that of other minor oilseed crops and its contribution to indig-enous oil production is estimated at less than 10 %.
Other crops include niger ( Guizotiaabyssinica, cultivat-ed on 320,000ha ), and mustard seed ( Brassica juncea, cultivated on 78,500 ha ).53 Although these crops are im-portant to local populations in the Shan states and east-ern Myanmar, their contribution to total output is small at around 4 % each. In addition, a limited amount of edible oil is produced from rice bran and cottonseed ( 1,120 tons and 20 tons respectively ).
49. United Nations Development Programme, Asian Development Bank & Ministry of Cooperatives ( 1984 ).Oilseeds Production and Processing Project. Feasibility Report. Volume I : Main Report. UGL Consultants Ltd.50. Data provided by Department of Agriculture51. FAO ( 2009 ). An Analysis of the Myanmar Edible Oil Crops Sub-Sector, p. 67.52. FAO ( 2009 ). An Analysis of the Myanmar Edible Oil Crops Sub-Sector, p. 67.53. Ibid. :p. 67.
Box 7 : Trends in sesame and groundnut yields
Despite remaining below both world and regional levels the yields for the two most important products in Myanmar’s oilseed sector, sesame and groundnuts, have seen impressive improvement since the turn of the century. Between 2000 and 2011 farmers in Myanmar increased sesame seed yields by 84 %, compared with regional and world increases of 72 % and 45 % respectively. As a result, yields in Myanmar went from being significantly below those of its competitors to being on par with both the world and regional neighbours. Of particular note is the jump in efficiency that followed the liberalization of the sesame export market in 2006.

21WHERE WE ARE NOW
Figure 11 : Trends in sesame seed yields ( hg / ha ) 2000–2011
7.000,00
6.000,00
5.000,00
4.000,00
3.000,00
2.000,00
South-Eastern Asia
World
Myanmar
2000
2002
2004
2006
2008
2010
Source : FAOSTAT.
Advancements in groundnut yields were equally impressive. While global yields remained relative-ly flat, Myanmar’s farmers succeeded in increasing groundnut yields by nearly 38 % between 2000 and 2013. Yields in Myanmar are currently higher than the regional average and only slightly below the world average.
Figure 12 : Trends in groundnut yields ( hg / ha ) 2000–2012
20.000,00
18.000,00
16.000,00
14.000,00
12.000,00
10.000,00
8.000,00
South-Eastern Asia
World
Myanmar
2000
2002
2004
2006
2008
2010
2012
Source : FAOSTAT.

22 THE REPUBLIC OF THE UNION OF MYANMAR NATIONAL EXPORT STRATEGY BEANS, PULSES AND OILSEEDS SECTOR STRATEGY 2015-2019
Figure 13 : Oilseed production in Myanmar 2007–2012
1.600.000
1.400.000
1.200.000
1.000.000
800.000
600.000
400.000
200.000
-2007
1.087.900
57.200
780.520
494.000
Groundnuts, with shell
Mustard seed
Sesame seed
Sunflower seed
2008
1.202.200
66.300
840.000
692.000
2009
1.304.829
84.344
853.393
779.725
2010
1.362.452
86.547
867.765
782.226
2011
1.399.625
61.647
901.230
489.653
2012
1.371.500
68.000
620.000
350.000
Prod
uctio
n (T
ons)
Source : FAOSTAT.
Box 8 : Important oilseed crops
Ses
ame Sesame seeds are generally either pressed for oil or else eaten whole.* Their distinctive flavour has made them
a staple ingredient in Eastern cooking and their popularity has been further boosted by their perceived health benefits in conjunction with an increased awareness of healthy habits. They are also used as key components of livestock and fish feed.**
Gro
undn
ut
Groundnut can be used as seed, as a prepared food ( flavoured, etc. ), to produce peanut butter and pastes, snacks and sweets, or crushed for oil and meal.*** Recent years, however, have seen a decrease in the share of groundnut that is crushed for oil and meal. This development is a result of increasingly available and lower fat vegetable oil alternatives such as soya bean and palm oil. Although groundnut oil is also facing increased competition from cereal-based products, groundnuts have found a resurgence in popularity as either a prepared food or as an ingredient in snacks. This is especially so in developed countries and emerging Asian economies.
Sun
flow
er Sunflower products have become increasingly popular in recent years. As with other seeds, they may be eaten directly or else processed for oil. Their perceived relative health benefits, and the light taste of sunflower seed oil, have contributed to their growing popularity among consumers. The leftover oilcake is also a popular livestock feed and the shells can be used for biofuel.
Mus
tard Mustard seeds are a popular component of food worldwide, being used as ingredients in meats, condiments,
and sausages.º The seeds are also ground into oil. The strong taste of mustard seed oil and concerns over health effects have hampered the growth of edible mustard oil in relation to other alternatives.
Nig
er Niger seeds produce an edible oil that has a wide range of uses.ºº It is used in foods, for frying, in soaps, and in paints. Moreover, it is a component of livestock feed and one of the most popular ingredients in bird feed.
Soy
a be
ans Soya beans are used for a variety of commercial purposes. Aside from being the main ingredient in food products
such as soy sauce, miso, soy milk and bean sprouts, soya bean products are also one of the primary ingredients in livestock feed. The growing popularity of Eastern cuisine in Western nations has only increased demand for soy products in recent years. Although originally used mainly for food, advances in oil extraction technologies spurred demand for soya bean oil that has been growing rapidly ever since.
*Ibid.: pp. 30-32. **U Kyaw Myint ( 2012 ). Sesame, the ideal crop for upper Myanmar. Myanmar Times, 10 December. Available from: www.mmtimes.com / index.php / business / 3509-sesame-the-ideal-crop-for-upper-myanmar.html?limitstart=0. ***FAO ( 2009 ).An Analysis of the Myanmar Edible Oil Crops Sub-Sector, pp. 26-27.
° Simon, J. E., Chadwick, A.F. and Craker, L.E. ( 1984 ). Herbs: An Indexed Bibliography. 1971-1980. The Scientific Literature on Selected Herbs, and Aromatic and Medicinal Plants of the Temperate Zone. Archon Books, Hamden, CT. Available from: www.hort.purdue.edu / newcrop / med-aro / factsheets / MUSTARD.html. °° Duke, J. A. ( 1983 ). Handbook of Energy Crops( unpublished ). Available from: www.hort.purdue.edu / newcrop / duke_energy / Guizotia_abyssinica.html.
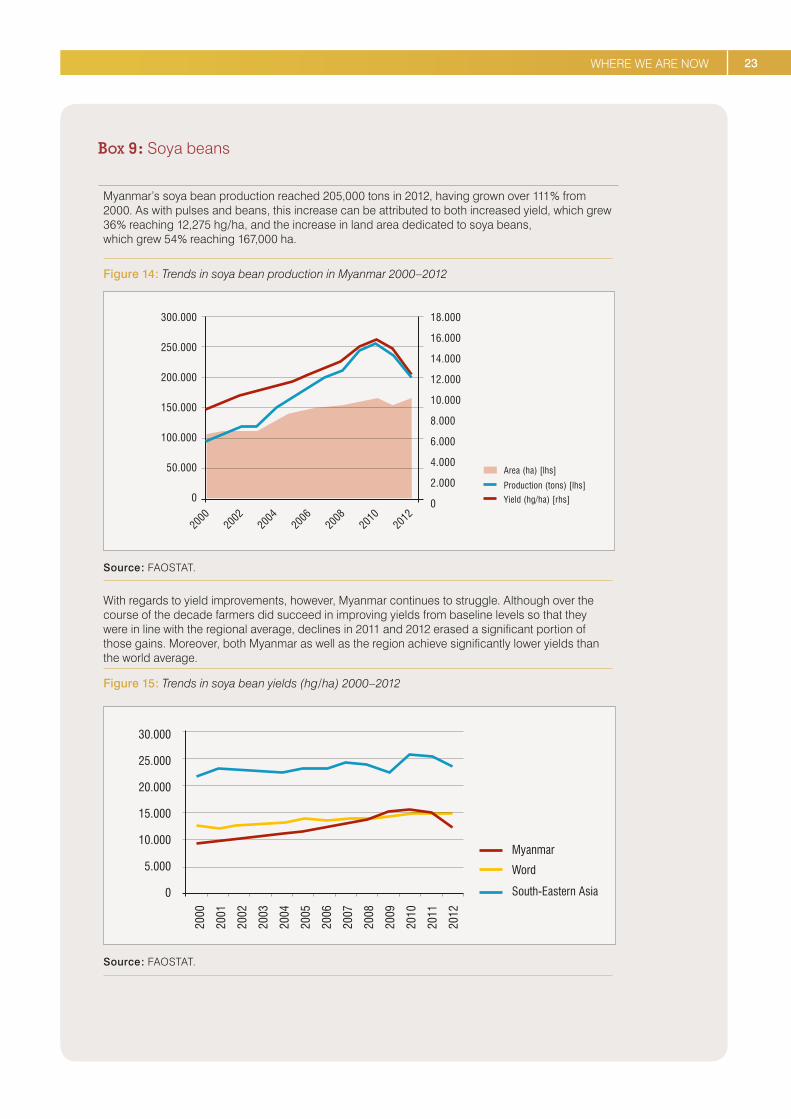
23WHERE WE ARE NOW
Box 9 : Soya beans
Myanmar’s soya bean production reached 205,000 tons in 2012, having grown over 111 % from 2000. As with pulses and beans, this increase can be attributed to both increased yield, which grew 36 % reaching 12,275 hg / ha, and the increase in land area dedicated to soya beans, which grew 54 % reaching 167,000 ha.
Figure 14 : Trends in soya bean production in Myanmar 2000–2012
300.000
250.000
200.000
150.000
100.000
50.000
0
18.000
16.000
14.000
12.000
10.000
8.000
6.000
4.000
2.000
0
2000
2002
2004
2006
2008
2010
2012
Area (ha) [lhs]
Production (tons) [lhs]
Yield (hg/ha) [rhs]
Source : FAOSTAT.
With regards to yield improvements, however, Myanmar continues to struggle. Although over the course of the decade farmers did succeed in improving yields from baseline levels so that they were in line with the regional average, declines in 2011 and 2012 erased a significant portion of those gains. Moreover, both Myanmar as well as the region achieve significantly lower yields than the world average.
Figure 15 : Trends in soya bean yields ( hg / ha ) 2000–2012
30.000
25.000
20.000
15.000
10.000
5.000
0
2000
2001
2002
2003
2004
2005
2006
2007
2008
2009
2010
2011
2012
South-Eastern Asia
Myanmar
Word
Source : FAOSTAT.

24 THE REPUBLIC OF THE UNION OF MYANMAR NATIONAL EXPORT STRATEGY BEANS, PULSES AND OILSEEDS SECTOR STRATEGY 2015-2019
There are currently 20 varieties of soya bean being cultivated in Myanmar, of which eight have been released by DoA. DoA estimates that approximately 70 % of total soya bean areas are cultivated with local varieties, while the remaining 30 % make use of improved varieties.
Figure 16 : Soya beanproduct map
Animal feedsOil of
Soybeans
Soya Saucefermented soya
product
SOYBEANS
Soya PasteA fermented, salty
condiment
Soya Curd fermentedor not-fermented
Legend: Green = Produced nationallyYellow = Small scale productionRed= No production
Enterprises in Myanmar currently exploit a wide range of products within the soya bean subsector. As such, they engage in the production of animal feeds, soya bean oil, soy sauce, soy paste, and soy curd.
Box 10 : Palm oil
Palm oil is the most used edible oil in Myanmar, accounting for nearly 60 % of oil consumption.* Nevertheless, the population relies on imports for an estimated 90 % of supply : 80 % is officially imported and 20 % is unofficially imported from Thailand and China. It should be noted that reliance upon informal imports increases drastically in certain regions. In the Thai border region, for example, informally imported oil accounts for nearly 80 % of consumption.The remaining 10 % of palm oil consumption is produced locally. Cultivation is centred in Tanintharyi region and Mon state. 50,000 acres of an eventual 200,000 acre area were cultivated in 2006 / 2007.** Domestic palm oil production at that time accounted for 7.5 % of edible oil consumption, and this share is expected to reach nearly 30 % once the planted 200,000 acres are put to use by 2015 / 2016.
* FAO (2009). An Analysis of the Myanmar Edible Oil Crops Sub-Sector, p. 50. ** Ibid.: p. 67.

25WHERE WE ARE NOW
OIL PROCESSING
Based on average crushing capacities, the FAO calcu-lates that the total milling capacity for edible oilseed crops is 1.7 million tons.54 This is more than twice the amount of domestic oilseed crops used for crushing ( 766,500 tons ). As existing capacity exceeds the availability of seeds, many mills have stopped operations altogether. Moreover, those that are still online only operate from five to six months out of the year, and even then only when grid electricity is available. The latest information received from MPBSMA indicates that actual edible oil production in 2012 was approximately 300,000 tons.
It is estimated that only 20 % of the 3,600 registered oil mills in Myanmar are operational.55 These include small and medium – and large – scale millers. The greatest con-centrations of mills can be found in the central and south-central regions of the country. The large availability of existing oil mills with processing capacity could be used to increase production of edible oil for national consump-tion and exports if imports of oilseeds were increased.
It should be noted that technological sophistication and hygienic standards in oil milling tend to be low, although some mills contain modern imported equipment. Millers of edible oil have been relatively uninterested in quality im-provements. Because price is the main concern they have been content to use poor quality seeds and contaminated materials such as recycled containers.
The growing demand for livestock feed, however, has be-gun to put pressure on millers to produce higher qual-ity oilcake. Millers are therefore beginning to implement greater quality controls, and analyses are performed by the Ministry of Livestock, Fisheries and Rural Development
54. Ibid. : p. 102.55. Ibid. : p. 101.
on demand from the private sector.56 While some feed millers are also equipped with testing equipment, expand-ed use of these tests is constrained by the high costs associated with imported lab chemicals. More frequent tests for moisture, oil, protein and fibre content would help facilitate negotiations between oil and feed millers.
The demand for oilcake has been increasing in tandem with the growing livestock and fishery sectors, which rely upon oilcake as a key ingredient for feed. A number of marketing and distribution dynamics exist according to the type of mill at which the cake is produced. At the lo-cal level, small-scale mills and farmers using traditional hsi-zone mills will produce cake either for their own use or to sell to nearby farmers. Medium-scale mills will sell the cake directly to local wholesale markets or else to a CEXC in Mandalay or Yangon. Although large-scale mills sell the majority of their oilcake to feed mills, they will also sell it to wholesale markets or CEXCs. The development of the oilseed sector can be achieved through the development of the oilcake market since this product is in high demand from the livestock and fisheries sector.
PRODUCT MAP
Enterprises operating in Myanmar’s oilseed subsector are engaged in the majority of sector products. They are involved in the production of roasted seeds, vegetable oils, flour, and flour-derived flakes. They also produce press cakes that are high in protein and nutrients, which they then process into both solid and liquid fertilizer as well as stock feed. Nonetheless, opportunities still exist for further product development. Specifically, enterprises are currently not engaged in the production of vegetable paste and butter.
56. Ibid. : p. 142.
Figure 17 : Oilseed product map
Press cakeHigh in proteinand nutriments
Vegetable Oils
Stock feedAlternative tolegumes
Oil seeds
FertiliserSolid of liquid
Vegetablepaste/butter
Roasted seeds Flour
Flakes
Legend: Green = Produced nationallyYellow = Small scale productionRed= No production

26 THE REPUBLIC OF THE UNION OF MYANMAR NATIONAL EXPORT STRATEGY BEANS, PULSES AND OILSEEDS SECTOR STRATEGY 2015-2019
SOCIAL IMPACTAccording to the World Bank, 67 % of Myanmar’s popu-lation lives in rural areas.57 Although specific figures for subsectors are difficult to come by, the agricultural sector as a whole accounts for 61.2 % of the total labour force.58 Extrapolation of the pulse, bean, and oilseed subsector’s share of employment based on land area dedicated to these crops would imply that they could account for nearly 37 % of national employment.59
Due to the rural nature of the sector, increased competi-tiveness would have a substantial effect on remote and vulnerable communities, thereby guaranteeing that the benefits of socioeconomic development are shared by all segments of society. Sector expansion would stimu-late better employment opportunities for large swathes of the rural population, providing much-needed income that could be used to meet basic needs and invest in ca-pacity upgrading.
57. World Bank DataBank ( 2012 ). Available from : http : / / databank.worldbank.org / data / home.aspx.58. FAO ( 2013 ). Country Profile Myanmar.Available from: http : / / coin.fao.org / cms / world / myanmar / CountryInformation.html.59. ITC calculations.
Myanmar’s reliance on these subsectors for both income and food makes the population especially vulnerable to unexpected negative events. From an economic stand-point, increased capacities would permit the sector to cope better with unforeseen developments, whether they are economic or environmental. This should mitigate the risk of losing large portions of both national income and food supply in the event that the risks are realized. From a health perspective, these two subsectors comprise a large portion of the national diet. Increased quality man-agement capacities for these staple foods would improve health and decrease risks of illness.
VALUE CHAIN OPERATIONSThe pulses &beans and oilseeds value chains involve the participation of a wide range of both national and international agents. Production, collection, processing, marketing, and distribution are carried out by an array of stakeholders that range from individual entrepreneurs to large wholesalers and exporters. These stakeholders are then aided by both private and public sector support insti-tutions. While the value chain survey seeks to illustrate the role of each of these participants in producing and bring-ing sector products to the market, the analysis is further detailed in the trade support network analysis and four gears sections of this strategy document.

27WHERE WE ARE NOW
Fig
ure
18 : C
urre
nt o
ilsee
ds v
alue
cha
in
Nat
iona
l com
pone
nt
Seed
s
Fert
ilize
rs
Pest
icid
e
Farm
equi
pmen
t
Farm
prep
arat
ion
Plan
ting
Wee
ding
Har
vest
Post
-ha
rves
tSt
orag
e
Stor
age
Colle
ctor
s
Oils
eeds
exp
orts
(hul
led
and
dehu
lled)
Smal
l pro
cess
ing
units
(roa
stin
g,pi
cklin
g,po
wde
ring)
Who
lesa
lers
Loca
lm
arke
t
Expo
rter
sCh
ina
and
Taip
ei
Loca
l mar
ket f
oran
imal
feed
Who
lesa
lers
Who
lesa
lers
Feed
Mill
ers
Loca
l mar
ket f
ored
ible
oils
(300
.000
tons
)Expo
rter
s
Impo
rter
/W
hole
sale
rsRe
tail
Roas
ter/
pack
er
Chin
a
Oil
Mill
s
Expo
rter
s(p
owde
r)(1
2000
tons
)
Oil
mill
s(~
3600
regi
ster
ed)
(onl
y 20
% in
op
erat
ion)
Agen
ts
Farm
pro
duct
ion
Colle
ctio
nO
il se
eds
Oil
cake
Prim
ary
Supp
ortin
g Se
rvic
es
Labo
ur
Land
Wat
er
MoE
nerg
y
MoA
I-AM
D
MoA
I-PPD
MoA
I-DoA
MoA
I-DAR
MoA
I-WR
UD
MoA
I-AED
MoC
oops
MoF
MST
RD
UMFC
CI
MPB
SMA
Mya
nmar
Indu
stry
Ass.
MoI
-DSI
MoC
-DoT
P
MoC
-DoT
MoC
-DCC
A
MCT
A&M
HTA
MoF
A
Insu
ranc
e co
mpa
nies
MoH
-FD
A
Regi
onal
cro
pex
chan
ge c
entre
s
MoA
I-irr
igat
ion
Labo
rato
ries
- Q
ualit
y te
stin
g
Bank
s -
Fina
ncia
l ser
vice
s
Tech
nica
l and
mai
nten
ance
ser
vice
s
Mya
. Agr
i. D
ev. B
ank
R&
DLege
nd
Inpu
t
Inte
rnat
iona
l com
pone
nt
Impo
rter
/W
hole
sale
rsRe
tail
Roas
ter/
pack
er
Japa
n
Oil
Mill
s
Impo
rter
/W
hole
sale
rsRe
tail
Roas
ter/
pack
er
Rep
ublic
of K
orea
Oil
Mill
s
Impo
rter
/W
hole
sale
rsRe
tail
Roas
ter/
pack
er
Sing
apor
e
Oil
Mill
s
Impo
rter
/W
hole
sale
rsRe
tail
Roas
ter/
pack
er
Mal
aysi
a
Oil
Mill
s
Impo
rter
/W
hole
sale
rsRe
tail
Roas
ter/
pack
er
Viet
Nam
Oil
Mill
s
Impo
rter
/W
hole
sale
rsRe
tail
Roas
ter/
pack
er
Thai
land
Oil
Mill
s
Impo
rter
/W
hole
sale
rsRe
tail
Roas
ter/
pack
er
Indo
nesi
a
Oil
Mill
s
Impo
rter
/W
hole
sale
rsRe
tail
Roas
ter/
pack
er
Belg
ium
Oil
Mill
s
Impo
rter
/W
hole
sale
rsRe
tail
Roas
ter/
pack
er
Indi
a
Oil
Mill
s
Seed
s fo
r ed
ible
oil

28 THE REPUBLIC OF THE UNION OF MYANMAR NATIONAL EXPORT STRATEGY BEANS, PULSES AND OILSEEDS SECTOR STRATEGY 2015-2019
Fig
ure
19 : C
urre
nt p
ulse
s va
lue
chai
n
Farm
pro
duct
ion
Wee
ding
Pla
ntin
g
Har
vest
Land
pr
epar
atio
n
Pos
t-ha
rves
tS
tora
ge
Colle
ctio
n
Age
nts
Col
lect
ors
Larg
e tr
ader
s
Stoc
kist
Larg
e W
hole
sale
rs
Expo
rts
Indi
aIm
porte
r/W
hole
sale
rsR
e-pa
cker
Ret
ail
Pro
cess
or
Paki
stan
Impo
rter/
Who
lesa
lers
Re-
pack
erR
etai
lP
roce
ssor
Indo
nesia
Impo
rter/
Who
lesa
lers
Re-
pack
erR
etai
lP
roce
ssor
Mal
aysia
Impo
rter/
Who
lesa
lers
Re-
pack
erR
etai
lP
roce
ssor
Chin
aIm
porte
r/W
hole
sale
rsR
e-pa
cker
Ret
ail
Pro
cess
or
Japa
nIm
porte
r/W
hole
sale
rsR
e-pa
cker
Ret
ail
Pro
cess
or
Phili
ppin
esIm
porte
r/W
hole
sale
rsR
e-pa
cker
Ret
ail
Pro
cess
or
Chin
e Ta
ipei
Impo
rter/
Who
lesa
lers
Re-
pack
erR
etai
lP
roce
ssor
Thai
land
Impo
rter/
Who
lesa
lers
Re-
pack
erR
etai
lP
roce
ssor
Inpu
t
See
ds
Ferti
lizer
s
Pes
ticid
e
Farm
equi
pmen
t
Labo
ur
Land
Wat
er
R&
D
Sto
rage
Regi
onal
Cr
op
Exch
ange
Ce
ntre
Cro
p Ex
chan
ge
Cent
re(Y
ango
n an
d M
anda
lay)
Proc
esso
rs
Lege
nd
Nat
iona
l com
pone
ntIn
tern
atio
nal c
ompo
nent
MoC
oops
MoA
I-AED
MoA
I-DoA
UM
FCCI
MoI
-DSI
MoF
MoA
I- irr
igat
ion
MoA
I-DAR
MPB
SMA
MoH
-FDA
MCT
A &
MHT
AM
oC-D
oTP
Insu
ranc
e co
mpa
nies
MoC
- DoT
MoE
nerg
y
MoA
I-AM
D
MST
RDM
ya. A
gri.
Dev.
Ban
kM
oAI-W
RUD
Mya
nmar
Indu
stry
As
s.Re
gion
al c
rop
exch
ange
cen
tres
MoF
A
MoC
-DCC
AM
oAI-P
PD
Prim
ary
Supp
ortin
g Se
rvic
es
Labo
rato
ries
-Qua
lity
test
ing
Ban
ks-F
inan
cial
ser
vice
sTe
chni
cal a
nd m
aint
enan
ce s
ervi
ces
Viet
nam
Impo
rter/
Who
lesa
lers
Re-
pack
erR
etai
lP
roce
ssor

29WHERE WE ARE NOW
BEANS AND PULSES
A number of enterprises and agents participate in the beans and pulses value chain, facilitating the cultivation and sale of local products.60 Among these participants are the farmers themselves, local traders, larger traders, wholesalers, exporters and agents. It should be noted that the heavy reliance upon middle men can often leave farmers disconnected from customers and direct negotia-tions, thereby exposing them to exploitation.
The first step of the value chain is production. This re-quires farmers to manage both the land and the crop cycle. Land is prepared and then sown with seeds de-pending on the soil, irrigation and crop type. Following the harvest, farmers keep production in storage until it moves to the next step of the value chain. A number of inputs are required in the production stage, not the least of which are seeds, farm equipment, land, labour, and water. Other inputs such as R & D, pesticides and fertilizers allow farmers to optimize their capacities and minimize risks.
The next step in the value chain is collection, in which har-vested products are usually purchased by local traders or agents. The dynamic of this stage of the value chain is of-ten governed by the complex relationships between farm-ers and traders, as many farmers rely upon these same traders for financial and technical assistance. Farmers are often subject to informal agreements which see them sell their products to traders without being able to ne-gotiate prices. Not only does this impede farmers’ abil-ity to search for attractive deals, but the rush to settle accounts leaves them unable to leave products in stor-age while waiting for the arrival of more favourable mar-ket conditions.
Having purchased the crops from farmers, local trad-ers will then sell the goods to larger regional companies through regional exchange centres, which eventually sell them to traders in Yangon. As Yangon is the hub for the bean and pulse trade, large wholesalers and exporters purchase goods from the Yangon traders either directly or through commodity exchange centres.
Once purchased, some wholesalers will process the products themselves and others will send them to pro-cessing companies before continuing with distribution. Processors meanwhile will purchase beans and pulses directly from the commodity exchange centres.
After the products have been processed, wholesalers will sell them directly abroad, distribute them to the retail net-work, or else sell them to warehouses in Yangon. These warehouses fulfil a key role in the value chain as they store and sell the products throughout the year in accordance
60. Thura Swiss ( August 2013 ). Myanmar’s Beans and Pulses Trade : Risks and Prospects, pp. 2-4.
with market conditions. This guarantees a stable supply of pulses and beans.
The key international destinations are India, Pakistan, Indonesia, Malaysia, China, Japan, the Philippines, Chinese Taipei and Thailand. Exporters sell beans and pulses in various stages of processing to importers and wholesalers. Having arrived in their respective market the products are then further processed by re-packers or pro-cessors, until they are finally distributed at the retail level.
OILSEEDS
As with pulses and beans, the first step in the oilseed value chain is that of production.61Inputs at this stage include land, water, seeds, labour, R & D, farm equipment, fertilizer and pesticides. Farmers prepare their land for sowing, plant the fields, weed and maintain the fields dur-ing cultivation, and harvest their product. The land will be tended post-harvest and the crops will be stored until they are distributed along the value chain.
The collection process involves a variety of participants, first of which are the primary village collectors. These col-lectors obtain oilseeds directly from the farmers in situ and the farmers are usually paid following the delivery and sale of the crops to the collectors’ clients. The collec-tors handle all marketing procedures and costs and will at times provide farmers with credit. The primary collec-tor will sell to millers / processors directly or else to other agents. They are generally paid between 5 % and 7 % of the oilseed value for their services.
The town wholesalers obtain oilseeds from primary col-lectors. They generally hire their own agents and brokers for collection, and their role as a facilitator along the value chain is quite varied. They may handle oilcake from mill-ers ; transport goods from local markets to larger, urban wholesale markets ; and buy crops for exporters, often on commission. In fact, the commission agent plays an im-portant role in the vale chain. These traders buy and sell oilseeds on an agreed commission that is usually valued at 1 % to 2 % of the crop. They will facilitate transactions between farmers and markets ( costs charged to the for-mer ) and between markets and millers / processors ( costs charged to the latter ). Commission agents usually work closely with and for larger traders and millers with whom they have a relationship, sharing price information and arranging financial logistics of the deals. Millers, traders, wholesalers, and exporters at times recruit brokers to help them purchase oilseeds. The incidence of brokerage is becoming more common as the sector becomes more competitive and enterprises compete to obtain sufficient seed stocks.
61. FAO ( 2009 ). An Analysis of the Myanmar Edible Oil Crops Sub-Sector, pp. 61-66.
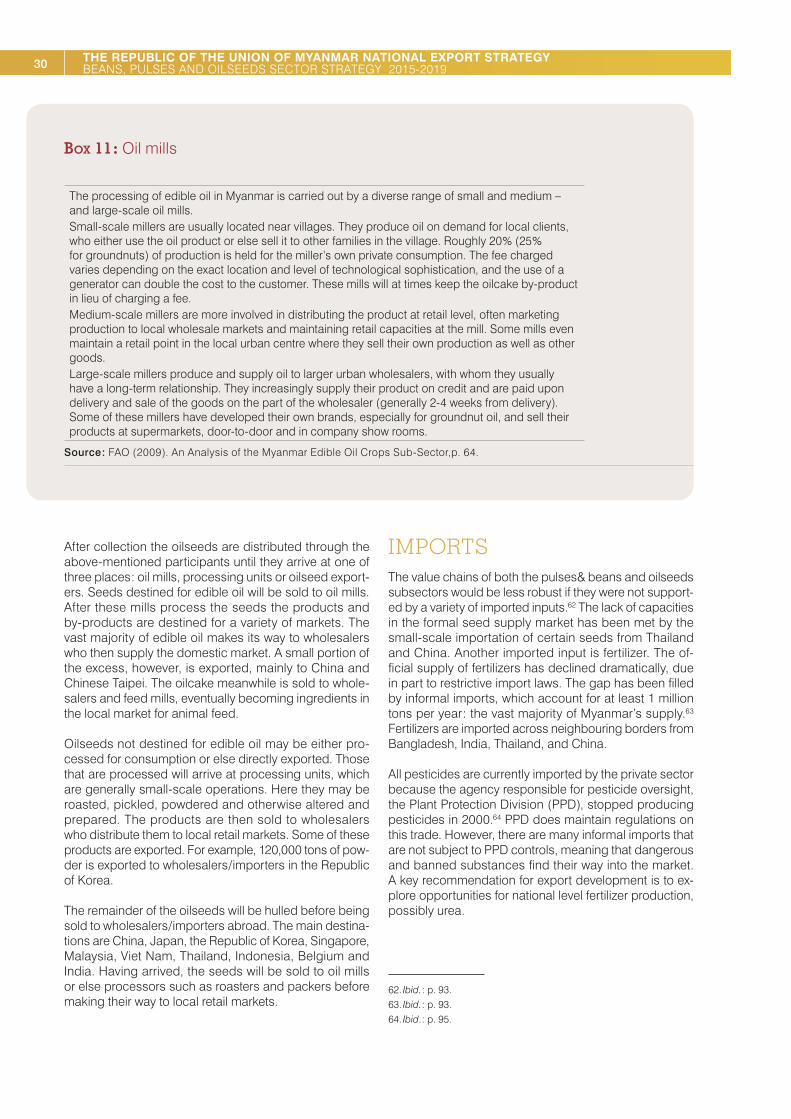
30 THE REPUBLIC OF THE UNION OF MYANMAR NATIONAL EXPORT STRATEGY BEANS, PULSES AND OILSEEDS SECTOR STRATEGY 2015-2019
Box 11 : Oil mills
The processing of edible oil in Myanmar is carried out by a diverse range of small and medium – and large-scale oil mills.Small-scale millers are usually located near villages. They produce oil on demand for local clients, who either use the oil product or else sell it to other families in the village. Roughly 20 % ( 25 % for groundnuts ) of production is held for the miller’s own private consumption. The fee charged varies depending on the exact location and level of technological sophistication, and the use of a generator can double the cost to the customer. These mills will at times keep the oilcake by-product in lieu of charging a fee.Medium-scale millers are more involved in distributing the product at retail level, often marketing production to local wholesale markets and maintaining retail capacities at the mill. Some mills even maintain a retail point in the local urban centre where they sell their own production as well as other goods.Large-scale millers produce and supply oil to larger urban wholesalers, with whom they usually have a long-term relationship. They increasingly supply their product on credit and are paid upon delivery and sale of the goods on the part of the wholesaler ( generally 2-4 weeks from delivery ). Some of these millers have developed their own brands, especially for groundnut oil, and sell their products at supermarkets, door-to-door and in company show rooms.
Source : FAO ( 2009 ). An Analysis of the Myanmar Edible Oil Crops Sub-Sector,p. 64.
After collection the oilseeds are distributed through the above-mentioned participants until they arrive at one of three places : oil mills, processing units or oilseed export-ers. Seeds destined for edible oil will be sold to oil mills. After these mills process the seeds the products and by-products are destined for a variety of markets. The vast majority of edible oil makes its way to wholesalers who then supply the domestic market. A small portion of the excess, however, is exported, mainly to China and Chinese Taipei. The oilcake meanwhile is sold to whole-salers and feed mills, eventually becoming ingredients in the local market for animal feed.
Oilseeds not destined for edible oil may be either pro-cessed for consumption or else directly exported. Those that are processed will arrive at processing units, which are generally small-scale operations. Here they may be roasted, pickled, powdered and otherwise altered and prepared. The products are then sold to wholesalers who distribute them to local retail markets. Some of these products are exported. For example, 120,000 tons of pow-der is exported to wholesalers / importers in the Republic of Korea.
The remainder of the oilseeds will be hulled before being sold to wholesalers / importers abroad. The main destina-tions are China, Japan, the Republic of Korea, Singapore, Malaysia, Viet Nam, Thailand, Indonesia, Belgium and India. Having arrived, the seeds will be sold to oil mills or else processors such as roasters and packers before making their way to local retail markets.
IMPORTSThe value chains of both the pulses& beans and oilseeds subsectors would be less robust if they were not support-ed by a variety of imported inputs.62 The lack of capacities in the formal seed supply market has been met by the small-scale importation of certain seeds from Thailand and China. Another imported input is fertilizer. The of-ficial supply of fertilizers has declined dramatically, due in part to restrictive import laws. The gap has been filled by informal imports, which account for at least 1 million tons per year : the vast majority of Myanmar’s supply.63 Fertilizers are imported across neighbouring borders from Bangladesh, India, Thailand, and China.
All pesticides are currently imported by the private sector because the agency responsible for pesticide oversight, the Plant Protection Division ( PPD ), stopped producing pesticides in 2000.64 PPD does maintain regulations on this trade. However, there are many informal imports that are not subject to PPD controls, meaning that dangerous and banned substances find their way into the market. A key recommendation for export development is to ex-plore opportunities for national level fertilizer production, possibly urea.
62. Ibid. : p. 93.63. Ibid. : p. 93.64. Ibid. : p. 95.

31WHERE WE ARE NOW
GLOBAL PERSPECTIVEPULSES AND BEANS
The global market for pulses and beans was valued at US $ 9.6 billion of imports in 2012. The biggest market by far was India, which purchased 23.6 % of world imports. Other important markets include China, the United States, Egypt and Pakistan. Annual growth of imports between 2008 and 2012 has been a healthy 8 %. While India’s growth in demand is in line with the world average, a num-ber of countries experienced extraordinary expansions as target markets. China’s imports, for example, grew at
an annual rate of 43 %, while those of the United States, Pakistan and Mexico were also especially significant.
The largest supplier of pulses and beans is Canada, which accounted for nearly 21 % of global exports. Australia and China also achieved market share in the double digits, while the United States and Myanmar each supplied roughly 9 % of the market. The most interesting growth in exports was achieved by the Russian Federation. Their US $ 303 million of bean and pulse exports is the result of an 82 % p.a. growth between 2008 and 2012. Australia’s 34 % growth in the same timeframe has helped solidify it as a leader in the sector.
Table 3 : Pulses and beans imports 2012
0713 – Dried vegetables, shelled
Importers
Trade indicators
Value imported in 2012
( US $ thousands )
Quantity imported in 2012
Annual growth in value 2008–2012
( % )
Share in world imports ( % )
World 9628066 12312258 8 100
1 India 2272319 3815735 8 23.6
2 China 582000 742251 43 6
3 United States 496135 332466 16 5.2
4 Egypt 426790 408499 12 4.4
5 Pakistan 407292 591992 21 4.2
6 Mexico 328705 294188 17 3.4
7 Spain 315580 406092 9 3.3
8 Brazil 293853 370036 11 3.1
9 Italy 260752 276405 3 2.7
10 Bangladesh 256565 486002 13 2.7
11 United Kingdom 228953 225208 0 2.4
12 Algeria 217485 176487 9 2.3
13 Turkey 215283 272186 -5 2.2
14 Japan 202076 150905 12 2.1
15 United Arab Emirates ( UAE ) 166059 239009 2 1.7
Source : ITC calculations based on UN Comtrade statistics.
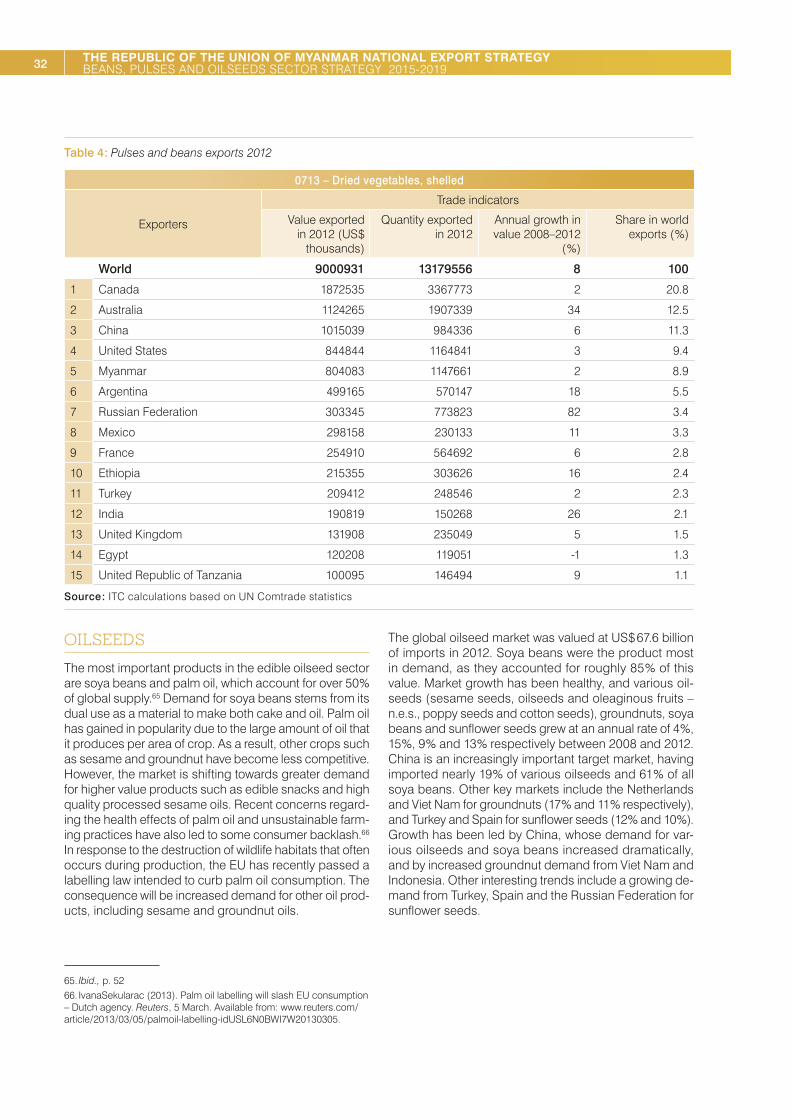
32 THE REPUBLIC OF THE UNION OF MYANMAR NATIONAL EXPORT STRATEGY BEANS, PULSES AND OILSEEDS SECTOR STRATEGY 2015-2019
Table 4 : Pulses and beans exports 2012
0713 – Dried vegetables, shelled
Exporters
Trade indicators
Value exported in 2012 ( US $
thousands )
Quantity exported in 2012
Annual growth in value 2008–2012
( % )
Share in world exports ( % )
World 9000931 13179556 8 100
1 Canada 1872535 3367773 2 20.8
2 Australia 1124265 1907339 34 12.5
3 China 1015039 984336 6 11.3
4 United States 844844 1164841 3 9.4
5 Myanmar 804083 1147661 2 8.9
6 Argentina 499165 570147 18 5.5
7 Russian Federation 303345 773823 82 3.4
8 Mexico 298158 230133 11 3.3
9 France 254910 564692 6 2.8
10 Ethiopia 215355 303626 16 2.4
11 Turkey 209412 248546 2 2.3
12 India 190819 150268 26 2.1
13 United Kingdom 131908 235049 5 1.5
14 Egypt 120208 119051 -1 1.3
15 United Republic of Tanzania 100095 146494 9 1.1
Source : ITC calculations based on UN Comtrade statistics
OILSEEDS
The most important products in the edible oilseed sector are soya beans and palm oil, which account for over 50 % of global supply.65 Demand for soya beans stems from its dual use as a material to make both cake and oil. Palm oil has gained in popularity due to the large amount of oil that it produces per area of crop. As a result, other crops such as sesame and groundnut have become less competitive. However, the market is shifting towards greater demand for higher value products such as edible snacks and high quality processed sesame oils. Recent concerns regard-ing the health effects of palm oil and unsustainable farm-ing practices have also led to some consumer backlash.66 In response to the destruction of wildlife habitats that often occurs during production, the EU has recently passed a labelling law intended to curb palm oil consumption. The consequence will be increased demand for other oil prod-ucts, including sesame and groundnut oils.
65. Ibid., p. 5266. IvanaSekularac ( 2013 ). Palm oil labelling will slash EU consumption – Dutch agency. Reuters, 5 March. Available from: www.reuters.com / article / 2013 / 03 / 05 / palmoil-labelling-idUSL6N0BWI7W20130305.
The global oilseed market was valued at US $ 67.6 billion of imports in 2012. Soya beans were the product most in demand, as they accounted for roughly 85 % of this value. Market growth has been healthy, and various oil-seeds ( sesame seeds, oilseeds and oleaginous fruits – n.e.s., poppy seeds and cotton seeds ), groundnuts, soya beans and sunflower seeds grew at an annual rate of 4 %, 15 %, 9 % and 13 % respectively between 2008 and 2012. China is an increasingly important target market, having imported nearly 19 % of various oilseeds and 61 % of all soya beans. Other key markets include the Netherlands and Viet Nam for groundnuts ( 17 % and 11 % respectively ), and Turkey and Spain for sunflower seeds ( 12 % and 10 % ).Growth has been led by China, whose demand for var-ious oilseeds and soya beans increased dramatically, and by increased groundnut demand from Viet Nam and Indonesia. Other interesting trends include a growing de-mand from Turkey, Spain and the Russian Federation for sunflower seeds.

33WHERE WE ARE NOW
Table 5 : Oilseed imports 2012
Importers
Trade indicators
Value imported in 2012 ( US $
thousands )
Quantity imported in 2012
Annual growth in value 2008–2012 ( % )
Share in world imports ( % )
1207 – Oilseeds
Total World 3460601 4 100
1 China 653169 813387 27 18.9
2 Japan 289312 -6 8.4
3 United States 276243 272825 1 8
4 Republic of Korea 214874 5 6.2
5 Germany 176497 107874 -3 5.1
1202 – Groundnuts ( not roasted )
Total World 3209216 1944052 15 100
1 Netherlands 555200 277958 9 17.3
2 Viet Nam 362095 284667 311 11.3
3 Indonesia 218286 185828 21 6.8
4 Germany 200553 102041 8 6.2
5 United Kingdom 162606 85568 11 5.1
1201 – Soya beans, whether or not broken
Total World 57343426 95882417 9 100
1 China 34941724 58380934 15 60.9
2 Spain 1908531 3312424 5 3.3
3 Germany 1876754 3266439 2 3.3
4 Japan 1810802 2727400 -5 3.2
5 Chinese Taipei 1461980 2349450 7 2.5
1206 – Sunflower seeds, whether or not broken
Total World 3583326 4166005 13 100
1 Turkey 443959 754162 14 12.4
2 Spain 360237 476416 15 10.1
3 Germany 331717 468333 2 9.3
4 Netherlands 299296 462692 7 8.4
5 Russian Federation 182083 28568 26 5.1
Source : ITC calculations based on UN Comtrade statistics
The most important exporters were the United States and Brazil, whose shipments of soya beans were responsible for 39 % and 27 % of total exports. With regards to vari-ous oilseeds and groundnuts, India was the top exporter, responsible for 16 % and 33 % of those export markets. Sunflower seed exports were dominated by Hungary and Bulgaria. Significant growth was realized by most of the top exporters, but Australia’s annual growth of 92 % be-tween 2008 and 2012 in various oilseeds was extraordi-nary. Export growth for groundnuts was led by India, the
Netherlands, and Argentina, while Canada, Brazil, and the United States recorded impressive export expansion in soya beans. Eastern European countries were joined by France and China in achieving healthy growth in sun-flower exports.
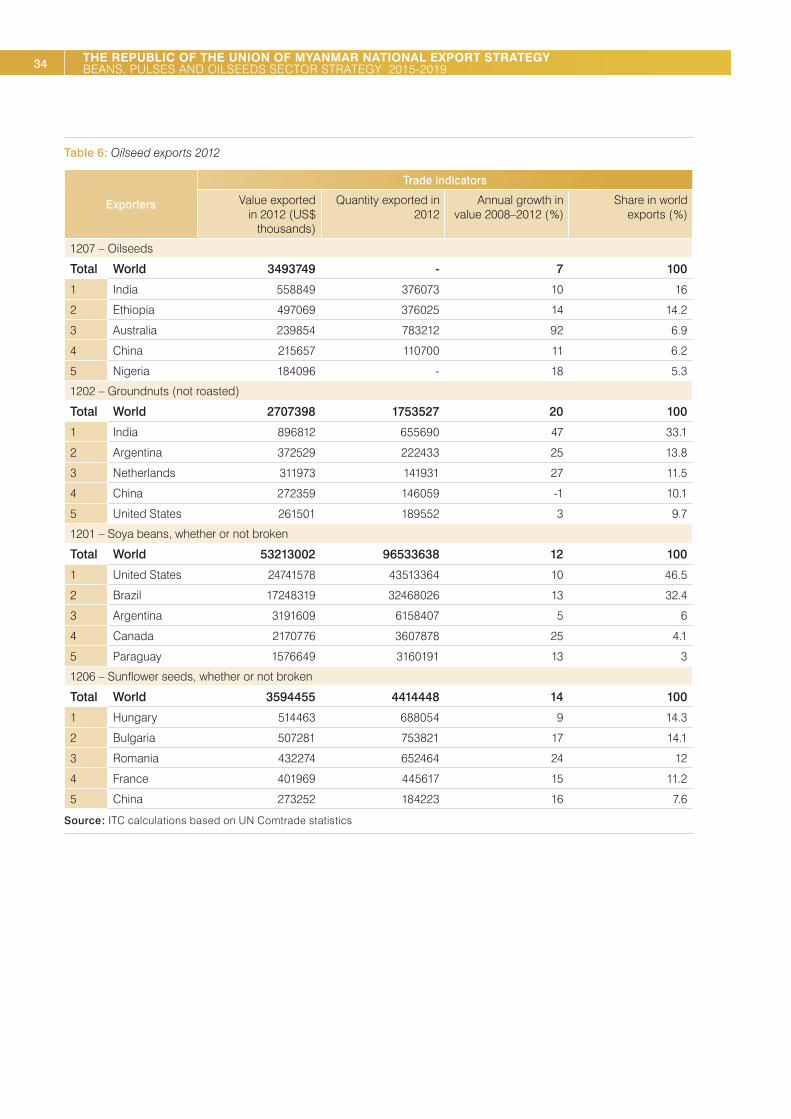
34 THE REPUBLIC OF THE UNION OF MYANMAR NATIONAL EXPORT STRATEGY BEANS, PULSES AND OILSEEDS SECTOR STRATEGY 2015-2019
Table 6 : Oilseed exports 2012
Exporters
Trade indicators
Value exported in 2012 ( US $
thousands )
Quantity exported in 2012
Annual growth in value 2008–2012 ( % )
Share in world exports ( % )
1207 – Oilseeds
Total World 3493749 - 7 100
1 India 558849 376073 10 16
2 Ethiopia 497069 376025 14 14.2
3 Australia 239854 783212 92 6.9
4 China 215657 110700 11 6.2
5 Nigeria 184096 - 18 5.3
1202 – Groundnuts ( not roasted )
Total World 2707398 1753527 20 100
1 India 896812 655690 47 33.1
2 Argentina 372529 222433 25 13.8
3 Netherlands 311973 141931 27 11.5
4 China 272359 146059 -1 10.1
5 United States 261501 189552 3 9.7
1201 – Soya beans, whether or not broken
Total World 53213002 96533638 12 100
1 United States 24741578 43513364 10 46.5
2 Brazil 17248319 32468026 13 32.4
3 Argentina 3191609 6158407 5 6
4 Canada 2170776 3607878 25 4.1
5 Paraguay 1576649 3160191 13 3
1206 – Sunflower seeds, whether or not broken
Total World 3594455 4414448 14 100
1 Hungary 514463 688054 9 14.3
2 Bulgaria 507281 753821 17 14.1
3 Romania 432274 652464 24 12
4 France 401969 445617 15 11.2
5 China 273252 184223 16 7.6
Source : ITC calculations based on UN Comtrade statistics

35WHERE WE ARE NOW
EXPORT PERFORMANCE BEANS AND PULSES
Myanmar exported 1,140,000 tons of beans and pulses in 2012, or roughly one-fifth of its total subsector production. These sales were valued at US $ 804 million and repre-sented 9.6 % of Myanmar’s total exports in 2012.67 Exports of beans and pulses are highly concentrated, with more than 74 % of shipments going to India and the top five countries accounting for over 90 % of subsector exports.
The overall growth of exports in this subsector has been subdued at roughly 2 % per annum. This is largely due to stagnant export growth to India. While worldwide imports
67. ITC calculation.
to India are in fact increasing in line with growing global demand, Myanmar has not benefited from this expansion. A further worrisome trend is the declining value of exports to China. Despite the stagnant and declining growth of ex-ports to two important markets, Myanmar has had much success in continuing to penetrate regional neighbours. More specifically, exports to the Philippines, Indonesia, Malaysia, and Thailand have grown at extraordinary rates. Exports to other important markets in Asia and the Pacific, including Japan and Chinese Taipei, have increased by double digits.
These fast emerging import markets represent a new op-portunity for growth and diversification. For certain mar-kets like Japan, Chinese Taipei and Thailand, key success criteria will be the ability of exporters to increase the qual-ity of exported pulses.
Table 7 : Myanmar’s pulses and beans exports ( 2012 )
0713 – Dried vegetables, shelled
Importers
Trade indicators
Tariff ( estimated )
faced by Myanmar
( % )
Exported value 2012
( US $ )thousands )
Share in Myanmar’s exports ( % )
Exported quantity
2012
Exported growth in value 2008-2012
( %, p.a. )
Ranking of partner countries in world imports
Share of partner
countries in world imports
( % )
Total import growth in value of partner
countries 2008-2012 ( %, p.a. )
Total 804083 100 1147661 2 100 8
1 India 596172 74.1 887362 0 1 23.6 8 19.1
2 Pakistan 45367 5.6 63422 10 5 4.2 21 0
3 Indonesia 37628 4.7 46793 32 27 0.8 37 0
4 Malaysia 28209 3.5 33623 16 26 0.8 17 0
5 China 20569 2.6 25650 -11 2 6 43 0
6 Japan 14025 1.7 15974 14 14 2.1 12 0
7 Philippines 10117 1.3 12132 47 42 0.4 8 2.2
8 Chinese Taipei
9927 1.2 14686 19 43 0.4 11 11
9 Thailand 9502 1.2 13369 15 51 0.2 17
10 Singapore 6938 0.9 7331 6 57 0.2 9 0
11 Republic of Korea
6664 0.8 9556 15 38 0.5 16 85.6
12 United Kingdom
5946 0.7 5520 13 11 2.4 0 0.3
13 Sri Lanka 3207 0.4 3524 21 17 1.3 -3 16.7
14 Australia 1774 0.2 1508 37 61 0.2 4 0
15 Russian Federation
1460 0.2 1295 28 47 0.3 6 0
Source : ITC calculations based on UN Comtrade statistics.
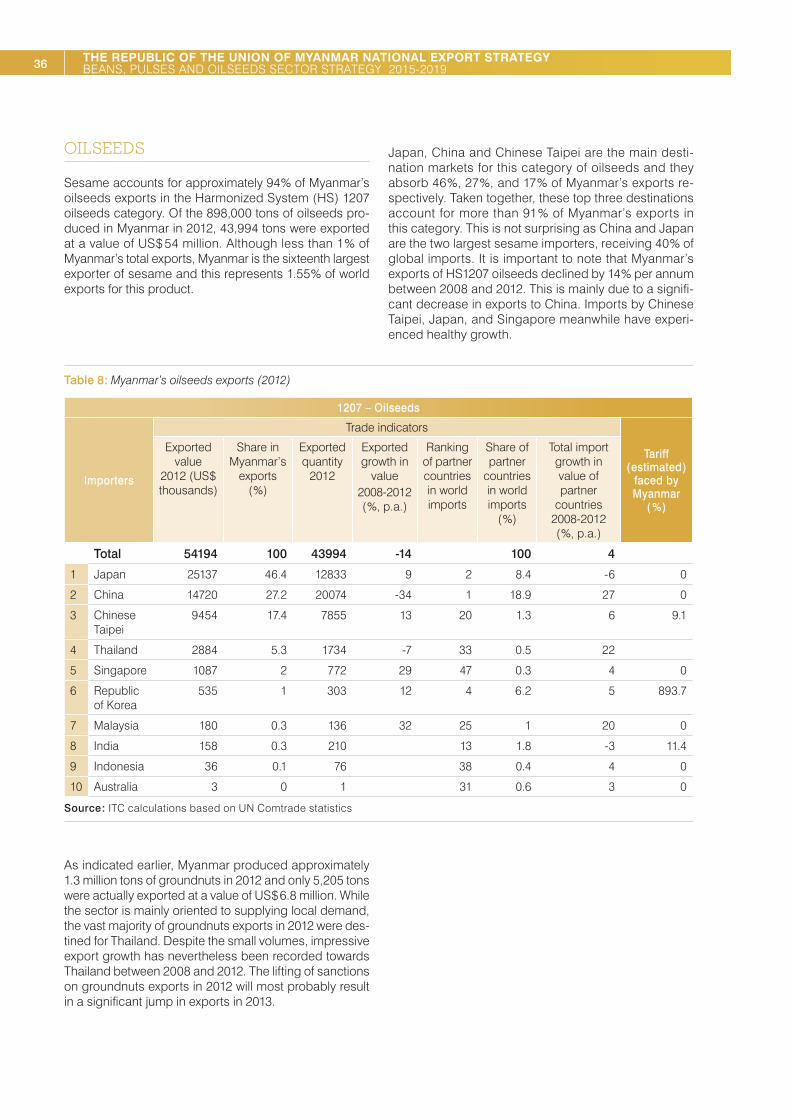
36 THE REPUBLIC OF THE UNION OF MYANMAR NATIONAL EXPORT STRATEGY BEANS, PULSES AND OILSEEDS SECTOR STRATEGY 2015-2019
OILSEEDS
Sesame accounts for approximately 94 % of Myanmar’s oilseeds exports in the Harmonized System ( HS ) 1207 oilseeds category. Of the 898,000 tons of oilseeds pro-duced in Myanmar in 2012, 43,994 tons were exported at a value of US $ 54 million. Although less than 1 % of Myanmar’s total exports, Myanmar is the sixteenth largest exporter of sesame and this represents 1.55 % of world exports for this product.
Japan, China and Chinese Taipei are the main desti-nation markets for this category of oilseeds and they absorb 46 %, 27 %, and 17 % of Myanmar’s exports re-spectively. Taken together, these top three destinations account for more than 91 % of Myanmar’s exports in this category. This is not surprising as China and Japan are the two largest sesame importers, receiving 40 % of global imports. It is important to note that Myanmar’s exports of HS1207 oilseeds declined by 14 % per annum between 2008 and 2012. This is mainly due to a signifi-cant decrease in exports to China. Imports by Chinese Taipei, Japan, and Singapore meanwhile have experi-enced healthy growth.
Table 8 : Myanmar’s oilseeds exports ( 2012 )
1207 – Oilseeds
Importers
Trade indicators
Tariff ( estimated )
faced by Myanmar
( % )
Exported value
2012 ( US $ thousands )
Share in Myanmar’s
exports ( % )
Exported quantity
2012
Exported growth in
value2008-2012 ( %, p.a. )
Ranking of partner countries in world imports
Share of partner
countries in world imports
( % )
Total import growth in value of partner
countries 2008-2012 ( %, p.a. )
Total 54194 100 43994 -14 100 4
1 Japan 25137 46.4 12833 9 2 8.4 -6 0
2 China 14720 27.2 20074 -34 1 18.9 27 0
3 Chinese Taipei
9454 17.4 7855 13 20 1.3 6 9.1
4 Thailand 2884 5.3 1734 -7 33 0.5 22
5 Singapore 1087 2 772 29 47 0.3 4 0
6 Republic of Korea
535 1 303 12 4 6.2 5 893.7
7 Malaysia 180 0.3 136 32 25 1 20 0
8 India 158 0.3 210 13 1.8 -3 11.4
9 Indonesia 36 0.1 76 38 0.4 4 0
10 Australia 3 0 1 31 0.6 3 0
Source : ITC calculations based on UN Comtrade statistics
As indicated earlier, Myanmar produced approximately 1.3 million tons of groundnuts in 2012 and only 5,205 tons were actually exported at a value of US $ 6.8 million. While the sector is mainly oriented to supplying local demand, the vast majority of groundnuts exports in 2012 were des-tined for Thailand. Despite the small volumes, impressive export growth has nevertheless been recorded towards Thailand between 2008 and 2012. The lifting of sanctions on groundnuts exports in 2012 will most probably result in a significant jump in exports in 2013.
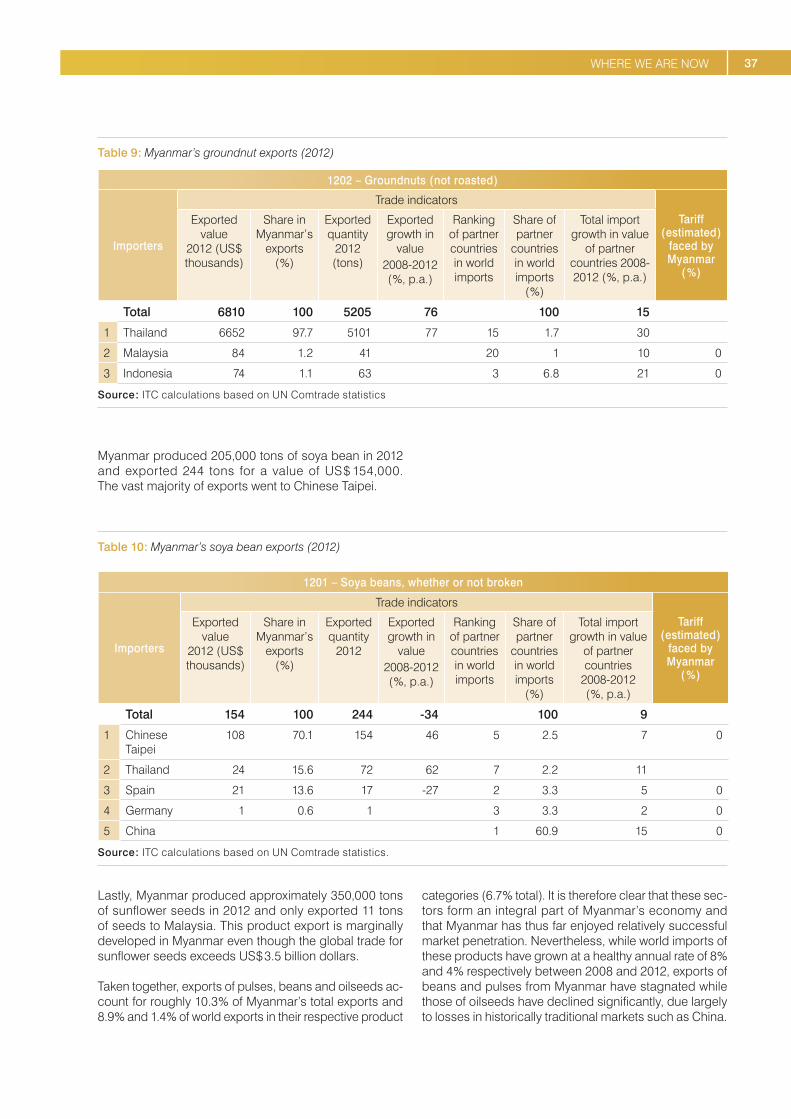
37WHERE WE ARE NOW
Table 9 : Myanmar’s groundnut exports ( 2012 )
1202 – Groundnuts ( not roasted )
Importers
Trade indicators
Tariff ( estimated )
faced by Myanmar
( % )
Exported value
2012 ( US $ thousands )
Share in Myanmar’s
exports ( % )
Exported quantity
2012 ( tons )
Exported growth in
value2008-2012 ( %, p.a. )
Ranking of partner countries in world imports
Share of partner
countries in world imports
( % )
Total import growth in value
of partner countries 2008-2012 ( %, p.a. )
Total 6810 100 5205 76 100 15
1 Thailand 6652 97.7 5101 77 15 1.7 30
2 Malaysia 84 1.2 41 20 1 10 0
3 Indonesia 74 1.1 63 3 6.8 21 0
Source : ITC calculations based on UN Comtrade statistics
Myanmar produced 205,000 tons of soya bean in 2012 and exported 244 tons for a value of US $ 154,000. The vast majority of exports went to Chinese Taipei.
Table 10 : Myanmar’s soya bean exports ( 2012 )
1201 – Soya beans, whether or not broken
Importers
Trade indicators
Tariff ( estimated )
faced by Myanmar
( % )
Exported value
2012 ( US $ thousands )
Share in Myanmar’s
exports ( % )
Exported quantity
2012
Exported growth in
value2008-2012 ( %, p.a. )
Ranking of partner countries in world imports
Share of partner
countries in world imports
( % )
Total import growth in value
of partner countries
2008-2012 ( %, p.a. )
Total 154 100 244 -34 100 9
1 Chinese Taipei
108 70.1 154 46 5 2.5 7 0
2 Thailand 24 15.6 72 62 7 2.2 11
3 Spain 21 13.6 17 -27 2 3.3 5 0
4 Germany 1 0.6 1 3 3.3 2 0
5 China 1 60.9 15 0
Source : ITC calculations based on UN Comtrade statistics.
Lastly, Myanmar produced approximately 350,000 tons of sunflower seeds in 2012 and only exported 11 tons of seeds to Malaysia. This product export is marginally developed in Myanmar even though the global trade for sunflower seeds exceeds US $ 3.5 billion dollars.
Taken together, exports of pulses, beans and oilseeds ac-count for roughly 10.3 % of Myanmar’s total exports and 8.9 % and 1.4 % of world exports in their respective product
categories ( 6.7 % total ). It is therefore clear that these sec-tors form an integral part of Myanmar’s economy and that Myanmar has thus far enjoyed relatively successful market penetration. Nevertheless, while world imports of these products have grown at a healthy annual rate of 8 % and 4 % respectively between 2008 and 2012, exports of beans and pulses from Myanmar have stagnated while those of oilseeds have declined significantly, due largely to losses in historically traditional markets such as China.

38 THE REPUBLIC OF THE UNION OF MYANMAR NATIONAL EXPORT STRATEGY BEANS, PULSES AND OILSEEDS SECTOR STRATEGY 2015-2019
Although past success has been admirable, especially in light of the sector’s relatively low level of sophistication, stakeholders must take action to modernize and enhance capacities in order to stem the loss of market share that has occurred over recent years. While efforts are required to bolster penetration in traditional markets, enterprises must also be equipped with the tools that will allow them to capitalize upon emerging opportunities and diversi-fy into new markets through enhanced crop quality, im-proved standards and quality management systems and compliance, improved market identification capacities, and upgraded marketing capacities.
THE INSTITUTIONAL PERSPECTIVETrade support institutions ( TSIs ) have an interest in, and bearing on, the sector’s export development. Broadly, the TSIs providing important services to Myanmar’s pulses, beans and oilseeds sector can be categorized in the fol-lowing support areas :
� Policy support network � Trade services network � Business services network � Civil society network.
Tables 11 to 14 identify the main TSIs whose service delivery affects the pulses, beans and oilseeds sector in Myanmar. An assessment of the TSIs along four key dimensions – coordination,68 human capital,69 financial sustainability,70 and lobbying / communication 71– is pro-vided. The ranking ( high / medium / low ) for each TSI was defined in the context of service delivery to the pulses, beans and oilseeds sector stakeholders. In other words, the assessment was conducted based on the evaluation by stakeholders of the TSIs from the perspective of how well they serve the pulses, beans and oilseeds sector.
POLICY SUPPORT NETWORK
These institutions represent ministries and competent au-thorities responsible for influencing or implementing poli-cies at the national level.
68. Coordination : measures the strength of this institution’s linkages with other institutions as well as the beneficiaries of their services in terms of collaboration and information sharing.69. Human capital : assesses the general level of capability of the institution’s staff in terms of their training and responsiveness to sector stakeholders.70. Financial resources : assesses the financial resources / capacity avail-able to the institution to provide service delivery in an efficient manner71. Lobbying / communication : evaluates the efficacy of this institution’s advocacy mechanisms, and how well / frequently this institution disseminates important information to the sector.

39WHERE WE ARE NOW
Table 11 : Policy support network for the Myanmar pulses, beans and oilseeds sector
Name of institution
Description of TSI in line with sector
Activities Coordination Human capital
Financial resources
Lobbying / communication
Ministry of Commerce
Department of Trade Promotion( previously MAPT )
• Market information, trade pro-motion, business-to-business meetings, trade fairs, export training, commodity prices
H H L L
Commodity Test-ing and Quali-ty Management (CTQM) (previ-ously PTAC)
• Disseminates post-harvest technology
• Post-harvest, quality control, cleaning and storage techniques
L L L L
Directorate of Trade
• Trade facilitation, trade liber-alization, trade negotiation, policy and regulation, region-al cooperation, rules of origin, trade registration, trade statis-tics, weekly commerce journal
H H L M
Department of Commerce and Consumer Affairs
• Issuance of export and import license, border trade (check points, license), consumer protection, competition
H H L L
Ministry of Industry
Department of Supervision and Inspection
• Licensing and registration of industrial operators
L L L L
Ministry of Health
FDA • Quality controls• Lab services• HACCP certificates
L L L L
Ministry of Agriculture and Irrigation
DoA-Seed Division
• Multiply quality seeds• Demonstration farms
( groundnuts, pigeon peas and chick peas )
L M L L
DAR • Improved varieties• Breeder &foundation seeds• Research farms
L M L L
DoA-Land Use Division
• Quality control of fertilizers• Fertilizer testing lab
L L L L
DoA-Agricultural Extension Division
• Model farms• Farmer seed banks• Seed farms and seed
multiplication ( not for oilseeds )
• Some farmer field schools• Training of farmer
associations
L L L L
Irrigation Department
• Building of dams and facilities, reservoirs and canals
• Collaboration with water management groups
M M H L
Water Resources Utilization Department
• Managing of pumping of ground water and river water
M L L L
Land Records and Settlement Department
• Data on production• Enforces land law• Land registry
L M L L
40 THE REPUBLIC OF THE UNION OF MYANMAR NATIONAL EXPORT STRATEGY BEANS, PULSES AND OILSEEDS SECTOR STRATEGY 2015-2019
Name of institution
Description of TSI in line with sector
Activities Coordination Human capital
Financial resources
Lobbying / communication
Ministry of Agriculture and Irrigation
Agricultural Mechanization Department
• Rents machinery• Promotes mechanization• Trains farmers
L L L L
DoA-Plant Protection Division
• Laboratory testing ( pesticide residues )
M M L M
DoA –Plant Protection Division
• Phytosanitary certificates L L L L
Ministry of Cooperatives
Microfinance t o farmers ( not yet operational )
• Microloans L L L L
Ministry of National Planning & Economic Development
Directorate of Investment and Company Administration
• Company registration• Joint venture services• Investment promotion
M M M M
Ministry of Energy
Myanmar Petrochemical Enterprise
• Fertilizer Production ( Urea, Nitrogen )
L L L L
Ministry of Finance
Department of Internal Revenues
• Commercial taxes L M H L
Customs Authority • Customs duties• Export documentation
L L M L
Ministry of Science and Technology
Myanmar Scientific & Technological Research Department
• Establishes standards L M L L
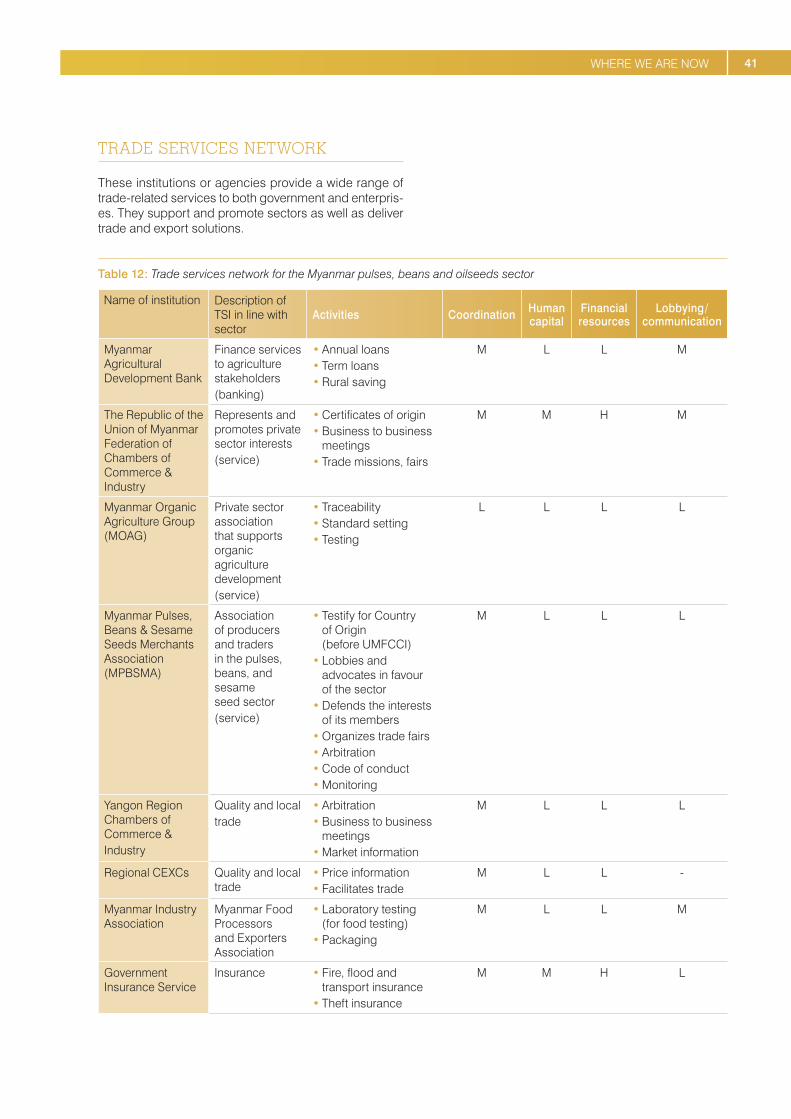
41WHERE WE ARE NOW
TRADE SERVICES NETWORK
These institutions or agencies provide a wide range of trade-related services to both government and enterpris-es. They support and promote sectors as well as deliver trade and export solutions.
Table 12 : Trade services network for the Myanmar pulses, beans and oilseeds sector
Name of institution Description of TSI in line with sector
Activities Coordination Human capital
Financial resources
Lobbying / communication
Myanmar Agricultural Development Bank
Finance services to agriculture stakeholders( banking )
• Annual loans• Term loans• Rural saving
M L L M
The Republic of the Union of Myanmar Federation of Chambers of Commerce & Industry
Represents and promotes private sector interests( service )
• Certificates of origin• Business to business
meetings• Trade missions, fairs
M M H M
Myanmar Organic Agriculture Group ( MOAG )
Private sector association that supports organic agriculture development( service )
• Traceability• Standard setting• Testing
L L L L
Myanmar Pulses, Beans & Sesame Seeds Merchants Association ( MPBSMA )
Association of producers and traders in the pulses, beans, and sesame seed sector( service )
• Testify for Country of Origin ( before UMFCCI )
• Lobbies and advocates in favour of the sector
• Defends the interests of its members
• Organizes trade fairs• Arbitration• Code of conduct• Monitoring
M L L L
Yangon Region Chambers of Commerce &Industry
Quality and localtrade
• Arbitration• Business to business
meetings• Market information
M L L L
Regional CEXCs Quality and local trade
• Price information• Facilitates trade
M L L -
Myanmar Industry Association
Myanmar Food Processors and Exporters Association
• Laboratory testing ( for food testing )
• Packaging
M L L M
Government Insurance Service
Insurance • Fire, flood and transport insurance
• Theft insurance
M M H L

42 THE REPUBLIC OF THE UNION OF MYANMAR NATIONAL EXPORT STRATEGY BEANS, PULSES AND OILSEEDS SECTOR STRATEGY 2015-2019
BUSINESS SERVICES NETWORK
These are associations, or major representatives, of com-mercial services providers used by exporters to effect international trade transactions.
Table 13 : Business services network for the Myanmar pulses, beans and oilseeds sector
Name of institution
Description of TSI in line with sector
Activities Coordination Human capital
Financial resources
Lobbying / communication
Association of Bankers
Banking • Loans to large processors and exporters
L M M L
Private insurance companies
Insurance • Insurance for processors and exporters
L L L L
Inspection agencies
SGS, OMIC, Myanmar Pest Control Services,Myanmar Overseas Commodity Inspection Co., Ltd, Myanmar Inspection and Testing Service
• Inspection, weight, quantity, quality, packing, fumigation, marking, testing
L L M L
Myanmar Container Trucks Association
Service • Transportation L L L L
Myanmar Customs Brokers Association
Service • Export / import procedures
• Clearing agents
L L L M
Myanmar Highway Freight Transportation Services Association
Service • Transportation L L L L
Myanmar Plastic Industries Association
Service • Bags ( polypropylene bags )
L L M L
CIVIL SOCIETY NETWORK
ANALYSIS OF THE TRADE SUPPORT NETWORK
These institutions are not explicitly engaged in the sec-tor’s trade-related activities. However, they are opinion leaders representing specific interests that have a bear-ing on the sector’s export potential and socioeconomic development.

43WHERE WE ARE NOW
Table 14 : Civil society network for the pulses, beans and oilseeds sectors
Name of institution
Description of TSI in line with sector
Activities Coordination Human capital
Financial resources
Lobbying / communication
Commerce Journal
Media • Market and price information M M L M
e-trade Myanmar
Media • Trade information M M L M
Universities Education • Specialized research L L L L
While the sustainable development of the pulses, beans and oilseeds sector requires the participation and sup-port of a wide-ranging TSI network, the analysis above illustrates that the human and financial capacities of in-stitutions supporting the sector need to be upgraded. While there is a fair amount of coordination on behalf of the trade services network and civil society network, co-ordination among policy support and business services networks is lacking. Especially concerning is the lack of coordination by a number of ministries including MoAI, which plays a key role in sectoral development. Moreover, both the Commerce Journal and e-trade Myanmar must increase their levels of coordination with enterprises, thereby guaranteeing an optimized flow of trade informa-tion to sector participants.
Another important issue is the lack of human resources capacities at the majority of TSIs, with the exception of the Ministry of Commerce ( MoC ). The availability of ad-equately trained staff at these institutions is indispensable to guide sector development. As focal points for sector knowledge they are critical in disseminating information among, and providing services to, sector stakeholders. Their ability to fulfil this role hinges upon the qualifications of their staff.
Equally worrisome is the insufficient access to financial resources, especially for MoAI, MoC, and MPBSMA. The development of the sector depends to a large extent upon the ability of these key institutions to act as anchors for sectoral growth and focal points of sectoral initiatives. Sustainable export development will only be possible if these institutions have access to an adequate and stable supply of financial resources.
TSIs must also increase their lobbying and communica-tion on behalf of and to sector stakeholders. It is important that enterprises can rely upon key coordinating institutions to advocate policy on their behalf in response to a chang-ing global trade environment.
Lastly, it is important to give special attention to univer-sities, whose capacities are lacking across all catego-ries. It will be important for Myanmar’s higher education
infrastructure to increase their coordination, human re-sources, financial capacities and advocacy in order to participate in developing and diffusing best agricultural practices.
DEVELOPMENT INITIATIVESHaving recognized the importance of agriculture to Myanmar’s economy and socioeconomic welfare, the government has committed to increasing sector capaci-ties. Moreover, following the political reforms of 2011 a number of donors have begun engaging in development initiatives. One of these donors is the International Fund for Agriculture and Development ( IFAD ), which is funding a US $ 300,000 project from October 2013 through March 2015.72 Executed in three villages of the central Magway area, the initiative will focus on building capacities in rural development and the agricultural and livestock sectors.
Another IFAD initiative is the Fostering Agricultural Revitalization in Myanmar project, which is currently be-ing designed.73 It will seek to provide aid to poor rural populations by increasing the incomes of employees and smallholders. Particular focus will be placed on women-headed households, landless households and ethnic minorities. The project will participate in both land devel-opment and capacity-building through the foundation of 55 knowledge centres that will serve to empower com-munities and improve local skills and institutions.
IFAD is also in various stages of investigating and ne-gotiating a number of other initiatives. These include a US $ 500,000 grant for capacity-building of MoAI and the Country Strategic Opportunities Programme, which will work towards facilitating access to agricultural resources, technologies, services and markets.74
72. Xinhua ( 2013 ).Myanmar sees encouraging foreign engagement in agricultural sector, 4 October. Available from: http : / / news.xinhuanet .com / english / business / 2013-10 / 04 / c_132771836.htm.73. IFAD ( August, 2013 ). Fostering Agricultural Revitalization in Myanmar Project Design Mission.74. IFAD ( 2013 ). Republic of the Union of Myanmar IFAD Mission September 2013 Aide-Mémoire.

44 THE REPUBLIC OF THE UNION OF MYANMAR NATIONAL EXPORT STRATEGY BEANS, PULSES AND OILSEEDS SECTOR STRATEGY 2015-2019
An important source of donor activity is the Livelihood and Food Security Trust Fund ( LIFT ), which has been active in Myanmar since 2009.75 LIFT is a multi-donor fund man-aged by the United Nations Office for Project Services that counts Australia, Denmark, the European Union, France, the Netherlands, New Zealand, Sweden, Switzerland, the United States and the United Kingdom of Great Britain and Northern Ireland among its supporters. Its goal is to channel aid to implementing partners in order to improve food and livelihood security of vulnerable populations in Myanmar. LIFT is currently assisting the agricultural sector to develop capacities through dozens of projects.
FAO is also implementing a number of projects that will affect the pulses, beans and oilseeds sector. By address-ing a wide variety of issues, regional projects seek to build capacities for the implementation of international food safety standards and develop plant pest surveillance and information management systems. Further aid is provided through two country-specific projects. The Food Security through Strengthening of Institutional Capacity for Seed Production project seeks to :
Establish a modern framework for sustainable seed delivery system( s ) by strengthening the capacity of the institutions responsible for crop varietal improve-ment, seed production, quality control ; and develop-ing an appropriate national seed policy and regulatory framework for seed programmes / industry with an ap-propriate oversight arrangement.76
The Sustainable Cropland and Forest Management in Priority Agro-Ecosystems of Myanmar project seeks to enable agricultural stakeholders to improve land condition and mitigate climate change through the spread of sus-tainable resource management policies and practices.77
Despite positive signs with regards to aid activity, it is only within the last two years that political changes have catalysed a greater willingness on the part of donors to engage more actively in Myanmar. While the num-ber of projects being implemented is limited, there have been generic commitments by the international com-munity. The European Union, for example, has commit-ted € 100 million, of which € 5.5 million will be dedicated to capacity-building.78 They are currently preparing a
75. Livelihoods and Food Security Trust Fund ( LIFT ) ( 2013 ). Website. Available from : http : / / lift-fund.org / 76. FAO–MoAI. Food Security through Strengthening of Institutional Capacity for Seed Production. Available from : http : / / coin.fao.org / coin-static / cms / media / 6 / 13244522724000 / food_security_seed_production.pdf.77. GEF Trust Fund ( 2013 ). Project Identification Form : Sustainable cropland and forest management in priority agro-ecosystems of Myanmar.78. European Commission ( 2014 ). Development and Cooperation – Europeaid : Myanmar / Burma. Available from http : / / ec.europa.eu / europeaid / where / asia / country-cooperation / myanmar / myanmar_en.htm.
€ 50 million long-term programme that will engage in trade assistance.
LEGAL AND LEGISLATIVE FRAMEWORKA number of agricultural and food product laws govern the pulses, beans and oilseeds sector. First among these is the National Food Law, which was passed in 1997 in line with the World Health Organization Model Food Law.79 This legislation laid the groundwork for Myanmar’s food regulation policy and its stated goals are to :
( i ) enable the public to consume food of genuine quality, free from danger, ( ii ) prevent the public from consuming food that may cause danger or ( that are ) in-jurious to health, ( iii ) supervise production of controlled food systematically, and ( iv ) control and regulate the production, import, export, storage, distribution and sale of food systematically.80
Among other things the law empowers the FDA to es-tablish and implement policy relating to production, stor-age, distribution, labelling, and sale of food. Although effective implementation has been elusive, this law also lays the groundwork for the oversight of food quality and standards.
With regards more specifically to agriculture, the Pesticide Law of 1990 empowers MoAI to regulate the registra-tion and use of pesticides in Myanmar.81 The Pesticide Registration Board was established as a result of this law, constituting ten authorities from various ministries. The Pesticide Analytical Laboratory was tasked with product testing and quality control.
The Fertilizer Law of 2002 established the Fertilizer Committee, which was tasked with developing and im-plementing policy related to the oversight of fertilizer use.82 The aim of the law was to support the development of agriculture in Myanmar by enabling the control and over-sight of fertilizers, supporting environmentally sound development through the use of suitable fertilizers, and enabling research into better agricultural practices and fertilization systems.
79. Htwe, Dr. Yi Yi ( n.d. ). FDA, Myanmar Department of Health. PowerPoint presentation available from ftp : / / ftp.fao.org / docrep / fao / meeting / 008 / ad813e.pdf.80. Republic of the Union of Myanmar, State Law and Order Restoration Council ( 3 March 1997 ). The National Food Law ( Law No. 5 / 97 ).81. U Myo Myint ( Plant Protection Division, Myanmar Agriculture Service ). Myanmar Country Report.82. Republic of the Union of Myanmar, State Peace and Development Council ( October, 2002 ). The Fertilizer Law ( Law No. 7 / 2002 ).
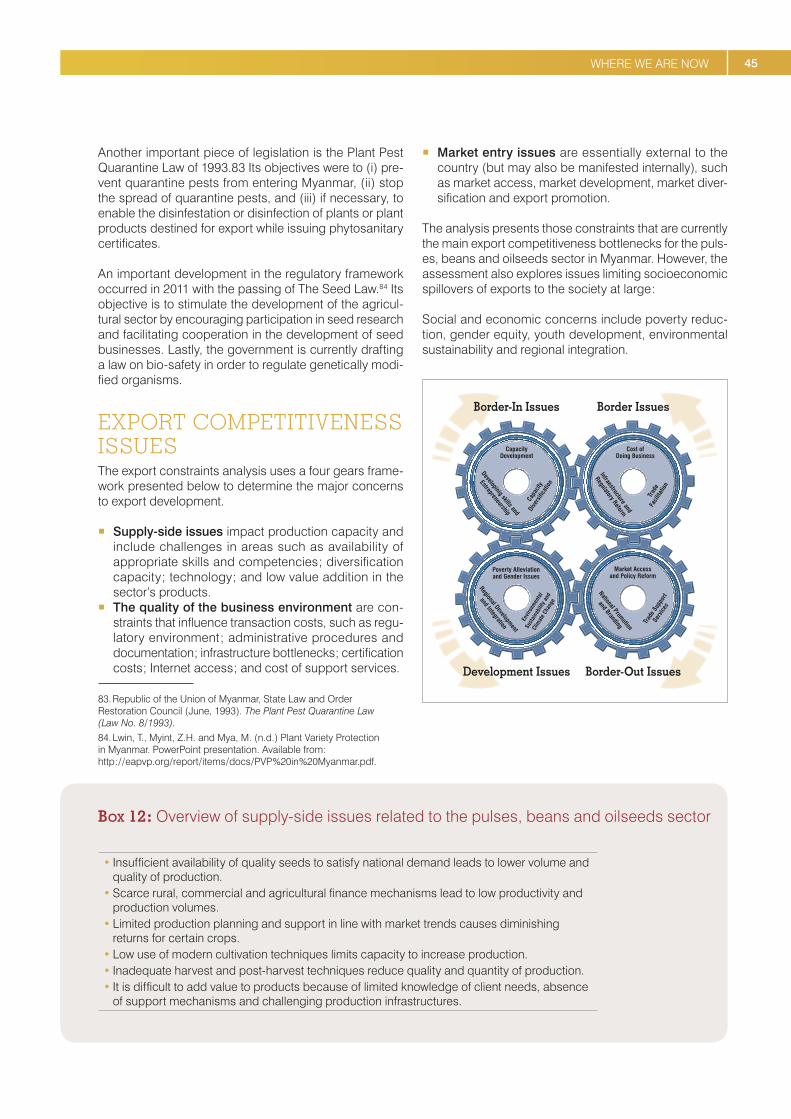
45WHERE WE ARE NOW
Another important piece of legislation is the Plant Pest Quarantine Law of 1993.83 Its objectives were to ( i ) pre-vent quarantine pests from entering Myanmar, ( ii ) stop the spread of quarantine pests, and ( iii ) if necessary, to enable the disinfestation or disinfection of plants or plant products destined for export while issuing phytosanitary certificates.
An important development in the regulatory framework occurred in 2011 with the passing of The Seed Law.84 Its objective is to stimulate the development of the agricul-tural sector by encouraging participation in seed research and facilitating cooperation in the development of seed businesses. Lastly, the government is currently drafting a law on bio-safety in order to regulate genetically modi-fied organisms.
EXPORT COMPETITIVENESS ISSUESThe export constraints analysis uses a four gears frame-work presented below to determine the major concerns to export development.
� Supply-side issues impact production capacity and include challenges in areas such as availability of appropriate skills and competencies ; diversification capacity ; technology ; and low value addition in the sector’s products.
� The quality of the business environment are con-straints that influence transaction costs, such as regu-latory environment ; administrative procedures and documentation ; infrastructure bottlenecks ; certification costs ; Internet access ; and cost of support services.
83. Republic of the Union of Myanmar, State Law and Order Restoration Council ( June, 1993 ). The Plant Pest Quarantine Law ( Law No. 8 / 1993 ).84. Lwin, T., Myint, Z.H. and Mya, M. ( n.d. ) Plant Variety Protection in Myanmar. PowerPoint presentation. Available from: http : / / eapvp.org / report / items / docs / PVP %20in %20Myanmar.pdf.
� Market entry issues are essentially external to the country ( but may also be manifested internally ), such as market access, market development, market diver-sification and export promotion.
The analysis presents those constraints that are currently the main export competitiveness bottlenecks for the puls-es, beans and oilseeds sector in Myanmar. However, the assessment also explores issues limiting socioeconomic spillovers of exports to the society at large :
Social and economic concerns include poverty reduc-tion, gender equity, youth development, environmental sustainability and regional integration.
CapacityDevelopment
Cost ofDoing Business
Developinig skills and
Entrepreneurship
Capa
city
Dive
rsifi
catio
n
Infraestructure and
Regulatory Reform
Trad
eFa
cilita
tion
Market Accessand Policy Reform
National Promotion
and Branding Trad
e Su
ppor
t
Serv
ices
Poverty Alleviationand Gender Issues
Regional Development
and Integration
Envir
onm
enta
l
Sust
aina
bilit
y and
Clim
ate
Chan
ge
Border IssuesBorder-In Issues
Border-Out IssuesDevelopment Issues
Box 12 : Overview of supply-side issues related to the pulses, beans and oilseeds sector
• Insufficient availability of quality seeds to satisfy national demand leads to lower volume and quality of production.
• Scarce rural, commercial and agricultural finance mechanisms lead to low productivity and production volumes.
• Limited production planning and support in line with market trends causes diminishing returns for certain crops.
• Low use of modern cultivation techniques limits capacity to increase production.• Inadequate harvest and post-harvest techniques reduce quality and quantity of production.• It is difficult to add value to products because of limited knowledge of client needs, absence
of support mechanisms and challenging production infrastructures.
46 THE REPUBLIC OF THE UNION OF MYANMAR NATIONAL EXPORT STRATEGY BEANS, PULSES AND OILSEEDS SECTOR STRATEGY 2015-2019
THE BORDER-IN GEAR ( SUPPLY-SIDE )
INSUFFICIENT AVAILABILITY OF QUALITY SEEDS TO SATISFY NATIONAL DEMAND LEADS TO LOWER VOLUME AND QUALITY OF PRODUCTION
As indicated above, the national production of quality seeds is largely insufficient to cover the needs of farmers. According to FAO, national seed multiplication only covers on average 1 % of seed requirements for oilseeds ( ses-ame, groundnuts, sunflower, soya bean, etc. ). MPBSMA indicates that this situation is also applicable for pulses and beans seed multiplication.
The absence of adequate technologies and the limited human capacity at DAR and at DoA-Seed Division ham-pers the development of an efficient seed multiplication infrastructure. According to Agricultural Science and Technology Indicators,85 average spending per agricul-tural scientist and research intensity ratio are among the lowest in the world, which implies a need to increase ag-ricultural research investments by sevenfold for Myanmar to be on par with the average for the Asia-Pacific region.
In addition to the insufficiency of R&D resources for the agriculture sector there is a challenge of coordination and cooperation between the relevant institutions for seed multiplication. There is currently limited dialogue or partnerships between government agriculture research bodies ( DAR, DoA-Seed Division ) and private seed mul-tiplication companies. Efforts to organize public–public and public–private dialogue on seed multiplication and distribution would contribute to defining opportunities for improving yields in the pulses and oilseeds sector.
It is important to note that, according to FAO,86 the exist-ing seed market in Myanmar is small and unorganized. A key reason for this situation is the limited financial capacity of farmers to purchase large volumes of seeds annually ; instead farmers buy small amounts and multiply them for many years, which leads to decreasing yields due to mixing of varieties. At the moment it is not commercially viable for the private sector to invest in seed multiplica-tion except for a limited number of crops, such as sesa-me.87 Efforts to sensitize farmers on the benefits of using quality seeds could support the initial development of a commercial seed sector. These efforts will need to be ac-companied with increased access to finance for farmers to purchase the seeds.
85. Stads, G., and Kam, P.S. ( 2007 ). Myanmar : Agricultural Science and Technology Indicators. ASTI Country Brief No. 38, June, p.886. FAO ( 2009 ). An Analysis of the Myanmar Edible Oil Crops Sub-Sector, p.86.87. Ibid. : p. 88.
SCARCE RURAL, COMMERCIAL AND AGRI-CULTURAL FINANCE MECHANISMS LEAD TO DIFFICULT DEVELOPMENT OF THE SECTOR
Access to finance is considered a key challenge to all sectors in Myanmar, including in the pulses, beans and oilseeds sector. The availability of adequate finance for agricultural development is very low. Agriculture engages 56.6 %88 of the population and produces approximately 48 %of GDP89 but it only receives 1 % to 3 % of formal bank credit.90 There are no agricultural financial mechanisms such as crop loans or agriculture credit lines that could support agricultural development. Reform of the finan-cial sector in Myanmar will need to take into account the development of agricultural finance as a means to boost productivity and production of both domestic and export crops such as pulses, beans and oilseeds.
There is very low financial intermediation in Myanmar with only 1.69 commercial bank branches per 100,000 residents, while there are 4.33 in Cambodia, 8.07 in the Philippines, 11.29 in Thailand, and 3.63 in Viet Nam.91 In addition to low intermediation, most commercial banks are located in urban areas with very limited outreach to rural regions. This situation makes it almost impossible for rural farmers and processors to access the financial resources required to increase production.
There is also limited availability of microfinance servic-es. The International Monetary Fund ( IMF ) estimates the total demand for microcredit at close to US $ 1 bil-lion while, based on the limited data available, the total portfolio of microloans is estimated at US $ 283 million.92 The development of microfinance and innovative finance mechanisms for rural regions would contribute to build-ing up the production capacity of the pulses, beans and oilseeds sector. The recent development to support ap-proximately 2.2 million people with ‘microsavings’ such as income-generating loans, agricultural loans, consumer loans, healthcare loans, education loans, client welfare schemes and voluntary savings,93 needs to be recognized even if additional efforts are required to reach a greater number of rural populations. According to certain banks and microfinance institutions, the limited development of finance and microfinance also aims to limit potential for over-indebtedness of farmers facing factors such as the decline of the price of beans.94
88. Department of Labour ( 1990 ).1990 Labour Force Survey.89. 2004 data, World Bank national accounts data, and OECD National Accounts data files.90. FAO ( 2009 ). An Analysis of the Myanmar Edible Oil Crops Sub-Sector, p. 88.91. IMF ( 2011 ). Financial Access Survey.92. IFC Advisory Services in East Asia and the Pacific ( 2013 ).Microfinance in Myanmar Sector Assessment.93. Ibid. : p.19.94. Ibid. : p.17.

47WHERE WE ARE NOW
Over-indebtedness of pulse farmers and traders occurred in 2008 and 2011 when a few large traders defaulted due to price falls caused by bad weather and lack of regulation regarding payment policies. The absence of price support systems95 for the pulses, beans and oilseeds sector limits the ability of farmers and traders to develop financial plan-ning for their operations. Efforts to establish a price sup-port system for the pulses, beans and oilseeds sector, in addition to rice, would benefit its long-term development.
LIMITED PRODUCTION PLANNING AND SUPPORT IN LINE WITH MARKET TRENDS CAUSES DIMINISHING RETURNS FOR CERTAIN CROPS
As indicated above, the socialist management system of agriculture until 1990 organized production according to the government’s priorities. The gradual liberalization of the agricultural production system, with the maintaining of certain regulations, permitted the development of a market-based agricultural system.
However, there is still difficulty in Myanmar to manage agricultural production efficiently through rigorous data collection, analysis and planning, thanks to an outdated and inaccurate data management system. According to some analyses, there was before 1988 an understandable motivation of data recorders to publish data supporting official state goals, while farmers had incentives to under-state production because of sales quotas imposed by the state. Moreover, even after governmental controls on ag-riculture were relaxed, starting in 1988 for pulses, statisti-cal officers inherited a database filled with inflated data on production and productivity which will remain mostly inaccurate until there is a thorough revamping of the ag-ricultural data collection and analysis system.96
Additionally, crop plantation and management is rarely based on solid market trends analysis. At the moment, farmers are mostly encouraged to grow certain crops based on assessments from government, sector associ-ations and traders, all of whom have limited access to reli-able market data and reports. For certain crops, such as black gram, this situation is leading to diminishing returns
95. Price support systems provide a benefit to all producers by establishing a price floor. The benefit is roughly equal to the difference between the internal price and the world price. Note : If the level of support is less than the de minimis threshold – i.e., 5 % of the value of production in the case of developed countries and 10 % in the case of developing – the support is excluded from the Aggregate Measure of Support ( AMS ) calculation under the World Trade Organization. ( DTB Associates ( 2011 ). Domestic Support and World Trade Organization Obligations in Key Developing Countries ).96. Michigan State University ( MSU ) and the Myanmar Development Resource Institute’s Center for Economic and Social Development ( MDRI / CESD ) ( 2013 ). A Strategic Agricultural Sector and Food Security Diagnostic for Myanmar.USAID,p.18.
since the Indian market – the main buyer – is currently re-ducing its imports.
Sector associations are only partially involved in planning planting cycles for the pulses, beans and oilseeds sec-tor. According to members of MPBSMA, there is a need to increase its involvement is conducting market trending in order to better inform relevant institutions and farmers about planting cycles.
LOW USE OF MODERN CULTIVATION TECHNIQUES LIMITS CAPACITY TO INCREASE PRODUCTION
The development of modern agricultural production tech-niques has increased the total productivity of agriculture at the global level. As indicated above, Myanmar has been under investing in agricultural R&D for many years. On average, Myanmar spends only US $ 0.06 of every US $ 100 in agricultural output on agricultural research, compared withUS $ 0.41 by its Asian neighbours, which represents expenditures averaging less than 20 % of its peers and competitors.97 This low investment in agricul-ture development, and more precisely the pulses, beans and oilseeds sector, leads to low human, institutional and technical capacities to modernize agricultural production.
The modernization of agricultural production techniques is also hampered by the limited capacity and resources available to extension services. The current ratio of one extension worker to 1,700 farmers98 would put Myanmar in line with the average ratio of extension services in de-veloping countries but far off from more advanced or de-veloped countries in Europe, North America or Asia with a ratio averaging 1 :40.99 In fact, some analyses100 indicate that the low level of outreach to farmers is caused by low salaries and benefits, lack of mobility and inadequate operational budgets that lower the morale of an other-wise sufficient number of extension staff. For this reason, extension of agricultural advice is virtually non-existent, with farmers depending heavily on each other, private suppliers of inputs and wholesale purchasers.101 The low presence of extension workers limits the transmission ca-pacity of modern production techniques to farmers.
97. Ibid. :p.44.98. Ratio provided by DoA during NES consultations.99. Feder, G., Willett, A. and Zijp, W. ( 1999 ).Agricultural Extension – Generic Challenges and Some Ingredients for Solutions, p.5.World Bank Policy Research Working Papers.100. Global Forum for Rural Advisory Services ( 2013 ). Worldwide extension study : Myanmar. Available from: www.g-fras.org / en / world-wide-extension-study / 94-world-wide-extension-study / asia / south-eastern-asia / 313-myammar.html.101. Anderson Irrigation ( 2012 ), p.14, cited inMichigan State University ( MSU ) and the Myanmar Development Resource Institute’s Center for Economic and Social Development ( MDRI / CESD ) ( 2013 ). A Strategic Agricultural Sector and Food Security Diagnostic for Myanmar.USAID,p. 45.

48 THE REPUBLIC OF THE UNION OF MYANMAR NATIONAL EXPORT STRATEGY BEANS, PULSES AND OILSEEDS SECTOR STRATEGY 2015-2019
In addition to limited extension services from government, the efficient dissemination of modern agricultural tech-niques is inhibited due a low use of information and com-munications technology. Numerous non-governmental organizations and institutions are implementing farmer field schools102 in Myanmar ; however, their number re-mains insufficient to reach most farmers. It is still consid-ered that agricultural extension services are a prerogative of the government, with little involvement of farmers.103
For this reason there is very limited outsourcing of exten-sion services to private sector operators. Investment in developing new models for delivering extension services through greater involvement of farmers could contribute to increasing the dissemination of new and modern agri-cultural technologies
INADEQUATE HARVEST AND POST-HARVEST TECHNIQUES REDUCE QUALITY AND QUANTITY OF PRODUCTION
It is estimated that harvest and post-harvest losses for pulses and beans are approximately 8 %-10 %, and up to 25 % for oilseeds ( mainly sesame ).104 There are a num-ber of factors contributing to harvest and post-harvest losses, ranging from improper harvesting to inadequate handling, inefficient threshing, poor transport conditions, outdated primary processing equipment and bad stor-age conditions.
Improper harvesting is caused by the insufficient exten-sion services that limit knowledge transfer to farmers con-cerning adequate harvesting periods and techniques. The low mechanization of harvesting is also a key cause of losses, primarily due to the limited capacity of small farmers to invest in modern agricultural equipment such as harvesting machines and dryers.105 Inefficient han-dling and threshing is caused by similar reasons of lim-ited knowledge and outdated machinery.
The poor transport conditions leading to contamination and loss of product can be attributed to many decades of underinvestment, heavy regulation and limited structures linking water, road and rail transportation.106 The trucks used for the transport of pulses, beans and oilseeds are
102. See Metta, AVSI, etc.103. Global Forum for Rural Advisory Services ( 2013 ). Worldwide extension study : Myanmar. Available from: www.g-fras.org / en / world-wide-extension-study / 94-world-wide-extension-study / asia / south-eastern-asia / 313-myammar.html.104. Information provided by MPBSMA during NES consultations, does not include the milling stage.105. Myanmar Farmer Association ( n.d. ). Proposal for the investment of establishing FARMER services centre. Available from: http : / / myanmarfarmer.org / ?q=node / 48.106. Michigan State University ( MSU ) and the Myanmar Development Resource Institute’s Center for Economic and Social Development ( MDRI / CESD ) ( 2013 ). A Strategic Agricultural Sector and Food Security Diagnostic for Myanmar. USAID, p. 43.
not always dedicated to the transport of dry legumes and seeds, which can also lead to contamination of products.
As indicated earlier, there is limited primary processing ( cleaning, sorting, splitting, de-husking ) in Myanmar due to a main focus on export of bulk commodities. Primary processing is often inadequate because of limited knowl-edge and inadequate machinery. For instance, sesame bags sometimes contain a high content of sand caused by poor cleaning.107
Limited storage capacities also affect the post-harvest losses of pulses, beans and oilseeds. Issues with stor-age affect multiple levels of the sector value chain. At the farm and community level bags of pulses, beans and oil-seeds are mixed with other products, which can lead to contamination. There is limited availability of silos at the community level and on shipment routes to protect the produce from pest and rodent infestations.
IT IS DIFFICULT TO ADD VALUE TO PRODUCTS BECAUSE OF LIMITED KNOWLEDGE OF CLIENT NEEDS, ABSENCE OF SUPPORT MECHANISMS AND CHALLENGING PRODUCTION INFRASTRUCTURES
Myanmar only processes between 5 % and 10 % of the ap-proximately 1 million tons of beans and pulses it exports annually.108 There is additional processing capacity but exporters and importers are accustomed to unclean and unsorted pulses.
The estimated edible oil demand in Myanmar of 825,000 tons by 2015 exceeds the total production of approxi-mately 300,000 tons.109 As indicated earlier, many mills are currently closed or partially operational because of insufficient seed availability.110 Furthermore, the quality of edible oil production is not standardized, leading to a high occurrence of oil contamination and adulteration.
The development of the pulses, beans and oilseeds sec-tor is partly limited by its own capacity to add value to its production. Globally, the market has evolved towards higher value products such as edible / snack groundnuts, processed white and black sesame, or gluten-free prod-ucts.111 It is therefore critical for the sector to move beyond bulk commodity exporting towards the development of various types of processing through renewed transfor-
107. FAO ( 2009 ). An Analysis of the Myanmar Edible Oil Crops Sub-Sector, p. 142.108. Thura Swiss ( August 2013 ). Myanmar’s Beans and Pulses Trade : Risks and Prospects, p.5.109. According to information received from MPBSMA during NES consultations.110. FAO ( 2009 ). An Analysis of the Myanmar Edible Oil Crops Sub-Sector, p. 102.111. Ibid. :p. 177.
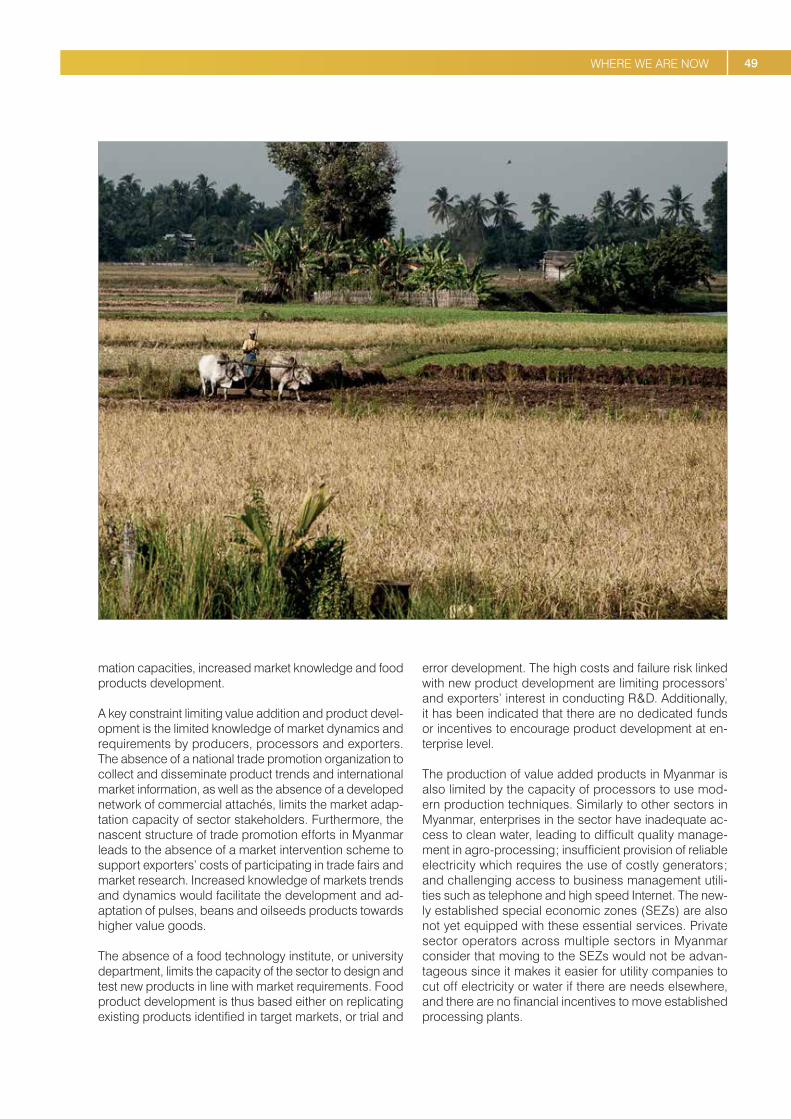
49WHERE WE ARE NOW
mation capacities, increased market knowledge and food products development.
A key constraint limiting value addition and product devel-opment is the limited knowledge of market dynamics and requirements by producers, processors and exporters. The absence of a national trade promotion organization to collect and disseminate product trends and international market information, as well as the absence of a developed network of commercial attachés, limits the market adap-tation capacity of sector stakeholders. Furthermore, the nascent structure of trade promotion efforts in Myanmar leads to the absence of a market intervention scheme to support exporters’ costs of participating in trade fairs and market research. Increased knowledge of markets trends and dynamics would facilitate the development and ad-aptation of pulses, beans and oilseeds products towards higher value goods.
The absence of a food technology institute, or university department, limits the capacity of the sector to design and test new products in line with market requirements. Food product development is thus based either on replicating existing products identified in target markets, or trial and
error development. The high costs and failure risk linked with new product development are limiting processors’ and exporters’ interest in conducting R & D. Additionally, it has been indicated that there are no dedicated funds or incentives to encourage product development at en-terprise level.
The production of value added products in Myanmar is also limited by the capacity of processors to use mod-ern production techniques. Similarly to other sectors in Myanmar, enterprises in the sector have inadequate ac-cess to clean water, leading to difficult quality manage-ment in agro-processing ; insufficient provision of reliable electricity which requires the use of costly generators ; and challenging access to business management utili-ties such as telephone and high speed Internet. The new-ly established special economic zones ( SEZs ) are also not yet equipped with these essential services. Private sector operators across multiple sectors in Myanmar consider that moving to the SEZs would not be advan-tageous since it makes it easier for utility companies to cut off electricity or water if there are needs elsewhere, and there are no financial incentives to move established processing plants.
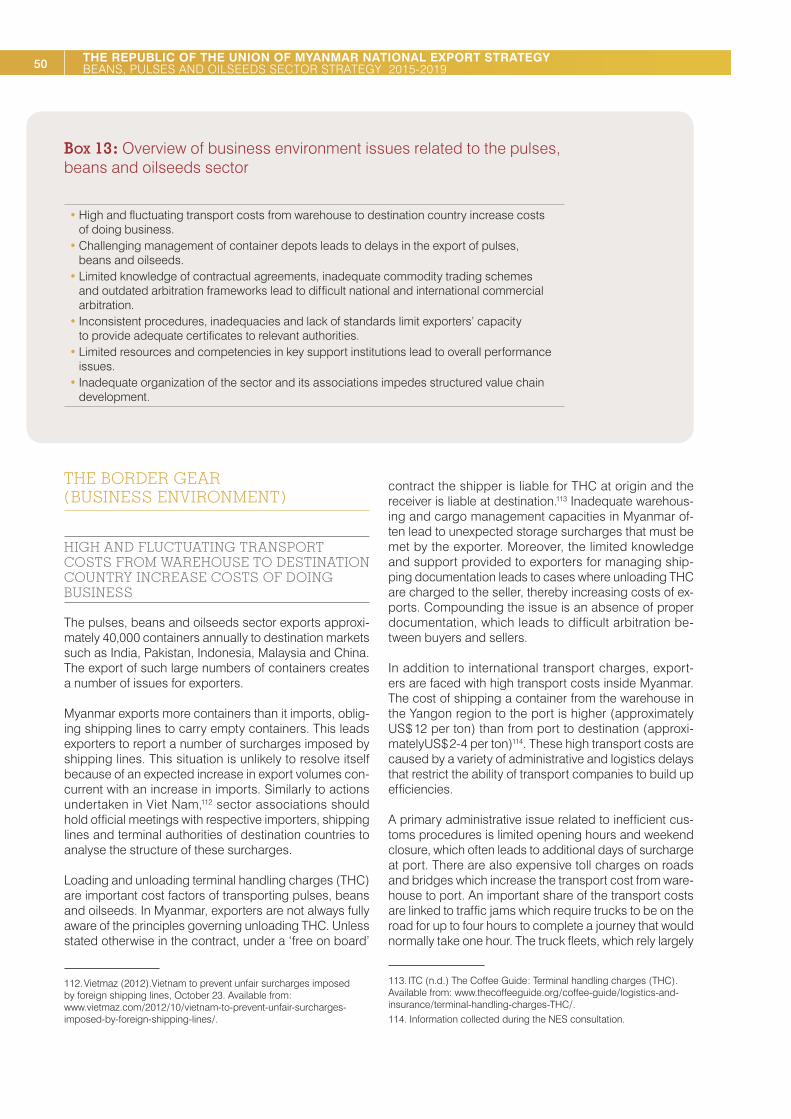
50 THE REPUBLIC OF THE UNION OF MYANMAR NATIONAL EXPORT STRATEGY BEANS, PULSES AND OILSEEDS SECTOR STRATEGY 2015-2019
Box 13 : Overview of business environment issues related to the pulses, beans and oilseeds sector
• High and fluctuating transport costs from warehouse to destination country increase costs of doing business.
• Challenging management of container depots leads to delays in the export of pulses, beans and oilseeds.
• Limited knowledge of contractual agreements, inadequate commodity trading schemes and outdated arbitration frameworks lead to difficult national and international commercial arbitration.
• Inconsistent procedures, inadequacies and lack of standards limit exporters’ capacity to provide adequate certificates to relevant authorities.
• Limited resources and competencies in key support institutions lead to overall performance issues.
• Inadequate organization of the sector and its associations impedes structured value chain development.
THE BORDER GEAR ( BUSINESS ENVIRONMENT )
HIGH AND FLUCTUATING TRANSPORT COSTS FROM WAREHOUSE TO DESTINATION COUNTRY INCREASE COSTS OF DOING BUSINESS
The pulses, beans and oilseeds sector exports approxi-mately 40,000 containers annually to destination markets such as India, Pakistan, Indonesia, Malaysia and China. The export of such large numbers of containers creates a number of issues for exporters.
Myanmar exports more containers than it imports, oblig-ing shipping lines to carry empty containers. This leads exporters to report a number of surcharges imposed by shipping lines. This situation is unlikely to resolve itself because of an expected increase in export volumes con-current with an increase in imports. Similarly to actions undertaken in Viet Nam,112 sector associations should hold official meetings with respective importers, shipping lines and terminal authorities of destination countries to analyse the structure of these surcharges.
Loading and unloading terminal handling charges ( THC ) are important cost factors of transporting pulses, beans and oilseeds. In Myanmar, exporters are not always fully aware of the principles governing unloading THC. Unless stated otherwise in the contract, under a ‘free on board’
112. Vietmaz ( 2012 ).Vietnam to prevent unfair surcharges imposed by foreign shipping lines, October 23. Available from: www.vietmaz.com / 2012 / 10 / vietnam-to-prevent-unfair-surcharges-imposed-by-foreign-shipping-lines / .
contract the shipper is liable for THC at origin and the receiver is liable at destination.113 Inadequate warehous-ing and cargo management capacities in Myanmar of-ten lead to unexpected storage surcharges that must be met by the exporter. Moreover, the limited knowledge and support provided to exporters for managing ship-ping documentation leads to cases where unloading THC are charged to the seller, thereby increasing costs of ex-ports. Compounding the issue is an absence of proper documentation, which leads to difficult arbitration be-tween buyers and sellers.
In addition to international transport charges, export-ers are faced with high transport costs inside Myanmar. The cost of shipping a container from the warehouse in the Yangon region to the port is higher ( approximately US $ 12 per ton ) than from port to destination ( approxi-matelyUS $ 2-4 per ton )114. These high transport costs are caused by a variety of administrative and logistics delays that restrict the ability of transport companies to build up efficiencies.
A primary administrative issue related to inefficient cus-toms procedures is limited opening hours and weekend closure, which often leads to additional days of surcharge at port. There are also expensive toll charges on roads and bridges which increase the transport cost from ware-house to port. An important share of the transport costs are linked to traffic jams which require trucks to be on the road for up to four hours to complete a journey that would normally take one hour. The truck fleets, which rely largely
113. ITC ( n.d. ) The Coffee Guide : Terminal handling charges ( THC ). Available from: www.thecoffeeguide.org / coffee-guide / logistics-and-insurance / terminal-handling-charges-THC / .114. Information collected during the NES consultation.

51WHERE WE ARE NOW
on second-hand vehicles, are subject to frequent repairs, while both fuel and labour costs are significant. As such, any delays can result in significant variable cost increases for the transport companies, which are then transferred to the pulses, beans and oilseeds exporters, thereby in-creasing their cost of doing business.
CHALLENGING MANAGEMENT OF CONTAINER DEPOTS LEADS TO DELAYS IN THE EXPORT OF PULSES, BEANS AND OILSEEDS
The high volume of containers exported by the sector re-quires efficient management of container depots.115 The absence of Radio Frequency Identification and Electronic Data Interchange systems in container yards has been identified as a challenge causing significant delays for exports. The absence of these key storage management systems creates frequent container congestion. The lack of automated scheduling for container clearance further complicates time-consuming handling and collection pro-cedures. The result is an inefficient system with compli-cated queuing that operates on a first come, first served basis. Not only do the delays that result from this system hinder the ability of enterprises to respond efficiently to dynamic markets, but the prevalence of ‘free on board’ shipping means that unexpected storage surcharges must be met by the exporter.
LIMITED KNOWLEDGE OF CONTRACTUAL AGREEMENTS, INADEQUATE COMMODITY TRADING SCHEMES AND OUTDATED ARBITRATION FRAMEWORKS LEAD TO DIFFICULT NATIONAL AND INTERNATIONAL COMMERCIAL ARBITRATION
Disputes between stakeholders in the sector occur due to a high default risk and informal agreements between sell-ers and buyers. At the moment, some disputes between the contracting parties in Myanmar are settled by UMFCCI, when both parties of the dispute are members of it.116 Problems occur when buyers pledge to pay the sell-ers at a predicted high price but prices fall. The difficul-ty of establishing contractual agreements is confirmed by the World Bank Doing Business survey, which ranks Myanmar as the second worst country in the world for enforcement of contracts.117 In addition to the frequent informal arrangements between buyers and sellers, an outdated Myanmar Companies Act ( 1914 ) and Myanmar
115. According to MPBSMA, pulses, beans and oilseeds are exported from three main container yards.116. Myanmar Legal Services Ltd ( 2013 ). Doing Business in Myanmar.117. World Bank ( 2013 ). Doing Business in Myanmar : Enforcing Contracts. Available from: www.doingbusiness.org / data / explore economies / myanmar#enforcing-contracts.
Arbitration Act ( 1944 ),118 combined with widespread infor-mal agreements between sellers and buyers, complicate the absence of clear payment policies between buyers and sellers.
According to Thura Swiss, in 2010 MPBSMA banned the use of verbal agreements for transactions in the sector with the objective of encouraging formal commercial ar-rangements. This initiative has been difficult to implement because of the ingrained practices of stakeholders, lim-ited knowledge on use of contractual agreements, and the absence of efficient commercial courts or arbitration tribunals to solve disputes. There is a need to promote the use of contractual agreements and provide training of contract drafting to ensure the cessation of verbal agree-ments in the sector.
Based on the Myanmar Export / Import Rules and Regulations issued by MoC, international trade disputes must be resolved in accordance with the Arbitration Act.119 However, there is no public record of any international commercial arbitration cases conducted under it.120 This confirms the low utilization of the court system to conduct international arbitration awards. In addition to Myanmar becoming, on 15 July 2013, a signatory of the New York Convention on the Recognition and Enforcement of Foreign Arbitral Awards,121 it is important to ensure the country rapidly revises and implements the newly com-pleted Arbitration Act. This will facilitate arbitration cases between exporters of pulses, beans and oilseeds and their buyers and will also provide a renewed framework to guide national arbitration cases.
In addition to the limited capacities and outdated legisla-tive framework for commercial arbitration, there is weak management of future trading in the sector. Future trading in the beans and pulses market was banned for a time at the Yangon Commodity Exchange122 because of difficulty enforcing regulations confirming the actual existence of the goods. Even with such bans, future trading remained rampant. The problem is the lack of control to ensure mini-mum stock requirements in future trading. The lax imple-mentation of such regulations and oversight by Yangon Region Chamber of Commerce and Industry has led to a trading system based on the absence of guarantees in commodity trading. This situation has been the cause of some of the largest defaults in the sector.
118. Myanmar Legal Services Ltd ( 2013 ). Doing Business in Myanmar.119. PricewaterhouseCoopers ( 2012 ). Myanmar Business Guide.120. Myanmar Legal Services Ltd ( 2013 ). Doing Business in Myanmar.121. Clifford Chance ( July 2013 ). Myanmar Update : New York Convention Enters Into Force. Available from: www.cliffordchance.com / publicationviews / publications / 2013 / 07 / myanmar_update_newyorkconventionentersint.html.122. Thura Swiss ( August 2013 ). Myanmar’s Beans and Pulses Trade : Risks and Prospects, p. 5.

52 THE REPUBLIC OF THE UNION OF MYANMAR NATIONAL EXPORT STRATEGY BEANS, PULSES AND OILSEEDS SECTOR STRATEGY 2015-2019
In addition to changes in oversight to the sector, there is a need to ensure better organization of the Commodity Exchange through enhanced quality control of the beans and pulses sold. Also, there is a need for a new electronic commodity trading centre in order for buyers and sellers to have real time access to market prices.123 Hence, it will be important to ensure the new Myanmar Trade and Commodity Exchange Centre124 is set up rapidly and linked to regional centres.
INCONSISTENT PROCEDURES, INADEQUACIES AND LACK OF STANDARDS LIMIT EXPORTERS’ CAPACITY TO PROVIDE ADEQUATE CERTIFICATES TO RELEVANT AUTHORITIES
Exports of pulses, beans and oilseeds to target markets require exporters to provide buyers and customs authori-ties with a number of certificates confirming compliance of the product with applicable regulations. The absence of streamlined processes and weak capacities of certain institutions to issue required certificates makes it difficult for pulses, beans and oilseeds exporters to comply with this important buyer requirement.
The absence of national standards to guide the produc-tion and processing of pulses, beans and oilseeds makes it difficult for the sector to comply with international quality management regulations. National standards were last published in Myanmar in 1970 by the Standards Division of the Myanmar Scientific and Technological Research Department ( MSTRD ). Of the 65 national standards devel-oped, there was only one for agricultural and food prod-ucts. This standard has not been reviewed or updated since its definition. In the absence of a national reference system, exporters prefer to use the regulations and stand-ards of target markets. This leads to large discrepancies in quality management between the various producers, processors and exporters of pulses, beans and oilseeds in Myanmar. It is imperative to update the standards ap-plicable to pulses, beans and oilseeds through shortening the process for development, dissemination and applica-tion of standards relevant the sector.
The provision of a phytosanitary certificate is required to demonstrate compliance of goods with import regula-tions aiming to diminish the risks associated with the en-try, establishment or spread of plant pests and noxious weeds. In Myanmar, phytosanitary certificates are issued by MoAI-PPD. This department is considered to have ac-ceptable levels of human resources but lacks financial resources to effectively complete its mandate. However, the department is perceived as having weak procedures
123. Ibid. : p.10.124. Myanmar Business Network ( 2013 ). http : / / www.myanmar-business.org / 2013 / 02 / international-commodity-centre-to-be.html.
to issue the certificate, leading to longer than usual issu-ance timelines.
It has been identified that the absence of a streamlined process to receive all required authorization and certifi-cates greatly affects the time and costs of doing business for pulses, beans and oilseeds exporters. The gradual development of the Myanmar Automated Cargo and Port Consolidated System125 will greatly improve the efficien-cy of administrative and customs procedures for export-ers. This is particularly important since Myanmar requires many more documents and procedures to export than the regional ASEAN average.126 It is important to include private sector operators in discussions on and implemen-tation activities for the Myanmar Automated Cargo and Port Consolidated System, to ensure coherence with the needs of importers and exporters.
LIMITED RESOURCES AND COMPETENCIES IN KEY SUPPORT INSTITUTIONS LEAD TO OVERALL PERFORMANCE ISSUES
The above analysis of the sector’s TSIs provides an over-view of the institutional support provided to the sector. Most importantly, it illustrates that human and financial capacities of institutions need to be upgraded to build the sector’s export performance. The following institutions are deemed the most in need of additional support to perform their duties effectively for the sector’s development : MoAI ( PPD, DAR ), MoC ( trade promotion ), MPBSMA, Customs, Myanmar Foreign Trade Bank and Myanmar Investment and Commercial Bank, MoH ( FDA ), inspection agencies, MSTRD and the Road Transport Authority.
The analysis recommends developing targeted support plans to ensure these institutions have sufficient and adequately trained staff, a stable supply of financial re-sources, and increased motivation and support to build up inter-institutional coordination. The support needs to encourage the development of sustainable resource mo-bilization to ensure continuity.
INADEQUATE ORGANIZATION OF THE SECTOR AND ITS ASSOCIATIONS IMPEDES STRUCTURED VALUE CHAIN DEVELOPMENT
MPBSMA represents a large array of stakeholders from the sector and serves as a key focal point for the organi-zation of sector development efforts. The inclusion of oth-er associations in MPBSMA is critical to ensure effective dialogues between different private operators. However,
125. This system is an adaptation of the Nippon Automated Cargo and Port Consolidated System. It is a first step towards the creation of a single window system for Myanmar.126. World Bank ( 2013 ). Doing Business 2014.
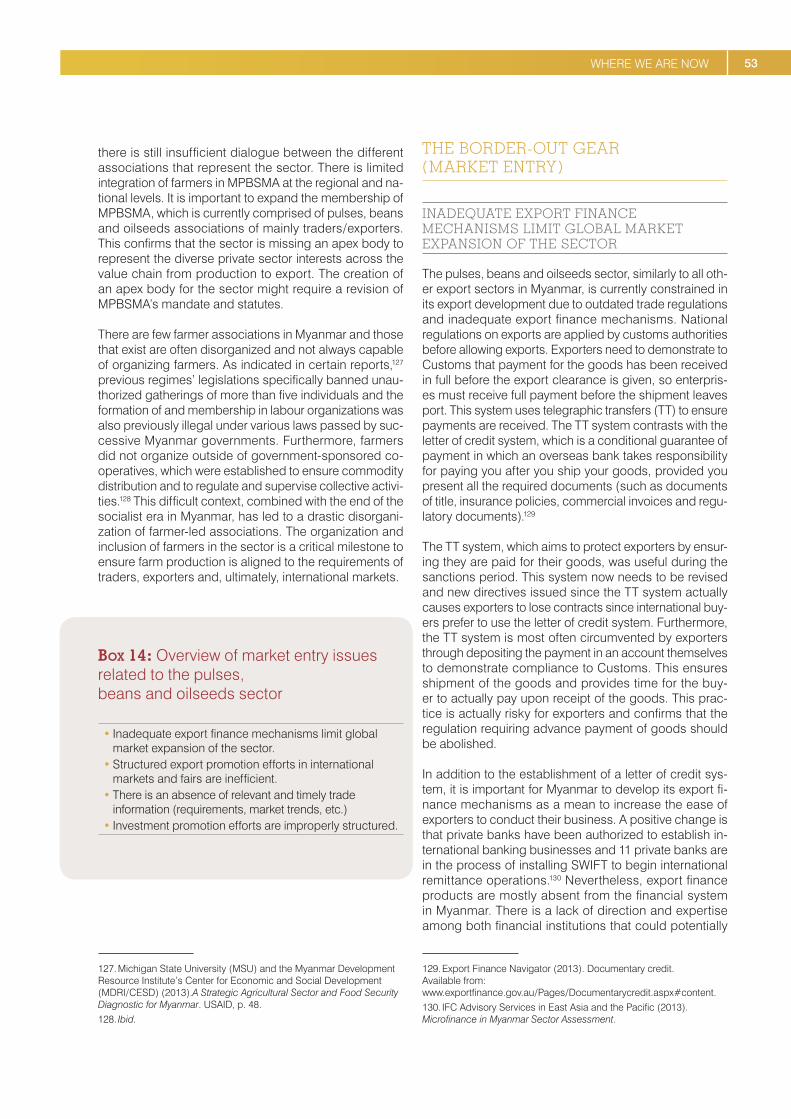
53WHERE WE ARE NOW
there is still insufficient dialogue between the different associations that represent the sector. There is limited integration of farmers in MPBSMA at the regional and na-tional levels. It is important to expand the membership of MPBSMA, which is currently comprised of pulses, beans and oilseeds associations of mainly traders / exporters. This confirms that the sector is missing an apex body to represent the diverse private sector interests across the value chain from production to export. The creation of an apex body for the sector might require a revision of MPBSMA’s mandate and statutes.
There are few farmer associations in Myanmar and those that exist are often disorganized and not always capable of organizing farmers. As indicated in certain reports,127 previous regimes’ legislations specifically banned unau-thorized gatherings of more than five individuals and the formation of and membership in labour organizations was also previously illegal under various laws passed by suc-cessive Myanmar governments. Furthermore, farmers did not organize outside of government-sponsored co-operatives, which were established to ensure commodity distribution and to regulate and supervise collective activi-ties.128 This difficult context, combined with the end of the socialist era in Myanmar, has led to a drastic disorgani-zation of farmer-led associations. The organization and inclusion of farmers in the sector is a critical milestone to ensure farm production is aligned to the requirements of traders, exporters and, ultimately, international markets.
Box 14 : Overview of market entry issues related to the pulses, beans and oilseeds sector
• Inadequate export finance mechanisms limit global market expansion of the sector.
• Structured export promotion efforts in international markets and fairs are inefficient.
• There is an absence of relevant and timely trade information ( requirements, market trends, etc. )
• Investment promotion efforts are improperly structured.
127. Michigan State University ( MSU ) and the Myanmar Development Resource Institute’s Center for Economic and Social Development ( MDRI / CESD ) ( 2013 ).A Strategic Agricultural Sector and Food Security Diagnostic for Myanmar. USAID, p. 48.128. Ibid.
THE BORDER-OUT GEAR ( MARKET ENTRY )
INADEQUATE EXPORT FINANCE MECHANISMS LIMIT GLOBAL MARKET EXPANSION OF THE SECTOR
The pulses, beans and oilseeds sector, similarly to all oth-er export sectors in Myanmar, is currently constrained in its export development due to outdated trade regulations and inadequate export finance mechanisms. National regulations on exports are applied by customs authorities before allowing exports. Exporters need to demonstrate to Customs that payment for the goods has been received in full before the export clearance is given, so enterpris-es must receive full payment before the shipment leaves port. This system uses telegraphic transfers ( TT ) to ensure payments are received. The TT system contrasts with the letter of credit system, which is a conditional guarantee of payment in which an overseas bank takes responsibility for paying you after you ship your goods, provided you present all the required documents ( such as documents of title, insurance policies, commercial invoices and regu-latory documents ).129
The TT system, which aims to protect exporters by ensur-ing they are paid for their goods, was useful during the sanctions period. This system now needs to be revised and new directives issued since the TT system actually causes exporters to lose contracts since international buy-ers prefer to use the letter of credit system. Furthermore, the TT system is most often circumvented by exporters through depositing the payment in an account themselves to demonstrate compliance to Customs. This ensures shipment of the goods and provides time for the buy-er to actually pay upon receipt of the goods. This prac-tice is actually risky for exporters and confirms that the regulation requiring advance payment of goods should be abolished.
In addition to the establishment of a letter of credit sys-tem, it is important for Myanmar to develop its export fi-nance mechanisms as a mean to increase the ease of exporters to conduct their business. A positive change is that private banks have been authorized to establish in-ternational banking businesses and 11 private banks are in the process of installing SWIFT to begin international remittance operations.130 Nevertheless, export finance products are mostly absent from the financial system in Myanmar. There is a lack of direction and expertise among both financial institutions that could potentially
129. Export Finance Navigator ( 2013 ). Documentary credit. Available from: www.exportfinance.gov.au / Pages / Documentarycredit.aspx#content.130. IFC Advisory Services in East Asia and the Pacific ( 2013 ).Microfinance in Myanmar Sector Assessment.

54 THE REPUBLIC OF THE UNION OF MYANMAR NATIONAL EXPORT STRATEGY BEANS, PULSES AND OILSEEDS SECTOR STRATEGY 2015-2019
provide trade finance and the Central Bank of Myanmar, which regulates them. There is a need to develop export finance instruments such as documentary collections, open accounts, export insurance, etc. at the national level.
Export finance is critical to all sectors in Myanmar but it is particularly important to the pulses, beans and oilseeds sector as the second largest export after petroleum and gas products. Discussions to develop export finance in-struments should include representatives from this im-portant export sector.
STRUCTURED EXPORT PROMOTION EFFORTS IN INTERNATIONAL MARKETS AND FAIRS ARE INEFFICIENT
The lack of export promotion activities in international markets is considered a primary cause explaining the high concentration of pulses, beans and oilseeds exports
to traditional markets ( India, China, Japan, Pakistan, Thailand, etc. ).Trade promotion efforts are relatively new to Myanmar and numerous challenges will need to be overcome to have an efficient promotion system for the sector. At the moment, the newly established commercial attachés in selected embassies lack adequate knowledge of products offered by the sector. Hence, there will be a need to increase dialogue between MoC, the Ministry of Foreign Affairs ( MoFA ) and exporters of pulses, beans and oilseeds to ensure effective promotion efforts.
As mentioned above, the limited participation of pulses, beans and oilseeds exporters in trade fairs limits their capacity to promote their products and to adapt to the latest market trends. There is currently no market inter-vention scheme ( cost sharing, group travel, promotion guidance, etc. ) to support exporters’ participation in trade fairs. Furthermore, the limited knowledge of exporters concerning branding and promotion techniques limits their capacity to project a positive and dynamic image

55WHERE WE ARE NOW
of the sector’s products. Hence, the development and promotion of a Myanmar brand of pulses, beans and oil-seeds would have important bearing on export value and competitiveness.
The newly established Department of Trade Promotion at MoC is initiating trade promotion efforts for priority export sectors, including the pulses, beans and oilseeds sector. There is a need for the Department of Trade Promotion to join forces with the private sector to build promotion efforts. It has been proposed to develop an international trade fair in Myanmar where exporters from multiple sec-tors, including pulses, beans and oilseeds, could present their products to international buyers.
The absence of a trade promotion agency to assist Myanmar exporters and potential exporters with informa-tion on market trends, market entry requirements, oppor-tunities, procedures and regulations has been recognized as a key requirement to boost the export sector.
THERE IS AN ABSENCE OF RELEVANT, RELIABLE AND TIMELY TRADE INFORMATION ( REQUIREMENTS, MARKET TRENDS, ETC. )
As was indicated earlier, the capacity of exporters to ac-cess relevant trade information is a key success factor for exporters to adapt their products to market require-ments and tap into emerging global trends. Access to reliable data in Myanmar has been considered a prima-ry challenge for exporters to understand the dynamics of production, processing and exports at national and global levels. Current reports produced on the pulses, beans and oilseeds sector provide partial information and should be supplemented with more detailed mar-ket reports and analyses. It also appears that informa-tion collected by various trade information institutions of Myanmar ( MoC, UMFCCI and MoFA ) do not reach export-ers efficiently. The absence of a trade information network to gather and centralize information at the national level,
and for specific sectors, is perceived as a key requirement for better dissemination of trade information.
Even with access to reliable and relevant trade informa-tion, the limited capacity of various sector stakeholders to understand sometimes complex information restricts their ability to make the best use of it. There is a need to organize structured training programmes on gathering and analysis of trade information.
INVESTMENT PROMOTION EFFORTS ARE IMPROPERLY STRUCTURED
The development of the sector – the largest agricultural export sector – requires structured investments in targeted areas to improve its performance. At the moment, sector investment development lacks a structured framework. MPBSMA does not have a detailed list of key priority in-vestment areas, based on the sector’s development ob-jectives, as a means to structure investment promotion efforts. A detailed list of priorities could support the work of the Myanmar Investment Commission ( MIC ) in attract-ing and authorizing investments. The endorsement on 2 November 2012131 of the new Foreign Investment Law and its clauses to structure investments in agriculture is aligned to sector stakeholders’ objective to be involved and guide investment in the sector. Nevertheless, MIC should increase its efforts to promote national and foreign investment in the sector.
MPBSMA has not been sufficiently active in organizing and participating in business matching meetings organ-ized by UMFCCI. Based on the above-mentioned list of priority investment areas, sector stakeholders will need to take on directly some of the investment promotion ef-forts of the sector.
131. Republic of the Union of Myanmar ( 2 November 2012 ). The Foreign Investment Law ( Law No. 21 / 2012 ). Available from: www.dica.gov.mm / includes / ... %2029-1-2013_.pdf
Box 15 : Overview of development issues related to the pulses, beans and oilseeds sector
• Difficult socioeconomic development of the sector’s rural farmers due to limited access to key services.
• Heightened risk of illness due to unhygienic storage.

56 THE REPUBLIC OF THE UNION OF MYANMAR NATIONAL EXPORT STRATEGY BEANS, PULSES AND OILSEEDS SECTOR STRATEGY 2015-2019
Figure 20 : Estimated GDP per capita by district ( 2009 )
0.50.81.22
-0.5-0.8-1.2-2#
Source : IDE-JETRO ( 2012 ). Myanmar economy viewed at night. Policy Review Series on Myanmar Economy, No.05, August.
THE DEVELOPMENT GEAR
Difficult socioeconomic development of the sector’s rural farmers due to limited access to key services.
As indicated earlier, there is a low distribution of key ser-vices such as finance, electricity, transport, etc., outside the main urban centres of Myanmar – Yangon, Nay Pyi Taw and Mandalay. According to figure 19, there is also an uneven and highly varied concentration of GDP per region in Myanmar.
The pulses, beans and oilseeds sector’s performance is largely based on the ability of its agricultural produc-ers in varied rural regions to increase production. The development of the sector is therefore closely linked to better distribution of services and support to producer groups in production areas. The strategic focus of favour-ing rural and agricultural development as part of sector development is fully aligned to Myanmar’s Framework for Economic and Social Reforms, which aims to favour private sector development as well as food security and agricultural growth.

57WHERE WE ARE NOW
HEIGHTENED RISK OF ILLNESS DUE TO PRODUCT ADULTERATION AND UNHYGIENIC STORAGE
The current method of storing and transporting edible oils in recycled metal drums creates a serious health con-cern for the local population, as well as for potential for-eign consumers. Previously, drums from imported palm oil would be re-used by the local sector. The increased prevalence of bulk palm oil imports however has severely limited the supply of available containers.
As a result, local stakeholders have increased their reli-ance upon recycled metal drums that had previously been used to carry industrial chemicals and other dangerous substances. Millers generally clean the drums with water and caustic soda, but the small openings in the contain-ers ( centimetres wide ), make effective cleaning difficult
at best. A sampling of such recycled drums has revealed the presence of highly toxic chemicals including irritants and carcinogens. These include trichloroethylene, mo-noisopropylamine, polyurethane, polyether polyol, styrene monomer, and various engine oil and fuels.
The presence of such toxic substances regularly mixed into one of the most prevalent food products in the na-tional diet creates a clear and present concern for public health. While certain health concerns may be placated through improved quality management practices and controls, diverse efforts must be made to reduce miller reliance upon unsafe containers, especially with regards to local and informal market activity. This could be done through enhancing awareness of both health issues and economic alternatives, while at the same time stressing the importance of increased hygienic standards as it re-lates to export expansion.

58 THE REPUBLIC OF THE UNION OF MYANMAR NATIONAL EXPORT STRATEGY BEANS, PULSES AND OILSEEDS SECTOR STRATEGY 2015-2019
WHERE WE WANT TO GO
VISIONThe following vision has been developed to guide the sec-tor and export development efforts of the pulses, beans and oilseeds sector.
“ Contribute to the socioeconomic development of Myanmar
by being a global provider of environmentally sustainable and value added products based on modern farming
and trading techniques. ”The scope for opportunities in the pulses, beans and oil-seeds sector is immense and extends along the entire value chain. Enhanced performance of the sector requires either strengthening certain links of the value chain, or making structural modifications to the links. The enhance-ment of the sector value chain will lead to increased mar-ket penetration ( increasing exports in existing markets ), product development ( increasing exports of new prod-ucts in existing markets ), market development ( increas-ing exports of existing products in new markets ), and full diversification ( increasing exports of new products in new markets ). The market development of the sector is a key requisite to achieve the sector’s vision of enhanced so-cioeconomic growth.
This envisaged future state of the pulses, beans and oil-seeds sector is discussed in greater detail below.

59WHERE WE WANT TO GO
Fig
ure
21 : F
utur
e va
lue
chai
n –
puls
es a
nd b
eans
sub
sect
or
Nat
iona
l com
pone
nt
Impo
rtpr
omot
ion
for
enric
hed
floor
s(w
ith fo
cus
on
orga
nics
)
Org
anic
ally
cert
ified
inpu
ts
Org
anic
pro
duct
ion
byin
divi
dual
farm
ers
asso
ciat
ions
and
coop
erat
ives
Incr
ease
org
anic
and
non-
orga
nic
liqui
d fe
rtili
zer
prod
uctio
n an
dim
port
s
Add
valu
e:Bu
ild u
p AS
EAN
GAP
cap
aciti
es
Impr
ove
qual
ity o
fpr
oces
sing
plan
ts (
ISO
)
Impr
ove
qual
ity,
pack
agin
g an
ddi
vers
ifica
tion
ofpr
oduc
t offe
r
Enha
nce
prod
uct
deve
lopm
ent
(inc
ludi
ng H
alal
)fo
r pr
oces
sed
prod
ucts
Impr
ove
qual
ityas
sura
nce
and
test
ing
Expa
ndpr
oduc
tion/
proc
essi
ngca
paci
ty to
ser
vegr
owin
g m
arke
t
Upg
rade
prod
uctio
n/pr
oces
sing
met
hods
to m
eet
qual
ity s
tand
ars
Enha
nce
qual
ityas
sura
nce
and
test
ing
capa
citie
s
Impr
ove
qual
ityas
sura
nce
and
test
ing
Enha
nce
valu
ead
ded
thro
ugh
prod
uct
deve
lopm
ent
Dis
trib
ute
Valu
e:R
euse
was
te fo
ran
imal
and
fish
feed
Crea
te V
alue
:lin
k to
oth
erse
ctor
s
Dis
trib
ute
valu
e:re
use
was
te fo
rel
ectr
icity
Ret
ain
valu
e:re
duce
pos
t-ha
rves
t los
ses
Addd
val
ue:
orga
nic
cert
ifica
tion
sche
me
Prim
ary
Supp
ortin
g Se
rvic
es
Stor
age
Colle
ctor
sRe
gion
alCr
opEx
chan
geCe
ntre
Larg
etra
ders
Expo
rts
Proc
esso
rs
Stoc
kist
Feed
Mill
ers
Ric
e, li
vest
ock
and
fishe
ries
sect
ors
Larg
eW
hole
sale
rs
Was
te c
olle
ctio
nto
run
gas
ifier
sfo
r ele
ctric
ityge
nera
tion
Elec
troni
cCo
mm
odity
(cro
p) E
xcha
nge
Cent
re(Y
ango
n an
dM
anda
lay)
Impo
rter
/W
hole
sale
rsRe
tail
Chin
a
Agen
ts
Colle
ctio
n
MoE
nerg
y
MoA
I-AM
D
MoA
I-PPD
MoA
I-DoA
MoA
I-DAR
MoA
I-WR
UD
MoA
I-AED
MoA
I-AED
MoC
oops
MoF
UMFC
CI
MPB
SMA
Mya
nmar
Indu
stry
Ass.
MoI
-DSI
MoC
-DoT
P
MoC
-DoT
MoC
-DCC
A
MCT
A&M
HTA
MoF
A
Insu
ranc
e co
mpa
nies
MoH
-FD
A
Regi
onal
cro
pex
chan
ge c
entre
s
MoA
I-irr
igat
ion
Labo
rato
ries
- Q
ualit
y te
stin
gBa
nks
- Fi
nanc
ial s
ervi
ces
Tech
nica
l and
mai
nten
ance
ser
vice
s
Mya
. Agr
i. D
ev. B
ank
Lege
nd
Inte
rnat
iona
l com
pone
nt
Impo
rter
/W
hole
sale
rsRe
tail
Japa
n
Impo
rter
/W
hole
sale
rsRe
tail
Phili
ppin
es
Impo
rter
/W
hole
sale
rsRe
tail
Chin
ese-
Taip
ei
Impo
rter
/W
hole
sale
rsRe
tail
Mal
aysi
a
Impo
rter
/W
hole
sale
rsRe
tail
EU (
UK)
Impo
rter
/W
hole
sale
rsRe
tail
Thai
land
Impo
rter
/W
hole
sale
rsRe
tail
Indo
nesi
a
Impo
rter
/W
hole
sale
rsRe
tail
Mid
dle_
east
(U
AE, T
urke
y, Is
rael
, etc
.)
Impo
rter
/W
hole
sale
rsRe
tail
Indi
a
Re-p
acke
r
Proc
esso
r
Re-p
acke
r
Proc
esso
r
Re-p
acke
r
Proc
esso
r
Re-p
acke
r
Proc
esso
r
Re-p
acke
r
Proc
esso
r
Re-p
acke
r
Proc
esso
r
Re-p
acke
r
Proc
esso
r
Re-p
acke
r
Proc
esso
r
Re-p
acke
r
Proc
esso
r
Re-p
acke
r
Proc
esso
r
Impr
ove
qual
ity,
stan
dard
s an
dpr
oduc
tde
velo
pmen
tca
pabi
litie
s
Impr
ove
prod
uct
deve
lopm
ent a
ndm
arke
ting
capa
bilit
ies
Seed
s
Fert
ilize
rs
Pest
icid
e
Farm
equi
pmen
t
Labo
ur
Land
Wat
er
R&
D
Inpu
t
Farm
prep
arat
ion
Plan
ting
Wee
ding
Har
vest
Post
-ha
rves
tSt
orag
e
Farm
pro
duct
ion

60 THE REPUBLIC OF THE UNION OF MYANMAR NATIONAL EXPORT STRATEGY BEANS, PULSES AND OILSEEDS SECTOR STRATEGY 2015-2019
Fig
ure
22 : F
utur
e va
lue
chai
n –
oils
eeds
sub
sect
or
Nat
iona
l com
pone
nt
Impo
rtpr
omot
ion
for
enric
hed
floor
s(w
ith fo
cus
on
orga
nics
)
Org
anic
ally
cert
ified
inpu
ts
Org
anic
pro
duct
ion
byin
divi
dual
farm
ers
asso
ciat
ions
and
coop
erat
ives
Incr
ease
org
anic
and
non-
orga
nic
liqui
d fe
rtili
zer
prod
uctio
n as
wel
las
impo
rts
Add
valu
e:Bu
ild u
p AS
EAN
GAP
cap
aciti
es
Focu
s on
incr
easi
ng q
ualit
yan
d sa
fety
stan
dars
Dev
elop
rela
tions
hips
and
enha
nce
qual
ity to
pa
rtic
ipat
e in
te
nder
s
Expa
ndpr
oduc
tion/
proc
essi
ngca
paci
ty to
ser
vegr
owin
g m
arke
t
Enha
nce
valu
ead
ded
thro
ugh
prod
uct
deve
lopm
ent
Mai
ntai
n an
dst
reng
then
exis
ting
trad
ere
latio
nshi
ps
Adap
t pro
duct
offe
ring
to m
eet
loca
l nee
ds (
e.g
Hal
al c
ertif
icat
ion)
Achi
eve
high
qual
ity s
tand
ars
and
valu
e ad
ditio
n
Add
valu
e: im
prov
equ
ality
man
agem
ent
(HAC
CP)
and
cert
ifypr
oces
ses
(ISO
/G
MP)
Crea
te v
alue
:in
crea
se c
ake
prod
uctio
n
Dis
trib
ute
valu
e:re
use
was
te fo
rel
ectr
icity
Ret
ain
valu
e:re
duce
pos
t-ha
rves
t los
ses
Addd
val
ue:
orga
nic
cert
ifica
tion
sche
me
Prim
ary
Supp
ortin
g Se
rvic
es
Stor
age
Colle
ctor
s
Oils
eeds
Oils
eeds
exp
orts
(hul
led
and
dehu
lled)
Smal
lpr
oces
sing
uni
ts(r
oast
ing,
pic
klin
g,po
wde
ring)
Gas
ifier
s fo
rel
ectri
city
gene
ratio
n
Oil
cake
Who
lesa
lers
Who
lesa
lersExpo
rter
s
Pow
der
expo
rts
(120
00 to
ns)
Who
lesa
lers
Feed
Mill
ers
Loca
lm
arke
t
Loca
l mar
ket f
ored
ible
oils
(300
000
tons
)
Furt
her d
evel
opm
ent o
rm
arke
t for
ani
mal
and
fish
feedEx
port
sCh
ina
and
Taip
eiO
il m
ills
(~36
00re
gist
ered
)(o
nly
20%
inop
erat
ion)
Seed
s fo
red
ible
oil
Agen
ts
Colle
ctio
n
MoE
nerg
y
MoA
I-AM
D
MoA
I-PPD
MoA
I-DoA
MoA
I-DAR
MoA
I-WR
UD
MoA
I-AED
MoA
I-AED
MoC
oops
MoF
UMFC
CI
MPB
SMA
Mya
nmar
Indu
stry
Ass.
MoI
-DSI
MoC
-DoT
P
MoC
-DoT
MoC
-DCC
A
MCT
A&M
HTA
MoF
A
Insu
ranc
e co
mpa
nies
MoH
-FD
A
Regi
onal
cro
pex
chan
ge c
entre
s
MoA
I-irr
igat
ion
Labo
rato
ries
- Q
ualit
y te
stin
g
Bank
s -
Fina
ncia
l ser
vice
s
Tech
nica
l and
mai
nten
ance
ser
vice
s
Mya
. Agr
i. D
ev. B
ank
Lege
nd
Inpu
t
Inte
rnat
iona
l com
pone
nt
Stre
ngth
endi
vers
ifica
tion
and
valu
e ad
ditio
nth
roug
h ne
wpr
oduc
tde
velo
pmen
t
Impo
rter
/W
hole
sale
rsRe
tail
Roas
ter/
pack
erCh
ina
Oil
Mill
s
Impo
rter
/W
hole
sale
rsRe
tail
Roas
ter/
pack
erJa
pan
Oil
Mill
s
Impo
rter
/W
hole
sale
rsRe
tail
Roas
ter/
pack
erR
epub
lic o
f Kor
ea
Oil
Mill
s
Impo
rter
/W
hole
sale
rsRe
tail
Roas
ter/
pack
erM
alay
sia
Oil
Mill
s
Impo
rter
/W
hole
sale
rsRe
tail
Roas
ter/
pack
erVi
et N
am
Oil
Mill
s
Impo
rter
/W
hole
sale
rsRe
tail
Roas
ter/
pack
erTh
aila
nd
Oil
Mill
s
Impo
rter
/W
hole
sale
rsRe
tail
Roas
ter/
pack
erIn
done
sia
Oil
Mill
s
Impo
rter
/W
hole
sale
rsRe
tail
Roas
ter/
pack
erN
ethe
rlan
ds
Oil
Mill
s
Impo
rter
/W
hole
sale
rsRe
tail
Roas
ter/
pack
erIn
dia
Oil
Mill
s
Expa
ndpr
oduc
tion/
proc
essi
ngca
paci
ty to
ser
vegr
owin
g m
arke
t
Seed
s
Fert
ilize
rs
Pest
icid
e
Farm
equi
pmen
t
Labo
ur
Land
Wat
er
R&
D
Farm
prep
arat
ion
Plan
ting
Wee
ding
Har
vest
Post
-ha
rves
tSt
orag
e
Farm
pro
duct
ion

61WHERE WE WANT TO GO
MARKET IDENTIFICATIONThe following section provides insights into market devel-opment opportunities based on quantitative and qualita-tive research.
Key markets associated with short-term opportunities are selected based on factors such as existing trade relation-ships, cultural affinity and geographical distances. These factors highlight strong existing market linkages that form the foundation for expanded future growth. Markets rep-resenting longer-term opportunities reflect the increasing ability of exporters to move into new and / or higher value markets over time – as envisioned by the NES and its PoA.
Beyond identifying export markets for beans, pulses and oilseeds, the potential to target leading internation-al agricultural commodity exporters should also be not-ed. Reports suggest that major multinationals such as Cargill132 and Alliance Grain Traders133 have been pro-actively exploring growth opportunities in Myanmar. Facilitating market entry through targeted investment at-traction activities could be a way for Myanmar to quickly leverage the capital, global distribution networks, tech-nical capacity and marketing expertise of established industry leaders while boosting the sector’s overall competitiveness.
BEANS AND PULSES MARKET OVERVIEW
Myanmar’s existing areas of export strength in beans and pulses are largely focused around dry beans – particu-larly black gram and green gram. Myanmar exports ap-proximately 1 million tons of beans and pulses annually, of which green gram represents roughly 30 % of export vol-ume and black gram represents roughly 60 %.134 Although other bean and pulse varieties ( such as pigeon peas, cow peas and chickpeas ) also play a critical role in agricultural production, green and black gram ( dry beans : HS071331 ) have been prioritized due to their relative importance in the sector’s export basket. In 2012 Myanmar’s total export value of dry beans ( HS 071331 ) was over US $ 384 million, while global exports of dry beans were valued at roughly
132. Jeremy Grant ( 2013 ). Myanmar : will Asia’s breadbasket rise again? Financial Times : Beyond BRICS Blog, 25 January. Available from: http : / / blogs.ft.com / beyond-brics / 2013 / 01 / 25 / myanmar-will-asias-breadbasket-rise-again / .133. Alliance Grain Traders Inc. ( 2013 ). Management’s Discussion and Analysis for the Year Ended December 31, 2012, p. 7. Available from: www.alliancegrain.com / download / 230.134. USDA Foreign Agricultural Service ( 2013 ). Union of Burma beans and pulses monthly report November 2012. Global Agricultural Information Network Report No. 1049, 15 January. USDA Foreign Agricultural Service. Available from: http : / / gain.fas.usda.gov / Recent %20GAIN %20Publications / Beans %20and %20Pulses %20Monthly %20Report %20November %202012_Rangoon_Burma %20- %20Union %20of_1-15-2013.pdf.
US $ 790 million. These figures indicate that Myanmar is the world’s top exporter of dry beans, accounting for al-most 50 % of global exports in 2012.135
Beans and pulses are staple foods in many markets and consumer preferences for different species vary signifi-cantly depending on regional tastes and traditions. The Indian market is particularly important for the bean and pulse sector, as well as other traditional markets such as Japan, Pakistan and Indonesia. Consumption also takes place in ‘non-traditional’ markets such as the United States and the United Kingdom, where consumers have a growing appetite for ethnic foods and a rising aware-ness of the nutritional benefits associated with beans and pulses. Beyond traditional foods, beans and pulses are also increasingly recognized as valuable ingredients for processed foods thanks to their potential to improve prod-uct positioning with enhanced health and sustainability claims.
A notable trend affecting beans and pulses is the long-term decline in per capita consumption stemming from rising world incomes, increasing urbanization and asso-ciated changes to consumer preferences. For instance, India’s per capita consumption of beans and pulses decreased by 43 % ( from 23 to 13 kg ) between 1961 and 2007 ; China’s per capita consumption decreased 90 % ( from 10 to 1 kg ) over the same period ; and North American per capita consumption has remained steady at roughly 3.5 kg per person.136 Despite this decline in per capita consumption, it is important to note that aggre-gate world demand for beans and pulses is still expand-ing due to a rising world population. In fact, the rapidly growing world population ( particularly in developing na-tions ) is expected to offset the impact of declining per capita consumption and drive overall growth in global bean and pulse consumption by over 20 % in the coming decades, with the largest increases in demand forecast for Asia and Africa.137
As indicated earlier, Myanmar’s existing exports are highly concentrated within a handful of markets. For instance, in 2012 roughly 71 % of dry bean exports were shipped to India and 9 % to Indonesia. This reflects geographic prox-imity and overall import trends, but also highlights oppor-tunities for diversification. Myanmar’s currently low level of diversification and limited capacity for value added activity means that the country is a price taker on world markets. Indeed, for dry beans ( HS 071331 ), Myanmar’s unit value of exports of 723 ( US $ / unit ) is below the world average
135. ITC calculations based on UN Comtrade statistics136. Tiwari, B. K., Gowen, A. and McKenna, B., eds ( 2011 ). Pulse Foods : Processing, Quality and Nutraceutical Applications. London : Elsevier. E-book.137. Clancey, B. ( 2009 ). World Pulse Outlook : Report to The Saskatchewan Pulse Growers. Canada : Stat Publishing. Available fromhttp : / / archive.saskpulse.com / media / pdfs / 091005_Final_Brian_Clancey_World_Pulse_Outlook.pdf.

62 THE REPUBLIC OF THE UNION OF MYANMAR NATIONAL EXPORT STRATEGY BEANS, PULSES AND OILSEEDS SECTOR STRATEGY 2015-2019
of 847 ( US $ / unit ).138 Further, it is estimated that only 5 % to 10 % of Myanmar’s beans and pulses go through any processing.139 This low level of processing is further con-strained by the use of relatively old and simple technolo-gies. Given the sector’s low levels of processing activity, existing exports consist mainly of bulk shipments of raw seeds, with low volumes of shelling, sorting and splitting.
Increasing the level of processing at the origin of sup-ply can play an important role in enhancing efficiencies of scale and adding value to the sector while building opportunities in rural bean and pulse growing regions. Beyond expanding shelling, sorting and splitting capaci-ties, Myanmar exporters should position themselves for long-term growth with the introduction of new products such as bean flours or other wholesale or consumer pack-aged goods. Myanmar’s large domestic population and
138. ITC calculations based on UN Comtrade statistics.139. Thura Swiss ( August 2013 ). Myanmar’s Beans and Pulses Trade : Risks and Prospects.
geographic proximity to major bean and pulse importers means that the country is well-positioned to expand value added activities.
Nevertheless, it is important to emphasize that as the sector moves up the value chain, market entry decisions will become increasingly predicated by the sector’s abil-ity to adapt to different foreign regulatory environments and consumer preferences. Adapting to these variables will require significant institutional and technical capac-ity upgrading. Moreover, much of the sector’s long-term potential will depend on enhanced marketing, food devel-opment and agricultural sciences to unlock higher value and improve the sector’s overall competitiveness. With strategic investments in technical and capacity upgrad-ing, Myanmar can strengthen market development while building its position as a leading source of beans, pulses and associated value added products.
Short – and mid-to-long-term country-specific market op-portunities are identified below.

63WHERE WE WANT TO GO
Table 15 : Beans and pulses : short-term ( 1-3 years )
Target market Product Distribution
channel
2012 exports to market ( US $
thousands )
Exported growth in value( % ) ( 2008–2012 )
Average GDP growth 2013–2018 forecast
( % change )
India Green gram• Not graded, not sized• Fair average qualityBlack gram• Dehusked• Whole or split
Wholesalers 272180 0 5.84
UAE Black gram• Special quality• Husked or dehusked• Whole or split
Wholesalers — — 3.69
Viet Nam Black gram• Special quality• Husked
Wholesalers — — 5.43
Malaysia Black gram• Special quality• Husked
Wholesalers 11627 16 5.07
Indonesia Black gram• Special quality• Husked
Wholesalers 36443 37 5.80
China Green gram• Graded and sized• Not graded, not sized• Husked or dehusked• Fair average quality
Wholesalers 18239 3 7.14
Chinese Taipei
Green gram• Graded and sized• Husked or dehusked• Special quality
Wholesalers 7347 17 3.85
Japan Green gram• Graded, sized and sorted• Husked• Special quality
Wholesalers 6282 14 1.29
United Kingdom
Green gram• Graded, sized and sorted• Husked• Special quality
Wholesalers 4779 27 1.94
Source : ITC calculations based on UN Comtrade data, growth rates based on IMF estimates ( World Economic Outlook database ).
INDIA
Products : green gram, black gram
India is the world’s most important import market for beans and pulses, with a 47 % share of world imports for dry beans ( HS071331 ) in 2012. Both green gram and
black gram bean varieties are essential ingredients in a wide range of traditional Indian dishes. As indicated ear-lier, Myanmar has well established trading relationships with India stemming from close geographic proximity and other historical ties. By building upon existing capacities and leveraging broker networks, Myanmar can expand its exports to India and strengthen the foundations needed to

64 THE REPUBLIC OF THE UNION OF MYANMAR NATIONAL EXPORT STRATEGY BEANS, PULSES AND OILSEEDS SECTOR STRATEGY 2015-2019
enter the market with higher value-added products. Further opportunities can be identified through participation in exploratory trade missions as well as enhanced market research ( including greater interactions by sector stake-holders with Myanmar’s economic attaché in New Delhi ).
Myanmar’s dry bean exports are currently highly depend-ent on the Indian market. Given this dependence on the Indian market, it is important to recognize key challenges affecting the prospects for future exports. In particular, growing concerns regarding food security among Indian policymakers are being used as the basis to justify protec-tionist measures, including an import substitution scheme composed of minimum support prices and possibly im-port duties ranging from 7.5 % to 30 %.140, 141 In addition, Myanmar’s growth in pulses exports to the Indian market has been stagnant for several years, with no growth in export value recorded between 2008 and 2012. The po-tential introduction of an import substitution scheme com-bined with limited growth prospects for exports of bulk dry beans into India highlights the importance of export-ers adapting their product offering towards higher value outputs, including retail-ready packaging of dry beans in smaller bags as well as other consumer-ready products
UAE
Product : black gram
The UAE is an important destination for exports of black gram. The country is home to a large Indian diaspora es-timated at 1.75 million, or roughly 30 % of the total UAE population.142 The country also represents a hub for fur-ther downstream processing and distribution of beans and pulses into Middle Eastern and other global markets. In 2010 the UAE imported dry beans ( HS071331 ) valued at US $ 6.5 million, or roughly 0.9 % of total exports from Myanmar, making it a small market overall, with a 0.7 % share of world imports of dry beans in 2012.
VIET NAM
Product : black gram
Myanmar has strong existing trade relationships with Viet Nam for the export of black gram. Viet Nam’s significance as an import destination is reflected by a 4.9 % share of
140. AninditaDey ( 2013 ). Agri ministry proposes import duty on pulses. Business Standard, 26 October. Available from: www.business-standard.com / article / markets / agri-ministry-proposes-import-duty-on-pulses-113102600363_1.html.141. Sean Pratt ( 2013 ). Rain boosts India’s pulse supply outlook. The Western Producer, 23 July. Available from: www.producer.com / 2013 / 07 / rain-boosts-indias-pulse-supply-outlook / .142. Embassy of India, Abu Dhabi, UAE ( 2013 ).UAE Indian Community. Available from : http : / / uaeindians.org / profile.aspx.
world imports of dry beans ( HS071331 ) in 2012.Similarly to neighbouring East Asian countries, black gram beans are widely used for sprouting as well as for use in pastes, soups, desserts and other traditional dishes. In order to continue building trading relationships in the Vietnamese market, further opportunities can be explored by liaising with Viet Nam’s commercial attaché in Yangon. It is ex-pected that the ASEAN Economic Community ( AEC ) will offer opportunities for expanded trade with Viet Nam fol-lowing the full entrance of Myanmar in 2012.
MALAYSIA
Product : black gram
Exports of dry beans ( HS071331 ) from Myanmar to Malaysia have grown by 16 % between 2008 and 2012. In 2012 the country represented 3 % of Myanmar’s dry bean exports and a 2.1 % share of global imports. Economic in-tegration between Myanmar and Malaysia will increase as a result of the AEC, offering greater opportunities for trade and investment in the bean and pulse sector. A specific attention to quality has been identified as a key deter-mining factor for exports to this market for special quality husked beans.
INDONESIA
Product : black gram
Indonesia is the fastest growing market for Myanmar’s dry bean exports, with a growth in export value of 37 % between 2008 and 2012.Indonesia is among the world’s top dry bean ( HS071331 ) importing countries, with a 5.9 % share of world imports, and a 9.5 % share of Myanmar exports in 2012.Opportunities for trade and investment with Indonesia are expected to increase thanks to greater economic integration through the AEC. The development of processed products with halal certification can also offer opportunities for export growth in the medium-to-long term.
CHINA
Product : green gram
Green gram beans are used in Chinese cuisine in a vari-ety of dishes in the form of sprouts, shelled, whole or split beans or pastes, and are an important ingredient across a wide range of dishes. Although China represents a large and important market, growth in exports from Myanmar has been limited in the past few years, estimated at only 3 % between 2008 and 2012.In 2012 China represented a 4.7 % share of Myanmar’s dry bean ( HS071331 ) exports and a 3.2 % share of global imports. Despite having a

65WHERE WE WANT TO GO
shared border with China, a weak border trade system makes the development and enforcement of contracts between Chinese and Myanmar trading partners difficult. These difficulties limit the development of effective trading relationships with Chinese partners and ultimately cre-ate obstacles to expansion in the Chinese market. As in India, medium-term opportunities may lie in the provision of higher value outputs, including retail-ready packaging of dry beans in smaller bags as well as other consumer-ready products.
CHINESE TAIPEI
Product : green gram
Chinese Taipei is viewed to be a stable export market for Myanmar’s beans and pulses. Green gram beans are commonly used for sprouting and are an essential ingre-dient in Taiwanese-style mooncake, as well as many other traditional dishes and beverages. In 2012 the Chinese Taipei market encompassed 1.9 % of Myanmar dry bean ( HS071331 ) exports and a 2 % share of global imports. Exports of dry beans from Myanmar to Chinese Taipei grew by 17 % between 2008 and 2012. Exporters can cap-ture value added opportunities through quality assurance systems, including the implementation of physical analy-ses such as sanitary and phytosanitary certifications, test-ing germination rates, chemical residues, etc.
JAPAN
Product : green gram
Japan represents the second most important global mar-ket for dry beans ( HS071331 ), behind India, with an 11.8 % share of world imports. Japanese importers are increas-ingly seeking alternative sources in order to reduce their current dependence on China. Although Myanmar dry beans offer a price advantage over Chinese and other
country imports, market access to Japan is dependent on meeting high quality and food safety standards, including sanitary and phytosanitary requirements, testing of ger-mination rates and chemical residues, etc.
UNITED KINGDOM
Product : green gram
The United Kingdom is a rapidly growing market for Myanmar dry bean exports, with 28 % growth in export val-ue recorded between 2008 and 2012.The country repre-sented a 1.2 % share of Myanmar’s dry bean exports and a 1.7 % share of global imports in 2012. The United Kingdom is home to a large and diverse immigrant population, with an estimated 2.8 million people ( roughly 5.1 % of the total population ) from Indian, Pakistani and Bangladeshi eth-nic groups.143
As this large ethnic population continues to grow and in-tegrate with local communities, it is driving demand for traditional foods made from beans and pulses. This de-mand has also spilled over into other segments of the population who are increasingly developing an appetite for Indian and Pakistani cuisine. Beyond demand for eth-nic foods, consumers and food processors in Western countries are increasingly turning to beans and pulses as a source of gluten-free, high fibre and environmentally sustainable ingredients. Beans and pulses also represent potential ingredients in high-margin pet foods ( such as or-ganic or vegetarian pet foods ). Significant efforts in mar-ket research, food development, and the establishment of collaborative relationships with major food processors can assist in integrating beans and pulses into a greater variety of processed products in the United Kingdom.
143. Office for National Statistics. ( 2009 ). Size of ethnic groups : ONS estimates, 2009. Available from: www.ethnicity.ac.uk / population / size.html.

66 THE REPUBLIC OF THE UNION OF MYANMAR NATIONAL EXPORT STRATEGY BEANS, PULSES AND OILSEEDS SECTOR STRATEGY 2015-2019
Table 16 : Beans and pulses : medium-to-long term ( 3+ years )
Target market Product Distribution channel
2012 exports to market ( US $
thousands )
Exported growth in value ( % )
( 2008–2012 )
Average GDP growth 2013–2018 forecast( % change )
United Kingdom Black gram• Special quality• Husked or dehusked• Whole or splitBlack gram flour
Wholesalers 4779 27 1.94
India Green gram• Graded, sorted, sized• Whole or split• Husked or dehuskedBlack gram flour
Wholesalers 272180 0 5.84
UAE Green gram• Special quality• Graded and sized• Husked or dehusked• Whole or splitBlack gram flour
Wholesalers — — 3.69
Japan Green gram• Graded, sized and
sorted• Husked• Branded products
Wholesalers 6282 14 1.29
Source : ITC calculations based on UN Comtrade data, growth rates based on IMF estimates ( World Economic Outlook database ).
UNITED KINGDOM
Products : black gram, black gram flour
Over the medium to long term, the United Kingdom of-fers important prospects for Myanmar exporters seeking to enter higher value markets. By building on existing re-lationships and emerging capacities, Myanmar firms will be able to expand their product offering. Initial areas of fo-cus include special quality hulled or dehulled black gram ( split or whole ), as well as black gram flour. Other longer-term opportunities include the introduction of a greater range of consumer packaged goods targeting the United Kingdom’s growing demand for ethnic foods, as well as opportunities for partnerships with food processors in Western countries seeking sources of gluten-free, high fi-bre or environmentally sustainable ingredients. Significant upgrading of technical and processing capacity as well as improvements to quality certification and traceabil-ity will be needed to satisfy the demands of British con-sumers and regulators. Experiences gained in the United Kingdom market will ultimately help to provide exporters with skills and capacities needed to support entry into other Western markets.
INDIA
Product : black gram flour
India will remain at the heart of Myanmar’s bean and pulse export strategy given the country’s close proximity and growing demand. Beyond existing exports of black gram and green gram beans, black gram flour has been iden-tified as a potential new product with strong prospects in the Indian market. Black gram flour is a key ingredient in the preparation of Indian-style snack foods – a rapidly growing market segment being driven by the country’s growing middle-class. The introduction of new products such as black gram flour will allow exporters to move up the value chain while building capacity for more value added activities.
Over the long term these increasing capacities will strengthen Myanmar’s ability to achieve greater levels of diversification and higher value. Despite this poten-tial, an important finding with possible repercussions on market entry of higher value products into India is the apparent consumer preference for products originating from domestic processing facilities rather than foreign.

67WHERE WE WANT TO GO
This preference has been witnessed by Canadian pulse exporters to India.144 This finding suggests that consumer attitudes could weigh heavily on market entry strategy, and could ultimately affect the sector’s ability to suc-cessfully locate higher value-added activities in Myanmar when serving the Indian market.
UAE
Product : green gram
The UAE offers important opportunities as a hub for fur-ther processing and future access to new and emerging markets. The country is currently a destination for exports of black gram ; however, with increased capacity the ex-port of green gram beans will also offer valuable opportu-nities for exporters. The UAE’s large Indian diaspora and relatively high income underscores the country’s strong demand for special quality green gram beans. Moreover, despite the UAE’s relatively small market size, these fac-tors highlight the country’s strategic potential as a loca-tion to build on future opportunities for diversification into Middle Eastern or African markets. It is important to note that exporters will need to adapt to the UAE’s consum-er demands and food safety regulations with enhanced quality and safety testing.
JAPAN
Product : green gram
Exporters can build on existing successes in the Japanese market by achieving a greater level of diver-sification through expanded product offerings. Beyond existing exports of black gram, the introduction of green gram beans ( graded, sized and husked ) is a significant opportunity. As Myanmar exporters move into higher val-ue markets in Japan the effective use of branding strate-gies will play an important role in differentiating exports and capturing new opportunities for consumer packaged goods. Upgrading production and processing methods to meet Japan’s strict food safety standards is also a good opportunity for Myanmar exporters to meet ( or exceed ) the standards of several other markets.
The opportunities identified above for black gram and green gram reflect areas in which Myanmar export-ers can build the strengths and capacities needed to achieve broader enhancements in the overall bean and pulse subsector. Enhancements in this subsector can also spill over into other areas, triggering a cascade of
144. Agriculture and Agri-Food Canada ( 2009 ). Consumer Trends – Pulses in India. Market Indicator Report December 2009. Ottawa : Government of Canada. Available from: www.gov.mb.ca / agriculture / statistics / agri-food / india_pulses_en.pdf.
improvements throughout the country’s agri-food sec-tor and the broader economy. For instance, the lessons learnt as black and green gram exporters implement the production and processing methods needed to satis-fy varying food safety regulations among trading part-ners can be leveraged to support market entry for other agri-food products or commodities. Exposure to world markets can also play a critical role in ensuring greater ef-ficiency, competitiveness and innovation among domes-tic firms. Targeted improvements to the black gram and green gram subsectors will play a key role in facilitating improvements to overall sector capacity while stimulating development in other areas.
OILSEEDS MARKET OVERVIEWSESAME SEEDS
Sesame seeds are known for their rich flavour and are used as a condiment or spice, in baked goods, snacks and confections, and as a valuable source of edible oil. The seeds are also key ingredients in many traditional recipes. The seeds can vary in colour depending on the plant variety ; however they are generally classified as white or black, with lighter coloured seeds typically be-ing considered of higher quality.145 However, regional pref-erences are apparent, with both black and white seeds being popular in Asian markets and white seeds being most popular in Western markets. Less visually appeal-ing ( brown or spotted ) seeds are typically classified as oil grade, while other physical and chemical properties also influence grading.
Sesame seeds are generally sold either as unroasted or roasted, and hulled or unhulled. Sesame oil also comes in two main varieties – roasted or unroasted. Unroasted oil is light tasting, pale yellow in colour and suitable for frying at high temperatures. Alternatively, roasted ses-ame oil has a stronger taste, darker colour, and a low smoke point meaning that it is a good seasoning but is unsuitable for cooking at high temperatures.146 The left-over meal from seed crushing processes has relatively high value in animal feed applications given its strong nutritional profile.147
145. Agricultural Marketing Resource Centre ( 2011 ). Sesame profile. Available from : www.agmrc.org / commodities__products / grains__oilseeds / sesame_profile.cfm.146. Ibid.147. Jefferson Agricultural Institute. ( 2013 ). Sesame : a High-Value Oilseed. Available from www.jeffersoninstitute.org / pubs / sesame.shtml.
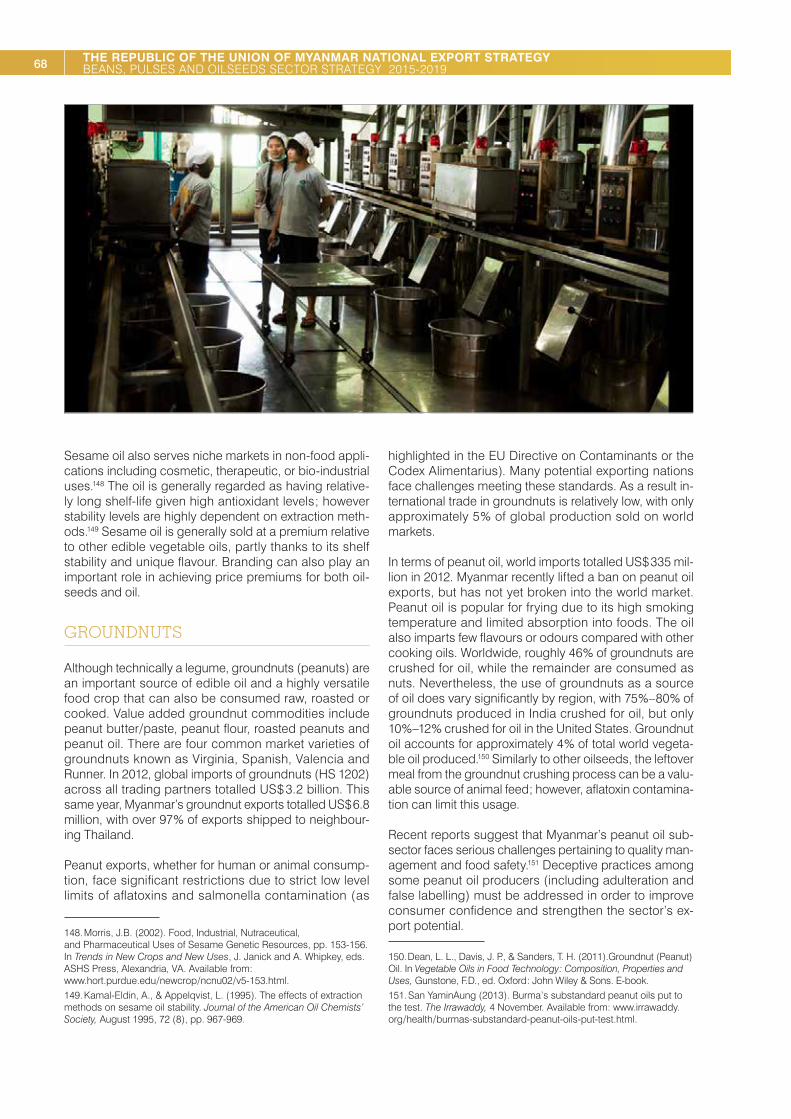
68 THE REPUBLIC OF THE UNION OF MYANMAR NATIONAL EXPORT STRATEGY BEANS, PULSES AND OILSEEDS SECTOR STRATEGY 2015-2019
Sesame oil also serves niche markets in non-food appli-cations including cosmetic, therapeutic, or bio-industrial uses.148 The oil is generally regarded as having relative-ly long shelf-life given high antioxidant levels ; however stability levels are highly dependent on extraction meth-ods.149 Sesame oil is generally sold at a premium relative to other edible vegetable oils, partly thanks to its shelf stability and unique flavour. Branding can also play an important role in achieving price premiums for both oil-seeds and oil.
GROUNDNUTS
Although technically a legume, groundnuts ( peanuts ) are an important source of edible oil and a highly versatile food crop that can also be consumed raw, roasted or cooked. Value added groundnut commodities include peanut butter / paste, peanut flour, roasted peanuts and peanut oil. There are four common market varieties of groundnuts known as Virginia, Spanish, Valencia and Runner. In 2012, global imports of groundnuts ( HS 1202 ) across all trading partners totalled US $ 3.2 billion. This same year, Myanmar’s groundnut exports totalled US $ 6.8 million, with over 97 % of exports shipped to neighbour-ing Thailand.
Peanut exports, whether for human or animal consump-tion, face significant restrictions due to strict low level limits of aflatoxins and salmonella contamination ( as
148. Morris, J.B. ( 2002 ). Food, Industrial, Nutraceutical, and Pharmaceutical Uses of Sesame Genetic Resources, pp. 153-156. In Trends in New Crops and New Uses, J. Janick and A. Whipkey, eds. ASHS Press, Alexandria, VA. Available from: www.hort.purdue.edu / newcrop / ncnu02 / v5-153.html.149. Kamal-Eldin, A., & Appelqvist, L. ( 1995 ). The effects of extraction methods on sesame oil stability. Journal of the American Oil Chemists’ Society, August 1995, 72 ( 8 ), pp. 967-969.
highlighted in the EU Directive on Contaminants or the Codex Alimentarius ). Many potential exporting nations face challenges meeting these standards. As a result in-ternational trade in groundnuts is relatively low, with only approximately 5 % of global production sold on world markets.
In terms of peanut oil, world imports totalled US $ 335 mil-lion in 2012. Myanmar recently lifted a ban on peanut oil exports, but has not yet broken into the world market. Peanut oil is popular for frying due to its high smoking temperature and limited absorption into foods. The oil also imparts few flavours or odours compared with other cooking oils. Worldwide, roughly 46 % of groundnuts are crushed for oil, while the remainder are consumed as nuts. Nevertheless, the use of groundnuts as a source of oil does vary significantly by region, with 75 %–80 % of groundnuts produced in India crushed for oil, but only 10 %–12 % crushed for oil in the United States. Groundnut oil accounts for approximately 4 % of total world vegeta-ble oil produced.150 Similarly to other oilseeds, the leftover meal from the groundnut crushing process can be a valu-able source of animal feed ; however, aflatoxin contamina-tion can limit this usage.
Recent reports suggest that Myanmar’s peanut oil sub-sector faces serious challenges pertaining to quality man-agement and food safety.151 Deceptive practices among some peanut oil producers ( including adulteration and false labelling ) must be addressed in order to improve consumer confidence and strengthen the sector’s ex-port potential.
150. Dean, L. L., Davis, J. P., & Sanders, T. H. ( 2011 ).Groundnut ( Peanut ) Oil. In Vegetable Oils in Food Technology : Composition, Properties and Uses, Gunstone, F.D., ed. Oxford : John Wiley & Sons. E-book.151. San YaminAung ( 2013 ). Burma’s substandard peanut oils put to the test. The Irrawaddy, 4 November. Available from: www.irrawaddy.org / health / burmas-substandard-peanut-oils-put-test.html.
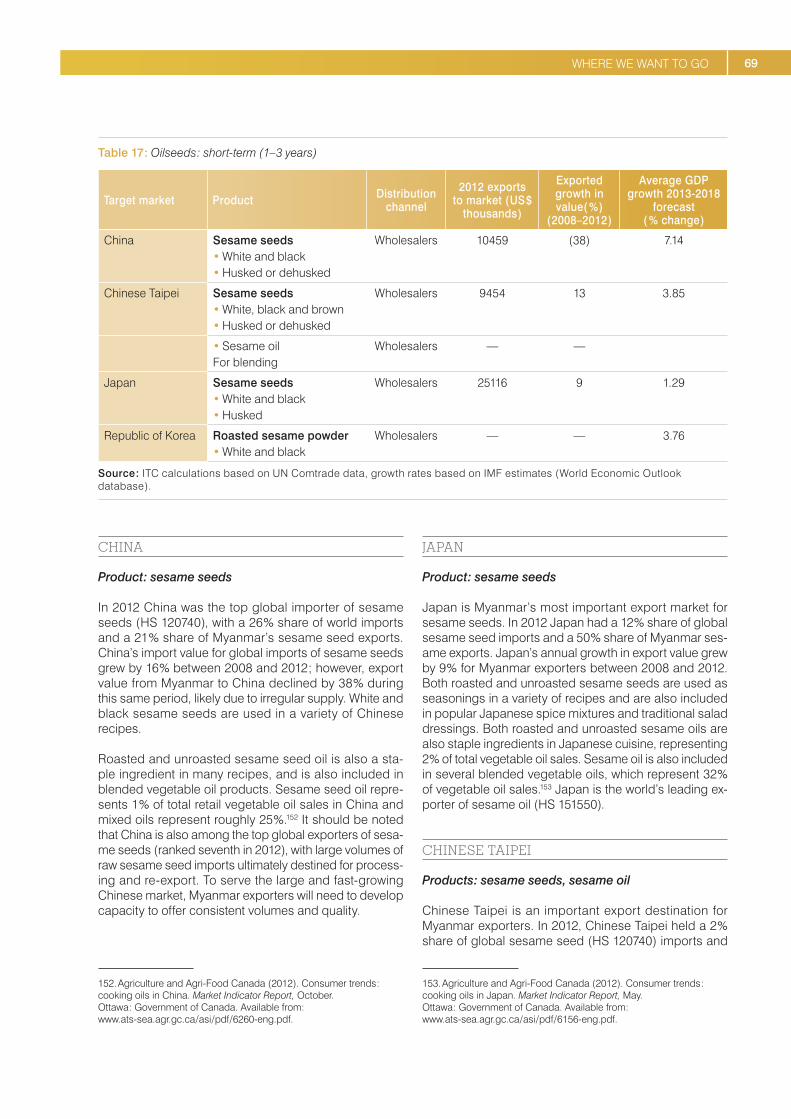
69WHERE WE WANT TO GO
Table 17 : Oilseeds : short-term ( 1–3 years )
Target market Product Distribution channel
2012 exports to market ( US $
thousands )
Exported growth in value( % )
( 2008–2012 )
Average GDP growth 2013-2018
forecast ( % change )
China Sesame seeds• White and black• Husked or dehusked
Wholesalers 10459 ( 38 ) 7.14
Chinese Taipei Sesame seeds• White, black and brown• Husked or dehusked
Wholesalers 9454 13 3.85
• Sesame oilFor blending
Wholesalers — —
Japan Sesame seeds• White and black• Husked
Wholesalers 25116 9 1.29
Republic of Korea Roasted sesame powder• White and black
Wholesalers — — 3.76
Source : ITC calculations based on UN Comtrade data, growth rates based on IMF estimates ( World Economic Outlook database ).
CHINA
Product : sesame seeds
In 2012 China was the top global importer of sesame seeds ( HS 120740 ), with a 26 % share of world imports and a 21 % share of Myanmar’s sesame seed exports. China’s import value for global imports of sesame seeds grew by 16 % between 2008 and 2012 ; however, export value from Myanmar to China declined by 38 % during this same period, likely due to irregular supply. White and black sesame seeds are used in a variety of Chinese recipes.
Roasted and unroasted sesame seed oil is also a sta-ple ingredient in many recipes, and is also included in blended vegetable oil products. Sesame seed oil repre-sents 1 % of total retail vegetable oil sales in China and mixed oils represent roughly 25 %.152 It should be noted that China is also among the top global exporters of sesa-me seeds ( ranked seventh in 2012 ), with large volumes of raw sesame seed imports ultimately destined for process-ing and re-export. To serve the large and fast-growing Chinese market, Myanmar exporters will need to develop capacity to offer consistent volumes and quality.
152. Agriculture and Agri-Food Canada ( 2012 ). Consumer trends : cooking oils in China. Market Indicator Report, October. Ottawa : Government of Canada. Available from: www.ats-sea.agr.gc.ca / asi / pdf / 6260-eng.pdf.
JAPAN
Product : sesame seeds
Japan is Myanmar’s most important export market for sesame seeds. In 2012 Japan had a 12 % share of global sesame seed imports and a 50 % share of Myanmar ses-ame exports. Japan’s annual growth in export value grew by 9 % for Myanmar exporters between 2008 and 2012.Both roasted and unroasted sesame seeds are used as seasonings in a variety of recipes and are also included in popular Japanese spice mixtures and traditional salad dressings. Both roasted and unroasted sesame oils are also staple ingredients in Japanese cuisine, representing 2 % of total vegetable oil sales. Sesame oil is also included in several blended vegetable oils, which represent 32 % of vegetable oil sales.153 Japan is the world’s leading ex-porter of sesame oil ( HS 151550 ).
CHINESE TAIPEI
Products : sesame seeds, sesame oil
Chinese Taipei is an important export destination for Myanmar exporters. In 2012, Chinese Taipei held a 2 % share of global sesame seed ( HS 120740 ) imports and
153. Agriculture and Agri-Food Canada ( 2012 ). Consumer trends : cooking oils in Japan. Market Indicator Report, May. Ottawa : Government of Canada. Available from: www.ats-sea.agr.gc.ca / asi / pdf / 6156-eng.pdf.
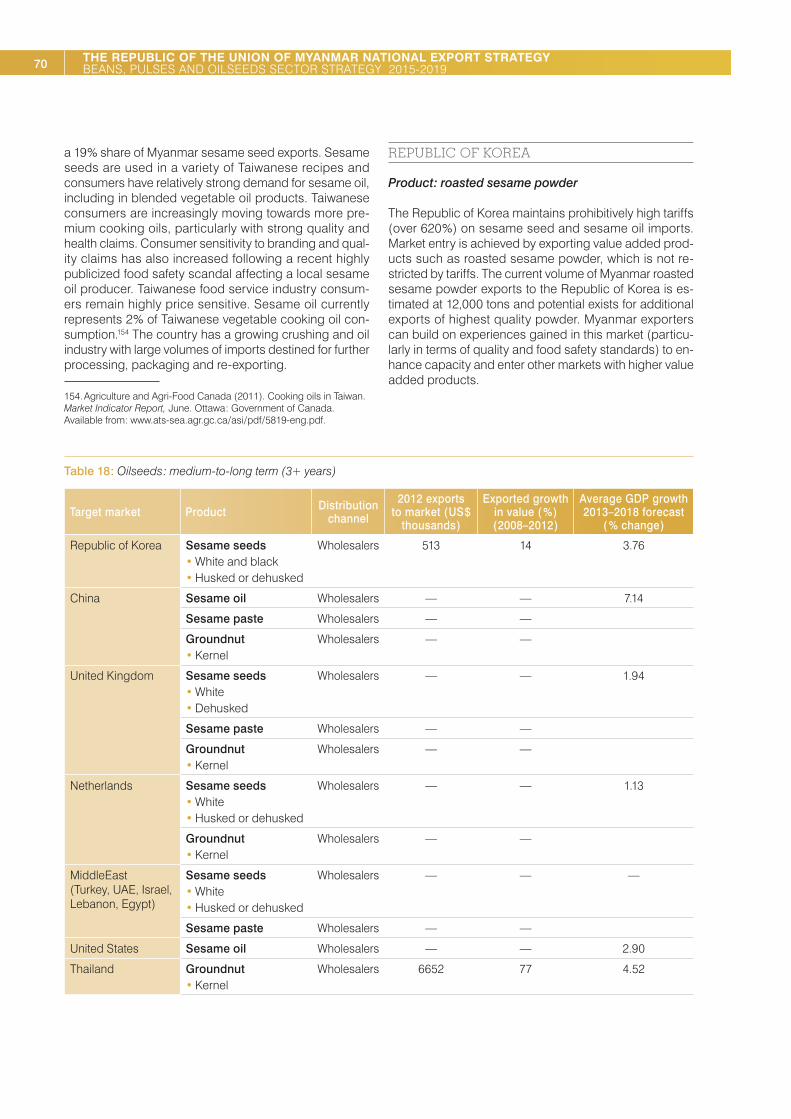
70 THE REPUBLIC OF THE UNION OF MYANMAR NATIONAL EXPORT STRATEGY BEANS, PULSES AND OILSEEDS SECTOR STRATEGY 2015-2019
a 19 % share of Myanmar sesame seed exports. Sesame seeds are used in a variety of Taiwanese recipes and consumers have relatively strong demand for sesame oil, including in blended vegetable oil products. Taiwanese consumers are increasingly moving towards more pre-mium cooking oils, particularly with strong quality and health claims. Consumer sensitivity to branding and qual-ity claims has also increased following a recent highly publicized food safety scandal affecting a local sesame oil producer. Taiwanese food service industry consum-ers remain highly price sensitive. Sesame oil currently represents 2 % of Taiwanese vegetable cooking oil con-sumption.154 The country has a growing crushing and oil industry with large volumes of imports destined for further processing, packaging and re-exporting.
154. Agriculture and Agri-Food Canada ( 2011 ). Cooking oils in Taiwan. Market Indicator Report, June. Ottawa : Government of Canada. Available from: www.ats-sea.agr.gc.ca / asi / pdf / 5819-eng.pdf.
REPUBLIC OF KOREA
Product : roasted sesame powder
The Republic of Korea maintains prohibitively high tariffs ( over 620 % ) on sesame seed and sesame oil imports. Market entry is achieved by exporting value added prod-ucts such as roasted sesame powder, which is not re-stricted by tariffs. The current volume of Myanmar roasted sesame powder exports to the Republic of Korea is es-timated at 12,000 tons and potential exists for additional exports of highest quality powder. Myanmar exporters can build on experiences gained in this market ( particu-larly in terms of quality and food safety standards ) to en-hance capacity and enter other markets with higher value added products.
Table 18 : Oilseeds : medium-to-long term ( 3+ years )
Target market Product Distribution channel
2012 exports to market ( US $
thousands )
Exported growth in value ( % )( 2008–2012 )
Average GDP growth 2013–2018 forecast
( % change )
Republic of Korea Sesame seeds• White and black• Husked or dehusked
Wholesalers 513 14 3.76
China Sesame oil Wholesalers — — 7.14
Sesame paste Wholesalers — —
Groundnut• Kernel
Wholesalers — —
United Kingdom Sesame seeds• White• Dehusked
Wholesalers — — 1.94
Sesame paste Wholesalers — —
Groundnut• Kernel
Wholesalers — —
Netherlands Sesame seeds• White• Husked or dehusked
Wholesalers — — 1.13
Groundnut• Kernel
Wholesalers — —
MiddleEast ( Turkey, UAE, Israel, Lebanon, Egypt )
Sesame seeds• White• Husked or dehusked
Wholesalers — — —
Sesame paste Wholesalers — —
United States Sesame oil Wholesalers — — 2.90
Thailand Groundnut• Kernel
Wholesalers 6652 77 4.52

71WHERE WE WANT TO GO
Target market Product Distribution channel
2012 exports to market ( US $
thousands )
Exported growth in value ( % )( 2008–2012 )
Average GDP growth 2013–2018 forecast
( % change )
Viet Nam Groundnut• Kernel
Wholesalers — — 5.43
Indonesia Groundnut• Kernel
Wholesalers 74 — 5.80
Japan Groundnut• Kernel
Wholesalers — — 1.29
Source : ITC calculations based on UN Comtrade data, growth rates based on IMF estimates ( World Economic Outlook database ).
REPUBLIC OF KOREA
Product : sesame seeds
The Republic of Korea has prohibitively high tariffs on sesame seed imports ; however, there are exceptions for government tenders. Supplying the government of the Republic of Korea with sesame seeds represents an op-portunity to break into this market with bulk sales. The ability to participate in government tenders will depend on improved testing and quality management, as well as stronger logistical capabilities to ensure timely deliv-ery. The development of relationships and partnerships with distributors in the Republic of Korea as well as the Republic of Korean Trade Investment Promotion Agency will also be critical to facilitate market entry.
CHINA
Products : sesame oil, sesame paste, groundnut kernels
In 2012, China was the world’s leading importer of ses-ame seeds and the fifth largest importer of sesame oil. In order to serve this large and fast-growing market with new higher value products, Myanmar exporters will need increased capacity, including processing facilities, capital equipment and upgraded technologies and food devel-opment / marketing capacities. These new capacities will enable Myanmar exporters to enter the Chinese market with new products such as sesame pastes. In the long-term, with increased capacities Myanmar could introduce branded consumer products. There are also opportunities to expand beyond traditional food markets by targeting industrial purchasers.
Peanut oil is among China’s most popular vegetable oils in terms of retail sales ( representing roughly 14 % of the market ), behind canola / rapeseed oil.155 Raw groundnuts
155. Agriculture and Agri-Food Canada ( 2012 ). Consumer trends : cooking oils in China. Market Indicator Report, October. Ottawa : Government of Canada. Available from: www.ats-sea.agr.gc.ca / asi / pdf / 6260-eng.pdf.
are also imported for use in cooking and incorporated into various recipes or crushed domestically for oil and cake. China is the world’s leading importer of peanut oil ( HS 1508 ), with a 33.5 % share of the US $ 444 million glob-al import market and 90 % annual growth in value be-tween 2008 and 2012. The Chinese market for peanuts ( HS 1202 ) was valued at over US $ 25 million in 2012, rep-resenting a 0.8 % share of the global import market and growing in value by 78 % between 2008 and 2012.To build on these opportunities it will be important to invest in ag-ronomic improvements leading to enhanced traits ( i.e. oil yield ) and new products such as peanut flour demanded by the Chinese market. It is also critical to resolve issues affecting the border trade system, particularly contractual agreements.
UNITED KINGDOM
Products : sesame seeds, sesame paste, groundnut kernels
The United Kingdom represents a leading import mar-ket for sesame oil and groundnuts, and an important im-porter of peanut oil and sesame seeds. In terms of world imports, in 2012 the United Kingdom represented a 5.3 % share of sesame oil imports ( HS 1515.50 ), a 5.1 % share of peanut imports ( HS 1202 ), a 1.5 % share of peanut oil imports ( HS 1508 ) and a 0.7 % share of sesame seed im-ports ( HS 120740 ).
Myanmar exporters can build upon skills and relationships gained in the bean and pulse subsector in order to enter the market with sesame seeds and peanuts. Meeting the United Kingdom’s food safety and quality standards will prepare Myanmar exporters for entry into other Western markets. For peanuts, it will be critical to maintain strong aflatoxin management practices in order to sustain mar-ket access. The United Kingdom offers opportunities for entry with new products such as sesame pastes or or-ganic certified products. Exporters can also work towards greater value addition and diversification by entering the consumer packaged goods sector with products such as branded sesame oils or tahini. A commercial attaché in

72 THE REPUBLIC OF THE UNION OF MYANMAR NATIONAL EXPORT STRATEGY BEANS, PULSES AND OILSEEDS SECTOR STRATEGY 2015-2019
the United Kingdom could assist Myanmar exporters to build relationships and identify marketing opportunities.
NETHERLANDS
Products : sesame seeds, groundnut kernels
The Netherlands is recognized as a leader in agri-food innovation and a gateway to European and global mar-kets. In 2012 the country had a 17 % share of world pea-nut imports ( HS 1202 ), or roughly US $ 555 million. The same year the country held a 1.3 % share of world ses-ame seed imports ( HS 120740 ), or roughly US $ 27 mil-lion. The presence of a commercial attaché in Europe will play an important role in assisting exporters with market-ing and business development activities. Entry into the Netherlands will also depend on strengthened food safety and quality standards – particularly with regards to afla-toxin contamination in peanuts. With improved traceability systems, Myanmar exporters can also take advantage of higher-margin opportunities in organic trade.
MIDDLE EAST
Products : sesame seeds, sesame paste
Middle Eastern countries such as Turkey, the UAE, Israel, Lebanon and Egypt share a strong demand for sesame seeds in traditional products such as tahini, halva, za’atar or ka’ak. Of these countries, Turkey represents the largest market, with an 8 % share of global sesame seed imports ( HS 120740 ), valued at roughly US $ 159 million in 2012.Entry into Middle Eastern markets can play an important role in enabling greater diversification for Myanmar ex-porters. In order to serve these markets, producers will require enhanced food processing and development ca-pacities, including an emphasis on quality and safety. Successful market entry will also depend on the devel-opment of stronger marketing and business develop-ment capabilities to develop a reputation and brand for Myanmar imports. The adoption of halal and kosher pro-duction processes is also critical to serve markets in this region.
UNITED STATES
Product : sesame oil
The United States is the world’s largest importer of sesa-me oil, with a 34 % share of global imports ( HS 151550 ), valued at over US $ 63 million in 2012. With economic sanctions lifting on Myanmar exports, entry into the United States represents a golden opportunity to establish rela-tionships and gain experience operating in this important market.
Similarly to other developed markets, the United States en-forces strict food safety and quality standards. Developing the skills and capacities to meet or exceed these stand-ards will play a critical role in strengthening Myanmar’s long-term agri-food export potential. Myanmar export-ers can also add value by taking advantage the grow-ing demand for organic certified products in the United States. The use of sesame oil in industrial applications also represents opportunities for diversification which can be strengthened through research and marketing. Finally, Myanmar will be able to use the duty free / quota free pref-erential access once it is recognized by the United States as a least developed country, thereby facilitating the de-velopment of this market.
THAILAND
Product : groundnut kernels
Thailand’s close geographic proximity and strong estab-lished relationships with Myanmar exporters offer oppor-tunities for entry with groundnuts. Peanuts are used in a variety of traditional Thai recipes and incorporated into animal feeds. In 2012 Thailand represented a 1.6 % share of global imports. The country offers opportunities for the introduction of consumer packaged goods such as pea-nut sauces. The ongoing integration enabled by the AEC also offers opportunities for increased exports.
VIET NAM
Product : groundnut kernels
Viet Nam is the second largest global import market for groundnuts, with an 11.7 % global import share in 2012, and is a fast-growing market with over 300 % growth in import value between 2008 and 2012. Opportunities for trade and investment with Viet Nam are expected to in-crease thanks to greater economic integration through the AEC. Indeed, Viet Nam applies an estimated average tariff of 9.7 % on groundnut imports ; however, it is believed that Myanmar will receive a preferential tariff thanks to the AEC. In order to build on these opportunities it is critical to strengthen the sector’s marketing and business develop-ment capacity while strengthening food safety and quality with enhanced testing, certification and the development of an accredited lab for oversight.
INDONESIA
Product : groundnuts
Indonesia is the third largest global import market for groundnuts with a 6.8 % share of world imports in 2012. Indonesia imposes an estimated average tariff of 4.8 %

73WHERE WE WANT TO GO
on imports of groundnuts. It is expected that integration through the AEC will relax this tariff. Myanmar exporters have established trade relations with Indonesian import-ers. Similarly to other markets, growth in Indonesia will require enhanced marketing capacities and improved food safety and quality standards.
JAPAN
Product : groundnut kernels
In 2012 the Japanese market for groundnuts represent-ed a 2 % share of total world imports. Myanmar export-ers have established strong relationships with several Japanese importers through existing agri-food exports, particularly in the bean and sesame subsectors. By build-ing on these relationships and experiences exporters can diversify into the groundnut sector. In Japan groundnuts are mainly used in the snack foods and confections in-dustry, thereby reflecting opportunities for future value addition in the development of consumer packaged goods. Japanese importers have been heavily depend-ent on Chinese imports but are looking to increase diversi-fication following recent supply shocks resulting from the identification of pesticide violations in Chinese imports. Japan maintains strict food safety and quality regulations that must be satisfied through the improvement of testing capacities and standards, particularly through the vigilant management of aflatoxin contamination. The develop-ment of increased marketing capacities will also be criti-cal to expand into this market
Strengthening the development of the groundnut and sesame seed subsectors can play an important role in laying the groundwork needed to unlock value across the broader oilseeds sector and the general economy. As ex-porters build know-how and capacity to increase market penetration these skills and resources can be leveraged into new areas for further export growth and development. Overall, given the importance of groundnuts and sesame seeds to Myanmar’s oilseed and agri-food sector, efforts directed towards strengthening export development in these crops will facilitate improvements to sector capac-ity while stimulating modernization and development in other areas.
STRUCTURAL IMPROVEMENTS TO THE VALUE CHAINAs indicated earlier, there are a number of performance issues that need to be addressed for the pulses, beans and oilseeds sector value chain to be effective. In addi-tion, for the long-term strategic development of the sec-tor it is important to explore opportunities for voluntarily improving the value chain in order to increase value addi-tion and environmental and social impact. The following section describes the strategic options that were identified by sector stakeholders as being necessary to enhance the long-term performance of the sector.
Box 16 : Overview of structural changes to the pulses, beans and oilseeds sector
• Increase organic and non-organic fertilizer production and imports in order to boost yields.• Increase quality and quantity of production through the implementation of ASEAN GAP.• Improve quality management of processing through the certification of processing
( HACCP, ISO and GMP ).• Promote the development of organic bean, pulse and oilseed production to access niche
target markets.• Set up alternative energy production such as agricultural waste gasifiers at field level
for irrigation, or at processing cluster level for electricity production.• Obtain import authorizations for oilseeds and enriched flours ( with a focus on organics )
to increase the production of edible oil, oilseed cake and animal feed.• Increase coordination with other value chains ( rice, livestock and fisheries ) to build synergies
and collaboration for sector development.

74 THE REPUBLIC OF THE UNION OF MYANMAR NATIONAL EXPORT STRATEGY BEANS, PULSES AND OILSEEDS SECTOR STRATEGY 2015-2019
Figure 23 : Fertilizer consumption Myanmar, Viet Nam and Thailand
0
5
10
15
20
Myanmar
11.984 M Ha
19.75 M Ha
10.072 M Ha
0.06 MT / Ha0.8 Mio MT
0.3 MT / Ha6 Mio MT
0.69 MT / Ha7 Mio MT
Agriculture Land
Fer tilzer Demand
Thailand Vietnam
Comparasion with NeighboringCountries
Source : Hein, T.( 2012 ). Prospects for agriculture and fertilizer market in Myanmar. PowerPoint presentation at IFA Crossroads Asia-Pacific 2012, Manila, 29–31 October.
INCREASE ORGANIC AND NON-ORGANIC FERTILIZER PRODUCTION AND IMPORTS IN ORDER TO BOOST YIELDS
As indicated earlier, the official supply of fertilizers has declined dramatically in the last decades, due in part to a reduction in subsidies from government and restric-tive import laws. Figure 23 confirms the net underuse of fertilizer in Myanmar compared with regional competi-tors. Based on this data,156 Myanmar’s fertilizer use ratio in tons per hectare would be between 5 and 10 times less that its regional competitors. Based on FAO statistics, Myanmar only produces approximately 100,000 tons of fertilizer and imports approximately 200,000 tons. Informal imports from neighbouring countries Bangladesh, India, Thailand and China would therefore account for approxi-mately 500,000 tons. The largest problem with informal imports is the absence of quality control, possibly leading to fertilizer that has null effects on yield.
It is a strategic necessity to increase organic and non-organic fertilizer production and imports to Myanmar in order to increase overall production. There are a number
156. Hein, T.( 2012 ). Prospects for agriculture and fertilizer market in Myanmar. PowerPoint presentation at IFA Crossroads Asia-Pacific 2012, Manila, 29-31 October.
of avenues required to increase availability of fertilizer. As discussed earlier, a primary requirement for increased fertilizer use in Myanmar is to ensure better access to fi-nance for farmer to enable them to purchase more fer-tilizer. Secondly, there is a need to allow for imports of greater quantities of fertilizer which will make it easier to ensure quality controls. There is also an opportunity to revisit and possible increase urea production capacity in Myanmar. Finally, a systematic collection and production of oilcake as a nitrogen-rich fertilizer would contribute to increasing the availability of organic fertilizer.
INCREASE QUALITY AND QUANTITY OF PRODUCTION THROUGH THE IMPLEMENTATION OF ASEAN GAP
The lowyields of certain pulses, beans and oilseeds in Myanmar can partly be attributed to a low use of GAP. Pulse, bean and oilseed production requires a number of specific agricultural skills to ensure high productivity and quality. The way the crop is planted, dried and collected plays an important role in the quality of production.
An increasing number of supermarket chains are de-manding their suppliers be certified against a private

75WHERE WE WANT TO GO
food safety standard such as Global GAP, BRC and IFS.157 Hence, certain key target markets in Europe, the United States and Asia require producers to gradually comply with GAP. The four modules of the ASEAN GAP on pro-duce quality, food safety, workers’ safety and environment are key building blocks in fostering the development of farmers’ skills in line with regional and international mar-ket requirements. ASEAN GAP, until it is recognized as a global standard, will serve as an initial step for producers wanting to be certified by Global GAP.
As indicated above, many elements such as enhanced seed availability, reinforced extension services, farmer field schools and increased access to financial resourc-es will be required for the pulses, beans and oilseeds sector to move towards the implementation of ASEAN GAP. Nevertheless, certain targeted productions with con-tract growers could aim to achieve GAP certification in the next few years. For the effective implementation of ASEAN GAP it will be important to increase the monitoring capaci-ties of DoA, MPBSMA and farmers associations to ensure GAP techniques are effectively used by pulse, bean and oilseed farmers.
IMPROVE QUALITY MANAGEMENT OF PROCESSING THROUGH THE CERTIFICATION OF PROCESSING ( HACCP, ISO AND GMP )
As indicated earlier, there are few processors and ex-porters compliant with international best practice in food safety. Only two companies in other subsectors of agri-business applied for the ISO 22000 international certifi-cate on food safety.
Quality management in Myanmar is underdeveloped for a variety of reasons, such as outdated metrology, ab-sence of up-to-date standards, low capacity of laborato-ries to complete modern testing, etc. In addition to these challenges, enterprises have been mostly catering to do-mestic consumers who have less stringent food safety requirements. Therefore few enterprises are aware of the requirements of international markets or have the capaci-ties to apply modern quality management techniques. A key challenge to overcome in order to build up the ca-pacities of enterprises is to train trainers in food safety.
A targeted focus is needed on building up and certify-ing those enterprises that have the best capacities to apply food safety requirements, such as ISO 22000. Simultaneously, the MPBSMA, in collaboration with the Myanmar Food Processors and Exporters Association and quality management institutions, needs to developed specialized modules to build up quality management in the pulses, beans and oilseeds sector, with the objective
157. FAO ( 2007 ). A Practical Manual for Producers and Exporters from Asia : Regulations, Standards and Certification for Agricultural Exports, p.34.
of increasing the number of food safety compliant and certified enterprises.
PROMOTE THE DEVELOPMENT OF ORGANIC PULSE, BEAN AND OILSEED PRODUCTION TO ACCESS NICHE TARGET MARKETS
As indicated above, there is currently low use of chemical fertilizers and herbicides in Myanmar due to limited na-tional production and limited imports. Recent efforts by the Myanmar Fruits and Vegetable Producers Association led to the setting up of the Myanmar Organic Agriculture Group ( MOAG ) to support organic agriculture develop-ment in the country. In early 2012 MOAG had around one hundred members and six supported certified organic farms covering 59.89 ha. of crop farmlands, and two fer-tilizer companies are approved by MOAG for organic in-puts. The organic products related to MOAG are sold in domestic markets as conventional products since a real local market for organic produce still needs to be de-veloped.158 Most importantly, a private organic standard was developed by MOAG in 2010 as well as certification services. Some members of MPBSMA are also members of MOAG, thereby providing an opportunity to initiate the development of organic pulses, beans and oilseeds in Myanmar.
The development of organic production of pulses, beans and oilseeds will require the strengthening of the organ-ic certification scheme in Myanmar. The initial efforts of MOAG are important in building the necessary momen-tum for organic agriculture development but without a comprehensive organic agricultural development, trace-ability and certification scheme realizing the important potential of organics in Myanmar in general, and more specifically in the pulses, beans and oilseeds sector, will be difficult. Hence, structured efforts will be needed be-tween MoAI, MOAG and MSTRD to promote the import or production of internationally accredited organic inputs ; to promote the building of a traceability system to track organic production from field to plate ; and to strengthen the standards and accreditation scheme in Myanmar. It will also be essential to build the knowledge of organic production and processing for extension services, farmer fields schools and key support institutions of the pulses, beans and oilseeds sector.
158. Green Net ( 2011 ). Myanmar organic agriculture. Available from: www.greennet.or.th / en / article / 1168.

76 THE REPUBLIC OF THE UNION OF MYANMAR NATIONAL EXPORT STRATEGY BEANS, PULSES AND OILSEEDS SECTOR STRATEGY 2015-2019
SET UP ALTERNATIVE ENERGY PRODUCTION SUCH AS AGRICULTURAL WASTE GASIFIERS AT FIELD LEVEL FOR IRRIGATION, OR AT PROCESSING CLUSTER LEVEL FOR ELECTRICITY PRODUCTION
The difficulty of regular access to electricity has been identified as a key challenge by most enterprises con-sulted for the elaboration of the NES. The pulses, beans and oilseeds sector is no different. According to the Asian Development Bank, Myanmar’s average electrification rate was about 26 % in 2011 with Yangon City having the highest electrification rate ( 63 % ), followed by Nay Pyi Taw ( 52 % ), Kayar ( 37 % ), Mandalay ( 29 % ) and rural ar-eas ( 16 % ).159 The economic development of every sec-tor in Myanmar, including the pulses, beans and oilseeds sector, will require significant quantities of electricity. However, planned investments in electricity production, mainly in hydroelectricity, over the next five years are only 617 megawatts of capacity, a growth rate of less than 5 % a year.160 This increase in production will not be able to satisfy a demand boosted by high growth rates.
The pulses, beans and oilseeds sector can generate some of its required electricity while new national level electricity generation capacity is created. The electricity demand in the sector is mainly for irrigation, threshing, milling and further processing. There are a number of ini-tiatives in Myanmar from the private sector, non-govern-mental organizations and ministries ( MSTRD and Ministry of Energy ) to pilot alternative energy production. In ad-dition to the setting up of solar panels, there is an inter-est in the production of electricity from gasifiers that use agricultural waste.161 Husks from pulses and sesame or pigeon pea stalks or other waste of the sector could be collected and used in strategically located gasifiers. This is an alternative to the setting up of costly fuel generators and permits the reuse of waste generated by the sector.
OBTAIN IMPORT AUTHORIZATIONS FOR OILSEEDS AND ENRICHED FLOURS ( WITH A FOCUS ON ORGANICS ) TO INCREASE THE PRODUCTION OF EDIBLE OIL, OILSEED CAKE AND ANIMAL FEED
As indicated earlier, the pulses, beans and oilseeds sector currently has an estimated edible oil processing volume of 300,000 tons. However, the total production capacity far
159. Asian Development Bank ( 10 December 2013 ). Project Data Sheet, Off-Grid Renewable Energy Demonstration Project Myanmar.160. Dapice, D. ( 2012 ). Electricity in Myanmar : The Missing Prerequisite for Development, p. 6. Ash Center for Democratic Governance and Innovation at the John F. Kennedy School of Government, Harvard University.161. East Asia Summit / Energy Cooperation Task Force Bio-fuel Database in East Asia ( 2013 ). Diversity of Potential Biomass in Myanmar. Available from: http : / / www.asiabiomass.jp / biofuelDB / myanmar / contents004.htm. Accessed 16 December 2013.
exceeds this volume. An increase in production volume through enhanced GAP and better post-harvest manage-ment will increase the edible oil production capacity of the sector. This increase is needed because of the large deficit in edible oil ( approximately 550,000 tons in 2015 ). In addition to intensification in national oilseed production, an increase in production of edible oil can be achieved through the imports of certain oilseeds ( soya, sunflower, canola, etc. ). Such imports would permit the milling indus-try to develop and also benefit other sectors in Myanmar through the production of oilcake for feeding livestock and fisheries aquaculture. Imports of specialized enriched flours would also contribute to better linking the sector with animal and aquaculture feed producers.
The proposed import of certain seeds and flours would encourage a building up of processing capacities in Myanmar though increasing the availability of inputs. This model is not opposed to an export model since it would encourage exporters to specialize in the export of higher value products such as premium and organic pulses, oil-seeds and edible oils, while at the same time satisfying the local demand for oil, oilcake and animal feed.
INCREASE COORDINATION WITH OTHER VALUE CHAINS ( RICE, LIVESTOCK AND FISHERIES ) TO BUILD SYNERGIES AND COLLABORATION FOR SECTOR’S DEVELOPMENT
Agricultural sectors in Myanmar face similar challenges in terms of limited access to rural finance, inadequate access to key inputs, low mechanization, challenging in-stitutional organization, etc. For this reason there are op-portunities for agricultural sector stakeholders to build synergies and collaborations.
The pulses, beans and oilseeds sector can make an im-portant contribution to socioeconomic development in Myanmar by better integrating with the livestock and fish-eries sectors. These important sectors for food security and export also have shortages of key inputs such as feed. As indicated above, an increase in the volume of milling and feed processing conducted by the pulses, beans and oilseeds sector would partly contribute to sat-isfying some of the demand for oilcake and animal feed. The numerous similarities with the rice sector confirm the need to conduct joint lobbying and advocacy campaigns. Also, the rice sector would be a great contributor to the setting up of gasifiers for electricity generation through waste reuse.

77WHERE WE WANT TO GO
ROLE OF INVESTMENT TO MOVE INTO NEW VALUE CHAINSImproving the pulse, bean, and oilseed value chains as envisioned by the sector strategy and plan of action will require considerable investment. Public funds and donor aid will be important sources of this investment, particu-larly for infrastructure, the business environment, gov-ernment capacity, and guidance to the private sector. However, few factors are as fundamental to the success of a sector as its capital investment, which must be profit-driven to be sustainable in the long term. Therefore, the private sector itself will be the primary source of invest-ment, and a successful sector strategy should mobilize export-oriented private investment as an integral part of and an early driver of improvements to the value chain. In the medium to long term, the combination of concert-ed public support, motivated private investment, and the general air of hope for Myanmar’s future should create enough confidence and momentum to stimulate a vir-tuous cycle of self-sustaining growth and development.
Myanmar is a least developed country ( LDC ) and clas-sified as being in a fragile or conflict-affected situation ( FCS ). It has a transition economy and a very weak fi-nancial sector. As such, domestic investment is unlikely to reach transformative levels for the pulse, bean, and oil-seed sector in the foreseeable future. A comprehensive private sector development plan is needed for domestic enterprises, but in the short to medium term the role of for-eign direct investment ( FDI ) will be especially important.
FDI can have a transformative effect on a develop-ing country’s home-grown, domestically oriented in-dustry, and help it to achieve significant export growth. International investors may be able to introduce a wide range of assets otherwise unavailable to local enterpris-es, such as large amounts of capital, better inputs ( e.g. high-quality seeds ), technologies, skills, management practices, operational experience, economies of scale, and international distribution channels, among others.
TYPES OF INVESTMENT NEEDED AND THEIR LIKELY SOURCES
Expanding the sector’s production volume, quality, effi-ciency, value chain operations, and exports will require a proliferation of companies engaged in various aspects of manufacturing, services, and primary production. Major FDI is most viable in the sector’s upstream, support ser-vices, and trading.
Low transportation costs are important to maintaining profit margins in the export of commodities, such as gram beans, sesame seeds, and peanuts, which are the
sector’s most important products. With Asia consuming, respectively, 86, 76, and 30 percent of these three prod-ucts globally, it makes sense for that production to take place within the region. Distance to market is even more important for oils, pastes, flours, snacks, and other pro-cessed forms of these commodities. The cost of shipping bottles and cans is prohibitive for export of mass market foods from a small market like Myanmar (by revenue) to a larger market. So, manufacturing and packaging tends to happen close to major markets. This is illustrated by 2012 total global exports of peanut oil, which, at 196,000 tons,162 represented a mere half percent of total global production.163 In other words, 99.5 percent of peanut oil sold in 2012 was manufactured in the country where it was sold.
Therefore, any FDI in the production of oils, pastes, flours, canned foods, or other processed forms of gram beans, sesame seeds, and peanuts would need to be targeted at serving the domestic Myanmar market. However, this is unlikely to occur during the timeframe covered by this strategy. Although the world’s major food and beverage manufacturers do depend more on developing countries for their growth, these tend to be major emerging markets, such as Brazil, China, and India, and not LDCs or FCS.
Table 19 presents the value chain segments where FDI is both needed and viable, along with leading sources of such FDI and competing locations in the region where investors are active.
Myanmar’s pulse, bean, and oilseed sector stakeholders, in particular DICA, MPBSMA, MOAI, and UMFCCI, should work to present proven investors with Myanmar’s invest-ment opportunities and, simultaneously, to advocate in-vestment climate reforms that will enhance Myanmar’s attractiveness. Table 19 presents the group of companies which collectively control large majorities of the global markets in their given fields. These are not the only po-tential investors, and smaller regional companies may be better poised to move quickly into Myanmar, given their proximity and knowledge of the country. However, given the immense potential volume of Myanmar’s pulse, bean, and oilseed sector, the world’s leading players are likely to be involved in a scaling up which fully realizes the sec-tor’s potential.
162. ITC calculations based on UN Comtrade statistics163. United States Department of Agriculture, Foreign Agricultural Service, Table 01: Major Oilseeds: World Supply and Distribution (Commodity View)

78 THE REPUBLIC OF THE UNION OF MYANMAR NATIONAL EXPORT STRATEGY BEANS, PULSES AND OILSEEDS SECTOR STRATEGY 2015-2019
Table 19: Value chain segments needing FDI and likely sources
Value chain segments where FDI is needed and viable
Leading companies with foreign affiliates in Asia
Source country Regional locations with an existing presence
Seeds, fertilizers, and pesticides–Sales, distribution, manufacturing, and R&D
Monsanto U.S. Bangladesh, China, India, Indonesia, Malaysia, Pakistan, Philippines, Sri Lanka, Thailand, Vietnam
Dupont (Pioneer) U.S. Cambodia, China, India, Indonesia, Pakistan, Philippines, Thailand, Vietnam
Syngenta Switzerland Bangladesh, China, India, Indonesia, Malaysia, Pakistan, Philippines, Thailand, Vietnam
Bayer Crop Science Germany China, India, Indonesia, Pakistan, Thailand
Dow Agrosciences U.S. China, India, Malaysia
BASF Germany Bangladesh, China, India, Indonesia, Malaysia, Pakistan, Philippines, Sri Lanka, Thailand, Vietnam
KWS (seeds) Germany China, Pakistan
Farm machinery and equipment–Sales, distribution, manufacturing, operation, maintenance, and repair
John Deere U.S. China, India, Thailand
CNH Netherlands China, India
AGCO U.S.
CLAAS Germany China, India, Thailand
SAME Deutz-Fahr Italy China, India
Kubota Japan China, India, Indonesia, Philippines, Thailand, Vietnam
Animal feed–Manufacturing and R&D
Charoen Pokphand Thailand Bangladesh, India, Indonesia, Malaysia, Myanmar, Viet Nam
Cargill U.S. China, India, Indonesia, Malaysia, Pakistan, Philippines, Sri Lanka, Thailand, Viet Nam
New Hope Group China Bangladesh, Indonesia, Philippines, Viet Nam
Brasil Foods Brazil
Tyson Foods U.S. China
12 other Chinese companies producing 1-10 MMT/year, including Guangdong Wen’s Group, Cofco, and East Hope Group
7 other Japanese companies producing 1-10 MMT/year, including Zen-noh Cooperative, Marubeni-Nisshin, and Mitsubishi Nossan
7 other Asian companies producing 1-10 MMT/year, including Betagro (Thailand), San Miguel (Philippines), Zuellig Gold Coin (Malaysia), Japfa Comfeed (Indonesia), CJ Cheil Jedang (Rep. of Korea), Easy Bio System (Rep. of Korea), and Proconco (Viet Nam)
Vertically integrated trading, including warehousing, transportation, and risk management (as well as agricultural consulting and manufacturing of biofuels and animal feed in some cases)
Louis Dreyfus Commodities
Netherlands Bangladesh, China, India, Indonesia, Malaysia, Philippines, Thailand, Viet Nam
Cargill U.S. China, India, Indonesia, Malaysia, Pakistan, Philippines, Sri Lanka, Thailand, Viet Nam
Archer Daniels Midland U.S. China, India, Indonesia
Bunge U.S. China, India, Indonesia, Philippines, Thailand, Viet Nam
Quality testing and certification SGS Switzerland Bangladesh, China, India, Indonesia, Malaysia, Myanmar, Pakistan, Philippines, Sri Lanka, Thailand, Viet Nam
Cotecna Bangladesh, China, India, Indonesia, Malaysia, Myanmar, Pakistan, Philippines, Sri Lanka, Thailand, Viet Nam
Intertek Bangladesh, China, India, Indonesia, Malaysia, Myanmar, Pakistan, Philippines, Sri Lanka, Thailand, Viet Nam
NSF China, India, Malaysia, Thailand, Viet Nam
SCS China India, Indonesia, Malaysia
Sources: (Shand, 2012), (Noealt Corporate Services, 2013), (Best & Jennison, 2012), (Murphy, Burch, & Clapp, 2012), and company web sites

79WHERE WE WANT TO GO
Figure 24: Possible evolution of a foreign investor’s activities in a given location
Salesrepresentative
Salesoffice
Distributioncentre
Assemblyplant
Manufacturingplant
Research anddevelopment
Regionalheadquarters
Shared servicecenter
Table 20: Leading Asian producers and exporters of gram beans, groundnuts, and sesame seeds (production figures in million metric tons)
Gram beans Groundnuts Sesame seeds
Regional producers ( major ones in bold )
India ( 1.5 )Thailand
China ( 14.3 )India ( 6.25 )Indonesia ( 1.25 )Viet Nam ( 0.5 )
Myanmar ( 0.72 )India ( 0.62 )China ( 0.59 )
Regional exporters ( major ones in bold )
MyanmarChinaThailandIndonesia ( large net importer )
IndiaChina
IndiaChina ( large net importer )MyanmarPakistan
Sources: ITC calculations based on UN Comtrade statistics; United States Department of Agriculture (sesame data from 2010, peanuts from 2009), (Sharma, et al., 2011)
Furthermore, most of the companies in Table 19 already have extensive presences in the region. Future invest-ments projects in Myanmar might originate with headquar-ters or with these regional affiliates. For the companies with no presence currently in Myanmar, a first venture would likely take the form of a sales office. Although, this does not create the jobs, technology spillovers, or skill spillovers of a manufacturing project, for example, the possibility of a sales office should not be dismissed by investment promoters as being of low value. A first sales office is an opportunity for a foreign company to make tentative entry into a new market, learning the business landscape and achieving a level of comfort. Of more im-mediate importance, it can provide Myanmar’s pulse, bean, and oilseed sector with valuable access to high-quality inputs, such as seeds, that are essential to the strengthening of the sector.
THE SECTOR’S LEADING COMPETITORS FOR FDI
Myanmar’s major competitors for FDI in these value chains are other low-and middle-income countries in Asia with a record of high production, be it for a domestic or ex-port market. Table 20 presents these competitors for FDI.
Myanmar’s top competitors for FDI in the sector are India and China, which are the world’s leading producers and exporters for the sector’s top products. That Myanmar bor-ders both countries is an advantage. It allows Myanmar to present potential investment projects to existing investors in those countries as a slightly more distant extension of their current activities. That China and India are the world’s 2nd and 15th largest FDI destinations, respectively, is a net disadvantage, as potential investors are generally more familiar with those markets and have better established public and private support networks.

80 THE REPUBLIC OF THE UNION OF MYANMAR NATIONAL EXPORT STRATEGY BEANS, PULSES AND OILSEEDS SECTOR STRATEGY 2015-2019
CRITICAL FACTORS FOR FOREIGN INVESTORS IN MYANMAR’S COMPETITOR LOCATIONS
The World Bank Group’s Enterprise Surveys has collected business data from 130,000 firms in 135 countries, from which indicators can be selected to approximate the com-petitiveness of these countries. Table 21 ranks Myanmar’s competitors, from left to right, by importance in Table 20. Below each country, the table presents the results of an enterprise survey, in which foreign investors in that country were asked to pick one of 15 issues as the biggest obsta-cle to doing business.
Although Enterprise Survey data on the biggest obstacles to doing business are available for Myanmar’s major com-petitors ( except Thailand ), at the publication of this docu-ment, Myanmar’s first enterprise surveys remain ongoing. When data becomes available around June 2014,164 they can be used to compare its relative investment climate strengths and weaknesses, giving sector stakeholders an area on which to focus their investment climate reforms. Even just having such a reform process underway will add to the sector’s attractiveness.
164. (World Bank Group, 2013)
When approaching foreign affiliates listed in Table 19, Myanmar’s investment promoters will be trying to per-suade them to invest in Myanmar based on absolute ad-vantages, such a large market and abundant resources, and relative advantages, such as better tax rates than its competitor countries. Myanmar’s investment promot-ers must distinguish themselves from the other spe-cific locations being considered by the investor. In the absence of detailed, country-by-country cost and risk data, Table 21 provides a rough basis for demonstrat-ing relative advantages. It lists the obstacles to FDI from most-cited, “electricity,” to least-cited, “courts” among Myanmar’s competitors for FDI. Looking at the group av-erage, there is a clear top tier of four problems among Myanmar’s competitors. If Myanmar could perform well in these areas, that would represent a compelling asset for attracting investors. “Tax rates” is the one area in which Myanmar clearly outperforms its competitors. It beats all but Thailand in Doing Business’s ranking for “paying taxes,” and it improved significantly over the last year, offering investment promoters a narrative of continuous enhancement of this existing strength. Most importantly, this issue was cited as the most important by foreign in-vestors in both India and China.
Table 21: Percent of surveyed foreign investors citing an issue as the “biggest obstacle” to doing business in countries competing with Myanmar for sector-related FDI
Strongest competitor ----------------------------------------------------> Weakest competitor
Group average India China Indonesia Viet Nam Pakistan
Electricity 15.7 5.6 2.7 8.9 3.3 57.9
Practices of the informal sector 14.4 8.3 10.1 1.2 51.8 0.5
Tax rates 14.2 27.8 19.9 1.2 2.3 19.6
Access to finance 10.1 13.9 18.5 15.7 2.6 0.0
Inadequately educated workforce 7.4 5.6 14.3 1.9 15.4 0.0
Customs and trade regulations 6.7 8.3 11.5 8.3 5.5 0.0
Political instability 6.6 0.0 1.0 26.4 1.3 4.5
Transportation 5.6 5.6 12.7 3.9 3.9 1.9
Access to land 4.3 5.6 3.8 9.3 2.8 0.0
Corruption 4.0 5.6 1.2 2.7 1.5 9.1
Crime, theft, and disorder 3.8 0.0 0.4 11.7 0.5 6.5
Labour regulations 2.9 8.3 1.5 4.3 0.3 0.0
Tax administration 2.5 5.6 2.2 0.5 4.1 0.0
Business licensing and permits 1.3 0.0 0.2 4.0 2.5 0.0
Courts 0.5 0.0 0.0 0.2 2.2 0.0
Note: Pink shading indicates an obstacle which more than 10 percent of the surveyed foreign investors cited as the biggest obstacle. Source: World Bank Group Enterprise Surveys, 2006-2012

81WHERE WE WANT TO GO
On the other hand, with respect to the other top-tier ob-stacles, Myanmar is a notably poor performer. These ob-stacles are a lack of reliable electricity, unfair competition from the informal sector, and weak access to finance. This reinforces the conclusions of the NES, which found that electricity and finance were particularly problematic for Myanmar. Making relevant reforms will not only strengthen sector; it will give the sector two competitive advantages over its top competitors for FDI. Anticipated aid of $ 1 bil-lion from the World Bank for rural electrification should aid in this effort, and considerable power to reform the coun-try’s financial markets lies in the hands of the Myanma government.
The preceding analysis provides a useful but initial indi-cation of the relative attractiveness of Myanmar’s pulse, bean, and oilseed sector and how its standing can be improved. However, MTDC and its stakeholders should commission a study to benchmark the competitiveness of the sector specifically. This study should evaluate specific costs and constraints for each of the investment types to be promoted in Table 19, simulating the cost-bene-fit and risk analyses of potential investors. Armed with this information, DICA – strengthened in line with NES recommendations and in partnership with MPBSMA, MOAI, UMFCCI, and other sector stakeholders – would be equipped to effectively target investors for the most competitive activities and advocate investment climate reforms to make the others more competitive.

82 THE REPUBLIC OF THE UNION OF MYANMAR NATIONAL EXPORT STRATEGY BEANS, PULSES AND OILSEEDS SECTOR STRATEGY 2015-2019
HOW TO GET THERE
The vision of the strategy to “contribute to the socioeco-nomic development of Myanmar by being a global pro-vider of environmentally sustainable and value added products based on modern farming and trading tech-niques” responds to the constraints, but equally to the ambitions, identified in the sector strategy. The following section explains the framework that will guide the imple-mentation of the strategy. A detailed action plan setting out what needs to be done, and by whom, is presented at the end of this section.
The pulses, beans and oilseeds sector vision of becoming a global provider of environmentally sustainable and value added products based on modern farming and trading techniques will require the implementation of a realistic and achievable roadmap to develop the sector. The fol-lowing section explains the framework that will guide the implementation of the strategy. A detailed PoA indicating what needs to be done and by whom is provided at the end of the section.
STRATEGIC OBJECTIVESThere are five strategic objectives considered necessary for realization of the sector vision. These strategic objec-tives provide a coherent framework to develop the pulses, beans and oilseeds sector for the next five years.
The first strategic objective aims to increase the sec-tor’s production and productivity through enhanced farming techniques, upgrading of farmers’ capacities, improved infrastructure and a reliable supply of qual-ity inputs.
This will be achieved by building farmers’ capacities to produce quality products ; ensuring a supply of certi-fied seeds and enhanced use of quality inputs ; pro-viding adequate access to financial instruments for production ; and improving plantation and post-harvest management.
The second strategic objective will enable compliance of the sector’s products to international standards by mod-ernizing and developing quality management systems.
This key objective will be realized though developing and aligning national standards for pulses, beans and oilseeds with international standards ; upgrading the national laboratories for pulses, beans and oilseeds exports ; developing compliance of the sector with voluntary standards ; setting up traceability systems ; and training traders and exporters in international qual-ity requirements and procedures.
The third strategic objective is to strengthen coopera-tion and efficiency in the sector by enhancing inter-insti-tutional collaboration and private–public partnerships.
This objective will be accomplished by encouraging the development of farmer level associations ; expand-ing the mandate of MPBSMA to represent the various stakeholders of the sector ; building the organizational and business skills of sector associations ; and organ-izing a private-public committee to coordinate sector development efforts.
The fourth strategic objective is to strengthen the sec-tor’s ability to add value to its product through enhanc-ing business management capacities and modernizing processing facilities and techniques.
This goal will be completed by increasing the knowl-edge of enterprises concerning products available globally ; providing adequate financial mechanisms to enterprises for innovation and product development ; ensuring proper infrastructure is available for enter-prises to be competitive ; and organizing structured investment promotion efforts.
The fifth strategic objective aims to ensure continuous growth and global reach of the sector through reliable market information, efficient export procedures, target-ed branding, and improved promotion efforts.
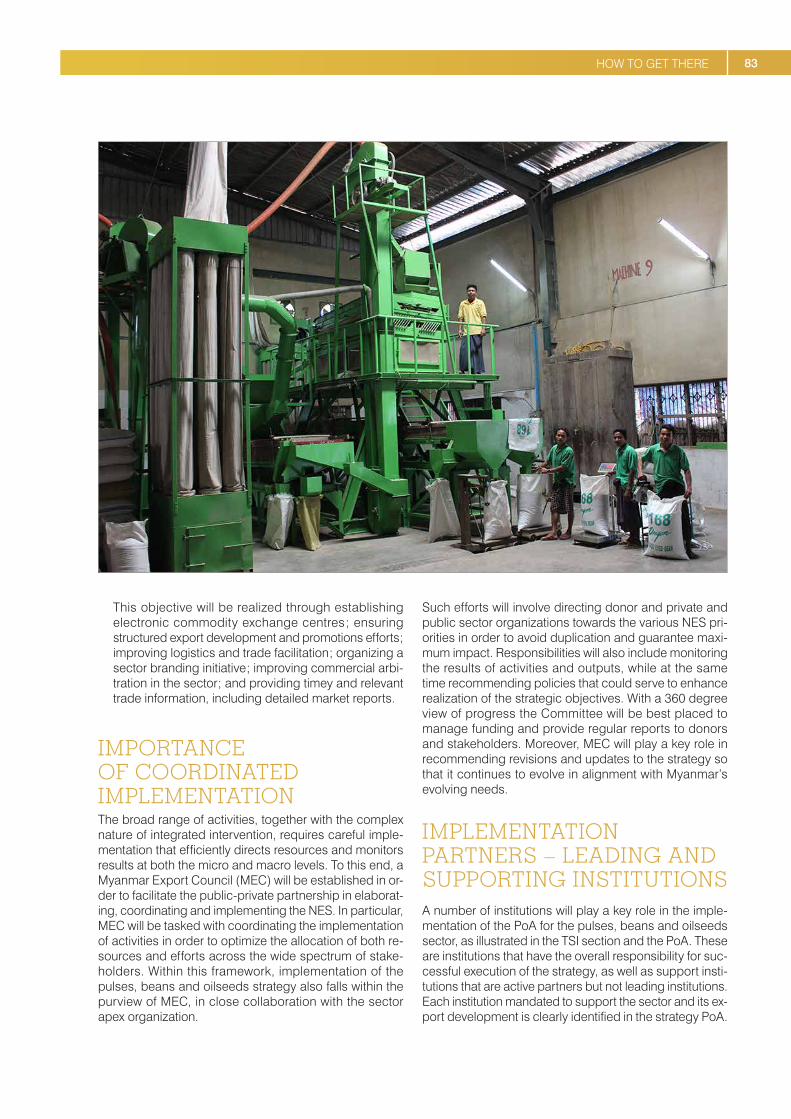
83HOW TO GET THERE
This objective will be realized through establishing electronic commodity exchange centres ; ensuring structured export development and promotions efforts ; improving logistics and trade facilitation ; organizing a sector branding initiative ; improving commercial arbi-tration in the sector ; and providing timey and relevant trade information, including detailed market reports.
IMPORTANCE OF COORDINATED IMPLEMENTATIONThe broad range of activities, together with the complex nature of integrated intervention, requires careful imple-mentation that efficiently directs resources and monitors results at both the micro and macro levels. To this end, a Myanmar Export Council ( MEC ) will be established in or-der to facilitate the public-private partnership in elaborat-ing, coordinating and implementing the NES. In particular, MEC will be tasked with coordinating the implementation of activities in order to optimize the allocation of both re-sources and efforts across the wide spectrum of stake-holders. Within this framework, implementation of the pulses, beans and oilseeds strategy also falls within the purview of MEC, in close collaboration with the sector apex organization.
Such efforts will involve directing donor and private and public sector organizations towards the various NES pri-orities in order to avoid duplication and guarantee maxi-mum impact. Responsibilities will also include monitoring the results of activities and outputs, while at the same time recommending policies that could serve to enhance realization of the strategic objectives. With a 360 degree view of progress the Committee will be best placed to manage funding and provide regular reports to donors and stakeholders. Moreover, MEC will play a key role in recommending revisions and updates to the strategy so that it continues to evolve in alignment with Myanmar’s evolving needs.
IMPLEMENTATION PARTNERS – LEADING AND SUPPORTING INSTITUTIONSA number of institutions will play a key role in the imple-mentation of the PoA for the pulses, beans and oilseeds sector, as illustrated in the TSI section and the PoA. These are institutions that have the overall responsibility for suc-cessful execution of the strategy, as well as support insti-tutions that are active partners but not leading institutions. Each institution mandated to support the sector and its ex-port development is clearly identified in the strategy PoA.


MYANMAR
THE REPUBLIC OF THE UNION OF MYANMAR NATIONAL EXPORT STRATEGY
BEANS, PULSES AND OIL SEEDSSECTOR STRATEGY 2015-2019
PLAN OF ACTIONThe following action plan details all the activities to be un-dertaken over the next five years to achieve the vision of the strategy. The action plan is organized around strategic and operational objectives that respond to the constraints
and opportunities identified in the strategy. The action plan provides a clear and detailed framework for the ef-fective implementation of the Pulses, beans and oilseeds strategy.
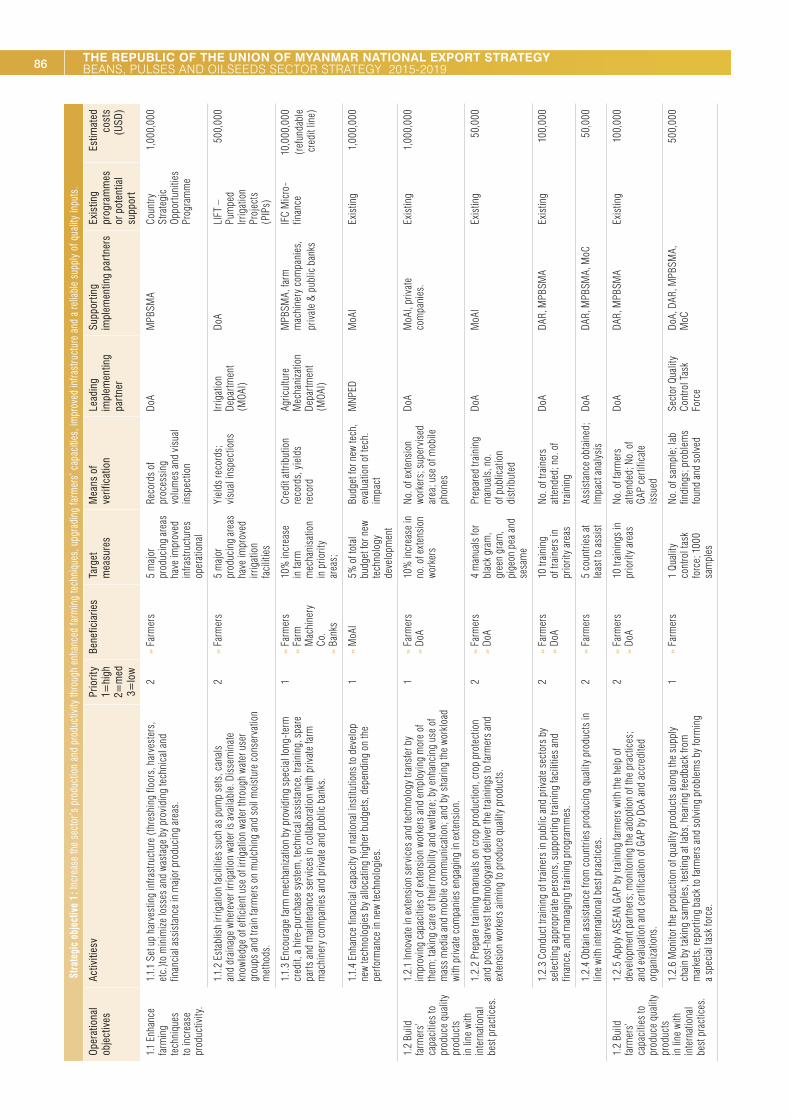
86 THE REPUBLIC OF THE UNION OF MYANMAR NATIONAL EXPORT STRATEGY BEANS, PULSES AND OILSEEDS SECTOR STRATEGY 2015-2019
Stra
tegi
c ob
ject
ive
1 : In
crea
se th
e se
ctor
’s p
rodu
ctio
n an
d pr
oduc
tivity
thro
ugh
enha
nced
farm
ing
tech
niqu
es, u
pgra
ding
farm
ers’
cap
aciti
es, i
mpr
oved
infra
stru
ctur
e an
d a
relia
ble
supp
ly o
f qua
lity
inpu
ts.
Ope
ratio
nal
obje
ctiv
esAc
tiviti
esv
Prio
rity
1=hi
gh2=
med
3=lo
w
Bene
ficia
ries
Targ
et
mea
sure
sM
eans
of
verif
icat
ion
Lead
ing
impl
emen
ting
part
ner
Supp
ortin
g im
plem
entin
g pa
rtne
rsEx
istin
g pr
ogra
mm
es
or p
oten
tial
supp
ort
Estim
ated
co
sts
( USD
)
1.1
Enha
nce
farm
ing
tech
niqu
es
to in
crea
se
prod
uctiv
ity.
1.1.
1 Se
t up
harv
estin
g in
frast
ruct
ure
( thr
eshi
ng fl
oors
, har
vest
ers,
et
c. )to
min
imize
loss
es a
nd w
asta
ge b
y pr
ovid
ing
tech
nica
l and
fin
anci
al a
ssis
tanc
e in
maj
or p
rodu
cing
are
as.
2 »Fa
rmer
s5
maj
or
prod
ucin
g ar
eas
have
impr
oved
in
frast
ruct
ures
op
erat
iona
l
Reco
rds
of
proc
essi
ng
volu
mes
and
vis
ual
insp
ectio
n
DoA
MPB
SMA
Coun
try
Stra
tegi
c Op
portu
nitie
s Pr
ogra
mm
e
1,00
0,00
0
1.1.
2 Es
tabl
ish
irrig
atio
n fa
cilit
ies
such
as
pum
p se
ts, c
anal
s an
d dr
aina
ge w
here
ver i
rriga
tion
wate
r is
avai
labl
e. D
isse
min
ate
know
ledg
e of
effi
cien
t use
of i
rriga
tion
wate
r thr
ough
wat
er u
ser
grou
ps a
nd tr
ain
farm
ers
on m
ulch
ing
and
soil
moi
stur
e co
nser
vatio
n m
etho
ds.
2 »Fa
rmer
s5
maj
or
prod
ucin
g ar
eas
have
impr
oved
irr
igat
ion
faci
litie
s
Yiel
ds re
cord
s ;
visu
al in
spec
tions
Irrig
atio
n De
partm
ent
( MOA
I )
DoA
LIFT
–
Pum
ped
Irrig
atio
n Pr
ojec
ts
( PIP
s )
500,
000
1.1.
3 En
cour
age
farm
mec
hani
zatio
n by
pro
vidi
ng s
peci
al lo
ng-t
erm
cr
edit,
a h
ire-p
urch
ase
syst
em, t
echn
ical
ass
ista
nce,
trai
ning
, spa
re
parts
and
mai
nten
ance
ser
vice
s in
col
labo
ratio
n wi
th p
rivat
e fa
rm
mac
hine
ry c
ompa
nies
and
priv
ate
and
publ
ic b
anks
.
1 »Fa
rmer
s »Fa
rm
Mac
hine
ry
Co.
»Ba
nks
10 %
incr
ease
in
farm
m
echa
nisa
tion
in p
riorit
y ar
eas ;
Cred
it at
tribu
tion
reco
rds,
yie
lds
reco
rd
Agric
ultu
re
Mec
hani
zatio
n De
partm
ent
( MOA
I )
MPB
SMA,
farm
m
achi
nery
com
pani
es,
priv
ate
& p
ublic
ban
ks
IFC
Mic
ro-
finan
ce10
,000
,000
( ref
unda
ble
cred
it lin
e )
1.1.
4 En
hanc
e fin
anci
al c
apac
ity o
f nat
iona
l ins
titut
ions
to d
evel
op
new
tech
nolo
gies
by
allo
catin
g hi
gher
bud
gets
, dep
endi
ng o
n th
e pe
rform
ance
in n
ew te
chno
logi
es.
1 »M
oAI
5 % o
f tot
al
budg
et fo
r new
te
chno
logy
de
velo
pmen
t
Budg
et fo
r new
tech
, ev
alua
tion
of te
ch.
impa
ct
MNP
EDM
oAI
Exis
ting
1,00
0,00
0
1.2
Build
fa
rmer
s’
capa
citie
s to
pr
oduc
e qu
ality
pr
oduc
ts
in li
ne w
ith
inte
rnat
iona
l be
st p
ract
ices
.
1.2.
1 In
nova
te in
ext
ensi
on s
ervi
ces
and
tech
nolo
gy tr
ansf
er b
y im
prov
ing
capa
citie
s of
ext
ensi
on w
orke
rs a
nd e
mpl
oyin
g m
ore
of
them
; tak
ing
care
of t
heir
mob
ility
and
wel
fare
; by
enha
ncin
g us
e of
m
ass
med
ia a
nd m
obile
com
mun
icat
ion ;
and
by
shar
ing
the
work
load
wi
th p
rivat
e co
mpa
nies
eng
agin
g in
ext
ensi
on.
1 »Fa
rmer
s »Do
A10
% in
crea
se in
no
. of e
xten
sion
wo
rker
s
No. o
f ext
ensi
on
work
ers ;
sup
ervi
sed
area
; use
of m
obile
ph
ones
DoA
MoA
I, pr
ivat
e co
mpa
nies
.Ex
istin
g1,
000,
000
1.2.
2 Pr
epar
e tra
inin
g m
anua
ls o
n cr
op p
rodu
ctio
n, c
rop
prot
ectio
n an
d po
st-h
arve
st te
chno
logy
and
deliv
er th
e tra
inin
gs to
farm
ers
and
exte
nsio
n wo
rker
s ai
min
g to
pro
duce
qua
lity
prod
ucts
.
2 »Fa
rmer
s »Do
A4
man
uals
for
blac
k gr
am,
gree
n gr
am,
pige
on p
ea a
nd
sesa
me
Prep
ared
trai
ning
m
anua
ls, n
o.
of p
ublic
atio
n di
strib
uted
DoA
MoA
IEx
istin
g50
,000
1.2.
3 Co
nduc
t tra
inin
g of
trai
ners
in p
ublic
and
priv
ate
sect
ors
by
sele
ctin
g ap
prop
riate
per
sons
, sup
porti
ng tr
aini
ng fa
cilit
ies
and
finan
ce, a
nd m
anag
ing
train
ing
prog
ram
mes
.
2 »Fa
rmer
s »Do
A10
trai
ning
of
trai
ners
in
prio
rity
area
s
No. o
f tra
iner
s at
tend
ed ; n
o. o
f tra
inin
g
DoA
DAR,
MPB
SMA
Exis
ting
100,
000
1.2.
4 Ob
tain
ass
ista
nce
from
cou
ntrie
s pr
oduc
ing
qual
ity p
rodu
cts
in
line
with
inte
rnat
iona
l bes
t pra
ctic
es.
2 »Fa
rmer
s5
coun
tries
at
leas
t to
assi
stAs
sist
ance
obt
aine
d ;
Impa
ct a
naly
sis
DoA
DAR,
MPB
SMA,
MoC
50,0
00
1.2
Build
fa
rmer
s’
capa
citie
s to
pr
oduc
e qu
ality
pr
oduc
ts
in li
ne w
ith
inte
rnat
iona
l be
st p
ract
ices
.
1.2.
5 Ap
ply
ASEA
N GA
P by
trai
ning
farm
ers
with
the
help
of
deve
lopm
ent p
artn
ers ;
mon
itorin
g th
e ad
optio
n of
the
prac
tices
; an
d ev
alua
tion
and
certi
ficat
ion
of G
AP b
y Do
A an
d ac
cred
ited
orga
niza
tions
.
2 »Fa
rmer
s »Do
A10
trai
ning
s in
pr
iorit
y ar
eas
No. o
f far
mer
s at
tend
ed ; N
o. o
f GA
P ce
rtific
ate
issu
ed
DoA
DAR,
MPB
SMA
Exis
ting
100,
000
1.2.
6 M
onito
r the
pro
duct
ion
of q
ualit
y pr
oduc
ts a
long
the
supp
ly
chai
n by
taki
ng s
ampl
es, t
estin
g at
labs
, hea
ring
feed
back
from
m
arke
ts, r
epor
ting
back
to fa
rmer
s an
d so
lvin
g pr
oble
ms
by fo
rmin
g a
spec
ial t
ask
forc
e.
1 »Fa
rmer
s1
Qual
ity
cont
rol t
ask
forc
e ; 1
000
sam
ples
No. o
f sam
ple ;
lab
findi
ngs ;
pro
blem
s fo
und
and
solv
ed
Sect
or Q
ualit
y Co
ntro
l Tas
k Fo
rce
DoA,
DAR
, MPB
SMA,
M
oC50
0,00
0

87PLAN OF ACTIONSt
rate
gic
obje
ctiv
e 1 :
Incr
ease
the
sect
or’s
pro
duct
ion
and
prod
uctiv
ity th
roug
h en
hanc
ed fa
rmin
g te
chni
ques
, upg
radi
ng fa
rmer
s’ c
apac
ities
, im
prov
ed in
frast
ruct
ure
and
a re
liabl
e su
pply
of q
ualit
y in
puts
.
Ope
ratio
nal
obje
ctiv
esAc
tiviti
esv
Prio
rity
1=hi
gh2=
med
3=lo
w
Bene
ficia
ries
Targ
et
mea
sure
sM
eans
of
verif
icat
ion
Lead
ing
impl
emen
ting
part
ner
Supp
ortin
g im
plem
entin
g pa
rtne
rsEx
istin
g pr
ogra
mm
es
or p
oten
tial
supp
ort
Estim
ated
co
sts
( USD
)
1.3
Ensu
re a
re
liabl
e an
d co
nsis
tent
su
pply
of
certi
fied
seed
s.
1.3.
1 Ac
quire
mod
ern
seed
mul
tiplic
atio
n te
chno
logi
es b
y in
vitin
g fo
reig
n se
ed c
ompa
nies
to e
stab
lish
oper
atio
ns in
Mya
nmar
( with
tax
ince
ntiv
es, e
nsur
ing
land
leas
es a
nd h
onou
ring
inte
llect
ual p
rope
rty
right
s ) a
nd in
crea
sing
tech
nica
l coo
pera
tion
with
ASE
AN s
eed
indu
strie
s an
d in
stitu
tes.
1 »Fa
rmer
s »Se
ed C
o.10
fore
ign
seed
co
mpa
nies
at
leas
t
Prod
uctio
n an
d di
strib
utio
n of
see
d ;
tech
. coo
pera
tion
repo
rts
Dire
ctor
ate
of In
vest
men
t an
d Co
mpa
ny
Adm
inis
tratio
n ( D
ICA )
DoA,
UM
FCCI
, MoF
A,
DAR
10,0
00
1.3.
2 Bu
ild th
e te
chni
cal c
apac
ities
of s
eed
tech
nici
ans
at D
AR, D
oA-
Seed
Div
isio
n, u
nive
rsiti
es a
nd p
rivat
e m
ultip
licat
ion
busi
ness
es
thro
ugh
the
train
ing
of tr
aine
rs a
nd th
e de
velo
pmen
t of m
anua
ls.
Seek
inte
rnat
iona
l tra
iner
s.
2 »DA
R, D
OA10
0 te
chni
cian
s to
trai
n ; 5
m
anua
ls to
de
velo
p
No. o
f tra
inin
gs
and
train
ees ;
no.
of
man
uals
MoA
IDI
CA, M
oFA,
MNP
EDEx
istin
g10
0,00
0
1.3.
3 Tr
ain
farm
ers
on p
rope
r util
izat
ion
tech
niqu
es o
f cer
tifie
d se
eds
and
on th
e im
porta
nce
of n
ot m
ixin
g va
rietie
s an
d ty
pes
of s
eeds
.1
»Fa
rmer
s10
00 fa
rmer
s at
5 m
ajor
pr
oduc
ing
area
s
No. o
f tra
ined
fa
rmer
s ; fi
eld
asse
ssm
ent
DoA
DAR,
Far
m C
rop
Prod
ucer
s As
soci
atio
nFA
O50
,000
1.3.
4 Es
tabl
ish
a m
ediu
m-t
erm
con
sign
men
t sch
eme
( thr
ee y
ears
, wi
th e
vent
ual p
hase
-out
) to
loan
see
ds to
farm
ers
( and
farm
ers
asso
ciat
ions
) with
an
oblig
atio
n to
retu
rn a
t sui
tabl
e tim
es th
e am
ount
of s
eeds
loan
ed b
y co
ntra
ctua
l agr
eem
ent.
This
activ
ity
is on
ly po
ssib
le w
ith lo
ng-t
erm
low
inte
rest
loan
s av
aila
ble
for
agric
ultu
ral d
evel
opm
ent.
2 »Fa
rmer
s20
% o
f sow
n ar
eas
in 5
maj
or
area
s
Seed
s lo
aned
and
re
turn
ed ; a
dopt
ing
rate
MPB
SMA
Mya
nmar
Agr
icul
tura
l De
velo
pmen
tBan
k,
Mya
nmar
Mic
rofin
ance
Ba
nk, C
entra
l Ban
k of
M
yanm
ar, c
omm
erci
al
bank
s
AUZa
id1,
000,
000
1.3.
5 In
crea
se c
olla
bora
tion
and
coor
dina
tion
betw
een
DAR,
DoA
and
se
ed m
ultip
licat
ion
ente
rpris
es ( F
arm
Cro
p Pr
oduc
ers
Asso
ciat
ion )
th
roug
h m
onth
ly m
eetin
gs ( v
ideo
con
fere
nce )
org
anize
d un
der t
he
ausp
ices
of M
oAI a
nd M
PBSM
A.
1 »M
oAI
»FC
PAM
onth
ly
mee
ting
Wor
ks d
one ;
is
sues
; fac
ts o
f co
llabo
ratio
n an
d co
ordi
natio
n
MoA
IM
oC, M
PBSM
A, D
AR,
DoA
50,0
00
1.3.
6 Ge
t the
priv
ate
sect
or ( M
PBSM
A, M
yanm
ar R
ice
Fede
ratio
n an
d th
e M
yanm
ar R
ice
Indu
stry
Ass
ocia
tion,
etc
. ) to
org
anize
a jo
int
lobb
ying
cam
paig
n to
enc
oura
ge p
ublic
sec
tor i
nves
tmen
t in
seed
m
ultip
licat
ion
in o
rder
to e
nsur
e gr
owth
of p
rodu
ctio
n an
d im
prov
ed
qual
ity fo
r exp
ort d
evel
opm
ent.
1 »Fa
rmer
s »Se
ed C
o.2
cam
paig
n pe
r ye
arPu
blic
sec
tor
inve
stm
ent i
n se
ed
mul
tiplic
atio
n ;
prod
uctio
n gr
owth
; qu
ality
exp
ort
UMFC
CIM
PBSM
A, M
yanm
ar
Rice
Fed
erat
ion
and
the
Mya
nmar
Ric
e In
dust
ry
Asso
ciat
ion
10,0
00
1.3.
7 Es
tabl
ish
a lo
ng-t
erm
con
tract
with
trai
ned
cont
ract
gro
wers
wi
th q
uota
requ
irem
ents
, cle
ar m
ultip
licat
ion
spec
ifica
tions
and
m
onito
ring
ever
y qu
arte
r in
orde
r to
ensu
re in
crea
sed
certi
fied
seed
av
aila
bilit
y.
2 »Co
ntra
ct
grow
ers
Quar
terly
m
eetin
gSe
eds
avai
labi
lity ;
Prod
uctio
n by
co
ntra
ct g
rowe
rs
DoA
DAR,
MPB
SMA,
Fa
rm C
rop
Prod
ucer
s As
soci
atio
n
15,0
00
1.4
Ensu
re
adeq
uate
ac
cess
to
finan
cial
in
stru
men
ts
for p
rodu
ctio
n de
velo
pmen
t.
1.4.
1 Es
tabl
ish
a ru
ral f
inan
ce m
echa
nism
( agr
icul
tura
l cre
dit,
etc.
) th
roug
h ru
ral b
anks
by
setti
ng u
p an
inte
grat
ed n
etwo
rk c
olla
bora
ting
with
pub
lic a
nd p
rivat
e ba
nks.
2 »Fa
rmer
s »M
ADB
20 m
ajor
pr
oduc
ing
town
ship
s to
co
ver
Perfo
rman
ce o
f m
echa
nism
; no.
of
rura
l ban
ks a
nd
publ
ic a
nd p
rivat
ba
nks
invo
lved
Mya
nmar
Ag
ricul
tura
l De
velo
pmen
tBan
k
Min
istry
of F
inan
ce,
Cent
ral B
ank
of
Mya
nmar
, pub
lic a
nd
priv
ate
bank
s
1,00
0,00
0
1.4.
2 In
crea
se p
rivat
e se
ctor
lobb
ying
to th
e Go
vern
men
t of M
yanm
ar
in o
rder
to d
evel
op th
e ag
ricul
tura
l fin
anci
ng in
stru
men
ts ( c
rop
loan
s, d
evel
opm
ent l
oans
, etc
. ) ne
eded
to e
nhan
ce q
ualit
y an
d qu
antit
y of
pro
duct
ion.
3 »Fa
rmer
s2
times
a y
ear
lobb
ying
Amou
nt o
f cro
p lo
ans,
dev
elop
men
t lo
ans ;
mon
itorin
g th
e de
velo
pmen
t
MPB
SMA
MoA
I, M
inis
try o
f Fi
nanc
e, U
MFC
CI,
publ
ic a
nd p
rivat
e ba
nks
50,0
00

88 THE REPUBLIC OF THE UNION OF MYANMAR NATIONAL EXPORT STRATEGY BEANS, PULSES AND OILSEEDS SECTOR STRATEGY 2015-2019
Stra
tegi
c ob
ject
ive
1 : In
crea
se th
e se
ctor
’s p
rodu
ctio
n an
d pr
oduc
tivity
thro
ugh
enha
nced
farm
ing
tech
niqu
es, u
pgra
ding
farm
ers’
cap
aciti
es, i
mpr
oved
infra
stru
ctur
e an
d a
relia
ble
supp
ly o
f qua
lity
inpu
ts.
Ope
ratio
nal
obje
ctiv
esAc
tiviti
esv
Prio
rity
1=hi
gh2=
med
3=lo
w
Bene
ficia
ries
Targ
et
mea
sure
sM
eans
of
verif
icat
ion
Lead
ing
impl
emen
ting
part
ner
Supp
ortin
g im
plem
entin
g pa
rtne
rsEx
istin
g pr
ogra
mm
es
or p
oten
tial
supp
ort
Estim
ated
co
sts
( USD
)
1.4
Ensu
re
adeq
uate
ac
cess
to
finan
cial
in
stru
men
ts
for p
rodu
ctio
n de
velo
pmen
t.
1.4.
3 En
cour
age
priv
ate
bank
s an
d m
icro
finan
ce b
anks
to d
evel
op
rura
l fin
ance
thro
ugh
the
esta
blis
hmen
t of a
spe
cial
fund
( agr
icul
ture
cr
edit
line )
with
adv
anta
geou
s in
terb
ank
lend
ing
rate
s to
be
carri
ed
over
to a
gric
ultu
re lo
ans.
1 »Fa
rmer
s »Ba
nks
50 to
wnsh
ips
to
cove
rPl
anne
d an
d ac
tual
us
e of
spe
cial
fund
; no
. of p
artic
ipat
ing
bank
s
Cent
ral B
ank
of
Mya
nmar
Min
istry
of F
inan
ce,
priv
ate
bank
s,
mic
rofin
ance
in
stitu
tions
75,0
00
1.4.
4 Ex
plor
e se
tting
up
a M
inim
um S
uppo
rt Pr
ice
for m
ajor
exp
ort
item
s of
pul
ses
and
sesa
me,
to a
pply
par
ticul
arly
for t
imes
of m
arke
t fa
ilure
, in
acco
rdan
ce w
ith W
TO p
roce
dure
s.
2 »Fa
rmer
s4
crop
s ( b
lack
gr
am, g
reen
gr
am, p
igeo
n pe
a, s
esam
e ) to
ap
ply
Pric
e, m
arke
t ou
tlook
, clim
ate
chan
ge, p
rodu
ctio
n
MoC
MoA
I, UM
FCCI
1,50
0,00
0
1.5
Impr
ove
prod
uctiv
ity
thro
ugh
enha
nced
us
e of
qua
lity
inpu
ts.
1.5.
1 Pr
ovid
e in
form
atio
n to
farm
ers
on th
e va
lue
of b
uyin
g qu
ality
fe
rtiliz
er, s
eeds
, and
oth
er in
puts
in o
rder
to in
crea
se q
ualit
y an
d qu
ality
of p
rodu
ctio
n by
usi
ng m
ass
med
ia ( j
ourn
als,
FM
radi
o,
tele
visi
on, S
MS,
etc
. ).
1 »Fa
rmer
sBi
-mon
thly
in
form
atio
n pr
ovis
ion
activ
ities
Use
of q
ualit
y in
puts
, yie
ld,
cove
rage
of m
ass
med
ia
DoA
MoA
I, UM
FCCI
, M
yanm
ar
Ferti
lizer
s, S
eed
and
Pest
icid
esEn
trepr
eneu
rs
Asso
ciat
ion,
see
d co
mpa
nies
Exis
ting
100,
000
1.5.
2 Pr
omot
e R&
D fo
r new
var
ietie
s of
hig
her y
ield
and
bet
ter q
ualit
y by
stre
ngth
enin
g an
d m
oder
nizin
g R&
D ce
ntre
s, c
apac
ity-b
uild
ing
and
mon
itorin
g of
mar
ket d
eman
d.
1 »Fa
rmer
s »DA
R20
R&
D Ce
ntre
s to
pr
omot
e
Budg
et o
f R&
D Ce
ntre
s, c
apac
ity
build
ing
activ
ities
; m
arke
t dem
and
DAR
DoA,
MoA
I, M
PBSM
A,
seed
com
pani
esEx
istin
g50
0,00
0
1.5.
3 Ra
ise
the
use
of c
hem
ical
and
bio
ferti
lizer
s by
sup
plem
entin
g lo
cal p
rodu
ctio
n th
roug
h im
ports
. Ens
ure
the
qual
ity o
f inp
uts
by
syst
emat
ic c
ontro
ls o
f fer
tilize
rs a
nd o
ther
inpu
ts in
line
with
laws
an
d re
gula
tions
.
1 »Ag
ro-
Chem
ical
Im
porte
rs
30 %
of
requ
irem
ents
to
impo
rt
Ferti
lizer
use
; lo
cal p
rodu
ctio
n ;
appl
icat
ion
for
impo
rt lic
ense
Mya
nmar
Fe
rtiliz
ers,
See
d an
d Pe
stic
ides
En
trepr
eneu
rs
Asso
ciat
ion
MoA
I, M
PBSM
A, s
eed
com
pani
esEx
istin
g10
0,00
0
1.5.
4 M
onito
r the
ava
ilabi
lity
and
useo
f inp
uts
( ferti
lizer
s, w
ater
, se
eds,
etc
. ) by
col
lect
ing
info
rmat
ion
from
maj
or a
gric
ultu
ral a
reas
an
d by
bui
ldin
g an
info
rmat
ion
syst
em o
n pr
oduc
tion,
yie
lds,
are
as
plan
ted,
etc
.
2 »Fa
rmer
s »M
oAI
24 / 7
ava
ilabl
e up
date
d in
fo.
Sys.
Inpu
ts d
ata,
pr
oduc
tion
data
MoA
IM
yanm
ar F
ertil
izers
, Se
ed a
nd P
estic
ides
En
trepr
eneu
rs
Asso
ciat
ion,
Far
mer
As
soci
atio
n
Exis
ting
50,0
00
1.6
Impr
ove
crop
and
pl
anta
tion
man
agem
ent t
o en
sure
con
stan
t re
turn
s.
1.6.
1 Im
prov
e da
ta c
olle
ctio
n on
pro
duct
ion
varie
ties
and
volu
mes
by
ens
urin
g sy
stem
atic
sam
plin
g, c
rop
cutti
ngs
and
adeq
uate
use
of
info
rmat
ion
tech
nolo
gy.
2 »SL
RD50
sel
ecte
d to
wnsh
ips
to
impr
ove
No. o
f sam
ples
, cro
p cu
tting
; var
ieta
l inf
o ;
use
of IC
T
Settl
emen
t and
La
nd R
ecor
ds
Depa
rtmen
t
MoA
I, M
NPED
Exis
ting
1,00
0,00
0
1.6.
2 Im
prov
eana
lysi
s an
d fo
reca
stin
g of
pla
ntat
ion
requ
irem
ents
by
sur
veyi
ng a
nd b
y ap
plic
atio
n of
rem
ote
sens
ing
and
Geog
raph
ic
Info
rmat
ion
Syst
em te
chno
logy
( res
ourc
e sh
arin
g wi
th o
ther
m
inis
tries
and
tech
nica
l ass
ista
nce
need
ed ).
2 »SL
RD10
% o
f are
as to
su
rvey
and
use
RS
/ GIS
Crop
ana
lysi
s ; c
rop
fore
cast
; are
a su
rvey
Settl
emen
t and
La
nd R
ecor
ds
Depa
rtmen
t
MoA
I, M
inis
try
of S
cien
ce a
nd
Tech
nolo
gy
Exis
ting
20,0
00,0
00
1.7
Impr
ove
post
-har
vest
m
anag
emen
t to
prod
uce
high
er
quan
tity
and
qual
ity.
1.7.1
Bui
ld c
apac
ities
of f
arm
ers,
trad
ers,
mill
ers,
war
ehou
se
oper
ator
s an
d fie
ld s
taff
in p
ost-
harv
est m
anag
emen
t thr
ough
tra
inin
g, e
xten
sion
ser
vice
s an
d de
mon
stra
tions
.
1 »Fa
rmer
s »Tr
ader
s »M
iller
s »W
areh
ouse
op
erat
ors
»Do
A
50 to
wnsh
ips
for p
ost-
harv
est
man
agem
ent
No. o
f tra
inin
g,
train
ees ;
ext
ensi
on
activ
ities
; no.
of
dem
onst
ratio
ns
DoA
MoA
I, UM
FCCI
Exis
ting
750,
000

89PLAN OF ACTIONSt
rate
gic
obje
ctiv
e 1 :
Incr
ease
the
sect
or’s
pro
duct
ion
and
prod
uctiv
ity th
roug
h en
hanc
ed fa
rmin
g te
chni
ques
, upg
radi
ng fa
rmer
s’ c
apac
ities
, im
prov
ed in
frast
ruct
ure
and
a re
liabl
e su
pply
of q
ualit
y in
puts
.
Ope
ratio
nal
obje
ctiv
esAc
tiviti
esv
Prio
rity
1=hi
gh2=
med
3=lo
w
Bene
ficia
ries
Targ
et
mea
sure
sM
eans
of
verif
icat
ion
Lead
ing
impl
emen
ting
part
ner
Supp
ortin
g im
plem
entin
g pa
rtne
rsEx
istin
g pr
ogra
mm
es
or p
oten
tial
supp
ort
Estim
ated
co
sts
( USD
)
1.7
Impr
ove
post
-har
vest
m
anag
emen
t to
prod
uce
high
er
quan
tity
and
qual
ity.
1.7.
2 De
velo
p bu
sine
ss s
kills
of f
arm
ers
by s
ettin
g up
farm
er
busi
ness
sch
ools
in s
trate
gic
area
s to
edu
cate
farm
ers
in b
usin
ess
skill
s, m
anag
emen
t, an
d ec
onom
ic d
ecis
ion-
mak
ing.
2 »Fa
rmer
s »M
oC5
busi
ness
sc
hool
s in
st
rate
gic
area
s
Busi
ness
sch
ools
ac
tiviti
es ; n
o. o
f fa
rmer
s tra
ined
MoC
UMFC
CI75
0,00
0
1.7.
3 Im
prov
e co
mm
unity
leve
l sto
rage
by
prov
idin
g ne
cess
ary
tech
nica
l kno
w-ho
w, h
elpi
ng w
ith fi
nanc
ial a
cces
sibi
lity,
and
build
ing
coop
erat
ive
partn
ersh
ips.
2 »Fa
rmer
s20
coo
p pa
rtner
ship
s to
se
t up
No. o
f sto
rage
fa
cilit
ies
and
quan
tity
stor
ed ;
finan
cial
ass
itanc
e
UMFC
CIDo
A, M
oCEx
istin
g10
,000
1.7.
4 Ex
pand
trad
ition
al s
tora
ge fa
cilit
ies
of s
mal
l size
, bui
lt wi
th
loca
lly a
vaila
ble
mat
eria
ls, b
y en
cour
agin
g lo
cal k
nowl
edge
, by
form
ing
coop
erat
ives
, and
by
mod
erni
zing
the
faci
litie
s.
2 »Fa
rmer
s »Co
-op
»M
PBSM
A
50 tr
aditi
onal
st
orag
e fa
cilit
ies
No. o
f fac
ilitie
s an
d si
zes ;
cos
t ; m
oder
niza
tion
acco
mpl
ishe
d
MPB
SMA
DoA
Exis
ing
50,0
00
1.7.
5 Im
plem
ent a
war
ehou
se re
ceip
t cre
dit s
yste
m m
anag
ed b
y lo
cal
MPB
SMA
mem
ber a
nd c
omm
unity
to e
nabl
e fa
rmer
s to
sto
re th
eir
prod
ucts
with
out d
eter
iora
ting
in q
ualit
y or
qua
ntity
bef
ore
selli
ng to
tra
ders
.
2 »M
PBSM
A m
embe
rs10
sys
tem
s to
es
tabl
ish
No. o
f far
mer
s pa
rtici
pate
; am
ount
of
pro
duce
sto
red ;
co
st o
f sto
rage
MPB
SMA
DoA,
Min
istry
of
Coop
erat
ives
150,
000
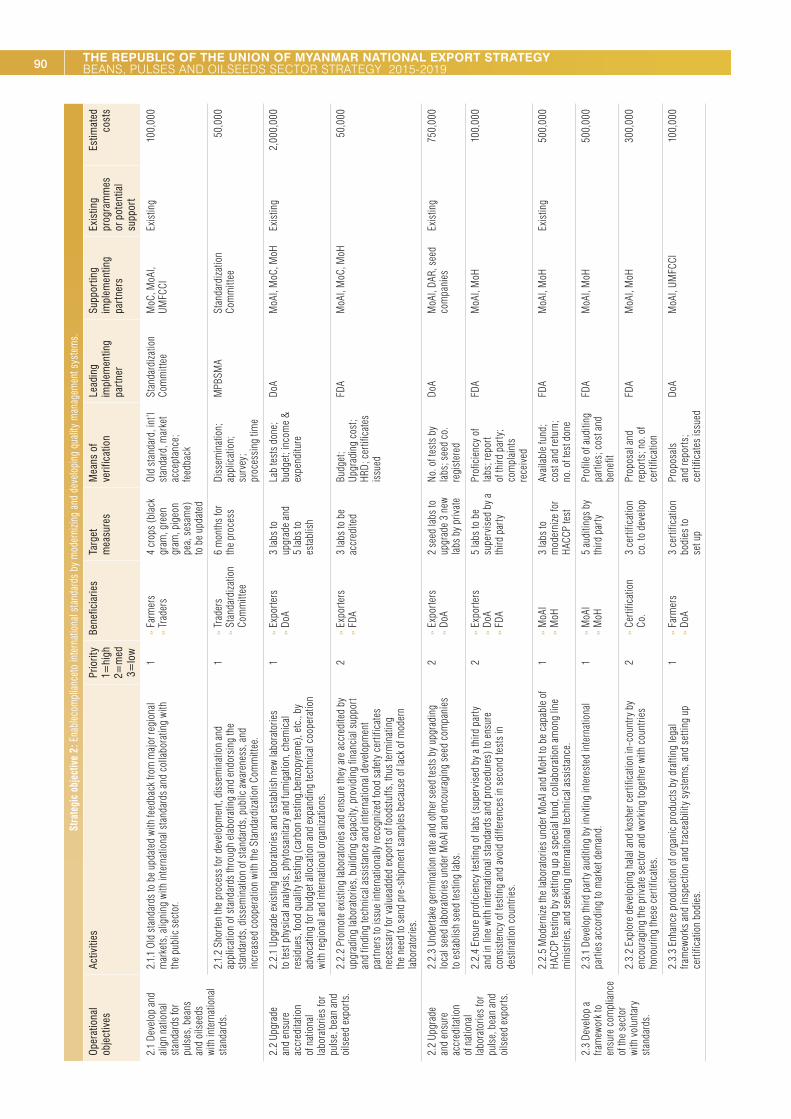
90 THE REPUBLIC OF THE UNION OF MYANMAR NATIONAL EXPORT STRATEGY BEANS, PULSES AND OILSEEDS SECTOR STRATEGY 2015-2019
Stra
tegi
c ob
ject
ive
2 : E
nabl
ecom
plia
ncet
o in
tern
atio
nal s
tand
ards
by
mod
erni
zing
and
deve
lopi
ng q
ualit
y m
anag
emen
t sys
tem
s.
Ope
ratio
nal
obje
ctiv
esAc
tiviti
esPr
iorit
y1=
high
2=m
ed3=
low
Bene
ficia
ries
Targ
et
mea
sure
sM
eans
of
verif
icat
ion
Lead
ing
impl
emen
ting
part
ner
Supp
ortin
g im
plem
entin
g pa
rtne
rs
Exis
ting
prog
ram
mes
or
pot
entia
l su
ppor
t
Estim
ated
co
sts
2.1
Deve
lop
and
alig
n na
tiona
l st
anda
rds
for
puls
es, b
eans
an
d oi
lsee
ds
with
inte
rnat
iona
l st
anda
rds.
2.1.
1 Ol
d st
anda
rds
to b
e up
date
d wi
th fe
edba
ck fr
om m
ajor
regi
onal
m
arke
ts, a
ligni
ng w
ith in
tern
atio
nal s
tand
ards
and
col
labo
ratin
g wi
th
the
publ
ic s
ecto
r.
1 »Fa
rmer
s »Tr
ader
s4
crop
s ( b
lack
gr
am, g
reen
gr
am, p
igeo
n pe
a, s
esam
e )
to b
e up
date
d
Old
stan
dard
, int
’l st
anda
rd, m
arke
t ac
cept
ance
; fe
edba
ck
Stan
dard
izat
ion
Com
mitt
eeM
oC, M
oAI,
UMFC
CIEx
istin
g10
0,00
0
2.1.
2 Sh
orte
n th
e pr
oces
s fo
r dev
elop
men
t, di
ssem
inat
ion
and
appl
icat
ion
of s
tand
ards
thro
ugh
elab
orat
ing
and
endo
rsin
g th
e st
anda
rds,
dis
sem
inat
ion
of s
tand
ards
, pub
lic a
ware
ness
, and
in
crea
sed
coop
erat
ion
with
the
Stan
dard
izat
ion
Com
mitt
ee.
1 »Tr
ader
s »St
anda
rdiz
atio
n Co
mm
ittee
6 m
onth
s fo
r th
e pr
oces
sDi
ssem
inat
ion ;
ap
plic
atio
n ;
surv
ey ;
proc
essi
ng ti
me
MPB
SMA
Stan
dard
izat
ion
Com
mitt
ee50
,000
2.2
Upgr
ade
and
ensu
re
accr
edita
tion
of n
atio
nal
labo
rato
ries
for
puls
e, b
ean
and
oils
eed
expo
rts.
2.2.
1 Up
grad
e ex
istin
g la
bora
torie
s an
d es
tabl
ish
new
labo
rato
ries
to te
st p
hysi
cal a
naly
sis,
phy
tosa
nita
ry a
nd fu
mig
atio
n, c
hem
ical
re
sidu
es, f
ood
qual
ity te
stin
g ( c
arbo
n te
stin
g,be
nzop
yren
e ), e
tc.,
by
advo
catin
g fo
r bud
get a
lloca
tion
and
expa
ndin
g te
chni
cal c
oope
ratio
n wi
th re
gion
al a
nd in
tern
atio
nal o
rgan
izat
ions
.
1 »Ex
porte
rs »Do
A3
labs
to
upgr
ade
and
5 la
bs to
es
tabl
ish
Lab
test
s do
ne ;
budg
et ; i
ncom
e &
ex
pend
iture
DoA
MoA
I, M
oC, M
oHEx
istin
g2,
000,
000
2.2.
2 Pr
omot
e ex
istin
g la
bora
torie
s an
d en
sure
they
are
acc
redi
ted
by
upgr
adin
g la
bora
torie
s, b
uild
ing
capa
city
, pro
vidi
ng fi
nanc
ial s
uppo
rt an
d fin
ding
tech
nica
l ass
ista
nce
and
inte
rnat
iona
l dev
elop
men
t pa
rtner
s to
issu
e in
tern
atio
nally
reco
gnize
d fo
od s
afet
y ce
rtific
ates
ne
cess
ary
for v
alue
adde
d ex
ports
of f
oods
tuffs
, thu
s te
rmin
atin
g th
e ne
ed to
sen
d pr
e-sh
ipm
ent s
ampl
es b
ecau
se o
f lac
k of
mod
ern
labo
rato
ries.
2 »Ex
porte
rs »FD
A3
labs
to b
e ac
cred
ited
Budg
et ;
Upgr
adin
g co
st ;
HRD ;
cer
tific
ates
is
sued
FDA
MoA
I, M
oC, M
oH50
,000
2.2
Upgr
ade
and
ensu
re
accr
edita
tion
of n
atio
nal
labo
rato
ries
for
puls
e, b
ean
and
oils
eed
expo
rts.
2.2.
3 Un
derta
ke g
erm
inat
ion
rate
and
oth
er s
eed
test
s by
upg
radi
ng
loca
l see
d la
bora
torie
s un
der M
oAI a
nd e
ncou
ragi
ng s
eed
com
pani
es
to e
stab
lish
seed
test
ing
labs
.
2 »Ex
porte
rs »Do
A2
seed
labs
to
upgr
ade
3 ne
w la
bs b
y pr
ivat
e
No. o
f tes
ts b
y la
bs ; s
eed
co.
regi
ster
ed
DoA
MoA
I, DA
R, s
eed
com
pani
esEx
istin
g75
0,00
0
2.2.
4 En
sure
pro
ficie
ncy
test
ing
of la
bs ( s
uper
vise
d by
a th
ird p
arty
an
d in
line
with
inte
rnat
iona
l sta
ndar
ds a
nd p
roce
dure
s ) to
ens
ure
cons
iste
ncy
of te
stin
g an
d av
oid
diffe
renc
es in
sec
ond
test
s in
de
stin
atio
n co
untri
es.
2 »Ex
porte
rs »Do
A »FD
A
5 la
bs to
be
supe
rvis
ed b
y a
third
par
ty
Prof
icie
ncy
of
labs
; rep
ort
of th
ird p
arty
; co
mpl
aint
s re
ceiv
ed
FDA
MoA
I, M
oH10
0,00
0
2.2.
5 M
oder
nize
the
labo
rato
ries
unde
r MoA
I and
MoH
to b
e ca
pabl
e of
HA
CCP
test
ing
by s
ettin
g up
a s
peci
al fu
nd, c
olla
bora
tion
amon
g lin
e m
inis
tries
, and
see
king
inte
rnat
iona
l tec
hnic
al a
ssis
tanc
e.
1 »M
oAI
»M
oH3
labs
to
mod
erni
ze fo
r HA
CCP
test
Avai
labl
e fu
nd ;
cost
and
retu
rn ;
no. o
f tes
t don
e
FDA
MoA
I, M
oHEx
istin
g50
0,00
0
2.3
Deve
lop
a fra
mew
ork
to
ensu
re c
ompl
ianc
e of
the
sect
or
with
vol
unta
ry
stan
dard
s.
2.3.
1 De
velo
p th
ird p
arty
aud
iting
by
invi
ting
inte
rest
ed in
tern
atio
nal
parti
es a
ccor
ding
to m
arke
t dem
and.
1 »M
oAI
»M
oH5
audi
tings
by
third
par
tyPr
ofile
of a
uditi
ng
parti
es ; c
ost a
nd
bene
fit
FDA
MoA
I, M
oH50
0,00
0
2.3.
2 Ex
plor
e de
velo
ping
hal
al a
nd k
oshe
r cer
tific
atio
n in
-cou
ntry
by
enco
urag
ing
the
priv
ate
sect
or a
nd w
orki
ng to
geth
er w
ith c
ount
ries
hono
urin
g th
ese
certi
ficat
es.
2 »Ce
rtific
atio
n Co
.3
certi
ficat
ion
co. t
o de
velo
pPr
opos
al a
nd
repo
rts ; n
o. o
f ce
rtific
atio
n
FDA
MoA
I, M
oH30
0,00
0
2.3.
3 En
hanc
e pr
oduc
tion
of o
rgan
ic p
rodu
cts
by d
rafti
ng le
gal
fram
ewor
ks a
nd in
spec
tion
and
trace
abili
ty s
yste
ms,
and
set
ting
up
certi
ficat
ion
bodi
es.
1 »Fa
rmer
s »Do
A3
certi
ficat
ion
bodi
es to
se
t up
Prop
osal
s an
d re
ports
; ce
rtific
ates
issu
ed
DoA
MoA
I, UM
FCCI
100,
000

91PLAN OF ACTIONSt
rate
gic
obje
ctiv
e 2 :
Ena
blec
ompl
ianc
eto
inte
rnat
iona
l sta
ndar
ds b
y m
oder
nizin
g an
d de
velo
ping
qua
lity
man
agem
ent s
yste
ms.
Ope
ratio
nal
obje
ctiv
esAc
tiviti
esPr
iorit
y1=
high
2=m
ed3=
low
Bene
ficia
ries
Targ
et
mea
sure
sM
eans
of
verif
icat
ion
Lead
ing
impl
emen
ting
part
ner
Supp
ortin
g im
plem
entin
g pa
rtne
rs
Exis
ting
prog
ram
mes
or
pot
entia
l su
ppor
t
Estim
ated
co
sts
2.3
Deve
lop
a fra
mew
ork
to
ensu
re c
ompl
ianc
e of
the
sect
or
with
vol
unta
ry
stan
dard
s.
2.3.
4 Ra
ise
awar
enes
s am
ong
prod
ucer
s an
d co
nsum
ers
of
orga
nics
and
requ
irem
ents
; and
bui
ld c
oope
ratio
n wi
th re
gion
al a
nd
inte
rnat
iona
l ins
titut
ions
.
2 »Fa
rmer
s »Co
nsum
ers
2 tim
es a
yea
r aw
aren
ess
cam
paig
n
Awar
enes
s ac
tiviti
es ;
avai
labi
lity
of
orga
nic
prod
ucts
; re
ports
by
inst
itutio
ns
DoA
Orga
nic
Team
Exis
ting
50,0
00
2.3.
5 Or
gani
ze m
ore
busi
ness
es to
hav
e IS
O in
tern
atio
nal s
tand
ards
by
pro
mot
ing
awar
enes
s, a
dopt
ing
good
pra
ctic
es, a
nd im
prov
ing
busi
ness
man
agem
ent.
2 »M
iller
s »Ex
porte
rs10
mem
bers
to
have
ISO
Repo
rts b
y bu
sine
sses
; as
sess
men
t stu
dy
MPB
SMA
UMFC
CI, M
oCEx
istin
g50
0,00
0
2.3.
6 Es
tabl
ish
Corp
orat
e So
cial
Res
pons
ibili
ty b
y tra
inin
g an
d ed
ucat
ion,
cap
acity
-bui
ldin
g of
bus
ines
ses
and
gove
rnm
ent
inst
itutio
ns, a
nd c
onse
rvat
ion
of th
e en
viro
nmen
t.
2 »Pu
blic
50 c
o. to
es
tabl
ish
CSR
Repo
rts b
y pu
blic
& p
rivat
e ;
asse
ssm
ent s
tudy
; SO
E re
ports
UMFC
CIM
oC10
0,00
0
2.3.
7 Su
ppor
t fai
r tra
de c
ertif
icat
ion
of p
rodu
cers
ass
ocia
tions
/ co-
ops
and
proc
esso
rsby
trai
ning
thes
e gr
oups
in g
ood
gove
rnan
ce, l
abou
r rig
hts,
etc
. and
pro
vidi
ng te
chni
cal s
uppo
rt to
adh
ere
to a
nd im
plem
ent
fair
trade
sta
ndar
ds.
2 »Pr
oduc
ers
»Co
-ops
»Pr
oces
sors
75 %
of
mem
bers
to
hav
e ce
rtific
atio
n
No. o
f tra
inin
g ;
tech
nica
l sup
port ;
st
anda
rds
revi
ew
UMFC
CIM
oC50
,000
2.4
Deve
lop
a tra
ceab
ility
sys
tem
fo
r the
pul
ses,
be
ans
and
oils
eeds
se
ctor
.
2.4.
1Und
erta
ke a
feas
ibili
ty s
tudy
to d
evel
op a
trac
eabi
lity
syst
em b
y su
rvey
ing
thro
ugho
ut th
e co
untry
, con
stru
ctin
g a
data
base
sys
tem
and
re
view
ing
mar
ket r
equi
rem
ents
.
2 »Do
A5 %
of
prod
uctio
n to
hav
e tra
ceab
ility
sy
stem
Prod
uctio
n an
d re
late
d da
ta ;
anal
ysis
of
data
base
; mar
ket
feed
back
DoA
MoA
I, M
oHEx
istin
g10
0,00
0
2.4
Deve
lop
a tra
ceab
ility
sys
tem
fo
r the
pul
ses,
be
ans
and
oils
eeds
se
ctor
.
2.4.
2 Lo
bby
busi
ness
es a
nd g
over
nmen
t ins
titut
ions
to s
et u
p a
trace
abili
ty s
yste
m b
y de
mon
stra
ting
curre
nt s
tatu
s an
d th
e ex
pect
ed
bene
fits
of th
e sy
stem
, and
invi
ting
inte
rnat
iona
l ins
titut
ions
wel
l kn
own
in th
is a
rea.
2 »Pu
blic
»Ex
porte
rs5 %
of
prod
uctio
n to
hav
e tra
ceab
ility
sy
stem
Feas
ible
stu
dy
repo
rt ; a
naly
sis
of c
ost &
ben
efit ;
in
t’l p
ract
ises
UMFC
CIM
oC10
,000
2.5
Trai
n tra
ders
an
d ex
porte
rs
on in
tern
atio
nal
qual
ity
requ
irem
ents
and
pr
oced
ures
.
2.5.
1 Tr
ain
trade
rs a
nd e
xpor
ters
on
inte
rnat
iona
l qua
lity
requ
irem
ents
an
d pr
oced
ures
by
cond
uctin
g tra
inin
g an
d wo
rksh
ops
with
the
help
of
MoC
, MoA
I, an
d in
tern
al a
nd e
xter
nal i
nstit
utio
ns.
1 »Ex
porte
rs4
times
a y
ear
train
ing
&
work
shop
No. o
f tra
inin
g &
wor
ksho
p ; n
o.
of p
artic
ipan
ts ;
mar
ket d
eman
d
UMFC
CIM
oC, M
oAI
40,0
00
2.5.
2 Co
llect
and
dis
tribu
te in
form
atio
n on
inte
rnat
iona
l qua
lity
requ
irem
ents
and
pro
cedu
res
by p
ublic
atio
ns, w
ebsi
tes
and
e-m
ails
.1
»Ex
porte
rsM
onth
ly
dist
ribut
ion
of
info
.
Qual
ity
requ
irem
ents
; pr
oced
ures
; no.
of
publ
icat
ions
; web
&
mai
l sta
tistic
s
Depa
rtmen
t of
Trad
e Pr
omot
ion
MoC
Exis
ting
10,0
00
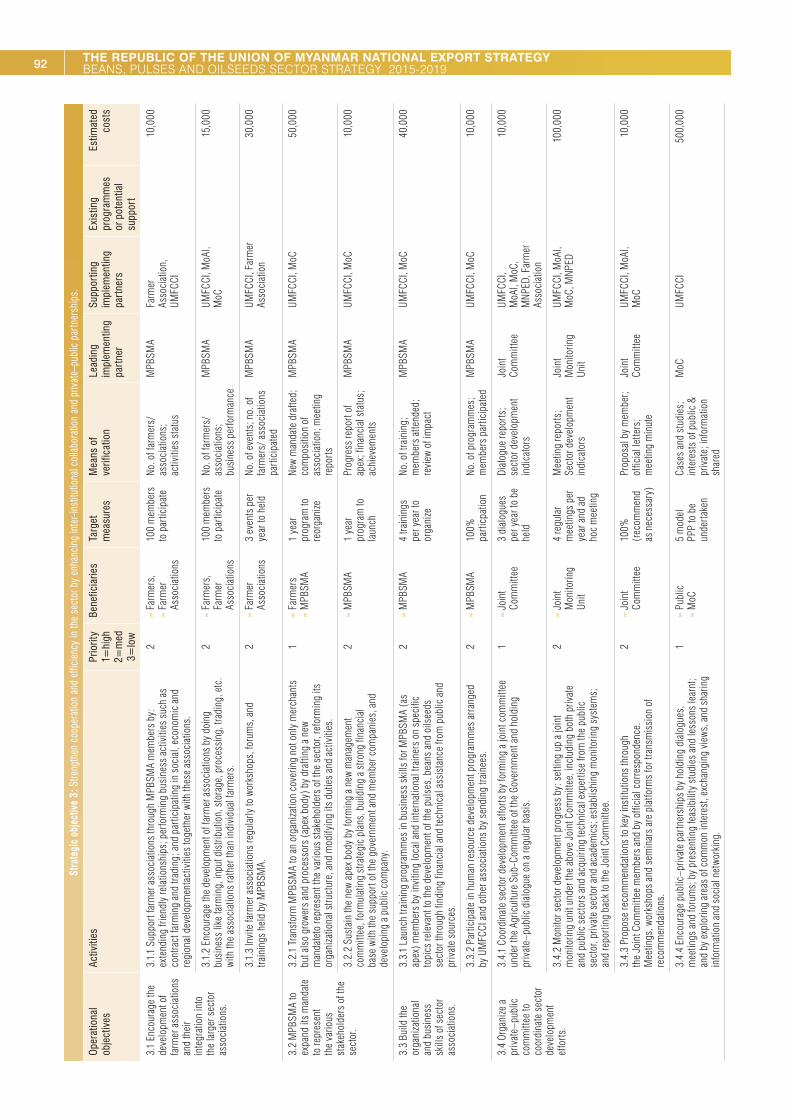
92 THE REPUBLIC OF THE UNION OF MYANMAR NATIONAL EXPORT STRATEGY BEANS, PULSES AND OILSEEDS SECTOR STRATEGY 2015-2019
Stra
tegi
c ob
ject
ive
3 : S
treng
then
coo
pera
tion
and
effic
ienc
y in
the
sect
or b
y en
hanc
ing
inte
r-ins
titut
iona
l col
labo
ratio
n an
d pr
ivat
e–pu
blic
par
tner
ship
s.
Ope
ratio
nal
obje
ctiv
esAc
tiviti
esPr
iorit
y1=
high
2=m
ed3=
low
Bene
ficia
ries
Targ
et
mea
sure
sM
eans
of
verif
icat
ion
Lead
ing
impl
emen
ting
part
ner
Supp
ortin
g im
plem
entin
g pa
rtne
rs
Exis
ting
prog
ram
mes
or
pot
entia
l su
ppor
t
Estim
ated
co
sts
3.1
Enco
urag
e th
e de
velo
pmen
t of
farm
er a
ssoc
iatio
ns
and
thei
r in
tegr
atio
n in
to
the
larg
er s
ecto
r as
soci
atio
ns.
3.1.
1 Su
ppor
t far
mer
ass
ocia
tions
thro
ugh
MPB
SMA
mem
bers
by :
ex
tend
ing
frien
dly
rela
tions
hips
; per
form
ing
busi
ness
act
iviti
es s
uch
as
cont
ract
farm
ing
and
tradi
ng ; a
nd p
artic
ipat
ing
in s
ocia
l, ec
onom
ic a
nd
regi
onal
dev
elop
men
tact
iviti
es to
geth
er w
ith th
ese
asso
ciat
ions
.
2 »Fa
rmer
s, »Fa
rmer
As
soci
atio
ns
100
mem
bers
to
par
ticip
ate
No. o
f far
mer
s /
asso
ciat
ions
; ac
tiviti
es s
tatu
s
MPB
SMA
Farm
er
Asso
ciat
ion,
UM
FCCI
10,0
00
3.1.
2 En
cour
age
the
deve
lopm
ent o
f far
mer
ass
ocia
tions
by
doin
g bu
sine
ss li
ke fa
rmin
g, in
put d
istri
butio
n, s
tora
ge, p
roce
ssin
g, tr
adin
g, e
tc.
with
the
asso
ciat
ions
rath
er th
an in
divi
dual
farm
ers.
2 »Fa
rmer
s,
Farm
er
Asso
ciat
ions
100
mem
bers
to
par
ticip
ate
No. o
f far
mer
s /
asso
ciat
ions
; bu
sine
ss p
erfo
rman
ce
MPB
SMA
UMFC
CI, M
oAI,
MoC
15,0
00
3.1.
3 In
vite
farm
er a
ssoc
iatio
ns re
gula
rly to
wor
ksho
ps, f
orum
s, a
nd
train
ings
hel
d by
MPB
SMA.
2 »Fa
rmer
As
soci
atio
ns3
even
ts p
er
year
to h
eld
No. o
f eve
nts ;
no.
of
farm
ers /
ass
ocia
tions
pa
rtici
pate
d
MPB
SMA
UMFC
CI, F
arm
er
Asso
ciat
ion
30,0
00
3.2
MPB
SMA
to
expa
nd it
s m
anda
te
to re
pres
ent
the
vario
us
stak
ehol
ders
of t
he
sect
or.
3.2.
1 Tr
ansf
orm
MPB
SMA
to a
n or
gani
zatio
n co
verin
g no
t onl
y m
erch
ants
bu
t als
o gr
ower
s an
d pr
oces
sors
( ape
x bod
y ) b
y dr
aftin
g a
new
man
date
to re
pres
ent t
he v
ario
us s
take
hold
ers
of th
e se
ctor
, ref
orm
ing
its
orga
niza
tiona
l stru
ctur
e, a
nd m
odify
ing
its d
utie
s an
d ac
tiviti
es.
1 »Fa
rmer
s »M
PBSM
A1
year
pr
ogra
m to
re
orga
nize
New
man
date
dra
fted ;
co
mpo
sitio
n of
as
soci
atio
n ; m
eetin
g re
ports
MPB
SMA
UMFC
CI, M
oC50
,000
3.2.
2 Su
stai
n th
e ne
w ap
ex b
ody
by fo
rmin
g a
new
man
agem
ent
com
mitt
ee, f
orm
ulat
ing
stra
tegi
c pl
ans,
bui
ldin
g a
stro
ng fi
nanc
ial
base
with
the
supp
ort o
f the
gov
ernm
ent a
nd m
embe
r com
pani
es, a
nd
deve
lopi
ng a
pub
lic c
ompa
ny.
2 »M
PBSM
A1
year
pr
ogra
m to
la
unch
Prog
ress
repo
rt of
ap
ex ; f
inan
cial
sta
tus ;
ac
hiev
emen
ts
MPB
SMA
UMFC
CI, M
oC10
,000
3.3
Build
the
orga
niza
tiona
l an
d bu
sine
ss
skill
s of
sec
tor
asso
ciat
ions
.
3.3.
1 La
unch
trai
ning
pro
gram
mes
in b
usin
ess
skill
s fo
r MPB
SMA
( as
apex
) mem
bers
by
invi
ting
loca
l and
inte
rnat
iona
l tra
iner
s on
spe
cific
to
pics
rele
vant
to th
e de
velo
pmen
t of t
he p
ulse
s, b
eans
and
oils
eeds
se
ctor
thro
ugh
findi
ng fi
nanc
ial a
nd te
chni
cal a
ssis
tanc
e fro
m p
ublic
and
pr
ivat
e so
urce
s.
2 »M
PBSM
A4
train
ings
pe
r yea
r to
orga
nize
No. o
f tra
inin
g ;
mem
bers
atte
nded
; re
view
of i
mpa
ct
MPB
SMA
UMFC
CI, M
oC40
,000
3.3.
2 Pa
rtici
pate
in h
uman
reso
urce
dev
elop
men
t pro
gram
mes
arra
nged
by
UM
FCCI
and
oth
er a
ssoc
iatio
ns b
y se
ndin
g tra
inee
s.2
»M
PBSM
A10
0 %
parti
cpat
ion
No. o
f pro
gram
mes
; m
embe
rs p
artic
ipat
edM
PBSM
AUM
FCCI
, MoC
10,0
00
3.4
Orga
nize
a
priv
ate–
publ
ic
com
mitt
ee to
co
ordi
nate
sec
tor
deve
lopm
ent
effo
rts.
3.4.
1 Co
ordi
nate
sec
tor d
evel
opm
ent e
fforts
by
form
ing
a jo
int c
omm
ittee
un
der t
he A
gric
ultu
re S
ub-C
omm
ittee
of t
he G
over
nmen
t and
hol
ding
pr
ivat
e–pu
blic
dia
logu
e on
a re
gula
r bas
is.
1 »Jo
int
Com
mitt
ee3
dial
ogue
s pe
r yea
r to
be
held
Dial
ogue
repo
rts ;
sect
or d
evel
opm
ent
indi
cato
rs
Join
t Co
mm
ittee
UMFC
CI,
MoA
I, M
oC,
MNP
ED, F
arm
er
Asso
ciat
ion
10,0
00
3.4.
2 M
onito
r sec
tor d
evel
opm
ent p
rogr
ess
by : s
ettin
g up
a jo
int
mon
itorin
g un
it un
der t
he a
bove
Joi
nt C
omm
ittee
, inc
ludi
ng b
oth
priv
ate
and
publ
ic s
ecto
rs a
nd a
cqui
ring
tech
nica
l exp
ertis
e fro
m th
e pu
blic
se
ctor
, priv
ate
sect
or a
nd a
cade
mic
s ; e
stab
lishi
ng m
onito
ring
syst
ems ;
an
d re
porti
ng b
ack
to th
e Jo
int C
omm
ittee
.
2 »Jo
int
Mon
itorin
g Un
it
4 re
gula
r m
eetin
gs p
er
year
and
ad
hoc
mee
ting
Mee
ting
repo
rts ;
Sect
or d
evel
opm
ent
indi
cato
rs
Join
t M
onito
ring
Unit
UMFC
CI, M
oAI,
MoC
, MNP
ED10
0,00
0
3.4.
3 Pr
opos
e re
com
men
datio
ns to
key
inst
itutio
ns th
roug
h th
e Jo
int C
omm
ittee
mem
bers
and
by
offic
ial c
orre
spon
denc
e.
Mee
tings
, wor
ksho
ps a
nd s
emin
ars
are
plat
form
s fo
r tra
nsm
issi
on o
f re
com
men
datio
ns.
2 »Jo
int
Com
mitt
ee10
0 %
( rec
omm
end
as n
eces
sary
)
Prop
osal
by
mem
ber ;
offic
ial l
ette
rs ;
mee
ting
min
ute
Join
t Co
mm
ittee
UMFC
CI, M
oAI,
MoC
10,0
00
3.4.
4 En
cour
age
publ
ic–p
rivat
e pa
rtner
ship
s by
hol
ding
dia
logu
es,
mee
tings
and
foru
ms ;
by
pres
entin
g fe
asib
ility
stu
dies
and
less
ons
lear
nt ;
and
by e
xplo
ring
area
s of
com
mon
inte
rest
, exc
hang
ing
view
s, a
nd s
harin
g in
form
atio
n an
d so
cial
net
work
ing.
1 »Pu
blic
»M
oC5
mod
el
PPP
to b
e un
derta
ken
Case
s an
d st
udie
s ;
inte
rest
s of
pub
lic &
pr
ivat
e ; in
form
atio
n sh
ared
MoC
UMFC
CI50
0,00
0

93PLAN OF ACTIONSt
rate
gic
obje
ctiv
e 4 :
Stre
ngth
en th
e se
ctor
’s a
bilit
y to
add
val
ue to
its
prod
ucts
thro
ugh
enha
ncin
g bu
sine
ss m
anag
emen
t cap
aciti
es a
nd m
oder
nizin
g pr
oces
sing
faci
litie
s an
d te
chni
ques
.
Ope
ratio
nal
obje
ctiv
esAc
tiviti
esPr
iorit
y1=
high
2=m
ed3=
low
Bene
ficia
ries
Targ
et
mea
sure
sM
eans
of v
erifi
catio
nLe
adin
gim
plem
entin
g pa
rtne
r
Supp
ortin
g im
plem
entin
g pa
rtne
rsEx
istin
g pr
ogra
mm
es
or p
oten
tial
supp
ort
Estim
ated
co
sts
4.1
Build
the
know
ledg
e of
sec
tor
ente
rpris
es
conc
erni
ng
exis
ting
prod
ucts
av
aila
ble
at th
e in
tern
atio
nal
leve
l.
4.1.
1 Es
tabl
ish
a fo
od d
evel
opm
ent t
echn
olog
y fra
mew
ork /
inst
itute
thro
ugh
colla
bora
tion
and
coop
erat
ion
amon
g st
akeh
olde
rs.
2Fo
od
prod
ucer
s1
natio
nal
inst
itute
to
estb
lish
Deve
lopm
ent p
rogr
ess ;
in
puts
by
stak
ehol
ders
MoA
IM
oH M
yanm
ar F
ood
Proc
esso
rs a
nd
Expo
rters
Ass
ocia
tion,
pr
ivat
e un
iver
sitie
s
1,00
0,00
0
4.1.
2 In
crea
se p
artic
ipat
ion
in tr
ade
fairs
by e
stab
lishi
ng a
mar
ket
inte
rven
tion
sche
me
to e
ncou
rage
par
ticip
atio
n an
d by
pro
vidi
ng
info
rmat
ion
and
nece
ssar
y su
ppor
t to
sect
or e
nter
pris
es.
2UM
FCCI
4 tra
de fa
irs a
t le
ast a
yea
r to
parti
cipa
te
No. o
f par
ticip
ated
en
terp
rise ;
feed
back
and
re
ports
UMFC
CIM
oC50
0,00
0
4.1.
3 Pr
ovid
e re
gula
r mar
ket r
epor
ts o
n pr
ices
, mar
ket t
rend
s,
polic
y ch
ange
s, e
tc. t
o al
l MPB
SMA
mem
bers
by
send
ing
post
m
ails
and
e-m
ails
and
upd
atin
g th
e we
bsite
.
1M
PBSM
AM
onth
ly
repo
rts to
pr
ovid
e
No. o
f cor
resp
onde
nce ;
m
onito
ring
of w
ebsi
teM
PBSM
AUM
FCCI
, MoC
10,0
00
4.2
Prov
ide
adeq
uate
fin
anci
al
mec
hani
sms
to s
timul
ate
inno
vatio
n an
d ne
w pr
oduc
t de
velo
pmen
t.
4.2.
1 Ad
voca
te, m
akin
g po
licy
prop
osal
s an
d re
com
men
datio
ns
to p
rovi
de in
cent
ives
( tax
redu
ctio
n, d
uty
free-
impo
rts, e
tc. )
to
sect
or e
nter
pris
es a
imin
g to
stim
ulat
e in
nova
tion
and
new
prod
uct
deve
lopm
ent.
1M
PBSM
AAd
voca
te a
s ne
cess
ary
Polic
y pr
opos
als
&
reco
mm
enda
tion
mad
e ;
achi
evem
ents
MPB
SMA
UMFC
CI, M
oC10
,000
4.2.
2 Es
tabl
ish
a sp
ecia
l inn
ovat
ion
fund
by
lobb
ying
, mee
ting
and
enga
ging
in d
iscu
ssio
n wi
th c
once
rned
min
istri
es a
nd
inst
itutio
ns.
2M
PBSM
A2 %
of e
xpor
t va
lue
for
fund
ing
Expo
rt va
lue ;
m
eetin
g m
inut
es ;
acco
mpl
ishm
ent
MPB
SMA
UMFC
CI, M
oC, M
oAI
1,00
0,00
0
4.3
Ensu
re
prop
er
infra
stru
ctur
e is
ava
ilabl
e fo
r en
terp
rises
to b
e co
mpe
titiv
e in
th
eir p
roce
ssin
g op
erat
ions
.
4.3.
1 M
ake
utili
ties
and
faci
litie
s ( e
lect
ricity
, wat
er, t
elep
hone
, et
c. ) a
vaila
ble
in S
EZs
to e
ncou
rage
ent
erpr
ises
to re
loca
te b
y en
surin
g th
e pr
oper
ser
vice
s an
d in
frast
ruct
ure
are
set u
p an
d op
erat
iona
l.
2Co
. in
SEZ
100 %
full
utili
ties
&
faci
litie
s
Avai
labi
lity
of u
tiliti
es
& fa
cilit
ies ;
no.
of c
o.
in S
EZs ;
SEZs
repo
rts
SEZ
Com
mitt
eeM
inis
try o
f Ele
ctric
Po
wer,
Min
istry
of
Info
rmat
ion,
Min
istry
of
Com
mun
icat
ions
and
In
form
atio
n Te
chno
logy
Exis
ting
10,0
00
4.3.
2 Pr
ovid
e an
adv
anta
geou
s fra
mew
ork
( ince
ntiv
e pa
ckag
e )
to e
ncou
rage
relo
catio
n of
trad
ers
and
proc
esso
rs to
SEZ
s. A
llow
the
priv
ate
sect
or to
par
ticip
ate
in th
e m
odifi
catio
n of
fram
ewor
ks,
laws
and
regu
latio
ns a
nd S
EZ m
anag
emen
t.
2Co
. in
SEZ
50 %
priv
ate
in S
EZ
Com
mitt
ee
Ince
ntiv
es o
ffere
d ;
mee
ting
repo
rtsSE
Z Co
mm
ittee
Min
istry
of I
nfor
mat
ion,
M
oC8,
000
4.3.
3 En
sure
the
qual
ity o
f the
infra
stru
ctur
e su
ch a
s ro
ad
netw
orks
, ele
ctric
sup
ply,
wate
r sup
ply,
etc.
in S
EZs
by p
rope
r m
aint
enan
ce a
nd u
pgra
ding
by
SEZ
man
agem
ent.
2Co
. in
SEZ
All S
EZ to
en
sure
the
qual
ity
Qual
ity s
tatu
s ;
mai
nten
ance
and
up
grad
ing
work
s
SEZ
Com
mitt
eeM
inis
try o
f Inf
orm
atio
n,
MoC
Exis
ting
5,00
0
4.3.
4 St
reng
then
rura
l / reg
iona
l sto
rage
and
pro
cess
ing
by
enco
urag
ing
smal
l and
med
ium
-size
d en
terp
rises
to in
vest
in
thes
e fa
cilit
ies,
bui
ldin
g an
d re
nova
tion
of ru
ral r
oads
, and
im
plem
entin
g ru
ral e
lect
rific
atio
n.
2SM
Es20
% o
f pr
oduc
ing
area
s to
st
reng
then
Stat
us in
sto
rage
&
proc
essi
ng ; i
nves
tmen
t by
ent
erpr
ises
; in
frast
ruct
ure
deve
lopm
ent
UMFC
CIM
oAI,
MoC
10,0
00
4.4
Orga
nize
st
ruct
ured
in
vest
men
t pr
omot
ion
effo
rts fo
r sec
tor
deve
lopm
ent
( pro
cess
ing )
.
4.4.
1 In
crea
se p
artic
ipat
ion
of s
ecto
r ent
erpr
ises
in b
usin
ess
mat
chin
g at
UM
FCCI
by
desi
gnin
g a
capa
city
-bui
ldin
g pr
ogra
mm
e on
how
to p
rese
nt th
eir e
nter
pris
es a
nd p
rodu
cts.
2SM
Es10
0 %
parti
cipa
tion
No. o
f pro
gram
s ;
parti
cipa
tionr
ate
MPB
SMA
UMFC
CIEx
istin
g10
,000

94 THE REPUBLIC OF THE UNION OF MYANMAR NATIONAL EXPORT STRATEGY BEANS, PULSES AND OILSEEDS SECTOR STRATEGY 2015-2019
Stra
tegi
c ob
ject
ive
4 : S
treng
then
the
sect
or’s
abi
lity
to a
dd v
alue
to it
s pr
oduc
ts th
roug
h en
hanc
ing
busi
ness
man
agem
ent c
apac
ities
and
mod
erni
zing
proc
essi
ng fa
cilit
ies
and
tech
niqu
es.
Ope
ratio
nal
obje
ctiv
esAc
tiviti
esPr
iorit
y1=
high
2=m
ed3=
low
Bene
ficia
ries
Targ
et
mea
sure
sM
eans
of v
erifi
catio
nLe
adin
gim
plem
entin
g pa
rtne
r
Supp
ortin
g im
plem
entin
g pa
rtne
rsEx
istin
g pr
ogra
mm
es
or p
oten
tial
supp
ort
Estim
ated
co
sts
4.4
Orga
nize
st
ruct
ured
in
vest
men
t pr
omot
ion
effo
rts fo
r sec
tor
deve
lopm
ent
( pro
cess
ing )
.
4.4.
2 Ha
ve M
PBSM
A lis
t inv
estm
ent o
ppor
tuni
ties
( incl
udin
g te
chno
logy
tran
sfer
) in
the
sect
or b
y di
scus
sion
with
MIC
, DIC
A,
MoC
, MoA
I, UM
FCCI
, etc
. to
prom
ote
inve
stm
ent f
or s
ecto
r de
velo
pmen
t.
2M
PBSM
A3
mon
ths
prog
ram
to
list
Oppo
rtuni
ties
revi
ew ;
disc
ussi
ons
with
rela
ted
inst
itutio
ns
MPB
SMA
UMFC
CI, M
IC, M
oC10
,000
4.4.
3 Pr
omot
e in
vest
men
t by
invi
ting
inve
stor
s, e
xpla
inin
g th
e in
vest
men
t opp
ortu
nitie
s, p
rovi
ding
sec
tor i
nfor
mat
ion,
and
m
atch
mak
ing
with
mem
ber e
nter
pris
es.
2In
vest
ors
2 tim
es a
yea
r pr
omot
ion
Inve
stm
ent
oppo
rtuni
ties ;
sec
tor
deve
lopm
ent ;
prog
ress
in
inve
stm
ent
MPB
SMA
UMFC
CI, M
IC, M
oAI,
MoC
500,
000
4.4.
4 Vi
sit f
orei
gn c
ount
ries
for i
nves
tmen
t pro
mot
ion
by
findi
ng fi
nanc
ial s
uppo
rt fro
m g
over
nmen
t, th
e pr
ivat
e se
ctor
, in
vest
men
t par
tner
s an
d ow
n re
sour
ces
to e
xplo
re n
ew m
arke
ts,
new
prod
ucts
, and
new
bus
ines
s pa
rtner
s ; to
lear
n in
tern
atio
nal
prac
tices
in in
vest
men
t ; to
dis
sem
inat
e in
form
atio
n ab
out
inve
stm
ent o
ppor
tuni
ties
in M
yanm
ar ; a
nd to
lear
n ab
out
mod
erni
zatio
n of
the
sect
or a
long
the
supp
ly c
hain
.
2M
PBSM
A3
times
a
year
at l
east
fo
reig
n vi
sit
Fina
ncia
l sup
port ;
ac
hiev
emen
t ; re
ports
on
vis
it
MPB
SMA
UMFC
CI, M
oC1,
000,
000

95PLAN OF ACTIONSt
rate
gic
obje
ctiv
e 5 :
Ens
ure
cont
inuo
us g
row
th a
nd g
loba
l rea
ch o
f the
sec
tor t
hrou
gh re
liabl
e m
arke
t inf
orm
atio
n, e
ffici
ent e
xpor
t pro
cedu
res,
targ
eted
bra
ndin
g an
d im
prov
ed p
rom
otio
n ef
forts
.
Ope
ratio
nal
obje
ctiv
esAc
tiviti
esPr
iorit
y1=
high
2=m
ed3=
low
Bene
ficia
ries
Targ
et m
easu
res
Mea
ns o
f ver
ifica
tion
Lead
ing
impl
emen
ting
part
ner
Supp
ortin
g im
plem
entin
g pa
rtne
rs
Exis
ting
prog
ram
mes
or
pot
entia
l su
ppor
t
Estim
ated
co
sts
5.1
Esta
blis
h el
ectro
nic
com
mod
ity
exch
ange
cen
tres.
5.1.
1 Un
derta
ke a
feas
ibili
ty s
tudy
aim
ing
at s
ucce
ssfu
l im
plem
enta
tion
ofel
ectro
nic
com
mod
ity e
xcha
nge
cent
res
by c
olle
ctin
g an
d an
alys
ing
info
rmat
ion
on c
entre
s’ c
urre
nt a
ctiv
ities
, ava
ilabi
lity
of m
arke
t in
form
atio
n, u
ser n
eeds
, app
licab
le te
chno
logy
, bud
get r
equi
rem
ents
, an
d le
sson
s le
arnt
by
fore
ign
com
mod
ity e
xcha
nge
cent
res.
2 »M
PBSM
A5
feas
ibili
ty
stud
y ( Y
ango
n,
Man
dala
y, Pa
thei
n, M
onyw
a,
Taun
ggyi
)
Repo
rts b
y CE
XCs ;
vo
lum
e an
d va
lue
of
exch
ange
; cos
t / ben
efit
MPB
SMA
UMFC
CI, M
oCEx
istin
g50
,000
5.1.
2 Es
tabl
ish
elec
troni
c co
mm
odity
exc
hang
e ce
ntre
s in
Yan
gon
and
Man
dala
y, th
en e
xten
dto
othe
r maj
or m
arke
ts b
y tra
nsfo
rmin
g an
d m
oder
nizin
g ex
istin
g CE
XCs.
3 »M
PBSM
A15
ele
ctro
nic
exch
ange
cen
tres
Prog
ress
repo
rt ;
mon
itorin
g ; tr
ade
stat
istic
s
MPB
SMA
UMFC
CI, M
oC75
0,00
0
5.1.
3 En
sure
effe
ctiv
e m
onito
ring
and
eval
uatio
n of
the
elec
troni
c co
mm
odity
exc
hang
e ce
ntre
s by
sur
veyi
ng u
sers
, doi
ng fi
nanc
ial
audi
ting,
ben
chm
arki
ng w
ith o
ther
cen
tres,
etc
.
2 »M
PBSM
A15
cen
tres
to
mon
itor
User
s su
rvey
; aud
it re
port ;
ev
alua
tion
MPB
SMA
UMFC
CI, M
oC10
0,00
0
5.2
Ensu
re
stru
ctur
ed e
xpor
t de
velo
pmen
t and
pr
omot
ion
effo
rts.
5.2.
1 Bu
ild c
apac
ities
of c
omm
erci
al a
ttach
és c
once
rnin
g th
e pu
lses
, be
ans
and
oils
eeds
sec
tor a
nd it
s pr
oces
sed
prod
ucts
by
train
ing,
se
ndin
g re
late
d in
form
atio
n, a
nd n
etwo
rkin
g wi
th M
PBSM
A.
1 »Ex
porte
rs10
0 % ( a
ll at
tach
es ) t
o co
ver
No. o
f tra
inin
g ;
info
rmat
ion
shar
ed ;
impa
ct a
naly
sis
UMFC
CIM
oC15
0,00
0
5.2.
2 Or
gani
ze m
ore
trade
mis
sion
s to
sel
ecte
d ta
rget
mar
kets
for
busi
ness
own
ers
from
the
puls
es, b
eans
and
oils
eeds
sec
tor,
with
the
help
of U
MFC
CI a
nd M
oFA.
1 »Ex
porte
rs4
mss
ions
at l
east
pe
r yea
rM
arke
t res
earc
h ; fu
nd
avai
labi
lity ;
mis
sion
repo
rtM
oCM
oFA,
UM
FCCI
Exis
ting
1,00
0,00
0
5.2.
3 Or
gani
ze a
n an
nual
Mya
nmar
inte
rnat
iona
l tra
de fa
ir by
invi
ting
loca
l and
inte
rnat
iona
l bus
ines
s pa
rtner
s to
par
ticip
ate.
2 »Ex
porte
rs1
annu
al
inte
rnat
iona
l tra
de
fair
No. o
f par
ticip
ants
; at
tend
ance
; rev
iew
UMFC
CIM
PBSM
A,
MoC
750,
000
5.2.
4 Le
adin
g im
plem
entin
g pa
rtner
with
“UM
FCCI
” an
d su
ppor
ting
impl
emen
ting
partn
er w
ith “
MPB
SMA,
MoC
”1
»Ex
porte
rs7
prio
rity
mar
kets
( In
dia,
Chi
na,
Japa
n, K
orea
, EU,
US
, Mid
dle
East
)
Mar
ket d
evel
opm
ent ;
mar
ket r
esea
rch ;
m
onito
ring
mar
ket
resp
onse
UMFC
CIM
PBSM
A,
MoC
, MoF
A25
,000
5.3
Impr
ove
logi
stic
s an
d tra
de
faci
litat
ion.
5.3.
1 Ho
ld o
ffici
al m
eetin
gs w
ith s
hipp
ing
lines
, roa
d au
thor
ities
, cu
stom
s an
d po
rt au
thor
ities
to re
solv
e th
e pr
oble
m o
f flu
ctua
ting
pric
es o
f tra
nspo
rt ( e
mpt
y co
ntai
ner c
harg
es a
nd d
estin
atio
n TH
C ).
Item
s to
be
addr
esse
d : »Op
enin
g ho
urs
at C
usto
ms
»De
lays
at p
ort
»To
ol c
harg
es »Al
tern
ativ
e ro
utes
to re
duce
traf
fic.
2 »Ex
porte
rs »Tr
ansp
orte
rs10
0 % ( a
ll m
arke
t wi
th th
e pr
oble
ms )
Data
col
lect
ion ;
ana
lysi
s ;
feed
back
from
exp
orte
rs &
im
porte
rs ;
Mon
itorin
g pr
ogre
ss
UMFC
CIM
oC, M
oFA
15,0
00
5.3.
2 Tr
ain
curre
nt a
nd e
mer
ging
exp
orte
rs o
n ex
port
docu
men
tatio
n,
proc
edur
es, a
nd re
quire
men
ts to
incr
ease
effe
ctiv
enes
s of
exp
ort
trans
actio
ns.
3 »Ex
porte
rs4
train
ings
a y
ear
No. o
f tra
inin
g ; tr
aine
es ;
eval
uatio
nUM
FCCI
MoC
, Cus
tom
s De
partm
ent,
bank
s
50,0
00
5.3
Impr
ove
logi
stic
s an
d tra
de
faci
litat
ion.
5.3.
3 Re
view
tolls
and
road
brid
ge c
harg
es b
y ho
ldin
g m
eetin
gs w
ith
auth
oriti
es a
nd p
rivat
e co
mpa
nies
con
cern
ed.
2 »Ex
porte
rs3
mee
tings
per
ye
arIn
form
atio
n co
llect
ion ;
re
view
; mee
ting
min
ute
UMFC
CIM
inis
try o
f Co
nstru
ctio
n,
MoC
10,0
00
5.3.
4 Ho
ld re
gula
r mee
tings
with
Cus
tom
s to
dis
cuss
issu
es a
nd
chal
leng
es c
once
rnin
g Cu
stom
s De
partm
ent p
roce
dure
s, in
ord
er to
es
tabl
ish
a si
mpl
ified
pro
cedu
re w
ith th
e ai
m o
f set
ting
up a
n ef
ficie
nt
sing
le w
indo
w sy
stem
.
2 »Ex
porte
rs4
mee
tings
per
ye
arRe
view
; com
paris
on w
ith
othe
r cou
ntrie
s ; m
eetin
g m
inut
e
Cust
oms
Depa
rtmen
tM
inis
try o
f Fi
nanc
e,
UMFC
CI
15,0
00

96 THE REPUBLIC OF THE UNION OF MYANMAR NATIONAL EXPORT STRATEGY BEANS, PULSES AND OILSEEDS SECTOR STRATEGY 2015-2019
Stra
tegi
c ob
ject
ive
5 : E
nsur
e co
ntin
uous
gro
wth
and
glo
bal r
each
of t
he s
ecto
r thr
ough
relia
ble
mar
ket i
nfor
mat
ion,
effi
cien
t exp
ort p
roce
dure
s, ta
rget
ed b
rand
ing
and
impr
oved
pro
mot
ion
effo
rts.
Ope
ratio
nal
obje
ctiv
esAc
tiviti
esPr
iorit
y1=
high
2=m
ed3=
low
Bene
ficia
ries
Targ
et m
easu
res
Mea
ns o
f ver
ifica
tion
Lead
ing
impl
emen
ting
part
ner
Supp
ortin
g im
plem
entin
g pa
rtne
rs
Exis
ting
prog
ram
mes
or
pot
entia
l su
ppor
t
Estim
ated
co
sts
5.3
Impr
ove
logi
stic
s an
d tra
de
faci
litat
ion.
5.3.
5 En
sure
that
the
port
and
logi
stic
s fa
cilit
ies
deve
lop
and
impl
emen
t tra
ckin
g an
d tra
cing
and
retri
evin
g sy
stem
s in
thei
r con
tain
er y
ards
by
the
oper
atin
g co
mpa
ny im
prov
ing
and
mod
erni
zing
the
faci
litie
s.
2 »Ex
porte
rs »Co
ntai
ner
Co.
100 %
( all
ports
to
mod
erni
ze )
Revi
ew p
rogr
ess ;
fe
edba
ck b
y ex
porte
rsCo
ntai
ner
com
pani
esPo
rt Au
thor
ity,
UMFC
CI10
,000
5.4
Orga
nize
a
bran
ding
initi
ativ
e fo
r the
sec
tor.
5.4.
1 Ex
plor
e ne
w br
andi
ng o
f pul
se, b
ean
and
oils
eed
prod
ucts
by
desi
gnin
g a
bran
ding
stra
tegy
for t
he s
ecto
r inv
olvi
ng a
ll th
e m
embe
rs
of th
e re
vam
ped
MPB
SMA
( ape
x bod
y ).
1 »M
PBSM
A2
bran
ding
ca
mpa
ings
a y
ear
Mon
itor b
rand
ing
activ
ities
; im
pact
ana
lysi
sM
PBSM
AM
oC, U
MFC
CI50
0,00
0
5.4.
2 En
sure
effe
ctiv
e m
anag
emen
t and
qua
lity
cont
rols
of t
he b
rand
by
setti
ngqu
ality
requ
irem
ents
and
con
trol s
yste
ms
for u
sers
of t
he b
rand
.1
»UM
FCCI
1 qu
ality
con
trol
syst
emSt
anda
rdiza
tion,
certi
ficat
es ;
mon
itorin
g ; m
arke
t co
mpl
aint
s
UMFC
CIM
oC,
Stan
dard
izatio
n Co
mm
ittee
1,50
0,00
0
5.5
Impr
ove
natio
nal a
nd
inte
rnat
iona
l co
mm
erci
al
arbi
tratio
n.
5.5.
1 Fo
rm a
spe
cial
com
mitt
ee o
n ar
bitra
tion
with
the
man
date
to
tran
sfor
m fr
om n
egot
iatio
n-ba
sed
to le
gal-
base
d by
revi
ewin
g ar
bitra
tion
case
s in
Mya
nmar
, usi
ng in
tern
atio
nal p
roce
dure
s an
d pr
actic
es, a
nd p
rovi
ding
reco
mm
enda
tions
for r
evis
ion
of th
e le
gal
fram
ewor
k.
2 »UM
FCCI
1 sp
ecia
l co
mm
ittee
on
arbi
tratio
n
Man
date
; leg
isla
tion ;
in
tern
atio
nal p
roce
dure
s &
pra
ctic
es
UMFC
CI,
MoC
Atto
rney
Ge
nera
lEx
istin
g20
0,00
0
5.5.
2 Pr
omot
e th
e us
e of
con
tract
s th
roug
h or
gani
zed
train
ing
and
prom
otio
n ef
forts
to fa
rmer
s, tr
ader
s an
d ex
porte
rs.
2 »M
PBSM
A2
train
ings
a y
ear
No. o
f tra
inin
g ; n
o. o
f pa
rtici
pant
s ; n
o. o
f co
ntra
cts
used
MPB
SMA
UMFC
CI20
,000
5.5.
3 Pr
ovid
e ta
rget
ed tr
aini
ng to
sec
tor s
take
hold
ers
on d
rafti
ng o
f co
ntra
ctua
l agr
eem
ents
and
use
of t
he a
rbitr
atio
n m
echa
nism
.2
»Fa
rmer
s »M
PBSM
A2
train
ings
a y
ear
No. o
f tra
inin
g ; n
o. o
f pa
rtici
pant
s ; n
o. o
f co
ntra
cts
& a
rbitr
atio
n m
echa
nism
use
d
20,0
00
5.5.
4 Cl
arify
arb
itrat
ion
role
s ve
rsus
cou
rt ru
lings
, as
well
as d
efin
ition
of
arb
itrat
ion
resp
onsi
bilit
ies
betw
een
MPB
SMA
and
UMFC
CI.
3 »UM
FCCI
»M
PBSM
A2
mee
tings
a y
ear
No. o
f arb
itrat
ion
case
s ;
cour
t rul
ings
; mee
ting
min
ute
10,0
00
5.6
Ensu
re a
cces
s to
tim
ely
and
rele
vant
trad
e in
form
atio
n,
incl
udin
g de
taile
d m
arke
t rep
orts
.
5.6.
1 Se
t up
a ne
twor
k to
col
lect
, ana
lyse
and
dis
sem
inat
e pr
oduc
tion,
m
arke
t, pr
ice
and
trade
info
rmat
ion
for t
he p
ulse
s, b
eans
and
oils
eeds
se
ctor
. Inf
orm
atio
n co
llect
ion
shou
ld c
over
dom
estic
as
well
as k
ey
inte
rnat
iona
l tar
get m
arke
ts a
nd b
e co
mpl
eted
in c
olla
bora
tion
with
lo
cal b
usin
esse
s.
1 »Fa
rmer
s »Tr
ader
s »Ex
porte
rs
1 tra
de in
form
atio
n ne
twor
k to
set
up
Avai
labl
e in
form
atio
n ;
acce
ssib
ility
; tim
elin
ess ;
re
liabi
lity
MoC
UMFC
CI,
MPB
SMA
Exis
ting
750,
000
5.6.
2 De
velo
p a
trade
info
rmat
ion
syst
em b
y or
gani
zing
a ta
sk fo
rce
to
supp
ort d
ata
colle
ctio
n, a
naly
sis
and
diss
emin
atio
n.1
»Tr
ader
s »Ex
porte
rs1
task
forc
e to
de
velo
pM
onito
ring
and
eval
uatio
n of
info
rmat
ion
sys
MoC
UMFC
CI,
MPB
SMA
100,
000
5.6.
3 Pr
ovid
e re
gula
r tra
inin
g to
exp
orte
rs o
n co
llect
ion,
ana
lysi
s an
d ut
iliza
tion
tech
niqu
es o
f tra
de in
form
atio
n to
faci
litat
e m
arke
t ent
ry.
1 »Ex
porte
rs3
train
ings
a y
ear
No. o
f tra
inin
gs ; n
o. o
f tra
inee
; eva
luat
ion
of
expo
rters
MoC
UMFC
CI,
MPB
SMA
15,0
00

97BIBLIOGRAPHY
BIBLIOGRAPHY
Agriculture and Agri-Food Canada ( 2012 ). Consumer trends : cooking oils in China. Market Indicator Report, October. Ottawa : Government of Canada. Available from www.ats-sea.agr.gc.ca / asi / pdf / 6260-eng.pdf.
Agriculture and Agri-Food Canada ( 2012 ). Consumer trends : cooking oils in Japan. Market Indicator Report, May. Ottawa : Government of Canada. Available from www.ats-sea.agr.gc.ca / asi / pdf / 6156-eng.pdf.
Agriculture and Agri-Food Canada ( 2011 ). Cooking oils in Taiwan. Market Indicator Report, June. Ottawa : Gov-ernment of Canada. Available from www.ats-sea.agr.gc.ca / asi / pdf / 5819-eng.pdf.
Agriculture and Agri-Food Canada ( 2009 ).Consum-er Trends – Pulses in India. Market Indicator Report December 2009. Ottawa : Government of Canada. Available from www.gov.mb.ca / agriculture / statis-tics / agri-food / india_pulses_en.pdf.
Agricultural Marketing Resource Centre( 2011 ). Sesame profile. Available from : www.agmrc.org / commodi-ties__products / grains__oilseeds / sesame_profile.cfm.
Alliance Grain Traders Inc. ( 2013 ). Management’s Dis-cussion and Analysis for the Year Ended December 31, 2012. Available from www.alliancegrain.com / down-load / 230.
Anindita Dey( 2013 ). Agri ministry proposes import duty on pulses. Business Standard, 26 October. Available from www.business-standard.com / arti-cle / markets / agri-ministry-proposes-import-duty-on-pulses-113102600363_1.html.
Asian Development Bank ( 10 December 2013 ). Project Data Sheet, Off-Grid Renewable Energy Demonstra-tion Project Myanmar.
Clancey, B. ( 2009 ). World Pulse Outlook : Report to The Saskatchewan Pulse Growers. Canada : Stat Pub-lishing. Available from http : / / archive.saskpulse.
com / media / pdfs / 091005_Final_Brian_Clancey_ World_Pulse_Outlook.pdf.
Clifford Chance ( July 2013 ). Myanmar Update : New York Convention Enters Into Force. Available from www.cliffordchance.com / publicationviews / publica-tions / 2013 / 07 / myanmar_update_newyorkconventio-nentersint.html.
Dapice, D. ( 2012 ). Electricity in Myanmar : The Missing Prerequisite for Development, p. 6. Ash Center for Dem-ocratic Governance and Innovation at the John F. Ken-nedy School of Government, Harvard University.
Dean, L. L., Davis, J. P., & Sanders, T. H. ( 2011 ). Ground-nut ( Peanut ) Oil. In Vegetable Oils in Food Technology : Composition, Properties and Uses, Gunstone, F.D. ed. Oxford : John Wiley & Sons.E-book.
Department of Labour ( 1990 ). 1990 Labour Force Survey.
Duke, J.A. ( 1983 ). Handbook of Energy Crops ( unpub-lished ). Available from www.hort.purdue.edu / new-crop / duke _energy / Guizotia_abyssinica.html.
East Asia Summit / Energy Cooperation Task Force Bio-fuel Database in East Asia ( 2013 ). Diversity of Poten-tial Biomass in Myanmar. Available from http : / / www.asiabiomass.jp / biofuelDB / myanmar / contents004.htm.Accessed 16 December 2013.
Embassy of India, Abu Dhabi, UAE ( 2013 ). UAE Indian Community. Available from : http : / / uaeindians.org / pro-file.aspx.
European Commission ( 2014 ). Development and Coop-eration – Europeaid : Myanmar / Burma. Available from http : / / ec.europa.eu / europeaid / where / asia / country-cooperation / myanmar / myanmar_en.htm.
Export Finance Navigator ( 2013 ). Documentary credit. Available from www.exportfinance.gov.au / Pages / Doc-umentarycredit.aspx#content.

98 THE REPUBLIC OF THE UNION OF MYANMAR NATIONAL EXPORT STRATEGY BEANS, PULSES AND OILSEEDS SECTOR STRATEGY 2015-2019
FAO ( 2013 ). Country Profile Myanmar. Available from http : / / coin.fao.org / cms / world / myanmar / CountryIn-formation.html.
FAO ( 2009 ). An Analysis of the Myanmar Edible Oil Crops Sub-Sector.
FAO ( 2007 ). A Practical Manual for Producers and Export-ers from Asia : Regulations, Standards and Certification for Agricultural Exports.
FAO-MoAI ( n.d. ). Food Security through Strengthen-ing of Institutional Capacity for Seed Production. Available from http : / / coin.fao.org / coin-static / cms / media / 6 / 13244522724000 / food_security_seed_ production.pdf.
‘FAO ( 2005 ). Proceedings of the Asia regional workshop on the implementation, monitoring and observance of the international code of conduct on the distribution and use of pesticides : Myanmar Report.
FAO / WFP ( January 2009 ). Special Report : FAO / WFP Crop and Food Security Assessment Mission to Myanmar.
Feder, G., Willett, A. and Zijp, W. ( 1999 ). Agricultural Ex-tension –Generic Challenges and Some Ingredients for Solutions, p. 5. World Bank Policy Research Work-ing Papers.
GEF Trust Fund ( 2013 ). Project Identification Form : Sus-tainable cropland and forest management in priority agro-ecosystems of Myanmar.
Global Forum for Rural Advisory Services ( 2013 ). Worldwide extension study : Myanmar. Available from: www.g-fras.org / en / world-wide-extension-study / 94-world-wide-ex-tension-study / asia / south-eastern-asia / 313-myammar.html.
Green Net ( 2011 ). Myanmar organic agriculture. Available from www.greennet.or.th / en / article / 1168.
Htwe, Dr. Y.Y. ( n.d. ). FDA, Myanmar Department of Health. PowerPoint presentation available from: ftp : / / ftp.fao.org / docrep / fao / meeting / 008 / ad813e.pdf.
IDE-JETRO ( 2012 ). Myanmar economy viewed at night. Policy Review Series on Myanmar Economy, No. 05, August.
IFC Advisory Services in East Asia and the Pacific ( 2013 ).Microfinance in Myanmar Sector Assessment.
IFAD ( September 2013 ). Republic of the Union of Myan-mar IFAD Mission September 2013 Aide-Mémoire.
IFAD ( August, 2013 ). Fostering Agricultural Revitalization in Myanmar Project Design Mission.
ITC ( n.d. ) The Coffee Guide : Terminal handling charges ( THC ). Available from www.thecoffeeguide.org / cof-fee-guide / logistics-and-insurance / terminal-handling-charges-THC / .
Ivana Sekularac ( 2013 ). Palm oil labeling will slash EU consumption – Dutch agency. Reuters, 5 March. Avail-able from www.reuters.com / article / 2013 / 03 / 05 / pal-moil-labelling-idUSL6N0BWI7W20130305.
Jefferson Agricultural Institute. ( 2013 ). Sesame : a High-Value Oilseed. Available fromwww.jeffersoninstitute.org / pubs / sesame.shtml.
Jeremy Grant ( 2013 ). Myanmar : will Asia’s breadbasket rise again? Financial Times : Beyond BRICS Blog, 5 January. Available from http : / / blogs.ft.com / beyond-brics / 2013 / 01 / 25 / myanmar-will-asias-breadbasket-rise-again / .
Kamal-Eldin, A., & Appelqvist, L. ( 1995 ). The effects of extraction methods on sesame oil stability. Journal of the American Oil Chemists’ Society, August 1995, 72 ( 8 ),pp. 967-969.
Kyi, H., Mruthyunjaya, Khan, N.A., Liyanapathirana, R. and Bottema, J.W.T. ( 1997 ). Market prospects for pulses in South Asia : international and domestic trade. Working Paper 27.Bogor, Indonesia : The CGPRT Centre.
Livelihoods and Food Security Trust Fund ( LIFT ) ( 2013 ). Website. Available from http : / / lift-fund.org / .
Lwin, T., Myint, Z.H. and Mya, M. ( n.d. ). Plant Variety Pro-tection in Myanmar. PowerPoint presentation. Availa-ble from http : / / eapvp.org / report / items / docs / PVP %20in %20Myanmar.pdf.
Michigan State University ( MSU ) and the Myanmar Devel-opment Resource Institute’s Center for Economic and Social Development ( MDRI / CESD ) ( 2013 ). A Strategic Agricultural Sector and Food Security Diagnostic for Myanmar. USAID.
Morris, J.B. ( 2002 ). Food, Industrial, Nutraceutical, and Pharmaceutical Uses of Sesame Genetic Resources, pp. 153-156. In Trends in New Crops and New Uses, J. Janick and A. Whipkey, eds. ASHS Press, Alexan-dria, VA. Available from www.hort.purdue.edu / new-crop / ncnu02 / v5-153.html.
Myanmar Farmer Association ( n.d. ). Proposal for the in-vestment of establishing FARMER services centre. Available fromhttp : / / myanmarfarmer.org / ?q=node / 48.
99BIBLIOGRAPHY
Myanmar Legal Services Ltd ( 2013 ). Doing Business in Myanmar.
Myanmar Pulses, Beans and Sesame Seeds Mer-chants Association ( 2013 ). Website. Available from http : / / www.mpbsma.org / .
National Sunflower Association ( 2014 ). Sunflower oil. Available from www.sunflowernsa.com / oil / default.asp?contentID=145.
Office for National Statistics. ( 2009 ). Size of ethnic groups : ONS estimates, 2009. Available from www.ethnicity.ac.uk / population / size.html.
PricewaterhouseCoopers ( 2012 ). Myanmar Business Guide.
Republic of the Union of Myanmar ( 2 November 2012 ). The Foreign Investment Law ( Law No. 21 / 2012 ). Availa-ble from http : / / export.gov / thailand / static / Foreign %20Investment %20Law_Latest_eg_th_ 055982.pdf.
Republic of the Union of Myanmar Ministry of Hotels and Tourism ( June 2013 ). Myanmar : Tourism Master Plan 2013–2020. Final Draft Report.
Republic of the Union of Myanmar State Law and Order Restoration Committee ( 3 March 1997 ). The National Food Law ( Law No. 5 / 97 ).
Republic of the Union of Myanmar State Law and Order Restoration Committee ( June, 1993 ). The Plant Pest Quarantine Law ( Law No. 8 / 1993 ).
Republic of the Union of Myanmar State Peace and De-velopment Committee ( October, 2002 ). The Fertilizer Law ( Law No. 7 / 2002 ).
San YaminAung ( 2013 ). Burma’s substandard peanut oils put to the test. The Ayeyarwady, 4 November. Available from www.irrawaddy.org / health / burmas-substandard-peanut-oils-put-test.html.
Sean Pratt ( 2013 ). Rain boosts India’s pulse supply out-look. The Western Producer, 23 July. Available from www.producer.com / 2013 / 07 / rain-boosts-indias-pulse-supply-outlook / .
Simon, J.E., Chadwick, A.F. and Craker, L.E. ( 1984 ).Herbs : An Indexed Bibliography. 1971-1980. The Sci-entific Literature on Selected Herbs, and Aromatic and Medicinal Plants of the Temperate Zone. Archon Books, Hamden, CT. Available from www.hort.purdue.edu / newcrop / med-aro / factsheets / MUSTARD.html.
Stads, G., and Kam, P.S. ( 2007 ). Myanmar : Agricultural Science and Technology Indicators. ASTI Country Brief No. 38, June.
Hein, T. ( 2012 ). Prospects for agriculture and fertilizer mar-ket in Myanmar. PowerPoint presentation at IFA Cross-roads Asia-Pacific 2012, Manila, 29–31 October.
Thura Swiss ( August 2013 ). Myanmar’s Beans and Pulses Trade : Risks and Prospects.
Tiwari, B. K., Gowen, A. and McKenna, B., eds ( 2011 ). Pulse Foods : Processing, Quality and Nutraceutical Applications. London : Elsevier. E-book.
U Kyaw Myint ( 2012 ). Sesame, the ideal crop for up-per Myanmar. Myanmar Times, 10 December. Available from www.mmtimes.com / index.php / busi-ness / 3509-sesame-the-ideal-crop-for-upper-myan-mar.html?limitstart=0.
United Nations Development Programme, Asian Develop-ment Bank&Ministry of Cooperatives ( 1984 ). Oilseeds Production and Processing Project. Feasibility Report. Volume I : Main Report. UGL Consultants Ltd.
USDA Foreign Agricultural Service ( 2013 ). Union of Bur-ma beans and pulses monthly report November 2012. Global Agricultural Information Network Report No. 1049, 15 January. USDA Foreign Agricultural Service. Available from http : / / gain.fas.usda.gov / Recent %20GAIN %20Publications / Beans %20and %20Pulses %20Monthly %20Report %20November %202012_Ran-goon_Burma %20- %20Union %20of_1-15-2013.pdf.
Vietmaz ( 2012 ).Vietnam to prevent unfair surcharges im-posed by foreign shipping lines, October 23. Available from www.vietmaz.com / 2012 / 10 / vietnam-to-prevent-unfair-surcharges-imposed-by-foreign-shipping-lines / .
World Bank ( 2013 ). Doing Business 2014.
World Bank ( 2013 ). Doing Business in Myanmar : Enforc-ing Contracts. Available from www.doingbusiness.org / data / explore economies / myanmar#enforcing-contracts.
World Bank DataBank ( 2012 ).Available from http : / / data-bank.worldbank.org / data / home.aspx.
Xinhua ( 2013 ). Myanmar sees encouraging foreign engage-ment in agricultural sector, 4 October. Available from http : / / news.xinhuanet.com / english / business / 2013-10 / 04 / c_132771836.htm.

100 THE REPUBLIC OF THE UNION OF MYANMAR NATIONAL EXPORT STRATEGY BEANS, PULSES AND OILSEEDS SECTOR STRATEGY 2015-2019
APPENDIX 1: SECTOR STRATEGY TEAM
No Name Designation Organization Contact
1 Daw Cho Cho Win Deputy Director General
Directorate of Investment and Company Administration, MNPED
2 U Than AungKyaw Director Ministry of Commerce thanaungkyaw61@ gmail.com
3 U Win Myint Director Ministry of Commerce [email protected]
4 U Kyaw Thu Deputy Director Ministry of Commerce [email protected]
5 U Myo Thu Deputy Director Ministry of Commerce [email protected]
6 Daw Hnin Sandar Deputy Director Ministry of Commerce hninsandar05@ gmail.com
7 U Kyaw Zarni Win Deputy Director Directorate of Investment and Company Administration
Daw Than Than Nu Staff Officer Ministry of Commerce [email protected]
8 DawKhin Mar Mar Nwe Deputy Director Ministry of Agriculture and Irrigation
kmmnwe1959@ gmail.com
9 Daw Aye Aye Win Asst. Director Ministry of Commerce [email protected]
10 Dr. San San Yi Assistant Director Ministry of Agriculture and Irrigation
dr.yi1964@ gmail.com
11 U Zaw Win Assistant Director Ministry of Agriculture and Irrigation
12 Daw Than Than Nu Staff Officer Ministry of Commerce thanthannu9@ gmail.com
13 U Soe Win Maung Coordinator MPBSMA [email protected]
14 U Sai Ba Nyan Vice Chairman MPBSMA [email protected]
15 U Tin Myint Vice Chairman MPBSMA [email protected]
16 U Soe Paing Joint Secretary MPBSMA [email protected]
17 U Tin Htun CEC Member MPBSMA [email protected]
18 Dr. Min Zaw Vice President (3) Yangon,Region-CCI [email protected]
19 Dr. Myo Lwin Vice President (4) Yangon,Region-CCI [email protected]
20 U Aung Thein Vice President (1) Yangon,Region-CCI [email protected]
21 U Soe Mya Auditor Yangon,Region-CCI diamondcrown.ygn@ gmail.com
22 U Van Lian Cung Lawyer HRMR [email protected]

101APPENDIX 1: SECTOR STRATEGY TEAM
No Name Designation Organization Contact
23 U Myint Kyu Auditor(1) MPBSMA [email protected]
24 Dr.Aung Kyaw Nyunt EC Yangon,Region-CCI [email protected]
25 Daw Su Win Myat Assistant General Manager
Myanmar Citzens Bank [email protected]
26 U Tin Maung Soe CEC Member Yangon, Region-CCI [email protected]
27 Daw Khin Moe Myint Observer TTI [email protected]
28 Daw San San Win Assistant General Manager
Myanmar Inspection and Testing Service
29 U Zaw Min Htike Director Kanlynn Intl Trading Co, Ltd [email protected]
30 Dr. MyatSoe Information Manager
MPBSMA [email protected]
31 Dr. Myint Oo Joint Secretary(3) MPBSMA [email protected]
32 U San Thein CEC Member Yangon, Region-CCI [email protected]
33 Daw Hla Hla Yee Secretary-1 MIFFA [email protected]
34 Dr. Kyaw Win Joint Secretary Yangon, Region-CCI Brightlight.oo.ltd@gmail. com
35 U Hla Win Advisor MFF [email protected]
36 U Thint Swe CEO MFF [email protected]


Myanmar Ministry of CommerceStreet address: 54-56, rue de Montbrillant 1202 Geneva, SwitzerlandPostal address: Palais des Nations 1211 Geneva 10, SwitzerlandTelephone: +41-22 730 0111Fax: +41-22 733 4439E-mail: [email protected]: www.intracen.org
In collaboration with :
With the financial support of :
Postal address: Office No.3, Zeya Htani Road Nay Pyi Taw
Phone : +95 67 408495 / +95 67 408266Fax : +95 67 408256E-mail : [email protected]