Embed Size (px)
Citation preview

Table of ContentsTable of ContentsTable of ContentsTable of Contents
PROSPECTUS SUPPLEMENT TO PROSPECTUS DATED DECEMBER 23, 2009 Filed pursuant to Rule 424(b)(3)Registration No. 333-163671
Republic of the Philippines Invites
the holders of the bonds (the “Group A Bonds”) specified below to submit offers to exchange Group A Bonds for newly issued U.S. dollar-denominated Global Bonds due 2021 (the “New 2021 Bonds”) or reopened 6.375%
Global Bonds due 2034 (the “Reopened 2034 Bonds”)
and the holders of the bonds (the “Group B Bonds”) specified below to submit offers to exchange Group B Bonds for Reopened 2034 Bonds
The Group A Bonds and Group B Bonds are collectively referred to as the “old bonds.” The New 2021 Bonds and the Reopened 2034 Bonds are collectively referred to as the “new global bonds.” This invitation, as contemplated by this prospectus supplement, is referred to as the “invitation.”
Offering for Cash of New 2021 Bonds, Reopened 2034 Bonds or both such bonds
The offering for cash is referred to in this prospectus supplement as the “cash offering” and, together with the invitation, as the “global bond offering.” The maximum principal amount of new global bonds that the Republic will issue pursuant to the global bond offering is $3,000,000,000. If the Republic issues any New 2021 Bonds pursuant to the global bond offering, the minimum principal amount to be issued will be $500,000,000.
The Reopened 2034 Bonds constitute a further issuance of, and on October 24, 2010 will be fungible with and consolidated and form a single series with, the $1,000,000,000 6.375% Global Bonds due 2034 issued by the Republic on October 23, 2009 and the $850,000,000 6.375% Global Bonds due 2034 issued by the Republic on January 13, 2010. Prior to October 24, 2010 the Reopened 2034 Bonds will bear different securities codes and trade separately from those previously issued 6.375% Global Bonds due 2034. The Reopened 2034 Bonds will accrue interest from the settlement date. A short first coupon, consisting of interest for the period from (and including) the settlement date to (but excluding) October 23, 2010, will be payable on the Reopened 2034 Bonds on October 23, 2010.
The new global bonds will be designated Collective Action Securities, and, as such, will contain provisions regarding certain aspects of default, acceleration, voting on amendments, modifications, changes, waivers and future issues of new global bonds that differ from those applicable to many of the Republic’s outstanding External Public Indebtedness. Under these provisions, which are described in the section entitled “Collective Action Securities” on page 113 of the accompanying prospectus dated December 23, 2009, the Republic may, among other things, amend the payment provisions of a series of new global bonds and certain other material terms with the consent of the holders of not less than 75% of the aggregate principal amount of the outstanding new global bonds of that series.
The offering of the new global bonds is conditional on the receipt of certain approvals of the Monetary Board of Bangko Sentral ng Pilipinas, the central bank of the Republic. The new global bonds are being offered globally for sale in the jurisdictions where it is lawful to make such offers and sales. Application has been made to admit the new global bonds to listing on the Official List of the Luxembourg Stock Exchange and to trading on the EuroMTF Market. The Republic cannot guarantee that the application to the Luxembourg Stock Exchange will be approved and settlement of the new global bonds is not conditioned on obtaining the listings. The new global bonds will be listed on the basis of a second prospectus supplement dated on or about September 29, 2010, as a supplement to the base prospectus dated December 23, 2009 and with the final pricing information for the new global bonds, which will be filed with the Luxembourg Stock Exchange and will be made available at the office of the Luxembourg paying and transfer agent.
NEITHER THE SECURITIES AND EXCHANGE COMMISSION NOR ANY OTHER REGULATORY BODY HAS APPROVED OR DISAPPROVED OF THESE SECURITIES OR DETERMINED IF THIS PROSPECTUS SUPPLEMENT OR THE ACCOMPANYING PROSPECTUS IS TRUTHFUL OR COMPLETE. ANY REPRESENTATION TO THE CONTRARY IS A CRIMINAL OFFENSE.
Joint dealer managers for the global bond offering
September 20, 2010
SeriesOutstanding
Principal Amount ISINReference
YieldFixed Spread
(bps)
8.375% Bonds due 2/15/2011 (“2011 Bonds”) $ 1,484,215,000 US718286AV96 4 Month USD LIBOR 59.000% Bonds due 2/15/2013 (“2013 Bonds”) $ 948,383,000 US718286AT41 USD Swap Rate* 258.250% Bonds due 1/15/2014 (“2014 Bonds”) $ 1,601,622,000 US718286AU14 USD Swap Rate* 708.875% Bonds due 3/17/2015 (“2015 Bonds”) $ 976,414,000 US718286AW79 USD Swap Rate* 708.000% Bonds due 1/15/2016 (“January 2016 Bonds”) $ 1,300,000,000 US718286BA41 USD Swap Rate* 708.750% Bonds due 10/7/2016 (“October 2016 Bonds”) $ 629,703,000 US718286AC16 /USY6972CAJ63 USD Swap Rate* 73
9.375% Bonds due 1/18/2017 (“2017 Bonds”) $ 822,381,000 US718286AQ02 USD Swap Rate* 90
(1) Restricted global bonds.
(2) Regulation S global bonds.
(3) Holders of this series of bonds may require the Republic of the Philippines to repurchase their bonds at par on January 18, 2012.
Series
Outstanding
Principal Amount ISIN
Reference
Yield
Relative Spread
(bps)
9.875% Bonds due 1/15/2019 (“January 2019 Bonds”) $ 962,468,000 US718286AK32 Reopening Yield of Reopened 2034 Bonds** -1658.375% Bonds due 6/17/2019 (“June 2019 Bonds”) $ 1,500,000,000 US718286BE62 Reopening Yield of Reopened 2034 Bonds** -1557.500% Bonds due 9/25/2024 (“September 2024 Bonds”) $ 774,204,000 US718286BC07 Reopening Yield of Reopened 2034 Bonds** -939.500% Bonds due 10/21/2024 (“October 2024 Bonds”) $ 480,406,000 US718286AL15 Reopening Yield of Reopened 2034 Bonds** -7310.625% Bonds due 3/16/2025 (“2025 Bonds”) $ 1,854,744,000 US718286AP29 Reopening Yield of Reopened 2034 Bonds** -589.500% Bonds due 2/2/2030 (“2030 Bonds”) $ 2,000,000,000 US718286AY36 Reopening Yield of Reopened 2034 Bonds** -187.750% Bonds due 1/14/2031 (“2031 Bonds”) $ 2,384,506,000 US718286BB24 Reopening Yield of Reopened 2034 Bonds** -16
(1) Payment of the principal amount of this series of bonds will be made in three equal installments on September 26, 2022, September 25, 2023 and September 25, 2024.
* Mid-market USD swap rates as displayed on the Bloomberg IRSB18 screen, subject to linear interpolation to the final maturity date of the bonds.
** The yield to final maturity of the Reopened 2034 Bonds on the settlement date, which shall be the sum of the reference yield for the Reopened 2034 Bonds, plus the reopening spread for the Reopened 2034 Bonds.
THE INVITATION AND WITHDRAWAL RIGHTS WILL COMMENCE TODAY, SEPTEMBER 20, 2010, AND WILL EXPIRE AT 5:00 P.M. (NEW YORK CITY TIME) ON SEPTEMBER 28, 2010 (SUCH DATE, AS IT MAY BE EXTENDED, THE “EXPIRATION DATE”), UNLESS EXTENDED OR EARLIER TERMINATED BY THE REPUBLIC IN ITS SOLE DISCRETION.
Citi HSBC UBS Investment Bank
(1) (2)
(3)
(1)
頁 1 / 247424(b)(3)
2014/03/12file:///C:/blp/data/CFd424b3.htm

Table of ContentsTable of ContentsTable of ContentsTable of Contents
[THIS PAGE INTENTIONALLY LEFT BLANK]
頁 2 / 247424(b)(3)
2014/03/12file:///C:/blp/data/CFd424b3.htm

Table of ContentsTable of ContentsTable of ContentsTable of Contents
TABLE OF CONTENTS
You should read this prospectus supplement along with the attached prospectus that accompanies it. You should rely only on the information contained or incorporated by reference in this document and the accompanying prospectus. The republic has not authorized anyone to provide you with information that is different. This document may only be used where it is legal to sell these securities. The information in this prospectus supplement and the prospectus may only be accurate as of the date of this prospectus supplement or the prospectus, as applicable. Terms used herein but not otherwise defined shall have the meaning given to them in the prospectus that accompanies this prospectus supplement.
S-3
Prospectus Supplement
Introductory Statements S-4Certain Legal Restrictions S-5Summary Time Schedule and Procedures for the Global Bond Offering S-6Summary S-9The New Global Bonds S-20Use of Proceeds S-24Recent Developments S-25Terms of the Global Bond Offering S-39The Old Bonds S-53Description of the New Global Bonds S-55Global Clearance and Settlement S-59Taxation S-62Plan of Distribution S-67Jurisdictional Restrictions S-70Legal Matters S-74General Information S-74Annex A Hypothetical Terms S-76Annex B Non U.S. Holder Deemed Representations S-80Prospectus
Certain Defined Terms and Conventions iiiForward Looking Statements iiiData Dissemination ivUse of Proceeds ivProspectus Summary 1Republic of the Philippines 7Description of the Securities 101Collective Action Securities 113Taxation 117Plan of Distribution 125Validity of the Securities 126Authorized Representative in the United States 126Experts; Official Statements and Documents 126Further Information 126Debt Tables of the Republic of the Philippines T-1
頁 3 / 247424(b)(3)
2014/03/12file:///C:/blp/data/CFd424b3.htm

Table of ContentsTable of ContentsTable of ContentsTable of Contents
INTRODUCTORY STATEMENTS
The Republic accepts responsibility for the information provided by it that is contained in this prospectus supplement and the prospectus that accompanies it. To the best of the knowledge and belief of the Republic (which has taken all reasonable care to ensure that such is the case), the information contained in this prospectus supplement and the accompanying prospectus provided by the Republic is in accordance with the facts and does not omit anything likely to affect the import of such information.
The Republic is a foreign sovereign state. Consequently, it may be difficult for you to obtain or realize upon judgments of courts in the United States against the Republic. See “Description of the Securities—Description of the Debt Securities—Jurisdiction and Enforceability” in the accompanying prospectus.
Unless otherwise indicated, all references in this prospectus supplement to “Philippine pesos,” “pesos,” “Ps.” or “(Peso)” are to the lawful national currency of the Philippines, those to “USD,” “dollars,” “US dollars” or “$” are to the lawful currency of the United States of America and
those to “EUR,” “euro” and “€” refer to the currency introduced at the start of the third stage of the European Economic and Monetary Union
pursuant to the Treaty establishing the European Community, as amended.
All references in this prospectus supplement to (a) the “Republic” or the “Philippines” are to the Republic of the Philippines, (b) the “Government” are to the national government of the Philippines, (c) the “administration” are to the current administration of President Benigno S.
Aquino III and (d) “Bangko Sentral” are to Bangko Sentral ng Pilipinas, the central bank of the Philippines.
Investors should note that:
None of the Republic, the dealer managers or the information and exchange agent has expressed any opinion as to whether the terms of the new global bond offering are fair. None of the Republic, the dealer managers or the information and exchange agent makes any recommendation that you offer to exchange old bonds or purchase new global bonds pursuant to the global bond offering or refrain from doing so, and no one has been authorized by the Republic, the dealer managers or the information and exchange agent to make any such recommendation. You must make your own decision as to whether to offer to exchange old bonds or purchase new global bonds pursuant to the global bond offering or refrain from doing so, and, if so, the principal amount of old bonds or new global bonds to offer to exchange or purchase.
You are reminded that documents (including, but not limited to, ATOP instructions and bond instructions (each as defined herein)) transmitted through electronic means may be altered or changed during the process of electronic transmission. Consequently, none of the Republic, the dealer managers or the information and exchange agent accepts any liability or responsibility whatsoever in respect of any difference between the documents in original form and the documents transmitted in electronic format.
S-4
• The new global bonds will contain provisions regarding default, acceleration, voting on amendments, modifications, changes, waivers and future issues of new global bonds that differ from those currently applicable to many of the Republic’s outstanding External Public Indebtedness. Under these provisions, which are commonly referred to as “collective action clauses,” the Republic may, among other things, amend certain key terms of a series of new global bonds, including the maturity date, interest rate and other payment terms, with the consent of the holders of not less than 75% of the aggregate principal amount of the outstanding new global bonds of that series. Those provisions are described in the section entitled “Collective Action Securities” on page 113 of the accompanying prospectus.
• The Republic will cancel any old bonds that it may acquire pursuant to the invitation. Accordingly, the exchange of old bonds of any series will reduce the aggregate principal amount of that series of old bonds that otherwise might trade in the public market, which could adversely affect the liquidity and market value of the remaining old bonds that the Republic does not acquire pursuant to the invitation.
頁 4 / 247424(b)(3)
2014/03/12file:///C:/blp/data/CFd424b3.htm

Table of ContentsTable of ContentsTable of ContentsTable of Contents
CERTAIN LEGAL RESTRICTIONS
The distribution of materials relating to the global bond offering, including this prospectus supplement and the accompanying prospectus, and the transactions contemplated by the global bond offering may be restricted by law in certain jurisdictions. If materials relating to the global bond offering come into your possession, you are required by the Republic to inform yourself of and to observe all of these restrictions. The materials relating to the global bond offering, including this prospectus supplement and the accompanying prospectus, do not constitute, and may not be used in connection with, an offer or solicitation in any place where offers or solicitations relating to the global bond offering are not permitted. If a jurisdiction requires that the global bond offering be made by a licensed broker or dealer and any of the dealer managers or any affiliate of any dealer manager is a licensed broker or dealer in such jurisdiction, the global bond offering shall be deemed to be made by such dealer manager or such affiliate on behalf of the Republic in such jurisdiction. For a description of some restrictions on the offering and sale of the new global bonds and the distribution of this prospectus supplement and the accompanying prospectus, see the section below entitled “Jurisdictional Restrictions.”
No solicitations in connection with the global bond offering will be made in Italy or Japan by any party, including the dealer managers. No copies of this prospectus supplement, the accompanying prospectus or any other documents relating to the new global bonds or the global bond offering will be distributed in Italy or Japan. No new global bonds will be offered, sold or delivered in Italy or Japan.
This prospectus supplement has been prepared on the basis that all offers of the new global bonds will be made pursuant to an exemption under the Prospectus Directive, as implemented in member states of the European Economic Area, from the requirement to produce a prospectus for offers of securities.
S-5
頁 5 / 247424(b)(3)
2014/03/12file:///C:/blp/data/CFd424b3.htm

Table of ContentsTable of ContentsTable of ContentsTable of Contents
S-6
SUMMARY TIME SCHEDULE AND PROCEDURES FOR THE GLOBAL BOND OFFERING
The following summarizes the anticipated time schedule for the global bond offering assuming, among other things, that the expiration date or time is not extended. This summary is qualified in its entirety by, and should be read in conjunction with, the more detailed information appearing elsewhere in this prospectus supplement. All references are to New York City time unless otherwise noted.
Offers may be submitted by holders of old bonds at any time following the announcement of the terms of the global bond offering from September 20 (Manila time) through 5:00 P.M., September 28, 2010 (which we refer to in this prospectus supplement as the “submission period”).
The Republic determines and announces, via press release to selected news services, the indicative new issue spread for the New 2021 Bonds and the indicative reopening spread for the Reopened 2034 Bonds, which may be revised on the announcement date, as defined below.
This information will also be available from the dealer managers and the information and exchange agent and via the website www.bondcom.com/rop.
The submission period ends and the invitation expires, unless the Republic extends it or terminates it earlier in its sole discretion. We refer to this date, as it may be extended, as the “expiration date.” After expiration, you may no longer submit, modify or withdraw your exchange offer.
September 20, 2010 (Manila time) Commencement Date
Announcement of the terms of the global bond offering, including the indicative ranges of the new issue spread for the New 2021 Bonds and the reopening spread for the Reopened 2034 Bonds, the fixed old bond spread for each series of Group A Bonds, the relative old bond spread for each series of Group B Bonds, and the indicative amount of the special cash payment for the 2030 Bonds and the 2031 Bonds. Commencement of the invitation during the morning (Manila time).
September 20 (Manila time) through September 28, 2010
Submission Period
The invitation is open during this period.
At or around 6:00 P.M., September 27, 2010 Determination and Announcement of Indicative New Issue Spread and Reopening Spread
5:00 P.M., September 28, 2010 Expiration Date
頁 6 / 247424(b)(3)
2014/03/12file:///C:/blp/data/CFd424b3.htm

Table of ContentsTable of ContentsTable of ContentsTable of Contents
S-7
The Republic will, in its sole discretion:
As soon as practical after these determinations and selections, and selections are made, which is expected to occur at 11:00 A.M., New York City time, on the announcement date, the Republic will announce them by press release to the news services. If pricing is not completed by 3:00 P.M., New York City time on the announcement date, the Republic will announce an alternative target pricing time.
As soon as practicable after the pricing, the Republic announces by press release to the news services:
At or around 11:00 A.M., September 29, 2010, or as soon as practicable thereafter
Pricing
• determine the reference yield for each series of old bonds and each series of new global bonds;
• determine the new issue spread for the New 2021 Bonds and the reopening spread for the Reopened 2034 Bonds;
• select the New 2021 Bond coupon; and
• determine the new global bond issue price for each series of new global bonds.
At or around 1:00 P.M., September 29, 2010, or as soon as practicable thereafter
Announcement Date
• the reference yield for each series of old bonds and each series of new global bonds;
• the new issue spread and new issue yield for the New 2021 Bonds;
• the reopening spread and reopening yield for the Reopened 2034 Bonds
• the New 2021 Bond coupon;
• the new global bond issue price for each series of the new global bonds;
• the old bond price, old bond exchange value and the exchange ratio for each series of old bonds accepted for exchange pursuant to the invitation;
• the amount of the special cash payment for each of the 2030 Bonds and the 2031 Bonds;
• the preliminary aggregate principal amount of old bonds of each series accepted for exchange in the invitation (which could be zero);
頁 7 / 247424(b)(3)
2014/03/12file:///C:/blp/data/CFd424b3.htm

Table of ContentsTable of ContentsTable of ContentsTable of Contents
S-8
Trading in the new global bonds on a when-and-if issued basis will commence following these announcements. We refer to the date on which these announcements are made as the “announcement date.”
Settlement of the global bond offering. Delivery of new global bonds and any cash payments against good delivery of old bonds or cash payment, as applicable. We refer to the date on which the global bond offering settles as the “settlement date.”
• the preliminary aggregate principal amount of new global bonds to be issued in exchange for each series of old bonds accepted for exchange (which could be zero);
• the preliminary aggregate principal amount of old bonds of each series that will remain outstanding following the invitation;
• information concerning any applicable proration; and
• the aggregate principal amount of each series of new global bonds to be issued pursuant to the cash offering (which could be zero).
October 6, 2010, or as soon as practicable thereafter Settlement Date
頁 8 / 247424(b)(3)
2014/03/12file:///C:/blp/data/CFd424b3.htm

Table of ContentsTable of ContentsTable of ContentsTable of Contents
S-9
SUMMARY
This summary highlights information contained elsewhere in this prospectus supplement and the accompanying prospectus. It may not contain all the information that you should consider before offering old bonds in exchange for new global bonds or investing in the new global bonds. You should read the entire prospectus supplement and the accompanying prospectus carefully.
Global Bond Offering
Offers to exchange old bonds for new global bonds pursuant to the invitation are sometimes referred to as “exchange offers.”
In addition, the Republic may offer new global bonds for cash in an underwritten offering with Citigroup Global Markets Inc., The Hongkong and Shanghai Banking Corporation Limited and UBS AG acting as joint lead managers. This offering is referred to as the “cash offering” and, together with the invitation, as the “global bond offering.” The initial public offering price per $1,000 principal amount of each series of new global bonds to be sold pursuant to the cash offering will equal the new global bond issue price (as described below) for that series of new global bonds.
The maximum principal amount of new global bonds to be issued pursuant to the global bond offering is $3,000,000,000.
Citigroup Global Markets Inc., The Hongkong and Shanghai Banking Corporation Limited and UBS AG are referred to collectively in this prospectus supplement as the “dealer managers.”
General The Republic is inviting holders of old bonds to submit offers to exchange old bonds for new global bonds on the terms and subject to the conditions described in this prospectus supplement and the accompanying prospectus (which transaction is referred to in this prospectus supplement as the “invitation”). Specifically, the Republic is inviting holders of its Group A Bonds to submit offers to exchange each series of Group A Bonds for New 2021 Bonds or Reopened 2034 Bonds, and holders of its Group B Bonds to submit offers to exchange each series of Group B Bonds for Reopened 2034 Bonds.
Purpose; Use of Proceeds The global bond offering is part of a broader program of the Republic to manage its external liabilities.
The Republic intends to use the net cash proceeds from the sale of new global bonds pursuant to the cash offering, if any, for expenses incurred in the invitation, including cash payable in lieu of new global bonds as a result of rounding, and any cash payments to be made in connection with payments of accrued interest on old bonds accepted in the invitation and the special cash payment for the 2030 Bonds and the 2031 bonds accepted in the invitation. The Republic may also use any such proceeds for general purposes, including budgetary support.
頁 9 / 247424(b)(3)
2014/03/12file:///C:/blp/data/CFd424b3.htm

Table of ContentsTable of ContentsTable of ContentsTable of Contents
S-10
Minimum Issue Size of New 2021 Bonds Pursuant to the global bond offering, the Republic will issue at least $500,000,000 aggregate principal amount of New 2021 Bonds, if any New 2021 Bonds are issued. There is no minimum issue size of the Reopened 2034 Bonds, because on October 24, 2010 they will become fungible with the Republic’s outstanding 6.375% Global Bonds due 2034. The Republic reserves the right, in its sole discretion, not to issue any new global bonds of either or both series pursuant to the invitation or the cash offering.
Invitation The invitation commences today, September 20, 2010, and expires at 5:00 P.M., New York City time, on September 28, 2010, unless the Republic, in its sole discretion, extends it or terminates it earlier. We refer to the date on which the invitation expires as the “expiration date.”
While the invitation is open, exchange offers may be made only by following the procedures for the submission of exchange offers described below.
Old Bonds The outstanding principal amount of each series of old bonds as of the date hereof is:
SeriesOutstanding
Principal Amount
Group A Bonds2011 Bonds $ 1,484,215,0002013 Bonds $ 948,383,0002014 Bonds $ 1,601,622,0002015 Bonds $ 976,414,000January 2016 Bonds $ 1,300,000,000October 2016 Bonds $ 629,703,0002017 Bonds $ 822,381,000
Group B BondsJanuary 2019 Bonds $ 962,468,000June 2019 Bonds $ 1,500,000,000September 2024 Bonds $ 774,204,000October 2024 Bonds $ 480,406,0002025 Bonds $ 1,854,744,0002030 Bonds $ 2,000,000,0002031 Bonds $ 2,384,506,000
(1) Holders of this series of bonds may require the Republic to repurchase their bonds at par on January 18, 2012.
(2) Payment of the principal amount of this series of bonds will be made in three equal installments on September 26, 2022, September 25, 2023 and September 25, 2024.
(1)
(2)
頁 10 / 247424(b)(3)
2014/03/12file:///C:/blp/data/CFd424b3.htm

Table of ContentsTable of ContentsTable of ContentsTable of Contents
S-11
For your convenience, the ISIN numbers for the old bonds of each series are specified on the cover of this prospectus supplement, and those numbers and certain other information about the old bonds are provided in the section entitled “The Old Bonds.”
Old bonds may be offered for exchange only in an authorized denomination of the series of old bonds offered.
New Global Bonds and Cash to be Received Pursuant to Exchange Offers
If you hold old bonds and validly offer to exchange them pursuant to the invitation and the Republic accepts your offer, you will receive, in exchange for each $1,000 original principal amount of each series of old bonds exchanged, the following:
• new global bonds of the applicable series having a principal amount (rounded downward to the nearest integral multiple of $1,000) equal to the product of (1) $1,000 and (2) the applicable exchange ratio (as defined below), and
• an amount in cash in US dollars in respect of rounding, as further described under “Terms of the Global Bond Offering—Consideration to be Received in Exchange Offers Pursuant to the Invitation,”
provided that new global bonds will be issued only in minimum denominations of $100,000 and in integral multiples of $1,000 in excess thereof. See “Terms of the Global Bond Offering—Offers Pursuant to the Invitation—Minimum Offer Amount” below.
The “exchange ratio” for each series of old bonds will be equal to the quotient (rounded to four decimal places, with 0.00005 rounded to 0.0001) of:
• the applicable old bond exchange value for such series, determined as described below, divided by
• the applicable new global bond issue price, determined as described below.
If you are exchanging 2030 Bonds or 2031 Bonds, in addition to new global bonds, you will also receive a “special cash payment” for such series of old bonds, which is expected to be an amount in cash in US dollars for each $1,000 principal amount of old bonds accepted for exchange as specified below:
SeriesSpecial Cash
Payment
2030 Bonds $ 207.002031 Bonds $ 167.00
The purpose of the special cash payment is to ensure that all Reopened 2034 Bonds to be issued in the global bond offering will be
頁 11 / 247424(b)(3)
2014/03/12file:///C:/blp/data/CFd424b3.htm

Table of ContentsTable of ContentsTable of ContentsTable of Contents
S-12
The Reopened 2034 Bonds will become fungible with the Republic’s currently outstanding 6.375% Global Bonds due 2034 on October 24, 2010. See “The New Global Bonds—Terms of the Reopened 2034 Bonds—Fungibility.”
On the settlement date, you will also receive a cash payment in respect of any accrued and unpaid interest on your old bonds accepted for exchange during the period from and including the last interest payment date with respect to such old bonds up to but not including the settlement date.
The “old bond price” for each series of old bonds will be a price per $1,000 principal amount of such old bonds (rounded to the nearest cent, with $0.005 being rounded to a full cent) intended to result in a yield to the final maturity (or, in the case of the September 2024 Bonds, a yield to September 25, 2023) of that series of old bonds on the settlement date equal to the sum of:
fungible for U.S. tax purposes. The Republic reserves the right to modify the special cash payment if necessary prior to 6:00 P.M., New York City time, on the business day immediately before the expiration date, in order to ensure that all the Reopened 2034 Bonds to be issued will be fungible for U.S. tax purposes, and the Republic may chose not to make any special cash payment if it is not necessary to ensure fungibility. The special cash payment for each of the 2030 Bonds and the 2031 Bonds will be deducted from the old bond exchange value for the 2030 Bonds and the 2031 Bonds, as applicable, when calculating the exchange ratio for those bonds, as described below.
Determination of Old Bond Exchange Values and Old Bond Prices
The “old bond exchange value” for each series of old bonds will be the difference of:
• the old bond price (as defined below) for that series, minus
• in the case of an exchange of the 2030 Bonds or the 2031 Bonds, the special cash payment.
• the reference yield for such series of old bonds, plus
• the old bond spread for such series of old bonds (as defined below).
The “reference yield” for each series of Group A Bonds other than the 2011 Bonds, will be equal to the rate, rounded to three decimal places (with 0.0005% rounded to 0.001%), determined by the dealer managers through linear interpolation of the mid-market US dollar interest rate swap rates for the maturities occurring immediately before and immediately after the final maturity date of that series of old bonds as displayed on the Bloomberg IRSB 18 screen at the pricing time on the announcement date. For purposes of linear interpolation, the time to maturity of each series of old bonds will be
頁 12 / 247424(b)(3)
2014/03/12file:///C:/blp/data/CFd424b3.htm

Table of ContentsTable of ContentsTable of ContentsTable of Contents
S-13
The Republic reserves the right to modify the fixed old bond spread for each series of Group A Bonds and the relative old bond spread for each series of Group B Bonds prior to 6:00 P.M., New York City time, on the business day immediately before the expiration date.
determined by calculating the number of days from the expected settlement date to the maturity date of the series of bonds, using the 30/360 day count method in accordance with market practice, and dividing the resulting number of days by 360.
The calculation of the reference yield for the 2017 Bonds will be based on the final maturity date for those bonds of January 18, 2017, and not January 18, 2012, the date on which holders of those bonds may require the Republic to repurchase those bonds at par.
The “reference yield” for the 2011 Bonds will be equal to the 4-month US dollar LIBOR rate displayed on the Bloomberg BBAM1 screen (without rounding) at the pricing time on the announcement date, multiplied by 365 and divided by 360.
The “reference yield” for each series of Group B Bonds will be equal to the yield to final maturity of the Reopened 2034 Bonds on the settlement date (the “Reopening Yield of Reopened 2034 Bonds”), which shall be the sum of the reference yield for the Reopened 2034 Bonds, plus the reopening spread for the Reopened 2034 Bonds.
Old Bond Spreads The “old bond spread” for each series of Group A Bonds is specified below:
Series Fixed Spread
(in basis points)
2011 Bonds 52013 Bonds 252014 Bonds 702015 Bonds 70January 2016 Bonds 70October 2016 Bonds 732017 Bonds 90
The “old bond spread” for each series of Group B Bonds is equal to the relative spread for the relevant series of Group B Bonds as specified below:
Series Relative Spread
(in basis points)
January 2019 Bonds -165June 2019 Bonds -155September 2024 Bonds -93October 2024 Bonds -732025 Bonds -582030 Bonds -182031 Bonds -16
頁 13 / 247424(b)(3)
2014/03/12file:///C:/blp/data/CFd424b3.htm

Table of ContentsTable of ContentsTable of ContentsTable of Contents
S-14
The “reference yield” for the New 2021 Bonds will be the rate, rounded to three decimal places (with 0.0005% rounded to 0.001%), determined by the dealer managers through linear interpolation of the mid-market US dollar interest rate swap rates for the maturities occurring immediately before and immediately after January 15, 2021, as displayed on the Bloomberg IRSB 18 screen at the pricing time on the announcement date.
The “reference yield” for the Reopened 2034 Bonds will be the yield to maturity, rounded to three decimal places (with 0.0005% rounded to 0.001%), calculated by the dealer managers in accordance with standard market practice, corresponding to the bid-side price of the U.S. Treasury 4.375% Bond due May 15, 2040, as displayed on the Bloomberg FIT1 screen at the pricing time on the announcement date.
New Global Bond Issue Price The “new global bond issue price” for each series of new global bonds will be a price per $1,000 principal amount of that series of new global bonds (rounded to the nearest cent, with $0.005 being rounded to a full cent) intended to result in a yield to final maturity of that series of new global bonds on the settlement date equal to the sum of:
• the reference yield (as defined below) for that series of new global bonds, plus
• in the case of New 2021 Bonds, the new issue spread (as defined below) for such bonds, and in the case of Reopened 2034 Bonds, the reopening spread (as defined below) for such bonds.
New Issue Spread/ Reopening Spread The indicative new issue spread (as defined below) and new issue spread for the New 2021 Bonds, and the indicative reopening spread (as defined below) and reopening spread for the Reopened 2034 Bonds are expected to each be within the ranges specified below:
Series Spread Range
(in basis points)
New 2021 Bonds (new issue spread) 149 – 164Reopened 2034 Bonds (reopening spread) 148 – 163
Determination and Announcement of the Indicative New Issue Spread and Indicative Reopening Spread
At or around 6:00 P.M., New York City time, on the business day before the expiration date, or as soon as practicable thereafter, the Republic will determine in its sole discretion, and announce via press release to selected news services, the “indicative new issue spread” for the New 2021 Bonds and the “indicative reopening spread” for the Reopened 2034 Bonds, each of which is expected to be within the ranges specified above.
頁 14 / 247424(b)(3)
2014/03/12file:///C:/blp/data/CFd424b3.htm

Table of ContentsTable of ContentsTable of ContentsTable of Contents
S-15
The spread for a series of new global bonds may be adjusted upward to permit the price for that series determined pursuant to the invitation to be equal to that price determined in connection with the cash offer, provided, however, that the new issue spread for the New 2021 Bonds announced on the announcement date may not be less than the indicative new issue spread and the reopening spread for the Reopened 2034 Bonds announced on the announcement date may not be less than the indicative reopening spread.
As soon as practical after these determinations and selections are made, which is expected to occur at 11:00 A.M., New York City time, on the announcement date, the Republic will announce them by press release to the news services. If pricing is not completed by 3:00 P.M., New York City time on the announcement date, the Republic will announce an alternative target pricing time.
If the Republic decides to accept offers to exchange any series of old bonds for new global bonds, it will accept the lesser of:
New Global Bond Pricing and Selection of New 2021 Bond Coupon
At or around 11:00 A.M., New York City time, on the announcement date, the Republic will, in its sole discretion:
• determine the reference yield for each series of old bonds and each series of new global bonds;
• determine the “new issue spread” for the New 2021 Bonds and the “reopening spread” for the Reopened 2034 Bonds;
• select the New 2021 Bond coupon; and
• determine the new global bond issue price for each series of new global bonds.
Acceptance of Exchange Offers; Cash Offering The Republic, after reviewing the exchange offers made in response to the invitation, will determine in its sole discretion whether to accept any offers to exchange any series of old bonds for new global bonds. The Republic may decide not to accept any offers or may decide to accept offers to exchange one or more series of old bonds but not other series.
1. all valid offers for that series of old bonds; and
2. the amount of exchange offers corresponding to the total principal amount of such series of old bonds that the Republic has determined in its sole discretion to accept pursuant to the invitation. See “Terms of the Global Bond Offering—Acceptance of Offers; Proration.”
頁 15 / 247424(b)(3)
2014/03/12file:///C:/blp/data/CFd424b3.htm

Table of ContentsTable of ContentsTable of ContentsTable of Contents
S-16
The Republic will also determine, in its sole discretion, whether to issue and sell any new global bonds pursuant to the cash offering, and will determine the series and the aggregate principal amount of new global bonds to be so issued and sold.
Proration Acceptance of old bonds of any or all series may be subject to proration. See “Terms of the Global Bond Offering—Acceptance of Offers; Proration.”
Announcement of Results Approximately two hours after the Republic announces the new global bond pricing and New 2021 Bond coupon, which is expected to be approximately 1:00 P.M., New York City time on the announcement date, or as soon as practicable thereafter, the Republic will announce:
• the reference yield for each series of old bonds and each series of new global bonds;
• the new issue spread for the New 2021 Bonds and the reopening spread for the Reopened 2034 Bonds;
• the New 2021 Bond coupon;
• the new global bond issue price for each series of the new global bonds;
• the old bond price, old bond exchange value and the exchange ratio for each series of old bonds accepted for exchange pursuant to the invitation;
• the amount of the special cash payment for each of the 2030 Bonds and the 2031 Bonds;
• the preliminary aggregate principal amount of old bonds of each series accepted for exchange in the invitation (which could be zero);
• the preliminary aggregate principal amount of new global bonds to be issued in exchange for each series of old bonds accepted for exchange (which could be zero);
• the preliminary aggregate principal amount of old bonds of each series that will remain outstanding following the invitation;
• information concerning any applicable proration; and
• the aggregate principal amount of each series of new global bonds to be issued pursuant to the cash offering (which could be zero).
Minimum Offer Amount; Denominations Your exchange offer must be for at least US$100,000 in principal amount of each series of old bonds that you are submitting, except that if you are submitting 2011 Bonds in exchange for the Reopened 2034 Bonds, your exchange offer must be for at least US$120,000 in principal amount of 2011 Bonds, in all cases such amount the “minimum offer amount.” Holders will be unable to participate in the
頁 16 / 247424(b)(3)
2014/03/12file:///C:/blp/data/CFd424b3.htm

Table of ContentsTable of ContentsTable of ContentsTable of Contents
S-17
All questions regarding the validity, form and eligibility of any exchange offer will be determined by the Republic in its sole discretion, which determination will be final and binding. See “Terms of the Global Bond Offering—Irregularities.”
Old Bonds Held Directly Through DTC
If you desire to submit an offer to exchange your old bonds and your old bonds are held through The Depository Trust Company (“DTC”), you must arrange for a direct participant in DTC to submit your offer to DTC electronically through DTC’s Automated Tender Offer Program (“ATOP”) and follow the procedures for book-entry transfer set forth herein at or prior to 5:00 P.M., New York City time, on the expiration date. Only a direct participant in DTC may submit an offer through ATOP.
To validly offer old bonds through ATOP, a holder must, among other things, (i) indicate whether the holder is in the United States (as defined in Rule 902 under the U.S. Securities Act of 1933, as amended), (ii) indicate on a series-by-series basis the aggregate principal amount of old bonds it is tendering of each series, and (iii) if Group A Bonds are tendered, indicate on a series-by-series basis the particular series of new global bonds that it wishes to receive in exchange for each series of Group A Bonds tendered.
Your ATOP instructions must be delivered in accordance with the deadlines and procedures established by DTC and in any event on or prior to 5:00 P.M., New York City time, on the expiration date. See “Terms of the Global Bond Offering—Procedures for the Submission of Offers—Old Bonds Held Directly Through DTC.”
Old Bonds Held Through Euroclear or Clearstream, Luxembourg
If you desire to submit an offer to exchange your old bonds and your old bonds are held through Euroclear Bank S.A./N.V. (“Euroclear”)
invitation if their ownership of old bonds is not large enough to meet this minimum offer amount requirement, or if proration would result in their accepted exchange offer not meeting this requirement. The minimum offer amount is applicable to each exchange offer submitted by, or on behalf of, one beneficial owner of the old bonds. Custodians may not aggregate exchange offers on behalf of multiple beneficial owners of the old bonds in order to meet the minimum offer amount. In addition, your exchange offer must be for a principal amount of US$1,000 multiples of each series of old bonds that you are submitting.
Offer Procedures If you wish to make an exchange offer, you or the custodial entity through which you hold your old bonds must submit, on or before 5:00 P.M., New York City time, on the expiration date, your exchange offer in the applicable manner described below and under the heading “Terms of the Global Bond Offering—Procedures for the Submission of Offers.”
頁 17 / 247424(b)(3)
2014/03/12file:///C:/blp/data/CFd424b3.htm

Table of ContentsTable of ContentsTable of ContentsTable of Contents
S-18
Only a direct participant in Euroclear or Clearstream, Luxembourg may submit an exchange offer by delivering bond instructions to Euroclear or Clearstream, Luxembourg.
Your bond instructions must be delivered in accordance with deadlines and procedures established by Euroclear or Clearstream, Luxembourg, as applicable, and in any event on or prior to 5:00 P.M., New York City time, on the expiration date. See “Terms of the Global Bond Offering—Procedures for the Submission of Offers—Old Bonds Held Through Euroclear or Clearstream, Luxembourg.”
Exchange Offers With Respect to Old Bonds Held by Custodians
If you own old bonds and hold your old bonds through a custodian, you may not tender into the exchange offer directly. Instead, you should contact that custodian to discuss which of the above options can be used by you and your custodian to submit exchange offers on your behalf. In the event that your custodian is unable to submit an exchange offer on your behalf by one of the methods described herein, you should contact the information and exchange agent, or the dealer managers for assistance in submitting your exchange offer. There can be no assurance that any of them will be able to assist you in successfully submitting your exchange offer.
Custodians, direct participants and clearing systems might have deadlines prior to the expiration date for receiving instructions and should be contacted by you as soon as possible to ensure the proper and timely delivery of instructions. Holders who hold old bonds through Euroclear or Clearstream, Luxembourg are urged to submit their old bonds for tender at least one day in advance of the expiration date to avoid delays that might affect the valid tender of their old bonds.
Certain Deemed Representations, Warranties and Undertakings
If you submit an exchange offer pursuant to the terms of the invitation, you will be deemed to have made certain acknowledgments, representations, warranties and undertakings to the Republic, the dealer managers, and the information and exchange agent. See “Terms of the Global Bond Offering—Holders’ Deemed Representations, Warranties and Undertakings.”
or Clearstream Banking, société anonyme (“Clearstream, Luxembourg”), you must deliver, or arrange for a direct participant in Euroclear or Clearstream, Luxembourg to deliver, bond instructions (as defined below) to Euroclear or Clearstream, Luxembourg in accordance with the deadlines specified by Euroclear or Clearstream, Luxembourg.
Withdrawals The right to withdraw an exchange offer will expire upon expiration of the invitation at 5:00 P.M., New York City time, on September 28,
頁 18 / 247424(b)(3)
2014/03/12file:///C:/blp/data/CFd424b3.htm

Table of ContentsTable of ContentsTable of ContentsTable of Contents
S-19
No solicitations in connection with the global bond offering will be made in Italy or Japan by any party, including the dealer managers. No copies of this prospectus supplement, the accompanying prospectus or any other documents relating to the new global bonds or the global bond offering will be distributed in Italy or Japan. No new global bonds will be offered, sold or delivered in Italy or Japan.
2010, the scheduled expiration date. The Republic may, but will not be required to, extend withdrawal rights if it extends the expiration date.
Settlement Date Settlement of the global bond offering will occur on the fifth business day in New York after the announcement date (as extended, the “settlement date”). On the settlement date, the new global bonds and any cash payments due to holders will be delivered against good delivery of the old bonds or cash payment, as applicable. See “Terms of the Global Bond Offering—Settlement.”
Income Tax Consequences Please see “Taxation” in this prospectus supplement for important information regarding the possible Philippine and U.S. federal income tax consequences to holders who exchange old bonds for new global bonds or purchase new global bonds.
Jurisdictions The Republic is making the global bond offering only in those jurisdictions where it is legal to make such offers. See “Certain Legal Restrictions” and “Jurisdictional Restrictions.”
頁 19 / 247424(b)(3)
2014/03/12file:///C:/blp/data/CFd424b3.htm

Table of ContentsTable of ContentsTable of ContentsTable of Contents
S-20
THE NEW GLOBAL BONDS
General Terms of the New Global Bonds
Issuer Republic of the Philippines.
Status of Bonds The new global bonds will be direct, unconditional, unsecured and general obligations of the Republic. Except as otherwise described, the new global bonds will at all times rank at least equally among themselves and with all other unsecured and unsubordinated External Indebtedness (as defined in the accompanying prospectus) of the Republic. The full faith and credit of the Republic will be pledged for the due and punctual payment of all principal and interest on the new global bonds. See “Description of the Securities—Description of the Debt Securities—Status of Bonds” in the accompanying prospectus.
Negative Pledge With certain exceptions, the Republic has agreed that it will not create or permit to subsist any Lien (as defined in the accompanying prospectus) on its revenues or assets to secure External Public Indebtedness (as defined in the accompanying prospectus) of the Republic, unless at the same time or prior thereto, the new global bonds are secured at least equally and ratably with such External Public Indebtedness. The international reserves of Bangko Sentral represent substantially all of the official gross international reserves of the Republic. Because Bangko Sentral is an independent entity, the Republic and Bangko Sentral believe that the international reserves owned by Bangko Sentral are not subject to the negative pledge covenant in the new global bonds and that Bangko Sentral could in the future incur External Public Indebtedness secured by such reserves without securing amounts payable under the new global bonds. See “Description of the Securities—Description of the Debt Securities—Negative Pledge Covenant” in the accompanying prospectus.
Taxation The Republic will make all payments of principal and interest in respect of the new global bonds free and clear of, and without withholding or deducting, any present or future taxes of any nature imposed by or within the Republic, unless required by law. In that event, the Republic will pay additional amounts so that the holders of the new global bonds receive the amounts that would have been received by them had no withholding or deduction been required. See “Description of the Securities—Description of the Debt Securities—Additional Amounts” in the accompanying prospectus. For a description of certain United States tax aspects of the new global bonds, see “Taxation—United States Tax Considerations” in the accompanying prospectus, and “Taxation—United States Federal Income Taxation” in this prospectus supplement.
Collective Action Clauses The new global bonds will contain provisions regarding default, acceleration, voting on amendments, modifications, changes, waivers and future issues of new global bonds that differ from those currently
頁 20 / 247424(b)(3)
2014/03/12file:///C:/blp/data/CFd424b3.htm

Table of ContentsTable of ContentsTable of ContentsTable of Contents
S-21
applicable to many of the Republic’s outstanding External Public Indebtedness. Under these provisions, which are described in the section entitled “Collective Action Securities” on page 113 of the accompanying prospectus, the Republic may, among other things, amend the payment provisions of a series of new global bonds and certain other terms with the consent of the holders of not less than 75% of the aggregate principal amount of the outstanding new global bonds of that series.
Cross-Defaults Events of default with respect to the new global bonds include (i) if the Republic fails to make a payment of principal, premium, prepayment charge or interest when due on any External Public Indebtedness with a principal amount equal to or greater than $25,000,000 or its equivalent, and this failure continues beyond the applicable grace period; or (ii) if any External Public Indebtedness of the Republic or the central monetary authority in principal amount equal to or greater than $25,000,000 is accelerated, other than by optional or mandatory prepayment or redemption. See “Collective Action Securities—Events of Default: Cross Default and Cross
Acceleration” in the accompanying prospectus.
Listing The Republic is offering the new global bonds for sale in the United States and elsewhere where such offer and sale is permitted. Application has been made to admit the new global bonds to listing on the Official List of the Luxembourg Stock Exchange and to trading on the EuroMTF Market in accordance with the rules of the Luxembourg Stock Exchange. The Republic cannot guarantee that the application to the Luxembourg Stock Exchange will be approved, and settlement of the new global bonds is not conditioned on obtaining the listing.
Form, Denomination and Registration The new global bonds will be issued in fully registered form in minimum denominations of $100,000 and integral multiples of $1,000 in excess thereof. The new global bonds will be represented by one or more global securities registered in the name of a depositary, its nominee or a custodian. Beneficial interests in the global securities will be shown on, and the transfer thereof will be effected only through, records maintained by the depositary and its direct and indirect participants. Settlement of all secondary market trading activity in the new global bonds will be made in immediately available funds. See “Description of the Securities—Description of the Debt Securities—Global Securities” in the accompanying prospectus.
Further Issues The Republic may from time to time, without notice to or the consent of the registered holders of new global bonds of either series, issue further bonds which will form a single series with such new global bonds. See “Collective Action Securities—Further Issues of Debt Securities” in the accompanying prospectus.
頁 21 / 247424(b)(3)
2014/03/12file:///C:/blp/data/CFd424b3.htm

Table of ContentsTable of ContentsTable of ContentsTable of Contents
S-22
Terms of the New 2021 Bonds
Terms of the Reopened 2034 Bonds
Fiscal Agent The Bank of New York Mellon (as successor in interest to JPMorgan Chase Bank, N.A.)
Governing Law The fiscal agency agreement and the new global bonds will be governed by and interpreted in accordance with the laws of the State of New York. The laws of the Republic will govern all matters governing authorization and execution of the new global bonds by the Republic.
Title US dollar-denominated global bonds due 2021.
Final Maturity Date January 15, 2021.
Interest The New 2021 Bonds will bear interest at the New 2021 Bond coupon from the settlement date, payable semi-annually in arrears. Interest will be calculated on the basis of a 360-day year, consisting of twelve 30-day months.
Interest Payment Dates January 15 and July 15 each year, payable to the persons who are registered holders thereof at the close of business on the preceding January 10 or July 10, as applicable, whether or not a business day. The New 2021 Bonds will have a short first coupon, the first interest payment will be made on January 15, 2011, in respect of the period from (and including) the settlement date to (but excluding) January 15, 2011.
Issuer Redemption The Republic may not redeem the New 2021 Bonds prior to their scheduled maturity.
Title 6.375% Global Bonds due 2034.
Final Maturity Date October 23, 2034.
Interest The Reopened 2034 Bonds will bear interest at 6.375% from the settlement date, payable semi-annually in arrears. Interest will be calculated on the basis of a 360-day year, consisting of twelve 30-day months.
Interest Payment Dates April 23 and October 23 of each year, payable to the persons who are registered holders thereof at the close of business on the preceding March 31 or September 30, as applicable, whether or not a business day. The Reopened 2034 Bonds will have a short first coupon, the first interest payment will be made on October 23, 2010, in respect of the period from (and including) the settlement date to (but excluding) October 23, 2010, and will be payable to the persons who are registered holders of the Reopened 2034 Bonds at the close of business on the settlement date.
頁 22 / 247424(b)(3)
2014/03/12file:///C:/blp/data/CFd424b3.htm

Table of ContentsTable of ContentsTable of ContentsTable of Contents
S-23
Issuer Redemption The Republic may not redeem the Reopened 2034 Bonds prior to their scheduled maturity.
Fungibility The Reopened 2034 Bonds constitute a further issuance of, and on October 24, 2010 will become fungible with and be consolidated and form a single series with, the 6.375% Global Bonds due 2034 issued by the Republic on October 23, 2009 in the amount of $1,000,000,000 and reopened on January 13, 2010, in the amount of $850,000,000. Prior to October 24, 2010 the Reopened 2034 Bonds will bear different securities codes and trade separately from those previously issued 6.375% Global Bonds due 2034. Upon issuance, the Reopened 2034 Bonds will rank pari passu with the previously issued 6.375% Global Bonds due 2034 in all respects.
頁 23 / 247424(b)(3)
2014/03/12file:///C:/blp/data/CFd424b3.htm

Table of ContentsTable of ContentsTable of ContentsTable of Contents
USE OF PROCEEDS
The Republic will not receive any cash proceeds from the invitation. The Republic intends to use the net cash proceeds from the sale of new global bonds pursuant to the cash offering, if any, for expenses incurred in the invitation, including cash payable in lieu of new global bonds as a result of rounding, and any cash payments to be made in connection with payments of accrued interest on old bonds accepted in the invitation and the special cash payment for the 2030 Bonds and the 2031 bonds accepted in the invitation. The Republic may also use any such proceeds for general purposes, including budgetary support.
S-24
頁 24 / 247424(b)(3)
2014/03/12file:///C:/blp/data/CFd424b3.htm

Table of ContentsTable of ContentsTable of ContentsTable of Contents
RECENT DEVELOPMENTS
The information in this section supplements the information about the Republic that is included in the accompanying prospectus dated December 23, 2009.
Recent Political Developments
National Elections
On May 10, 2010, national elections were held for the positions of President, Vice President, 12 Senators, all members of the House of Representatives and most local government posts. On June 30, 2010, Benigno Aquino III, the son of Senator Benigno Aquino Jr. and former President Corazon Aquino, assumed office as President of the Republic. Former Makati City mayor Jejomar Binay assumed office as Vice President of the Republic. President Aquino is a member of the Liberal Party, whose candidates have four of the 24 seats in the Senate, and 119 of the 287 seats in the House of Representatives (excluding seats allotted for sectoral or party-list representatives), which together constitute the 15th Congress of the Republic. The Lakas-KAMPI party of former President Gloria Macapagal-Arroyo has 45 members, including former President Macapagal-Arroyo, currently serving in the House of Representatives.
State of the Nation Address
In his State of the Nation Address on July 26, 2010, President Aquino focused on the new administration’s goal of improving the Republic’s fiscal deficit. The President outlined certain strategies for achieving this goal: (1) eradicating inefficient projects and wasteful uses of Government funds; (2) minimizing tax evasion to increase tax revenues; (3) funding public projects through partnerships with the private sector; and (4) streamlining governmental procedures to make them more efficient, reliable and business-friendly. To further support fiscal discipline, the President focused on certain pending and enacted legislation, such as: (1) passing the Fiscal Responsibility Bill to limit fiscal spending to appropriations that identify a specific source of funding; (2) passing an antitrust law to ensure fair competition for market participants; (3) amending the Procurement Law to ensure that all government contracts undergo correct procedures; and (4) re-evaluating and eliminating certain fiscal incentives.
In addition, President Aquino cited two other areas of focus for his administration. First, he vowed to examine alleged wrongdoings committed by Government officials during the previous administration and hold accountable those who are found guilty. Second, stressing that peace and order are the foundation for growth and prosperity, President Aquino encouraged dialogue between the Government and the militant Communist Party of the Philippines and the Moro Islamic Liberation Front in an effort to resume peace talks.
Truth Commission
On July 30, 2010, President Aquino signed Executive Order No. 1 (“EO No. 1”), creating a truth commission primarily to “seek and find the truth on, and toward this end, investigate reports of graft and corruption committed by public officers and employees, their co-principals, accomplices and accessories from the private sector, if any, during the previous administration; and thereafter recommend the appropriate action or measures to be taken thereon.” On August 12, 2010, various members of the House of Representatives petitioned the Philippine Supreme Court to declare EO No.1 a violation of the constitutional doctrine of separation of powers between the executive and judicial branches. The Supreme Court has not announced any decision on the matter.
PSALM/NPC Investigations
On July 27, 2010, Energy Secretary Rene Almendras commenced an investigation into alleged anomalies concerning the recovery of approximately (Peso)471 billion in debt of the Power Sector Assets Liability Management Corporation (“PSALM”) and National Power Corporation (“NPC”) through the universal charge component of
S-25
頁 25 / 247424(b)(3)
2014/03/12file:///C:/blp/data/CFd424b3.htm

Table of ContentsTable of ContentsTable of ContentsTable of Contents
electricity charges to consumers. A number of senators have also called for investigations into the matter, alleging that various PSALM costs and expenses relating to consultancy fees, employee bonuses and other remuneration were included in PSALM’s universal charge application with the Energy Regulatory Commission. PSALM has denied these allegations, and the Commission on Audit has also stated that no such components were included in PSALM’s universal charge applications.
Chiang Mai Initiative Multilateralization
On March 24, 2010, the Chiang Mai Initiative Multilateralization (“CMIM”), a reserve pooling arrangement designed to address short-term liquidity difficulties in the Southeast Asian region and supplement other existing international financing arrangements, came into effect. Under the CMIM, member countries of the Association of Southeast Asian Nations (“ASEAN”), as well as the People’s Republic of China (the “PRC”), Japan, the Republic of Korea and Hong Kong, will be able to draw on the CMIM’s reserve pool up to a specified percentage of their contribution, with smaller countries able to draw higher proportionate amounts. The total initial amount of the CMIM is $120.0 billion, with the PRC, Japan, the Republic of Korea and Hong Kong contributing approximately $96.0 billion and other members of ASEAN collectively contributing approximately $24.0 billion. The Republic made an initial contribution of approximately $4.6 billion to the CMIM. In May 2010, the Republic announced that it would increase its contribution to the CMIM by approximately 24% to $4.6 billion.
NAIA-3 Arbitration
On July 22, 2010, an International Chamber of Commerce (“ICC”) arbitration panel in Singapore decided in favor of the Government with respect to the arbitration proceedings brought by the Philippine International Air Terminals Corp. (“PIATCO”) involving the construction of Terminal 3 of the Ninoy Aquino International Airport (“NAIA-3”). After the Philippine Supreme Court nullified the contract in 2003 on the grounds that it violated the Constitution, public policy and that there were irregularities regarding the award of the contract, PIATCO sought approximately $1.1 billion in damages for the cancellation of its contract to construct and operate NAIA-3. The ICC decision in favor of the Government follows the dismissal in 2007 by the International Center for Settlement of Investment Disputes in Washington, D.C. of a compensation claim made by Fraport AG, PIATCO’s German partner, against the Government for reparation of its investment losses.
Aviation Industry Dispute
In July 2010, several pilots of Philippine Airlines (“PAL”) resigned without prior notice, resulting in cancellation of several flights, delays and rerouting of passengers. PAL claims that the pilots resigned without affording PAL the opportunity to hire replacements, resulting in disruptions to flight schedules and PAL’s domestic and international operations. The Government, through the Department of Transportation and Communications, is continuing its attempts to broker discussions between the pilots and PAL to amicably settle the dispute. Meanwhile, the Government is evaluating implementation of an open skies or a partial open skies policy as an alternative approach to minimize future flight disruptions.
Manila Hostage Crisis
On August 23, 2010, 25 persons, mostly tourists from Hong Kong, were held hostage aboard a tour bus in Rizal Park in Manila by a dismissed officer of the Philippine National Police. The armed hostage-taker held the tourists hostage for approximately 11 hours, claiming to be innocent of charges that resulted in his dismissal and demanding reinstatement with the Philippine National Police. During negotiations, a number of hostages were released, but the situation eventually deteriorated, resulting in an exchange of fire between the Manila Police District SWAT team and the hostage-taker. The situation ended with the deaths of eight Hong Kong citizens in addition to the hostage-taker. In response to the hostage situation, the Hong Kong Special Administrative Region (“Hong Kong SAR”) government immediately issued a “black” travel alert for the Philippines, the highest travel warning to be issued by the Hong Kong SAR government, and advised Hong Kong travelers in the Philippines to
S-26
頁 26 / 247424(b)(3)
2014/03/12file:///C:/blp/data/CFd424b3.htm

Table of ContentsTable of ContentsTable of ContentsTable of Contents
leave the country. In addition, the governments of the PRC and the Hong Kong SAR have each requested the Government to conduct a thorough investigation of the incident, and the Hong Kong Security Bureau has sent officers to Manila to assist with the ongoing investigation.
Recent Economic Developments
GDP/GNP
In the first six months of 2010, preliminary estimates indicate that GDP grew by 7.9% and GNP grew by 8.2% (each at constant 1985 prices), compared to growth of 0.9% and 3.9%, respectively, in the first six months of 2009. The increases in GDP and GNP growth were primarily attributable to the global economic recovery, increased government expenditures and the growth in income of overseas Filipino workers (“OFWs”). Consumer spending grew by 5.1%, while government consumption expenditure grew by 12.2% in the first six months of 2010, compared to growth of 4.3% and 9.2%, respectively, in the first six months of 2009. GDP and GNP growth in the first six months of 2010 were driven mainly by the manufacturing, private services, trade, and the housing and real estate subsectors, which were partially offset by the impact of the El Niño phenomenon on the agriculture and fishery subsector. The higher growth in GNP, as compared with GDP growth, was the result of continued strong growth in net factor income from abroad, which registered growth of 10.6% in the first six months of 2010, compared to 29.6% growth in the first six months of 2009.
In 2009, GDP grew by 1.1% compared to growth of 3.7% in 2008. The decrease in the GDP growth rate was due mainly to the global economic crisis, which primarily affected the Republic’s exports, as well as tropical cyclones that affected the Republic in the second half of 2009. GDP growth in 2009 was attributable mainly to growth in private services, construction and mining and quarrying subsectors, which grew 6.4%, 9.8% and 21.5%, respectively. In 2009, GNP grew by 4.0% compared to growth of 6.4% in 2008. The slower GNP growth was due mainly to the slowdown in GDP growth. The primary factor that caused GNP growth to exceed GDP growth was the continued strong growth in net factor income from abroad, which registered 28.0% growth in 2009 compared to 34.5% growth in 2008.
Agriculture, Fishery and Forestry
Preliminary data indicates that the agriculture, fishery and forestry sector, which comprised approximately 16.3% of total GDP, contracted by 2.9% in the first six months of 2010, a reversal from growth of 1.2% in the first six months of 2009. The contraction was due mainly to contractions in the production of rice, corn and sugarcane, which offset growth in other crops, poultry and livestock. Rice production contracted by 10.2% in the first six months of 2010, compared to growth of 3.6% in the first six months of 2009, due to the effects of the El Niño phenomenon resulting in unfavorable weather conditions in some major rice producing regions. Corn production contracted by 24.9% in the first six months of 2010, compared with a contraction of 2.3% in the first six months of 2009, due to unfavorable weather conditions. Sugarcane production contracted by 16.5% in the first six months of 2010, compared to a contraction of 20.9% in the first six months of 2009. Other crops grew by 2.9% in the first six months of 2010, compared to a contraction of 2.8% in the first six months of 2009. Poultry and livestock, which grew 2.4% and 2.1%, respectively, in the first six months of 2010, also contributed to growth in the agricultural subsector. The fishery subsector contracted by 0.2% in the first six months of 2010, compared to growth of 4.7% in the first six months of 2009. The forestry subsector contracted by 17.5% in the first six months of 2010, compared to a contraction of 15.9% in the first six months of 2009.
In 2009, the agriculture, fishery and forestry sector recorded no growth compared to 2008, while growth in the previous year was 3.1%. Increases in fishery, poultry, livestock, banana, corn and coconut were offset by decreases in the production of rice, other crops, sugarcane and forestry. The decreases in the production of agricultural crops, particularly rice, were due mainly to unfavorable weather conditions as a result of a tropical storm and typhoons.
S-27
頁 27 / 247424(b)(3)
2014/03/12file:///C:/blp/data/CFd424b3.htm

Table of ContentsTable of ContentsTable of ContentsTable of Contents
Industry
Preliminary data indicates that the industry sector, which comprised approximately 34.1% of total GDP in the first six months of 2010, grew by 15.9% in the first six months of the year compared with the same period in the previous year, due mainly to growth in the manufacturing subsector. The manufacturing subsector grew by 16.2% in the first six months of 2010, compared to a contraction of 7.5% in the first six months of 2009, due mainly to 55.5% growth in the production of electrical machinery, 37.6% growth in the manufacture of petroleum and coal products and 16.4% growth in the manufacture of chemical products. Growth in these subsectors was partially offset by contractions of 10.8% in footwear and apparel, and 29.9% in tobacco manufacturing. The mining and quarrying subsector grew by 23.0% in the first six months of 2010, compared to growth of 20.7% in the first six months of 2009, due mainly to increases in the production of nickel, gold and other non-metallic minerals as a result of higher metal prices in the world market. The construction subsector grew by 15.7% in the first six months of 2010, compared to growth of 18.9% in the first six months of 2009, as a result of increased private and public construction. The electricity, gas and water subsector grew by 8.3% in the first six months of 2010, compared to a contraction of 2.3% in the first six months of 2009, as a result of stable consumption and strong demand from commercial users.
In 2009, the industry sector contracted by 0.9%, compared to growth of 4.9% in 2008, due mainly to contractions in the manufacturing and the electricity, gas and water subsectors. The manufacturing subsector contracted by 4.4% in 2009, compared to growth of 4.2% in 2008, due mainly to a contraction in the manufacture of petroleum products. The electricity, gas and water subsector contracted by 2.9% in 2009, primarily due to a contraction in power consumption of the industrial sector reflecting the continued impact of the global financial crisis on the operations of companies in the manufacturing subsector. The contraction in the industry sector in 2009 was partially offset by growth in the construction and mining and quarrying subsectors. The construction subsector grew by 9.8% in 2009, compared to 7.6% growth in 2008, primarily due to the implementation of the fiscal stimulus program by the Government, which resulted in increased public construction spending. The mining and quarrying subsector grew by 21.5% in 2009, compared to growth of 1.9% in 2008, primarily due to favorable metal and mineral prices in the world market and the completion of six new mining projects in the second half of 2009.
Services
Preliminary data indicates that the services sector, which comprised approximately 49.6% of total GDP in the first six months of 2010, grew by 6.7% in the first six months of 2010, compared with the first six months of 2009, due mainly to growth in the private services, trade, and housing and real estate subsectors. The private services subsector grew by 7.5% in the first six months of 2010, compared to growth of 5.0% in the first six months of 2009, due mainly to growth in recreational services, which include the broadcasting media. Business services, including the business process outsourcing (“BPO”) industry, hotel and restaurants, other services and medical and health, also contributed to growth in the private services subsector. The trade subsector grew by 10.0% in the first six months of 2010, compared to a contraction of 0.4% in the first six months of 2009, due mainly to growth in retail trade. Wholesale trade also contributed to growth in the trade subsector as a result of an increase in petrochemical sales. The housing and real estate subsector grew by 7.1% in the first six months of 2010, compared to a contraction of 0.9% in the first six months of 2009, primarily due to growth in real estate. The government services subsector grew by 7.1% in the first six months of 2010, compared to 6.4% growth in the first six months of 2009, primarily due to the stimulus program implemented by the Government in response to the global financial crisis. The financial services subsector grew by 4.4% in the first six months of 2010, compared to growth of 3.4% in the first six months of 2009, due to growth in bank, non-bank and insurance services. The transportation, communication and storage subsector grew by 1.6% in the first six months of 2010, compared to 3.2% growth in the first six months of 2009. The slower growth was primarily due to slower growth in communication services.
In 2009, the services sector grew by 2.8% compared with the previous year, while in 2008 growth was 3.1%. The slower growth was primarily the result of a contraction in the housing and real estate subsector and a
S-28
頁 28 / 247424(b)(3)
2014/03/12file:///C:/blp/data/CFd424b3.htm

Table of ContentsTable of ContentsTable of ContentsTable of Contents
slowdown in the transportation, communication and storage subsector. The housing and real estate subsector contracted by 0.3% in 2009, compared to growth of 5.8% in 2008, primarily due to the decline of 8.1% in the real gross value added of real estate. The transportation, communication and storage subsector grew by 0.6% in 2009 compared to 4.2% growth in 2008. The slower growth in this subsector was attributable to a slowdown in the water transport subsector, which also affected storage and other services. Growth in the services sector in 2009 was attributable principally to growth in the private services, finance and government services subsectors. The private services subsector grew by 6.4% in 2009, compared to growth of 4.9% in 2008, and this higher level of growth was due mainly to growth in business and recreational services. The finance subsector grew by 5.9% in 2009, compared to 2.5% growth in 2008, driven mainly by increased bank lending supported by lower interest rates in the Republic. The government services subsector grew by 6.1% in 2009, compared to 3.0% growth in 2008, primarily due to the stimulus program implemented by the Government in response to the global financial crisis.
Income from Abroad
In the first six months of 2010, net factor income from abroad, which comprised approximately 13.4% of total GNP, increased by 10.6% to (Peso)115.4 billion compared to (Peso)104.3 billion in the first six months of 2009. The increase was primarily due to increased compensation inflows from OFWs as a result of the sustained strong demand for the services and expertise of Filipinos abroad. In 2009, the net factor income from abroad grew by 28.0% compared to the previous year, which had growth of 34.5%. Growth of the net factor income from abroad was due mainly to an increase in OFW remittances.
Preliminary data indicates that in the first six months of 2010, total OFW remittances were $9.1 billion, 6.9% higher than the $8.5 billion recorded in the first six months of 2009. Growth in remittances in 2010 was primarily attributable to continued deployments of both land-based and sea-based workers overseas. In 2009, preliminary data indicates that total OFW remittances were $17.3 billion, a 5.6% increase from the $16.4 billion recorded in 2008.
Inflation
Inflation, measured as the change in the consumer price index, or CPI, was 4.0% in August 2010, slightly higher than the July 2010 inflation of 3.9%. Average inflation for the first eight months of 2010 was 4.2%, within the Government’s average inflation target band of 3.5% to 5.5% for 2010, compared to the average inflation rate of 3.2% in 2009. The primary inflationary pressures in the first eight months of 2010 were increases in prices of fuel, light and water, as well as increases in prices of food, particularly meat, fish and miscellaneous food items, and in prices of services. These increases offset slower price increases in beverages, housing and repairs and miscellaneous items.
The Producer Price Index, or PPI, decreased by 5.0% from 173.2 in December 2009 to 164.5 in June 2010, due to decreases in the prices of textiles, chemical products, rubber and plastic products and metals. These price decreases offset general price increases in food manufacturing, leather products and petroleum products. The PPI for June 2010 was approximately 5.7% lower than the level recorded in June 2009. This was primarily attributable to price decreases in furniture and fixtures, electrical machinery and non-electrical machinery over the period.
Unemployment
The average rate of unemployment in July 2010 was 6.9%, a decrease from the 7.6% recorded in July 2009 and the 7.3% recorded in January 2010. The services sector continued to employ the highest number of persons in July 2010, accounting for 51.2% of the total workforce of approximately 36.3 million, followed by the 33.9% of the workforce employed in the agriculture sector, and 14.9% in the industrial sector. Among all regions in the Philippines, the National Capital Region, which includes Metro Manila, posted the highest unemployment rate of 10.9% in July 2010.
S-29
頁 29 / 247424(b)(3)
2014/03/12file:///C:/blp/data/CFd424b3.htm

Table of ContentsTable of ContentsTable of ContentsTable of Contents
Balance of Payments
Overall Balance of Payments Performance
In the first three months of 2010, preliminary data indicates that the overall balance of payments position of the Republic recorded a surplus of $1.4 billion, which was approximately 21.3% lower than the surplus of $1.7 billion recorded for the first three months of 2009, primarily as a result of an outflow of $433 million in net unclassified items, compared to an inflow of $1.3 billion in the first three months of 2009. The lower surplus was also attributable to a lower surplus in the current account, which was $1.8 billion for the first three months of 2010, 0.8% lower than the $1.9 billion surplus recorded for the first three months of 2009. The capital and financial account recorded a deficit of $51 million in the first three months of 2010, compared to the $1.4 billion deficit recorded in the first three months of 2009.
Preliminary data indicates that, the overall balance of payments position of the Republic recorded a surplus of $5.3 billion in 2009, which was considerably higher than the $89 million overall surplus recorded in 2008. This improvement in the balance of payments position was mainly attributable to the higher surplus in the current account of $8.6 billion for 2009, which was 135.4% higher than the surplus of $3.6 billion recorded in 2008. The capital and financial account recorded a deficit of $2.0 billion in 2009, compared to a $1.8 billion deficit recorded in 2008.
Current Account
Preliminary data indicates that in the first three months of 2010, the current account recorded a surplus of $1.8 billion, a decrease of 0.8% from the surplus of $1.9 billion recorded for the first three months of 2009. The lower surplus was mainly the result of a higher trade-in-goods deficit and net income payments, as well as lower net services receipts. In the first three months of 2010, the trade-in-goods deficit increased by 1.5% to $2.3 billion. Net income payments increased by 5.7% to $2.1 billion in the first three months of 2010 from $1.9 billion recorded in the first three months of 2009. The trade-in-services surplus decreased by 3.4% to $826 million in the first three months of 2010 from a surplus of $855 million recorded in the first three months of 2009. Net receipts from current transfers increased by 2.4% to $3.9 billion in the first three months of 2010 from $3.8 billion recorded in the first three months of 2009. Increased current transfer receipts were attributable to higher levels of remittances from OFWs in the period, which increased to $3.7 billion, 5.9% higher than the $3.5 billion of remittances recorded in the first three months of 2009.
According to preliminary data, the current account recorded a surplus of $8.6 billion in 2009, an approximately 135.4% increase from the surplus of $3.6 billion recorded in 2008. The higher surplus was mainly the result of higher net receipts from current transfers, which increased 4.7% to $16.0 billion in 2009, a lower trade-in-goods deficit, which decreased 31.1% to $8.9 billion in 2009 from $12.9 billion in 2008, and a higher trade-in-services surplus, which increased 32.7% to $1.5 billion in 2009 from $1.2 billion in 2008. These developments were partially offset by the $69 million deficit recorded in the income account in 2009, a reversal from the surplus of $111 million recorded in 2008.
Goods Trade. According to preliminary data, in the first three months of 2010, the trade-in-goods deficit increased slightly to $2.3 billion. Imports in the first three months of 2010 increased to $13.4 billion from $10.0 billion recorded in the first three months of 2009. Exports increased to $11.1 billion in the first three months of 2010 from $7.7 billion recorded in the first three months of 2009. These developments reflected the increased domestic economic activity and the stronger external demand as a result of the global economic recovery.
According to preliminary data, the trade-in-goods deficit decreased to $8.9 billion in 2009, a 31.1% decrease from the deficit of $12.9 billion recorded in 2008. The lower deficit was due mainly to the decrease in imports exceeding the decrease in exports in 2009 as a result of the weak global trade. Exports of goods contracted by
S-30
頁 30 / 247424(b)(3)
2014/03/12file:///C:/blp/data/CFd424b3.htm

Table of ContentsTable of ContentsTable of ContentsTable of Contents
22.3% in 2009 as all major export commodities, except sugar and related products, declined. Imports of goods contracted by 24.1% in 2009 as all major import commodities contracted as a result of weak global prices for most commodities.
Exports of Goods. In the first three months of 2010, according to preliminary data, total exports of goods increased 43.5% to $11.1 billion from $7.7 billion recorded in the first three months of 2009. The increase was mainly attributable to increased revenues for the export of manufactured goods, mineral products, coconut products, petroleum products and other agricultural-based products. In particular, exports of manufactured goods, which comprise 88.3% of total exports, grew by 45.7% to $10.0 billion recorded in the first three months of 2010 from the $6.9 billion recorded in the first three months of 2009, primarily due to an increase in electronic products exports from $4.6 billion to $6.9 billion, an increase in machinery and transport equipment exports from $470 million to $770 million, and increases in chemical exports and other manufactured products exports. Exports of mineral products increased 12.0% to $391 million in the first three months of 2010, due mainly to an increase in copper prices. Exports of coconut products grew by 135.6% to $311 million in the first three months of 2010 from $132 million recorded in the first three months in 2009. Exports of petroleum products grew by 192.3% to $76 million in the first three months of 2010, partly due to increased sales of petroleum naphtha and reformat. Exports of other agricultural-based products grew by 23.6% to $136 million, due mainly to increased shipments of abaca fibers, natural rubber and others. These increases were partially offset by contractions in exports of fruits and vegetables and sugar and related products, which decreased by 18.9% and 3.8%, respectively.
According to preliminary data, total exports of goods decreased 22.3% to $37.5 billion in 2009 from $48.3 billion recorded in 2008 as exports of all major export commodities declined except sugar and related products. The decrease was mainly attributable to an 18.2% decline in total exports of manufactured products to $33.5 billion in 2009 from the $41.0 billion recorded in 2008. Manufactured goods comprised 87.4% of total exports in 2009. Total electronics, which comprised the majority of manufactured products exports, were $23.6 billion in 2009, a decrease of 21.2% from the $29.9 billion recorded in 2008, due mainly to the weaker demand for electronic products as result of the global economic crisis. The declines in exports of petroleum products, mineral products, other agricultural products, coconut products and fruits and vegetables also contributed to the decrease of total exports of goods in 2009.
Imports of Goods. In the first three months of 2010, according to preliminary data, total imports of goods increased 34.0% to $13.4 billion from the $10.0 billion recorded in the first three months of 2009. The increase in imports was consistent with the level of increase in export revenues and was mainly attributable to increases in raw materials and intermediate goods imports, capital goods imports, mineral fuels and lubricants and consumer goods. Imports of raw materials and intermediate goods increased 19.6% to $6.6 billion in the first three months of 2010, from $5.6 billion in the first three months of 2009, driven primarily by the increase in imports of raw materials needed for the manufacture of electronic goods, which comprised approximately 56.1% of raw materials and intermediate goods imports, as electronics exports increased. Capital goods imports increased 42.8% to $2.4 billion in the first three months of 2010 from $1.7 billion recorded in the first three months of 2009, driven mainly by the expansion of economic activity. Imports of mineral fuels and lubricants in the first three months of 2010 increased 55.1% to $2.1 billion from $1.4 billion recorded in the first three months of 2009, due mainly to higher volume and price of petroleum crude imports. Imports of consumer goods in the first three months of 2010 increased 64.8% to $2.0 billion from $1.2 billion recorded in the first three months of 2009.
In 2009, according to preliminary data, imports of goods decreased 24.1% to $46.4 billion, from $61.1 billion recorded in 2008, as imports of all major import commodities contracted as a result of weak global prices for most commodities. In particular, mineral fuels and lubricants decreased 40.8% to $7.3 billion in 2009 from the $12.4 billion recorded in 2008, due mainly to the decline in the volume and price of petroleum crude imports. Imports of raw material needed for the manufacture of electronics goods, which comprised 30.4% of total import payments, decreased 24.8% to $14.1 billion in 2009 from the $18.7 billion recorded in 2008, primarily due to the weaker demand for electronic products in 2009.
S-31
頁 31 / 247424(b)(3)
2014/03/12file:///C:/blp/data/CFd424b3.htm

Table of ContentsTable of ContentsTable of ContentsTable of Contents
Services Trade. In the first three months of 2010, according to preliminary data, the trade-in-services account recorded a surplus of $826 million, a 3.4% decrease from the $855 million surplus recorded in the first three months of 2009. The lower surplus was mainly attributable to higher net payments in travel, construction services, transportation, financial services, royalties and license fees and government services, which were partially offset by inflows in computer and information services, communication services and other business services, including continued growth in the export of BPO-related services which increased 30.7% to $1.5 billion in the first three months of 2010 from the $1.2 billion recorded in the first three months of 2009.
According to preliminary data, the trade-in-services account recorded a surplus of $1.5 billion in 2009, a 32.7% increase from the $1.2 billion surplus recorded in 2008. This higher surplus was mainly attributable to growth in miscellaneous business professional and technical services and computer and information services, which grew by 16.0% and 11.0%, respectively, in 2009. Lower net payments for transportation and insurance services also contributed to growth in the trade-in-services account, due mainly to the lower payments for freight as a result of reduced imports of goods.
Income Account. In the first three months of 2010, according to preliminary data, the income account recorded a deficit of $596 million, a 7.8% increase from the $553 million deficit recorded in the first three months of 2009. The larger deficit was primarily the result of increased net payments in the investment income account, which were partially offset by the $1.2 billion increase in gross earnings of OFWs. The higher investment income account deficit was due mainly to higher net income payments on portfolio investments, as a result of increased dividends distributed by banks and private corporations to non-resident portfolio equity investors, higher net income payments by residents to direct investors abroad, higher interest payments on bonds issued by the Government, and lower interest income receipts from holdings of debt securities by monetary authorities and corporations due to declining global interest rates.
According to preliminary data, the income account recorded a deficit of $69 million in 2009, a reversal from the $111 million surplus recorded in 2008. The main contributors to the deficit were higher net income payments by residents to affiliated enterprises and to portfolio investors, as well as lower net interest income receipts by monetary authorities and corporations due to the decline in global interest rates.
Current Transfers. The current transfers account recorded a preliminary surplus of $3.9 billion in the first three months of 2010, 2.4% higher than the $3.8 billion surplus recorded in the first three months of 2009, due mainly to OFW remittances of $3.7 billion, representing a 5.9% increase from the $3.5 billion recorded in same period of 2009.
According to preliminary data, the current transfers account recorded a surplus of $16.0 billion in 2009, 4.7% higher than the $15.2 billion surplus recorded in 2008, due mainly to remittances from non-resident OFWs of $15.1 billion in 2009, representing a 4.2% increase from remittances of $14.5 billion recorded in 2008.
Capital and Financial Account
According to preliminary data, the capital and financial account recorded a net outflow of $51 million in the first three months of 2010, a 96.5% decrease from the $1.4 billion net outflow recorded in the first three months of 2009. The decrease in net outflow was mainly attributable to a decrease in net outflow of portfolio investment and a reversal of the other investments from a net outflow to a net inflow. The decrease in the net outflow of the capital and financial account was partially offset by the lower direct investment net inflow. Portfolio investments posted a net outflow of $542 million in the first three months of 2010, a decrease from a net outflow of $643 million recorded in the first three months of 2009. Net inflow of other investments amounted to $352 million in the first three months of 2010, a reversal from the net outflow of $1.1 billion recorded in the first three months of 2009. Direct investments posted a lower net inflow of $166 million in the first three months of 2010, compared with a net inflow of $282 million in the first three months of 2009.
S-32
頁 32 / 247424(b)(3)
2014/03/12file:///C:/blp/data/CFd424b3.htm

Table of ContentsTable of ContentsTable of ContentsTable of Contents
According to preliminary data, the capital and financial account recorded a net outflow of $2.0 billion in 2009, an increase from the net outflow of $1.8 billion recorded in 2008. The increase in the net outflow was due mainly to a reversal in the other investment account from a net inflow of $771 million recorded in 2008 to a net outflow of $5.1 billion recorded in 2009 caused by net loan repayments by local banks and private corporations, non-residents’ net withdrawal of currency and deposit placements in local banks and private corporations and loans extended abroad by resident banks to non-residents. The increase in the net outflow was partially offset by net inflows in direct and portfolio investments. The direct investment account recorded a net inflow of $1.6 billion in 2009, a 23.7% increase from the $1.3 billion recorded in 2008. The portfolio investment account recorded a net inflow of $1.4 billion, a reversal from a net outflow of $3.8 billion recorded in 2008.
Direct Investments. According to preliminary data, direct investments posted a net inflow of $166 million in the first three months of 2010, 41.1% lower than the $282 million net inflow recorded in the first three months of 2009. The lower level of net inflows was due to higher residents’ equity capital investments abroad, which amounted to $230 million in the first three months of 2010 compared to $52 million in the first three months of 2009. The net inflow of direct investments was largely attributable to non-residents’ investments in the Republic, which amounted to $396 million in the first three months of 2010. Net inflows of foreign direct investment posted an increase in the other capital account, consisting mainly of intercompany borrowing and lending between foreign direct investors and their subsidiaries and affiliates in the Republic, which recorded a net inflow of $319 million in the first three months of 2010 compared to a net outflow of $48 million in the first three months of 2009. Equity capital recorded a net inflow of $45 million, a 90% decrease from the level recorded in the first three months of 2009, as investors remained risk averse on concerns about the sovereign debt problems in Europe. The reinvested earnings also contributed to the net inflow of direct investments, which recorded a net inflow of $32 million in the first three months of 2010, a reversal from the $78 million net outflow recorded in the first three months of 2009.
In 2009, the direct investment account recorded a net inflow of $1.6 billion, a 23.7% increase from the $1.3 billion recorded in 2008. The higher inflows were due mainly to a 26.2% increase in non-residents’ investment. In particular, the Republic had a net inflow of $1.8 billion in equity capital investments in 2009, a 46.2% increase from the level recorded in 2008. The reinvested earnings account recorded a net inflow of $84 million in 2009, compared to a $53 million net inflow in 2008, as investors chose to reinvest corporate earnings in local companies. The other capital investments account recorded a net outflow of $58 million in 2009, a 77.3% decrease from the $256 million net inflow recorded in 2008, primarily due to higher trade credits extended by local subsidiaries and affiliates to their parent companies abroad.
Portfolio Investments. According to preliminary data, portfolio investments recorded a net outflow of $542 million in the first three months of 2010, a 15.7% decrease from the $643 million net outflow recorded in the first three months of 2009, due mainly to the reversal of non-residents’ portfolio investments to a net inflow of $332 million from a net outflow of $270 million recorded in the first three months of 2009. The net outflow in portfolio investments was attributable in part to the net purchase by residents of Philippine debt issued abroad by the Republic and some public and private corporations, approximately $1.4 billion in bond repayments by the Republic, and residents’ debt securities placements abroad. The net outflow in portfolio investments was partially offset by non-residents’ subscription to the Republic’s $1.5 billion global bond issued in January 2010 and $1.1 billion Samurai Bonds issued in February 2010.
In 2009, according to preliminary data, portfolio investments recorded a net inflow of $1.4 billion, a reversal from the net outflow of $3.8 billion recorded in 2008. This reversal was mainly attributable to non-residents’ subscription to the bond offerings by the Republic, PSALM and certain private corporations, non-residents’ placements in government securities, and resident banks’ maturing bonds and notes placements abroad.
Other Investments. According to preliminary data, the other investments account recorded a net inflow of $352 million in the first three months of 2010, a reversal from the $1.1 billion net outflow recorded in the first three months of 2009, primarily as a result of $1.1 billion in trade credits extended by non-residents to private corporations, and currency and deposit placements by non-residents in local banks.
S-33
頁 33 / 247424(b)(3)
2014/03/12file:///C:/blp/data/CFd424b3.htm

Table of ContentsTable of ContentsTable of ContentsTable of Contents
According to preliminary data, the other investment account recorded a net outflow of $5.1 billion in 2009, a reversal from the $771 million net inflow recorded in 2008. The change was mainly attributable to net loan repayments by local banks and some private corporations, non-residents’ net withdrawal of currency and deposits from local banks and private corporations, and loans extended abroad by resident banks to non-residents.
International Reserves
According to preliminary data, gross international reserves of the Republic totalled $49.6 billion as of August 31, 2010, $537 million higher than the $49.0 billion recorded as of July 31, 2010, and $5.4 billion higher than the $44.2 billion recorded as of December 31, 2009. The increase from December 31, 2009 was due mainly to inflows from foreign currency deposits by the Government, as well as valuation gains with respect to Bangko Sentral’s gold reserves. These gains were partially offset by reduced holdings of special drawing rights and decreased net foreign exchange operations by Bangko Sentral. The level of gross international reserves as of August 31, 2010 was sufficient to cover approximately 9.2 months of imports of goods and payments of services and income, and was equivalent to 9.5 times the Republic’s short-term debt based on original maturity and 5.1 times based on residual maturity.
According to preliminary data, net international reserves of the Republic were $49.6 billion as of August 31, 2010, an increase from the $49.0 billion recorded as of July 31, 2010, and an increase from the $44.2 billion recorded as of December 31, 2009.
External Debt
As of March 31, 2010, the Republic’s outstanding external debt recorded by Bangko Sentral was $55.4 billion, a 4.1% increase from the $53.3 billion recorded as of December 31, 2009, and 5.6% higher than the $52.5 billion recorded as of March 31, 2009. The increase in external debt in the first three months of 2010 was due mainly to increases in net borrowings of both the private and public sectors.
As of March 31, 2010, Bangko Sentral-approved medium- and long-term external debt amounted to $50.2 billion, while Bangko Sentral-approved short-term external debt amounted to $5.2 billion. Approximately 51.2% of total Bangko Sentral-approved external debt (including short-term debt) was denominated in U.S. dollars, 29.4% was denominated in Japanese yen, and 8.2% was denominated in other currencies. Multicurrency loans from the World Bank and the Asian Development Bank accounted for the remaining 11.2% of total Bangko Sentral-approved external debt.
Money Supply
Preliminary data indicates that as of July 31, 2010, the Republic’s money supply was (Peso)3.9 trillion, a 10.2% increase from the level recorded as of July 31, 2009, but principally unchanged from the level recorded as of December 31, 2009. The increase in liquidity as of July 31, 2010 was primarily attributable to growth in net foreign assets, which grew by 15.9% compared to the level as of July 31, 2009. The increase in net foreign assets was due mainly to the continued expansion of Bangko Sentral’s foreign assets, which grew by 15.7%. As of July 31, 2010, the net domestic assets grew by 2.8% from the level recorded as of July 31, 2009. Growth in credit extended to the private sector was 10.0% as of July 31, 2010 compared to the level recorded as of July 31, 2009, and credit extended to the public sector increased 11.4% as of July 31, 2010 compared to the level recorded as of July 31, 2009.
As of December 31, 2009, according to preliminary data, the Republic’s money supply was (Peso)4.0 trillion, an 8.3% increase from the level recorded as of December 31, 2008. The increase was attributable to growth in net foreign assets, which grew 25.3% for the year. Growth in net foreign assets was due to an expansion in foreign assets held by Bangko Sentral. Net domestic assets contracted by 3.7% in 2009 due mainly to the expansion of the net other items account, which includes revaluation and capital reserve accounts, as well as special deposit account placements of trust entities.
S-34
頁 34 / 247424(b)(3)
2014/03/12file:///C:/blp/data/CFd424b3.htm

Table of ContentsTable of ContentsTable of ContentsTable of Contents
Non-performing Loans of Universal and Commercial Banks
According to Bangko Sentral data as of July 31, 2010, the non-performing loan (“NPL”) ratio for universal and commercial banks was 3.37% (3.78% exclusive of interbank loans), a 0.12% improvement from the 3.49% (3.99% exclusive of interbank loans) ratio recorded as of July 31, 2009. The improvement in the NPL ratio in the period was attributable mainly to a decline in the amount of non-performing loans, as well as to an increase in the total loan portfolio.
Interest Rates
As of August 26, 2010, based on the assessment that current monetary policy is appropriate and given the favorable inflation outlook, the Monetary Board of Bangko Sentral decided to maintain its policy interest rates at 4.0% for the overnight borrowing or reverse repurchase (“RRP”) rate, and at 6.0% for the overnight lending or repurchase (“RP”) rate. The interest rates on term RRP and RP facilities, as well as special deposit accounts also remained unchanged. The policy interest rates have not been changed since July 2009, when the RRP rate and RP rate were lowered to their current levels from 4.25% and 6.25%, respectively.
Foreign Exchange System
On September 17, 2010, the peso-to-U.S. dollar exchange rate was (Peso)44.339 per U.S. dollar, compared to (Peso)46.356 per U.S. dollar at the end of 2009, and (Peso)47.485 per U.S. dollar at the end of 2008.
In the first eight months of 2010, the average exchange rate was (Peso)45.764 per U.S. dollar, compared to (Peso)47.900 per U.S. dollar in the first eight months of 2009. In 2009, the average exchange rate was (Peso)47.637 per U.S. dollar, compared to (Peso)44.475 per U.S. dollar in 2008, and (Peso)46.148 in 2007. The general strengthening of the peso was attributable to sustained foreign exchange inflows from OFW remittances, foreign direct and other investments, and the strong performance of the Republic’s sovereign bonds. These trends were offset in part by concerns over the sovereign debt problem in Europe and the Republic’s deteriorating fiscal position.
The Philippine Securities Markets
As of September 17, 2010, the Philippine Stock Exchange composite index closed at 3,979.4, an increase of 30.4% compared to 3,052.7 recorded as of the end of 2009. In the first eight months of 2010, the average Philippine Stock Exchange composite index was 3,260.9 compared to the average composite index of 2,287.1 in the first eight months of 2009. In 2009, the average Philippine Stock Exchange composite index was 2,508.7 compared to 2,587.4 in 2008, and 3,442.9 in 2007.
2011 Budget
On August 9, 2010, President Aquino approved the (Peso)1.645 trillion national budget for 2011. The 2011 budget is approximately 6.8% higher than the (Peso)1.54 trillion appropriated for 2010. The approved budget provides for a deficit of (Peso)290.0 billion.
S-35
頁 35 / 247424(b)(3)
2014/03/12file:///C:/blp/data/CFd424b3.htm

Table of ContentsTable of ContentsTable of ContentsTable of Contents
The ten Government agencies with the highest allocations under the proposed 2011 budget compared to their corresponding allocations under the 2010 budget are set out below:
Revenues and Expenditures
Seven months ended July 31, 2010 compared to seven months ended July 31, 2009
The Government recorded a deficit of (Peso)229.4 billion for the first seven months of 2010, compared to a deficit of (Peso)188.0 billion for the first seven months of 2009. The deficit was primarily a result of the continued increase in expenditures outpacing the increase in government collections, particularly with respect to tax collections.
Total Government revenues for the first seven months of 2010 were (Peso)695.0 billion, compared to (Peso)644.1 billion recorded in the first seven months of 2009, reflecting a 7.9% increase. Bureau of Internal Revenue (“BIR”) collections for the first seven months of 2010 were (Peso)467.3 billion (of which (Peso)460.4 billion were cash revenues), reflecting an increase of 7.9% from BIR collections of (Peso)433.2 billion (of which (Peso)414.1 billion were cash revenues) recorded in the first seven months of 2009, as a result of the continued implementation of the run after tax evaders program of the Government. Bureau of Customs (“BOC”) collections were (Peso)153.0 billion (of which (Peso)133.0 billion were cash revenues) in the first seven months of 2010, compared to (Peso)129.0 billion recorded for the first seven months of 2009 (of which (Peso)109.9 billion were cash revenues), reflecting an 18.6% increase. Revenues from other offices were (Peso)39.3 billion in the first seven months of 2010, an increase of 0.3% from revenues from other offices of (Peso)39.2 billion recorded in the first seven months of 2009. Income from the Bureau of the Treasury was (Peso)35.5 billion in the first seven months of 2010, compared to income of (Peso)42.7 billion recorded in the first seven months of 2009, representing a 17.0% decrease.
For the first seven months of 2010, total Government expenditures were (Peso)924.4 billion (of which (Peso)189.5 billion were interest payments), representing an 11.1% increase from Government expenditures of (Peso)832.1 billion (of which (Peso)183.7 billion were interest payments) recorded in the first seven months of 2009.
2009 compared to 2008 and program 2009 targets
The Government recorded a deficit of (Peso)298.5 billion in 2009, compared to a program deficit of (Peso)250.0 billion and an actual deficit of (Peso)68.1 billion in 2008.
Total Government revenues in 2009 were (Peso)1,123.2 billion, compared to (Peso)1,202.9 billion recorded in 2008, reflecting a 6.6% decrease. Total revenues in 2009 were below the program target of (Peso)1,239.2 billion, primarily
S-36
Agency2011
Allocation2010
Allocation
(in billions)
Department of Education (Peso)207.3 (Peso)175.0Department of Public Works and Highways 110.6 135.6Department of National Defense 104.7 96.2Department of the Interior and Local Government 88.2 78.8Department of Agriculture 37.7 41.2Department of Social Welfare and Development 34.3 15.4Department of Health 33.3 29.3Department of Transportation and Communications 32.3 17.2Department of Agrarian Reform 16.7 21.1The Judiciary 14.3 13.3
(1) includes the Department of Education Educational Facilities Fund
(2) includes pension and AFP Modernization Program
(3) includes pension
(1)
(2)
(3)
頁 36 / 247424(b)(3)
2014/03/12file:///C:/blp/data/CFd424b3.htm

Table of ContentsTable of ContentsTable of ContentsTable of Contents
due to collection shortfalls across all Government offices compared to their target collections for 2009. BIR collections in 2009 were (Peso)750.3 billion (of which (Peso)720.5 billion were cash revenues) compared to (Peso)778.6 billion (of which (Peso)761.9 billion were cash revenues) recorded in 2008, reflecting a 3.6% decrease. The Government’s program target for BIR collections in 2009 was (Peso)798.5 billion (of which (Peso)778.5 billion was targeted to be in cash). BOC collections were (Peso)220.3 billion in 2009 (of which (Peso)198.2 billion were cash revenues) compared to (Peso)260.2 billion (of which (Peso)218.2 billion were cash revenues) recorded in 2008, reflecting a 15.3% decrease. 2009 program target collections for the BOC was (Peso)273.3 billion, of which (Peso)238.0 billion was targeted in cash. Revenues from other Government offices were (Peso)82.7 billion in 2009, compared to other revenues of (Peso)100.4 billion recorded in 2008, reflecting a 17.6% decrease. The revenues derived from other offices were also below the 2009 program target of (Peso)107.3 billion set by the Government. These shortfalls offset income from the Bureau of the Treasury, which was (Peso)69.9 billion in 2009, compared to income of (Peso)63.7 billion recorded in 2008, representing a 9.8% increase. The figure is also above the (Peso)60.1 billion program target for 2009.
In 2009, total Government expenditures were (Peso)1,421.7 billion (of which (Peso)278.9 billion were interest payments), representing an 11.9% increase from Government expenditures of (Peso)1,271.0 billion (of which (Peso)272.2 billion were interest payments) recorded in 2008. Full year program target expenditure in 2009 was set at (Peso)1,489.2 billion, of which (Peso)311.2 billion was targeted for interest payments.
Consolidated Public Sector Financial Position
In 2009, preliminary data showed that the consolidated financial position of the Republic recorded a deficit of (Peso)256.4 billion, a reversal from the surplus of (Peso)31.2 billion recorded in 2008. The reversal in the public sector position was primarily due to the higher deficits of the national Government as well as Government-owned and—controlled corporations in 2009, which offset surpluses recorded by local government units and Government financial institutions such as the Social Security System and the Government Service Insurance System.
National Government Debt
As of June 30, 2010, total outstanding Government debt was (Peso)4,582.4 billion, an increase of 4.2% from the (Peso)4,396.6 billion recorded as of December 31, 2009. Of the total outstanding Government debt recorded as of June 30, 2010, domestic debt comprised (Peso)2,595.8 billion, a 5.1% increase from the (Peso)2,470.0 billion recorded as of December 31, 2009, and foreign currency-denominated debt comprised (Peso)1,986.6 billion, which increased by 3.1% from the (Peso)1,926.6 billion recorded as of December 31, 2009. The overall increase in Government debt is attributable to net borrowings made by the Government in the first six months of 2010, as well as issuances of Government securities during the same period.
Privatization
The Government continues to evaluate options for the privatization of Government assets. Initially, the Government targeted approximately (Peso)30.0 billion in revenues from privatization in 2010, but since the Aquino administration assumed office, Government privatization plans for the year have been subject to reassessment. In August 2010, the Secretary of Energy announced that the Government no longer plans to sell its stake in the Malampaya gas field, which is held through the Philippine National Oil Company-Exploration Corp. The Government has also deferred the privatization of the 120-hectare Food Terminal, Inc. agro-commercial and industrial property in Taguig City in Metro Manila. As a result of these developments, the Government’s revised expectation of proceeds from privatization in 2010, excluding proceeds received from the privatization of assets of NPC by PSALM, is approximately (Peso)2.0 billion.
Privatization of NPC’s Assets
On January 12, 2010, PSALM commenced the public auction process for the privatization of the 246 MW Angat Hydroelectric power plant in Bulacan province. On April 28, 2010, Korea Water Resources Development
S-37
頁 37 / 247424(b)(3)
2014/03/12file:///C:/blp/data/CFd424b3.htm

Table of ContentsTable of ContentsTable of ContentsTable of Contents
Corp. was declared the highest bidder for the Angat plant with a $440.9 million bid. Various special interest groups, however, have subsequently called for the suspension of the public auction process for the Angat dam, claiming that the property must remain in the public domain. On May 5, 2010, PSALM declared BacMan Geothermal Inc. as the winning bidder for the 150 MW Bacon-Manito Geothermal Power Plant package with a bid of $28.3 million.
On August 18, 2010, the Department of Energy informed PSALM that the privatization of the Agus-Pulangi Hydro power plant complex in Mindanao, originally scheduled for 2011, would be deferred due to inappropriate timing and to ensure the stability of the power supply in the Mindanao region. The Secretary of Energy added that the Department of Energy was examining the best means by which the deferral could be accomplished without seeking legislative amendment given that the privatization of the Agus-Pulangi complex by 2011 is mandated by law.
Since January 2010, as set out in the table below, PSALM began appointing independent power producer administrators for the contracted capacity of certain of its power plants.
S-38
Facility Winning BidderContractedCapacity Amount of Bid
(in MW) (in $ millions)
Ilijan Natural Gas Combined Cycle plant San Miguel Corporation 1,200 870.0Malaya Thermal plant Launched April 15, 2010 650 —
Unified Leyte Geothermal plant Launched May 19, 2010 640 —
Naga coal-fired plant Launched June 7, 2010 110 —
頁 38 / 247424(b)(3)
2014/03/12file:///C:/blp/data/CFd424b3.htm

Table of ContentsTable of ContentsTable of ContentsTable of Contents
TERMS OF THE GLOBAL BOND OFFERING
Terms of the Global Bond Offering
The Republic is inviting holders of old bonds to submit one or more offers to exchange old bonds for new global bonds on the terms and subject to the conditions described in this prospectus supplement and the accompanying prospectus. Specifically, the Republic is inviting holders of its Group A Bonds to submit offers to exchange each series of Group A Bonds for New 2021 Bonds or Reopened 2034 Bonds, and holders of Group B Bonds to submit offers to exchange each series of Group B Bonds for Reopened 2034 Bonds.
In addition, the Republic may offer new global bonds for cash pursuant to the cash offering. The Republic reserves the right, in its sole discretion, not to issue any new global bonds pursuant to the invitation or the cash offering. The initial public offering price per $1,000 principal amount of each series of new global bonds to be sold pursuant to the cash offering will equal the new global bond issue price for that series of new global bonds.
The maximum principal amount of new global bonds that the Republic will issue pursuant to the global bond offering is $3,000,000,000. Pursuant to the global bond offering, the Republic will issue at least $500,000,000 aggregate principal amount of the New 2021 Bonds, if any New 2021 Bonds are issued. There is no minimum issue size of the Reopened 2034 Bonds, because on October 24, 2010 they will become fungible with the Republic’s outstanding 6.375% Global Bonds due 2034.
The terms of the new global bonds are described in “Description of the New Global Bonds.”
Purpose; Use of Proceeds
The global bond offering is part of a broader program of the Republic to manage its liabilities. The Republic intends to use the net cash proceeds from the sale of new global bonds pursuant to the cash offering, if any, for expenses incurred in the invitation, including cash payable in lieu of new global bonds as a result of rounding, and any cash payments to be made in connection with payments of accrued interest on old bonds accepted in the invitation and the special cash payment for the 2030 Bonds and the 2031 bonds accepted in the invitation. The Republic may also use any such proceeds for general purposes, including budgetary support.
Consideration to be Received in Exchange Offers Pursuant to the Invitation
Only bonds of the series listed as “old bonds” on the cover of this prospectus supplement may be exchanged for new global bonds pursuant to the invitation.
If you hold old bonds and validly offer to exchange at least the minimum offer amount of old bonds for new global bonds pursuant to the invitation and the Republic accepts your exchange offer, you will receive, in exchange for each $1,000 original principal amount of each series of old bonds exchanged, and subject to minimum denominations of $100,000 for the new global bonds, new global bonds of the applicable series having a principal amount (rounded downward to the nearest integral multiple of $1,000) equal to the product of:
In addition, because the Republic will issue new global bonds only in minimum denominations of $100,000 and integral multiples of $1,000 in excess thereof, the aggregate principal amount of the new global bonds of a series that will be issued to any exchanging bondholder pursuant to all of its accepted exchange offers for that series of new bonds, if not an integral multiple of $1,000, will be rounded downward to the nearest integral multiple of $1,000 (subject to minimum denominations of $100,000), and you will also receive an amount in cash in US dollars in respect of such rounding equal to:
S-39
• $1,000 multiplied by
• the applicable exchange ratio.
• the decrease in the aggregate principal amount of new global bonds issuable to you as a result of such rounding, multiplied by
頁 39 / 247424(b)(3)
2014/03/12file:///C:/blp/data/CFd424b3.htm

Table of ContentsTable of ContentsTable of ContentsTable of Contents
If you are exchanging 2030 Bonds or 2031 Bonds, in addition to new global bonds, you will also receive a “special cash payment” for such series of old bonds, which is expected to be an amount in cash in US dollars for each $1,000 principal amount of old bonds accepted for exchange as specified below:
The purpose of the special cash payment is to ensure that all Reopened 2034 Bonds to be issued in the global bond offering will be fungible for U.S. tax purposes. The Republic reserves the right to modify the special cash payment if necessary prior to 6:00 P.M., New York City time, on the business day immediately before the expiration date, in order to ensure that all the Reopened 2034 Bonds to be issued will be fungible for U.S. tax purposes, and the Republic may chose not to make any special cash payment if it is not necessary to ensure fungibility. The special cash payment for each of the 2030 Bonds and the 2031 Bonds will be deducted from the old bond exchange value for the 2030 Bonds and the 2031 Bonds, as applicable, when calculating the exchange ratio for those bonds, as described below.
The Reopened 2034 Bonds will become fungible with the Republic’s currently outstanding 6.375% Global Bonds due 2034 on October 24, 2010. See “The New Global Bonds—Terms of the Reopened 2034 Bonds—Fungibility.”
In addition, you will receive a cash payment in respect of any accrued and unpaid interest on your old bonds accepted for exchange during the period from and including the last interest payment date with respect to such old bonds up to but not including the settlement date.
Determination of Exchange Ratios, Old Bond Prices and New Global Bond Issue Prices
Determination of Exchange Ratios
The “exchange ratio” for each series of old bonds will be equal to the quotient (rounded to four decimal places, with 0.00005 rounded to 0.0001) of:
Determination of Old Bond Exchange Values and Old Bond Prices
The “old bond exchange value” for each series of old bonds will be the difference of:
The “old bond price” for each series of old bonds will be a price per $1,000 principal amount of such old bonds (rounded to the nearest cent, with $0.005 being rounded to a full cent) intended to result in a yield to the final maturity (or, in the case of the September 2024 Bonds, a yield to September 25, 2023) of that series of old bonds on the settlement date equal to the sum of:
S-40
• the new global bond issue price; divided by
• $1,000.
SeriesSpecial Cash
Payment
2030 Bonds $ 207.002031 Bonds $ 167.00
• the applicable old bond exchange value for such series, determined as described below, divided by
• the applicable new global bond issue price, determined as described below.
• the old bond price for that series, minus
• in the case of an exchange of the 2030 Bonds or the 2031 Bonds, the special cash payment for that series.
• the reference yield for such series of old bonds, plus
• the old bond spread for such series of old bonds.
頁 40 / 247424(b)(3)
2014/03/12file:///C:/blp/data/CFd424b3.htm

Table of ContentsTable of ContentsTable of ContentsTable of Contents
The “reference yield” for each series of Group A Bonds other than the 2011 Bonds, will be equal to the rate, rounded to three decimal places (with 0.0005% rounded to 0.001%), determined by the dealer managers through linear interpolation of the mid-market US dollar interest rate swap rates for the maturities occurring immediately before and immediately after the final maturity date of that series of old bonds as displayed on the Bloomberg IRSB 18 screen at the pricing time on the announcement date. For purposes of linear interpolation, the time to maturity of each series of old bonds will be determined by calculating the number of days from the expected settlement date to the maturity date of the series of bonds, using the 30/360 day count method in accordance with market practice, and dividing the resulting number of days by 360. The calculation of the interpolated reference yield for the 2017 Bonds will be based on the final maturity date for those bonds of January 18, 2017, and not January 18, 2012, the date on which holders of those bonds may require the Republic to repurchase those bonds at par.
The “reference yield” for the 2011 Bonds will be equal to the 4-month US dollar LIBOR rate displayed on the Bloomberg BBAM1 screen (without rounding) at the pricing time on the announcement date, multiplied by 365 and divided by 360.
The “reference yield” for each series of Group B Bonds will be equal to the yield to final maturity of the Reopened 2034 Bonds on the settlement date (the “Reopening Yield of Reopened 2034 Bonds”), which shall be the sum of the reference yield for the Reopened 2034 Bonds, plusthe reopening spread for the Reopened 2034 Bonds.
The “old bond spread” for each series of Group A Bonds is specified below:
The “old bond spread” for each series of Group B Bonds is equal to the relative spread for the relevant series of Group B Bonds as specified below:
The Republic reserves the right to modify the fixed old bond spread for each series of Group A Bonds and the relative old bond spread for each series of Group B Bonds prior to 6:00 P.M., New York City time, on the business day immediately before the expiration date.
S-41
Series Fixed Spread
(in basis points)
2011 Bonds 52013 Bonds 252014 Bonds 702015 Bonds 70January 2016 Bonds 70October 2016 Bonds 732017 Bonds 90
Series Relative Spread
(in basis points)
January 2019 Bonds -165June 2019 Bonds -155September 2024 Bonds -93October 2024 Bonds -732025 Bonds -582030 Bonds -182031 Bonds -16
頁 41 / 247424(b)(3)
2014/03/12file:///C:/blp/data/CFd424b3.htm

Table of ContentsTable of ContentsTable of ContentsTable of Contents
Determination and Announcement of New Issue Spreads, New Global Bond Issue Prices and New 2021 Bond Coupon
The new global bond issue price for each series of new global bonds will be a price per $1,000 principal amount of such new global bonds (rounded to the nearest cent, with $0.005 being rounded to a full cent) intended to result in a yield to final maturity of that series of new global bonds on the settlement date equal to the sum of:
The “reference yield” for the New 2021 Bonds will be the rate, rounded to three decimal places (with 0.0005% rounded to 0.001%), determined by the dealer managers through linear interpolation of the mid-market US dollar interest rate swap rates for the maturities occurring immediately before and immediately after January 15, 2021, as displayed on the Bloomberg IRSB 18 screen at the pricing time on the announcement date.
The “reference yield” for the Reopened 2034 Bonds will be the yield to maturity, rounded to three decimal places (with 0.0005% rounded to 0.001%), calculated by the dealer managers in accordance with standard market practice, corresponding to the bid-side price of the U.S. Treasury 4.375% Bond due May 15, 2040, as displayed on the Bloomberg FIT1 screen at the pricing time on the announcement date.
The Republic’s calculation of the new global bond issue price for each series of new global bonds will be made in accordance with standard market practice and in a manner consistent with the methodology underlying the hypothetical calculations as described in Annex A to this prospectus supplement.
The indicative new issue spread (as defined below) and new issue spread for the New 2021 Bonds, and the indicative reopening spread (as defined below) and reopening spread for the Reopened 2034 Bonds are expected to each be within the ranges specified below:
At or around 6:00 P.M., New York City time, on the business day before the expiration date, or as soon as practicable thereafter, the Republic will determine in its sole discretion, and announce via press release to selected news services, the “indicative new issue spread” for the New 2021 Bonds and the “indicative reopening spread” for the Reopened 2034 Bonds, each of which is expected to be within the ranges specified above.
The spread for a series of new global bonds may be adjusted upward to permit the price for that series determined pursuant to the invitation to be equal to that price determined in connection with the cash offer, provided, however, that the new issue spread for the New 2021 Bonds announced on the announcement date may not be less than the indicative new issue spread and the reopening spread for the Reopened 2034 Bonds announced on the announcement date may not be less than the indicative reopening spread.
At or around 11:00 A.M., New York City time, on the announcement date, the Republic will, in its sole discretion:
S-42
• the reference yield for that series of new global bonds, plus
• in the case of New 2021 Bonds, the new issue spread (as defined below) for such bonds, and in the case of Reopened 2034 Bonds, the reopening spread (as defined below) for such bonds.
Series Spread Range
(in basis points)
New 2021 Bonds (new issue spread) 149 – 164Reopened 2034 Bonds (reopening spread) 148 – 163
• determine the reference yield for each series of old bonds and each series of new global bonds;
• determine the “new issue spread” for the New 2021 Bonds and the “reopening spread” for the Reopened 2034 Bonds;
• select the New 2021 Bond coupon, which is the interest rate on the New 2021 Bonds; and
• determine the new global bond issue price for each series of new global bonds.
頁 42 / 247424(b)(3)
2014/03/12file:///C:/blp/data/CFd424b3.htm

Table of ContentsTable of ContentsTable of ContentsTable of Contents
As soon as practical after these determinations and selections are made, which is expected to occur at 11:00 A.M., New York City time on the announcement date, the Republic will announce them by press release to the news services. If pricing is not completed by 3:00 P.M., New York City time on the announcement date, the Republic will announce an alternative target pricing time.
Methodology Generally; No Recommendation
The methodology that is ultimately used to calculate the consideration to be received pursuant to accepted exchange offers will represent one of several possible approaches and its formulation will have involved choices and judgments that are necessarily subjective. You should independently analyze the value of the old bonds of each series that you hold and the new global bonds and make an independent assessment of the terms of the invitation. None of the Republic, any dealer manager or the information and exchange agent has expressed any opinion as to whether the terms of the invitation are fair. None of the Republic, any dealer manager or the information and exchange agent makes any recommendation that you offer to exchange old bonds or refrain from offering to do so pursuant to the invitation, and no one has been authorized by the Republic, any dealer manager or the information and exchange agent to make any such recommendation.
Hypothetical Terms
Based on the assumptions described in Annex A, we have included in Annex A hypothetical exchange ratios and hypothetical reference yields, hypothetical new issue spreads, a hypothetical New 2021 Bond coupon, hypothetical new global bond issue prices and resulting hypothetical principal amounts of new global bonds that might be received in exchange for each $1,000 original principal amount of each series of old bonds exchanged in the invitation. These amounts are for illustrative purposes only. Actual amounts will likely differ from these hypothetical figures, and that difference may be material.
Offers Pursuant to the Invitation
General
The original principal amount of each series of old bonds you may offer for exchange must be an authorized denomination of the series of old bonds offered.
Minimum Offer Amount
Your exchange offer must be for at least US$100,000 in principal amount of each series of old bonds that you are submitting, except that if you are submitting 2011 Bonds in exchange for the Reopened 2034 Bonds, your exchange offer must be for at least US$120,000 in principal amount of 2011 Bonds, in all cases such amount the “minimum offer amount.” Holders will be unable to participate in the invitation if their ownership of old bonds is not large enough to meet this minimum offer amount requirement, or if proration would result in their accepted exchange offer not meeting this requirement. The minimum offer amount is applicable to each exchange offer submitted by, or on behalf of, one beneficial owner of the old bonds. Custodians may not aggregate exchange offers on behalf of multiple beneficial owners of the old bonds in order to meet the minimum offer amount. In addition, your exchange offer must be for a principal amount of US$1,000 multiples of each series of old bonds that you are submitting.
Holders’ Deemed Representations, Warranties and Undertakings
By submitting an exchange offer pursuant to the terms of the invitation, you are deemed to make certain acknowledgments, representations, warranties and undertakings to the Republic, the dealer managers and the information and exchange agent, including that, as of the time of submission of your exchange offer and on the settlement date:
S-43
(1) you have received and reviewed this prospectus supplement and the accompanying prospectus;
(2) you understand that your offer to exchange old bonds pursuant to any of the procedures set forth in this prospectus supplement and the accompanying prospectus will constitute your acceptance of the terms and conditions of the invitation;
頁 43 / 247424(b)(3)
2014/03/12file:///C:/blp/data/CFd424b3.htm

Table of ContentsTable of ContentsTable of ContentsTable of Contents
In addition, in submitting an exchange offer, you will be required to specify whether the beneficial owner of the new global bonds to be received if your offer is accepted is or is not a U.S. person (as defined in Regulation S under the Securities Act of 1933, as amended).
S-44
(3) you understand that once the Republic has announced by press release issued to the news services the acceptance of any exchange offers in accordance with the terms and conditions of the invitation, the Republic’s acceptance will be irrevocable, and the exchange offer you have made, as so accepted, constitutes a binding obligation on you and the Republic to settle the exchange;
(4) you own, or have confirmed that the party on whose behalf you are acting owns, the old bonds being offered, and have the full power and authority to offer for exchange the old bonds offered by you, and that if the same are accepted for exchange by the Republic pursuant to the invitation, the Republic will acquire good and marketable title thereto on the settlement date, free and clear of all liens, charges, claims, encumbrances, interests and restrictions of any kind;
(5) you will, upon request, execute and deliver any additional documents deemed by the information and exchange agent or the Republic to be necessary or desirable to complete such exchange;
(6) you acknowledge that your exchange offer constitutes an irrevocable offer to exchange the old bonds specified therein for new global bonds, on the terms and subject to the conditions of the invitation (and subject to the Republic’s right to terminate or amend the invitation and to your right to withdraw your exchange offer prior to 5:00 P.M, New York City time, on September 28, 2010, in either case in the manner specified in the invitation);
(7) you are a person for whom it is lawful to participate in the global bond offering under the applicable securities laws set forth in the “Jurisdictional Restrictions” section of this prospectus supplement;
(8) all questions as to the form of all documents and the validity (including time of receipt) and acceptance of exchange offers for old bonds will be determined by the Republic, in its sole discretion, which determination shall be final and binding;
(9) (a) if your old bonds are held through an account at DTC, you have submitted or caused to be submitted your offer to DTC electronically through DTC’s ATOP system in accordance with DTC’s normal procedures; or (b) if your old bonds are held through an account at Euroclear or Clearstream, Luxembourg, you have delivered or caused to be delivered bond instructions to Euroclear or Clearstream, Luxembourg, as the case may be, in accordance with normal procedures;
(10) you authorize the information and exchange agent, DTC, Euroclear and/or Clearstream, Luxembourg, as the case may be, to take those actions specified in this prospectus supplement and the accompanying prospectus with respect to the old bonds that are the subject of your exchange offer in connection with the invitation;
(11) you authorize the information and exchange agent to instruct DTC, Euroclear or Clearstream, Luxembourg, as appropriate, as to the aggregate original principal amount of your old bonds that are accepted for exchange by the Republic and represent that you have instructed DTC, Euroclear or Clearstream, Luxembourg, as the case may be, to credit any new global bonds issuable pursuant to your exchange offer(s) to the same account in which your old bonds being exchanged were held; and
(12) if you are submitting an exchange offer by or on behalf of a holder who (i) is located and/or resident in France or the United Kingdom, or (ii) holds the relevant old bonds or will hold the relevant new global bonds in France or the United Kingdom, you are deemed to make the applicable acknowledgments, representations, warranties and undertakings set forth in Annex B to this prospectus supplement.
頁 44 / 247424(b)(3)
2014/03/12file:///C:/blp/data/CFd424b3.htm

Table of ContentsTable of ContentsTable of ContentsTable of Contents
Procedures for the Submission of Offers
If you wish to submit an exchange offer, you or the custodial entity through which you hold your old bonds must submit, on or prior to 5:00 P.M., New York City time, on the expiration date, your exchange offer in the applicable manner described below.
Set forth below is a general description of certain procedures applicable to offers to exchange old bonds. It is your responsibility to inform yourself of, and arrange for timely offer of your old bonds in accordance with, the procedures and deadlines applicable to the clearing system through which you submit your offer.
Only a direct participant in a clearing system can properly instruct that clearing system with regard to submitting exchange offers. In so instructing, the direct participant, and the offering holder on whose behalf it is acting, will be deemed to have read and agreed to be bound by the terms and conditions contained in this prospectus supplement.
None of the Republic, any dealer manager or the information and exchange agent will be responsible for the communication of exchange offers by:
If you hold old bonds through a broker, dealer, commercial bank or financial institution, you should consult with that institution as to whether it will charge any service fees.
Old Bonds Held Directly Through DTC
If you hold your old bonds through DTC, you must arrange for a direct participant in DTC to submit your offer to DTC electronically through DTC’s ATOP system and follow the procedures for book-entry transfer set forth below. Only a direct participant in DTC may submit an offer through ATOP.
To validly offer old bonds through ATOP, a holder must, among other things, (i) indicate whether the holder is in the United States (as defined in Rule 902 under the U.S. Securities Act of 1933, as amended), (ii) indicate on a series-by-series basis the aggregate principal amount of old bonds it is tendering of each series, and (iii) if Group A Bonds are tendered, indicate on a series-by-series basis, the particular series of new global bonds that it wishes to receive in exchange for each series of Group A Bonds tendered.
DTC has confirmed that the invitation is eligible for ATOP. Accordingly, a DTC participant whose name appears on a security position listing as the holder of the old bonds must electronically transmit its submission of an exchange offer by causing DTC to irrevocably transfer the old bonds to the information and exchange agent’s ATOP account in accordance with DTC’s ATOP procedures for such a transfer. DTC will then send an Agent’s Message to the information and exchange agent.
The term “Agent’s Message” means a message transmitted by DTC and received by the information and exchange agent that forms a part of a book-entry confirmation, which states that DTC has received an express acknowledgment from the offering participant, which acknowledgment states that such participant has received and agrees to be bound by the terms of the invitation (as set forth in this prospectus supplement) and that the Republic may enforce such agreement against such participant. Holders who intend to offer their old bonds on the expiration date should allow sufficient time for completion of the ATOP procedures prior to 5:00 P.M., New York City time, on that date.
Although transfer of the old bonds to the information and exchange agent’s account at DTC may be effected through book-entry at DTC, an Agent’s Message must be transmitted by DTC and received by the information and exchange agent on or prior to the expiration date in order to validly offer your old bonds pursuant to the invitation.
S-45
• holders of old bonds to the direct participant in DTC, Euroclear or Clearstream, Luxembourg, through which they hold old bonds; or
• holders of old bonds or the direct participant to the information and exchange agent, DTC, Euroclear or Clearstream, Luxembourg.
頁 45 / 247424(b)(3)
2014/03/12file:///C:/blp/data/CFd424b3.htm

Table of ContentsTable of ContentsTable of ContentsTable of Contents
Your exchange offer must be submitted through DTC’s ATOP system in accordance with the deadlines and procedures established by DTC, and an Agent’s Message with respect to your exchange offer must be received by the information and exchange agent at or prior to 5:00 P.M., New York City time, on the expiration date.
If you are not a direct participant in DTC, you must ensure that the offer submitted through ATOP on your behalf by a direct participant can be reconciled with your exchange offer.
If you hold your old bonds through a custodian, you should contact that custodian to submit an exchange offer on your behalf. Alternatively, or in the event that your custodian is unable to submit an exchange offer on your behalf, you should contact the dealer managers for assistance in submitting your exchange offer.
Old Bonds Held Through Euroclear or Clearstream, Luxembourg
If you desire to submit an offer to exchange your old bonds and your old bonds are held through Euroclear or Clearstream, Luxembourg, you must deliver, or arrange for a direct participant in Euroclear or Clearstream, Luxembourg to deliver, bond instructions (as defined below) to Euroclear or Clearstream, Luxembourg in accordance with the deadlines specified by Euroclear or Clearstream, Luxembourg.
Only a direct participant in Euroclear or Clearstream, Luxembourg may submit an exchange offer by delivering bond instructions to Euroclear or Clearstream, Luxembourg. If you are not a direct participant in Euroclear or Clearstream, Luxembourg, you must ensure that the bond instructions transmitted through the Euroclear or Clearstream, Luxembourg, direct participant can be reconciled with your exchange offer.
Upon receipt of your bond instructions, Euroclear or Clearstream, Luxembourg will forward your bond instructions to the information and exchange agent.
“Bond instructions” means:
Your bond instructions must be delivered and received by Euroclear or Clearstream, Luxembourg in accordance with deadlines and procedures established by them and in any event prior to 5:00 P.M., New York City time, on the expiration date. You are responsible for informing yourself of these deadlines and for arranging the due and timely delivery of bond instructions to Euroclear or Clearstream, Luxembourg.
If you hold your old bonds through a custodian, you should contact that custodian to submit an exchange offer on your behalf. Alternatively, or in the event that your custodian is unable to submit an exchange offer on your behalf, you should contact the dealer managers for assistance in submitting your exchange offer.
Exchange Offers With Respect to Old Bonds Held by Custodians
If you own old bonds and hold your old bonds through a custodian, you may not tender into the exchange offer directly. Instead, you should contact that custodian to discuss which of the above options can be used by
S-46
• irrevocable instructions to transmit your exchange offer details to the information and exchange agent, including the principal amount and series of old bonds you are offering to exchange;
• irrevocable instructions to block your old bonds;
• irrevocable instructions to debit your account on the settlement date in respect of all of your old bonds or in respect of such lesser portion of your old bonds as are accepted for exchange by the Republic;
• an irrevocable authorization to disclose the name of the account holder, whether the beneficial owner is in the United States (as defined in Rule 902 under the U.S. Securities Act of 1933, as amended) and information about the foregoing instructions to the information and exchange agent; and
• a confirmation that the direct participant is making the acknowledgments, representations, warranties and undertakings set forth in the invitation.
頁 46 / 247424(b)(3)
2014/03/12file:///C:/blp/data/CFd424b3.htm

Table of ContentsTable of ContentsTable of ContentsTable of Contents
you and your custodian to submit exchange offers on your behalf. In the event that your custodian is unable to submit an exchange offer on your behalf by one of the methods described herein, you should contact the information and exchange agent or the dealer managers for assistance in submitting your exchange offer. There can be no assurance that any of them will be able to assist you in successfully submitting your exchange offer.
Custodians, direct participants and clearing systems might have deadlines prior to the expiration date for receiving instructions and should be contacted by you as soon as possible to ensure the proper and timely delivery of instructions. Holders who hold old bonds through Euroclear or Clearstream, Luxembourg are urged to submit their old bonds for tender at least one day in advance of the expiration date to avoid delays that might affect the valid tender of their old bonds.
Irrevocability; Withdrawal Rights
Your offer will become irrevocable upon the expiration of the invitation on the expiration date, which unless extended or earlier terminated by the Republic shall be at 5:00 P.M., New York City time, on September 28, 2010, the scheduled expiration date. However, properly withdrawn exchange offers may be re-submitted by following one of the procedures described under “Procedures for the Submission of Offers” at any time before the expiration of the invitation on the expiration date. The Republic may, but will not be required to, extend withdrawal rights if it extends the expiration date.
If the Republic terminates the invitation without accepting any exchange offers, all exchange offers shall automatically be deemed to be withdrawn. If the Republic accepts any exchange offers, any exchange offers not so accepted shall automatically be deemed to be withdrawn. Old bonds held through DTC, Euroclear or Clearstream, Luxembourg and not accepted for exchange by the Republic will be returned to the originating accounts as soon as practicable, in accordance with the normal procedures of the relevant clearing system.
Any old bonds properly withdrawn will be deemed not to have been validly tendered for purposes of the invitation. You may withdraw an offer of old bonds only in accordance with the following procedures.
Procedures for Withdrawing Offers with Respect to Bonds Held Through DTC
ATOP instructions cannot be revised. However, if you hold your old bonds through DTC, you may withdraw your exchange offer through the submission of an Agent’s Message through, and in accordance with, the withdrawal procedures applicable to DTC’s ATOP system prior to 5:00 P.M., New York City time, on September 28, 2010. Any notice of withdrawal must (1) specify the name, address and telephone number of the holder and DTC participant that submitted your exchange offer, (2) identify the series, ISIN number(s) and the aggregate principal amount of the old bonds as to which the offer is withdrawn and (3) contain information sufficient to reconcile such withdrawal with the original exchange offer.
If you have requested that a custodian submit an offer to exchange old bonds on your behalf and you would like to withdraw your offer, you should contact such custodian and request it to so withdraw the offer prior to 5:00 P.M., New York City time, on September 28, 2010. You should be aware, however, that the custodian may impose earlier deadlines for withdrawing an exchange offer in accordance with its procedures.
Procedures for Withdrawing Offers with Respect to Bonds Held Through Euroclear or Clearstream, Luxembourg
If you hold your old bonds through Euroclear or Clearstream, Luxembourg, you may withdraw your bond instructions prior to 5:00 P.M., New York City time, on September 28, 2010. For a withdrawal of an offer to exchange old bonds to be effective, the information and exchange agent must receive an electronic withdrawal instruction, by a properly transmitted message, submitted by or on behalf of the withdrawing holder in accordance with the procedures of the relevant clearing system.
S-47
頁 47 / 247424(b)(3)
2014/03/12file:///C:/blp/data/CFd424b3.htm

Table of ContentsTable of ContentsTable of ContentsTable of Contents
If you have requested that a custodian submit an offer to exchange old bonds on your behalf and you would like to withdraw your offer, you should contact such custodian and request it to so withdraw the offer prior to 5:00 P.M., New York City time, on September 28, 2010. You should be aware, however, that the custodian and clearing system may impose earlier deadlines for withdrawing an offer in accordance with its procedures.
Discretion on the Part of the Republic; Selection of Principal Amounts in Connection with the Invitation
The Republic reserves the right in its sole discretion not to accept any exchange offers. If the Republic determines to accept any exchange offers submitted pursuant to the invitation for a series of new global bonds, it will, as soon as practicable after selecting the New 2021 Bond coupon and determining the new issue spreads and the new global bond issue prices for each series of new global bonds, on the announcement date, select in its sole discretion:
Acceptance of Offers; Proration
Once the Republic selects the applicable new issue spreads and determines the principal amounts as described above, the Republic will, for each series of old bonds as to which it has decided to accept any exchange offers, accept the lesser of:
If the aggregate principal amount of old bonds of any series that were validly offered for exchange would exceed the total principal amount of such series of old bonds that the Republic has determined in its sole discretion to accept pursuant to the invitation, the Republic will decrease, pro rata, the principal amount of old bonds of such series it will accept for exchange pursuant to valid exchange offers, rounded downward to the nearest integral multiples of US$1,000.
The Republic need not treat all series of old bonds equally in applying the proration rules set forth above. For example, the Republic could decrease to zero the amount of valid offers of one series of old bonds that it will accept for exchange, while accepting in full all valid offers of another series of old bonds. Furthermore, the Republic may apply separate proration factors for each series of Group A Bonds, depending upon whether such old bonds were tendered in exchange for New 2021 Bonds or Reopened 2034 Bonds. For example, the Republic could accept in full a particular series of Group A Bonds that were validly offered in exchange for Reopened 2034 Bonds, without accepting any amount of that series of Group A Bonds that were validly offered in exchange for New 2021 Bonds.
Once the Republic has announced, by press release issued to the news services, the acceptance of any exchange offers in accordance with the terms of the invitation, the Republic’s acceptance will be irrevocable. Exchange offers, as so accepted, will constitute binding obligations of the submitting holders of old bonds and the Republic to settle the exchange in the manner described in “—Settlement.”
The maximum principal amount of new global bonds that the Republic will issue pursuant to the global bond offering is $3,000,000,000. If the Republic issues any New 2021 Bonds pursuant to the global bond offering, the minimum principal amount of New 2021 Bonds to be issued will be $500,000,000. There is no minimum issue size of the Reopened 2034 Bonds, because on October 24, 2010 they will become fungible with the Republic’s outstanding 6.375% Global Bonds due 2034.
S-48
• the aggregate principal amount of old bonds of each series (which could be zero) accepted in exchange for new global bonds; and
• the aggregate principal amount of new global bonds to be issued pursuant to the invitation (which could be zero).
• all valid offers for such series of old bonds; and
• the amount of exchange offers corresponding to the total principal amount of such series of old bonds that the Republic has determined in its sole discretion to accept pursuant to the invitation.
頁 48 / 247424(b)(3)
2014/03/12file:///C:/blp/data/CFd424b3.htm
Table of ContentsTable of ContentsTable of ContentsTable of Contents
Irregularities
All questions regarding the validity, form and eligibility, including time of receipt or revocation or revision, of any exchange offer will be determined by the Republic in its sole discretion, which determination will be final and binding. The Republic reserves the absolute right to reject any and all exchange offers not in proper form or for which any corresponding agreement by the Republic to exchange may, in the opinion of the Republic’s counsel, be unlawful. The Republic reserves the absolute right to waive any of the conditions of the invitation or defects in exchange offers. None of the Republic, any dealer manager or the information and exchange agent shall be under any duty to give notice to you, as the offering holder of old bonds, of any irregularities in exchange offers or exchanges, nor shall any of them incur any liability for the failure to give such notice.
Participation by the Republic or Governmental Agencies of the Republic
The Republic and any governmental agency of the Republic may submit exchange offers.
A “governmental agency of the Republic” means any governmental agency, including Bangko Sentral, the central bank of the Republic, any institution under the direct or indirect control of the Republic or any governmental agency acting at the direction of, or on behalf of, the Republic. Regulation of financial institutions in the Republic by regulatory authorities of the Republic does not constitute control for this purpose.
Participation by the Dealer Managers
The dealer managers will be permitted to submit exchange offers as holders of old bonds and to facilitate settlement of certain exchange offers. The Republic will not require the dealer managers to deliver ATOP instructions or bond instructions with respect to the old bonds subject to their exchange offers prior to the end of the submission period.
Term of Invitation, Termination and Amendments
The invitation will expire at 5:00 P.M., New York City time, on September 28, 2010, unless the Republic in its sole discretion extends it or terminates it earlier.
At any time before the Republic announces, on the announcement date, the acceptance of any exchange offers by press release issued to the news services, the Republic may, in its sole discretion:
In the event of such termination or amendments, the Republic will make an announcement to that effect by press release issued to the news services.
The Cash Offering; Discretion on the Part of the Republic
Pursuant to the cash offering, the Republic will have the right to issue and offer to sell additional new global bonds of either series for cash to the dealer managers for resale.
The Republic reserves the right in its sole discretion not to issue any new global bonds of either or both series pursuant to the cash offering. If the Republic and the dealer managers determine that, pursuant to the cash offering, the Republic will issue and sell new global bonds to the dealer managers for resale, the Republic and the dealer managers will determine by negotiation the series and the aggregate principal amount of new global bonds to be so issued and sold, although the aggregate principal amount of the global bond offering will not exceed $3,000,000,000.
S-49
• terminate the invitation, including with respect to exchange offers submitted prior to the time of the termination;
• extend the invitation past the originally scheduled expiration date; or
• amend the invitation from time to time in any fashion.
頁 49 / 247424(b)(3)
2014/03/12file:///C:/blp/data/CFd424b3.htm

Table of ContentsTable of ContentsTable of ContentsTable of Contents
As soon as practicable after selecting the New 2021 Bond coupon and the new global bond issue price for each series of new global bonds on the announcement date, the Republic will select and announce by press release issued to the news services the series and the aggregate principal amount of new global bonds to be issued and sold for cash pursuant to the cash offering.
In addition, the Republic will prepare a second prospectus supplement containing the final pricing information for the new global bonds, which will be filed with the Luxembourg Stock Exchange and will be made available at the office of the Luxembourg paying and transfer agent.
The initial public offering price per $1,000 principal amount of each series of new global bonds to be sold pursuant to the cash offering will be equal to the new global bond issue price for that series of new global bonds. For additional information about the cash offering, see “Plan of Distribution.”
Minimum Issue Size of New Global Bonds
The Republic will issue at least $500,000,000 aggregate principal amount of the New 2021 Bonds, if any New 2021 Bonds are issued. There is no minimum issue size of the Reopened 2034 Bonds, because on October 24, 2010 they will become fungible with the Republic’s outstanding 6.375% Global Bonds due 2034. The Republic reserves the right, in its sole discretion, not to issue any new global bonds of either or both series pursuant to the invitation or the cash offering.
Announcements
Approximately two hours after the Republic announces the new global bond pricing and New 2021 Bond coupon, which is expected to be approximately 1:00 P.M., New York City time on the announcement date, or as soon as practicable thereafter, the Republic will announce by press release to the news services:
You may also obtain this information by contacting a dealer manager. The Republic will notify the Luxembourg Stock Exchange of the results of the global bond offering and, subject to rules of the Luxembourg Stock Exchange, will publish such information as described in “—Publication.”
S-50
• the reference yield for each series of old bonds and each series of new global bonds;
• the new issue spread for the New 2021 Bonds and the reopening spread for the Reopened 2034 Bonds;
• the New 2021 Bond coupon;
• the new global bond issue price for each series of the new global bonds;
• the old bond price, old bond exchange value and the exchange ratio for each series of old bonds accepted for exchange pursuant to the invitation;
• the amount of the special cash payment for each of the 2030 Bonds and the 2031 Bonds;
• the preliminary aggregate principal amount of old bonds of each series accepted for exchange in the invitation (which could be zero);
• the preliminary aggregate principal amount of new global bonds to be issued in exchange for each series of old bonds accepted for exchange (which could be zero);
• the preliminary aggregate principal amount of old bonds of each series that will remain outstanding following the invitation;
• information concerning any applicable proration; and
• the aggregate principal amount of each series of new global bonds to be issued pursuant to the cash offering (which could be zero).
頁 50 / 247424(b)(3)
2014/03/12file:///C:/blp/data/CFd424b3.htm

Table of ContentsTable of ContentsTable of ContentsTable of Contents
Conditions to the Invitation
The Republic reserves the right, in its sole discretion, not to accept any exchange offer, or to accept exchange offers for one series of new global bonds but not the other series, for any reason. In addition, notwithstanding any other provisions of the invitation, the invitation is conditioned upon there not having been threatened, instituted or pending any action or proceeding before any court or governmental, regulatory or administrative body that: (1) makes or seeks to make illegal the acceptance for exchange any of the old bonds, or the delivery of new global bonds or any cash payments, pursuant to the invitation; (2) would or might result in a delay in, or restrict, the ability of the Republic to accept for exchange or exchange any of the old bonds or to deliver the new global bonds or any cash payments; or (3) imposes or seeks to impose limitations on the ability of the Republic to acquire or cancel the old bonds or to issue the new global bonds.
Each of the foregoing conditions is for the sole benefit of the Republic and may be waived by the Republic, in whole or in part, at any time and from time to time, in its discretion. Any determination by the Republic concerning the conditions set forth above (including whether or not any such condition has been satisfied or waived) will be final and binding upon all parties.
Publication
Information about the global bond offering will, to the extent provided in this prospectus supplement, be published by press release issued to the news services. In addition, the Republic will, subject to the rules of the Luxembourg Stock Exchange, publish a notice in a leading newspaper of general circulation in Luxemburg, which is expected to be the d’Wort, or on the website of the Luxembourg Stock Exchange.
Settlement
The settlement date for the global bond offering will be the fifth business day in New York City following the announcement date. Under the current schedule, the settlement date will be October 6, 2010. Bondholder Communications Group, LLC will act as information and exchange agent in connection with new global bonds issued pursuant to accepted exchange offers.
On the settlement date:
In return you will receive, as applicable:
If you are purchasing new global bonds for cash pursuant to the cash offering, you will pay the purchase price in immediately available funds, in accordance with standard settlement procedures applicable to global bond offerings, and in return you will receive, solely by credit to the account designated to the dealer managers, the new global bonds to which you are entitled all in accordance with and subject to the terms and conditions of the underwriting agreement to be entered into among the Republic and the dealer managers in connection with the cash offering.
S-51
• If the Republic has accepted your exchange offer, you, as the identified account holder, or DTC, Euroclear or Clearstream, Luxembourg, on your behalf, as the case may be, must deliver to the Republic good and marketable title to your old bonds, free and clear of all liens, charges, claims, encumbrances, interests, rights of third parties and restrictions of any kind.
• solely by credit to the same DTC, Euroclear or Clearstream, Luxembourg, account in which your old bonds being exchanged were held, the new global bonds to which you are entitled; and
• solely by credit to the same DTC, Euroclear or Clearstream, Luxembourg, account in which your old bonds being exchanged were held, any cash payments to which you are entitled pursuant to the terms of the invitation.
頁 51 / 247424(b)(3)
2014/03/12file:///C:/blp/data/CFd424b3.htm

Table of ContentsTable of ContentsTable of ContentsTable of Contents
The determination by the Republic of the consideration to be received by the bondholders and any other calculation or quotation made with respect to the global bond offering shall be conclusive and binding on you, absent manifest error.
See “Global Clearance and Settlement” for a description of settlement procedures.
Market for the Old Bonds and New Global Bonds
The Republic intends to cancel all old bonds acquired by it pursuant to the invitation. Accordingly, the exchange of old bonds of any series pursuant to the invitation will reduce the aggregate original principal amount of old bonds of that series that otherwise might trade in the public market, which could adversely affect the liquidity and market value of the remaining old bonds of that series not offered or accepted pursuant to the invitation. Old bonds not exchanged pursuant to the invitation will remain outstanding.
The New 2021 Bonds are a new issue of securities with no established trading market. The dealer managers have advised the Republic that they intend to make a market in each series of the new global bonds but are not obligated to do so and may discontinue market making at any time without notice. Application has been made to admit the new global bonds to listing on the Official List of the Luxembourg Stock Exchange and to trading on the EuroMTF Market. No assurance can be given as to the liquidity of the trading market for either series of the new global bonds. The price at which each series of new global bonds will trade in the secondary market is uncertain.
Certain Other Matters
The Republic reserves the right following completion or cancellation of the global bond offering to offer to exchange or buy old bonds or sell new securities (including additional new global bonds), or to issue a new invitation to submit offers to exchange or sell old bonds or to purchase new securities, in each case on terms that may be more or less favorable than those contemplated by this global bond offering. The making of any such new offers and the making of any new invitation will depend on various factors, including interest rates prevailing at such time and the original principal amount of old bonds retired pursuant to this invitation.
S-52
頁 52 / 247424(b)(3)
2014/03/12file:///C:/blp/data/CFd424b3.htm

Table of ContentsTable of ContentsTable of ContentsTable of Contents
THE OLD BONDS
The following chart summarizes information with respect to each series of the old bonds:
Principal Features of the Old Bonds
S-53
Series ISINInterest
Payment Dates Issue Date Maturity Date
OutstandingPrincipalAmount
MinimumDenomination
/Increment (US$)
Group A Bonds8.375% Bonds due 2011 US718286AV96 February 15 and August 15
of each yearFebruary 26, 2004 February 15, 2011 $1,484,215,000 $2,000/
$1,0009.000% Bonds due 2013 US718286AT41 February 15 and August 15
of each yearNovember 25, 2002 February 15, 2013 $948,383,000 $1,000/
$1,0008.250% Bonds due 2014 US718286AU14 January 15 and July 15 of
each yearJuly 15, 2003 January 15, 2014 $1,601,622,000 $2,000/
$1,0008.875% Bonds due 2015 US718286AW79 March 17 and September 17
of each yearMarch 17, 2004 March 17, 2015 $976,414,000 $2,000/
$1,0008.000% Bonds due 2016 US718286BA41 January 15 and July 15 of
each yearSeptember 14, 2005 January 15, 2016 $1,300,000,000 $100,000/
$1,0008.750% Bonds due 2016 US718286AC16
USY6972CAJ63
April 7 and October 7 of each year
October 10, 1996 October 7, 2016 $629,703,000 $250,000/
$10,000
$1,000/$1,000
9.375% Bonds due 2017 US718286AQ02 July 18 and January 18 of each year
January 18, 2002 January 18, 2017 $822,381,000 $1,000/$1,000
Group B Bonds9.875% Bonds due 2019 US718286AK32 July 15 and January 15 of
each yearJanuary 15, 1999 January 15, 2019 $962,468,000 $1,000/
$1,0008.375% Bonds due 2019 US718286BE62 June 17 and December 17
of each yearJanuary 14, 2009 June 17, 2019 $1,500,000,000 $100,000/
$1,0007.500% Bonds due 2024 US718286BC07 March 25 and September 25
of each yearSeptember 25, 2006 September 25,
2024$774,204,000 $100,000/
$1,0009.500% Bonds due 2024 US718286AL15 April 21 and October 21 of
each yearOctober 21, 1999 October 21, 2024 $480,406,000 $1,000/
$1,00010.625% Bonds due 2025 US718286AP29 March 16 and September 16
of each yearMarch 16, 2000 March 16, 2025 $1,854,744,000 $1,000/
$1,0009.500% Bonds due 2030 US718286AY36 February 2 and August 2 of
each yearFebruary 2, 2005 February 2, 2030 $2,000,000,000 $2,000/
$2,0007.750% Bonds due 2031 US718286BB24 January 14 and July 14 of
each yearJanuary 11, 2006 January 14, 2031 $2,384,506,000 $100,000/
$1,000
(1) ISIN corresponding to restricted global bonds of this series.
(2) ISIN corresponding to Regulation S global bonds of this series.
(15)
(5)
(15)
(6)
(15) (7)
(15) (8)
(16)
(9)
(15)
(1)
(2)
(17)
(18)
(15) (10)
(3)
(15) (11)
(16)
(16)
(4)
(15)
(15) (12)
(15) (13)
(16) (14)
頁 53 / 247424(b)(3)
2014/03/12file:///C:/blp/data/CFd424b3.htm

Table of ContentsTable of ContentsTable of ContentsTable of Contents
The aggregate principal balance of all of the old bonds currently outstanding is approximately $17.72 billion.
Each series of old bonds constitutes direct, general, and unconditional External Public Indebtedness (as defined in the accompanying prospectus) of the Republic. None of the old bonds are listed on the Philippine Stock Exchange. All of the old bonds are listed on the Luxembourg Stock Exchange. Certain of the old bonds are admitted to trading on the regulated market of the Luxembourg Stock Exchange, while others are admitted to trading on the EuroMTF market, as indicated in the preceding table. Certain of the old bonds are not “collective action securities,” while the new global bonds will contain collective action clauses. See “Description of the New Global Bonds—General.”
The Republic will cancel any old bonds that it may acquire pursuant to the invitation. Accordingly, the exchange of old bonds pursuant to this invitation will reduce the aggregate principal amount of old bonds that otherwise might trade in the public market, which could adversely affect the liquidity and market value of the remaining old bonds that the Republic does not acquire pursuant to the invitation.
The above information regarding the old bonds other than the October 2016 Bonds is qualified in its entirety by the forms of those old bonds and the fiscal agency agreement, copies of which are on file and available at the offices of the fiscal agent, The Bank of New York Mellon (as successor in interest to JPMorgan Chase Bank, N.A.), and the information and exchange agent.
The information herein regarding the October 2016 Bonds is qualified in its entirety by the forms of such old bonds, the trust deed dated October 7, 1996, between the Republic and Citibank, N.A. (as successor to Morgan Guaranty Trust Company of New York, London Office), and the agency agreement dated October 7, 1996, between the Republic, Citibank, N.A. (as successor to Morgan Guaranty Trust Company of New York, London Office), the initial principal paying agent, the registrar and the transfer and paying agents named therein; copies of which are on file and available at the offices of Citibank, N.A. and the information and exchange agent.
S-54
(3) Holders of this series of bonds may require the Republic to repurchase their bonds at par on January 18, 2012.
(4) Payment of the principal amount of this series of bonds will be made in three equal installments on September 26, 2022, September 25, 2023 and September 25, 2024, respectively.
(5) Reopened on May 4, 2004.
(6) Reopened on January 13, 2003.
(7) Reopened on October 23, 2003 and May 4, 2004.
(8) Reopened on September 17, 2004 and May 16, 2005.
(9) Reopened on August 1, 2006.
(10) Reopened on July 7, 2004.
(11) Reopened on February 16, 1999 and December 22, 1999.
(12) Reopened on October 23, 2003 and September 17, 2004.
(13) Reopened on May 16, 2005.
(14) Reopened on August 1, 2006 and September 25, 2006.
(15) Admitted to trading on the regulated market of the Luxembourg Stock Exchange.
(16) Admitted to trading on the EuroMTF market.
(17) Minimum denomination/increment corresponding to restricted global bonds of this series.
(18) Minimum denomination/increment corresponding to Regulation S global bonds of this series.
頁 54 / 247424(b)(3)
2014/03/12file:///C:/blp/data/CFd424b3.htm

Table of ContentsTable of ContentsTable of ContentsTable of Contents
DESCRIPTION OF THE NEW GLOBAL BONDS
General
The new global bonds will be issued under a fiscal agency agreement, dated as of October 4, 1999, as supplemented by supplement no.1 to the fiscal agency agreement dated February 26, 2004 and supplement no. 2 to the fiscal agency agreement dated January 11, 2006 and in the case of the Reopened 2034 Bonds, a supplement to the fiscal agency agreement to be dated the settlement date, between the Republic and The Bank of New York Mellon (as successor in interest to JPMorgan Chase Bank, N.A.), as fiscal agent. Each series of the new global bonds will be series of debt securities as more fully described in the accompanying prospectus, except to the extent indicated below. The following statements are subject to the provisions of the fiscal agency agreement, the supplements to the fiscal agency agreement and the new global bonds. This summary does not purport to be complete and the description below may not contain all of the information that is important to you as a potential investor in the new global bonds. The Republic has filed forms of these documents as exhibits to the registration statement numbered 333-163671. You should refer to the exhibits to that registration statement for more complete information. Capitalized terms not defined below shall have the respective meanings given in the accompanying prospectus.
The new global bonds will:
The new global bonds will be designated Collective Action Securities, and, as such, will contain provisions regarding default, acceleration, voting on amendments, modifications, changes, waivers and future issues of new global bonds that differ from those currently applicable to many of the Republic’s outstanding External Public Indebtedness. Under these provisions, which are commonly referred to as “collective action clauses,” the Republic may, among other things, amend certain key terms of a series of new global bonds, including the maturity date, interest rate and other payment terms, with the consent of the holders of not less than 75% of the aggregate principal amount of the outstanding new global bonds of that series. Those provisions are described in the section entitled “Collective Action Securities” on page 113 of the accompanying prospectus.
Application has been made to admit the new global bonds of each series to listing on the Official List of the Luxembourg Stock Exchange and to trading on the EuroMTF Market. We cannot guarantee that the application to the Luxembourg Stock Exchange will be approved, and settlement of the new global bonds is not conditioned on obtaining the listing.
Terms of the New 2021 Bonds
The New 2021 Bonds will:
S-55
• be issued in denominations of $100,000 and integral multiples of $1,000 in excess thereof;
• constitute direct, unconditional, unsecured and general obligations of the Republic; and
• rank at least equally among themselves and with all other unsecured and unsubordinated External Indebtedness (as defined in the accompanying prospectus) of the Republic.
• bear interest at the New 2021 Bond coupon from the settlement date;
• have a final maturity date of January 15, 2021;
• pay interest on January 15 and July 15 of each year, commencing on January 15, 2011. The New 2021 Bonds will have a short first coupon, the first interest payment will be made on January 15, 2011, in respect of the period from (and including) the settlement date to (but excluding) January 15, 2011; and
• pay interest to the persons in whose names the New 2021 Bonds are registered on the record date, which is the close of business on the preceding January 10 or July 10 (whether or not a business day), as the case may be. Interest will be calculated on the basis of a 360-day year, consisting of twelve 30-day months.
頁 55 / 247424(b)(3)
2014/03/12file:///C:/blp/data/CFd424b3.htm

Table of ContentsTable of ContentsTable of ContentsTable of Contents
Terms of the Reopened 2034 Bonds
The Reopened 2034 Bonds will:
Book Entry
The Republic will issue the new global bonds of each series in the form of fully registered global securities. The Republic will deposit the global securities with DTC and register the global securities in the name of Cede & Co., as DTC’s nominee. Beneficial interests in the global securities will be represented by, and transfers thereof will be effected only through, book-entry accounts maintained by DTC and its participants.
You may hold your beneficial interests in a global security through Euroclear or Clearstream, Luxembourg, or indirectly through organizations that are participants in such systems. Euroclear and Clearstream, Luxembourg will hold their participants’ beneficial interests in a global security in their customers’ securities accounts with the Clearing System Depositaries. The Clearing System Depositaries in turn will hold such interests in their customers’ securities accounts with DTC.
Certificated Securities
In circumstances detailed in the accompanying prospectus (see “Description of the Securities—Description of the Debt Securities—Global Securities—Registered Ownership of the Global Security”), the Republic could issue certificated securities. The Republic will issue certificated securities only in fully registered form in minimum denominations of $100,000 and integral multiples of $1,000 in excess thereof. The holders of certificated securities shall present directly at the corporate trust office of the fiscal agent, at the office of the Luxembourg paying and transfer agent or at the office of any other transfer agent as the Republic may designate from time to time all requests for the registration of any transfer of such securities, for the exchange of such securities for one or more new certificated securities in a like aggregate principal amount and in authorized denominations and for the replacement of such securities in the cases of mutilation, destruction, loss or theft. Certificated securities issued as a result of any partial or whole transfer, exchange or replacement of the new global bonds will be delivered to the holder at the corporate trust office of the fiscal agent, at the office of the Luxembourg paying and transfer agent or at the office of any other transfer agent, or (at the risk of the holder) sent by mail to such address as is specified by the holder in the holder’s request for transfer, exchange or replacement.
S-56
• bear interest at 6.375% from the settlement date;
• have a final maturity date of October 23, 2034;
• pay interest on April 23 and October 23 of each year, commencing on October 23, 2010. The Reopened 2034 Bonds will have a short first coupon, the first interest payment will be made on October 23, 2010 in respect of the period from (and including) the settlement date to (but excluding) October 23, 2010, and will be payable to the persons who are registered holders of the Reopened 2034 Bonds at the close of business on the settlement date;
• for subsequent interest payments, pay interest to the persons in whose names the Reopened 2034 Bonds are registered on the record date, which is the close of business on the preceding March 31 or September 30 (whether or not a business day), as the case may be. Interest will be calculated on the basis of a 360-day year, consisting of twelve 30-day months; and
• constitute a further issuance of, and on October 24, 2010 become fungible with and be consolidated and form a single series with, the 6.375% Global Bonds due 2034 issued by the Republic on October 23, 2009 in the amount of $1,000,000,000 and reopened on January 13, 2010, in the amount of $850,000,000. Prior to October 24, 2010 the Reopened 2034 Bonds will bear different securities codes and trade separately from those previously issued 6.375% Global Bonds due 2034. Upon issuance, the Reopened 2034 Bonds will rank pari passu with the previously issued 6.375% Global Bonds due 2034 in all respects.
頁 56 / 247424(b)(3)
2014/03/12file:///C:/blp/data/CFd424b3.htm

Table of ContentsTable of ContentsTable of ContentsTable of Contents
Registration and Payments
The Republic will pay the principal amount of the new global bonds of each series on their scheduled maturity dates in immediately available funds in the City of New York upon presentation of the new global bonds at the office of the fiscal agent in the City of New York or, subject to applicable law and regulations, at the office outside the United States of any paying agent, including the Luxembourg paying agent (if the new global bonds are traded on the EuroMTF Market and the rules of the Luxembourg Stock Exchange so require).
The Republic will appoint the fiscal agent as registrar, principal paying agent and transfer agent of the new global bonds of each series. In these capacities, the fiscal agent will, among other things:
For as long as the new global bonds are traded on the EuroMTF Market, and the rules of the Luxembourg Stock Exchange so require, the Republic will appoint and maintain a Luxembourg paying and transfer agent, who shall initially be The Bank of New York (Luxembourg) S.A. Payments and transfers with respect to the new global bonds may be effected through the Luxembourg paying and transfer agent, which will be executed through Euroclear and Clearstream, Luxembourg. Holders of certificated new global bonds may present such securities for registration of transfer or payment at the office of the Luxembourg paying and transfer agent. Forms of the transfer notice (or other instrument of transfer) are available, and duly completed transfer notices (or other instrument of transfer) may be submitted, at the office of the Luxembourg paying and transfer agent. For so long as the new global bonds are traded on the EuroMTF Market, the Republic will publish any change as to the identity of the Luxembourg paying and transfer agent in a leading newspaper in Luxembourg or on the website of the Luxembourg Stock Exchange.
Redemption and Sinking Fund
The Republic may not redeem the new global bonds prior to their scheduled maturity. The Republic will not provide a sinking fund for the amortization and retirement of the new global bonds.
Regarding the Fiscal Agent
The fiscal agent has its principal corporate trust office at 101 Barclay Street, New York, New York 10286. The Republic will at all times maintain a paying agent and a transfer agent in the City of New York which will, unless otherwise provided, be the fiscal agent. The Republic may maintain deposit accounts and conduct other banking transactions in the ordinary course of business with the fiscal agent. The fiscal agent will be the agent of the Republic, not a trustee for holders of any new global bonds. Accordingly, the fiscal agent will not have the same responsibilities or duties to act for such holders as would a trustee, except that all funds held by the fiscal agent for the payment of principal, and premium, if any, or interest on the new global bonds of either series shall be held by the fiscal agent in trust for the holders of the global bonds. Neither the fiscal agent nor the Luxembourg paying and transfer agent will have any responsibility or liability in relation to payments of principal and interest.
S-57
• maintain a record of the aggregate holdings of each series of new global bonds represented by the global securities of the relevant series and any certificated securities of the relevant series and accept new global bonds for exchange and registration of transfer;
• ensure that payments of principal and interest in respect of the new global bonds of each series received by the fiscal agent from the Republic are duly paid to the depositaries for the global securities of the relevant series or their respective nominees and any other holders of any new global bonds of the relevant series; and
• transmit to the Republic any notices received from holders of any of the new global bonds.
頁 57 / 247424(b)(3)
2014/03/12file:///C:/blp/data/CFd424b3.htm
Table of ContentsTable of ContentsTable of ContentsTable of Contents
The fiscal agency agreement and the supplements to the fiscal agency agreement are not required to be qualified under the U.S. Trust Indenture Act of 1939. Accordingly, the fiscal agency agreement and the supplements to the fiscal agency agreement may not contain all of the provisions which could be beneficial to holders of the global bonds which would be contained in an indenture qualified under the Trust Indenture Act.
Notices
All notices will be mailed to the registered holders of the new global bonds. If a depositary is the registered holder of the global bonds, each beneficial holder must rely on the procedures of the depositary and its participants to receive notice, subject to any statutory or regulatory requirements.
So long as the new global bonds are traded on the EuroMTF Market, and the rules of the Luxembourg Stock Exchange so require, all notices to the holders of the new global bonds will be published in a leading newspaper of general circulation in Luxembourg or on the website of the Luxembourg Stock Exchange (www.bourse.lu). Information on the website of the Luxembourg Stock Exchange is not incorporated by reference into this prospectus supplement. The Republic expects that it will initially make this publication on the website of the Luxembourg Stock Exchange. If publication as described above is not practicable, notice will be considered to be validly given if made in accordance with the rules of the Luxembourg Stock Exchange.
S-58
頁 58 / 247424(b)(3)
2014/03/12file:///C:/blp/data/CFd424b3.htm

Table of ContentsTable of ContentsTable of ContentsTable of Contents
GLOBAL CLEARANCE AND SETTLEMENT
The Depository Trust Company (“DTC”), Euroclear Bank, S.A./N.V. (“Euroclear”) and Clearstream Banking, société anonyme(“Clearstream, Luxembourg”) have established links among themselves to facilitate the initial settlement of the global bonds and cross-market transfers of the global bonds in secondary market trading. DTC will be linked to The Bank of New York, a New York banking corporation, as depositary of Euroclear, and Citibank, N.A., as depositary for Clearstream, Luxembourg (the “Clearing System Depositaries”).
Although DTC, Euroclear and Clearstream, Luxembourg have agreed to the procedures provided below to facilitate transfers of global bonds among participants of DTC, Euroclear and Clearstream, Luxembourg, they are under no obligation to perform such procedures. In addition, such procedures may be modified or discontinued at any time. Neither the Republic nor the fiscal agent nor the Luxembourg paying and transfer agent will have any responsibility for the performance by DTC, Euroclear or Clearstream, Luxembourg or their respective participants or indirect participants of the respective obligations under the rules and procedures governing their operations.
The Clearing Systems
The Depository Trust Company. DTC is:
DTC was created to hold securities for its participants and facilitate the clearance and settlement of securities transactions between its participants. It does this through electronic book-entry settlement in the accounts of its direct participants, eliminating the need for physical movement of securities certificates. DTC is owned by a number of its direct participants and by the New York Stock Exchange, Inc., the American Stock Exchange, Inc. and the National Association of Securities Dealers, Inc.
DTC can act only on behalf of its direct participants, who in turn act on behalf of indirect participants and certain banks. In addition, unless a global security is exchanged in whole or in part for a definitive security, it may not be physically transferred, except as a whole among DTC, its nominees and their successors. Therefore, your ability to pledge a beneficial interest in the global security to persons that do not participate in the DTC system, and to take other actions, may be limited because you will not possess a physical certificate that represents your interest.
Euroclear and Clearstream, Luxembourg. Like DTC, Euroclear and Clearstream, Luxembourg hold securities for their participants and facilitate the clearance and settlement of securities transactions between their participants through electronic book-entry settlement in their accounts. Euroclear and Clearstream, Luxembourg provide various services to their participants, including the safekeeping, administration, clearance and settlement and lending and borrowing of internationally traded securities. Euroclear and Clearstream, Luxembourg participants are financial institutions such as underwriters, securities brokers and dealers, banks, trust companies and other organizations. Other banks, brokers, dealers and trust companies have indirect access to Euroclear or Clearstream, Luxembourg by clearing through or maintaining a custodial relationship with a Euroclear or Clearstream, Luxembourg participant.
S-59
• a limited-purpose trust company organized under the New York Banking Law;
• a “banking organization” under the New York Banking Law;
• a member of the Federal Reserve System;
• a “clearing corporation” under the New York Uniform Commercial Code; and
• a “clearing agency” registered under Section 17A of the US Securities Exchange Act of 1934.
頁 59 / 247424(b)(3)
2014/03/12file:///C:/blp/data/CFd424b3.htm

Table of ContentsTable of ContentsTable of ContentsTable of Contents
Initial Settlement
Settlement of the Invitation
Upon the issuance of the new global bonds pursuant to the invitation, DTC or its custodian will credit on its internal system the respective amounts of individual beneficial interest represented by the global securities for each series of new global bonds to the account of DTC participants, including the Clearing System Depositaries. Such accounts will be designated by the information and exchange agent, and will be the same as the accounts in which the old bonds accepted for exchange were held.
Settlement of the Cash Offering
If you plan to hold your interests in the new global bonds through DTC, you will follow the settlement practices applicable to global security issues. If you plan to hold your interests in the new global bonds through Euroclear or Clearstream, Luxembourg, you will follow the settlement procedures applicable to conventional Eurobonds in registered form. If you are an investor on the settlement date, you will pay for the new global bonds by wire transfer and the entity through which you hold your interests in the new global bonds will credit your securities custody account.
Secondary Market Trading
The purchaser of securities determines the place of delivery in secondary market trading. Therefore, it is important for you to establish at the time of the trade where both the purchaser’s and seller’s accounts are located to ensure that settlement can be made on the desired value date (i.e., the date specified by the purchaser and seller on which the price of the securities is fixed).
Settlement among DTC participants. DTC participants will transfer interests in the securities among themselves in the ordinary way according to the rules and operating procedures of DTC governing global security issues. Participants will pay for these transfers by wire transfer.
Settlement among Euroclear and/or Clearstream, Luxembourg participants. Euroclear and Clearstream, Luxembourg participants will transfer interests in the securities among themselves in the ordinary way according to the rules and operating procedures of Euroclear and Clearstream, Luxembourg governing conventional Eurobonds. Participants will pay for these transfers by wire transfer.
Settlement between a DTC seller and a Euroclear or Clearstream, Luxembourg purchaser. When the securities are to be transferred from the account of a DTC participant to the account of a Euroclear or Clearstream, Luxembourg participant, the purchaser must first send instructions to Euroclear or Clearstream, Luxembourg through a participant at least one business day before the settlement date for such securities. Euroclear or Clearstream, Luxembourg will then instruct its depositary to receive the securities and make payment for them. On the settlement date for such securities, the depositary will make payment to the DTC participant’s account and the securities will be credited to the depositary’s account. After settlement has been completed, DTC will credit the securities to Euroclear or Clearstream, Luxembourg, and in turn Euroclear or Clearstream, Luxembourg will credit the securities, in accordance with its usual procedures, to the participant’s account, and the participant will then credit the purchaser’s account. These securities credits will appear the next day (European time) after the settlement date. The cash debit from the account of Euroclear or Clearstream, Luxembourg will be back-valued to the value date, which will be the preceding day if settlement occurs in New York. If settlement is not completed on the intended value date (i.e., the trade fails), the cash debit will instead be valued at the actual settlement date.
Participants in Euroclear and Clearstream, Luxembourg will need to make funds available to Euroclear or Clearstream, Luxembourg in order to pay for the securities by wire transfer on the value date. The most direct way of doing this is to preposition funds (i.e., have funds in place at Euroclear or Clearstream, Luxembourg
S-60
頁 60 / 247424(b)(3)
2014/03/12file:///C:/blp/data/CFd424b3.htm

Table of ContentsTable of ContentsTable of ContentsTable of Contents
before the value date), either from cash on hand or from existing lines of credit. Under this approach, however, participants may take on credit exposure to Euroclear and Clearstream, Luxembourg until the securities are credited to their accounts one day later.
As an alternative, if Euroclear or Clearstream, Luxembourg has extended a line of credit to a participant, the participant may decide not to preposition funds, but to allow Euroclear or Clearstream, Luxembourg to draw on the line of credit to finance settlement for the securities. Under this procedure, Euroclear or Clearstream, Luxembourg would charge the participant overdraft charges for one day, assuming that the overdraft would be cleared when the securities were credited to the participant’s account. However, interest on the securities would accrue from the value date. Therefore, in many cases the interest income on securities which the participant earns during that one-day period will substantially reduce or offset the amount of the participant’s overdraft charges. Of course, this result will depend on the cost of funds to (i.e., the interest rate that Euroclear or Clearstream, Luxembourg charges) each participant.
Since the settlement will occur during New York business hours, a DTC participant selling an interest in the securities can use its usual procedures for transferring global securities to the Clearing System Depositaries of Euroclear or Clearstream, Luxembourg for the benefit of Euroclear or Clearstream, Luxembourg participants. The DTC seller will receive the sale proceeds on the settlement date. Thus, to the DTC seller, a cross-market sale will settle no differently than a trade between two DTC participants.
Finally, day traders that use Euroclear or Clearstream, Luxembourg and that purchase new global bonds from DTC participants for credit to Euroclear participants or Clearstream, Luxembourg participants should note that these trades will automatically fail on the sale side unless one of the following three steps is taken:
Settlement between a Euroclear or Clearstream, Luxembourg seller and a DTC purchaser. Due to time zone differences in their favor, Euroclear and Clearstream, Luxembourg participants can use their usual procedures to transfer securities through their Clearing System Depositaries to a DTC participant. The seller must first send instructions to Euroclear or Clearstream, Luxembourg through a participant at least one business day before the settlement date. Euroclear or Clearstream, Luxembourg will then instruct its depositary to credit the securities to the DTC participant’s account and receive payment. The payment will be credited in the account of the Euroclear or Clearstream, Luxembourg participant on the following day, but the receipt of the cash proceeds will be back valued to the value date, which will be the preceding day if settlement occurs in New York. If settlement is not completed on the intended value date (i.e., the trade fails), the receipt of the cash proceeds will instead be valued at the actual settlement date.
If the Euroclear or Clearstream, Luxembourg participant selling the securities has a line of credit with Euroclear or Clearstream, Luxembourg and elects to be in debit for the securities until it receives the sale proceeds in its account, then the back-valuation may substantially reduce or offset any overdraft charges that the participant incurs over that one-day period.
S-61
• borrowing through Euroclear or Clearstream, Luxembourg for one day, until the purchase side of the day trade is reflected in their Euroclear account or Clearstream, Luxembourg account, in accordance with the clearing system’s customary procedures;
• borrowing the new global bonds in the United States from a DTC participant no later than one day prior to settlement, which would give the new global bonds sufficient time to be reflected in the borrower’s Euroclear account or Clearstream, Luxembourg account in order to settle the sale side of the trade; or
• staggering the value dates for the buy and sell sides of the trade so that the value date of the purchase from the DTC participant is at least one day prior to the value date for the sale to the Euroclear participant or Clearstream, Luxembourg participant.
頁 61 / 247424(b)(3)
2014/03/12file:///C:/blp/data/CFd424b3.htm

Table of ContentsTable of ContentsTable of ContentsTable of Contents
TAXATION
The following discussion summarizes certain U.S. federal income and estate and Philippine tax considerations that may be relevant to you if you invest in new global bonds. This summary is based on laws, regulations, rulings and decisions now in effect in the United States and on laws and regulations in effect in the Philippines and may change. Any change could apply retroactively and could affect the continued validity of this summary.
This summary does not describe all of the tax considerations that may be relevant to you or your situation, particularly if you are subject to special tax rules.
General
An exchange pursuant to the invitation may be a taxable transaction under the laws applicable to you. You should consult your own tax advisor to determine your particular tax consequences in respect of the exchange of old bonds for new global bonds pursuant to the invitation or the purchase, ownership or sale of new global bonds.
Philippine Taxation
The following is a summary of certain Philippine tax consequences that may be relevant to non-Philippine holders of the new global bonds in connection with the exchange of old bonds for new global bonds and the holding and disposition of the new global bonds. The Republic uses the term “non-Philippine holders” to refer to (i) non-residents of the Philippines who are neither citizens of the Philippines nor are engaged in trade or business within the Philippines or (ii) non-Philippine corporations not engaged in trade or business in the Philippines.
This summary is based on Philippine laws, rules and regulations now in effect, all of which are subject to change. It is not intended to constitute a complete analysis of the tax consequences under Philippine law of the receipt, ownership or disposition of the new global bonds, in each case by non-Philippine holders, nor to describe any of the tax consequences that may be applicable to residents of the Republic.
Exchange of Old Bonds into New Global Bonds. A holder’s exchange of old bonds into new global bonds will be treated as a sale or exchange of the old bonds. Under the Philippine Tax Code, gains realized from the sale, exchange or retirement of bonds with a maturity of more than five years is not subject to Philippine income tax. Since the old bonds have a maturity of more than five years from the date of issuance, any gains realized by any holder from the exchange of the old bonds for new global bonds will not be subject to Philippine income tax. No documentary stamp will be imposed on the disposition of the old bonds but documentary stamp shall be due from the issuance of the new global bonds. Documentary stamp tax on the issuance of the new global bonds will be paid by the Republic.
Effect of Holding New Global Bonds. Payments by the Republic of principal of and interest on the new global bonds to a non-Philippine holder will not subject such non-Philippine holder to taxation in the Philippines by reason solely of the holding of the new global bonds or the receipt of principal or interest in respect thereof.
Taxation of Interest on the New Global Bonds. When the Republic makes payments of principal and interest to you on the new global bonds, no amount will be withheld from such payments for, or on account of, any taxes of any kind imposed, levied, withheld or assessed by the Philippines or any political subdivision or taxing authority thereof or therein. If any such taxes are required to be paid, the Republic will pay additional amounts so that the holders of the new global bonds receive the amounts that would have been received by them had no withholding or deduction been required, as described more fully in “Description of the Securities—Description of the Debt Securities—Additional Amounts” in the accompanying prospectus.
Taxation of Capital Gains. Non-Philippine holders of the new global bonds will not be subject to Philippine income or withholding tax in connection with the sale, exchange or retirement of a new global bond if such sale,
S-62
頁 62 / 247424(b)(3)
2014/03/12file:///C:/blp/data/CFd424b3.htm

Table of ContentsTable of ContentsTable of ContentsTable of Contents
exchange or retirement is made outside the Philippines or an exemption is available under an applicable tax treaty in force between the Philippines and the country of domicile of the non-Philippine holder. Under the Philippine Tax Code, any gain realized from the sale, exchange or retirement of securities with an original maturity of more than five years from the date of issuance will not be subject to income tax. Since the new global bonds have a maturity of more than five years from the date of issuance, any gains realized by a holder of the new global bonds will not be subject to Philippine income tax.
Documentary Stamp Taxes. No documentary stamp tax is imposed upon the transfer of the new global bonds. A documentary stamp tax is payable upon the issuance of the new global bonds and will be for the account of the Republic.
Estate and Donor’s Taxes. The transfer of a new global bond by way of succession upon the death of a non-Philippine holder will be subject to Philippine estate tax at progressive rates ranging from 5% to 20% if the value of the net estate of properties located in the Philippines is over (Peso)200,000.
The transfer of a new global bond by gift to an individual who is related to the nonresident holder will generally be subject to a Philippine donor’s tax at progressive rates ranging from 2% to 15% if the value of the net gifts of properties located in the Philippines exceed (Peso)100,000 during the relevant calendar year. Gifts to unrelated donees are generally subject to tax at a flat rate of 30%. An “unrelated donee” is a person who is not a (i) brother, sister (whether by whole or half blood), spouse, ancestor or lineal descendant or (ii) relative by consanguinity in the collateral line within the fourth degree of relationship.
The foregoing apply even if the holder is a nonresident holder. However, the Republic will not collect estate and donor’s taxes on the transfer of the new global bonds by gift or succession if the deceased at the time of death, or the donor at the time of donation, was a citizen and resident of a foreign country that provides certain reciprocal rights to citizens of the Philippines (a “Reciprocating Jurisdiction”). For these purposes, a Reciprocating Jurisdiction is a foreign country which at the time of death or donation (i) did not impose a transfer tax of any character in respect of intangible personal property of citizens of the Philippines not residing in that foreign country or (ii) allowed a similar exemption from transfer or death taxes of every character or description in respect of intangible personal property owned by citizens of the Philippines not residing in that foreign country.
United States Federal Income Taxation
The following discussion summarizes certain U.S. federal income tax considerations relating to the exchange of old bonds for new global bonds pursuant to the invitation and to the acquisition, ownership and disposition of the new global bonds. This summary deals only with holders that hold old bonds and/or new global bonds as capital assets and that acquire new global bonds pursuant to the global bond offering. It does not address tax considerations that may be relevant to you if you are an investor that is subject to special tax rules, such as a bank, thrift, real estate investment trust, tax-exempt organization, regulated investment company, life insurance company, dealer or trader in securities, currencies or commodities, trader in securities that makes a mark-to-market election with respect to the new global bonds, a person that holds old bonds or will hold new global bonds as a hedge against interest rate risk or as a position in a “straddle” or conversion transaction or other integrated investment or a person whose “functional currency” is not the US dollar.
You should consult your own tax advisors in determining the tax treatment of the exchange of old bonds pursuant to the invitation and of the acquisition, ownership and sale of new global bonds, including the relevance to your particular situation of the tax considerations discussed below and of any relevant state, local or other tax laws.
Except as discussed under “Non-United States Holders” and “Backup Withholding and Information Reporting,” this discussion applies only to U.S. Holders. You are a U.S. Holder if you are, for U.S. federal income tax purposes:
S-63
• an individual citizen or resident of the United States;
頁 63 / 247424(b)(3)
2014/03/12file:///C:/blp/data/CFd424b3.htm

Table of ContentsTable of ContentsTable of ContentsTable of Contents
A “Non-United States Holder” is a beneficial owner of an old bond or a new global bond that is not a U.S. Holder.
If a partnership holds old bonds or new global bonds, the tax treatment of a partner generally will depend upon the status of the partner and the activities of the partnership. Partners in a partnership that holds or acquires old bonds or new global bonds are urged to consult their own tax advisors.
United States Holders
Exchange of Old Bonds for New Global Bonds
For U.S. federal income tax purposes, an exchange of old bonds for new global bonds will be considered a modification of the old bonds. The tax consequences of such a modification will depend on whether the modification is considered “significant.” As discussed below, in general, if the modification is significant, the exchange will be a taxable transaction. If it is not significant, the exchange will not be taxable to you except with respect to any payments of accrued qualified stated interest that you receive in respect of the old bonds, which will be taxable as ordinary income. As used in this prospectus supplement, the term “qualified stated interest” generally means the stated interest payable with respect to the old bonds.
Under the applicable U.S. Treasury regulations, a modification will be considered significant if, based on all the facts and circumstances other than certain specified changes, the legal rights or obligations that are altered and the degree to which they are altered are economically significant. In addition, certain changes to the yield of the old bonds, as calculated under a formula set forth under the regulations, or to the maturity of the old bonds, also may be treated as a significant modification. Because the yield and maturity of the old bonds will change as a result of the exchange of old bonds for new global bonds, the exchange of the Group A Bonds for the New 2021 Bonds or Reopened 2034 Bonds will constitute a significant modification of the Group A Bonds for U.S. federal income tax purposes. Additionally, the exchange of the January 2019 Bonds, June 2019 Bonds, September 2024 Bonds, October 2024 Bonds, and 2025 Bonds for the Reopened 2034 Bonds will constitute a significant modification of the old bonds for U.S. federal income tax purposes. Although the matter is not entirely free from doubt, the Republic also intends to treat the exchange of the 2030 Bonds and the 2031 Bonds for the Reopened 2034 Bonds as a significant modification of the old bonds for U.S. federal income tax purposes because a number of material substantive terms of the 2030 Bonds and 2031 Bonds will change as a result of the exchange. By accepting the new global bonds, you agree to the treatment of the exchange as described in this paragraph and you further agree to report for U.S. federal income tax purposes all income or loss with respect to the old bonds and the new global bonds in accordance with this characterization. Except as otherwise indicated, the remainder of this summary assumes that the exchange will be treated as a significant modification.
You will recognize gain or loss in connection with the exchange equal to the difference, if any, between your adjusted basis in the old bonds that you exchange and the amount you realize on the exchange. The amount you realize on the exchange will be equal to the issue price (determined as described below) of the new global bonds you receive in the exchange plus the amount of cash you receive in connection with the exchange (other than amounts attributable to accrued but unpaid interest, which will be taxed as such). Your basis in the new global bonds received in the exchange will be equal to their issue price. Subject to the discussion below of the Reopened 2034 Bonds, the issue price of the new global bonds, for the purposes of determining the amount you realize on the exchange, will be, for each series of the new global bonds, the first price at which a substantial
S-64
• a corporation created or organized in or under the laws of the United States or of any state thereof (including the District of Columbia);
• a trust that (1) is subject to the control of one or more U.S. persons and the administration of which is subject to the primary supervision of a court within the United States, or (2) that has a valid election in effect under the applicable Regulations to be treated as a U.S. person; or
• an estate the income of which is subject to U.S. federal income taxation regardless of its source.
頁 64 / 247424(b)(3)
2014/03/12file:///C:/blp/data/CFd424b3.htm

Table of ContentsTable of ContentsTable of ContentsTable of Contents
amount of such series of bonds is sold in the cash offering to persons other than bond houses, brokers, or similar persons or organizations acting in the capacity of underwriters, placement agents, or wholesalers. If either series of the new global bonds are not sold in a cash offering, the issue price of such series of bonds will equal their fair market value as determined under applicable Treasury Regulations.
The Reopened 2034 Bonds should form part of a “qualified reopening” for U.S. federal income tax purposes. Accordingly, for other purposes the issue price of the Reopened 2034 Bonds should be the issue price of the 6.375% bonds due 2034 issued by the Republic on October 23, 2009, which was $993.82 per $1,000 principal amount. While not certain, the Republic believes that the amount realized in an exchange for Reopened 2034 Bonds nevertheless should be determined as described in the prior paragraph.
Except to the extent attributable to accrued but unpaid qualified stated interest (including payments thereof) or accrued market discount and except as otherwise described below, gain or loss recognized on the exchange of the old bonds will be capital gain or loss and will be long term capital gain or loss if you held the old bonds for more than one year. Certain U.S. Holders (including individuals) are eligible for preferential rates of U.S. federal income tax in respect of long-term capital gain. The ability of a U.S. Holder to offset capital losses against ordinary income is subject to limitations. Gain or loss on the sale, exchange or other disposition of the old bonds generally will be treated as U.S. source gain or loss. Gain or loss attributable to accrued but unpaid qualified stated interest and market discount (to the extent not previously included in income) will be taxed as ordinary income.
If, contrary to the discussion above, the exchange of 2030 Bonds or 2031 Bonds that you hold for Reopened 2034 Bonds is not deemed to result in a significant modification, you would not recognize gain or loss on the exchange, except with respect to payments of accrued qualified stated interest received in respect of the 2030 or 2031 Bonds. In addition, the Reopened 2034 Bonds exchanged for the 2030 Bonds or 2031 Bonds would be treated as having an issue price equal to the adjusted issue price of the 2030 or 2031 Bonds that you exchange, in which case it is expected that those Reopened 2034 Bonds would be treated as issued with original issue discount (“OID”) in an amount that could be substantial. The rules regarding OID are complex, but generally require that you include OID in ordinary gross income for U.S. federal income tax purposes as it accrues, before you receive the cash attributable to that income. Accordingly, it is possible that the Internal Revenue Service would require you to include OID on the Reopened 2034 Bonds that you received in exchange for the 2030 Bonds or the 2031 Bonds in income on a current basis, or would require a secondary market investor in Reopened 2034 Bonds to include OID in income. You should consult your tax advisors with regard to the U.S. federal income tax consequences to you of exchanging old bonds for new global bonds.
Taxation of New Global Bonds
Interest on new global bonds. Interest on the new global bonds will generally be subject to United States taxation. You will be subject to tax on such interest as ordinary income at the time it accrues or is received in accordance with your method of accounting for tax purposes.
Interest income on the new global bonds will be treated as foreign source income for the purposes of calculating a U.S. Holder’s foreign tax credit limitation. The limitation on foreign taxes eligible for the U.S. foreign tax credit is calculated separately with respect to specific classes of income. The rules relating to foreign tax credits and their timing are extremely complex. U.S. Holders are advised to consult their own tax advisors regarding the application of the foreign tax credit rules to their particular situation.
Disposition of new global bonds. You will generally recognize gain or loss on the sale, exchange or other disposition of the new global bonds in an amount equal to the difference between the amount you realize on such sale, exchange or other disposition (less any accrued interest, which will be taxable as ordinary interest income) and your adjusted basis in the new global bonds. In the case of new global bonds acquired in the exchange, your adjusted basis in the new global bonds will be equal to your initial basis in the new global bonds determined as described above under “—Exchange of Old Bonds for New Global Bonds.” New global bonds acquired in the cash offering should have an initial basis equal to the amount paid for such bonds.
S-65
頁 65 / 247424(b)(3)
2014/03/12file:///C:/blp/data/CFd424b3.htm

Table of ContentsTable of ContentsTable of ContentsTable of Contents
Gain or loss recognized on sale, exchange or other disposition of the new global bonds will be capital gain or loss. Such gain or loss will generally be long-term capital gain or loss if your holding period for the new global bonds is more than one year. Certain U.S. Holders (including individuals) are eligible for preferential rates of U.S. federal income tax in respect of long-term capital gain. The ability of a U.S. Holder to offset capital losses against ordinary income is subject to limitations. Gain or loss on the sale, exchange or other disposition of the new global bonds generally will be treated as U.S. source gain or loss.
Non-United States Holders
Subject to the discussion of backup withholding below, if you are a Non-United States Holder, the interest income and gains that you derive in respect of the old bonds and the new global bonds generally will be exempt from U.S. federal income taxes, including withholding tax. However, to receive this exemption you may be required to satisfy certain certification requirements (described below in “Backup Withholding and Information Reporting”) of the U.S. Internal Revenue Service to establish that you are a Non-United States Holder.
Even if you are a Non-United States Holder, you may still be subject to U.S. federal income taxes on any interest income you derive in respect of the new global bonds if such interest is effectively connected with the conduct of your trade or business within the United States.
If you are a Non-United States Holder, any gain you realize on a sale or exchange of the old bonds or the new global bonds generally will be exempt from U.S. federal income tax, including withholding tax, unless:
Backup Withholding and Information Reporting
In general, information reporting requirements will apply to payments in respect of the old bonds or new global bonds within the United States, and backup withholding will apply to such payments if you (i) fail to provide an accurate taxpayer identification number, (ii) are notified by the U.S. Internal Revenue Service that you have failed to report all interest and dividends required to be shown on your federal income tax return, or (iii) otherwise fail to comply with applicable certification requirements.
Backup withholding and information reporting will not apply to payments made within the United States by the Republic or any agent thereof (acting in such capacity) to you if you are a Non-United States holder so long as either (i) if you are the beneficial owner, you certify to the Republic or its agent, under penalties of perjury, that you are a Non-United States Holder and provide your name and address or (ii) you have otherwise established an exemption, and provided that neither the Philippines nor its agent has actual knowledge that you are not a Non-United States Holder or that the conditions of any exemption are not in fact satisfied.
Similar rules requiring information reporting and, in certain circumstances, backup withholding will apply with respect to sales of new global bonds through certain brokers.
Beginning in 2011, individual U.S. Holders may be required to report to the IRS certain information with respect to their beneficial ownership of the new global notes not held through an account with a financial institution. Investors who fail to report required information could be subject to substantial penalties.
S-66
• such gain is effectively connected with the conduct of your trade or business within the United States; or
• if you are an individual, you are present in the United States for a total of 183 days or more during the taxable year in which such gain is realized and either:
• such gain is attributable to your office or fixed place of business maintained in the United States; or
• you have a tax home in the United States.
頁 66 / 247424(b)(3)
2014/03/12file:///C:/blp/data/CFd424b3.htm

Table of ContentsTable of ContentsTable of ContentsTable of Contents
PLAN OF DISTRIBUTION
We have entered into a dealer managers agreement with Citigroup Global Markets Inc., The Hongkong and Shanghai Banking Corporation Limited and UBS AG, referred to in this prospectus supplement as the dealer managers. Pursuant to the dealer managers agreement, we have:
The obligations of the dealer managers under the dealer managers agreement are subject to certain conditions.
If the Republic and the dealer managers determine that, pursuant to the cash offering, if any, the Republic will issue and sell new global bonds of either or both series for resale, the Republic and the dealer managers will determine by negotiation the aggregate principal amount of new global bonds of each series to be so issued and sold. Once the Republic and the dealer managers determine the aggregate principal amount of the new global bonds of each series to be issued and sold pursuant to the cash offering, if any, the Republic and the dealer managers will enter into an underwriting agreement with respect to each such series, each of which will consist of a terms agreement and the underwriting agreement standard terms filed as an exhibit to the registration statement. Pursuant to the underwriting agreements, subject to certain terms and conditions, the Republic will agree:
The underwriting agreements would also provide that:
Any offer and sale of new global bonds pursuant to the cash offering will be subject to the selling restrictions described under “Jurisdictional Restrictions” (including “Jurisdictional Restrictions—Luxembourg Selling Restrictions”).
If new global bonds are sold pursuant to the cash offering, it is expected that the dealer managers will propose initially to offer the new global bonds in part to the public at the applicable new global bond issue price for the new global bonds determined as described above, and in part to dealers at that price less a concession not to exceed an amount to be determined in the underwriting agreement. When the new global bonds are released for sale, the dealer managers may change the offering price and other selling terms.
A subsequent prospectus supplement to be issued on or after the announcement date will include the principal amount of the new global bonds to be offered pursuant to the cash offering by the dealer managers and the fees to be paid to the dealer managers in respect of the new global bonds being offered pursuant to the cash offering.
S-67
• retained the dealer managers to act, directly or through affiliates, on our behalf as dealer managers in connection with the invitation;
• agreed to pay the dealer managers a fee based on the aggregate principal amount of new global bonds issued pursuant to the global bond offering;
• agreed to reimburse the dealer managers for certain of their out-of-pocket expenses in connection with the invitation; and
• agreed to indemnify the dealer managers and their affiliates against certain liabilities, including certain liabilities under the Securities Act.
• to sell to the dealer managers, and the dealer managers will agree to purchase from the Republic, severally and not jointly, at the applicable issue price for the new global bonds of such series less an underwriting fee, the principal amount of new global bonds stated therein; and
• to indemnify the dealer managers against certain liabilities, including certain liabilities under the Securities Act, or contribute to payments the dealer managers may be required to make in that respect.
• the dealer managers are obligated to purchase all of the new global bonds if any are purchased; and
• if a dealer manager defaults, the purchase commitment of the non-defaulting dealer manager may be increased, or the cash offering of the new global bonds may be terminated.
頁 67 / 247424(b)(3)
2014/03/12file:///C:/blp/data/CFd424b3.htm

Table of ContentsTable of ContentsTable of ContentsTable of Contents
If any of the dealer managers acquire any new global bonds pursuant to the global bond offering, they may resell such new global bonds from time to time in one or more transactions, including negotiated transactions, at a fixed public offering price or at varying prices to be determined at the time of sale. Any such new global bonds may be offered to the public either through an underwriting syndicate represented by the dealer managers or directly by the dealer managers. Any public offering price and any discounts or concessions allowed or reallowed or paid to dealers may be varied from time to time by the dealer managers.
In connection with the global bond offering, the dealer managers may purchase and sell the new global bonds or old bonds in the open market. These transactions may include stabilizing transactions, over-allotment transactions and syndicate-covering transactions by the dealer managers (for themselves or a syndicate, if there is a syndicate).
These activities may stabilize, maintain or otherwise affect the market price of the new global bonds or old bonds, which may be higher than the price that might otherwise prevail in the open market, and these activities, if commenced, may be discontinued at any time. These transactions may be effected on the Luxembourg Stock Exchange, in the over-the-counter market or otherwise. Placements of new global bonds or old bonds in the United States in connection with the global bond offering will be made through one or more United States affiliates of the dealer managers.
The dealer managers are relying on an exemption obtained from the SEC from Rule 101 of Regulation M under the Securities Exchange Act of 1934, as amended, with respect to the trading activities of the dealer managers and certain of their affiliates in connection with the global bond offering.
In the ordinary course of their activities, the dealer managers and their respective affiliates may purchase and sell the new global bonds and/or old bonds in the open market or otherwise, may at any time hold long or short positions, and may trade or otherwise effect transactions, for their own account or the accounts of customers, in securities of the Republic. The dealer managers and certain of their respective affiliates have from time to time engaged in transactions with and performed services for the Republic in the ordinary course of business.
The Republic estimates that its share of the total expenses of the global bond offering, excluding fees and commissions, will be approximately $350,000.
The Republic has retained Bondholder Communications Group, LLC to act as information and exchange agent.
The Republic has agreed to:
S-68
• Stabilizing transactions consist of certain bids or purchases for the purpose of preventing or retarding a decline in the market price of the securities.
• Over-allotment transactions involve the sales by the dealer managers of new global bonds or old bonds in excess of the principal amount of the new global bonds or old bonds the dealer managers are obligated to purchase, which creates a syndicate short position.
• Syndicate-covering transactions involve purchases of the new global bonds or old bonds in the open market after the distribution has been completed in order to cover syndicate short positions. A short position is more likely to be created if the dealer managers are concerned that there may be downward pressure on the price of the new global bonds or old bonds in the open market after pricing that could adversely affect investors who purchase in the global bond offering.
• pay the information and exchange agent customary fees for its services; and
• reimburse the information and exchange agent for certain of its out-of-pocket expenses in connection with the invitation.
頁 68 / 247424(b)(3)
2014/03/12file:///C:/blp/data/CFd424b3.htm

Table of ContentsTable of ContentsTable of ContentsTable of Contents
Settlement and Delivery
The Republic expects that delivery of the global bonds will be made against payment therefor on or about the fifth business day following the date of pricing of the global bonds, which is expected to be October 6, 2010. Under Rule 15c6-1 of the U.S. Securities Exchange Act of 1934, as amended, trades in the secondary market generally are required to settle in three business days, unless the parties to a trade expressly agree otherwise. Accordingly, purchasers who wish to trade global bonds on the date of pricing or the next four succeeding business days will be required, by virtue of the fact that the global bonds initially will settle in T+5 to specify alternative settlement arrangement to prevent a failed settlement.
S-69
頁 69 / 247424(b)(3)
2014/03/12file:///C:/blp/data/CFd424b3.htm

Table of ContentsTable of ContentsTable of ContentsTable of Contents
JURISDICTIONAL RESTRICTIONS
Austria Selling Restrictions
Each the dealer manager has represented and agreed that the new global bonds have not been and will not be offered or sold or publicly promoted or advertised by it in the Republic of Austria (i) before notification of the offer to the competent Austrian authority Oesterreichische Kontrollbank (OeKB) and (ii) other than in compliance with Austrian laws applicable with respect to the offer and sale of securities, in particular the provisions of the Austrian Capital Markets Act (Kapitalmarktgesetz) and the Austrian Securities Supervision Act (Wertpapieraufsichtsgesetz).
Belgium Selling Restrictions
The communication of this prospectus supplement and any other documents or materials relating to the global bond offering is not being made and such documents and/or materials have not been approved by the Belgian Commissions for Banking, Finance and Insurance pursuant to the Law of April 1, 2007 on public takeover bids (“Takeover Law”) and the global bond offering is not being made, and will not be made, directly or indirectly, in or into Belgium as a public offer as defined in article 6 of the Takeover Law. Accordingly, investors are hereby notified that the global bond offering is not intended to be addressed, the new global bonds may not be offered, sold or delivered and such documents and/or materials are not directed at, are not being distributed to and must not be passed on to the general public in Belgium. The communication of such documents and/or materials is only being made to, and such documents and/or materials are only being distributed to and directed at (i) persons who are outside Belgium or (ii) to qualified investors as defined in article 10 of the Law of June 16, 2006 on the public offering of investment instruments and the admission of investment instrument to trading on a regulated market or (iii) persons to whom such communication may otherwise lawfully be made or documents and/or materials distributed under the Takeover Law (all such persons in (i), (ii) and (iii) above together being referred to as “relevant persons”). The global bond offering is only available to relevant persons. Any person who is not a relevant person should not act or rely on this prospectus supplement or any other documents or materials relating to the global bond offering or any of their contents.
Denmark Selling Restrictions
This prospectus supplement and the accompanying prospectus have not been filed with or approved by the Danish Financial Supervisory Authority or any other regulatory authority in the Kingdom of Denmark.
The new global bonds have not been offered or sold and may not be offered, sold or delivered directly or indirectly in Denmark, unless in compliance with Chapter 6 or Chapter 12 of the Danish Act on Trading in Securities and Executive Orders issued pursuant thereto as amended from time to time
France Selling Restrictions
This prospectus supplement and the accompanying prospectus are not being distributed in the context of a public offer in France and have accordingly not been submitted to the Autorité des marchés financiers for prior approval and clearance. This prospectus supplement and the accompanying prospectus are not to be further distributed or reproduced (in whole or in part) by the addressees and has been distributed on the undertaking that addressees would undertake not to transfer, directly or indirectly, the New Global Bonds, other than in compliance with applicable laws and regulation.
Each of the issuer, the dealer managers and the addressees represents and agrees that the invitation and/or cash offering have/has not been made, directly or indirectly, to the public in France and that it has not offered or sold and will not offer or sell, directly or indirectly, the new global bonds to the public in the Republic of France, and has not distributed or caused to be distributed and will not distribute or cause to be distributed to the public in the Republic of France, this document or any offering material relating to the invitation or the cash offering,
S-70
頁 70 / 247424(b)(3)
2014/03/12file:///C:/blp/data/CFd424b3.htm

Table of ContentsTable of ContentsTable of ContentsTable of Contents
and that such offers, sales and distributions have been and shall only be made in the Republic of France to qualified investors other than individuals acting for their own account or providers of investment services relating to portfolio management for the account of third parties as defined in and in accordance with Articles L. 411-1, L. 411-2 and D. 411-1 to D. 411-3 of the French Code monétaire et financier.
Germany Selling Restrictions
The new global bonds may only be offered or sold or publicly promoted or advertised in the Federal Republic of Germany in compliance with the German Securities Prospectus Act (Wertpapierprospektgesetz) of June 22, 2005, as amended from time to time, or any other laws and regulations applicable in the Federal Republic of Germany in relation to the issuance, offer and sale of securities.
Each dealer manager has represented and agreed that the new global bonds have not been and will not be offered or sold or publicly promoted or advertised by it in the Federal Republic of Germany other than in compliance with the German Securities Prospectus Act or any other laws and regulations applicable in the Federal Republic of Germany in relation to the issuance, offer and sale of securities.
Neither this prospectus supplement nor the accompanying prospectus nor any other offer document in relation to the new global bonds have been approved by the German Federal Financial Services Supervisory Authority (Bundesanstalt für Finanzdienstleistungsaufsicht (“BaFin”)) nor have they been notified to BaFin by any competent authority in accordance with § 17 (3) of the German Securities Prospectus Act.
Hong Kong Selling Restrictions
Each dealer manager represents and agrees that it has not issued or had in its possession for the purposes of issue and will not issue or have in its possession for the purposes of issue any advertisement, invitation or document relating to the new global bonds, whether in Hong Kong or elsewhere, which is directed at, or the contents of which are likely to be accessed or read by, the public in Hong Kong (except if permitted to do so under the securities laws of Hong Kong) other than with respect to new global bonds which are or are intended to be disposed of only to persons outside Hong Kong or only to “professional investors” within the meaning of the Securities and Futures Ordinance (Cap. 571) and any rules made thereunder.
Luxembourg Selling Restrictions
The new global bonds may not be offered or sold to the public in the Grand Duchy of Luxembourg, directly or indirectly, and, neither this prospectus supplement nor any other circular, prospectus, form of application, advertisement, communication or other material may be distributed, or otherwise made available in, or from or published in, the Grand Duchy of Luxembourg, except for the sole purpose of the admission to trading of the new global bonds on the Euro MTF market of the Luxembourg Stock Exchange and listing on the official list of the Luxembourg Stock Exchange, and except in circumstances which do not constitute an offer of securities to the public.
Monaco Selling Restrictions
The new global bonds may not be offered or sold and investment advices be provided in Monaco in respect thereto, other than by an intermediary duly authorized under Monaco financial activities laws.
S-71
頁 71 / 247424(b)(3)
2014/03/12file:///C:/blp/data/CFd424b3.htm

Table of ContentsTable of ContentsTable of ContentsTable of Contents
The Netherlands Selling Restrictions
Each dealer manager has represented and agreed that the new global bonds have not been and will not be offered or sold or publicly promoted or advertised by it in the Netherlands other than in compliance with the provisions of the Dutch Act on Financial Supervision (Wet op het financieel toezicht) or of any other laws applicable in the Netherlands governing the offer and sale of securities.
Philippines Selling Restrictions
The new global bonds constitute exempt securities within the meaning of the Philippine Securities Regulation Code and as such are not required to be registered under the provisions of the said law before they can be sold or offered for sale or distribution in the Philippines. However, the new global bonds may be sold or offered for sale in the Philippines only by underwriters, dealers or brokers duly licensed by the Philippine Securities and Exchange Commission.
Singapore Selling Restrictions
Each dealer manager acknowledges that the prospectus supplement and the accompanying prospectus have not been registered as a prospectus with the Monetary Authority of Singapore, and the new global bonds will be offered pursuant to exemptions under the Securities and Futures Act, Chapter 289 of Singapore (the “Securities and Futures Act”). Accordingly, each dealer manager represents and agrees that it has not offered or sold any new global bonds or caused the new global bonds to be made the subject of an invitation for subscription or purchase and will not offer or sell any new global bonds or cause the new global bonds to be made the subject of an invitation for subscription or purchase, and has not circulated or distributed, nor will it circulate or distribute, the prospectus supplement and the accompanying prospectus or any document or material in connection with the offer or sale, or invitation for subscription or purchase, of any new global bonds, whether directly or indirectly, to any person in Singapore other than (a) to an institutional investor pursuant to Section 274 of the Securities and Futures Act, (b) to a relevant person under Section 275(1) of the Securities and Futures Act, or to any person pursuant to Section 275(1A) of the Securities and Futures Act and in accordance with the conditions specified in Section 275 of the Securities and Futures Act, or (c) otherwise pursuant to, and in accordance with the conditions of, any other applicable provision of the Securities and Futures Act.
Each of the following persons specified in Section 275 of the Securities and Futures Act which has subscribed or purchased new global bonds, namely a person who is:
should note that shares, debentures and units of shares and debentures of that corporation or the beneficiaries’ rights and interest in that trust shall not be transferable for 6 months after that corporation or that trust has acquired the new global bonds under Section 275 of the Securities and Futures Act except:
S-72
(a) a corporation (which is not an accredited investor (as defined in Section 4A of the Securities and Futures Act)) the sole business of which is to hold investments and the entire share capital of which is owned by one or more individuals, each of whom is an accredited investor; or
(b) a trust (where the trustee is not an accredited investor) whose sole purpose is to hold investments and each beneficiary is an individual who is an accredited investor,
(i) to an institutional investor under Section 274 of the Securities and Futures Act or to a relevant person or to any person pursuant to Section 275(1) and Section 275(1A) of the Securities and Futures Act, respectively and in accordance with the conditions specified in Section 275 of the Securities and Futures Act; or
(ii) where no consideration is or will be given for the transfer; or
(iii) where the transfer is by operation of law; or
(iv) pursuant to Section 276(7) of the Securities and Futures Act.
頁 72 / 247424(b)(3)
2014/03/12file:///C:/blp/data/CFd424b3.htm

Table of ContentsTable of ContentsTable of ContentsTable of Contents
Switzerland Selling Restrictions
The invitation and the cash offering are made in Switzerland on the basis of a private placement, not as a public offering. The new global bonds will not be listed on the SWX Swiss Exchange. This prospectus supplement therefore does not constitute a prospectus within the meaning of Art. 652a or 1156 of the Swiss Federal Code of Obligations or Arts. 32 et seq. of the Listing Rules of the SWX Swiss Exchange.
UK Selling Restrictions
Each of the dealer managers represents and agrees that it has complied and will comply with all applicable provisions of the Financial Services and Markets Act 2000 with respect to anything done by it in relation to the new global bonds in, from or otherwise involving the United Kingdom.
S-73
頁 73 / 247424(b)(3)
2014/03/12file:///C:/blp/data/CFd424b3.htm

Table of ContentsTable of ContentsTable of ContentsTable of Contents
LEGAL MATTERS
The validity of the global bond offering will be passed upon on behalf of the Republic as to Philippine law by the Secretary of the Department of Justice of the Republic, and as to US federal law and New York State law by Allen & Overy. Certain matters will be passed upon for the dealer managers by Cleary Gottlieb Steen & Hamilton LLP, United States counsel for the dealer managers, as to matters of US and New York State law, and by Romulo, Mabanta, Buenaventura, Sayoc & de Los Angeles, Philippine counsel for the dealer managers, as to matters of Philippine law.
GENERAL INFORMATION
1. The new global bonds have been accepted for clearance through DTC, Euroclear and Clearstream, Luxembourg. The securities codes for the new global bonds are:
2. The Republic’s currently outstanding $1,850,000,000 6.375% Global Bonds due 2034 issued on October 23, 2009 and reopened on January 13, 2010, which on October 24, 2010 will consolidate and form a single series with the Reopened 2034 Bonds, have previously been accepted for clearance through DTC, Euroclear and Clearstream Luxembourg. Their International Securities Identification Number is US718286BG11, their CUSIP number is 718286 BG1, and their Common Code number is 045948790. Upon consolidation, the Reopened 2034 Bonds will also have these identification numbers.
3. The issue and sale of the new global bonds was authorized by the Full Powers signed by the President of the Republic on September 17, 2010.
4. Except as disclosed in this prospectus supplement and the accompanying prospectus, there has been no material adverse change in the fiscal condition or affairs of the Republic that is material in the context of the global bond offering since December 23, 2009.
5. Application has been made to admit the new global bonds to listing on the Official List of the Luxembourg Stock Exchange and to trading on the EuroMTF Market. Copies of the following documents will, so long as any new global bonds are outstanding and traded on the EuroMTF Market, be available for inspection during usual business hours at the specified office of The Bank of New York (Luxembourg) S.A. in Luxembourg:
In addition, so long as the new global bonds are outstanding and traded on the EuroMTF Market, copies of the Philippines’ economic reports for each year in English (as and when available) will be available at the offices of the listing agent in Luxembourg during normal business hours on any weekday. The underwriting agreement, if any, the fiscal agency agreement and the supplements to the fiscal agency agreement shall also be available free of charge at the office of the listing agent and the Luxembourg paying and transfer agent.
S-74
ISIN CUSIP No. Common Code
New 2021 Bonds US718286BK23 718286 BK2 N/A* Reopened 2034 Bonds (prior to October 24, 2010) US718286BL06 718286 BL0 N/A* Reopened 2034 Bonds (from October 24, 2010) US718286BG11 718286 BG1 045948790
• copies of the Registration Statement, which includes the fiscal agency agreement, the supplements to the fiscal agency agreement and the form of the underwriting agreement as exhibits thereto; and
• the Full Powers signed by the President of the Republic on September 17, 2010, and the resolution of the Monetary Board of Bangko Sentral adopted on September 16, 2010, authorizing and approving-in principle the global bond offering.
* Common Code numbers will be issued upon pricing of the new global bonds.
頁 74 / 247424(b)(3)
2014/03/12file:///C:/blp/data/CFd424b3.htm

Table of ContentsTable of ContentsTable of ContentsTable of Contents
5. The Bank of New York (Luxembourg) S.A. has been appointed as the Luxembourg paying and transfer agent. For so long as the new global bonds are traded on the EuroMTF Market and the rules of the Luxembourg Stock Exchange so require, the Republic will maintain a Luxembourg paying and transfer agent.
S-75
頁 75 / 247424(b)(3)
2014/03/12file:///C:/blp/data/CFd424b3.htm
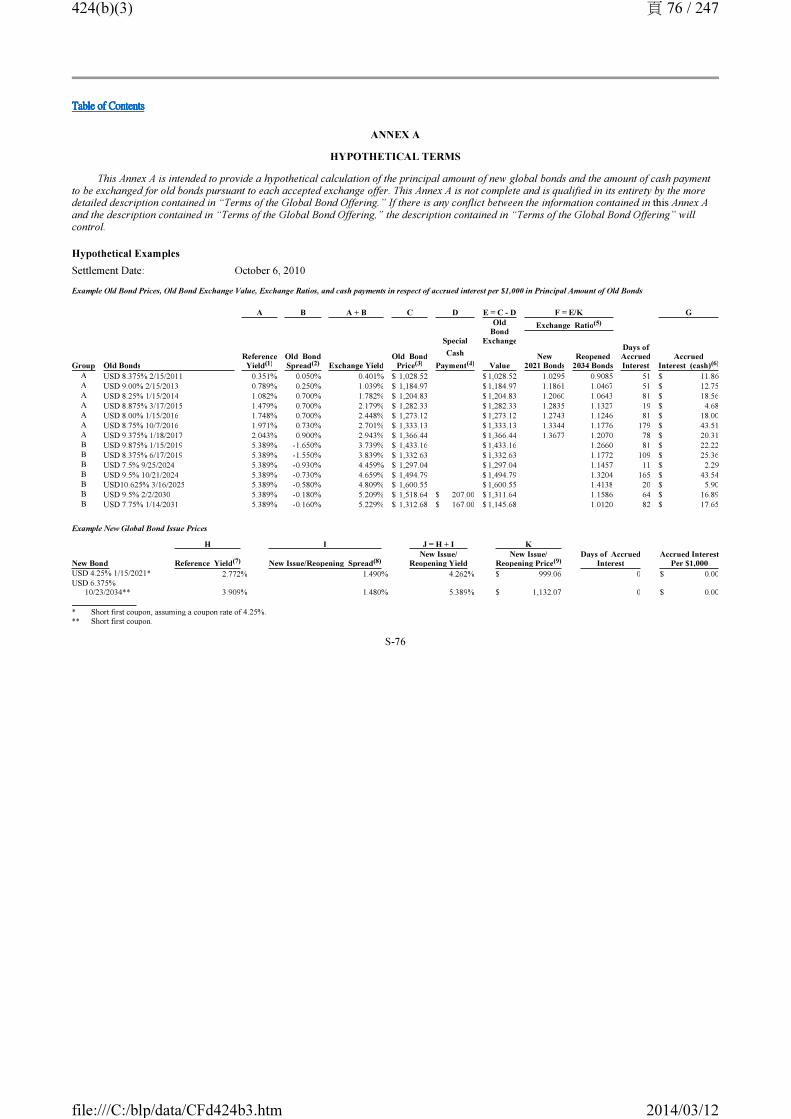
Table of ContentsTable of ContentsTable of ContentsTable of Contents
ANNEX A
HYPOTHETICAL TERMS
This Annex A is intended to provide a hypothetical calculation of the principal amount of new global bonds and the amount of cash payment to be exchanged for old bonds pursuant to each accepted exchange offer. This Annex A is not complete and is qualified in its entirety by the more detailed description contained in “Terms of the Global Bond Offering.” If there is any conflict between the information contained in this Annex A and the description contained in “Terms of the Global Bond Offering,” the description contained in “Terms of the Global Bond Offering” will control.
Hypothetical Examples
Settlement Date: October 6, 2010
Example Old Bond Prices, Old Bond Exchange Value, Exchange Ratios, and cash payments in respect of accrued interest per $1,000 in Principal Amount of Old Bonds
Example New Global Bond Issue Prices
S-76
A B A + B C D E = C - D F = E/K G
Group Old BondsReferenceYield
Old BondSpread Exchange Yield
Old BondPrice
Special
Cash
Payment
OldBond
Exchange
Value
Exchange Ratio
Days ofAccruedInterest
AccruedInterest (cash)
New2021 Bonds
Reopened2034 Bonds
A USD 8.375% 2/15/2011 0.351% 0.050% 0.401% $ 1,028.52 $ 1,028.52 1.0295 0.9085 51 $ 11.86A USD 9.00% 2/15/2013 0.789% 0.250% 1.039% $ 1,184.97 $ 1,184.97 1.1861 1.0467 51 $ 12.75A USD 8.25% 1/15/2014 1.082% 0.700% 1.782% $ 1,204.83 $ 1,204.83 1.2060 1.0643 81 $ 18.56A USD 8.875% 3/17/2015 1.479% 0.700% 2.179% $ 1,282.33 $ 1,282.33 1.2835 1.1327 19 $ 4.68A USD 8.00% 1/15/2016 1.748% 0.700% 2.448% $ 1,273.12 $ 1,273.12 1.2743 1.1246 81 $ 18.00A USD 8.75% 10/7/2016 1.971% 0.730% 2.701% $ 1,333.13 $ 1,333.13 1.3344 1.1776 179 $ 43.51A USD 9.375% 1/18/2017 2.043% 0.900% 2.943% $ 1,366.44 $ 1,366.44 1.3677 1.2070 78 $ 20.31B USD 9.875% 1/15/2019 5.389% -1.650% 3.739% $ 1,433.16 $ 1,433.16 1.2660 81 $ 22.22B USD 8.375% 6/17/2019 5.389% -1.550% 3.839% $ 1,332.63 $ 1,332.63 1.1772 109 $ 25.36B USD 7.5% 9/25/2024 5.389% -0.930% 4.459% $ 1,297.04 $ 1,297.04 1.1457 11 $ 2.29B USD 9.5% 10/21/2024 5.389% -0.730% 4.659% $ 1,494.79 $ 1,494.79 1.3204 165 $ 43.54B USD10.625% 3/16/2025 5.389% -0.580% 4.809% $ 1,600.55 $ 1,600.55 1.4138 20 $ 5.90B USD 9.5% 2/2/2030 5.389% -0.180% 5.209% $ 1,518.64 $ 207.00 $ 1,311.64 1.1586 64 $ 16.89B USD 7.75% 1/14/2031 5.389% -0.160% 5.229% $ 1,312.68 $ 167.00 $ 1,145.68 1.0120 82 $ 17.65
H I J = H + I K
New Bond Reference Yield New Issue/Reopening SpreadNew Issue/
Reopening YieldNew Issue/
Reopening PriceDays of Accrued
InterestAccrued Interest
Per $1,000
USD 4.25% 1/15/2021* 2.772% 1.490% 4.262% $ 999.06 0 $ 0.00USD 6.375%
10/23/2034** 3.909% 1.480% 5.389% $ 1,132.07 0 $ 0.00
* Short first coupon, assuming a coupon rate of 4.25%. ** Short first coupon.
(1) (2) (3) (4)
(5)
(6)
(7) (8) (9)
頁 76 / 247424(b)(3)
2014/03/12file:///C:/blp/data/CFd424b3.htm

Table of ContentsTable of ContentsTable of ContentsTable of Contents
Example New Global Bonds in Principal Amount and Cash Rounding Amount Per $1,000,000 in Principal Amount of Old Bonds Accepted for Exchange into New 2021 Bonds
Example New Global Bonds in Principal Amount, Cash Rounding Amount, and Special Cash Payment Amount Per $1,000,000 in Principal Amount of Old Bonds Accepted for Exchange into Reopened 2034 Bonds
Determined from BBAM1 for 8.375% due 2011 multiplied by 365/360, and for other Group A Bonds as quoted on Bloomberg IRSB18 (mid-market) interpolated on a 30/360 basis and rounded to 0.001%;
For all Group B Bonds the reference yield is the reopening yield of the Reopened 2034 Bonds;
Reference yields will be fixed at the pricing time on the announcement date.
S-77
L = F * $1,000,000M = L Rounded
Down to Nearest $1,000 N = (L - M) * (K/$1,000)
Group Old Bonds New 2021 Bonds New 2021 Bonds after Rounding Cash Rounding
A USD 8.375% 2/15/2011 $ 1,029,500.00 $ 1,029,000.00 $ 499.53A USD 9.00% 2/15/2013 $ 1,186,100.00 $ 1,186,000.00 $ 99.91A USD 8.25% 1/15/2014 $ 1,206,000.00 $ 1,206,000.00 $ 0.00A USD 8.875% 3/17/2015 $ 1,283,500.00 $ 1,283,000.00 $ 499.53A USD 8.00% 1/15/2016 $ 1,274,300.00 $ 1,274,000.00 $ 299.72A USD 8.75% 10/7/2016 $ 1,334,400.00 $ 1,334,000.00 $ 399.62A USD 9.375% 1/18/2017 $ 1,367,700.00 $ 1,367,000.00 $ 699.34
L = F * $1,000,000M = L Rounded
Down to Nearest $1,000 N = (L - M) * (K/$1,000) O = $1,000,000*(D/$1,000)
Group Old Bonds Reopened 2034 Bonds Reopened 2034 Bonds after Rounding Cash Rounding Special Cash Payment
A USD 8.375% 2/15/2011 $ 908,500.00 $ 908,000.00 $ 566.04 $ 0.00A USD 9.00% 2/15/2013 $1,046,700.00 $ 1,046,000.00 $ 792.45 $ 0.00A USD 8.25% 1/15/2014 $1,064,300.00 $ 1,064,000.00 $ 339.62 $ 0.00A USD 8.875% 3/17/2015 $1,132,700.00 $ 1,132,000.00 $ 792.45 $ 0.00A USD 8.00% 1/15/2016 $1,124,600.00 $ 1,124,000.00 $ 679.24 $ 0.00A USD 8.75% 10/7/2016 $1,177,600.00 $ 1,177,000.00 $ 679.24 $ 0.00A USD 9.375% 1/18/2017 $1,207,000.00 $ 1,207,000.00 $ 0.00 $ 0.00B USD 9.875% 1/15/2019 $1,266,000.00 $ 1,266,000.00 $ 0.00 $ 0.00B USD 8.375% 6/17/2019 $1,177,200.00 $ 1,177,000.00 $ 226.41 $ 0.00B USD 7.5% 9/25/2024 $1,145,700.00 $ 1,145,000.00 $ 792.45 $ 0.00B USD 9.5% 10/21/2024 $1,320,400.00 $ 1,320,000.00 $ 452.83 $ 0.00B USD10.625% 3/16/2025 $1,413,800.00 $ 1,413,000.00 $ 905.66 $ 0.00B USD 9.5% 2/2/2030 $1,158,600.00 $ 1,158,000.00 $ 679.24 $ 207,000.00B USD 7.75% 1/14/2031 $1,012,000.00 $ 1,012,000.00 $ 0.00 $ 167,000.00
(1) As of September 17, 2010 at 12:00 noon New York City time;
(2) Fixed spread for the Group A Bonds and relative spread for the Group B Bonds, subject to change until the business day prior to expiration.
(3) The price will be calculated to be the price per $1,000 in principal amount intended to result in a yield to maturity equal to the sum of the reference yield and the applicable fixed old bond spread or relative old bond spread, calculated in accordance with standard market practice, rounded to the nearest $0.01.
(4) The special cash payment is paid in cash with respect to the 2030 Bonds and the 2031 Bonds, but subtracted from the old bond price to determine the applicable old bond exchange value used in the calculation of the applicable exchange ratio.
(10)
(10)
頁 77 / 247424(b)(3)
2014/03/12file:///C:/blp/data/CFd424b3.htm

Table of ContentsTable of ContentsTable of ContentsTable of Contents
The “reference yield” for the Reopened 2034 Bonds will be the yield to maturity, rounded to three decimal places (with 0.0005% rounded to 0.001%), calculated by the dealer managers in accordance with standard market practice, corresponding to the bid-side price of the U.S. Treasury 4.375% Bond due May 15, 2040, as displayed on the Bloomberg FIT1 screen at the pricing time on the announcement date.
The new issue spread and reopening spread used in this hypothetical example are based on the lower end of the spread ranges specified in this prospectus supplement.
S-78
(5) The exchange ratio is the old bond exchange value divided by the relevant new global bond issue price, this number is rounded to 4 decimal places.
(6) Accrued interest per $1,000 in principal amount is the result of the number of days of accrued interest multiplied by the product of $1,000 and the annual coupon rate divided by 360 days. This amount is paid in cash on the settlement date with the final payment amount rounded to the nearest $0.01.
(7) The “reference yield” for the New 2021 Bonds will be the rate, rounded to three decimal places (with 0.0005% rounded to 0.001%), determined by the dealer managers through linear interpolation of the mid-market US dollar interest rate swap rates for the maturities occurring immediately before and immediately after January 15, 2021, as displayed on the Bloomberg IRSB 18 screen at the pricing time on the announcement date.
(8) The indicative new issue spread for the New 2021 Bonds and the indicative reopening spread for the Reopened 2034 Bonds will be announced on the business day before the expiration date. The final spreads used to calculate the new global bond issue prices may not be less than the indicative ones announced on that date.
(9) The new global bond issue price will be calculated to be the price per $1,000 in principal amount intended to result in a yield to maturity equal to the sum of the reference yield and the new issue spread for the New 2021 Bonds or the reopening spread for the Reopened 2034 Bonds, as applicable, calculated in accordance with standard market practice, rounded to the nearest $0.01.
(10) Payment of cash rounding amount will be rounded to the nearest $0.01.
頁 78 / 247424(b)(3)
2014/03/12file:///C:/blp/data/CFd424b3.htm

Table of ContentsTable of ContentsTable of ContentsTable of Contents
Formulas to Determine Old Bond and New Global Bond Prices
Definitions
N
�
Formulas
S-79
Bond Yield Specified yield to maturity (expressed as a decimal number) of the relevant series of bonds, which is equal to the sum of (x) the reference yield of that series of bonds, plus (y) the spread of that series of bonds, each as specified in the invitation
Coupon The contractual rate of interest payable on of the relevant series of bonds expressed as a decimal number.
N The number of semi-annual payments of interest on the relevant series of bonds, based on the final maturity date (or, September 25, 2023, in the case of the September 2024 Bonds) of such series of bonds, from (but not including) the expected settlement date to (and including) such maturity date or other applicable dates.
S In the case of old bonds, the number of days from and including the interest payment date immediately preceding the expected settlement date up to, but not including, the expected settlement date. In the case of New 2021 Bonds, the number of days from and including July 15, 2010 up to, but not including, the expected settlement date. In the case of the Reopened 2034 Bonds, the number of days from and including April 23, 2010 up to, but not including, the expected settlement date. The number of days is computed using the 30/360 day-count method.
k=1 Summate. The term in the brackets to the right of the summation symbol is separately calculated “N” times (substituting for “k” in that term each whole number shown between 1 and N, inclusive), and the separate calculations are then added together.
Exp Exponentiate. The term to the left of “exp” is raised to the power indicated by the term to the right of “exp.”
AI Accrued interest on the relevant series of old bonds, calculated at the relevant coupon, from and including the interest payment date immediately preceding the expected settlement date up to, but not including, the expected settlement date. In the case of the New 2021 Bonds, an adjustment to account for the length of the first interest period, calculated at the relevant coupon, from and including July 15, 2010 up to, but not including, the expected settlement date. In the case of the Reopened 2034 Bonds, an adjustment to account for the length of the first interest period, calculated at the relevant coupon, from and including April 23, 2010 up to, but not including, the expected settlement date.
Bond Price The applicable price of the relevant series of bonds per $1,000 principal of such bonds. The price is rounded to the nearest $0.01.
AI = U.S.$1,000(Coupon/2)(S/180)
BOND
PRICE =
U.S.$1,000 (1+Bond Yield/2) exp (N-(S/180))
+
N
�
k=1 [ U.S.$1,000 (Coupon/2)
(1+Bond Yield/2) exp (k-(S/180))
] – AI
頁 79 / 247424(b)(3)
2014/03/12file:///C:/blp/data/CFd424b3.htm

Table of ContentsTable of ContentsTable of ContentsTable of Contents
ANNEX B
NON U.S. HOLDER DEEMED REPRESENTATIONS
France
You acknowledge, represent, warrant and undertake that:
United Kingdom
You acknowledge, represent, warrant and undertake that (i) the dealer managers are agents of the Republic only and none of the dealer managers is in any way acting for or advising any of the bondholders in connection with the invitation and/or the cash offering and (ii) none of the dealer managers will be responsible for providing bondholders with the protections afforded to its clients in connection with the invitation and/or the cash offering.
S-80
(a) the new global bonds are offered in France through private placement and no prospectus has been submitted to the clearance procedure of the Autorité des marchés financiers or notified to the Autorité des marchés financiers by the competent authority of an other member state of the European Economic Area;
(b) you are a qualified investor (investisseur qualifié), other than individual, acting for your own account or a provider of investment services relating to portfolio management for the account of third parties (personne fournissant le service d’investissement de gestion de portefeuille pour le compte de tiers) all as defined in Articles L. 411-1, L. 411-2 and D. 411-1 to D. 411-3 of the Code monétaire et financier;
(c) you have contacted and requested the invitation and/or the cash offering documents from one or more of the dealer managers outside France in connection with the invitation;
(d) you have not been solicited in connection with the invitation by the Republic of the Philippines, the dealer managers, or any person acting for or on behalf of any of the foregoing; and
(e) you will not resell directly or indirectly the new global bonds in violation of the French securities laws and regulations.
頁 80 / 247424(b)(3)
2014/03/12file:///C:/blp/data/CFd424b3.htm

Table of ContentsTable of ContentsTable of ContentsTable of Contents
PROSPECTUS
Republic of the Philippines
$3,000,000,000
Debt Securities and/or
Warrants
The Republic will provide specific terms of these securities in supplements to this prospectus. You should read this prospectus and any supplement carefully before you invest. This prospectus may not be used to offer or sell securities unless accompanied by a supplement. The Republic may sell the securities directly, through agents designated from time to time or through underwriters. The names of any agents or underwriters will be provided in the applicable prospectus supplement.
You should read this prospectus and any supplements carefully. You should not assume that the information in this prospectus, any prospectus supplement or any document incorporated by reference in them is accurate as of any date other than the date on the front of these documents.
Neither the Securities and Exchange Commission nor any state securities commission has approved or disapproved of these securities or determined if this prospectus is truthful or complete. Any representation to the contrary is a criminal offense.
This prospectus is dated December 23, 2009.
頁 81 / 247424(b)(3)
2014/03/12file:///C:/blp/data/CFd424b3.htm

Table of ContentsTable of ContentsTable of ContentsTable of Contents
TABLE OF CONTENTS
ii
Certain Defined Terms and Conventions iiiForward-Looking Statements iiiData Dissemination ivUse of Proceeds ivProspectus Summary 1Republic of the Philippines 7
History, Land and People 7Government 7Philippine Economy 19GDP and Major Financial Indicators 26Principal Sectors of the Economy 30Prices, Employment and Wages 38Balance of Payments 42Monetary System 67The Philippine Financial System 72The Philippine Securities Markets 78Public Finance 79The Government Budget 84Debt 86
Description of the Securities 101Description of the Debt Securities 101Description of the Warrants 110Limitations on Issuance of Bearer Debt Securities 111
Collective Action Securities 113Taxation 117
Philippine Taxation 117United States Tax Considerations 118
Plan of Distribution 125Validity of the Securities 126Authorized Representative in the United States 126Experts; Official Statements and Documents 126Further Information 126Debt Tables of the Republic of the Philippines T-1
頁 82 / 247424(b)(3)
2014/03/12file:///C:/blp/data/CFd424b3.htm

Table of ContentsTable of ContentsTable of ContentsTable of Contents
CERTAIN DEFINED TERMS AND CONVENTIONS
Statistical information included in this prospectus is the latest official data publicly available at the date of this prospectus. Financial data provided in this prospectus may be subsequently revised in accordance with the Republic’s ongoing maintenance of its economic data, and that revised data will not be distributed by the Republic to any holder of the Republic’s securities. As used in this prospectus, the term “N/A” identifies statistical or financial data that is not available.
All references in this prospectus to (a) the “Republic” or the “Philippines” are to the Republic of the Philippines, (b) the “Government” are to the national government of the Philippines, (c) the “Administration” are to the current administration of President Gloria Macapagal-Arroyo and (d) “Bangko Sentral” or “BSP” are to Bangko Sentral ng Pilipinas, the central bank of the Philippines.
“Government-owned corporations” or “Government-owned and controlled corporations” are corporations at least 51% of the capital stock of
which is owned by the Government directly or indirectly through its instrumentalities.
The fiscal year of the Government commences on January 1 of each year and ends on December 31 of such year.
Unless otherwise indicated, all references in this prospectus to “Philippine Pesos”, “pesos” or “(Peso)” are to the lawful national currency of
the Philippines, those to “dollars”, “US dollars” or “$” are to the lawful currency of the United States of America and references to “euro”, and
“€” are to the currency introduced on January 1, 1999 at the start of the third stage on European Economic and Monetary Union. References to
“SDR” are to Special Drawing Rights of the International Monetary Fund.
This prospectus contains conversions of some peso amounts into US dollars for the convenience of the reader. Unless otherwise specified, the conversions were made at the exchange rate as stated by the Bangko Sentral Reference Exchange Rate Bulletin published by the Treasury Department of Bangko Sentral on the relevant date. No representation is made that the peso amounts actually represent the US dollar amounts or could have been converted into US dollars at the rates indicated, at any particular rate, or at all.
Any discrepancies in the tables included herein between the amounts listed and the totals thereof are due to rounding.
FORWARD-LOOKING STATEMENTS
Some of the statements contained in this prospectus under “Republic of the Philippines” are forward looking. They include statements concerning, among others,
• the Republic’s economic, business and political conditions and prospects;
• the Republic’s financial stability;
• the depreciation or appreciation of the peso;
• changes in interest rates; and
Actual results may differ materially from those suggested by the forward-looking statements due to various factors. These factors include, but are not limited to:
• governmental, statutory, regulatory or administrative initiatives.
iii
• Adverse external factors, such as high international interest rates and recession or low growth in the Republic’s trading partners. High international interest rates could increase the Republic’s current
頁 83 / 247424(b)(3)
2014/03/12file:///C:/blp/data/CFd424b3.htm

Table of ContentsTable of ContentsTable of ContentsTable of Contents
account deficit and budgetary expenditures. Recession or low growth in the Republic’s trading partners could lead to fewer exports from the Republic and, indirectly, lower growth in the Republic.
• Adverse domestic factors, such as a decline in foreign direct and portfolio investment, increases in domestic inflation, high domestic interest rates and exchange rate volatility. Each of these factors could lead to lower growth or lower international reserves.
DATA DISSEMINATION
The Republic is a subscriber to the International Monetary Fund’s Special Data Dissemination Standard (“SDDS”), which is designed to improve the timeliness and quality of information of subscribing member countries. The SDDS requires subscribing member countries to provide schedules indicating, in advance, the date on which data will be released or the so-called “Advance Release Calendar”. For the Philippines, precise dates or “no-later-than dates” for the release of data under the SDDS are disseminated three months in advance through the Advance Release Calendar, which is published on the Internet under the International Monetary Fund’s Dissemination Standards Bulletin Board. Summary methodologies of all metadata to enhance transparency of statistical compilation are also provided on the Internet under the Dissemination Standards Bulletin Board. The Internet website for the Philippines’ “Advance Release Calendar” and metadata is located at “http://dsbb.imf.org/Applications/web/sddsctycatarclist/?strcode=PHL”.
USE OF PROCEEDS
Unless otherwise specified in the applicable prospectus supplement, the net proceeds from sales of securities will be used for the general purposes of the Republic, including for budget support and to repay a portion of the Government’s borrowings.
iv
• Other adverse factors, such as the recurrence of the outbreak of diseases such as severe acute respiratory syndrome and avian influenza, climatic or seismic events and political uncertainty.
頁 84 / 247424(b)(3)
2014/03/12file:///C:/blp/data/CFd424b3.htm

Table of ContentsTable of ContentsTable of ContentsTable of Contents
1
PROSPECTUS SUMMARY
Republic of the Philippines
General
The Philippine archipelago has over 7,000 islands with a total land area of approximately 300,000 square kilometers. The islands are grouped into three geographic regions: Luzon, the largest island, in the north, covering an area of 141,395 square kilometers; Visayas in the central region, covering an area of 56,606 square kilometers; and Mindanao in the south, covering an area of 101,999 square kilometers. Manila is the Republic’s capital. According to the 2007 census, the Republic’s population is estimated at approximately 88.6 million.
Government and Politics
The Republic’s current constitution was adopted by plebiscite in 1987. The ratification of the new Constitution in 1987 restored a presidential form of government consisting of three branches: executive, legislative and judiciary. Executive power is vested in the President, who is elected by direct popular vote and who may serve one term of six years. Legislative authority is vested in the Congress of the Philippines, which consists of the Senate and the House of Representatives. Judicial power is vested in the Supreme Court and in various lower courts.
President Gloria Macapagal Arroyo was elected to her current six-year term in 2004. Ms. Arroyo, who was then the Vice President, first became President in January 2001, after the impeachment and resignation of former President Joseph Estrada, who was eventually convicted on charges of plunder in 2007. Mr. Estrada was unconditionally pardoned by President Arroyo.
There have been several unsuccessful attempts to remove President Arroyo from office. Allegations of fraud committed during the May 2004 election and graft and corruption during her term have resulted in the filing of numerous impeachment complaints against President Arroyo in the House of Representatives. The most recent complaint, filed on October 13, 2008, was dismissed on November 26, 2008. There have also been military plots to remove President Arroyo from office. However, with the Republic scheduled to hold national elections for all elective positions (including for president) in May 2010, calls for President Arroyo to resign from office have largely been rendered moot. See “Republic of the Philippines—Government—National Elections and Recent Political Developments”.
In her State of the Nation Address on July 27, 2009, President Arroyo addressed the continuing impact of the global financial downturn on the Philippines and the ongoing implementation of measures to address these concerns. She focused on measures to strengthen revenue collection, which include imposition of so-called “sin” taxes on alcohol and tobacco products at proposed higher rates. She also highlighted educational reforms to streamline and strengthen the educational system. President Arroyo also commented on her administration’s ongoing programs to keep the Philippines safe from natural disasters, such as typhoons and floods, as well as efforts to create peace with the Communist Party of the Philippines (“CPP”) and the Moro Islamic Liberation Front (“MILF”).
Over the past three decades, groups of communist rebels and Muslim separatists in the Republic have periodically fought with Government forces. As of the date hereof, peace negotiations with these groups have been largely unsuccessful.
頁 85 / 247424(b)(3)
2014/03/12file:///C:/blp/data/CFd424b3.htm
Table of ContentsTable of ContentsTable of ContentsTable of Contents
2
Economy
The Philippines has a mixed economy in which the Government is directly engaged in certain economic activities through Government-owned and controlled corporations (“GOCCs”) and Government Financial Institutions (“GFIs”). The Government actively encourages domestic and foreign private investment. The Philippines has undertaken liberalization of trade and investment in tandem with the deregulation of the financial system, foreign exchange liberalization, tax reforms, acceleration of privatization, enhancement of competition in the provision and operation of public utilities, and deregulation of the oil and power industries. President Arroyo’s policy priorities for her current six-year term, as announced in June and July 2004, include creating jobs, improving education, balancing the Government’s budget, reducing corruption, promoting the peace process with rebel groups, and reforming the energy and electric power industries.
The principal sectors of the Philippine economy are services, industry and agriculture (including fishery and forestry). The services sector accounted for 48.9% of real gross domestic product (“GDP”) in 2008, including the subsectors of trade (16.7% of real GDP), transportation, communications and storage (8.9% of real GDP) and private services (8.6% of real GDP). The industry sector accounted for 32.8% and the agriculture, fishery and forestry sector accounted for 18.3% of real GDP in 2008.
In 2008, real gross national product (“GNP”) grew 6.2% and real GDP grew 3.8%, compared with real GNP growth of 7.5% and real GDP growth of 7.1%, respectively, for 2007. GDP growth in 2008 resulted from an increase of 5.0% in the industry sector, 3.3% in the service sector, 3.2% in the agriculture, fishery and forestry sector, and 30.8% in net factor income from abroad. GDP growth was primarily attributable to strong growth in private consumption expenditure, which was supported by benign inflation and improved labor market conditions. The continued growth in net factor income from abroad was primarily responsible for GNP growth exceeding GDP growth.
Foreign trade is important to the Philippine economy. In 2008, exports of goods as reported by the National Statistics Office (“NSO”) were equal to 26.5% of the country’s GNP and imports were equal to 30.6% of GNP. Total exports of goods as reported by the NSO were $49.1 billion in 2008. Manufactured goods accounted for 83.5% of the Republic’s exports in 2008. Electronics, machinery and transport equipment and garments have historically been the Republic’s leading manufactured exports.
In 2008, the overall balance of payments position of the Republic recorded a surplus of $89 million, which was considerably lower than the $8.6 billion overall surplus recorded in 2007. This overall change in the balance of payments position was mainly attributable to the deficit in the capital and financial account of $1.9 billion for the year, which was a reversal from the surplus of $3.5 billion in 2007. In addition, the current account surplus of $3.9 billion in 2008 was 45.1% lower than the $7.1 billion surplus recorded in 2007.
As of June 30, 2009, the Republic’s outstanding external debt approved by Bangko Sentral was $51.8 billion, a 5.5% decrease from the $54.8 billion recorded as of June 30, 2008. The decrease was mainly due to net principal payments of approximately $708 million made by debtors during the period and increased offshore investments by Philippine residents, which compensated for foreign exchange revaluation adjustments of approximately $437 million in the same period that resulted from the continued weakening of the dollar against other currencies.
As of June 30, 2009, Bangko Sentral-approved medium and long-term external debt amounted to approximately $46.1 billion. Approximately 51.1% of total Bangko Sentral-approved external debt (including short-term debt) was denominated in US dollars while approximately 28.5% was denominated in Japanese yen. Multi-currency loans from institutions such as the World Bank and the Asian Development Bank (“ADB”) accounted for 10.4% of total Bangko Sentral-approved external debt as of June 30, 2009.
頁 86 / 247424(b)(3)
2014/03/12file:///C:/blp/data/CFd424b3.htm

Table of ContentsTable of ContentsTable of ContentsTable of Contents
3
As of December 21, 2009, the Philippine Stock Exchange composite index closed at 3,020.6, compared to a close of 1,872.9 on December 24, 2008, 3,621.6 on December 28, 2007 and 2,982.5 on December 28, 2006.
In the first eleven months of 2009, the average exchange rate was (Peso)47.748 per US dollar, compared to (Peso)44.475 in 2008 and (Peso)46.148 in 2007 and (Peso)51.314 in 2006, respectively.
The average interest rates for 91-day Treasury bills decreased to 4.2% for the first eleven months of 2009 from an average of 5.4% in 2008, 3.4% in 2007 and 5.4% in 2006.
Beginning in the second half of 2007, the short-term funding markets in the United States experienced credit issues, leading to liquidity disruption in various markets. In particular, subprime mortgage loans in the United States experienced increased rates of delinquency, foreclosure and loss. These and other related events had a significant adverse impact on the global credit and financial markets as a whole, which included the bankruptcy filings by, and, the acquisition, restructuring and nationalization of, certain financial institutions. Regulators in the United States, Europe and Asia took steps in response to the unprecedented conditions facing financial institutions in their jurisdictions. Against the backdrop of the global financial crisis, the Republic has experienced limited exposure to subprime assets and bankrupt financial institutions. Nonetheless, in 2008, the Republic experienced slower growth rates, a weakening of equity prices, lower values for the peso and increasing inflation. In 2009, the Republic’s economy began to exhibit indications of a recovery, although certain of its economic recovery policies have yet to result in positive effects. In the first ten months of 2009, overseas foreign worker (“OFW”) remittance levels exceeded the Republic’s forecasts and supported growth in the economy despite continuing slowdowns in other production sectors, while increased Government spending in an effort to stimulate the economy has resulted in an increasing fiscal deficit.
On June 10, 2009, the Republic revised certain of its macroeconomic assumptions for 2009. It revised the assumption for GDP growth downwards to a range of 0.8-1.8% in 2009 (from a previous assumption of 3.1-4.1% growth as of April 16, 2009) and its assumption for GNP growth was reduced to a range of 2.1-3.1% (from a previous assumption of 2.8-3.8% growth as of April 16, 2009). Exports in 2009 are assumed to contract by 13.0-15.0%, and imports in 2009 are assumed to decline by 8.0-12.0% from their respective levels in 2008. The target budget deficit for 2009 was also increased to approximately (Peso)250.0 billion as a result of the Government’s strategy to stimulate the economy by increasing spending and anticipated lower revenue collections; the (Peso)250.0 billion deficit is expected to be equivalent to approximately 3.2% of GDP in 2009. The assumptions include an expectation that the overall balance of payments position will register a surplus of $4.0-$5.0 billion in 2009.
In the first nine months of 2009, preliminary data indicated that the Republic’s GDP and GNP (at constant 1985 prices) grew 0.7% and 3.3%, respectively. Preliminary data also indicated that the Republic’s balance of payments recorded a surplus of $2.2 billion in the first six months of 2009. However, preliminary data also indicated that the Republic’s exports and imports contracted by 28.9% and 30.2%, respectively, in the first nine months of 2009. In addition, for the first ten months of 2009, preliminary data indicated that the Republic’s budget deficit was (Peso)266.1 billion.
On May 4, 2009, finance ministers of the member countries of the Association of Southeast Asian Nations (“ASEAN”), as well as those of the People’s Republic of China, Japan and the Republic of Korea (together with ASEAN, the “ASEAN Plus Three”) agreed on major components of the Chiang Mai Initiative Multilateralization (“CMIM”), a reserve pooling arrangement designed to address short-term liquidity difficulties in the region and supplement other existing international financial arrangements. Under the CMIM, the ASEAN Plus Three countries would be able to draw from the CMIM’s reserve pool up to a certain percentage of their contribution, with smaller countries being able to draw greater proportionate amounts. The CMIM was originally conceptualized alongside the Chiang Mai Initiative, a bilateral currency swap arrangement established in 2000 to assist the ASEAN Plus Three in mitigating the impact of the 1997 Asian financial crisis and averting similar
頁 87 / 247424(b)(3)
2014/03/12file:///C:/blp/data/CFd424b3.htm

Table of ContentsTable of ContentsTable of ContentsTable of Contents
4
crises in the future. The total amount of the CMIM is expected to be $120.0 billion, with the People’s Republic of China, Japan and the Republic of Korea contributing approximately 80% of the total amount and the members of ASEAN collectively contributing the remainder. The Republic has stated that it will contribute approximately $3.7 billion to the CMIM from its foreign currency reserves. The CMIM is expected to be fully implemented in early 2010.
On September 26, 2009, Typhoon Ketsana made landfall in the Republic, resulting in severe flooding that submerged approximately 80% of Metro Manila at one point. The storm also affected or displaced approximately 1.8 million people. On October 3, 2009, Typhoon Parma made landfall in the northern provinces of the Republic, aggravating the flooding and damage already brought about by Ketsana and causing severe landslides, which rendered roads impassable and increased the number of displaced residents. According to the Republic’s National Disaster Coordinating Council, as of October 11, 2009, these two typhoons resulted in approximately (Peso)15.0 billion in damages. Local and international relief efforts have been made to the affected areas, and the Government is currently considering additional measures, such as a supplemental budget allocation and other additional financings and aid options, to mitigate the damage caused by these storms. Any additional revenue measures, expenditures or financings adopted may have an effect on the Republic’s expected budget deficits for 2009 and 2010.
On May 6, 2009, Fitch Ratings, Ltd. (“Fitch Ratings”) affirmed its long-term foreign and local currency ratings outlook for the Republic at “stable,” while affirming the existing ratings of BB and BB+, respectively. Fitch highlighted the Republic’s strong remittance inflows, manageable external financing requirements and controlled government spending, which resulted in reduction in both the budget deficit and Government debt, as the main reasons for the stable outlook.
On July 24, 2009, Moody’s Investor Services (“Moody’s”) upgraded its long-term foreign and local currency ratings for the Republic to Ba3 from B1, but downgraded its long-term foreign and local currency outlook from “positive” to “stable”. Moody’s reported that the Republic exhibited relative resiliency in its external payments position and showed stability in its financial system. In particular, Moody’s cited the rapid growth in remittance inflows from overseas workers as the primary factor that contributed to the Republic’s improved external payments position.
On September 11, 2009, Standard & Poor’s Ratings Services (“Standard & Poor’s”) affirmed its BB- long-term and B short-term foreign currency sovereign credit ratings for the Republic, as well as the Republic’s BB+ long-term and B short-term local currency sovereign credit ratings. Standard & Poor’s also retained its “stable” outlook for the Republic, noting its resilient and improving external liquidity position, against a challenging external environment, as well as the low likelihood of realization of contingent liabilities posed by the banking system. However, Standard & Poor’s also noted that the outlook may be further adjusted depending on actions by the new administration subsequent to the elections scheduled in May 2010.
頁 88 / 247424(b)(3)
2014/03/12file:///C:/blp/data/CFd424b3.htm

Table of ContentsTable of ContentsTable of ContentsTable of Contents
5
Summary Economic Information of the Republic of the Philippines
Sources: National Statistics Office; National Statistical Co-ordination Board; Bureau of the Treasury; Department of Finance, Bangko Sentral.
2004 2005 2006 2007 2008 2009
(in billions, except as indicated)
GDP (at current market prices) (Peso) 4,872 (Peso) 5,444 (Peso) 6,031 (Peso) 6,647 (Peso) 7,423 (Peso) 5,467GDP (at constant 1985 prices) 1,154 1,212 1,276 1,367 1,419 1,037GDP per capita (in US dollars at
current market prices) $ 1,040 $ 1,159 $ 1,352 $ 1,624 $ 1,845 $ 1,240GDP growth rate (at constant 1985
prices) 6.4% 5.0% 5.3% 7.1% 3.8% 0.7Consumer Price Inflation rate 6.0% 7.7% 6.2% 2.8% 9.3% 3.2%Unemployment rate 11.8% 7.8% 8.0% 7.3% 7.4% 7.5%Government surplus/(deficit) as % of
GDP (3.8)% (2.7)% (1.1)% (0.2)% (0.9)% (4.3) Public sector borrowing requirement (280.8) (187.0) (79.1) 47.9 (91.0) (103.9)Consolidated public sector financial
position (232.1) (100.7) 11.0 21.3 29.2 (47.3)
2004 2005 2006 2007 2008 2009
(percentages, except as indicated)
Current account surplus/(deficit) as % of GDP 1.9% 2.0% 4.5% 4.9% 2.3% 5.2%
Overall balance of payments position as % of GDP (0.3)% 2.4% 3.2% 5.9% 0.1% 2.9%
Gross international reserves (in millions of dollars) $ 16,228 $ 18,494 $ 22,967 $ 33,751 $ 37,551 $ 43,731
2004 2005 2006 2007 2008 2009
(in billions, end of period; except as indicated)
Direct domestic debt of the Republic(Peso)2,001.2 (Peso)2,164.3 (Peso)2,154.1 (Peso)2,201.2 (Peso)2,414.4 (Peso)2,424.2
Direct external debt of the Republic $ 32.2 $ 32.5 $ 34.6 $ 36.3 $ 38.1 $ 40.2Public sector domestic debt (Peso)1,700.0 (Peso)1,745.4 (Peso)1,913.9 (Peso)2,201.8 (Peso)2,336.3 2,508.9Public sector external debt 3,589.2 3,288.5 3,029.7 2,571.8 2,935.1 2,985.3
(1) Preliminary data as of November 26, 2009 for the first nine months of 2009, unless otherwise indicated.
(2) Amounts in pesos have been converted to US dollars using the average Bangko Sentral reference exchange rates for the applicable year.
(3) Preliminary data as of December 4, 2009 for the first eleven months of 2009.
(4) A new methodology of calculating the unemployment rate was applied in April 2005. The old definition of unemployment included all persons as least 15 years old without work who were seeking work, whereas the new definition is restricted to such persons who are immediately available for work. Data for 2005 is computed using the new methodology for the period from July to December of 2005. Under the old methodology, the unemployment rate would have been 11.9% in the first six months of 2005.
(5) Average of January, April, July and October 2009 Labor Force Survey figures.
(6) Represents the aggregate deficit of the Government, the Central Bank-Board of Liquidation (the “CB-BOL”), the Oil Price Stabilization Fund and the 14 GOCCs whose debt comprises virtually all the debt incurred by GOCCs (the “14 monitored GOCCs”).
(7) Preliminary data for the first three months of 2009.
(8) Comprises the aggregate deficit or surplus of the Government, the CB-BOL’s accounts, the 14 monitored GOCCs, the Social Security System, the Government Service Insurance System, Bangko Sentral, the Government financial institutions (“GFIs”) and the local government units.
(9) Preliminary data for the first six months of 2009.
(10) Overall balance of payments has been revised to reflect: late reports, post-audit adjustments and final data from companies. See “Balance of Payments—Revisions” for a more detailed discussion of recent and pending revisions to previously reported data.
(11) Comprises the holdings by Bangko Sentral of gold reserves, foreign investments, foreign exchange and SDRs, including Bangko Sentral’s reserve position in the IMF at period-end. Figures for 2005 have been revised to reflect the reclassification of released collateral from Brady Bonds from non-international reserves to international reserves eligible assets of Bangko Sentral.
(1)
(2)
(3)
(4) (5)
(6) (7)
(8) (7)
(9)
(10) (9)
(11) (12)
(13)
(14) (15)
(14) (15)
(16) (17)
(18) (17)
頁 89 / 247424(b)(3)
2014/03/12file:///C:/blp/data/CFd424b3.htm

Table of ContentsTable of ContentsTable of ContentsTable of Contents
6
(12) Preliminary data as of November 30, 2009.
(13) Amounts in original currencies were converted to US dollars or pesos, as applicable, using the Bangko Sentral reference exchange rates at the end of each applicable period.
(14) Represents debt of the Government only, and does not include other public sector debt. Includes direct debt obligations of the Government, the proceeds of which are on-lent to GOCCs and other public sector entities, but excludes debt guaranteed by the Government and debt originally guaranteed by other public sector entities for which the guarantee has been assumed by the Government.
(15) Preliminary data as of September 30, 2009.
(16) Represents debt of the Government, the 14 monitored GOCCs, the CB-BOL, Bangko Sentral and the GFIs.
(17) Preliminary data as of March 31, 2009.
(18) Includes public sector debt, whether or not guaranteed by the Government.
頁 90 / 247424(b)(3)
2014/03/12file:///C:/blp/data/CFd424b3.htm

Table of ContentsTable of ContentsTable of ContentsTable of Contents
REPUBLIC OF THE PHILIPPINES
History, Land and People
History
Spain governed the Philippines as a colony from 1521 until 1898. On June 12, 1898, during the Spanish-American War, the Filipinos declared their independence. The United States claimed sovereignty over the Philippines under the 1898 Treaty of Paris, which ended the Spanish-American War, and governed the Philippines as a colony until 1935, when the Philippines became a self-governing commonwealth. On July 4, 1946, the Philippines became an independent republic.
Geography and General Information
The Philippine archipelago, located in Southeast Asia, comprises over 7,000 islands and a total land area of approximately 300,000 square kilometers. The Republic groups the islands into three geographic regions: Luzon in the north, covering an area of 141,395 square kilometers, Visayas in the center, covering an area of 56,606 square kilometers, and Mindanao in the south, covering an area of 101,999 square kilometers. The Republic is also divided into 17 administrative regions.
Forests cover approximately 50% of the Philippines, and 47% of the country is under agricultural cultivation. Agriculture, forestry and fishery employed 33.6% of the labor force as of July 2009 and provided approximately 5.7% of the Republic’s export earnings (including exports of agriculture-based products) in 2008. The Republic is a major exporter of certain agricultural products. Manufactured goods comprise the most important category of the Republic’s exports, accounting for 83.6% of the Republic’s exports in 2008. Electronics, machinery and transport equipment and garments have historically been the Republic’s leading manufactured exports.
The Republic’s population was 88.6 million according to the 2007 census, and is projected to reach 92.2 million by the end of 2009. The Republic’s capital, Manila, located in Luzon, had an estimated population of 1.7 million in 2007. The cities of Manila, Pasay, Caloocan, Quezon, Mandaluyong, Las Piñas, Muntinlupa, Marikina, Pasig, Makati, Malabon, Valenzuela, and Parañaque, together with four surrounding municipalities, make up the National Capital Region or Metro Manila. Metro Manila, the most populous of the administrative regions, had an estimated population of 11.6 million people in 2007.
The majority of Filipinos have Malay ethnic origins. Filipino culture also includes strong Spanish, Chinese and American influences. Filipino is the national language, but English is the primary language used in business, government and education. The population speaks over 80 other dialects and languages, including Chinese and Spanish. As of 2000, the Republic’s literacy rate was 92.3%, ranking among the highest in Asia.
Christianity, primarily Roman Catholicism, is the predominant religion in the Philippines. A significant Muslim minority lives in Mindanao.
Government
Governmental Structure
Since 1935, the Republic has had three constitutions. The country adopted the current Constitution by plebiscite in February 1987 after Ferdinand Marcos, who had ruled for 20 years, was ousted a year earlier in favor of Corazon Aquino (who opposed Marcos in the 1986 presidential election) following a people’s uprising. The new Constitution restored a presidential form of government comprised of three branches: executive, legislative and judicial.
The principal features of each branch are as follows:
7
• Executive—The President, elected by popular vote for a single, six-year term, exercises executive power. If the President dies, becomes permanently disabled or is removed from office or resigns, the
頁 91 / 247424(b)(3)
2014/03/12file:///C:/blp/data/CFd424b3.htm

Table of ContentsTable of ContentsTable of ContentsTable of Contents
Vice President acts as President for the remainder of the term. If the Vice President cannot serve, the President of the Senate or, if he cannot serve, the Speaker of the House of Representatives acts as President until the election and qualification of a new President or Vice President. The person acting as President for any remaining term may, if elected, serve a six-year term as President.
• Legislative—Congress, comprised of the Senate and the House of Representatives, exercises the Republic’s legislative authority. The Constitution mandates a Senate of 24 members and a House of Representatives of not more than 250 members, all elected by popular vote. Senators serve for a term of six years and members of the House of Representatives for a term of three years. The country held elections for 12 Senators and all members of the House of Representatives in May 2004. The remaining 12 Senators were elected in May 2007.
• Judicial—The Supreme Court and any lower courts established by law exercise the Republic’s judicial authority. The Republic’s court system is a multi-tiered system of courts of general jurisdiction that includes the Supreme Court and the Court of Appeals. Below these are the Regional Trial Courts, Metropolitan Trial Courts, Municipal Trial Courts and Municipal Circuit Trial Courts, which constitute courts of original jurisdiction.
Special or administrative tribunals and quasi-courts also exercise judicial functions. Included in this category are constitutional commissions, the Sandiganbayan (a special court with jurisdiction over criminal and civil cases involving graft and corruption in the Government), the Court of Tax Appeals, the Shari’ah courts (which handle matters governed by Islamic law) and administrative agencies that handle specialized areas such as labor relations and securities regulation.
A Chief Justice and 14 Associate Justices constitute the Supreme Court, which supervises all lower courts and related personnel. The Supreme Court and the Court of Appeals may review decisions and rulings of lower courts and quasi-judicial tribunals. The President appoints each Supreme Court or Court of Appeals justice and lower court judge from at least three candidates nominated by the Judicial and Bar Council.
National Elections and Recent Political Developments
On May 10, 2004, national elections were held for the positions of President, Vice President, 12 Senators, all members of the House of Representatives and most local government posts. On June 24, 2004, a joint session of Congress declared Gloria Macapagal-Arroyo and Noli de Castro as President-elect and Vice President-elect, respectively. They began their six-year terms on June 30, 2004.
Ms. Arroyo, who was then the Vice President, first became president in January 2001 after former President Joseph Estrada was subject to allegations of corruption, which culminated in impeachment proceedings, mass public protests in Manila, withdrawal of support by the military and his eventual resignation from office. Former President Estrada was arrested and charged with perjury and plunder. On September 12, 2007, he was convicted of plunder by the Sandiganbayan and was sentenced to life imprisonment. On October 25, 2007, President Arroyo unconditionally pardoned former President Estrada.
Both President Arroyo and Vice President de Castro are members of the ruling Koalisyon ng Katapatan at Karanasan para sa Kinabukasan (Coalition of Integrity and Experience for the Future or “K4”) coalition. In the May 2004 elections, the K4 coalition enlarged its majority in both the Senate and the House of Representatives in the 13th Congress, which convened on July 26, 2004. Certain opposition candidates, including defeated presidential candidate Fernando Poe, Jr., questioned the election results, alleging fraud and disenfranchisement of voters. These allegations of fraud intensified in early June 2005, after the revelation that President Arroyo had spoken with an official from the independent Commission on Elections during the counting of votes. President Arroyo maintains that she won the 2004 elections fairly and has cited the approval of international election observers and the National Movement for Free Elections, a Philippine non-governmental organization dedicated
8
頁 92 / 247424(b)(3)
2014/03/12file:///C:/blp/data/CFd424b3.htm

Table of ContentsTable of ContentsTable of ContentsTable of Contents
to free, orderly and honest elections. Similarly, in connection with the May 2004 elections, defeated vice-presidential candidate, Senator Loren Legarda filed a case against current Vice President Noli de Castro, alleging fraud in the ballot procedures that determined the national election results. On June 5, 2007, a presidential electoral tribunal dismissed the case.
Since July 2005, impeachment complaints have been filed by several citizens and opposition lawmakers in the House of Representatives against President Arroyo alleging, among other things, culpable violation of the Constitution, graft, corruption and betrayal of public trust. The Constitution allows a single impeachment proceeding against the President for each 12 month period after a complaint is filed. All impeachment complaints against President Arroyo have been dismissed, the most recent of which was filed on October 13, 2008 and dismissed on November 26, 2008.
There have been several attempts by military groups to remove President Arroyo from office. On February 24, 2006, President Arroyo issued Proclamation 1017, which declared a state of national emergency in response to an alleged coup d’état attempt. In connection with the proclamation, several opposition members were arrested or threatened with arrest. All public rallies, including planned demonstrations to mark the twentieth anniversary of the revolution that ended the presidency of former President Marcos, were discouraged. On March 3, 2006, President Arroyo lifted the state of national emergency. Several constitutional challenges to President Arroyo’s Proclamation 1017 were filed with the Supreme Court, but the Supreme Court upheld the President’s authority to declare a state of emergency and to call upon the armed forces to prevent or suppress lawless violence. However, provisions of the proclamation that gave the President the power to (i) issue decrees; (ii) direct the Armed Forces of the Philippines to enforce obedience to laws not related to lawless violence as well as decrees promulgated by the President; and (iii) impose standards on media or any form of prior restraint on the press, were ruled unconstitutional. Certain acts committed by law enforcement officers in furtherance of Proclamation 1017 were also declared unconstitutional.
On July 7, 2006, the joint Armed Forces of the Philippines (“AFP”) and the Philippine National Police (“PNP”) arrested eight people, including six military officers, in Quezon City in connection with an alleged plot to seize control of the Government during President Arroyo’s State of the Nation Address on July 24, 2006. The six military officers were identified as members of the group of soldiers who demanded President Arroyo’s resignation during the armed occupation of a luxury apartment-hotel in Manila’s financial district in July 2003.
On November 29, 2007, another group of military officers, led by former Lieutenant and current Senator, Antonio Trilianes IV, walked out of their ongoing trial for the armed takeover of a luxury apartment-hotel in Manila’s financial district in 2003 and forcibly occupied another luxury hotel in the same area while calling for President Arroyo’s resignation. They were joined by a former vice president, Teofisto Guingona Jr. After a brief standoff with Government forces, the perpetrators peacefully surrendered on the same day. On December 3, 2007, they were charged with rebellion; but on December 14, 2007, the charges against 18 civilians involved in the November 29 incident, including former Vice President Guingona, were dismissed. The proceedings against Senator Trilianes and the military officers are ongoing.
On several occasions the Supreme Court has declared certain executive actions taken in response to recent events unconstitutional or null and void. In a unanimous decision, the Supreme Court declared unconstitutional Executive Order 464, which was issued by the President on September 28, 2005 to prohibit members of the executive branch from appearing before Congress in legislative hearings unless they had obtained permission from the President. In another unanimous decision, the Supreme Court declared null and void the Government’s calibrated preemptive response (“CPR”) policy with respect to rallies and assemblies against the Government. The CPR policy had been implemented by the Government during the state of emergency and directed law enforcement to be proactive in preventing violence and opposition gatherings.
On August 24, 2006, Sigaw ng Bayan (“Cry of the Nation”) and the Union of Local Authorities of the Philippines, two groups leading an initiative to amend the 1987 Constitution to provide for a parliamentary
9
頁 93 / 247424(b)(3)
2014/03/12file:///C:/blp/data/CFd424b3.htm

Table of ContentsTable of ContentsTable of ContentsTable of Contents
federal form of government, submitted approximately ten million signatures to the Commission on Elections. On October 25, 2006, the Supreme Court rejected the initiative on the grounds that the initiative failed to comply with the constitutional requirements for conducting such an initiative. However, on November 21, 2006, in a motion for reconsideration brought by representatives of Sigaw ng Bayan, the Supreme Court overturned a case that formed the basis of their earlier decision that the initiative process was unconstitutional and opened the possibility for a future initiative.
In December 2006, Congress convened a constituent assembly comprising members of the Senate and the House of Representatives to discuss constitutional changes, but adjourned the assembly after deciding to pursue constitutional reforms through a constitutional convention. Despite President Arroyo’s intermittent calls for further discussion on the matter, in early 2007, Speaker of the House Jose de Venecia announced that he would postpone initiating talks on proposed constitutional changes until 2008. However, on February 5, 2008, the House of Representatives, approved a motion to remove Representative de Venecia from his position as Speaker, due to alleged corruption and mismanagement.
On June 2, 2009, the House of Representatives approved House Bill No. 1109, which again called for the convening of a constituent assembly to discuss constitutional changes. The bill was opposed by numerous social and civic sectors of the Republic, as well as by certain members of the House of Representatives and the Senate for being passed solely by the House of Representatives without the involvement of the Senate. Under the Constitution, a constituent assembly must be composed of members of both houses of Congress. Further discussions on the bill in Congress have been deferred, and discussions of the bill are expected to resume after the general elections scheduled in May 2010.
On August 25, 2009, a House of Representatives committee on constitutional amendments approved a resolution calling for a constitutional convention to propose amendments to the Constitution. The delegates to the constitutional convention are proposed to be elected in the barangay(villages, which are the basic political unit of the Republic) elections of the Republic scheduled for October 25, 2010, with each of the 219 congressional districts of the Republic allotted one delegate. The resolution was set to be approved by plenary voting of the House of Representatives, but on October 12, 2009, the House of Representatives committee on appropriations disapproved the corresponding budget proposal for the constitutional convention, citing that such appropriations should be directed towards the Republic’s relief efforts with respect to recent natural calamities and that the funding for the constitutional convention be reallocated from the budget of the Commission on Elections.
The Republic is expected to hold general elections in May 2010 to elect all national and local elective officials of the Republic, including a new president. Among the candidates who have filed their respective certificates of candidacy for president are Senator Benigno Aquino III, son of the assassinated former senator Benigno “Ninoy” Aquino, Jr. and the late former President Corazon Aquino, former President Joseph Estrada, Secretary of Defense Gilberto Teodoro and senator and real estate magnate Manuel Villar.
On November 23, 2009, the Republic suffered its worst instance of election-related violence when 57 people were killed in the province of Maguindanao in the Mindanao region. Various human rights groups condemned the mass killing, and in response, on December 4, 2009, President Arroyo issued Proclamation No. 1959 declaring martial law in the province of Maguindanao. Proclamation No. 1959 is currently being challenged in the Supreme Court by civic groups and other lawmakers for being without basis under the Constitution.
Administrative Organization
As of September 30, 2009 the Republic had 17 regions and 43,725 local Government units. Local Government units included 80 provinces, 120 cities, 1,514 municipalities (subdivisions of provinces) and 42,011 barangays. Highly urbanized cities function independently of any province, while other cities are subject to the administrative supervision of the provinces in which they are located.
10
頁 94 / 247424(b)(3)
2014/03/12file:///C:/blp/data/CFd424b3.htm

Table of ContentsTable of ContentsTable of ContentsTable of Contents
The Government is organized primarily around the various departments and department-equivalent agencies of the executive branch, which implement the various programs and projects of the Government. The departments and department-equivalent agencies are grouped into the following five sectors.
Government Corporations
Sector Major Departments
Social services Health; Education, Culture and Sports; Labor and Employment; Social Welfare and Development
Economic services Agriculture; Agrarian Reform; Energy; Environment and Natural Resources; Tourism; Trade and Industry; Public Works and Highways; Transportation and Communications; Science and Technology
Defense National Defense
General public services Foreign Affairs; Finance; Budget and Management; Interior and Local Government; Justice; National Economic and Development Authority; Office of the Press Secretary; Autonomous Region of Muslim Mindanao; Cordillera Administrative Region
Constitutional offices General Public Services (Elections, Audit, Civil Service, Public Order and Safety, Office of the Ombudsman), Social Services (Human Rights)
The Government owns or controls a number of corporations that provide essential goods and services to the public and work with the private sector to encourage economic growth and development. Originally restricted to basic public services and national monopolies, the number of Government corporations grew from 13 in the 1930s to 301 by 1984.
As of August 31, 2009 there are approximately 741 Government-owned and/or Government-controlled corporations, including subsidiaries.An executive department for policy and program coordination oversees the activities of these corporations.
The Government closely monitors 14 major non-financial Government corporations engaged in various major business activities by recording their individual contributions to the public sector deficit or surplus position and other financial indicators. These 14 corporations, referred to as the 14 monitored GOCCs, and their areas of activity are as follows:
11
Government Corporation Business Activity
National Power Corporation power generation and transmission
National Electrification Administration holding company, power
Metropolitan Waterworks and Sewerage System water utilities
Local Water Utilities Administration water utilities
Philippine Export Zone Authority area development
National Food Authority agriculture
National Irrigation Administration agriculture
Philippine National Railways transportation
頁 95 / 247424(b)(3)
2014/03/12file:///C:/blp/data/CFd424b3.htm

Table of ContentsTable of ContentsTable of ContentsTable of Contents
These Government corporations currently account for a significant proportion of the Republic’s domestic and external debt. As of March 31, 2009, the 14 monitored GOCCs listed above had aggregate domestic and external liabilities of approximately (Peso)1.3 trillion, which comprised a majority of the liabilities incurred by Government corporations.
The Government has in recent years implemented a general policy to improve the corporate governance and financial performance of GOCCs by encouraging adequate contribution by these GOCCs to the Government’s fiscal consolidation efforts, integrity, efficient and effective delivery of public services, sustainability, transparency and accountability. Further to its privatization strategies, the Government has also sought decreased intervention in the business affairs of other GOCCs in view of its policy for GOCCs to be self-sustaining; however, in certain instances, the Government supports the transactions of such corporations by acting as guarantor for obligations and providing other assistance as it deems necessary and as may be allowable under law.
The Government currently closely monitors the contribution to the public sector deficit or surplus, and other financial indicators, of three Governmental financial institutions that provide credit to enterprises in support of public policies. These include two specialized Government banks—the Development Bank of the Philippines and the Land Bank of the Philippines. For a description of the Development Bank and the Land Bank, see “—The Philippine Financial System—Structure of the Financial System”. The third Government financial institution, the Trade and Investment Development Corporation of the Philippines (formerly Philippine Export and Foreign Loan Guarantee Corporation), guarantees foreign currency loans to exporters and contractors. As of March 31, 2009, the three monitored Governmental financial institutions had aggregate domestic and external liabilities of (Peso)615.5 billion.
Arroyo Administration Policy
Government Corporation Business Activity
Light Rail Transit Authority transportation
Philippine Ports Authority transportation
National Development Company financing/investment
Philippine National Oil Company holding company
National Housing Authority housing
Home Guaranty Corporation housing insurance
On June 28, 2004, President Arroyo announced a ten-point agenda of policy priorities for her six-year term in office. The President’s agenda includes the following goals:
• creating six to ten million jobs in six years through increased support for entrepreneurs, increased lending to small and medium enterprises and the development of one to two million hectares of land for agriculture;
• improving education through construction of new classrooms, provision of books and supplies for students and increasing scholarships to poor families;
• balancing the Government budget;
• expanding transportation networks and digital infrastructure to link the entire country;
• providing electricity and water to local communities across the country;
12
• alleviating congestion in Metro Manila by establishing new government and housing centers in other regions;
頁 96 / 247424(b)(3)
2014/03/12file:///C:/blp/data/CFd424b3.htm

Table of ContentsTable of ContentsTable of ContentsTable of Contents
• developing the Clark Special Economic Zone and the Subic Bay Freeport Area as international service and logistics centers;
• increasing the use of automation in the electoral process;
• completing the peace negotiation process with rebel groups in the Philippines; and
In December 2004, President Arroyo approved the Medium-Term Philippine Development Plan 2004–2010, which provides comprehensive details of the measures intended to achieve the Government’s basic goal of poverty reduction and economic growth, as well as the President’s specific ten-point agenda.
As part of its economic growth agenda, the Government announced in 2004 a fiscal consolidation program that aims to achieve a balanced budget by 2010 and reduce the ratio of consolidated public sector deficit to GDP to 1.0% by 2010 from the ratio of 4.8% in 2004. As part of this initiative, the Government proposed eight priority legislative revenue measures, four of which have been passed into law. Taxes were increased on alcohol and tobacco in December 2004. A lateral attrition system was signed into law in January 2005 that provides for a series of rewards and penalties at the Bureau of Internal Revenue and the Bureau of Customs for officials and employees who exceed or fall short of revenue collection quotas.
In May 2005, President Arroyo signed into law the Reformed Value-Added Tax Act of 2005, ending certain value added tax (“VAT”) exemptions on power, electricity, and air and sea transport, raising the corporate tax rate from 32.0% to 35.0%, and granting the President “standby authority” to raise the rate of sales tax from 10.0% to 12.0% in 2006. After a challenge to the constitutionality of the law in the courts, on September 1, 2005, the Supreme Court upheld the constitutionality of the Reformed Value-Added Tax Act of 2005, and the law was implemented on November 1, 2005. The Reformed Value-Added Tax Act required the President to raise the VAT upon the recommendation of the Secretary of Finance from 10.0% to 12.0%, effective February 1, 2006 if either the VAT to GDP ratio in 2005 was greater than 2.8% or the Government deficit-to-GDP ratio in 2005 was greater than 1.5%. In 2005, the VAT to GDP ratio was 2.9% while the deficit to GDP ratio was 2.7%. The expanded VAT was subsequently raised to 12.0% effective February 1, 2006. Additional tax reform measures, which are intended to stimulate economic growth, include a decrease in corporate tax rate from 35.0% to 30.0% effective on January 1, 2009.
In May 2007, the Tax Amnesty Law, one of President Arroyo’s priority revenue measures, became effective. The Tax Amnesty Law increased Government revenues from tax collections primarily by encouraging delinquent taxpayers to pay taxes owed to the Government. The amnesty law exempted taxpayers who complied with its conditions from certain taxes, as well as from administrative, civil and criminal penalties in relation to delinquent payments. The amnesty law covered all national internal revenue taxes for 2005 and prior years, as well as most taxpayer categories in the Philippines, including resident and non-resident individuals, estates and trusts, corporations and cooperatives. The Department of Finance reported that the Tax Amnesty Law contributed approximately (Peso)4.7 billion in additional tax revenues to the Government as of March 31, 2008.
In her State of the Nation Address on July 24, 2006, President Arroyo focused on improving the Republic’s global competitiveness. The President outlined five main strategies for achieving this goal: (1) making food plentiful and affordable to keep labor costs globally competitive; (2) reducing the cost of electricity to make factories regionally competitive; (3) modernizing infrastructure to efficiently transport people and goods; (4) mobilizing, upgrading and disseminating knowledge and technologies to enhance productivity; and (5) reducing bureaucracy in all government agencies to lower transaction costs. President Arroyo promised significant public investment in infrastructure projects and divided the country into five “super regions” that are to benefit from substantial investments planned by the Government in coming years—North Luzon, Metro Luzon, Central Philippines, Mindanao and the Cyber Corridor, a region that cuts across the length of the other four regions. In North Luzon and Mindanao, the Government aimed to prioritize agribusiness investments. In Metro Luzon, the Government planned to develop a globally competitive urban, industrial and services center. In
13
• promoting reconciliation among opposing political movements.
頁 97 / 247424(b)(3)
2014/03/12file:///C:/blp/data/CFd424b3.htm

Table of ContentsTable of ContentsTable of ContentsTable of Contents
Central Philippines, the Government targeted investments towards improving tourism infrastructure. In the Cyber Corridor, planned investments focused on information and communications technology, call centers and business process outsourcing.
In her State of the Nation Address on July 23, 2007, President Arroyo focused on funding the following projects in three separate categories over the next three years: (1) investments in physical, intellectual, legal and security infrastructure to increase business confidence; (2) investments in a stronger and wider social safety net, including more affordable medicines, affordable housing and education; and (3) investments in anti-terrorism projects and bringing peace to Mindanao. President Arroyo further explained these priorities in the context of the five super regions outlined in her State of the Nation address from the previous year. In the Mindanao, Metro Luzon and North Luzon super regions, the Government aims to continue prioritizing agribusiness investments and providing better airports, bridges and a sufficient supply of energy. In the Central Philippines super region, the Government aims to protect the region’s natural beauty and provide the means for tourists to travel. In the Cyber Corridor super region, investments are intended to focus on value-added services in the information and communications technology, call center and business process outsourcing industries.
In her State of the Nation Address on July 28, 2008, President Arroyo addressed the impact of the global financial crisis on the Philippines by proposing the following solutions: (1) a targeted and precise strategy to ease the price challenges facing the country; (2) food self-sufficiency, decreased energy dependence, and greater self-reliance overall as a nation; and (3) not sacrificing long term reforms for short-term relief. President Arroyo also highlighted the importance of fiscal reforms, such as maintaining the VAT, to accomplish these objectives, explaining that the VAT contributes to investor confidence, the recent strength of the peso in the world market and revenue for the Government to meet its fiscal needs. President Arroyo highlighted the importance of improving current agrarian reform programs, as a response to the rice shortage in the past year.
In her State of the Nation Address on July 27, 2009, President Arroyo addressed the continuing impact of the global financial crisis on the Philippines and the ongoing implementation of measures to address these concerns. She focused on measures to strengthen revenue collection, which include collection of so-called “sin” taxes on alcohol and tobacco products at proposed higher rates. She also highlighted educational reforms to streamline and strengthen the educational system. President Arroyo also commented on her administration’s ongoing programs to keep the Philippines safe from natural disasters, such as typhoons and floods, as well as the efforts to create peace with the CPP and the MILF.
A number of President Arroyo’s policy goals that were set out in the 2006 to 2009 State of the Nation speeches have been implemented. As of July 2009, 39 infrastructure projects in the super regions have been completed, and another 67 projects are still in progress. In addition, as of July 2009, 51 airport projects, 222 road and bridge projects and 144 port projects were also completed by the Arroyo administration. To achieve long-term food supply sufficiency, the Arroyo administration commissioned the FIELDS (Fertilizer, Irrigation, Extension and Education, Loans, Dryers and Seeds) program in April 2008. In terms of agrarian reform, as of March 2009, approximately 1.8 billion hectares of land has been redistributed by the Arroyo administration since 2001 to indigenous people and farmers. The Arroyo administration also restructured the Republic’s school system through its reorganization of the basic curriculum and Ladderized Educational Program for accelerated attainment of vocational degrees. In 2008, the passage of the Cheaper Medicines Act and the expansion of Philippine Health Insurance Corp. (“PhilHealth”) coverage helped to improve healthcare affordability.
Internal Conflict with Rebel Groups
Over the past three decades, rebel groups in the Republic have periodically fought against Government forces. Armed conflict has continued between the Government and various rebel groups, mainly communist rebels and Muslim separatists.
Abu Sayyaf and Moro Islamic Liberation Front. In 2003, the AFP launched sustained military offensives against the MILF and the Abu Sayyaf guerrilla group, which the Government held responsible for a series of
14
頁 98 / 247424(b)(3)
2014/03/12file:///C:/blp/data/CFd424b3.htm

Table of ContentsTable of ContentsTable of ContentsTable of Contents
bombings and raids in the southern region of Mindanao and elsewhere. Leaders of the MILF, the largest Muslim separatist group in the Philippines, condemned the attacks and denied that they target civilians. The United States and the United Kingdom have issued advisories against travel to Mindanao, where rebel groups are most active.
The United States has sent troops and military advisers to assist the AFP in its conflict with the Abu Sayyaf. In July 2002, the United States and the Republic entered into a sustained military cooperation agreement that provides for annual training exercises involving both Philippine and US soldiers. In July 2005, US and Philippine military forces launched a joint operation in Mindanao to capture the leader of the Abu Sayyaf. Sporadic fighting between the AFP and the Abu Sayyaf continues despite the AFP’s claim in 2008 that fewer than 500 Abu Sayyaf guerrillas remain in Mindanao. The Government has reiterated its policy of not negotiating with terrorist organizations, including the Abu Sayyaf. The MILF continues to condemn attacks against the Abu Sayyaf. On December 6, 2007, 14 members of the Abu Sayyaf were convicted by a local court for the abductions of an American missionary couple and 18 others in a 2001 kidnapping spree during which an American missionary was killed.
Peace negotiations between the Government and the MILF continue. The Government and the MILF held the twelfth round of exploratory talks, focusing on ancestral domain issues in Mindanao on May 2-4, 2006 in Malaysia. The issue of the territorial definition of a proposed autonomous Bangsamoro (which is the historical name for the traditionally Muslim portions of Mindanao) remains a source of disagreement. In response to armed clashes between the Government and the MILF in late June and early July of 2006, representatives from the AFP, PNP and the MILF entered into an agreement on July 11, 2006 establishing four demilitarized buffer zones in the Maguindanao province of southern Mindanao, to be jointly guarded by representatives from both the MILF and the Government. On September 7, 2006, another round of peace talks between the Government and the MILF were held in Kuala Lumpur, Malaysia, but these talks were suspended pending the presentation of a new proposal from the Government regarding ancestral lands and an autonomous Bangsamoro homeland. The Government submitted its proposal on these issues to the MILF in November 2006. The Government continues to conduct communication with the MILF through the Malaysian secretariat of the International Monitoring Team, the group responsible for monitoring the ceasefire in Mindanao. In December 2006, Japan contributed to the peace process by providing grants for infrastructure development and social services in Bangsamoro.
Despite the ongoing peace talks between the Government and the MILF, there have been sporadic clashes in the southern part of the Philippines between Muslim fighters and Government armed forces. For example, on July 12, 2007, Islamic militants in Basilan, a province in Mindanao, killed 14 AFP marines, beheading ten of them.
The Government was scheduled to resume talks with the MILF in Kuala Lumpur, Malaysia on December 4, 2007, but the talks were postponed until January 2008 to give both parties more time to prepare. On January 10, 2008, the Arroyo administration announced its willingness to consider a constitutional amendment to adopt a federal system of government to address some of the MILF’s demands for greater autonomy for a Bangsamoro homeland. Exploratory talks resumed on January 30, 2008, but were again postponed without any significant developments.
On July 16, 2008, the Government and the MILF drafted a Memorandum of Agreement on Ancestral Domains (“MOA-AD”), whereby a national plebiscite would be held six months after signing the MOA-AD to determine whether the Muslim regions in Mindanao would separate to form an autonomous state. Petitions were filed by various lawmakers in the Supreme Court to invalidate the MOA-AD on grounds of unconstitutionality, and on August 4, 2008, a temporary restraining order was granted prohibiting the signing of the MOA-AD while the Supreme Court deliberated on the merits of the petitions. On October 14, 2008, the Supreme Court rendered the MOA-AD null and void on the basis that it purports to amend the Constitution by persons who do not have the power to make constitutional amendments and usurps legislative powers that are vested in Congress. Sporadic violence in the Mindanao region continues, with MILF rebels targeting Christian villages and other civilians.
15
頁 99 / 247424(b)(3)
2014/03/12file:///C:/blp/data/CFd424b3.htm

Table of ContentsTable of ContentsTable of ContentsTable of Contents
In January 2009, President Arroyo constituted a new Government panel to resume formal talks with the MILF, and also initiated informal discussions on the peace process with political leaders in Mindanao. On July 23, 2009, to expedite the resumption of formal discussions, the Government declared a suspension of all offensive military operations against the MILF, and on July 25, 2009, the MILF declared a similar suspension of military operations. The Government expects discussions to resume and a final peace accord to be concluded in 2010.
On September 29, 2009, two American soldiers and one Filipino soldier were killed in an explosion in the southern Philippine province of Sulu on Jolo Island in Mindanao. Sulu province is an area where the Abu Sayyaf has been active. On January 15, 2009, three members of the International Committee of the Red Cross were abducted in the area by an organization affiliated with the Abu Sayyaf. These individuals have since been released.
In September 2009, an International Contact Group (“ICG”), composed of representatives from the United Kingdom, Japan and Turkey, along with representatives of several non-governmental organizations, was formed to aid in brokering the resumption of talks between the parties. On December 8 and 9, 2009, formal peace talks between the parties resumed in Kuala Lumpur, Malaysia, with members of the ICG in attendance.
Communists and Affiliated Groups. In 2002, the United States and the European Union placed the CPP and the CPP’s armed affiliate, the New People’s Army (“NPA”), on their lists of “foreign terrorist organizations”. As a result, the United States and European governments have frozen financial accounts linked to these groups and restricted travel of CPP and NPA members in the United States and the European Union. The Government and the National Democratic Front (“NDF”), a political organization closely aligned with the CPP and NPA, have held three rounds of peace talks in Oslo, Norway, since February 2004. However, sporadic fighting between the NPA and AFP has continued and a fourth round of peace talks originally planned for August 2004 was postponed indefinitely by the NDF. The NDF has indicated it will not participate in further formal talks as long as the CPP and NPA are designated as a “terrorist organization” by the United States government. At the beginning of August 2005, in response to inconsistent statements by the NDF about its intentions to continue negotiations, the Government gave the NDF 30 days notice of its indefinite suspension of the Joint Agreement on Safety and Immunity Guarantee, which protects 97 members of the NDF from arrest.
Officials of the NDF and representatives of the Government commenced informal meetings in Oslo, Norway in August 2005. Effective September 30, 2005, the Government withdrew its notice regarding suspension of immunity guarantees to the NDF in an effort to resume formal peace talks. The Government indicated that its participation in any further peace negotiations with the NDF, the CPP and the NPA are conditional upon an immediate nationwide ceasefire, a definitive timeframe and agenda for, and a demonstrated commitment by, the NDF, the CPP and the NPA, to the peace process.
On June 16, 2006, President Arroyo ordered the Secretary for Budget and Management to release (Peso)1 billion to the AFP and the PNP to finance security operations against the NPA. On July 5, 2006, President Arroyo announced her intention to sign executive orders that would consolidate the resources of the PNP and the AFP in a combined campaign including security operations directed at armed adversaries of the Government, development assistance directed at poor communities and good governance initiatives directed at the local governments.
In early July 2006, members of the NDF requested the Government to resume peace talks and end the security operations against the NPA. NDF chairman, Luis Jalandoni, announced that members of the NDF had been dispatched to Norway for consultation with the Norwegian foreign ministry, which has been working as a mediator between the NDF and the Government for several years. On July 5, 2006, the Government encouraged exiled leaders of the CPP and the NDF to show goodwill by agreeing to an immediate ceasefire and dropping their condition to the resumption of the negotiations that the European Union and the United States delist the CPP and NPA as terrorist organizations. The Government stated that if the exiled leaders agree to its proposals, it will grant them safe passage to return to the Philippines. The peace negotiations between the Government and the NDF have not resumed.
16
頁 100 / 247424(b)(3)
2014/03/12file:///C:/blp/data/CFd424b3.htm

Table of ContentsTable of ContentsTable of ContentsTable of Contents
On July 14, 2006, President Arroyo signed Executive Order 546, which directs the PNP and local officials to actively support the AFP in joint military and police operations against communist rebel groups. The goal of the campaign was to end nearly 40 years of communist insurgency in the Philippines.
In 2007, the AFP outlined a three-year strategy to end the communist insurgency by the end of President Arroyo’s term in 2010. However, following the implementation of the strategy the military was criticized for alleged human rights violations and on November 26, 2007, the UN Human Rights Council, following its investigation into the deaths and disappearances of certain leftist leaders in the Philippines, announced its conclusion that the AFP had killed those leftist activists as part of a campaign against communist insurgents. The UN Human Rights Council also concluded that the combat operations impeded the NDF’s and CPP’s willingness to participate in talks with the Government. In light of the criticism, the armed forces are focusing less on combat operations and more on information campaigns and development projects to counter civilian support for the NPA.
Although formal peace talks with communist-affiliated groups have been suspended since August 2004, the peace process has proceeded through “informal engagements” that are designed to allow both parties to speak informally and with no pre-agreed agenda. As a result of the informal talks that occurred on May 13-15, 2008 and November 28-30, 2008, both parties agreed to work towards the resumption of formal talks. However, this consensus subsequently dissolved over disagreement about the duration of an accompanying ceasefire. Ultimately, informal negotiations continued and the Government lifted the suspension of the Joint Agreement on Safety and Immunity Guarantees on July 17, 2009 to allow members of the NPA to prepare for meetings scheduled in August 2009 in Norway. However, these meetings were cancelled due to disagreements between the parties over recently added NDF conditions to the resumption of talks.
On November 4, 2009, Presidential Adviser on the Peace Process Annabelle T. Abaya stated that peace talks between the Government, the CPP and NDF may resume by December 2009. Abaya noted that the NDF was “open and hopeful” to the resumption of the peace process, and cited the arrival of Norwegian mediators in the country for the purpose of reopening discussions.
International Relations
The Philippines places a high priority on expanding global trade through a multilateral framework of principles and rules that respect individual countries’ policy objectives and levels of economic development. The Republic’s participation in various international organizations, such as the World Trade Organization, the International Monetary Fund (“IMF”), the International Bank for Reconstruction and Development (the “World Bank”) and the Asian Development Bank (“ADB”), allows it to encourage liberalized trade and investment and to discuss global issues
that affect the Republic’s economy.
The following table shows the Republic’s capital participation in, and loans obtained from, major international financial organizations.
MEMBERSHIP IN INTERNATIONAL FINANCIAL ORGANIZATIONS
17
Name of Organization Date of Admission Subscribed
Capital
Share
Capital
Paid In
Loans
Outstanding
(in millions, except for percentages)
International Monetary Fund December 1945 SDR 879.9 — SDR 879.9 0International Bank for Reconstruction and Development December 1945 $825.6 0.4% $48.9 $1,734.0Asian Development Bank December 1966 $1,205.0 2.4% $84.4 $4,624.1
(1) As of December 9, 2009; Source: IMF.
(1)
(2)
(3)
頁 101 / 247424(b)(3)
2014/03/12file:///C:/blp/data/CFd424b3.htm

Table of ContentsTable of ContentsTable of ContentsTable of Contents
(2) As of September 30, 2009; Source: World Bank.
The Philippines also promotes its economic interests through membership in the following regional organizations:
(3) As of September 30, 2009; Source: Asian Development Bank.
• ASEAN;
• ASEAN Free Trade Area;
• South East Asia, New Zealand and Australia Central Banks;
• South East Asian Central Banks;
• Asia-Pacific Economic Cooperation, or APEC; and
Relationship with the IMF
• Executives Meeting of East Asia and Pacific Central Banks.
The IMF historically maintained relations with the Republic within the contexts of a regular IMF program monitoring arrangement and a subsequent post-program monitoring arrangement (“PPM”). Under its regular program monitoring arrangement, the IMF was allowed to influence the Republic’s fiscal policies through stabilization and structural adjustment programs. On the other hand, a PPM arrangement involved program assessments based on a regular review of economic developments and policies rather than the attainment of specific quantitative targets. Unlike a regular IMF program, a PPM arrangement does not include a financing component.
On January 19, 2006, the IMF issued a report, which noted the significant economic reforms that have been made since the Arroyo administration took office in 2004, particularly with respect to the implementation of the Reformed Value-Added Tax Act and the increase in the VAT rate which became effective on February 1, 2006. The IMF also noted a number of risks to the Republic’s economic outlook, including the possibility of decreases in foreign demand for Philippine exports (in particular due to increased competition in the electronics sector), inflationary pressures from any further increases in oil prices, avian flu and adverse developments in the international capital markets.
On December 28, 2006, the monetary board of Bangko Sentral (the “Monetary Board”) approved the prepayment of all of Bangko Sentral’s outstanding obligations to the IMF, amounting to $219.7 million as of December 18, 2006. On December 29, 2006, Bangko Sentral paid these obligations ahead of their scheduled maturities, which varied up to 2008. This prepayment triggered the Philippines’ early exit from its PPM arrangement with the IMF, which was originally scheduled to end in April 2007.
On July 31, 2007, after an official visit to the Republic, the IMF issued a statement highlighting improvements in the Philippine economy, particularly the substantial reduction in the fiscal deficit over the past three years. The IMF noted the increased spending in infrastructure development and a strengthening of the financial sector, while explaining the need for continued efforts to increase tax collection and efficiency as the Government continues to move towards the goal of a balanced budget.
On June 23, 2008, after a mission to the Republic, the IMF highlighted the twin challenges of a slowing global economy and escalating food and fuel prices that the Philippines faces, along with its peer countries in Southeast Asia. The IMF noted that past fiscal and other reforms helped to mitigate the impact of these challenges on the economy, but stated that prudent macroeconomic policy management would be needed due to slower growth and the threat of high inflation, including measures to limit the deficit and increase tax revenue collections.
On February 20, 2009, the IMF released its staff report on recent bilateral discussions with the Republic. The discussions focused on the effects of the worsening economic environment and policies designed to manage associated near-term risks. The report noted that the Republic’s banks have approached the crisis in a relatively strong position, but still face significant challenges.
18
頁 102 / 247424(b)(3)
2014/03/12file:///C:/blp/data/CFd424b3.htm

Table of ContentsTable of ContentsTable of ContentsTable of Contents
On August 20, 2009, the Republic announced that it will increase its annual contribution to the IMF by $1 billion. A nation’s voting power relates to the amount of money that the nation contributes to the IMF. Other nations have also announced plans to increase their contribution amounts; as a result, the Republic’s increased contribution amount is expected to maintain the Republic’s place within the IMF voting structure.
On November 25, 2009, after a mission to the Republic, the IMF upgraded its growth forecast for the Republic’s GDP growth to 1.5% from a previous forecast of 1.0%. However, the IMF also expressed concern over the Republic’s inability to control spending and increase tax revenues, noting the Republic’s budget deficit in 2009 was likely to breach projected levels.
World Bank Aid Package
On April 30, 2009, the World Bank announced the new Country Assistance Strategy (“CAS”) for the Philippines for the years 2010 to 2012. The World Bank announced that, with the main goal of alleviating poverty, it will provide financial support of $700 million to $1.0 billion per year for the next three years, coupled with analytical and advisory support. The International Finance Corporation (“IFC”), the private sector financing arm of the World Bank, will work with the World Bank on the CAS, focusing on infrastructure, agribusiness and the financial sector.
Asian Development Bank Aid Package
On July 9, 2009, the ADB announced a three-year economic assistance program for 2010-2012 aggregate of $2.0 billion to $3.0 billion. The assistance program is intended to support the recovery of the Philippine economy beginning in 2010, and is primarily focused on support for infrastructure and private sector development, natural resource management and mitigation of the effects of the global economic downturn on the Republic.
Philippine Economy
Overview
Like many developing countries after World War II, the Philippines protected local industry from foreign competition through measures such as import tariffs and quotas, and hoped to replace imported finished goods with domestically produced goods over time. Successive administrations also intervened in domestic economic affairs by imposing quantitative trade barriers, price controls and subsidies. Initially, the economy grew rapidly, with real GNP growing at an average rate of 5.7% per annum from 1970 to 1980, largely due to increased exports and Government investments. Infrastructure spending increased, and state ownership and nationalization of commercial enterprises became more prevalent. By the early 1980s, however, the Republic began to face increasing budget deficits, growing levels of foreign and domestic borrowing, rising inflation, climbing interest rates, a depreciating peso, declining investment capital, and slowing economic growth or, at times, a contraction in GDP. The Republic’s unstable political situation during that period, highlighted by the assassination of opposition leader Benigno Aquino in 1983, exacerbated its economic problems.
The general optimism brought about by the peaceful removal of the unpopular Marcos administration in 1986 helped economic recovery. Real GNP grew by 3.4% in 1986, increasing to 6.8% in 1988 before decelerating to a decline of 0.6% in 1991. The deceleration was caused principally by underlying macroeconomic imbalances, compounded by supply bottlenecks, natural disasters, political instability, the global recession and the Persian Gulf crisis of 1990-91.
The government of President Corazon Aquino, who came to power in 1986, embarked on a stabilization program aimed at preventing an upsurge in inflation, controlling the fiscal deficit and improving the external current account position. The economy responded favorably to these measures, posting increases in real GNP, investments, private consumption and imports in 1992. The Aquino administration also recognized that the Republic’s economic difficulties in large part resulted from its protectionist policies. The Aquino administration, therefore, initiated reforms to open the economy to market forces and reduce the size and role of the government in the Philippine economy. The government of President Fidel Ramos, who assumed office in 1992, accelerated the reform efforts initiated by the Aquino administration.
19
頁 103 / 247424(b)(3)
2014/03/12file:///C:/blp/data/CFd424b3.htm

Table of ContentsTable of ContentsTable of ContentsTable of Contents
Following a review of a number of the policies and programs initiated by previous administrations, the Estrada administration continued many of the financial policies and market-oriented reforms of the Aquino and Ramos administrations.
After the onset of the Asian economic crisis in mid-1997, the Philippines experienced economic turmoil characterized by currency depreciation, a decline in the performance of the banking sector, interest rate volatility, a significant decline in share prices on the local stock market and a reduction of foreign currency reserves. These factors led to a slowdown in the Philippine economy in 1997 and 1998. In response, the Government adopted a number of policies to address the effects of the Asian economic crisis by strengthening the country’s economic fundamentals.
Beginning in the second half of 2007, the short-term funding markets in the United States experienced credit issues, leading to liquidity disruption in various markets. In particular, subprime mortgage loans in the United States experienced increased rates of delinquency, foreclosure and loss. These and other related events had a significant adverse impact on the global credit and financial markets as a whole, which included the bankruptcy filings by, and, the acquisition, restructuring and nationalization of, certain financial institutions. Regulators in the United States, Europe and Asia took steps in response to the unprecedented conditions facing financial institutions in their jurisdictions. Against the backdrop of the global financial crisis, the Republic has experienced limited exposure to subprime assets and bankrupt financial institutions. Nonetheless, in 2008, the Republic experienced slower growth rates, a weakening of equity prices, lower values for the peso and increasing inflation. In 2009, the Republic’s economy began to exhibit indications of a recovery, although certain of its economic recovery policies have yet to result in positive effects. In the first ten months of 2009, OFW remittance levels exceeded the Republic’s forecasts and supported growth in the economy despite continuing slowdowns in other production sectors, while increased Government spending in an effort to stimulate the economy has resulted in an increasing fiscal deficit.
Recent Economic Indicators
The following table sets out the performance of certain of the Republic’s principal economic indicators for the specified periods.
2004 2005 2006 2007 2008 2009
GDP growth (%) (at constant prices) 6.4 5.0 5.3 7.1 3.8 0.7GNP growth (%) (at constant prices) 6.9 5.4 5.4 7.5 6.2 3.3Inflation rate (%) 6.0 7.7 6.2 2.8 9.3 3.2Unemployment rate
Old definition (%) 11.8 — — — —
New definition (%) — 7.8 8.0 7.3 7.4 7.591-day T-bill rate (%) 7.3 6.4 5.4 3.4 5.4 4.2External position
Balance of payments ($ million) (280) 2,410 3,769 8,557 89 2,216Export growth (%) 9.8 3.8 15.6 6.4 (2.5) (33.2) Import growth (%) 8.0 8.0 10.9 8.7 5.6 (32.5)
External debt ($ billion) 54.8 54.2 53.4 54.9 53.9 51.8International reserves
Gross ($ billion) 16.2 18.5 23.0 33.8 37.6 43.7Net ($ billion) 14.6 17.7 23.0 33.7 36.0 43.7Months of retained imports 3.6 3.8 4.2 5.7 6.0 8.1
Domestic credit growth (%) 8.5 (1.6) 7.2 5.2 16.8 8.8
(1) Preliminary data as of November 26, 2009 for the first nine months of 2009.
(2) Preliminary data as of December 4, 2009 for the first eleven months of 2009.
20
(3) In April 2005, a new definition of unemployment was adopted. The old definition of unemployment included all persons at least 15 years old without work who were seeking work, whereas the new definition is restricted to such persons who are immediately available for work. Data for 2005 is computed using the new methodology for the period from July to December of 2005. Under the old methodology, the unemployment rate would have been 11.9% in the first six months of 2005.
(1)
(1)
(2)
(3)
(4)
(2)
(5)
(6)
(7)
(8)
(8)
(8)
(9) (10)
頁 104 / 247424(b)(3)
2014/03/12file:///C:/blp/data/CFd424b3.htm

Table of ContentsTable of ContentsTable of ContentsTable of Contents
(4) Average of January, April, July and October 2009 Labor Force Survey figures.
(5) Includes Bangko Sentral obligations, public sector debt, whether or not guaranteed by the Government, and private sector debt registered and approved by Bangko Sentral. Does not include intercompany accounts of Philippine branches of foreign banks, private sector debt not registered with Bangko Sentral or private sector obligations under capital lease arrangements. Figures reflect the change in treatment of offshore banking units from non-resident to resident entities, pursuant to the fifth edition of the IMF Balance of Payments Manual (“BPM5”).
(6) Preliminary data as of September 24, 2009 for the first six months of 2009.
(7) Preliminary data as of June 30, 2009.
(8) Preliminary data as of November 30, 2009.
(9) Based on the Depository Corporations Survey.
2009 Budget
(10) Preliminary data as of September 30, 2009 for the first nine months of 2009.
On March 12, 2009, President Arroyo signed into law Republic Act No. 9524, or the (Peso)1.41 trillion National Expenditure Program for 2009. The 2009 budget is approximately 15.3% or (Peso)188.0 billion higher than the (Peso)1.23 trillion appropriated for 2008. The budget also includes a (Peso)10.1 billion economic stimulus fund to support the Philippine economy, which is experiencing difficulties as a result of the global economic downturn.
The ten Government agencies with the highest allocations under the 2009 budget compared to their corresponding allocations under the 2008 budget are set out below:
Allocations (in billions)
Agency 2008 2009
(in billions)
Department of Education (Peso)149.2 (Peso)171.5Department of Public Works and Highways 102.4 137.5Department of Interior and Local Government 53.5 63.2Department of National Defense 56.1 61.6Department of Agriculture 25.4 42.6Department of Health 20.3 28.5Department of Transportation and Communication 22.8 24.8Commission on Elections 4.4 16.9Department of Finance 8.1 13.9Department of Environment and Natural Resources 8.5 13.5
(1) Includes allocations for School Building Program.
(2) Includes allocations for AFP Modernization Program.
Under the 2009 budget, the priority sectors are infrastructure, education, health, environment, science and technology. The budget includes housing and salary adjustments for state workers. The economic services allocation increased from 24.4% of the general appropriations or (Peso)299.0 billion in 2008 to 26.8% in the 2009 budget, or (Peso)381.7 billion. Under the 2009 budget, funding for social services accounted for 31.7% of the national allocation or (Peso)452.2 billion, up by 19.8% or (Peso)74.7 billion. Among executive departments, the largest increases in budgetary allocations under the 2009 budget compared to 2008 were the following: the Department of Public Works and Highways with a (Peso)35.1 billion increase; the Department of Education (inclusive of allocations for its School Building Program) with (Peso)22.2 billion increase; the Department of Agriculture (inclusive of allocations for the Agriculture and Fisheries Modernization Program), which received a (Peso)17.1 billion increase; the Department of Interior and Local Government, with (Peso)9.7 billion increase; and Department of Health, whose allocation increased by (Peso)8.2 billion.
21
(3) Includes allocations for Agriculture and Fisheries Modernization Program.
(1)
(2)
(3)
頁 105 / 247424(b)(3)
2014/03/12file:///C:/blp/data/CFd424b3.htm

Table of ContentsTable of ContentsTable of ContentsTable of Contents
2010 Budget
On November 9, 2009, the House of Representatives approved the proposed 2010 national budget of (Peso)1.54 trillion. This proposed budget is 8.1% or (Peso)115.0 billion higher than the 2009 budget. The increased budget is designed to allow the Government to complete ongoing infrastructure projects, develop human capital and support agricultural activity. In the proposed 2010 budget, (Peso)340.8 billion is designated for payment of the Republic’s debt service obligations in 2010, which are expected to increase by 34.9% from (Peso)252.6 billion in 2009. The proposed debt service allotment for 2010 includes (Peso)221.2 billion for domestic obligations and (Peso)119.6 billion for foreign obligations. The Department of Education (inclusive of allocations for its School Building Program) received the largest departmental allocation with (Peso)172.8 billion. The Department of Public Works and Highways was allotted (Peso)105.3 billion, 32.3% lower than its (Peso)137.5 billion allotment in 2009 due to the completion of certain infrastructure projects in 2009. The Department of Social Welfare and Development was allotted (Peso)16.4 billion, a 53.3% increase from the (Peso)10.7 billion it was allotted under the 2009 budget. The proposed 2010 budget anticipates a (Peso)233.4 billion budget deficit in 2010, or approximately 2.8% of the Republic’s expected GDP. The proposed budget is now being deliberated upon by the Senate.
Privatization
The Government began privatizing a number of GOCCs during the Aquino administration, and expects to continue to do so. The Republic’s privatization program has broadened the ownership base of Government assets and helped develop the domestic capital markets.
Since January 1, 2001, the Privatization Council has been responsible for the privatization of the remaining Government corporations scheduled to be privatized. The Privatization Council, a policy-making body, is chaired by the Secretary of Finance and includes representatives from various Government agencies. Along with the Privatization Council, there are two additional main disposition entities, (i) the Land Bank of the Philippines, which is responsible for the disposition of the financial assets previously held by the Asset Privatization Trust, an entity created by President Aquino whose mandate expired on December 31, 2000, and (ii) the Privatization and Management Office, which is responsible for the disposition of physical assets. In addition, the Privatization Council may designate certain Government corporations to undertake privatization of their respective subsidiaries. Such disposition entities include the Philippine National Oil Company (“PNOC”), National Power Corporation (“NPC”), Bases Conversion and Development Authority and the National Development Company. The Privatization Council may also designate certain Government agencies, such as the Presidential Commission on Good Government, to dispose of certain other assets. All disposition entities must submit their privatization plans to the Privatization Council for its review and approval.
22
頁 106 / 247424(b)(3)
2014/03/12file:///C:/blp/data/CFd424b3.htm

Table of ContentsTable of ContentsTable of ContentsTable of Contents
The following table summarizes the Government’s principal privatizations to date:
Source: Privatization Council.
Year of Sale
Government
OwnershipAfter Sale
Gross
PrivatizationProceeds
(in billions)
International Corporate Bank 1987; 1993 0.0% (Peso)2.2Union Bank of the Philippines 1988; 1991; 1992 13.0 1.3Philippine Plaza Holdings 1991 0.0 1.5Philippine Airlines 1992 1.0 10.7National Steel Corporation 1994; 1997 12.5 17.1Paper Industries Corporation of the Philippines 1994 8.0 2.4Philippine Shipyard and Engineering Corporation 1994 9.0 2.1Fort Bonifacio Development Corporation 1995 45.0 39.2Metropolitan Waterworks and Sewerage System 1997 — —
Philippine Associated Smelting and Refining Corp 1999 4.3 3.3Philippine Phosphate Fertilizer Corporation 2000 0.0 3.1Philippine National Bank 1989; 1992; 1995
1996; 2000; 2005; 2007 0.0 15.5Old Iloilo Airport 2007 0.0 1.2Phili Telecommunications Investment Corp 2007 0.0 25.2PNOC Energy Development Corporation 2006; 2007; 2008 0.0 94.8Petron Corporation 1993; 1994; 2008 0.0 50.7Manila Electric Company 1991; 1994; 1997; 2008 0.0 25.2
(1) Net remittances to the Government upon the privatization of its assets are, in certain circumstances, less than the gross proceeds from the sale of such assets, based on agreements between the Government and the privatized entities.
The Government sold a portion of its shares in the Philippine National Bank (“PNB”) in September 2005, which generated (Peso)8.0 billion in gross proceeds in a primary and secondary offer of shares, of which approximately (Peso)6.0 billion was remitted to the Philippine Deposit Insurance Corporation (“PDIC”), the GOCC responsible for insuring the Republic’s private deposits, and approximately (Peso)2.0 billion was remitted to the Government. On August 1, 2007, the Government sold its remaining shares in PNB through a public offering for approximately (Peso)1.0 billion; PDIC also sold its remaining shares in the same offering and received (Peso)3.2 billion.
On December 13, 2006, the Republic completed the partial privatization of PNOC Energy Development Corporation (“PNOC EDC”) through a (Peso)19.2 billion initial public offering. PNOC, a wholly-owned GOCC, sold approximately 25% of its holdings in PNOC EDC and the remainder of the offering comprised new shares issued by PNOC EDC. As a result of the offering, private shareholders owned approximately 40% of the outstanding shares of PNOC EDC. PNOC’s net proceeds from the offering were approximately (Peso)9.3 billion. PNOC EDC’s proceeds from the offering were (Peso)9.6 billion.
On November 22, 2007, PNOC awarded a 60% controlling stake in PNOC EDC to Red Vulcan Holdings Corp., a Philippine corporation, in a full privatization of this GOCC. Red Vulcan Holdings Corp. submitted the highest bid of (Peso)58.5 billion in an auction on November 21, 2007. The stake sold consisted of approximately six billion common shares, or a 46.7% stake, that was held by the Government, and a 13.3% share held by the PNOC EDC Retirement Fund.
23
(2) The privatization of Metropolitan Waterworks and Sewerage System involved awarding two 25-year concessions to rehabilitate, expand and operate the system. Over the term of the concessions, the concessionaires are required to make improvements in water services, sewerage services and interconnection facilities and to pay concession fees to the Metropolitan Waterworks and Sewerage System. The estimated cost of the required improvements is $7.0 billion, which is expected to be incurred over the 25-year concession period.
(1)
(2)
(2) (2)
頁 107 / 247424(b)(3)
2014/03/12file:///C:/blp/data/CFd424b3.htm

Table of ContentsTable of ContentsTable of ContentsTable of Contents
As of November 30, 2009, there were 39 Government corporations, 82 assets handled by the Privatization and Management Office and certain property assets held by the Presidential Commission on Good Government for privatization. Other than the privatization of NPC pursuant to the restructuring of the electric power industry, the Government plans to focus on selling Food Terminal Inc. (“FTI”), PNOC Exploration Corporation (“PNOC EC”) and shares in San Miguel Corporation. The Government has established public-private partnerships to provide social services, especially in the health, education, postal and pension sectors. The national Government and local government units have also encouraged “build-operate-transfer” arrangements and other initiatives to enable the private sector to meet more of the infrastructure needs, especially in the
power, water, transportation and telecommunications sectors.
On October 8, 2009, the Privatization Management Office declared that the third auction for the sale of FTI had failed because of a lack of bidders. FTI is a 120-hectare agro-industrial commercial estate in Taguig City that is host to firms engaged in various lines of production and services. FTI was previously unsuccessfully auctioned in June and December of 1997. The Republic is planning to conduct a negotiated sale for FTI by the end of 2009. Revenues from the expected sale by the Republic of FTI, as well as the scheduled sale of the Republic’s stake in PNOC EC, were programmed into the (Peso)250 million budget deficit target for 2009.
Restructuring of the Electric Power Industry. The Electric Power Industry Reform Act of 2001 (the “EPIRA”), which became effective on June 28, 2001, provided the legal framework for the restructuring of the electric power industry, the privatization of NPC and the establishment of various open market devices to promote free and fair competition.
Pursuant to the EPIRA, the power industry was restructured to comprise four sectors—generation, transmission, distribution and supply. To allow the industry to adjust to a market-oriented setting, and to help mitigate adverse economic consequences of the restructuring, the EPIRA also contains transition mechanisms dealing with, among other issues, transition supply contracts, independent power producer (“IPP”) contracts, and “stranded costs and debts” that NPC will not be able to dispose of or settle subsequent to its privatization.
To reorganize NPC’s assets and liabilities, two entities were created pursuant to the EPIRA:
• the Power Sector Assets and Liabilities Management Corporation (“PSALM”), which has taken ownership of all of NPC’s existing generation assets, liabilities, real estate, and other disposable assets, as well as certain IPP contracts; and
Privatization of NPC’s Assets. NPC’s generation assets are being privatized by PSALM through an open public bidding process, which began in the last quarter of 2003. PSALM has identified 34 generation assets for privatization with a total generation capacity of approximately 4,772.3 MW. As of December 10, 2009, PSALM had sold or contracted to sell 29 of NPC’s generation assets, although five of these asset sales have not yet been completed. The generation assets that PSALM has sold or contracted to sell in Luzon and the Visayas have a total operating capacity of 3,072.2 MW, representing approximately 81.3% of the NPC generation assets in Luzon and the Visayas that are included for purposes of determining when open access, which will permit electricity suppliers to compete freely on the open market to supply end-users with power, may be implemented in those regions. The total sales price for the asset sales that have been completed as of December 10, 2009 was approximately $3.0 billion, The total sales price for the five asset sales that have not yet been completed was approximately $47.4 million.
24
• the National Transmission Corporation (“Transco”), an entity wholly owned by PSALM, which has assumed NPC’s electricity transmission assets.
頁 108 / 247424(b)(3)
2014/03/12file:///C:/blp/data/CFd424b3.htm

Table of ContentsTable of ContentsTable of ContentsTable of Contents
The Republic has also begun to transfer the management and control of the total energy output of NPC-owned power plants covered by IPP contracts to private entities which will act as IPP Administrators (“IPPAs”). On August 28, 2009, PSALM conducted successful auctions for the appointment of IPPAs for the Sual and Pagbilao plants. San Miguel Energy Corporation was declared winning bidder for the Sual plant with a bid of $1.1 billion, while Therma Luzon Inc., an affiliate of Aboitiz Power Corp., was declared the winning bidder for the Pagbilao plant with a winning bid of $691.0 million. The contracted capacities of the Sual and Pagbilao plants total 1,700.0 MW, or approximately 34.7% of the contracted capacity of the IPP contracts for Luzon and the Visayas. PSALM is required to privatize 70% of such capacity as a condition to open access.
On December 12, 2007, the consortium of Monte Oro Grid Corporation, Calaca High Power Corporation and the State Grid Corporation of China was awarded a 25-year concession to operate Transco. Their winning bid was $3.95 billion. The Philippine Securities and Exchange Commission approved the incorporation of the National Grid Corporation of the Philippines, (“Concessionaire”), formed by the consortium on February 21, 2008. The concession agreement, after the execution and delivery to the Concessionaire, became effective on February 28, 2008. On December 1, 2008 President Arroyo signed Republic Act No. 9511, or the Transco Franchise Law, which granted the Concessionaire a 50-year franchise to operate Transco, which became effective on December 20, 2008. Pursuant to the terms of the concession agreement, the Concessionaire remitted separate payments of $445 million and (Peso)25.5 billion to PSALM in early January 2009. The amount represented 25% of the total concession fee. On January 15, 2009, PSALM formally transferred the operations of Transco to the Concessionaire. On July 15, 2009, PSALM received the first interest payment on the balance of the concession fee in the amount of approximately (Peso)6.0 billion.
Issues Relating to Cost Adjustments. The Purchased Power Adjustment (“PPA”), an automatic cost adjustment mechanism, historically allowed NPC to pass on increased costs associated with its IPP contracts. President Arroyo issued a presidential directive ordering NPC to reduce the average PPA charge in 2002. Identifying problems with PPA calculations, the Energy Regulatory Commission (“ERC”) promulgated two price adjustment mechanisms, the Generation Rate Adjustment Mechanism (“GRAM”) and the Incremental Currency Exchange Rate Adjustment (“ICERA”). The GRAM was approved by the ERC in 2003 to allow recovery of incremental fuel and purchased power costs from changes in either fuel prices or the cost of power purchased from IPPs. The ICERA allows for the recovery of incremental costs incurred as a result of foreign currency exchange rate fluctuations. Both mechanisms involve quarterly adjustment to the generation rate.
On August 14, 2008, PSALM submitted its Proposed Rules for the Automatic Recovery of NPC/PSALM’s Generation Assets’ Monthly Fuel, Purchased Power and Foreign Exchange-Related Costs to the ERC. On August 3, 2009, the ERC approved the proposed rules to replace the ERC guidelines for GRAM and ICERA filings. The rules will automatically adjust the generation rates, and eliminate the need for PSALM and NPC to file for recoveries each quarter and await a decision by the ERC. Instead, NPC and PSALM will submit filings to the ERC on a monthly basis after adjusting the generation rates, and the ERC will review and, if it concurs, confirm the adjustments.
On July 29, 2009, NPC and PSALM filed their most recent application for basic rate adjustments under the GRAM and the ICERA, which are known as the 14th GRAM and 13th ICERA applications. Under these applications, the Luzon and Visayas grids’ effective generation rates would increase by (Peso)1.5058 per kWh and (Peso)1.3382 per kWh, respectively, while for the Mindanao grid, the customer rates would decrease by (Peso)0.0952 per kWh.
Issues Relating to the Universal Charge. Under the EPIRA, a “Universal Charge” is imposed. The Universal Charge, which is not limited to NPC’s customers, is imposed to pay for NPC’s remaining debt and contract obligations that will not be liquidated by proceeds from NPC’s privatization, some costs associated with long-term purchase contracts of distribution utilities, the cost of electrification projects in remote areas (“missionary electrification”), an environmental charge for rehabilitation and maintenance of watershed areas,
25
頁 109 / 247424(b)(3)
2014/03/12file:///C:/blp/data/CFd424b3.htm

Table of ContentsTable of ContentsTable of ContentsTable of Contents
and a subsidy for indigenous and renewable sources of energy. After a challenge to the constitutionality of the Universal Charge by various consumer and environmentalist groups for being an undue delegation of legislative power, the Supreme Court upheld the constitutionality of the Universal Charge on July 17, 2007.
On June 30, 2009, PSALM filed a petition with the ERC for recovery of the Universal Charge for stranded debt and stranded contract costs accumulated in 2008. If PSALM’s petition is granted as requested, all electricity end-users would be imposed additional electricity charges of (Peso)0.920 per kWh and (Peso)0.305 per kWh for the recovery of stranded contract costs and stranded debts, respectively. These additional charges would be imposed over a duration of five and 17 years, respectively. The ERC is presently considering the petition, and hearings are expected to commence by December 2009.
On August 17, 2009, the ERC issued a resolution granting provisional authority for Transco and other distribution utilities to collect a Universal Charge for missionary electrification of (Peso)0.0978 per kWh beginning on September 15, 2009. This charge is intended to cover subsidies of approximately (Peso)5.7 billion given to NPC’s small power utilities group for its expenses in 2009.
As of September 30, 2009, total collections from the Universal Charge amounted to (Peso)11.3 billion, out of which PSALM disbursed (Peso)10.9 billion to NPC for the environmental charge and missionary electrification in accordance with the provisions of the EPIRA.
Government Financing of NPC. To cover its cash flow deficits for the years 2003, 2004 and 2005, NPC obtained a total of approximately $3.8 billion ($1.5 billion in 2003, $1.7 billion in 2004 and $590 million in 2005) including bond issuances, in financing from multilateral organizations and export credit agreements, all of which were guaranteed by the Government. In addition, to finance its debt service requirements, from 2001 to 2008, the Government provided NPC a total of (Peso)114.2 billion in cash advances. Of this amount, (Peso)108.4 billion has been repaid by NPC, leaving (Peso)5.8 billion of Government cash advances unpaid as of December 31, 2008. NPC’s capital expenditures were historically financed through borrowings from multilateral organizations, export credit agreements and internal cash generation. Under the EPIRA, the Government was obligated to assume (Peso)200 billion of NPC’s debt, and the Government assumed $3.4 billion and €500 million (amounting to approximately (Peso)200 billion) of NPC’s debt in March 2005. In addition, under the EPIRA, PSALM was tasked with the management and liquidation on NPC’s assets and liabilities. Through its privatization of NPC’s assets, PSALM has generated revenue which it has utilized for the management and servicing of NPC’s liabilities.
Prepayment of NPC Debts. On December 5, 2007, PSALM announced plans to maximize the use of proceeds from its privatization efforts in 2007 by pre-paying a portion of NPC’s outstanding debts. In the first nine months of 2008, PSALM’s prepayments of NPC debt aggregated approximately $1.3 billion, which helped lower NPC’s outstanding debt to approximately $18.1 billion as of October 1, 2008. PSALM had identified an additional $1.1 billion of NPC debt it had intended to prepay in the last quarter of 2008 and 2009. However, in the last quarter of 2008, PSALM suspended its prepayments program as a result of the international credit crisis. On December 2, 2009, PSALM completed an exchange offer through which $600 million of bonds originally issued by NPC and due in 2010 and 2011 were exchanged for longer-termed PSALM bonds due in 2019 and 2024.
GDP and Major Financial Indicators
Gross Domestic Product
Gross domestic product, or GDP, measures the market value of all final goods and services produced within a country during a given period and is indicative of whether the country’s productive output rises or falls over time. By comparison, gross national product, or GNP, measures the market value of all final goods and services
26
頁 110 / 247424(b)(3)
2014/03/12file:///C:/blp/data/CFd424b3.htm

Table of ContentsTable of ContentsTable of ContentsTable of Contents
produced by a country’s citizens during a given period, whether or not the production occurred within the country.
Economists show GDP and GNP in both current and constant market prices. GDP and GNP at current market prices values a country’s output using the actual prices of each year, whereas GDP and GNP at constant market prices (also referred to as “real” GDP and GNP) values output using the prices from a base year, thereby eliminating the distorting effects of inflation. Growth figures for GDP and GNP in this prospectus are period-on-period comparisons of real GDP and real GNP, respectively.
Overview
In 2006, GDP grew by 5.3%, compared to 5.0% growth in 2005. The 2006 GDP rate was within the Government’s forecast of 5.3% to 5.6% for the year. The primary contributors to growth in 2006 were the industry and services sectors. Net factor income from abroad grew by 6.1%, compared to 10.7% growth in 2005. The decrease in the growth rate was due to slower economic growth in the United States, where the Republic receives substantial inflows from OFW remittances. GNP grew by 5.4% in 2006 and in 2005.
In 2007, GDP grew by 7.1% and GNP grew by 7.5%, compared to growth rates of 5.3% and 5.4%, respectively, in 2006. The GDP rate exceeded the Government’s forecast of 6.1% to 6.7% for 2007. GDP growth was primarily attributable to strong growth in private consumption expenditure, which was supported by benign inflation and improved labor market conditions. Overall investment spending also expanded, with business sentiment continuing to remain positive as indicated by Government surveys. GNP growth was also driven by continued growth in net factor income from abroad, which registered 12.1% growth, an increase from 6.1% growth recorded in 2006.
In 2008, GDP grew by 3.8% compared to 7.1% growth in 2007. GDP growth in 2008 was below the Government’s forecasted growth range of 4.1% to 4.8%, which had been revised downward in October 2008 from original estimates as a result of the global economic downturn. The decrease in GDP growth was due mainly to a slowdown in domestic production, consumer demand and external trade as inflation increased. GDP growth in 2008 was attributable mainly to growth in the manufacturing, trade, agriculture and private services subsectors. Increase in production of agricultural products such as sugarcane and banana products also contributed to GDP growth. In 2008, GNP grew by 6.2% compared to growth of 7.5% in 2007. The decrease in the rate of growth was due mainly to the slowdown in GDP growth. The primary factor that caused GNP growth to exceed GDP growth was the continued growth in net factor income from abroad, which registered 30.8% growth in 2008, compared to 12.1% growth in 2007.
In the first nine months of 2009, preliminary estimates indicate that GDP grew by 0.7% and GNP grew by 3.3% at constant 1985 prices, compared to growth of 4.2% and 6.0%, respectively, in the first nine months of 2008, in each case compared with the same period in the previous year. The gap between GDP and GNP growth was due mainly to decreased spending and increased investments by families of OFWs in response to the economic downturn. The decreases in GDP and GNP growth were primarily attributable to the global financial downturn having negative effects on production subsectors, including manufacturing, finance services, trade services and certain agricultural products, such as sugarcane and corn. On the expenditure side, the continued global downturn resulted in lower consumer spending in the first nine months of 2009. GDP and GNP growth in the first nine months of 2009 were driven primarily by growth in the mining and quarrying and communication subsectors, among others. The main contributors to growth on the expenditure side were construction, personal consumption expenditures and government consumption expenditures. GNP growth was also driven by continued accelerated growth in net factor income from abroad, which registered growth of 25.2%, an improvement from 23.9% growth in the first nine months of 2008.
27
頁 111 / 247424(b)(3)
2014/03/12file:///C:/blp/data/CFd424b3.htm

Table of ContentsTable of ContentsTable of ContentsTable of Contents
GROSS DOMESTIC PRODUCT BY MAJOR SECTORS (AT CURRENT MARKET PRICES)
Source: National Statistical Coordination Board.
Percentage ofGDP
2004 2005 2006 2007 2008 2009 2004 2008
(in billions, except as indicated)
Agriculture, fishery and forestry (Peso) 734.2 (Peso) 778.4 (Peso) 853.7 (Peso) 943.3 (Peso) 1,102.8 (Peso) 773.5 15.1% 14.9%
Industry sectorMining and quarrying 52.9 63.6 75.6 108.3 111.0 88.6 1.1 1.5Manufacturing 1,122.9 1,264.7 1,377.6 1,459.1 1,656.5 1,058.2 23.0 22.3Construction 212.8 210.2 240.2 299.9 346.3 296.1 4.4 4.7Electricity, gas and water 155.8 196.7 216.1 230.9 235.6 190.6 3.2 3.2
Total 1,544.4 1,735.1 1,909.4 2,098.2 2,349.4 1,633.4 31.7% 31.6%
Service sectorTransportation,
communications and storage 367.4 413.9 446.2 478.4 508.8 380.7 7.5 6.9
Trade 681.7 776.9 877.9 981.5 1,088.2 793.2 14.0 14.7Finance 215.7 263.4 311.4 362.0 404.9 335.3 4.4 5.5Ownership of dwellings and
real estate 292.2 320.4 350.7 373.9 412.7 319.6 6.0 5.6Private services 653.3 742.0 830.2 936.9 1,036.9 818.3 13.4 14.0Government services 382.7 413.9 451.6 473.3 519.6 412.8 7.9 7.0
Total 2,593.0 2,930.5 3,268.0 3,605.9 3,971.0 3,060.0 53.2% 53.5%
Total GDP (Peso)4,871.6 (Peso)5,444.0 (Peso) 6,031.2 (Peso) 6,647.3 (Peso) 7,423.2 (Peso) 5,466.9 100.0% 100.0%
Total GNP (Peso)5,248.1 (Peso)5,891.2 (Peso) 6,532.1 (Peso) 7,227.3 (Peso) 8,250.2 (Peso) 6,221.7Total GDP (in millions of US
dollars) $ 86,931 $ 98,829 $ 117,534 $ 144,043 $ 166,929 $ 114,056GDP per capita (in US dollars)
$ 1,040.3 $ 1,159.1 $ 1,351.8 $ 1,624.0 $ 1,845.0 $ 1,239.8
(1) The GDP figures have recently been revised. See “—Periodic Revisions to Philippine National Accounts”.
(2) Preliminary data as of November 26, 2009 for the first nine months of 2009.
(3) Calculated using the average exchange rate for the period indicated. See “—Monetary System—Foreign Exchange System”.
28
(4) The 2004 figures are calculated using 2000 census-based population projections. Beginning in May 2004, population estimates are based on the National Statistical Coordination Board (“NSCB”) Resolution No.2, Adoption of the Decennial Census Based Population.
(1) (1) (2)
(3)
(4)
頁 112 / 247424(b)(3)
2014/03/12file:///C:/blp/data/CFd424b3.htm

Table of ContentsTable of ContentsTable of ContentsTable of Contents
GROSS DOMESTIC PRODUCT BY MAJOR SECTORS (AT CONSTANT MARKET PRICES )
Source: National Statistical Coordination Board.
Percentageof GDP
2004 2005 2006 2007 2008 2009 2004 2008
(in billions, except as indicated)
Agriculture, fishery and forestry (Peso) 226.4 (Peso) 231.0 (Peso) 239.8 (Peso) 251.3 (Peso) 259.4 (Peso) 183.7 23.1% 18.3%
Industry sectorMining and
quarrying 18.3 20.0 18.8 23.7 24.2 22.6 1.6% 1.7% Manufacturing 278.6 293.3 305.7 315.7 329.3 219.7 24.1% 23.2% Construction 48.7 45.9 50.3 60.9 65.7 54.6 4.2% 4.6% Electricity, gas
and water 36.8 37.7 40.1 42.7 45.9 34.6 3.2% 3.2%
Total (Peso) 382.4 (Peso) 396.9 (Peso) 414.8 (Peso) 443.1 (Peso) 465.0 (Peso) 331.6 33.1% 32.8%
Service sectorTransportation,
communications and storage 97.6 104.8 111.4 120.7 125.8 92.8 8.5% 8.9%
Trade 192.7 203.6 216.1 233.9 236.7 171.3 16.7% 16.7% Finance 56.9 64.6 71.9 81.3 83.4 67.1 4.9% 5.9% Ownership of
dwellings and real estate 53.7 56.5 59.7 63.2 66.9 50.3 4.7% 4.7%
Private services 93.4 100.4 107.3 116.4 122.0 92.8 8.1% 8.6% Government
services 51.2 53.8 55.2 56.6 59.8 47.7 4.4% 4.2%
Total (Peso) 545.5 (Peso) 583.6 (Peso) 621.6 (Peso) 672.1 (Peso) 694.5 (Peso) 522.0 47.3% 48.9%
Total GDP (Peso)1,154.3 (Peso)1,211.5 (Peso)1,276.2 (Peso)1,366.5 (Peso)1,419.0 (Peso)1,037.3 100.0% 100.0%
Total GNP (Peso)1,252.3 (Peso)1,320.0 (Peso)1,391.3 (Peso)1,495.6 (Peso)1,587.8 (Peso)1,186.8Yearly growth in
GDP 6.4% 5.0% 5.3% 7.1% 3.8% 0.7% Yearly growth in
GNP 6.9% 5.4% 5.4% 7.5% 6.2% 3.3%
(1) Based on constant 1985 prices.
(2) The GDP figures have recently been revised. See “—Periodic Revisions to Philippine National Accounts”.
29
(3) Preliminary data as of November 26, 2009 for the first nine months of 2009.
(1)
(2) (2) (3)
頁 113 / 247424(b)(3)
2014/03/12file:///C:/blp/data/CFd424b3.htm

Table of ContentsTable of ContentsTable of ContentsTable of Contents
The following table shows the percentage distribution of the Republic’s GDP at constant 1985 prices.
DISTRIBUTION OF GROSS DOMESTIC PRODUCT BY EXPENDITURE (AT CONSTANT MARKET PRICES )
2004 2005 2006 2007 2008 2009
Personal consumption 78.3% 78.2% 78.3% 77.4% 78.1% 79.5% Government consumption 6.5 6.4 6.7 6.6 6.6 7.6Capital formation
Fixed capital 19.4 17.3 17.0 17.6 17.5 17.6Changes in stocks 0.9 0.3 0.5 0.8 0.6 (0.7)
Total capital formation 20.3 17.6 17.6 18.4 18.1 16.9Exports of goods and services 46.8 46.7 50.3 49.5 46.7 43.0Imports of goods and services 54.5 53.1 51.4 46.0 45.4 42.5Statistical discrepancy 2.6 4.2 (1.5) (6.0) (4.1) (4.4)
Total 100% 100% 100% 100% 100% 100%
Source:National Statistical Coordination Board.
(1) Based on constant 1985 prices.
(2) The figures have recently been revised. See “—Periodic Revisions to Philippine National Accounts”.
Periodic Revisions to Philippine National Accounts. The National Statistical Coordination Board (“NSCB”) releases quarterly data on the Republic’s national accounts, which includes GDP and GNP data. Under NSCB policy, GDP and GNP data for a particular quarter are revised the following quarter, while annual data are released together with first quarter data and are revised thereafter in May of each year. GDP and GNP estimates are considered “final” after three years. However, NSCB may still revise the “final” estimates whenever it undertakes an overall revision of the national accounts.
Revisions in the Republic’s national accounts are normally due to the availability of new or more complete data, receipt of revised data from original sources, and inclusion or exclusion of emerging or closed industries. The NSCB has traditionally followed the 1968 United Nations System of National Accounts (“UNSNA”). The current overall revision of the Republic’s national accounts incorporates to a large extent the recommendations of the most recent 1993 UNSNA.
The overall revision of the national accounts is ongoing, therefore, GDP and GNP estimates that are currently considered “final” may be subject to further material changes.
Principal Sectors of the Economy
(3) Preliminary data as of November 26, 2009 for the first nine months of 2009.
Agriculture, Fishery and Forestry Sector
The Agriculture, Fishery and Forestry sector comprises the agriculture and fishery subsector and the forestry subsector. This sector contributed approximately 18.3% to GDP in 2008 compared to 19.6% to GDP in 2004, at constant market prices.
Agriculture and Fishery Subsector. The Republic’s principal agricultural products include cereals, such as rice and corn, both of which are cultivated primarily for domestic use, and other crops, such as coconuts, sugar cane and bananas, produced for both the domestic market and export. The Philippines’ diverse agricultural system contains many coconut plantations farmed by agricultural tenants and workers, sugar haciendas farmed
30
(1)
(2) (2) (3)
頁 114 / 247424(b)(3)
2014/03/12file:///C:/blp/data/CFd424b3.htm

Table of ContentsTable of ContentsTable of ContentsTable of Contents
either under labor administration or by tenants, and large “agro-business” plantations devoted mainly to crops for export such as bananas and pineapples. Rice, corn and coconuts each account for approximately a quarter of the country’s cultivated area. Fishing production is divided into commercial, municipal and aquaculture fishing.
Forestry Subsector. The country’s forests, one of the Philippines’ main natural resources, contain a large quantity of hardwood trees. Over the years population growth, shifting cultivation, illegal logging and inadequate reforestation depleted the forests, leading to a Government-imposed ban in 1991 on nearly all logging activity in virgin forests and the subsequent continuing decline of the forestry subsector.
In 2006, the agriculture, fishery and forestry sector grew by 3.8% compared to growth of 2.0% in 2005. The growth was generally attributable to the Government’s technical and financial assistance programs for agriculture, together with improved dispersal programs. Notably, increases in rice and corn production contributed significantly to the sector’s growth, as well as high seaweed production in the fishery subsector, favorable weather conditions and foreign demand for agricultural products. The sector was able to sustain this general growth for the year despite several typhoons in the fourth quarter of 2006.
In 2007, the agriculture, fishery and forestry sector grew by 4.8%, compared to growth of 3.8% in 2006. The agriculture and fishery subsector grew by 5.0% in 2007, compared to 3.7% in 2006, benefiting from Government programs that were put in place as a rapid response measure to mitigate the negative effects of extreme dry weather conditions in the first half of 2007. Leading contributors to growth in the sector in 2007 were fishery, corn and banana production. Rice production continued to grow in 2007 at a rate of 6.0%, while corn production grew by 10.8% and fishery grew by 6.9%.
In 2008, the agriculture, fishery and forestry sector grew by 3.2% compared to growth of 4.8% in 2007. The decrease in the rate of growth was due to a slowdown in production of rice and corn as a result of unfavorable weather conditions and increases in fertilizer costs. Decreases in the production of livestock and other crops also contributed to slower growth. Fishery growth decreased to 5.5% in 2008 from 6.9% in 2007 as commercial, municipal and aquaculture fishing registered slower growth. On the other hand, the forestry subsector grew 1.7% in 2008, a reversal from a 23.9% contraction in the subsector in 2007. Other contributors to growth in the sector were from increased production of rice, sugarcane, banana, coconut and poultry products.
Preliminary data indicates that the agriculture, fishery and forestry sector, grew by 1.3% in the first nine months of 2009, compared to growth of 3.4% in the first nine months of 2008. Growth in the agriculture and fishery subsector slowed to 1.3% in the first nine months of 2009, compared to growth of 3.4% in the first nine months of 2008. The slower growth was due mainly to contractions in sugar and other crops production. Leading contributors to growth in agriculture were banana, corn and poultry production, as well as fishery. Rice production grew 0.7% in the first nine months of 2009, which was slower than the growth of 37.1% in the first nine months of 2008. The increases in agriculture and fishery were supported in part by growth in forestry of 1.1% in the first nine months of 2009, compared to growth of 3.4% in the first nine months of 2008.
Industry Sector
The industry sector comprises, in order of importance: the manufacturing subsector; the construction subsector; the electricity, gas and water subsector; and the mining and quarrying subsector. The industry sector contributed approximately 32.8% to GDP in 2008 compared to 33.1% to GDP in 2004, at constant market prices.
In 2006, the industry sector grew 4.5% compared to growth of 3.8% in 2005, due mainly to the growth in the manufacturing and construction subsectors. The manufacturing subsector grew by 4.2% in 2006. The construction subsector grew by 9.6% in 2006 as a result of increased public construction projects. The growth in the industry sector was partially offset by a 6.1% decline in the mining and quarrying subsector, as production from mining declined.
In 2007, the industry sector grew by 6.8% compared to growth of 4.5% in 2006, due primarily to growth in the mining and quarrying subsector, and the construction subsector. The mining and quarrying subsector grew by
31
頁 115 / 247424(b)(3)
2014/03/12file:///C:/blp/data/CFd424b3.htm

Table of ContentsTable of ContentsTable of ContentsTable of Contents
26.0% in 2007, as a result of higher metal prices in the world market. The construction subsector grew by 21.1% in 2007, compared to 9.6% growth in 2006, due primarily to the increase of Government spending and private construction projects. The electricity, gas and water subsector grew 6.7% in 2007. The manufacturing subsector recorded lower growth of 3.3% in 2007, compared to growth of 4.2% in 2006.
In 2008, the industry sector grew by 5.0% compared to growth of 6.8% in 2007. The decrease in the growth rate was due to slower growth in the mining and quarrying subsector and the construction subsector. The construction subsector grew by 7.8% in 2008, compared to 21.1% growth in 2007, due mainly to a contraction in both public and private construction. The mining and quarrying subsector grew by 1.9% in 2008 compared to 26.1% growth in 2007, the slowdown due to production decreases in crude oil, stone quarrying, clay and sandpits, and all metallic mining except copper. Growth in the industry sector in 2008 was attributable to growth in the manufacturing and electricity, gas and water subsectors. Manufacturing, the largest subsector in the industry sector, grew by 4.3% in 2008, compared to growth of 3.3% in 2007, due primarily to the growth in the food and beverage industry. The electricity, gas and water subsector grew by 7.3% in 2008, compared to 6.7% growth in 2007, due primarily to growth in electricity and gas.
Preliminary data shows that the industry sector contracted by 2.9% in the first nine months of 2009 compared to growth of 4.8% in the first nine months of 2008. The contraction was primarily due to a contraction in the manufacturing subsector, which offset growth in the mining and quarrying and construction subsectors. The manufacturing subsector, which comprised approximately 18.6% of GDP in the first nine months of 2009, contracted by 7.5% compared to growth of 4.7% in the same period of 2008, mainly as a result of declines in the manufacture of petroleum products, electrical machinery, footwear and apparel and basic metals. These declines offset in part growth in food manufacturing, chemicals and non-metallic minerals in the first nine months of 2009. The mining and quarrying subsector recorded growth of 22.4% in the first nine months of 2009, primarily due to increases in the production of coal, copper and nickel, as well as non-metallic minerals. Construction also grew by 9.7% in the first nine months of 2009, compared to growth of 5.9% in the same period in 2008, as a result of growth in private construction.
Manufacturing Subsector. The Republic’s manufacturing subsector comprises three major industry groups:
• consumer goods, including the food, footwear and garment industries;
• intermediate goods, including the petroleum, chemical and chemical product industries; and
32
• capital goods, including the electrical machinery and electronics industries.
頁 116 / 247424(b)(3)
2014/03/12file:///C:/blp/data/CFd424b3.htm

Table of ContentsTable of ContentsTable of ContentsTable of Contents
The following table presents, at constant 1985 market prices, the gross value added, which equals the value of sales minus the cost of raw material and service inputs, for the manufacturing sector by industry or industry group
GROSS VALUE ADDED IN MANUFACTURING BY INDUSTRY GROUP (AT CONSTANT MARKET PRICES )
2004 2005 2006 2007 2008 2009
(in millions)
Food manufactures (Peso)112,274 (Peso)119,174 (Peso)125,733 (Peso)131,878 (Peso)143,182 (Peso)98,693Beverage industries 9,609 9,465 9,727 11,266 12,744 8,266Tobacco manufactures 2,780 2,549 2,404 2,090 2,581 1,960Textile manufactures 4,965 5,727 5,397 5,430 4,624 3,109Footwear/wearing apparel 12,662 11,784 11,554 11,935 12,783 6,711Wood and cork products 2,338 1,644 1,461 1,779 1,512 846Furniture and fixtures 3,964 4,548 4,794 5,549 5,131 2,836Paper and paper products 2,209 2,149 2,213 2,343 2,357 1,778Publishing and printing 3,763 3,363 3,291 3,357 3,122 2,173Leather and leather products 128 124 145 158 185 35Rubber products 1,948 1,993 2,038 1,958 1,906 1,297Chemical and chemical products 15,960 17,630 18,067 17,578 18,326 12,300Petroleum and coal products 32,659 40,762 42,310 42,893 44,289 26,643Non-metallic mineral products 6,279 5,867 6,169 6,947 7,580 5,536Basic metal industries 7,862 7,493 9,456 9,876 9,881 6,481Metal industries 6,114 6,186 6,555 7,116 7,632 4,774Machinery (except electrical) 5,278 4,161 3,373 3,358 3,592 2,182Electrical machinery 37,175 37,967 39,309 37,365 34,482 24,265Transport equipment 2,525 2,737 2,560 2,895 2,987 2,330Miscellaneous manufactures 7,682 8,011 9,108 9,940 10,419 7,510
Gross value added in manufacturing (Peso)278,624 (Peso)293,334 (Peso)305,663 (Peso)315,709 (Peso)329,317 (Peso)219,726
Source: Economic and Social Statistics Office; National Statistical Coordination Board.
(1) Based on constant 1985 prices.
In 2006, growth in the manufacturing subsector remained stable at 4.2% compared to growth of 5.3% in 2005. The growth was supported by the food and beverage, electrical machinery and basic metals subsectors.
In 2007, the manufacturing subsector recorded lower growth of 3.3% in 2007 compared to growth of 4.2% in 2006, as a result of increased competition from China and other countries in the region and lower exports resulting from slower economic growth in export markets.
In 2008, the manufacturing subsector recorded growth of 4.3%, compared to growth of 3.3% in 2007 due to accelerated growth in food manufacturing, fueled by an increase in sugar production. In addition to food manufacturing, beverages, footwear and wearing apparel, chemical and chemical products, and products of petroleum and coal all grew in 2008.
33
(2) Preliminary data as of November 26, 2009 for the first nine months of 2009.
(1)
(2)
頁 117 / 247424(b)(3)
2014/03/12file:///C:/blp/data/CFd424b3.htm

Table of ContentsTable of ContentsTable of ContentsTable of Contents
In the first nine months of 2009, the manufacturing sector contracted by 7.5%, compared to growth of 4.7% for the same period of 2008. The contraction was the result of generally weak demand due to the economic downturn.
Construction Subsector. The construction subsector’s contribution to GDP, at constant market prices, increased from 4.2% in 2004 to 4.6% in 2008.
In 2006, the construction subsector grew by 9.6% compared to a contraction of 5.9% in 2005, driven mainly by public construction projects of the Government, local government units and GOCCs, consistent with the President’s emphasis on infrastructure projects in the 2006 State of the Nation speech.
In 2007, the construction subsector grew by 21.1%, as both public and private construction increased. The increase in public construction was driven by the increase in Government infrastructure projects, while real estate development projects and business process outsourcing (“BPO”) offices contributed to the increase in private construction projects.
In 2008, the construction subsector grew by 7.8%, compared to growth of 21.1% in 2007. The decline in the rate of growth is mainly attributable to lesser demand from the private sector.
In the first nine months of 2009, the construction subsector grew by 9.7%, which is an increase from the 5.9% expansion recorded in the first nine months of 2008, due mainly to higher expenditures in private and public construction projects as a result of the Republic’s efforts to minimize the effects of the global downturn on the economy.
Electricity, Gas and Water Subsector. The electricity, gas and water subsector, also known as the utilities subsector, accounted for 3.1% of GDP in 2008 and 3.2% of GDP in 2004.
In 2006, the utilities subsector grew by 6.4% compared to growth of 2.5% in 2005. The growth was supported by the demand for electricity from the call center industry and the opening of new retail malls and light rail transit operations.
In 2007, the utilities subsector grew by 6.7% compared to the growth of 6.4% in 2006, driven by stable consumption and increasing growth in the commercial sectors.
In 2008, the utilities subsector grew by 7.3% compared to the growth of 6.7% in 2007, driven by higher electricity consumption in the industrial sector.
In the first nine months of 2009, the utilities subsector contracted by 2.3% compared to the growth of 8.4% in the first nine months of 2008, due to reduced electricity and gas consumption as a result of the global economic downturn.
Mining and Quarrying Subsector. The mining and quarrying subsector’s contribution to GDP, at constant market prices, increased from 1.6% in 2004 to 1.7% in 2008.
In 2006, the mining and quarrying subsector declined by 6.1% compared to growth of 9.3% in 2005. The decline was due to lower yields of gold and copper, as well as a decline in crude oil production from the Malampaya field.
In 2007, the mining and quarrying subsector grew by 26.0%, compared to a decline of 6.1% in 2006, as a result of higher metal prices in the world market. The growth in the mining and quarrying subsector is also related to the Government’s 2005 policy efforts to revive the mining industry. Mining of copper, gold, nickel and other metals, stone quarrying and crude petroleum production all contributed to the mining and quarrying subsector’s growth.
In 2008, the mining and quarrying subsector grew by 1.9% compared to growth of 26.0% in 2007. The growth was affected by the contraction of gold, chromium and other metallic mining.
34
頁 118 / 247424(b)(3)
2014/03/12file:///C:/blp/data/CFd424b3.htm

Table of ContentsTable of ContentsTable of ContentsTable of Contents
In the first nine months of 2009, the mining and quarrying subsector grew by 22.4% compared to a contraction of 2.3% in the first nine months of 2008. The growth was driven by higher production of copper, nickel, crude oil, stone quarrying, clay and other non-metallic minerals.
Service Sector
The service sector includes: the trade subsector; the transportation, communication and storage subsector; the private services subsector; the finance subsector; the housing and real estate subsector; and the government services subsector. The services sector remains the largest contributor to GDP, having contributed 48.9% to GDP at constant market prices in 2008, an increase from 47.3% in 2004.
In 2006, the services sector grew by 6.5%, which was lower than the 7.0% growth recorded in 2005. The decrease was due to the lower growth rates in the transportation, communication and storage subsector, the finance subsector and the government services subsector. The growth in the sector in 2006 was primarily attributable to the finance, trade and private services subsectors. These sectoral increases and growth in transportation, communication and storage subsector, coupled with the benign inflation rate in 2006, made positive contributions to both the trade and private services subsectors.
In 2007, the services sector was the fastest growing sector of the economy, with growth of 8.1%, compared to growth of 6.5% in 2006, due principally to a property market supported by favorable interest rates. The stock market also exhibited increased trading volume in 2007, which was attributable to higher corporate earnings and improved fiscal performance, with the result being a positive contribution to the service sector growth. Leading the growth in the service sector were the finance, trade, private services, and transportation, communication and storage subsectors.
In 2008, the services sector grew by 3.3% compared to growth of 8.1% in 2007. The decrease in the growth rate was due to a slowdown in the trade, finance, transportation, communication and storage, and private services subsectors. The trade subsector grew by 1.2% in 2008, compared to 8.2% growth in 2007. The slower growth was attributable to higher inflation, which affected consumption patterns, while increased wholesale trade was the main driver for growth. Private services grew by 4.9% in 2008, compared to growth of 8.4% in 2007. The decrease in the growth rate was due to slower growth of educational services, as well as slower growth of hotel and restaurant, medical and health, and personal services. Growth in 2008 was attributable principally to the trade, private services, housing and real estate and government services subsectors. Growth in private services was attributable due mainly to the growth of personal, recreational, medical and other services. The housing and real estate subsector grew by 5.7% in 2008, compared to 5.8% growth in 2007, driven mainly by strong demand from retail markets as well as outsourcing firms. The government services subsector grew by 5.5% in 2008, compared to 2.7% growth in 2007.
Preliminary data indicates that the services sector grew by 2.9% in the first nine months of 2009 compared to growth of 4.1% in the first nine months of 2008. The slower growth was mainly due to a contraction in the ownership of dwellings and real estate subsector by 0.7% in the first nine months of 2009, compared to growth of 7.1% in the same period of 2008. Transportation, communication and storage was the main contributor to the sector’s growth, although the 2.0% growth in this subsector in the first nine months of 2009 was at slower rate than the 4.2% growth recorded in the same period in 2008. Private services grew by 2.9% in the first nine months of 2009, down from 5.8% growth in the first nine months of 2008. Business services, including the business process outsourcing (“BPO”) industry, also contributed to growth in the services sector.
Trade Subsector. The trade subsector, which consists of wholesale and retail activities, accounted for 16.7% of GDP at constant market prices in 2004 and 14.5% of GDP in 2008. Total trade comprised approximately 75.0% retail trade and 25.0% wholesale trade.
In 2006, the trade subsector grew 6.1%, compared to growth of 5.6% in 2005, driven primarily by new innovations developed in the communications subsector.
35
頁 119 / 247424(b)(3)
2014/03/12file:///C:/blp/data/CFd424b3.htm

Table of ContentsTable of ContentsTable of ContentsTable of Contents
In 2007, the trade subsector recorded growth of 8.2%, compared to growth of 6.1% in 2006. The increase was driven by sales from newly opened retail malls.
In 2008, the trade subsector grew by 1.2% even as consumer demand decreased. Wholesale trade drove the growth, as retail trade slowed down due to the rise in inflation. Wholesale trade grew because businesses increased inventories in anticipation of higher prices.
In the first nine months of 2009, the trade subsector grew by 2.7%, compared to growth of 1.7% in the same period in 2008. The increased growth was due mainly to continued growth in retail trade despite the general economic downturn.
Finance Subsector. The finance subsector’s contribution to GDP at constant market prices increased significantly from 4.9% in 2004 to 5.9% in 2008.
In 2006, financial services grew by 11.3%, compared to growth of 13.5% in 2005. Banks drove the subsector’s growth with the gains from interest income and non-interest income, which included the income from fee-based transactions and the sale of Government securities.
In 2007, financial services grew by 13.1%, compared to growth of 11.3% in 2006. The increase was attributable to higher remittances from OFWs and an increase in tourism.
In 2008, the finance subsector grew by 2.5%. The slower growth was due to the slowing global economy and rising inflation.
In the first nine months of 2009, the finance subsector expanded by 6.0%, compared to growth of 5.0% in the same period in 2008, due mainly to the strong financial position of banks and insurance companies, which allowed them to expand during the global downturn. Furthermore, legislation to increase deposit insurance coverage from (Peso)250,000 to (Peso)500,000 was enacted in April 2009, boosting depositor confidence.
For a discussion of the country’s financial system, see “—The Philippine Financial System”.
Private Services Subsector. The private services subsector includes educational, medical and health, recreational, and hotel and restaurant services. The subsector contributed 8.1% to GDP in 2004 and 8.6% to GDP in 2008.
In 2006, the private services subsector recorded growth of 6.9%, compared to growth of 7.5% in 2005. The increase was attributable to growth in the BPO industry that was driven by developments in communications technology, as new products increased productivity and enhanced services.
In 2007, the private services subsector grew by 8.4%, compared to growth of 6.9% in 2006, primarily as a result of increases in business process outsourcing services and increased spending for health and educational services, both of which were attributable in part to higher OFW remittances.
In 2008, the private services subsector grew by 4.9%, compared to growth of 8.4% in 2007. The slowdown in growth was due to lower growth in hotel and restaurant services, recreational services and personal services.
In the first nine months of 2009, the private services subsector grew by 2.9%, compared to growth of 5.8% in the same period in 2008. This lower growth is mainly the result of a slowdown in offshoring and outsourcing activities, as businesses put expansion plans on hold given the uncertainties in the economic environment.
Transportation, Communications and Storage Subsector. The geographically diverse nature of the Philippines makes it important to have well developed road, air and sea transportation systems. The Government has encouraged the private sector to provide basic transportation services and strengthen inter-regional and urban
36
頁 120 / 247424(b)(3)
2014/03/12file:///C:/blp/data/CFd424b3.htm

Table of ContentsTable of ContentsTable of ContentsTable of Contents
links. Important ongoing projects involving the private sector include the Metro Rail Transit Project, portions of which have been operating since October 29, 2004, the Metro Manila Skyway Project, the Manila-Cavite Expressway Project and the South Luzon Expressway Extension. In March 2008, the Subic-Clark-Tarlac Expressway, which provides access to the Clark and Subic airports, was completed.
The Philippine road network is the most important transportation system, carrying approximately 65% of freight and 90% of passenger traffic. The road network covers more than 200,000 kilometers. Over 5.5 million vehicles use the road network, including over 800,000 vehicles for public use, principally in Metro Manila. Traffic remains congested in the National Capital Region, despite traffic management and various engineering measures. To ease traffic congestion the Government has built and continues to promote alternative road networks and mass rapid urban-transit-rail.
Use of Philippine rail facilities has declined largely because of the outdated facilities of the Philippine National Railways. The Government has constructed a three-line light-rail transit system in Metro Manila, financed by a build, lease and transfer arrangement, and has started work on a fourth line.
Five major public international airports, in Manila, Cebu, Clark, Subic and Davao, and over 80 other facilities throughout the Republic help meet the Republic’s air transport needs. The Government plans to upgrade several major airports to international standards and generally to modernize air navigation and communications operations in the Republic. On June 14, 2007, the Iloilo International Airport servicing the Visayas region opened to commercial traffic, and on March 31, 2008, the rehabilitation and upgrade of Clark International Airport was completed.
The Republic also requires an effective water transport system to ferry cargo and passengers among islands. Currently, the water transport system handles approximately 40% of total freight traffic and 10% of total passenger traffic in the Philippines. The regulatory policy during the past decade has been to open the industry to competition, ensuring lower cargo passage rates and improving the quality of service. The Government planned to construct or improve 96 national ports, approximately 300 municipal, feeder and fishing ports and river landings and special handling facilities for grains and bulk cargo in other selected ports. As of June 30, 2009, 21 of these national port projects have been completed, including the Subic Bay Port and the Lucena Port in Quezon Province.
Faced with historical shortages of telephone lines and long waits for basic telephone service, especially outside Metro Manila, the Government opened the telecommunications industry in 1993 to intensify competition and to increase substantially the number of telephone lines and interconnections. The Government has continued to implement programs designed to provide telephone lines, exchanges and transmission facilities to underserved regions of the country.
The transport, communications and storage subsector’s contribution to GDP, at constant market prices, grew from 8.5% in 2004 to 8.9% in 2008.
In 2006, the transportation, communication and storage subsector grew by 6.3%, compared to growth of 7.3% in 2005. Specifically, communication contributed significantly to overall growth as new products were developed, accompanied by intensified marketing efforts of firms in light of new innovations.
In 2007, the transportation, communication and storage subsector grew by 8.3%, compared to growth of 6.3% in 2006. The increase was primarily led by communications, as new services encouraged the use of mobile phones.
In 2008, the transportation, communication and storage subsector grew by 4.2%, compared to growth of 8.3% in 2007. The slowdown in growth was attributable mainly to the higher cost of fuel and a decrease in
37
頁 121 / 247424(b)(3)
2014/03/12file:///C:/blp/data/CFd424b3.htm

Table of ContentsTable of ContentsTable of ContentsTable of Contents
consumer demand for telecommunications services. Growth in the transportation, communication and storage subsector was attributed mainly to the expansion of the water and air transportation industries as the number of tourists using ferry and airplane services increased.
In the first nine months of 2009, the transportation, communication and storage subsector grew by 2.0%, compared to growth of 4.2% in the same period in 2008. The slower rate of growth was mainly the result of slower growth in water transportation and storage.
Income from Abroad
Net factor income from abroad, which is a component of GNP but is not included in GDP, is a significant factor in the Philippine economy, largely driven by OFW remittances.
In 2006, net factor income from abroad grew by 6.1%, compared to growth of 10.7% in 2005. The decrease was partially due to slower economic growth in the United States, where most OFW remittances originated.
In 2007, net factor income from abroad recorded growth of 12.1%, compared to growth of 6.1% in 2006. The increase was primarily attributable to the increase in OFW remittance from the Americas, as the number of OFW contracts from the United States increased 20.0% compared to 2006.
In 2008, net factor income from abroad grew by 30.8%, compared to growth of 12.1% in 2007. OFW remittances increased as demand for OFWs continued to grow in the education and health care sectors in North America and the construction sector in the Middle East. Higher remittance levels were partially offset by lower income from property investments in 2008 compared to 2007.
In the first nine months of 2009, net factor income from abroad increased by 25.2% to (Peso)149.4 billion from (Peso)119.3 billion in the first nine months of 2008. The increase was mainly due to increased remittances from OFWs as demand for OFWs increased in the education and health care sectors in North America, as well as in the construction sector in the Middle East. The growth in net factor income from abroad was also attributable to decreased property expenses, as OFWs and their families chose to save their earnings instead of investing the same.
In the first ten months of 2009, preliminary data shows that total OFW remittances were $14.3 billion, 4.5% higher than the $13.7 billion recorded in the first ten months of 2008. Growth in remittances in 2009 is primarily attributable to continued deployments of both land-based and sea-based workers overseas, as well the growth in the number of skilled and higher-income workers deployed. In 2008, preliminary data shows that total OFW remittances were $16.4 billion, a 13.7% increase from total remittances of $14.4 billion in 2007, higher than the Government’s forecast of 10.0% growth for 2008.
Prices, Employment and Wages
Inflation
The Philippines reports inflation as the annual percentage change in the consumer price index (“CPI”), which measures the average price of a standard “basket” of goods and services used by a typical consumer. The National Statistics Office (“NSO”) conducts a nationwide Family Income and Expenditure Survey every three years. Although the Government previously reported inflation figures based on both the 1994 CPI basket and the 2000 CPI basket, the 2000 CPI basket has been the only official measure for inflation since January 2005.
38
頁 122 / 247424(b)(3)
2014/03/12file:///C:/blp/data/CFd424b3.htm

Table of ContentsTable of ContentsTable of ContentsTable of Contents
The following table sets out the principal components of the 2000 CPI basket.
PRINCIPAL COMPONENTS OF THE 2000 CPI BASKET
The following table sets out the consumer price index (based on the 2000 CPI basket) and the manufacturing sector’s equivalent, the producer price index (based on the 1994 Producer Price Index benchmark for 2004 and 2005, while the 2000 PPI was the base for 2006 onwards), as well as the annual percentage changes in each index.
CHANGES IN CONSUMER AND PRODUCER PRICE INDEX
Source: National Statistics Office.
Category2000
CPI Basket
Food items (including beverages and tobacco), total 50.0Rice 9.4
Non-food items, total 50.0Housing and repairs 16.8Services 15.9Fuel, light and water 6.9Clothing 3.0Miscellaneous 7.3
2004 2005 2006 2007 2008 2009
Consumer Price Index 120.6 129.8 137.9 141.8 155.0 159.7Increase over previous year 6.0% 7.6% 6.2% 2.8% 9.3% 3.2% Producer Price Index for manufacturing (“PPI”) 198.2 219.5 169.6 170.8 175.3 172.7Increase over previous year 7.5% 10.8% 11.2% 0.7% 4.1% -0.6%
(1) Average of the CPI from January to November 2009.
The average inflation rate for 2006 was 6.2%, which was lower than the 7.7% inflation rate recorded in 2005 as all commodity groups recorded slower average annual growth rates. The lowest average inflation rate among the commodity groups during the year was registered in clothing and miscellaneous items. The highest average inflation was for fuel, light and water at 12.9%.
The average inflation rate for 2007 was 2.8%, which was lower than the 6.2% inflation rate recorded in 2006 due to lower annual average growth rates registered in all commodity groups. The biggest drop in inflation rate was in fuel, light and water due to a lower annual increase in the price of kerosene.
The average inflation rate for 2008 was 9.3%, higher than the average inflation rate of 2.8% in 2007. The primary inflationary pressures in 2008 were increases in food and energy prices. In particular, domestic rice prices rose during the first six months of 2008 due to an increase in the price of fertilizers and fuel, as a result of a rise in global oil prices, and a significant rise in the price of imported rice.
Inflation as of November 2009 was 2.8%, which was higher than the 1.6% for October 2009, but substantially lower than the 9.9% recorded for November 2008. The decrease on a year-on-year basis was a result of smaller price increases in all commodity groups particularly fuel, light and water and services. Average inflation for the first eleven months of 2009 was 3.2%, which is within the Government’s average inflation target between 2.5% to 4.5% for 2009.
39
(2) Average of the PPI from January to September 2009.
(1)
(2)
頁 123 / 247424(b)(3)
2014/03/12file:///C:/blp/data/CFd424b3.htm

Table of ContentsTable of ContentsTable of ContentsTable of Contents
Preliminary data indicates that the PPI decreased by 0.9% from 175.8 in August 2009 to 174.2 in September 2009 due to price decreases of several products, particularly furniture and fixtures, basic metals, petroleum products and paper products. These price decreases offset increases in the price of wood products, footwear and apparel. The PPI for September 2009 was approximately 3.6% lower than the level recorded in September 2008, primarily due to price decreases in furniture and fixtures, basic metals and petroleum products.
Employment and Wages
The following table presents selected employment information for various sectors of the economy.
SELECTED EMPLOYMENT INFORMATION
Source: Bureau of Labor and Employment Statistics—Current Labor Statistics; National Statistics Office—Labor Force Survey.
2004 2005 2006 2007 2008 2009
Labor force (in thousands)(old methodology) 35,480 34,938 — — — —
Labor force (in thousands)(new methodology) — — 35,464 36,213 36,805 37,891Unemployment rate (old methodology) 11.9% 11.4% Unemployment rate (new methodology) 8.0% 7.3% 7.4% 7.5% Employment share by sector:Agriculture, fishery and forestry 35.9 35.9 35.8 35.1 35.3 34.3Industry sector
Mining and quarrying 0.4 0.4 0.4 0.4 0.5 0.5Manufacturing 9.8 9.6 9.4 9.1 8.6 8.3Construction 5.4 5.3 5.1 5.3 5.4 5.4Electricity, gas and water 0.4 0.4 0.4 0.4 0.4 0.4
Total industry sector 15.9% 15.7% 15.3% 15.3% 14.8% 14.5% Service sector
Transportation, communication and storage 7.7 7.6 7.6 7.7 7.6 7.6Trade 18.5 19.0 19.0 18.9 18.9 19.2Finance and housing 3.2 3.3 3.5 3.7 3.9 4.1Services 18.7 18.5 18.8 19.2 19.5 20.2
Total services sector 48.1% 48.4% 48.9% 49.6% 49.9% 51.1%
Total employed 100.0% 100.0% 100.0% 100.0% 100.0% 100.0%
(1) Average of January, April, July and October 2009 Labor Force Survey figures.
(2) Does not include OFWs.
As of October 2009, the labor force in the Republic, not including OFWs, totaled 37.9 million people. Workers in the Republic are employed primarily in service industries, such as wholesale and retail trade and repair of motor vehicles, motorcycles and personal and household goods. Filipino workers in the agriculture sector comprised 34.3% of the total employed followed by the industry sector, which employed 14.5% of the total labor force as of October 2009. Most Filipinos employed in the industry sector, constituting approximately 8.3% of the total labor force, worked in the manufacturing subsector.
Regional tripartite bodies consisting of representatives of Government, businesses and workers establish minimum wage adjustments, which vary based on region and industry. Under Philippine law, minimum wage adjustments may only be increased once in any twelve month period. The minimum wages for workers in Metro Manila and the surrounding areas are the highest in the country.
40
(3) Figures generated using 2000 census-based population projections.
(1)
(2)(3)
(2)(3)
頁 124 / 247424(b)(3)
2014/03/12file:///C:/blp/data/CFd424b3.htm

Table of ContentsTable of ContentsTable of ContentsTable of Contents
In April 2005, the Government adopted a new definition of unemployment. The old definition of unemployment included all persons at least 15 years old without work who were seeking work. The new definition is restricted to such persons who are also immediately available for work (excluding, for example, students seeking work who would not be able to immediately take on new employment). The new definition of employment is intended to make the Republic’s reporting of labor statistics consistent with prevailing international standards. Using the new definition of unemployment, the national average unemployment for the period of July to December 2005 was 7.8% in 2005. Under the old methodology, the unemployment rate would have been 11.9% in the first six months of 2005.
The average unemployment rate of 8.0% in 2006 was slightly higher than the 7.8% average for the period of July to December 2005. The employment rate in the agricultural and services sectors increased by 1.7% and 3.2%, respectively, but this was offset in part by the unemployment rate for the industry sector, which decreased by 0.3%.
The average rate of unemployment in 2007 was 7.3%, a decrease from 8.0% in 2006. Leading contributors to the decrease in unemployment in 2007 were increases in the number of workers employed in the services and industry sectors. The services sector continued to employ the highest number of persons in 2007, and contributed 697,000 new jobs to the economy in 2007.
The average rate of unemployment in 2008 was 7.4%, compared to 7.3% in 2007. The increase in the unemployment rate from the previous year was attributed mainly to decreased employment in the industry sector, particularly in manufacturing. Unemployment remained high in urbanized areas, with the unemployment rate in the National Capital Region reaching 12.2% and the unemployment rate in Region IV-A reaching 9.2%.
The average rate of unemployment in 2009 was 7.5%, an increase from the 7.4% average unemployment rate in 2008. The services sector continued to employ the highest number of persons in 2009, accounting for 51.1% of the total workforce of approximately 37.9 million, followed by the 34.3% employed in the agriculture sector and 14.5% in the industrial sector. In the National Capital Region, which includes Metro Manila, the unemployment rate of 12.9% in 2009 was significantly higher than the national average.
Social Security System and Government Service Insurance System
The Philippines does not pay any unemployment compensation or make any general welfare payments other than through the Social Security System and the Government Service Insurance System. The Social Security System provides private sector employees, including self-employed persons and their families, with protection against decreases in income due to disability, sickness, old age and death. Monthly contributions by covered employees and their employers, and investment income of the Social Security System, fund the system. The Social Security System invests its funds in Government securities and in domestic equity securities.
The Government Service Insurance System administers social security benefits for Government employees, including retirement benefits, life insurance, medical care and sickness and disability benefits. It also administers the self-insurance program for Government properties, such as buildings and equipment. The Government Service Insurance System also oversees loan programs, including housing loans for Government employees. Monthly contributions by covered employees and their employers fund the system. Government agencies must include in their annual appropriations the amounts needed to cover their share of the contributions and any additional premium required based on the hazardous nature of the work. The Government Service Insurance System invests its funds in a manner similar to the Social Security System.
41
頁 125 / 247424(b)(3)
2014/03/12file:///C:/blp/data/CFd424b3.htm

Table of ContentsTable of ContentsTable of ContentsTable of Contents
Savings
The following table sets out gross national savings, total investment and the savings-investment gap as a percentage of GDP.
NATIONAL SAVINGS AND INVESTMENTS
Source: National Accounts, NSCB.
Balance of Payments
Item 2004 2005 2006 2007 2008
Gross national savings 29.7% 30.1% 29.1% 30.2% 30.8% Gross domestic savings 21.2 21.9 20.0 20.7 19.2Foreign savings 4.9 4.9 8.3 9.7 9.7Investment 16.8 14.6 14.5 15.4 15.2Saving-investment gap 13.0% 15.5% 14.8% 15.8% 15.2%
Overview
Balance of payments figures measure the relative flow of goods, services and capital into and out of the country as represented in the current account and the capital and financial accounts. The current account tracks a country’s trade-in-goods, services, income and current transfer transactions. The capital and financial account includes the capital account, which covers all transactions involving capital transfers and acquisition or disposition of non-produced, non-financial assets, and the financial account, which covers all transactions associated with changes of ownership in the foreign financial assets and liabilities of an economy. A balance of payments surplus indicates a net inflow of foreign currencies, thereby increasing demand for and strengthening the local currency. A balance of payments deficit indicates a net outflow of foreign currencies, thereby decreasing demand for and weakening the local currency.
Revisions
On March 30, 2005, Bangko Sentral released the balance of payments statistics for 2003 and 2004, which incorporate the results of improved data collection and estimation methodologies, revised classifications and treatment, and new methodologies to make the compilation practices consistent with internationally recommended concepts. The most significant revisions involved adjustments to import statistics, the treatments of remittances by OFWs and trade credits.
In the case of import data, the revisions were made in accordance with the recommendations of the Inter-agency Committee on Trade Statistics (comprising representatives of the Bangko Sentral, NSO, the National Economic Development Authority (“NEDA”), Bureau of Customs and the National Statistical Coordination Board), and included valuation adjustments of imports under consignment arrangements, particularly for electronics and garments, and other imports not covered in the foreign trade statistics of the NSO, such as remittances in kind. These adjustments resulted in a wider trade deficit that consequently reduced the current account balance. In the case of remittances, OFW remittance statistics were revised to categorize OFWs into residents and non-residents in accordance with the one-year residency rule recommended in the IMF’s BPM5. Under the BPM5 methodology, the residency of seasonal workers, such as OFWs, is classified according to the length of their intended stay in the host country. Generally, OFWs who are expected to be working abroad for less than one year are classified as Philippine residents and their gross earnings are reflected under the income account. On the other hand, OFWs who are expected to be working abroad for one year or more are classified as non-residents and their remittances are reflected under the current transfers account. Moreover, the new estimation methodology takes into account cash remittances made by OFWs through informal channels, as well as remittances-in-kind. Calculation of these cash remittances and remittances-in-kind are based on data from the
42
頁 126 / 247424(b)(3)
2014/03/12file:///C:/blp/data/CFd424b3.htm

Table of ContentsTable of ContentsTable of ContentsTable of Contents
NSO’s Survey of Overseas Filipinos. Trade credits are now based on surveys and external debt reports, rather than the previous method of deriving trade receivables and payables from data on goods shipments and payments. Other changes involved the use of new databases, such as administrative records of government regulatory agencies, as well as records of international agencies.
With respect to imports and exports of goods, the balance of payments statistics released by Bangko Sentral are based on the trade-in-goods statistics compiled by the NSO. However, for purposes of inclusion in the overall balance of payments, the trade-in-goods statistics reported by the NSO are adjusted by Bangko Sentral to exclude temporary exports and imports and returned goods. This adjustment is intended to bring the balance of payments results in line with the IMF’s BPM5.
In August 2005, the NSO released revised export figures for 2004 and import figures for 2003 and 2004. Exports of goods in 2004 were revised from $39.6 billion to $39.7 billion due to previously underreported exports from Subic Bay. Imports of goods were revised from $37.5 billion to $40.5 billion for 2003 and from $40.3 billion to $44.0 billion for 2004. As noted above, the revisions in the import data included valuation adjustments of imported components used in electronic goods that were subsequently exported. The understatement, particularly in these electronic components under consigned arrangement, was due to the fact that (i) the actual import value is unknown to the importer since the relevant components are off-balance sheet items and (ii) these types of goods are duty-free and, therefore, subject to less rigid customs checks than dutiable goods. Overall, the Republic’s trade-in-goods deficits as reported by the NSO were revised from $1.3 billion to $4.2 billion for 2003 and from $713 million to $4.4 billion for 2004. The August 2005 revisions to NSO’s trade figures are reflected in the discussion in the section “—Current Account—Goods Trade”.
In March 2006, along with the release of the full year balance of payments data for 2005, Bangko Sentral also released revised balance of payments data for the years 1999 to 2004. The revisions for the years 2003 and 2004 mainly reflected data updates and reclassification, specifically in the financial account.
In September 2006, along with the balance of payments data for the first half of 2006, the Bangko Sentral released revisions to the balance of payments data for 2004 and 2005. The revisions mainly consisted of: (i) reclassification of transactions previously recorded under merchant services imports to miscellaneous business, professional and technical services; (ii) correction of reinvested earnings under the income account; and (iii) revision of the 2004 and 2005 portfolio investment assets to reflect the revised results of the Coordinated Portfolio Investment Survey. As a result of the revisions, reinvested earnings and undistributed branch earnings reversed to a deficit of $140 million from the $25 million surplus originally reported. The income account deficit consequently increased to $294 million from the $107.0 billion originally reported. The portfolio investments account increased to a surplus of $3.5 billion from the $2.8 billion originally reported. This brought the financial account balance to $2.2 billion, an increase from the $820 million originally reported.
In September 2008, along with the balance of payments data for the second half of 2008, Bangko Sentral released revisions to the balance of payments data for 2007. The revisions mainly consisted of: (i) revision of the goods import and export figures to reflect adjustments made by the NSO; (ii) revision of investment income under the income account; and (iii) revision of portfolio investment and other investment assets to reflect the revised results of the Coordinated Portfolio Investment Survey. As a result of the revisions, goods exports increased to $49.5 billion from the $49.3 billion originally reported. Goods imports increased to $57.9 billion from the $57.6 billion originally reported. Investment income increased to a deficit of $3.9 billion from the $3.5 billion originally reported. Assets under the portfolio investments account reversed to a deficit of $834 million from the $481 million surplus originally reported; while assets under the other investment account increased from $2.5 billion to $4.8 billion.
In September 2009, along with the balance of payments data for the first half of 2009, Bangko Sentral released revisions to the balance of payments data for 2008. The revisions mainly consist of (i) revision of the goods import and export figures to reflect adjustments made by the NSO; (ii) revision of investment income under the income account; and (iii) revision of portfolio investment and other investment assets to reflect the
43
頁 127 / 247424(b)(3)
2014/03/12file:///C:/blp/data/CFd424b3.htm

Table of ContentsTable of ContentsTable of ContentsTable of Contents
revised results of the Coordinated Portfolio Investment Survey. As a result of the revisions, goods exports increased to $48.3 billion from the $48.2 billion originally reported. Goods imports increased to $61.1 billion from the $60.8 billion originally reported. Investment income increased to a deficit of $4.0 billion from the $3.9 billion originally reported. The asset deficit under the portfolio investments decreased to a deficit of $619 million from a deficit of $1.0 billion originally reported; while the asset deficit under the other investment account increased from a deficit of $3.8 billion to $4.4 billion.
The following table sets out the consolidated financial position for the Republic for the years 2004 to 2008, as well as preliminary data as of June 30, 2009. Please note that, as indicated above, Bangko Sentral announced revisions to the balance of payment statistics for 2008 in September 2009. As a result, the data included in this table may be different from previously reported data.
BALANCE OF PAYMENTS
Source: Bangko Sentral.
2004 2005 2006 2007 2008 2009
(in millions)
Overall BOP position: $ (280) $ 2,410 $ 3,769 $ 8,557 $ 89 $ 2,216
Current account $ 1,628 $ 1,984 $ 5,347 $ 7,119 $ 3,897 $ 3,936
Goods and services: (7,461) (9,113) (6,595) (6,142) (11,469) (3,957) Exports 42,837 44,788 52,970 59,278 58,448 21,388Imports 50,298 53,901 59,565 65,420 69,917 25,345Goods (5,684) (7,773) (6,732) (8,391) (12,885) (4,553)
Credit: Exports 38,794 40,263 46,526 49,512 48,253 16,822Debit: Imports 44,478 48,036 53,258 57,903 61,138 21,375
Services (1,777) (1,340) 137 2,249 1,416 596Credit: Exports 4,043 4,525 6,444 9,766 10,195 4,566Debit: Imports 5,820 5,865 6,307 7,517 8,779 3,970
Income: (71) (294) (1,255) (892) 140 6Credit: Receipts 3,725 3,937 4,388 5,351 5,973 2,797Debit: disbursements 3,796 4,231 5,643 6,243 5,833 2,791
Current transfers: 9,160 11,391 13,197 14,153 15,226 7,887Credit: Receipts 9,420 11,711 13,511 14,573 15,781 8,151Debit: Disbursements 260 320 314 420 555 264
Capital and financial account: (1,630) 2,229 20 3,527 (1,898) (1,029)
Capital account: 17 40 138 24 53 36Credit: Receipts 46 58 181 108 114 67Debit: Disbursements 29 18 43 84 61 31
Financial account: (1,647) 2,189 (118) 3,503 (1,951) (1,065) Direct investment 109 1,665 2,818 (620) 1,144 769
Debit: Assets, residents’ investments abroad 579 189 103 3,536 259 123Credit: Liabilities, non-residents’ investments in the Philippines 688 1,854 2,921 2,916 1,403 892
Portfolio investments (1,713) 3,475 3,043 4,623 (3,799) 372Debit: Assets, residents’ investments abroad 910 146 1,567 (834) (619) (68) Credit: Liabilities, non-residents’ investments in the Philippines (803) 3,621 4,610 3,789 (4,418) 304
Financial derivatives: (27) (43) (138) (288) (113) 53Debit: Assets, residents’ investments abroad (58) (98) (159) (170) (541) (212) Credit: Liabilities, non-residents’ investments in the Philippines (85) (141) (297) (458) (654) (159)
Other investment: (16) (2,908) (5,841) (212) 817 (2,259) Debit 859 4,791 3,512 4,840 (4,395) 113Credit 843 1,883 (2,329) 4,628 (3,578) (2,146)
Net unclassified items: (278) (1,803) (1,598) (2,089) (1,910) (691)
44
(1) Revised to reflect: late reports, post audit adjustments and final data from companies. Please see “Balance of Payments—Revisions” for a more detailed discussion of recent and pending revisions to previously reported data.
(1) (2)
(3)
(1)
頁 128 / 247424(b)(3)
2014/03/12file:///C:/blp/data/CFd424b3.htm

Table of ContentsTable of ContentsTable of ContentsTable of Contents
(2) Preliminary data as of September 24, 2009 for the first six months of 2009.
Overall Balance of Payments Performance
(3) The overall BOP position is determined by deducting change in reserve liabilities from change in reserve assets.
In 2006, the Republic’s balance of payments position recorded a surplus of $3.8 billion, which was a 56.4% increase from the surplus of $2.4 billion in 2005. The increase reflected a considerable surplus in the current account of $5.3 billion compared to the current account surplus of $2.0 billion in 2005. The significant increase more than offset the smaller net inflow in the capital and financial account following higher prepayments of public and private sector bonds and loans during the year. The increase in the current account was primarily due to the continued inflows of OFW remittances combined with a lower goods and services account deficit which together more than offset a widening deficit in the income account. Receipts from transfers mostly comprised OFW remittances which rose 15.9% compared to the previous year. The 27.5% contraction in the goods and services account deficit from $9.1 billion to $6.7 billion was due to a reversal of the services account from a net outflow of $1.3 billion to a net inflow of $137 million and a lower trade-in-goods deficit of $6.7 billion compared to $7.8 billion in 2005. The reversal of the deficit in the services account was due to higher net inflows from travel, communication and other business services, led by increasing BPO activities. Net travel receipts grew by 32.9% following a rise in foreign visitors to the Philippines. The trade-in-goods deficit contracted primarily due to higher exports of manufactured goods, mineral products, petroleum products and produce.
In 2007, the Republic’s overall balance of payments position recorded a surplus of $8.6 billion, more than twice the surplus of $3.8 billion in 2006. The higher balance of payments position was supported by sustained inflows from OFWs. In addition, the higher balance of payments surplus was recorded although the Republic prepaid certain public and private sector obligations during this period, due to ample foreign exchange liquidity in the system which allowed for such prepayments before maturity, with total prepayments reaching $2.2 billion during the year. The overall balance of payments position was also supported by increased foreign exchange inflows, as recorded in the current account, which grew by 34.0% to $7.1 billion from $5.3 billion in 2006, where an increase in the trade-in-goods deficit was offset by a surplus in the services account of $2.2 billion from $137 million in 2006. Growth in the capital and financial account resulted in a $3.5 billion surplus compared to $20.0 million in 2006, was primarily attributable to the financial account, which had a surplus of $3.5 billion from a deficit of $118 million in 2006. In this account, the net inflow in portfolio investments grew by 53.3% to $4.6 billion from $3.0 billion in the previous year.
In 2008, the overall balance of payments position of the Republic recorded a surplus of $89 million, which was considerably lower than the $8.6 billion overall surplus recorded in 2007. This overall change in the balance of payments position was mainly attributable to the deficit in the capital and financial account of $1.9 billion for the year, which was a reversal from the surplus of $3.5 billion in 2007. In addition, the current account surplus of $3.9 billion in 2008 was 45.1% lower than the $7.1 billion surplus recorded in 2007. The sustained surplus in the current account is primarily attributable to the increase in net current transfers, which was attributable primarily to higher remittances and the surplus of net income flows. These developments were offset in part, however, by lower net services inflows and the higher trade-in-goods deficit.
In the first six months of 2009, preliminary data indicates that the overall balance of payments position of the Republic recorded a surplus of $2.2 billion, 14.6% higher than the surplus of $1.9 billion recorded in the same period of 2008. The surplus in the overall position was attributable primarily to a higher surplus in the current account, which recorded a surplus of $3.9 billion for the first six months of 2009, 81.5% higher than the $2.2 billion surplus for the same period in 2008. By contrast, the capital and financial account recorded a deficit of $1.0 billion in the first six months of 2009 compared to the $891 million surplus recorded in the same period in 2008. The reversal in the capital and financial account was primarily attributable to a reversal of the other investments accounts to a net deficit, which more than offset surpluses in the direct and portfolio investments accounts.
45
頁 129 / 247424(b)(3)
2014/03/12file:///C:/blp/data/CFd424b3.htm

Table of ContentsTable of ContentsTable of ContentsTable of Contents
Current Account
The Republic’s current account recorded a surplus of $5.3 billion for 2006, a significant increase from the $2.0 billion surplus for 2005. The expansion of the current account surplus mainly reflected the combined effects of higher net current transfer inflows primarily from continued OFW remittances and lower deficits in the trade-in-goods and services accounts, resulting primarily from export growth and receipts from foreign visitors and BPO services.
The current account recorded a surplus of $7.1 billion in 2007, 34.0% higher than the previous year’s surplus of $5.3 billion. The higher surplus was mainly the result of strong inflows in the current transfers and services account, which grew by 7.2% to $14.2 billion, as a result of higher remittances by OFWs. The income account also recorded a lower deficit during the year of $892.0 million, from a deficit of $1.3 billion in 2006. These improvements more than offset the higher trade-in-goods deficit, which widened by 25.4% to $8.4 billion from a deficit of $6.7 billion in 2006.
In 2008, the current account recorded a surplus of $3.9 billion, a decrease of approximately 45.1% from a surplus of $7.1 billion recorded in the previous year. The lower surplus was mainly the result of the trade-in-goods deficit in 2008, which increased to $12.9 billion from an $8.4 billion deficit in 2007 due to higher levels of imports of all major commodities and a contraction in the exports of goods. A lower net inflow of services, which declined by 36.4% to $1.4 billion in 2008 from $2.2 billion in 2007, also contributed to the decrease in the current account surplus. These developments offset improvements in net current transfer receipts of $15.2 billion, which was a 7.0% increase from the $14.2 billion recorded in 2007.
In the first six months of 2009, according to preliminary data, the current account recorded a surplus of $3.9 billion, an increase of 81.5% from a surplus of $2.2 billion recorded in the same period in 2008. The higher surplus was mainly the result of a lower trade-in-goods deficit compared with the same period in 2008. In the first six months of 2009, the trade-in-goods deficit narrowed by 29.7% to $4.6 billion, lower than the deficit of $6.5 billion in the same period in 2008; however, total imports and exports of goods were both lower in the first six months of 2009 as a result of the global economic downturn. Current transfers also increased by 3.8% in the first six months of 2009 to $7.9 billion, from $7.6 billion for the same period in 2008. These increases offset a decrease in net inflow of services by 27.1%, from $818 million in the first six months of 2008 to $596 million in the first six months of 2009.
Goods Trade. Trading in goods significantly affects the Philippine economy. From 2004 to 2008, exports (as reported by the NSO) were equal to an average of 38.4% of the country’s GDP, and imports were equal to an average of 43.0% of GDP, respectively.
A significant proportion of exports depends on imported raw materials or other inputs, rendering the country’s exports vulnerable to any import decline resulting from a peso depreciation. See “Monetary System—Foreign Exchange System”.
The trade-in-goods deficit in 2006 was $6.7 billion, a decrease of 14.1% from the deficit of $7.8 billion in 2005. The improvement was attributable to export growth of 15.6% for the year, compared to 10.9% growth in imports in the same period. The key growth product drivers for export were manufactured goods, minerals, and petroleum products, which grew by 10.6%, 156.8% and 56.7%, respectively.
The trade-in-goods account deficit widened by 25.4% to $8.4 billion in 2007, compared to a deficit of $6.7 billion in 2006, as the growth of imports outpaced that of exports. Imports of goods in 2007 expanded by 8.7%, supported by higher purchases across all major commodity groups, led by raw materials and intermediate goods, while notable increases were recorded in mineral fuels and lubricants. Exports of goods in 2007 rose by 6.4%, driven by higher shipments of manufactures (mainly electronics, machinery and transport, chemicals, wood, and processed food and beverages), mineral and petroleum products, coconut products, fruits and vegetables and other agro-based products.
46
頁 130 / 247424(b)(3)
2014/03/12file:///C:/blp/data/CFd424b3.htm

Table of ContentsTable of ContentsTable of ContentsTable of Contents
In 2008, the trade-in-goods deficit widened to $12.9 billion, a 53.6% increase from the deficit of $8.4 billion recorded in 2007. The higher deficit was mainly due to the combined effects of growth in imports and contraction in exports of goods in 2008. Import growth was 5.6% in the year, compared to 8.7% growth in 2007, as a result of higher raw material costs globally. The higher deficit was also attributable to exports of goods contracting by 2.5% in 2008, a reversal from 6.4% growth for the same period in 2007 as a result of the slowdown of developed economies from the global economic downturn. Though the rate of import growth slowed, there was nevertheless an increase in the imports of all major import commodities in 2008, with purchases of consumer goods and mineral fuels and lubricants posting growth rates of 41.7% and 29.2%, respectively.
Preliminary data indicates that in the first eight months of 2009, the trade-in-goods deficit narrowed to $5.8 billion, 39.6% lower than the deficit of $9.6 billion recorded in the same period in 2008. The lower deficit was due mainly to total imports contracting more than total exports did during the period. Imports in the first eight months of 2009 contracted by $14.2 billion in the period to $29.3 billion, a decrease of 32.7% from the first eight months of 2008. Imports of all major commodity groups recorded contractions of more than 20% in the first eight months of 2009. Exports contracted by $10.4 billion to $23.5 billion in the first eight months of 2009, a decrease of 30.7% from the $33.9 billion recorded in the first eight months of 2008.
47
頁 131 / 247424(b)(3)
2014/03/12file:///C:/blp/data/CFd424b3.htm

Table of ContentsTable of ContentsTable of ContentsTable of Contents
Exports of Goods. The following tables set out the Republic’s exports of goods by major commodity group and destination, as reported by the NSO and adjusted by the BSP.
EXPORTS OF GOODS BY COMMODITY GROUP
Source: National Statistics Office.
Percentage ofTotal Exports
2004 2005 2006 2007 2008 2009 2004 2008
(in millions, except percentages)
ManufacturesElectronics, electrical equipment, parts and
TelecomElectronic products $26,722 $27,287 $29,673 $31,085 $28,502 $13,732 67.3% 58.1% Other electronics 1,145 1,200 941 1,158 1,426 840 2.9 2.9Garments 2,171 2,309 2,655 2,309 1,952 1,036 5.5 4.0Textile yarns/fabrics 238 247 220 209 194 94 0.6 0.4Footwear 34 26 25 31 31 18 0.1 0.1Travel goods and handbags 39 20 30 104 95 40 0.1 0.2Wood manufactures 122 138 651 770 918 530 0.3 1.9Furniture & fixtures 294 304 276 241 221 93 0.7 0.5Chemicals 448 546 758 1,032 1,130 593 1.1 2.3Non-metallic mineral manufactures 165 171 182 223 211 105 0.4 0.4Machinery and transport equipment 1,604 1,836 1,713 1,857 2,116 1,207 4.0 4.3Processed food and beverages 498 519 536 728 943 659 1.3 1.9Iron and steel 58 94 244 265 263 83 0.1 0.5Baby carriages, toys, games and sporting goods 128 131 152 152 143 82 0.3 0.3Basketwork, wickerwork and other articles of
plaiting materials 67 58 53 56 42 25 0.2 0.1Miscellaneous 234 283 358 342 332 185 0.6 0.7Others 1,558 1,776 2,392 2,394 2,480 1,585 3.9 5.1
Total manufactures 35,525 36,945 40,859 42,956 40,999 20,906 89.5 83.5Agro-based products
Coconut products 716 821 757 946 1,348 465 1.8 2.7Sugar and sugar products 79 81 98 88 80 60 0.2 0.2Fruits and vegetables 601 660 724 750 735 496 1.5 1.5Other agro-based products 476 442 457 521 612 336 1.2 1.2
Total agro-based products 1,872 2,004 2,036 2,305 2,775 1,357 4.7 5.7Mineral products 796 819 2,103 2,605 2,498 950 2.0 5.1Petroleum products 380 586 918 1,109 1,240 185 1.0 2.5Forest products 34 33 28 34 34 23 0.1 0.1Others 1,074 868 1,466 1,456 1,531 584 2.7 3.1
Total (per NSO) $39,681 $41,255 $47,410 $50,465 $49,077 $24,005 100.0% 100.0%
Less adjustments (conceptual and undercoverage) (887) (992) (884) (953) (824) (538)
Total (BPM5) $38,794 $40,263 $46,526 $49,512 $48,253 $23,467
(1) Total export figures for 2008 were revised in September 2009. Please see “Balance of Payments—Revisions” for a more detailed discussion of recent and pending revisions to previously reported data.
(2) Preliminary data as of October 13, 2009 for the first eight months of 2009.
(3) Data reflects the old definition of electronic parts and equipment, which includes only microcircuit semiconductors and other electronic equipment.
(4) Includes semiconductors, electronic data processing, office equipment, consumer electronics, telecommunication, radar, medical and industrial instrumentation and automotive electronics.
48
(5) Conceptual adjustments reflect the exclusion of returned goods and temporary exports, in accordance with the IMF’s Balance of Payments Manual (BPM5), while coverage adjustments reflect the inclusion of exports of goods that are not captured in the data sourced from the NSO’s foreign trade statistics.
(1) (2)
(3)
(4)
(4)
(5)
頁 132 / 247424(b)(3)
2014/03/12file:///C:/blp/data/CFd424b3.htm

Table of ContentsTable of ContentsTable of ContentsTable of Contents
EXPORTS OF GOODS BY DESTINATION
Source: National Statistics Office.
Percentage of
Total Exports
Country 2004 2005 2006 2007 2008 2009 2004 2008
(in millions, except percentages)
United States $7,088 $7,418 $8,690 $8,594 $8,207 $4,188 17.9% 16.7% Japan 7,981 7,205 7,916 7,303 7,707 3,858 20.1 15.7Southeast Asia 4,202 4,435 4,679 4,885 4,476 2,086 10.6 9.1United Kingdom 555 437 484 479 483 184 1.4 1.0Hong Kong 3,146 3,341 3,706 5,804 4,987 2,012 7.9 10.2Netherlands 3,583 4,033 4,769 4,150 3,708 2,205 9.0 7.6Federal Republic of Germany 1,436 1,349 1,781 2,149 2,440 1,409 3.6 5.0China, Republic of (Taiwan) 2,228 1,888 2,010 1,973 1,862 897 5.6 3.8Korea, Republic of 1,113 1,391 1,423 1,784 2,523 1,172 2.8 5.1China, People’s Republic of 2,653 4,077 4,628 5,750 5,469 2,084 6.7 11.1Others 5,696 5,681 7,324 7,594 7,215 3,910 14.4 14.7
Total $39,681 $41,255 $47,410 $50,465 $49,077 $24,005 100% 100%
(1) Total export figures for 2008 were revised in September 2009. Please see “Balance of Payments—Revisions” for a more detailed discussion of recent and pending revisions to previously reported data.
(2) Preliminary data as of October 13, 2009 for the first eight months of 2009.
(3) Includes only Malaysia, Indonesia, Thailand, Brunei, Vietnam, Myanmar and Laos.
Exports of goods, as reported by the NSO, grew by 9.5% in 2004, 4.0% in 2005, 14.9% in 2006, and 6.4% in 2007, but decreased 2.8% in 2008 and 30.7% in the first eight months of 2009. As a percentage of total exports, manufactured goods decreased from 89.5% in 2004 to 83.5% in 2008. During the same period, exports of garments as a proportion of total exports decreased from 5.5% in 2004 to 4.0% in 2008 primarily due to increased international competition and a general decline in global demand. Exports of agriculture products, including coconut products, sugar products and fruits and vegetables, increased as a proportion of total exports from 3.5% in 2004 to 4.4% in 2008. As a percentage of total exports, machinery and transport equipment increased from 4.0% in 2004 to 4.3% in 2008.
In 2006, total exports of goods increased by 14.9% to $47.4 billion, from $41.3 billion in 2005. The increase was supported mainly by higher shipments of manufactured products such as electronics, garments, wood, chemicals and iron and steel. Electronics shipments in 2006 were recorded at $29.7 billion, an increase of 8.8% from the $27.3 billion recorded in 2005. Chemical shipments, another major contributor to export growth, grew by 38.9% in 2006 to $758 million from $546 million in 2005. Other drivers of growth in 2006 were mineral and petroleum products, coconut products and fruits and vegetables.
In 2007, total exports of goods increased by 6.4% to $50.5 billion from $47.4 billion in 2006. The increase was supported mainly by higher shipments of manufactured products such as electronics, machinery and transport, chemicals, wood and processed food and beverages. Electronics shipments in 2007 were $32.2 billion, an increase of 5.2% from $30.6 billion recorded in 2006. Chemical shipments increased by 36.1% in 2007 to $1.0 billion from $758 million in 2006. Other drivers of growth in 2007 were mineral and petroleum products, coconut products, fruits and vegetables and agro-based products.
In 2008, total exports of goods decreased by 2.8% to $49.1 billion from $50.5 billion in 2007. The decrease was mainly attributable to a 4.6% decline of total exports of manufactured products to $41.0 billion in 2008 from
49
(4) Based on NSO foreign trade statistics.
(1) (2)
(3)
(4)
頁 133 / 247424(b)(3)
2014/03/12file:///C:/blp/data/CFd424b3.htm

Table of ContentsTable of ContentsTable of ContentsTable of Contents
$43.0 billion in 2007. Manufactured goods comprised 83.5% of total exports in 2008. Total electronics shipments, which comprise the majority of manufactured products exports, were $29.9 billion in 2008, a decrease of 7.2% from the $32.2 billion in 2007, due mainly to decreases in exports of semiconductors and consumer electronics. The decrease in manufacturing exports was partially offset by higher shipments of petroleum products and agriculture products, which grew by 11.8% and 5.7% in 2008, respectively. The overall decline in export growth of 2.8% in 2008 was a reversal from 4.1% growth in the first nine months of the year and 4.2% in the first six months, and is attributable to the sharp downturn in the global economy in the fourth quarter.
Preliminary data indicates that in the first eight months of 2009, total exports of goods decreased by 30.3% to $24.0 billion from $34.5 billion for the same period of 2008. The decrease was mainly attributable to weak global demand across most goods, including manufactured goods, petroleum products, mineral products and agricultural products. In particular, total exports of manufactured goods, which comprise approximately 87.1% of total exports, declined by 27.2%, primarily due to a sharp decline in electronics exports to $14.6 billion from $21.2 billion in the same period last year. Exports of mineral products recorded a 47.0% decline, due mainly to a decrease in copper prices. Exports of petroleum products and agricultural products decreased by 81.0% and 29.1%, respectively. These declines were partially offset by growth in exports of sugar and related products.
The United States accounted for, on average, 17.6% of total exports from 2004 to 2008. Japan accounted for, on average, 16.9% of Philippine exports from 2004 to 2008. In the first eight months of 2009, the United States was the destination for approximately 17.4% of the Republic’s exports, while Japan accounted for 16.1% of total exports. The Republic aims to diversify its export markets and increase its exports to other countries, particularly ASEAN countries, although the Republic’s exports to all markets have generally declined in the first eight months of 2009 as a result of the global economic downturn. The Republic is a party to the ASEAN Free Trade Agreement, which provides for reduced tariffs among ASEAN nations as well as plans for intra-regional investments, industrial linkages and banking and financial integration.
The Republic’s overall average trade-weighted tariff rates increased from 3.7% in 2004 to 4.5% in 2008. By sector, average trade-weighted tariff rates increased from 9.2% in 2004 to 12.0% in 2008 for agricultural products, remained at 2.8% from 2004 to 2008 for mining products and increased from 3.1% in 2004 to 3.7% in 2008 for manufactures.
Imports of Goods. The import data for 2008 have been recently revised by the NSO. Please see “Balance of Payments—Revisions” for a more detailed discussion of recent and pending revisions to previously reported data for 2008.
50
頁 134 / 247424(b)(3)
2014/03/12file:///C:/blp/data/CFd424b3.htm

Table of ContentsTable of ContentsTable of ContentsTable of Contents
The following tables set out the sources of the Philippines’ imports of goods by commodity group and by country, reflecting import data revisions for 2008.
IMPORTS OF GOODS BY COMMODITY GROUP
Source: National Statistics Office, Bangko Sentral.
2004 2005 2006 2007 2008 2009
Percentage ofTotal Imports
2004 2008
(in millions, except percentages)
Raw materials and intermediate goodsUnprocessed raw materials $ 1,502 $ 1,482 $ 1,636 $ 1,652 $ 1,910 $ 1,539 3.3% 3.2% Semi-processed raw materials 25,887 27,350 30,101 31,278 29,608 14,218 57.5 48.9
Total raw materials and intermediate goods 27,389 28,832 31,737 32,930 31,518 15,757 60.8 52.0Capital goods 8,743 8,928 9,245 9,711 9,309 4,788 19.4 15.4Consumer goods
Durable 1,288 1,410 1,640 2,032 2,393 1,477 2.9 4.0Non-durable 1,739 2,017 2,097 2,636 4,223 2,248 3.9 7.0
Total consumer goods 3,027 3,427 3,737 4,668 6,616 3,725 6.7 10.9Mineral fuels and lubricants 4,714 6,281 8,001 9,593 12,395 4,525 10.5 20.5Other 1,148 1,060 853 738 718 352 2.5 1.2
Total $45,021 $48,528 $53,573 $57,640 $60,556 $29,147 100% 100%
Conceptual and CoverageAdjustments (543) (492) (315) 263 582 142
Total (BPM5) $44,478 $48,036 $53,258 $57,903 $61,138 $29,289
(1) Total import figures for 2008 were revised in September 2009. Please see “Balance of Payments—Revisions” for a more detailed discussion of recent and pending revisions to previously reported data.
(2) Preliminary data as of October 27, 2009 for the first eight months of 2009.
(3) Includes wheat, corn, unmilled cereals excluding rice and corn, inedible crude materials and unmanufactured tobacco.
(4) Includes chemicals and chemical compounds, manufactured goods that are not capital or consumer goods, materials for the manufacture of electrical and electronic equipment and parts, and embroideries.
(5) Includes valuation adjustments to NSO data.
51
(6) Conceptual adjustments reflect the exclusion of returned goods and temporary imports, in accordance with the IMF’s BPM5, while coverage adjustments reflect the inclusion of imports of goods that are not captured in the data sourced from the NSO’s foreign trade statistics.
(1) (2)
(3)
(4)
(5)
(6)
頁 135 / 247424(b)(3)
2014/03/12file:///C:/blp/data/CFd424b3.htm

Table of ContentsTable of ContentsTable of ContentsTable of Contents
IMPORTS OF GOODS BY SOURCE
Source: Foreign Trade Statistics, National Statistics Office, Economic Indices and Indicators Division, Industry and Trade Statistics Department, Republic of the Philippines.
Percentage of
Total Imports
Country 2004 2005 2006 2007 2008 2009 2004 2008
(in millions, except percentages)
Japan $ 7,674 $ 8,071 $ 7,270 $ 6,842 $ 6,604 $ 3,401 17.4% 11.6% United States 8,270 9,096 8,437 7,835 7,221 3,493 18.8 12.7Southeast Asia 4,932 5,145 5,839 6,656 8,432 4,930 11.2 14.9Hong Kong 1,739 1,929 2,095 2,219 1,958 937 3.9 3.5Saudi Arabia 1,274 2,182 2,935 3,526 5,032 897 2.9 8.9Taiwan 3,214 3,549 4,145 4,062 3,835 1,976 7.3 6.8Republic of Korea 2,740 2,294 3,200 3,278 2,962 1,788 6.2 5.2Australia 579 531 618 717 902 491 1.3 1.6Federal Republic of Germany 1,196 1,131 1,368 1,244 1,064 606 2.7 1.9China, People’s Republic of 2,659 2,973 3,647 4,001 4,246 2,534 6.0 7.5Others 9,759 10,517 12,220 15,134 14,490 6,954 22.2 25.5
Total $44,039 $47,418 $51,774 $55,514 $56,746 $28,007 100.0% 100.0%
(1) Total import figures for 2008 were revised in September 2009. Please see “Balance of Payments—Revisions” for a more detailed discussion of recent and pending revisions to previously reported data.
(2) Preliminary data as of October 27, 2009 for the first eight months of 2009.
In 2006, imports of goods expanded by 10.4% to $53.6 billion, from a level of $48.5 billion in 2005. The increase in imports was attributable to higher purchases in raw materials and intermediate goods, which increased by 10.1% to $31.7 billion in 2006 from a level of $28.8 billion in 2005. Increases were also recorded in imports of (i) mineral fuels and lubricants, which increased by 27.4% to $8.0 billion in 2006 from $6.3 billion in 2005; and (ii) consumer goods, which increased by 8.8% to $3.7 billion from $3.4 billion. Imports of capital goods grew by 3.4% in 2006.
In 2007, imports of goods expanded by 7.5% to $57.6 billion, from a level of $53.6 billion in 2006. The increase in imports was attributable to higher purchases across almost all major commodity groups, particularly raw materials and intermediate goods, which increased by 3.8% to $32.9 billion in 2007 from a level of $31.7 billion in 2006. Notable increases of over 20.0% were also recorded in imports of (i) mineral fuels and lubricants, which grew by 20.0% to $9.6 billion in 2007 from $8.0 billion in 2006; as well as (ii) consumer goods, which grew by 27.0% to $4.7 billion from $3.7 billion. Imports of capital goods grew by 5.4% in 2007.
In 2008, imports of goods expanded by 5.2% to $60.6 billion, from $57.6 billion in 2007. The increase in imports was attributable primarily to higher purchases of mineral fuels and lubricants, which grew by 29.2% to $12.4 billion in 2008 from $9.6 billion in 2007 due primarily to an increase in global oil prices from late 2007 until mid 2008, and a corresponding increase in petroleum imports. Imports of consumer goods increased by 40.4% to $6.6 billion in 2008 from $4.7 billion in 2007, primarily due to significant increases in rice imports and the increasing price of rice. Rice imports increased following the Government’s and private sector’s attempts to buffer an anticipated deficiency in domestic rice stocks. Imports of raw materials and intermediate goods decreased by 4.3% to $31.5 billion in 2008 from $32.9 billion in 2007. The decrease was primarily due to a decrease in demand for imports of semi-processed raw materials, particularly materials used for the manufacture of electrical equipment. Capital goods imports also decreased by 4.1% from $9.7 billion in 2007 to $9.3 billion in 2008.
52
(3) Includes only Malaysia, Indonesia, Thailand, Brunei, Vietnam, Myanmar and Laos.
(1) (2)
(3)
頁 136 / 247424(b)(3)
2014/03/12file:///C:/blp/data/CFd424b3.htm

Table of ContentsTable of ContentsTable of ContentsTable of Contents
Preliminary data indicates that in the first eight months of 2009, total imports of goods decreased by 32.4% to $29.1 billion, from $43.1 billion in the same period of 2008. The decrease in imports was consistent with the slowdown in the domestic and global economies. Imports of mineral fuels and lubricants declined by 51.6% to $4.5 billion in the first eight months of 2009 from $9.3 billion in the same period in 2008. This amount included a decline of 68.2% in crude petroleum imports, and was also due to both a decrease in oil import prices caused by drops in global oil prices, as well as a decrease in oil import volume, largely attributable to the shutdown of various refinery plants in early 2009. Imports of raw materials and intermediate goods decreased by 28.8% to $15.8 billion in the first eight months of 2009, from $22.2 billion in the same period of 2008, driven primarily by a decrease in imports of raw materials needed for the manufacture of electronic goods. Capital goods imports decreased 25.0% to $4.8 billion in the first six months of 2009 from $6.4 billion in the same period of 2008.
Services Trade. The following table sets out the Republic’s services trade by sector compiled in accordance with the BPM5 framework for the periods indicated. Please note that, as indicated above, Bangko Sentral has recently revised the service trade statistics for the year 2008 and that the data included in this table differs from previously reported data.
SERVICES TRADE
53
2004 2005 2006 2007 2008 2009
(in millions)
Total services trade $(1,777) $(1,340) $ 137 $ 2,249 $ 1,416 $ 596
Exports 4,043 4,525 6,444 9,766 10,195 4,566Imports 5,820 5,865 6,307 7,517 8,779 3,970
Transportation (2,094) (2,163) (2,301) (2,521) (2,907) (1,046)
Exports 1,001 962 1,151 1,323 1,368 544Imports 3,095 3,125 3,452 3,844 4,275 1,590of which: Passenger 122 222 192 195 37 77
Exports 373 490 518 587 602 286Imports 251 268 326 392 565 209
of which: Freight (2,178) (2,338) (2,492) (2,712) (2,944) (1,063) Exports 499 353 474 503 483 167Imports 2,677 2,691 2,966 3,215 3,427 1,230
of which: Other (38) (47) (1) (4) 0 (60) Exports 129 119 159 233 283 91Imports 167 166 160 237 283 151
Travel 742 986 2,269 3,270 2,175 193
Exports 2,017 2,265 3,501 4,933 4,388 1,377Imports 1,275 1,279 1,232 1,663 2,213 1,184
Communication services 359 407 477 418 257 108
Exports 487 522 575 517 404 162Imports 128 115 98 99 147 54
Construction services 23 59 54 92 57 19
Exports 71 66 69 113 90 37Imports 48 7 15 21 33 18
Insurance services (187) (186) (209) (229) (243) (86)
Exports 12 17 21 22 19 7Imports 199 203 230 251 262 93
(1) (2)
頁 137 / 247424(b)(3)
2014/03/12file:///C:/blp/data/CFd424b3.htm

Table of ContentsTable of ContentsTable of ContentsTable of Contents
Source: Bangko Sentral.
2004 2005 2006 2007 2008 2009
(in millions)
Financial services (34) (40) (24) (123) (23) (39)
Exports 43 53 101 87 59 38Imports 77 93 125 210 82 77
Computer and information services (16) 27 28 243 320 199
Exports 33 89 95 305 400 252Imports 49 62 67 62 80 53
Royalties and license fees (262) (259) (343) (380) (382) (213)
Exports 11 6 6 5 0 1Imports 273 265 349 385 382 214
Other business services (249) (114) 263 1,605 2,376 1,566
Exports 361 525 898 2,439 3,446 2,129Imports 610 639 635 834 1,070 563
Merchanting and other trade-related services 17 14 24 18 29 19Exports 17 14 24 18 29 19Imports 0 0 0 0 0 0
Operational leasing services (53) (48) (61) (86) (121) (69) Exports 4 5 9 10 13 6Imports 57 53 70 96 134 75
Misc. business, professional and technical services (213) (80) 300 1,673 2,468 1,616Exports 340 506 865 2,411 3,404 2,104Imports 553 586 565 738 936 488
Personal, cultural and recreational services (8) 11 19 0 (5) 5Exports 7 20 27 22 21 19Imports 15 9 8 22 26 14
Audio-visual and related services (4) 14 19 2 (9) 6Exports 7 19 24 15 8 14Imports 11 5 5 13 17 8
Other personal, cultural and recreational services (4) (3) 0 (2) 4 (1) Exports 0 1 3 7 13 5Imports 4 4 3 9 9 6
Government services (51) (68) (96) (126) (209) (110)
Exports 0 0 0 0 0 0Imports 51 68 96 126 209 110
(1) Revised to reflect: late reports, post audit adjustments and final data from companies. Please see “Balance of Payments—Revisions” for a more detailed discussion of recent and pending revisions to previously reported data.
In 2006, the trade-in-services account recorded a surplus of $137 million, a reversal from the deficit of $1.3 billion in 2005. The surplus was mainly attributable to higher net inflows from tourism services as more foreigners visited the Philippines and a continued increase in BPO services as the Philippines continues to attract BPO employers primarily due to an abundant English-speaking labor supply and tax incentives for information technology based businesses.
The trade-in-services account recorded a surplus of $2.2 billion in 2007, which was higher than the surplus of $137 million in 2006. The higher surplus was attributed mainly to increases in inflow recorded in travel,
54
(2) Preliminary data as of September 24, 2009 for the first six months of 2009.
(1) (2)
頁 138 / 247424(b)(3)
2014/03/12file:///C:/blp/data/CFd424b3.htm

Table of ContentsTable of ContentsTable of ContentsTable of Contents
construction and other business services, particularly miscellaneous business, professional and technical services. Net receipts from travel increased by 44.1% to $3.3 billion in 2007, and receipts from other business services expanded considerably to $1.6 billion.
In 2008, the Republic recorded a surplus of $1.4 billion in the trade-in-services account, a 37.0% decrease from the $2.2 billion surplus in 2007. This lower surplus was mainly attributable to higher outflows in transportation, insurance, travel and communication services, which offset growth in computer and information services and other business services.
Preliminary data indicates that in the first six months of 2009, the Republic recorded a surplus of $596 million in the trade-in-services account, a 27.1% decrease from the $818 million surplus recorded in the same period in 2008. The lower surplus was mainly attributable to lower inflows in travel services, financial services and communications services. The lower inflows in these areas more than offset growth in transportation, computer and information and other business services, including growth in BPO-related services.
Income. The following table sets out the Republic’s income compiled in accordance with the IMF’s BPM5 framework for the periods indicated. Entries with “zero” balances indicate either that there were no relevant transactions during the period or that the Republic had not yet begun to track and record the relevant entry. Under the BPM5, the residency of seasonal workers, such as OFWs, is classified according to the length of their intended stay in the host country. Generally, OFWs who are expected to be working abroad for less than one year are classified as Philippine residents and their gross earnings are reflected under the Income Account. On the other hand, OFWs who are expected to be working abroad for one year or more are classified as non-residents and their remittances are reflected under the Current Transfers Account. Please note that, as indicated above, Bangko Sentral has recently revised the Republic’s income numbers for 2008 and therefore the data included in this table is different from previously reported data.
INCOME
55
2004 2005 2006 2007 2008 2009
(in millions)
Total income $ (71) $ (294) $(1,255) $ (892) $ 140 $ 6
Receipts 3,725 3,937 4,388 5,351 5,973 2,797Disbursements 3,796 4,231 5,643 6,243 5,833 2,791
Compensation of employees 2,851 2,893 2,758 3,030 4,092 2,207
Investment income (2,922) (3,187) (4,013) (3,922) (3,952) (2,201)
Receipts 874 1,044 1,630 2,321 1,881 590Disbursements 3,796 4,231 5,643 6,243 5,833 2,791Direct investment income (1,346) (1,372) (1,962) (2,085) (1,636) (851)
Receipts 27 19 53 48 32 27Disbursements 1,373 1,391 2,015 2,133 1,668 878
Income on equity (1,295) (1,281) (1,875) (1,914) (1,536) (821) Receipts 18 17 53 44 28 26Disbursements 1,313 1,298 1,928 1,958 1,564 847
Dividends and distributed branch profits (1,154) (1,141) (1,390) (1,294) (1,630) (733) Receipts 18 17 53 44 28 26Disbursements 1,172 1,158 1,443 1,338 1,658 759
Reinvested earnings and undistributed branch profits (141) (140) 485 (620) 94 (88) Receipts 0 0 0 0 0 0Disbursements 141 140 (485) 620 (94) 88
(1) (2)
頁 139 / 247424(b)(3)
2014/03/12file:///C:/blp/data/CFd424b3.htm

Table of ContentsTable of ContentsTable of ContentsTable of Contents
56
2004 2005 2006 2007 2008 2009
(in millions)
Income on debt (interest) (51) (91) (87) (171) (100) (30) Receipts 9 2 0 4 4 1Disbursements 60 93 87 175 104 31
Portfolio investment income (685) (924) (1,053) (966) (1,311) (839) Receipts 596 625 802 1,359 1,259 469Disbursements 1,281 1,549 1,855 2,325 2,570 1,308
Income on equity (dividends) (70) (163) (391) (665) (952) (509) Receipts 0 1 2 7 9 0Disbursements 70 164 393 672 961 509
Monetary authorities 0 0 0 0 0 0Receipts 0 0 0 0 0 0Disbursements 0 0 0 0 0 0
General government 0 0 0 0 0 0Receipts 0 0 0 0 0 0Disbursements 0 0 0 0 0 0
Banks 0 (5) (14) (30) (109) (7) Receipts 0 0 0 0 0 0Disbursements 0 5 14 30 109 7
Other sectors (70) (158) (377) (635) (843) (502) Receipts 0 1 2 7 9 0Disbursements 70 159 379 642 852 502
Income on debt (interest) (615) (761) (662) (301) (359) (330) Receipts 596 624 800 1,352 1,250 469Disbursements 1,211 1,385 1,462 1,653 1,609 799
Bonds and notes (723) (810) (722) (314) (360) (331) Receipts 487 575 740 1,338 1,249 468Disbursements 1,210 1,385 1,462 1,652 1,609 799
Monetary authorities 217 363 562 681 923 390Receipts 360 477 576 701 954 400Disbursements 143 114 14 20 31 10
General government (688) (870) (1,071) (1,128) (1,139) (587) Receipts 0 0 0 0 0 0Disbursements 688 870 1,071 1,128 1,139 587
Banks 0 0 0 (75) (59) (10) Receipts 0 0 0 0 0 0Disbursements 0 0 0 75 59 10
Other sectors (252) (303) (213) 208 (85) (124) Receipts 127 98 164 637 295 68Disbursements 379 401 377 429 380 192
Money market instruments 108 49 60 13 1 1Receipts 109 49 60 14 1 1Disbursements 1 0 0 1 0 0
Monetary authorities 0 0 0 0 0 0Receipts 0 0 0 0 0 0Disbursements 0 0 0 0 0 0
General government 0 0 0 0 0 0Receipts 0 0 0 0 0 0Disbursements 0 0 0 0 0 0
Banks 0 0 0 0 0 0Receipts 0 0 0 0 0 0Disbursements 0 0 0 0 0 0
(1) (2)
頁 140 / 247424(b)(3)
2014/03/12file:///C:/blp/data/CFd424b3.htm

Table of ContentsTable of ContentsTable of ContentsTable of Contents
Source: Bangko Sentral.
2004 2005 2006 2007 2008 2009
(in millions)
Other sectors 108 49 60 13 1 1Receipts 109 49 60 14 1 1Disbursements 1 0 0 1 0 0
Other investment income (891) (891) (998) (871) (1,005) (511) Receipts 251 400 775 914 590 94Disbursements 1,142 1,291 1,773 1,785 1,595 605
Monetary authorities 11 93 275 402 200 17Receipts 89 167 348 411 206 25Disbursements 78 74 73 9 6 8
General government (358) (465) (424) (468) (463) (225) Receipts 0 0 0 0 0 0Disbursements 358 465 424 468 463 225
Banks (79) (152) (425) (252) (125) (34) Receipts 104 145 310 409 339 45Disbursements 183 297 735 661 464 79
Other sectors (465) (367) (424) (553) (617) (269) Receipts 58 88 117 94 45 24Disbursements 523 455 541 647 662 293
(1) Revised to reflect: late reports, post audit adjustment and final data from companies. Please see “Balance of Payments—Revisions” for a more detailed discussion of recent and pending revisions to previously reported data.
In 2006, the Republic’s income account registered a deficit of $1.3 billion, which was an increase from the deficit of $294 million in 2005, primarily due to higher net outlays for dividends and profits, as well as reinvested earnings of direct investors. An increase in interest payments on Government-issued debt securities also contributed to the deficit.
The income account deficit narrowed to $892 million in 2007, a 28.9% reduction from the $1.3 billion deficit recorded in 2006. The decrease in the deficit was mainly attributable to higher gross earnings of resident OFWs, as well as a lower deficit in investment income due mainly to higher income receipts by the monetary authorities on holdings of foreign debt securities, deposit placements abroad and corporations’ holdings of debt securities.
In 2008, the income account recorded a surplus of $140 million, a reversal from the deficit of $892 million in 2007. The main contributor to the surplus was gross earnings of resident OFWs of $4.1 billion, which was an increase of approximately 35.0% over the prior year. The surplus was offset, however, by decreased income from debt securities held by corporations.
Preliminary data indicates that in the first six months of 2009, the income account recorded a surplus of $6 million, 97.4% lower than the surplus of $229 million recorded in the same period in 2008. The lower surplus was mainly attributable to higher net outflows in investment income as a result of increased outlays on reinvested earnings and undistributed branch profits, as well as lower income receipts of resident corporations on their holdings of foreign debt securities and deposits abroad. These declines offset the 3.6% improvement in gross earnings of OFWs, which rose to $2.2 billion.
57
(2) Preliminary data as of September 24, 2009 for the first six months of 2009.
(1) (2)
頁 141 / 247424(b)(3)
2014/03/12file:///C:/blp/data/CFd424b3.htm

Table of ContentsTable of ContentsTable of ContentsTable of Contents
Current Transfers. The following table sets out the Republic’s income compiled in accordance with the IMF’s BPM5 framework for the periods indicated. Current transfers primarily include OFW remittances, as well as private and institutional gifts, donations and grants. As described above under “—Income,” under the BPM5, the residency of seasonal workers such as OFWs is classified according to the intended length of their stay in the host country.
CURRENT TRANSFERS
Source: Bangko Sentral.
2004 2005 2006 2007 2008 2009
(in millions)
Total Current Transfers $ 9,160 $ 11,391 $ 13,197 $ 14,153 $ 15,226 $ 7,887
Receipts 9,420 11,711 13,511 14,573 15,781 8,151Payments 260 320 314 420 555 264General government 387 437 313 506 292 275
Receipts 460 530 424 625 451 330Payments 73 93 111 119 159 55
Other sectors 8,773 10,954 12,884 13,647 14,934 7,612Receipts 8,960 11,181 13,087 13,948 15,330 7,821Payments 187 227 203 301 396 209Workers’ remittances 8,617 10,668 12,481 13,255 14,537 7,424
Receipts 8,617 10,668 12,481 13,255 14,537 7,424Payments 0 0 0 0 0 0
Other transfers 156 286 403 392 397 188Receipts 343 513 606 693 793 397Payments 187 227 203 301 396 209
(1) Revised to reflect late reports, post audit adjustments and final data from companies. Please see “Balance of Payments—Revisions” for a more detailed discussion of recent and pending revisions to previously reported data.
In 2006, the current transfers account recorded a surplus of $13.2 billion, which was a 15.8% increase from the surplus of $11.4 billion recorded in 2005.
The current transfers account recorded a net surplus of $14.2 billion in 2007, which was a 7.2% increase over the surplus of $13.2 billion in 2006. Remittances from non-resident OFWs were a leading contributor to inflows in the current transfers account.
The current transfers account recorded a surplus of $15.2 billion in 2008, 7.6% higher than the surplus of $14.2 billion in 2007. The higher surplus was due mainly to remittances from non-resident OFWs of $14.5 billion in 2008, representing a 9.7% increase from remittances of $13.3 billion in 2007.
Preliminary data indicates that in the first six months of 2009, the current transfers account recorded a surplus of $7.9 billion, 3.8% higher than the surplus of $7.6 billion for the same period in 2008, due mainly to non-resident OFW remittances of $7.4 billion in the period, representing a 2.7% increase from the level recorded in same period of 2008.
Capital and Financial Account
(2) Preliminary data as of September 24, 2009 for the first six months of 2009.
In 2006, the capital and financial account recorded a surplus of $20 million, significantly less than the $2.2 billion surplus recorded in 2005. This lower surplus was mainly due to higher outflows in the other investment
58
(1) (1) (2)
頁 142 / 247424(b)(3)
2014/03/12file:///C:/blp/data/CFd424b3.htm

Table of ContentsTable of ContentsTable of ContentsTable of Contents
and portfolio investment accounts for the year. The widening of the other investment account deficit from $2.9 billion in 2005 to $5.8 billion in 2006 was partly due to debt prepayment by the public and private sectors, as foreign exchange liquidity and the strength of the peso encouraged foreign and private borrowers to prepay some of their external obligations. The portfolio investment account surplus decreased by 12.4% to $3.0 billion in 2006 from $3.5 billion in 2005 due to higher resident investments abroad, notably domestic banks’ investments in foreign-issued bonds and notes. Prepayments of bonds and notes by the public sector also contributed to the higher deficit.
The capital and financial account recorded a net inflow of $3.5 billion in 2007, from a net inflow of $20 million recorded in 2006. The increase was mainly due to strong macroeconomic fundamentals, which encouraged investments. The overall capital and financial account surplus was partially offset by a net outflow of direct investments of $620 million, mainly due to the repayment of intercompany loans. This net outflow was a reversal from the surplus of $2.8 billion recorded in 2006. The other investment account also supported the net surplus in the capital and financial account, recording a decreased deficit of $212 million in 2007 from a deficit of $5.8 billion in 2006, due to (i) disbursement of program loans to the Government from official creditors such as the World Bank, ADB and the Japan Bank for International Cooperation; (ii) corporate loans; (iii) short-term loan availments by banks; (iv) higher net currency and deposit placements of non-residents; and (v) lower lending by residents abroad.
In 2008, the capital and financial account recorded a net outflow of $1.9 billion, a reversal from a net inflow of $3.5 billion recorded in 2007. The reversal was due mainly to a net outflow of $3.8 billion in portfolio investments, a reversal from a net inflow of $4.6 billion in 2007. The net outflow in portfolio investments was attributable to approximately $2.7 billion in aggregate net bond repayments by the Government, local banks and corporations in 2008. Net withdrawals by non-residents also contributed to the outflow, as investors withdrew funds from the equity securities market due to the global economic downturn. The net outflow in portfolio investments offset the inflow of $817 million in the other investment account in 2008, a reversal from a net outflow of $212 million recorded in 2007. The net outflow of portfolio investments also offset the net inflows in the direct investment account of $1.1 billion in 2008, a reversal from a net outflow of $620 million in 2007.
Preliminary data indicates that in the first six months of 2009, the capital and financial account recorded a net outflow of $1.0 billion, a reversal from a net inflow of $891 million recorded in the same period of 2008. The decline reflected the reversal of other investments to a net outflow, even as direct and portfolio investments managed to post net inflows. Direct investments posted a net inflow of $769 million in the first six months of 2009, compared with a net inflow of $534 million in the same period of 2008. Net outflows of other investments $2.3 billion in the first six months of 2009, a reversal from the net inflow of $936 million recorded in the same period of 2008. Portfolio investments posted a net inflow of $372 million in the first six months of 2009, compared to a net outflow of $582 million in the same period of 2008.
The capital and financial account is divided into four categories: direct investments, portfolio investments, financial derivatives, and other investments.
59
頁 143 / 247424(b)(3)
2014/03/12file:///C:/blp/data/CFd424b3.htm

Table of ContentsTable of ContentsTable of ContentsTable of Contents
The following table sets out the Republic’s direct investments for the periods indicated. Entries with “zero” balances indicate either that there were no relevant transactions during the period or that the Republic had not yet begun to track and record the relevant entry. Please note that, as indicated above, Bangko Sentral has revised the Republic’s direct investment numbers for 2008 and therefore the data included in this table is different from previously reported data.
DIRECT INVESTMENTS
Source: Bangko Sentral.
2004 2005 2006 2007 2008 2009
(in millions)
Total direct investments $ 109 $1,665 $2,818 $ (620) $1,144 $ 769
Assets: Residents’ investments abroad 579 189 103 3,536 259 123
Equity capital 579 189 103 3,536 259 123Claims on affiliated enterprises 579 189 103 3,536 274 132Liabilities to affiliated enterprises 0 0 0 0 15 9
Reinvested earnings 0 0 0 0 0 0Other capital 0 0 0 0 0 0
Liabilities: Non-residents’ investments in the Philippines 688 1,854 2,921 2,916 1,403 892
Equity capital 750 1,181 1,324 1,949 1,236 996Liabilities to direct investors 750 1,181 1,324 1,949 1,236 996
Reinvested earnings 141 140 485 620 (94) 88Other capital (203) 533 1,112 347 261 (192)
Claims on direct investors (96) (190) (214) 329 (108) 556Liabilities to direct investors (299) 343 898 676 153 364
(1) Revised to reflect: late reports, post audit adjustments and final data from companies. Please see “Balance of Payments—Revisions” for a more detailed discussion of recent and pending revisions to previously reported data.
60
(2) Preliminary data as of September 24, 2009 for the first six months of 2009.
(1) (2)
頁 144 / 247424(b)(3)
2014/03/12file:///C:/blp/data/CFd424b3.htm

Table of ContentsTable of ContentsTable of ContentsTable of Contents
The following table sets out the Republic’s portfolio investments for the periods indicated. Entries with “zero” balances indicate either that there were no relevant transactions during the period or that the Republic had not yet begun to track and record the relevant entry. Please note that, as indicated above, Bangko Sentral has revised the Republic’s portfolio investment numbers for 2008 and therefore the data included in this table is different from previously reported data.
PORTFOLIO INVESTMENTS
Source: Bangko Sentral.
2004 2005 2006 2007 2008 2009
(in millions)
Total direct investments $(1,713) $3,475 $3,043 $4,623 $(3,799) $ 372
Assets: Residents’ investments abroad 910 146 1,567 (834) (619) (68)
Equity securities 18 5 (1) 79 (75) 6Debt securities 892 141 1,568 (913) (544) (74)
Bonds and notes 183 428 1,272 (87) 10 (365) Banks 155 (353) 1,224 430 (455) (184) Other sectors (28) 781 48 (517) 465 (181)
Liabilities: Non-residents’ investments in the Philippines (803) 3,621 4,610 3,789 (4,418) 304
Equity securities 518 1,465 2,525 3,178 (1,289) (986) Debt securities (1,321) 2,156 2,085 611 (3,129) 1,290
Monetary authorities (542) (723) (41) 91 (34) (19) General Government (506) 2,712 1,272 385 (1,068) 1,109Banks 125 225 122 (89) (183) 185Other sectors (398) (69) 702 242 (1,843) (32)
(1) Revised to reflect: late reports, post audit adjustments and final data from companies. Please see “Balance of Payments—Revisions” for a more detailed discussion of recent and pending revisions to previously reported data.
The following table sets out the Republic’s financial derivative investments for the periods indicated. Entries with “zero” balances indicate either that there were no relevant transactions during the period or that the Republic had not yet begun to track and record the relevant entry.
FINANCIAL DERIVATIVES
Source: Bangko Sentral.
(2) Preliminary data as of September 24, 2009 for the first six months of 2009.
2004 2005 2006 2007 2008 2009
(in millions)
Total financial derivatives $(27) $ (43) $(138) $(288) $(113) $ 53
Assets (58) (98) (159) (170) (541) (212)
Monetary authorities 0 0 0 0 0 0General Government 0 0 0 0 0 0Banks (58) (98) (159) (170) (439) (128) Other sectors 0 0 0 0 (102) (84)
Liabilities (85) (141) (297) (458) (654) (159)
Monetary authorities 0 0 0 0 0 0General Government 0 0 0 0 0 0Banks (85) (141) (297) (458) (353) (73) Other sectors 0 0 0 0 (301) (86)
61
(1) Preliminary data as of September 24, 2009 for the first six months of 2009.
(1) (2)
(1)
頁 145 / 247424(b)(3)
2014/03/12file:///C:/blp/data/CFd424b3.htm

Table of ContentsTable of ContentsTable of ContentsTable of Contents
The following table sets out the Republic’s other investments compiled in accordance with the BPM5 framework for the periods indicated. Entries with “zero” balances indicate either that there were no relevant transactions during the period or that the Republic had not yet begun to track and record the relevant entry. Please note that, as indicated above, Bangko Sentral has recently revised the Republic’s other investment numbers for the year 2008 and therefore the data included in this table is different from previously reported data.
OTHER INVESTMENTS
Source: Bangko Sentral.
2004 2005 2006 2007 2008 2009
(in millions)
Total other investments $ (16) $(2,908) $(5,841) $ (212) $ 817 $(2,259)
Assets: Residents’ investments abroad 859 4.791 3,512 4,840 (4,395) 113
Trade credits 3 17 3 29 10 4Loans (156) 1,857 3,129 1,259 (3,248) 243
Banks (351) 1,407 1,937 501 (1,429) 800Other sectors 195 450 1,192 758 (1,819) (557)
Currency and deposits 937 3,321 2,257 3,768 3,547 (169) Banks 818 2,750 1,329 1,958 3,698 (199) Other sectors 119 571 928 1,810 (151) 30
Other assets 75 (404) (1,877) (216) (4,704) 35Banks 76 (416) (1,875) (215) (4,700) 41Other sectors (1) 12 (2) (1) (4) (6)
Liabilities: Non-residents’ investments in the Philippines 843 1,883 (2,329) 4,628 (3,578) (2,146)
Trade credits 380 (59) 239 632 (593) 835Loans (480) 1,581 (2,304) 3,293 (3,415) (1,692)
Monetary authorities (4) 60 (563) (194) 0 0Drawings 229 106 0 0 0 0Repayments 233 46 563 194 0 0
General Government (362) (500) 176 438 2 157Drawings 913 900 1,526 1,610 1,197 770Repayments 1,275 1,400 1,350 1,172 1,195 613
Banks 276 1,099 (1,182) 415 (882) (1,049) Long-term 50 0 228 25 (1,395) (605)
Drawings 50 0 228 150 799 70Repayments 0 0 0 125 1,630 675
Short-term 226 1,099 (1,410) 390 513 (444) Other sectors (390) 922 (735) 2,634 (2,535) (800)
Long-term (287) (102) (1,628) 2,851 (810) (682) Drawings 1,560 2,023 1,200 5,514 1,900 620Repayments 1,847 2,125 2,828 2,663 2,710 1,302
Short-term (103) 1,024 893 (217) (1,725) (118) Currency and deposits 868 147 (339) 552 (158) (666)
Banks 883 (192) (126) 537 (376) (217) Other sectors (15) 339 (213) 15 218 (449)
Other liabilities 75 214 75 151 588 (623) Banks 74 198 79 124 600 (608) Other sectors 1 16 (4) 27 (12) (15)
62
(1) Revised to reflect: late reports, post audit adjustments and final data from companies. Please see “Balance of Payments—Revisions” for a more detailed discussion of recent and pending revisions to previously reported data.
(1) (2)
(3)
(4)
(4)
(4)
(4)
(5)
頁 146 / 247424(b)(3)
2014/03/12file:///C:/blp/data/CFd424b3.htm

Table of ContentsTable of ContentsTable of ContentsTable of Contents
(2) Preliminary data as of September 24, 2009 for the first six months of 2009.
(3) All trade credits are short-term credits in non-governmental sectors.
(4) Long-term loans.
Domestic macroeconomic policies and structural reforms have significantly affected the flow of foreign investment into the Philippines. The Foreign Investment Act of 1991, as amended, introduced a more favorable investment environment to the Philippines. The act permits foreigners to own 100% of Philippine enterprises, except in certain specified areas included in a “negative list” with respect to which the Constitution or applicable statute limits foreign ownership, generally to a maximum of 40% of the enterprise’s equity capital. The Constitution also prohibits foreign ownership in certain sectors, such as the media.
The Republic’s Board of Investments coordinates with national agencies and local governments on investment policies and procedures and establishes and administers annual investment priority plans to promote certain sectors of the economy by providing special investment incentives to specific industries. The Government’s 2008 Investment Priorities Plan seeks to sustain globally competitive industries and to support the growth of small and medium-sized enterprises, primarily as a means to generate jobs, provide food, deliver basic services and encourage rural development.
In March 2000, the Retail Trade Liberalization Act was enacted. The law aims to promote efficiency and competition among domestic industries and foreign competitors and better service and lower prices for consumers. Prior to its enactment, only citizens of the Philippines and corporations wholly owned by Filipino citizens could own a retail business in the Philippines. Under the law, a foreigner is allowed to own 100% of a retail business in the Philippines provided it makes an investment of at least $7.5 million in the Philippines. If a foreigner makes an investment of between $2.5 million to $7.5 million, the foreigner is allowed to own up to 60% of the retail business in the Philippines for the first two years.
63
(5) All short-term liabilities.
頁 147 / 247424(b)(3)
2014/03/12file:///C:/blp/data/CFd424b3.htm

Table of ContentsTable of ContentsTable of ContentsTable of Contents
The following tables set out foreign investment in the Philippines registered with Bangko Sentral by sector. Beginning in 2004, the Bangko Sentral shifted to the use of the 1994 Philippine Standard Industrial Classification (“PSIC”) instead of the 1977 PSIC.
NET FOREIGN DIRECT INVESTMENTS BY SECTOR
Source: Department of Economic Statistics, Bangko Sentral.
Sector 2004 2005 2006 2007 2008 2009
(in millions)
Total equity $ 750.0 $1,181.0 $1,324.0 $1,949.0 $1,236.0 $1,319.0Agriculture, Hunting and Forestry 0.0 0.2 0.1 3.7 0.7 0.1Fishing 0.0 0.0 0.0 0.0 0.0 0.0Mining and Quarrying 0.2 0.4 32.4 154.6 154.9 1.9Manufacturing 83.6 531.6 408.7 548.6 309.3 874.0Electricity, Gas and Water 8.6 (6.3) 200.4 699.2 221.9 (4.0) Construction (15.3) (2.9) 8.7 50.4 157.3 104.0Trade/Commerce 18.6 3.6 8.3 4.6 22.2 5.4Hotels and Restaurants 0.0 0.0 0.0 2.6 20.7 0.5Transport, Storage and Communications 1.6 (32.4) (8.5) 12.8 (26.2) 6.4Financial Intermediation (including Insurance) 6.8 199.5 (20.1) (22.6) 32.3 256.3Real Estate 54.8 111.9 120.5 137.7 164.0 61.5Services 89.9 17.1 (119.5) 42.3 (19.3) 11.5Others, not elsewhere classified 500.9 358.3 692.9 315.2 198.3 1.5
Reinvested earnings 141.0 140.0 485.0 620.0 (94.0) 114.0Inter-company Loans (203.0) 533.0 1,112.0 347.0 261.0 (164.0)
TOTAL $ 688.0 $1,854.0 $2,921.0 $2,916.0 $1,403.0 $1,269.0
(1) Balance of payments net foreign direct investment flows refer to non-resident placements less non-resident withdrawals, reinvested earnings and net inter-company loans.
(2) Revised to reflect (a) late reports; (b) post-audit adjustments; and (c) final data from companies.
In 2005, net inflows of foreign direct investments were $1.9 billion, representing a 169.5% increase from the $688 million recorded in 2004. The increase was largely due to investor confidence brought about by the Republic’s generally improved macroeconomic position, as well as positive economic projections for 2006. Gross equity capital placements recorded an inflow of $1.2 billion in 2005, an increase of approximately 57.5% from the $750 million recorded in 2004. These investments were primarily channeled into the manufacturing and real estate sectors.
In 2006, net inflows of foreign direct investments were $2.9 billion, an increase of 57.6% from the $1.9 billion recorded in 2005. The increase was largely due to the significant macroeconomic improvements in the Republic in 2006, particularly a strong external payments position, fiscal position and declining inflation. Gross equity capital placements recorded an inflow of $1.3 billion in 2006, an increase of 8.3% from the $1.2 billion recorded in 2005. These investments were primarily channeled into the manufacturing, services, construction and financial intermediation sectors. The reinvested earnings account also increased to an inflow of $485 million in 2006, reflecting an increase of 246.4% from the $140 million recorded in 2005.
In 2007, net inflows of foreign direct investments were $2.9 billion, a decrease of $5 million from the level recorded in 2006 due to the repayment of intercompany loans during the year. Gross equity capital placements
64
(3) Preliminary data as of September 30, 2009.
(1)
(2) (3)
頁 148 / 247424(b)(3)
2014/03/12file:///C:/blp/data/CFd424b3.htm

Table of ContentsTable of ContentsTable of ContentsTable of Contents
recorded an inflow of $2.0 billion in 2007, an increase of 53.8% from the level recorded in 2006. These investments were primarily channeled into the manufacturing, services, construction and real estate sectors. The reinvested earnings account also increased to $620 million in 2007, an increase of 16.9% from the $485.0 million recorded in 2006, as foreign direct investors continued to reinvest their earnings into local enterprises and corporations.
In 2008, net inflows of foreign direct investments totaled $1.4 billion, 51.9% lower than the $2.9 billion recorded in 2007. The lower inflows were mainly due to global financial uncertainties and decreasing investor confidence. In particular, direct investments in the manufacturing, mining and quarrying sectors as well as the electricity, gas and water sector all declined by more than 80.0% in 2008 compared to their respective levels in 2007. The Republic had a net inflow of $1.2 billion in equity capital investments in 2008. These investments were distributed mainly among the manufacturing, services, mining and construction sectors. The reinvested earnings account recorded an outflow of $91 million in 2008, compared to an inflow of $620.0 million in 2007.
Preliminary data indicates that in the first nine months of 2009, net inflows of foreign direct investments were $1.3 billion, an increase of 6.8% from the level recorded in the first nine months of 2008 due to sustained equity capital inflows and higher reinvested earnings during the period. Gross equity capital placements recorded an inflow of $1.3 billion in the first nine months of 2009, an increase of 20.6% from the level recorded in the first nine months of 2008. These investments were primarily channeled into the manufacturing, construction, real estate and services sectors. The reinvested earnings account also recorded an inflow of $114 million in the first nine months of 2009, a reversal from the outflow of $75 million in the first nine months of 2008.
International Reserves
The following table sets out the gross international reserves of Bangko Sentral, compiled in a manner consistent with the revised balance of payments framework and the treatment of IMF accounts in the monetary survey published in the IMF’s International Financial Statistics.
GROSS INTERNATIONAL RESERVES OF BANGKO SENTRAL
Source: International Department and Treasury Department, Bangko Sentral.
As of December 31,
2004 2005 2006 2007 2008 2009
(in millions, except months and percentages)
Gold $ 3,112 $ 2,568 $ 2,941 $ 3,541 $ 4,358 $ 5,634SDRs 1 1 2.3 0.7 11 1,158Foreign investments 12,742 15,397 19,612 29,715 32,066 36,371Foreign exchange 237 403 280 356 981 427Reserve position in the IMF 135 125 132 138 135 141
Total $ 16,228 $ 18,494 $ 22,967 $ 33,751 $ 37,551 $ 43,731
Total as number of months of imports of goods and services 3.6 3.8 4.2 5.7 6.0 8.1Total as a % of short-term debt
Original maturity 321.6 289.2 458.5 476.4 536.4 920.1Residual maturity 156.9 131.6 250.1 256.3 324.2 415.1
(1) Preliminary data as of November 30, 2009.
65
(2) Beginning in January 2000, a new system was adopted, revising the treatment of monetary gold under swap arrangements, including it as part of gross international reserves. Under the new accounting system, a gold swap transaction is treated as a loan transaction collateralized by gold that remains a part of the international reserves. In addition, the accrued interest payable on Bangko Sentral’s short-term liabilities is netted out of the gross international reserves when calculating net international reserves, reducing the level of net international reserves.
(1)
(2)
(3)
( (4)
(5)
頁 149 / 247424(b)(3)
2014/03/12file:///C:/blp/data/CFd424b3.htm

Table of ContentsTable of ContentsTable of ContentsTable of Contents
(3) Consists of time deposits, investments in securities issued or guaranteed by government or international organizations and repurchase agreements.
(4) The reserve position in the IMF is an off-balance sheet item and is recorded by Bangko Sentral’s Treasury Department as a contingent asset with a matching contingent liability.
The gross international reserves controlled by Bangko Sentral constitute substantially all of the Philippines’ official international reserves. Bangko Sentral occasionally enters into options with respect to gold, foreign exchange and foreign securities for purposes of managing yield or market risk. It also enters into financial swap contracts to optimize yield on its gold reserves.
As of the December 31, 2006, gross international reserves were $23.0 billion, an increase from the $18.5 billion in 2005. Gross international reserves were sufficient to cover 4.2 months of imports goods and payment of services and income. In terms of short-term debt coverage, the reserve level was 4.6 times the amount of the Republic’s short-term external liabilities based on original maturity and 2.5 times based on residual maturity, the latter referring to outstanding short-term debt based on original maturity plus principal payments on medium- and long-term loans of the public and private sectors due within 12 months. Net international reserves at the end of 2006 were $23.0 billion, an increase from the $17.7 billion amount for 2005.
As of December 31, 2007, gross international reserves were $33.8 billion, an increase from the $23.0 billion at the end of 2006. Gross international reserves at the end of 2007 were sufficient to cover 5.7 months worth of imports goods and payment of services and income. In terms of short-term debt coverage, the reserve level was 4.8 times the amount of the Republic’s short-term external liabilities based on original maturity and 2.7 times based on residual maturity. Net international reserves at the end of 2007 were $33.7 billion, an increase from the $23.0 billion amount at the end of 2006. Approximately 88.0% of reserves were held in the form of foreign investments, with the balance held in gold, foreign exchange and reserves to cover outstanding short-term and long-term debt due in the next 12 months.
As of December 31, 2008, gross international reserves were $37.6 billion, an increase from the $33.8 billion at the end of 2007. Gross international reserves at the end of 2008 were sufficient to cover 6.0 months worth of import goods and payment of services and income. In terms of short-term debt coverage, the reserve level was 5.4 times the amount of the Republic’s short-term external liabilities based on original maturity and 3.2 times based on residual maturity. Net international reserves at the end of 2008 were $36.0 billion, an increase from the $33.7 billion amount at the end of 2007.
According to preliminary data, as of November 30, 2009, gross international reserves of the Republic totalled $43.7 billion, $0.5 billion higher than the balance as of October 31, 2009 and $6.1 billion higher than the balance as of December 31, 2008. The increase in the first eleven months of the year was due mainly to valuation gains from the Republic’s gold supply, foreign currency deposits by the Government of its loan proceeds and income from the Republic’s investments abroad. These inflows were partially offset by payments of maturing foreign exchange obligations of the Government and Bangko Sentral. The level of gross international reserves as of November 30, 2009 was sufficient to cover approximately 8.1 months of imports of goods and payments of services and income, as well as being equivalent to 9.2 times the Republic’s short-term debt based on original maturity and 4.2 times based on residual maturity.
As of November 30, 2009, net international reserves of the Republic were $43.7 billion, an increase from the $41.9 billion recorded as of September 30, 2009 and $36.0 billion recorded as of December 31, 2008.
66
(5) Short-term debt based on residual maturity refers to outstanding short-term external debt on original maturity plus principal payments on medium– and long–term loans of the pubic and private sectors due within the next 12 months.
頁 150 / 247424(b)(3)
2014/03/12file:///C:/blp/data/CFd424b3.htm

Table of ContentsTable of ContentsTable of ContentsTable of Contents
Monetary System
Monetary Policy
In 1993, the Government established Bangko Sentral, the Republic’s central bank, pursuant to the New Central Bank Act. Bangko Sentral replaced the old Central Bank of the Philippines. Bangko Sentral functions as an independent central monetary authority responsible for policies in the areas of money, banking and credit, as authorized under the New Central Bank Act. The New Central Bank Act prohibits Bangko Sentral from engaging in quasi-fiscal activities, commercial banking or development banking or financing, all of which had contributed to substantial deficits at the old Central Bank of the Philippines. Additionally, Bangko Sentral does not engage in any commercial banking activities.
Bangko Sentral’s primary objectives are to maintain price stability, monetary stability and the convertibility of the peso. To achieve its price stability objective, Bangko Sentral undertakes monetary management mainly through adjustments to policy rates and the conduct of open market operations, including the purchase and sale of Government securities, rediscounting transactions and adjustments in reserve requirements.
Bangko Sentral’s functions include:
• conducting monetary policy;
• issuing the national currency;
• managing foreign currency reserves;
• acting as depository for the Government, its political subdivisions and instrumentalities and Government-owned corporations; and
The Government owns all of the capital stock of Bangko Sentral. A seven member Monetary Board, comprised of Bangko Sentral’s Governor, a member of the Cabinet designated by the President and five full-time private sector representatives, governs Bangko Sentral. The President appoints each of the seven Monetary Board members, except the Cabinet representative, to six-year terms.
Philippine law requires Bangko Sentral to maintain a net positive foreign asset position. As of June 30, 2009, Bangko Sentral had total assets of (Peso)2,411.6 billion, of which international reserves accounted for (Peso)1,895.2 billion. Bangko Sentral’s remaining assets consist mainly of loans and advances and Government securities, and its liabilities consist mainly of deposits of financial institutions, the Government and Government-owned corporations and foreign liabilities in the form of loans and bonds payable.
67
• regulating banks and quasi-banks in the Philippines.
頁 151 / 247424(b)(3)
2014/03/12file:///C:/blp/data/CFd424b3.htm

Table of ContentsTable of ContentsTable of ContentsTable of Contents
Money Supply
The following table presents certain information regarding the Philippines’ money supply.
MONEY SUPPLY
Source: Bangko Sentral, Department of Economic Statistics.
As of December 31,
2004 2005 2006 2007 2008 2009
(in billions, except percentages)
M1Currency in circulation (Peso) 253.4 (Peso) 267.8 (Peso) 305.3 (Peso) 347.7 (Peso) 429.5 (Peso) 400.8Current account
deposits 311.4 348.9 463.6 538.4 641.3 716.3
Total 564.8 616.7 768.9 886.0 1,070.8 1,117.2percentage increase
(decrease) 9.1% 9.2% 24.7% 15.2% 20.8% 17.2%M2 2,109.1 2,315.4 2,826.7 3,129.1 3,611.9 3,660.6
percentage increase 10.0% 9.8% 22.1% 10.7% 15.4% 11.8%M3 2,121.4 2,339.0 2,869.6 3,174.4 3,668.4 3,735.6
percentage increase 10.3% 10.3% 22.7% 10.6% 15.6% 12.5%
(1) The survey used to determine domestic liquidity was expanded in 2005 to include Bangko Sentral, commercial banks, thrift banks, rural banks, non-stock savings and loan associations and non-banks with quasi-banking functions. The previously used survey took into account only data from the Bangko Sentral, commercial banks and certain rural banks.
(2) Preliminary data as of October 31, 2009.
(3) Consists of currency in circulation and demand deposits.
(4) Comparison between October 31, 2008 and October 31, 2009.
(5) Consists of M1, savings deposits and time deposits.
As of December 31, 2006, the Republic’s money supply was (Peso)2.9 trillion, an increase of 22.7% from (Peso)2.3 trillion from 2005. The increase was mainly due to strong foreign exchange inflows from OFW remittances, portfolio and direct investments.
As December 31, 2007, the Republic’s money supply was (Peso)3.2 trillion, an increase of 10.6% from (Peso)2.9 trillion from 2006. This increase was mainly due to the steady rise in net foreign assets of depositary corporations.
As of December 31, 2008, the Republic’s money supply was (Peso)3.7 trillion, a 15.6% increase from the level recorded as of December 31, 2007. The increase was attributable to growth in both net domestic and net foreign assets, which grew by 13.1% and 16.4% for the year, respectively. Net domestic asset growth was driven largely by a 16.7% increase in credit extended to the private sector for the year, which was mainly a result of increased lending to the Government. Growth in net foreign assets was due to an expansion in foreign assets held by Bangko Sentral.
Preliminary data indicates that as of October 31, 2009, the Republic’s money supply was (Peso)3.7 trillion, a 12.5% increase from the level recorded as of October 31, 2008. The increase in liquidity compared to the level recorded as of October 31, 2008 was due mainly to a 29.9% increase in net foreign assets in the first ten months of 2009. This was offset in part by a contraction in net domestic assets as of October 31, 2009 of 3.2% compared to the level recorded as of October 31, 2008.
68
(6) Consists of M2 and deposit substitutes.
(1)
(2)
(3)
(4)
(5)
(4)
(6)
(4)
頁 152 / 247424(b)(3)
2014/03/12file:///C:/blp/data/CFd424b3.htm

Table of ContentsTable of ContentsTable of ContentsTable of Contents
The following table presents information regarding domestic interest and deposit rates.
DOMESTIC INTEREST AND DEPOSIT RATES
Source: Bangko Sentral.
2004 2005 2006 2007 2008 2009
(weighted averages per period)
91-day Treasury bill rates 7.3% 6.4% 5.4% 3.4% 5.4% 4.3% 90-day Manila Reference rate 9.5 8.9 8.1 8.3 7.5 7.4Bank average lending rates 10.1 10.2 9.7 8.7 8.8 8.7
(1) January to August 2009.
Monetary Regulation
(2) Based on promissory notes and time deposit transactions of sample commercial banks.
On April 8, 2005, the Monetary Board of Bangko Sentral increased its overnight borrowing rate from 6.75% to 7.0% and increased its overnight lending rate from 9.0% to 9.25%. The 0.25% increase in Bangko Sentral’s policy rates was the first change to the policy rates since July 2003. The Monetary Board noted that the increase in the policy rates was a response to rising inflation expectations caused by higher oil prices, declining real wages and delays in the enactment of revenue measures. With effect from July 15, 2005, Bangko Sentral increased the liquidity reserve requirement for universal and commercial banks from 10.0% to 11.0% and the regular reserve requirement from 9.0% to 10.0%. In September and October 2005, the Monetary Board took two further steps to check inflation. Bangko Sentral revised its two key policy interest rates in two 0.25% steps from 7.0% to 7.25% and then from 7.25% to 7.5%, for the overnight borrowing or reverse repurchase (“RRP”) rate, and from 9.25% to 9.50% and then from 9.50% to 9.75%, for the overnight lending or repurchase (“RP”) rate. These rate hikes were made on September 22, 2005 and October 20, 2005, respectively. The 91-day Treasury bill rate had decreased to 5.0% in March 2006 from 5.4% in November 2005 and 7.8% in December 2004.
In 2006, the weighted average 91-day Treasury bill rate was 5.4%, compared to 6.4% in 2005. The average RRP was 7.5% in 2006 compared to 7.0% in 2005. The average RP rate in 2006 was 9.8%, an increase from the average of 9.3% in 2005.
In 2007, the weighted average 91-day Treasury bill rate was 3.4%, compared to 5.4% in 2006. The average RRP was 6.8% in 2007 compared to 7.5% in 2006; on the other hand, the average RP rate in 2007 was 8.0%, an increase from the average of 9.8% in 2006.
In 2008, the weighted average 91-day Treasury bill rate was 5.4%, compared to 3.4% in 2007. The average RRP was 5.4 in 2008, compared to 6.8% in 2007. The average RP rate in 2008 was 7.8%, compared to 8.0% in 2007.
As of July 9, 2009, in response to the continued global economic downturn, the Monetary Board of Bangko Sentral’s policy interest rates were set at 4.0% for the RRP rate and 6.0% for the RP rate. The lowering of these policy interest rates in July 2009 was the sixth time the Monetary Board lowered rates since December 2008 as part of Bangko Sentral’s efforts to support the financial markets and real economy of the Republic. The Monetary Board based its decisions mainly on expected lower inflation in 2009 and 2010, which would support lower policy interest rates. From an RRP rate of 6.0% and an RP rate of 8.0% in early December 2008, the Monetary Board lowered the RRP and RP rates by 0.5% on December 18, 2008 and again on January 29, 2009. Subsequently, the Monetary Board lowered the RRP and RP rates by 0.25% on each of March 5, 2009, April 16, 2009 and May 28, 2009.
69
(1)
(2)
頁 153 / 247424(b)(3)
2014/03/12file:///C:/blp/data/CFd424b3.htm

Table of ContentsTable of ContentsTable of ContentsTable of Contents
Commercial bank lending rates also eased steadily over the past five years, from an average range of 10.1% to 12.1% in 2004, 9.1% to 11.1% in 2005, 8.3% to 10.2% in 2006, 6.9% to 8.6% in 2007 and 9.5% to 7.5% in 2008. In the first six months of 2009, the average range of lending was 9.4% to 7.6%. This compares to the first six months of 2008, where the average range of lending was 8.9% to 7.0%.
Foreign Exchange System
The Republic maintains a floating exchange rate system under which market forces determine the exchange rate for the peso. Bangko Sentral may, however, intervene in the market to maintain orderly market conditions and limit sharp fluctuations in the exchange rate.
The following table sets out exchange rate information between the peso and the US dollar.
EXCHANGE RATES OF PESO PER US DOLLAR
Source: Reference Exchange Rate Bulletin, Treasury Department, Bangko Sentral.
YearPeriodEnd
PeriodAverage
2004 56.267 56.042005 53.067 55.0862006 49.132 51.3142007 41.401 46.1482008 47.485 44.4752009 (through November 30) 46.752 47.748
Foreign exchange may be freely sold and purchased outside the banking system and deposited in foreign currency accounts. Both residents and non-residents may maintain foreign currency deposit accounts with authorized banks in the Philippines, and residents may maintain deposits abroad without restriction. However, foreign exchange may not be purchased from the domestic banking system to deposit in these accounts abroad.
Payments related to foreign loans registered with Bangko Sentral and foreign investments approved by or registered with Bangko Sentral may be serviced with foreign exchange purchased from authorized agent banks. Bangko Sentral must approve and register all outgoing investments by residents exceeding $6 million per investor per year if the funds will be sourced from the banking system. For a discussion of Bangko Sentral’s loan approval regime, see “The Philippine Financial System—Foreign Currency Loans”.
While the Government imposes no currency requirements for outgoing payments, all exchange proceeds from exports, services and investments must be obtained in any of 22 prescribed currencies. Authorized agent banks may convert the acceptable currencies to pesos.
Individual or corporate non-residents may open peso bank accounts without Bangko Sentral’s approval. The export or electronic transfer out of the Philippines of peso amounts exceeding (Peso)10,000 requires prior authorization from Bangko Sentral.
In 2006, the peso averaged (Peso)51.314 per US dollar, 7.4% higher than the average of (Peso)55.086 per US dollar in 2005. The peso appreciated as a result of foreign exchange inflows from remittances, as well as foreign direct and portfolio investments.
70
(1) The average of the monthly average exchange rates for each month of the applicable period.
(1)
頁 154 / 247424(b)(3)
2014/03/12file:///C:/blp/data/CFd424b3.htm

Table of ContentsTable of ContentsTable of ContentsTable of Contents
In 2007, the average exchange rate was (Peso)46.148 per US dollar, compared to (Peso)51.314 and (Peso)55.086 per US dollar in 2006 and 2005, respectively. The strengthening of the peso was attributable to sustained foreign exchange inflows from OFW remittances, foreign direct and portfolio investments, higher earnings from exports of goods and services, the subprime mortgage market-related credit crisis in the United States and the weakened dollar resulting from the downturn in the US economy.
In 2008, the average exchange rate was (Peso)44.475 per US dollar, compared to (Peso)46.148 per US dollar in 2007 and (Peso)51.314 in 2006. The general strengthening of the peso was attributable to sustained foreign exchange inflows from OFW remittances, foreign direct and other investments, and earnings from exports of goods and services. These trends have been offset by concerns over the global economic downturn following the US credit crisis in recent months.
For the first eleven months of 2009, the average peso-to-US dollar exchange rate was (Peso)47.748 per US dollar, compared to an average of (Peso)44.475 per US dollar at the end of 2008 and (Peso)46.148 per US dollar in 2007.
Stabilization of the Peso
Since it allowed the peso to float on July 11, 1997, Bangko Sentral has intervened minimally in the foreign exchange market. It has, however, adopted measures related to foreign exchange trading aimed to reduce currency speculation and combat money laundering. Since 2005, these measures have included the following:
• With effect from July 15, 2005, Bangko Sentral increased the liquidity reserve requirement for universal and commercial banks from 10.0% to 11.0% and the regular reserve requirement from 9.0% to 10.0%.
71
• In July 2005, the Bangko Sentral implemented an improved Currency Risk Protection Program (“CRPP”) through a more competitive pricing mechanism. The CRPP allows eligible corporations and other foreign exchange users to purchase foreign exchange from banks at a predetermined rate in the future. In 2005, total availments under the CRPP amounted to $708 million.
頁 155 / 247424(b)(3)
2014/03/12file:///C:/blp/data/CFd424b3.htm

Table of ContentsTable of ContentsTable of ContentsTable of Contents
The Philippine Financial System
Composition
The following table sets out the total assets of the Philippine financial system by category of financial institution.
TOTAL ASSETS OF THE FINANCIAL SYSTEM
Source: Bangko Sentral.
As of December 31,
2004 2005 2006 2007 2008 2009
(in billions)
BanksUniversal/Commercial banks (Peso)3,760.6 (Peso)3,986.0 (Peso)4,392.6 (Peso)4,578.3 (Peso)5,219.1 (Peso)5,404.6Thrift banks 317.9 357.8 453.8 501.8 590.8 543.9Rural and cooperative banks 104.5 120.3 139.3 164.6 163.9 167.0
Total banks 4,183.0 4,464.1 4,985.6 5,244.7 5,973.8 6,115.5
Non-bank financial institutions 992.9 1,155.4 1,271.5 1,369.1 1,431.4 1,438.5
Total assets (Peso)5,175.9 (Peso)5,619.5 (Peso)6,257.1 (Peso)6,613.8 (Peso)7,405.2 (Peso)7,554.0
(1) Excludes assets of Bangko Sentral.
(2) Preliminary data as of September 30, 2009, unless otherwise indicated.
(3) Preliminary data as of June 30, 2009.
The Philippine financial system consists of banks and non-bank financial institutions. Banks include all financial institutions that lend funds obtained from the public primarily through the receipt of deposits. Non-banks include financial institutions other than banks which lend, invest or place funds, or at which evidences of indebtedness or equity are deposited with or acquired by them, either for their own account or for the account of others. Non-bank financial institutions may have quasi-banking functions. Quasi-banking functions include borrowing money to relend or purchase receivables and other obligations by issuing, endorsing or accepting debt or other instruments or by entering into repurchase agreements with 20 or more lenders at any one time.
The Supervision and Examination Sector of Bangko Sentral supervises all banks and non-banks with quasi-banking functions, including their subsidiaries and affiliates engaged in related activities, with Bangko Sentral’s Monetary Board having ultimate supervisory authority.
Structure of the Financial System
(4) Preliminary data as of March 31, 2009.
The Philippine financial system is comprised of commercial banks, thrift banks, rural and cooperative banks and non-bank financial institutions. Each type of bank participates in distinct business activities and geographic markets.
Commercial banks:
• accept drafts;
• issue letters of credit, promissory notes, drafts, bills of exchange and other evidences of indebtedness;
• receive deposits;
• buy and sell foreign exchange and gold and silver bullion; and
72
• lend money on a secured or unsecured basis.
(1)
(2)
(3)
(4)
頁 156 / 247424(b)(3)
2014/03/12file:///C:/blp/data/CFd424b3.htm

Table of ContentsTable of ContentsTable of ContentsTable of Contents
Expanded commercial banks, otherwise known as universal banks, in addition to regular commercial banking activities, may also engage in investment banking activities, invest in non-bank businesses and own allied financial undertakings other than commercial banks. As of September 30, 2009 the Republic had 38 universal and commercial banks, with a total of 4,444 offices.
The following table sets out the outstanding loans of commercial banks classified by sector.
COMMERCIAL BANKS’ OUTSTANDING LOANS BY SECTOR
Source: Bangko Sentral.
As of December 31,
2004 2005 2006 2007 2008 2009
(in millions, except percentages)Total (Peso)1,410,665 100.0 (Peso)1,338,137 100.0 (Peso)1,380,571 100.0 (Peso)1,478,294 100.0 (Peso)1,748,206 100.0 1,790,643 100.0Agriculture, hunting and forestry 117,871 8.4% 132,818 9.9% 150,748 10.9% 202,087 13.7% 309,279 17.7% 303,775 17.0Fishing 5,799 0.4 5,965 0.4 5,774 0.4 6,889 0.5 3,934 0.2 3,573 0.2Mining and quarrying 12,211 0.9 11,387 0.9 9,683 0.7 10,342 0.7 6,890 0.4 4,368 0.2Manufacturing 419,380 29.7 412,539 30.8 376,824 27.3 373,154 25.2 392,794 22.5 325,090 18.2Electricity, gas and water 77,123 5.5 70,055 5.2 75,483 5.5 122,534 8.3 112,599 6.4 140,530 7.8Construction 29,890 2.1 26,084 1.9 25,875 1.9 25,204 1.7 34,485 2.0 23,623 1.3Wholesale and retail 190,537 13.5 165,373 12.4 183,362 13.3 178,879 12.1 228,716 13.1 214,986 12.0Transportation, storage and
communication 61,320 4.3 48,334 3.6 50,455 3.7 55,542 3.8 81,017 4.6 138,288 7.7Financial institutions, real estate
and business services 121,913 8.6 111,407 8.3 116,471 8.4 153,366 10.4 130,560 7.5 143,992 8.0Real Estate, Renting and Bus.
Services 203,484 14.4 199,887 14.9 221,188 16.0 217,208 14.7 282,880 16.2 290,802 16.2Public Administration and
Defense 35,403 2.5 32,333 2.4 41,586 3.0 37,810 2.6 52,704 3.0 68,924 3.8Education 10,514 0.7 9,269 0.7 9,526 0.7 9,359 0.6 10,341 0.6 10,187 0.6Health and Social Work 7,286 0.5 6,398 0.5 6,718 0.5 7,084 0.5 8,364 0.5 9,837 0.5Community, social and personal
services 100,974 7.2 93,563 7.0 94,226 6.8 64,255 4.3 72,592 4.2 85,606 4.8Undifferentiated Production
Activities of Private Households 0 0.0 0 0.0 0 0.0 0 0.0 0 0 0 0
Hotels & Restaurants 16,962 1.2 12,726 1.0 12,653 0.9 14,580 1.0 21,051 1.2 27,062 1.5
Thrift banks invest their capital and the savings of depositors in:
(1) Preliminary data as of October 31, 2009.
• financings for homebuilding and home development;
• marketable debt securities;
• commercial paper and accounts receivable, drafts, bills of exchange, acceptances or notes arising out of commercial transactions; or
As of September 30, 2009 the Republic had 73 thrift banks, with a total of 1,298 offices.
Rural and cooperative banks extend credit in the rural areas on reasonable terms to meet the normal credit needs of farmers, fishermen, cooperatives and merchants and, in general, the people in the rural communities. As of September 30, 2009 the Republic had 685 rural and cooperative banks, with a total of 2,172 offices.
Some thrift and rural banks are considered microfinance oriented banks, with more than 50% of their operations dedicated to lending amounts as low as (Peso)5,000.
73
• short-term working capital and medium and long-term loans to small and medium-sized businesses and individuals engaged in agriculture, services, industry, housing and other financial and allied services in its market.
(1)
頁 157 / 247424(b)(3)
2014/03/12file:///C:/blp/data/CFd424b3.htm

Table of ContentsTable of ContentsTable of ContentsTable of Contents
The specialized Government banks are the Development Bank of the Philippines, the Land Bank of the Philippines and the Al-Amanah Islamic Investment Bank of the Philippines. The Development Bank generally provides banking services to meet the medium and long-term needs of small and medium-sized agricultural and industrial enterprises, particularly in rural areas. The Land Bank primarily provides financial support for agriculture and all phases of the Republic’s agrarian reform program. The Development Bank and the Land Bank may also operate as universal banks. The Al-Amanah Islamic Investment Bank promotes the development of the Autonomous Region of Muslim Mindanao by offering banking, financing and investment services based on Islamic banking principles and rulings.
Non-bank financial institutions are primarily long-term financing institutions, though they also facilitate short-term placements in other financial institutions. As of September 30, 2009, Bangko Sentral regulated or supervised 6,439 non-bank financial institutions with quasi-banking functions, among them six investment houses, seven financing companies and one non-bank financial institution. Bangko Sentral also supervised or regulated non-bank financial institutions without quasi-banking functions, including 16 investment houses, 17 financing companies, four investment companies, 15 security dealers/brokers, 6,294 pawnshops, six investment companies, two lending investors, 74 non-stock savings and loan associations, one venture capital corporation, two Government non-bank financial institutions and four credit card companies.
Non-Performing Loans
The following table provides information regarding non-performing loans (“NPL”) for the banking system for the periods indicated.
TOTAL LOANS (GROSS) AND NON-PERFORMING LOANS BY TYPE
OF COMMERCIAL BANKS
Source: Bangko Sentral.
74
As of December 31,
2004 2005 2006 2007 2008 2009
(in billions, except percentages)
Expanded commercial/Universal banks
Total loans (Peso)1,143.7 (Peso)1,194.2 (Peso)1,313.0 (Peso)1,413.8 (Peso)1,619.7 (Peso)1,583.9Total non-performing loans 164.7 113.2 87.8 71.7 63.5 59.2Ratio of non-performing
loans to total loans 14.4% 9.5% 6.7% 5.1% 3.9% 3.8% Non-expanded/Commercial
banksTotal loans 168.7 168.6 165.1 162.5 180.9 156.9Total non-performing loans 30.4 18.1 14.5 12.1 11.4 12.5Ratio of non-performing
loans to total loans 18.0% 10.7% 8.8% 7.5% 6.3% 8.0% Government banks
Total loans 231.8 269.3 297.1 305.3 361.9 314.5Total non-performing loans 27.2 18.6` 12.6 10.9 8.2 8.0Ratio of non-performing
loans to total loans 11.7% 6.9% 4.2% 3.6% 2.3% 2.6% Foreign banks
Total loans 240.1 240.6 298.1 313.2 339.8 342.5Total non-performing loans 4.8 3.8 2.5 2.8 5.1 4.1Ratio of non-performing
loans to total loans 2.0% 1.6% 0.8% 0.9% 1.5% 1.2% Total loans 1,784.2 1,872.7 2.073.3 2,194.8 2,502.3 2,397.8Total non-performing loans 227.0 153.7 117.4 97.6 88.2 83.8Ratio of non-performing loans
to total loans 12.7% 8.2% 5.7% 4.4% 3.5% 3.5%
(1)
(2)
(2)
(3)
(4)
頁 158 / 247424(b)(3)
2014/03/12file:///C:/blp/data/CFd424b3.htm

Table of ContentsTable of ContentsTable of ContentsTable of Contents
(1) Preliminary data as August 31, 2009.
(2) Includes ING Bank and excludes Land Bank of the Philippines and Development Bank of the Philippines.
(3) Consists of Land Bank, Development Bank and Al-Amanah Islamic Investment Bank.
The NPL ratio for universal and commercial banks as of December 31, 2006 was at 5.7%, which was a decrease from 8.2% as of December 31, 2005. The (Peso)36.3 billion decrease in non-performing loans, from (Peso)153.7 billion in 2005 to (Peso)117.4 billion in 2006, was due mainly to the decline in non-performing loans of universal banks in the period.
As of December 31, 2007, the NPL ratio for universal and commercial banks was at 4.4%, which was an improvement from the 5.7% recorded as of December 31, 2006. The (Peso)19.8 billion reduction in non-performing loans, from (Peso)117.4 billion in 2006 to (Peso)97.6 billion in 2007, was attributable to a reduction of (Peso)16.1 billion in non-performing loans of universal banks.
As of December 31, 2008, the NPL ratio for universal and commercial banks was 3.5%, which was 0.9% lower than the 4.4% recorded as of December 31, 2007. The (Peso)9.4 billion reduction in non-performing loans from (Peso)97.6 billion in 2007 to (Peso)88.2 billion in 2008, was largely due to the decline in non-performing loans of universal banks.
Preliminary data as of October 31, 2009 shows that the NPL ratio for universal and commercial banks was 3.4%, compared with a ratio of 4.0% recorded as of October 31, 2008. The lower NPL ratio in the period was attributable mainly to a decline in the amount of non-performing loans, as well as to an increase in the total loan portfolio.
Financial Sector Reforms
(4) Consists of 14 foreign banks; excludes four foreign bank subsidiaries.
The Government has undertaken a number of reforms in the financial sector intended to reduce bank holdings of nonperforming assets and improve the health of the banking industry in general.
The General Banking Law of 2000, which amended the General Banking Act, enhanced Bangko Sentral’s supervisory and enforcement powers and liberalized foreign ownership of banks (foreign banks are now generally permitted to acquire up to 100% of the voting stock of a Philippine bank). In particular, the General Banking Law reforms included the formal adoption of Basel risk-based capital requirements, a legal basis for consolidated supervision, stronger safeguards against insider loans, enhanced disclosure requirements and increases in monetary penalties.
In September 2001, the Anti-Money Laundering Act of 2001 (the “AMLA”) was passed. The AMLA made money laundering a criminal offense, requires reporting of unusual or suspicious transactions and allows the Government to request any foreign country to assist in locating and freezing proceeds of unlawful activities. Amendments were made to the law in 2003 to comply with the demands of the Financial Action Task Force (“FATF”), established by the Organization for Economic Cooperation and Development to combat money laundering. The amendments lowered the threshold amount for bank transactions automatically subject to reporting requirements from (Peso)4 million to (Peso)500,000. However, a court order will be required to examine suspicious transactions or freeze bank accounts other than those suspected to be related to terrorism, kidnapping, hijacking and drug trafficking. The new law remains silent on whether it will apply retroactively.
The Special Purpose Vehicle Act (“SPV Act”) was enacted in January 2003. The SPV Act provides the legal framework for the creation of private asset management companies that are expected to relieve a major portion of the banking system’s non-performing assets and thereby promote bank lending to support economic growth. The SPV Act’s implementing rules and regulations took effect on April 9, 2003. On June 26, 2003, the Monetary
75
頁 159 / 247424(b)(3)
2014/03/12file:///C:/blp/data/CFd424b3.htm

Table of ContentsTable of ContentsTable of ContentsTable of Contents
Board of Bangko Sentral approved accounting guidelines allowing the staggered booking of losses from the discounted sales of non-performing assets to SPVs to spread their losses over a maximum period of seven years, provided that the banks fully disclose any deviations from generally accepted accounting practices in connections with such sales. Under the SPV Act, 40 private asset management companies were registered with the Philippine Securities and Exchange Commission (“Philippine SEC”) and were deemed eligible to acquire non-performing assets until the expiration of the SPV Act.
On April 24, 2006, the President signed into law an amendment to the SPV Act which extends the deadline for the establishment and registration of qualifying SPVs. The extension enabled financial institutions to continue to transfer non-performing assets to private asset-management companies, which allowed for increased lending from the banking system. More specifically, as of June 30, 2008, the extended deadline of the SPV Act resulted in the additional disposal of approximately (Peso)146.3 billion in non-performing assets and brought asset quality ratios in the banking sector closer to pre-Asian crisis levels. This amount represents approximately 28% of the P520.0 billion in non-performing assets held by the Bangko Sentral prior to the passage of the SPV Act in 2003. Apart from the SPV related disposals, Bangko Sentral has issued recent regulations allowing banks to enter into joint venture agreements with real estate developers to dispose of foreclosed properties.
On December 19, 2005, the Monetary Board partially lifted a moratorium on the establishment of bank branches and other banking offices that had been in place since 1999. This action was aimed primarily at increasing competition among banks and improving banking services and accessibility in underserved areas. Under the Monetary Board’s new guidelines, banks that meet certain qualification requirements may establish branches anywhere in the Philippines, except in selected areas of Metro Manila that Bangko Sentral has determined are adequately served by existing banking offices.
The Medium Term Philippine Development Plan 2004–2010 called for a more developed and stable financial infrastructure to promote a deeper domestic capital market and a stronger banking sector. The major bank and non-bank sector reforms for the medium-term include:
• amendments to the New Central Bank Act of 1993 to strengthen the supervisory capability and the effectiveness of the Bangko Sentral;
• promotion of compliance with International Accounting Standards, International Standards for Auditing and International Valuation Standards;
• adoption of the Basel II risk-based capital adequacy framework on July 1, 2007;
• establishment of a strong central credit information bureau;
• promotion of microfinance in support of development and poverty alleviation;
• encouraging new listings in the Philippine Stock Exchange and improving transparency and clearance settlements; and
Also, Bangko Sentral has supported amendments to the Bangko Sentral charter to strengthen regulation of the banking sector. The proposed amendments, which are currently pending before Congress, would relax bank secrecy rules, give Bangko Sentral more flexibility to order consolidations in the banking industry, clarify the grounds for closing problem banks or declaring them insolvent and strengthen legal protections for Bangko Sentral officers acting in their official capacity.
On August 22, 2008, the Personal Equity and Retirement Account Law (“PERA Law”) was signed by President Arroyo into law. The PERA Law aims to improve the Republic’s savings rate and support the
76
• support for the establishment of alternative trading systems and the full operation of the Fixed Income Exchange.
頁 160 / 247424(b)(3)
2014/03/12file:///C:/blp/data/CFd424b3.htm

Table of ContentsTable of ContentsTable of ContentsTable of Contents
development of the domestic capital markets by setting up a personal savings plan for employees similar to the 401(k) pension scheme adopted in the United States.
On October 31, 2008, the Credit Information System Act (“CISA”) was signed into law. The CISA aims to establish a comprehensive credit information system in the Republic, and also seeks to improve access to credit, lower the cost of credit to borrowers and reduce reliance on collateral-based lending.
On June 30, 2009, Republic Act No. 9648, or The Documentary Stamp Tax Law, was signed into law by President Arroyo. The law exempts the sale, barter or exchange of shares of stock listed and traded through the Philippine Stock Exchange from documentary stamp taxes. The law is intended to stimulate trading in the local capital markets.
On September 29 and October 1, 2009, the Republic’s Senate and House of Representatives, respectively, passed a bill to enact the Real Estate Investment Trust (“REIT”) Act of 2009. The bill seeks to create a legal framework for REITs in the Republic and establish a new category of financial product in the country. The bill is designed to democratize real estate as an investment vehicle for average Filipino investors and stimulate capital market growth. The bill has been transmitted to the Office of the President, and will be enacted into law upon signature by President Arroyo.
Foreign Currency Loans
Bangko Sentral imposes a combination of prior approval, registration and reporting requirements on all non-peso denominated loans. The regime is as follows:
77
Type of Loan Requirements
Private sector loans:
• guaranteed by a public sector entity or a local commercial bank;
• granted by foreign currency deposit units that are specifically or directly funded from, or collateralized by, offshore loans or deposits;
• obtained by banks and financial institutions with a term exceeding one year which will be relent to public and private enterprises; or
• serviced using foreign exchange purchased from the banking system, unless specifically exempted from the approval requirement.
Prior approval, subsequent registration and reporting requirements.
Private sector loans which are specifically exempted and which will be serviced with foreign exchange purchased in the banking system.
Subsequent registration and reporting requirements.
All private sector loans to be serviced with foreign exchange not purchased from the banking system.
Reporting requirements.
Public sector offshore loans except:
• short-term foreign currency deposit loans for trade financing; and
• short-term interbank borrowings
Prior approval and reporting requirements.
頁 161 / 247424(b)(3)
2014/03/12file:///C:/blp/data/CFd424b3.htm

Table of ContentsTable of ContentsTable of ContentsTable of Contents
The Philippine Securities Markets
History and Development
The securities industry in the Philippines began with the opening of the Manila Stock Exchange in 1927. In 1936, the Government established the Philippine SEC to oversee the industry and protect investors. Subsequently, the Makati Stock Exchange opened in 1963 and merged with the Manila Stock Exchange to form the Philippine Stock Exchange in 1994.
On June 29, 1998, the Philippine SEC granted the Philippine Stock Exchange self-regulatory organization status, empowering it to supervise and discipline its members, including by examining a member’s books of account and conducting audits.
To broaden the range of securities eligible for listing, the Philippine Stock Exchange established a board for small- and medium-sized enterprises with an authorized capital of (Peso)20 million to (Peso)99.9 million of which at least 25% must be subscribed and fully paid.
In August 2001, the Philippine Stock Exchange completed its conversion to a publicly held stock corporation. As its first shareholders, each of the 184 member-brokers subscribed and fully paid for 50,000 shares. The listing of its shares on the Philippine Stock Exchange took effect in December 2003 and 40% of the unissued shares were sold through a private placement in February 2004.
As of August 31, 2008, the Philippine Stock Exchange had 149 local and 35 foreign members, and 246 listed companies.
As of December 21, 2009 the Philippine Stock Exchange composite index closed at 3,020.6 compared to a close of 1,872.9 on December 24, 2008, 3,621.6 on December 28, 2007 and 2,982.5 on December 28, 2006.
In addition to the Philippine Stock Exchange, the Philippine Dealing and Exchange Corporation (“PDEX”), which deals mainly with foreign exchange and Government securities, was granted self-regulatory organization status by the Philippine SEC in 2006, The PDEX registered a trading volume of (Peso)233.5 billion for Government securities among its participant banks for the month of September 2009, which was more than triple the volume of (Peso)68.0 billion in December 2006.
Government Securities Market
The Government securities market is dominated by short-term Treasury bills with maturities not exceeding one year. Responding to investor preferences and to create a yield curve for long-term domestic securities, the Government issued securities with longer maturities, including five-year fixed rate treasury bonds in June 1995, seven- and ten-year fixed rate treasury bonds in 1996 and 20-year Treasury bonds in 1997. The Bureau of the Treasury currently conducts weekly public offerings of Treasury bills with maturities of 91 days, 182 days and 364 days, as well as Treasury bonds with maturities ranging from two years to 25 years. Net financing of the Government decreased by 21.5% in 2005 compared to 2004. Net foreign borrowings amounted to (Peso)92.7 billion in 2005, including the issuance of $1.5 billion, $750 million and $1.0 billion in global bonds in February, May and September, respectively; domestic borrowings amounted to (Peso)54.1 billion, with sales of short-term treasury bills used to finance maturing obligations during the period. The Government also issued $1.5 billion and €500 million in global bonds in January 2006. As of December 31, 2005, the Government had (Peso)637.6 billion in outstanding Treasury bills (a 49.9% increase from (Peso)425.4 billion on December 31, 2001) and (Peso)1,496.5 billion in outstanding Treasury bonds (a 88.7% increase from (Peso)793.1 billion on December 31, 2001). The Government’s outstanding direct domestic debt totaled (Peso)2.2 trillion as of December 31, 2005.
In the first quarter of 2006, the Government conducted a domestic debt consolidation with the goal of creating large domestic three-, five- and seven-year benchmarks. The transaction was conducted in two phases.
78
頁 162 / 247424(b)(3)
2014/03/12file:///C:/blp/data/CFd424b3.htm

Table of ContentsTable of ContentsTable of ContentsTable of Contents
On February 17, 2006, the Republic issued (Peso)70.7 billion of new three-year bonds in exchange for approximately (Peso)66.0 billion of eligible bonds from 49 different series. On March 3, 2006, the Republic issued (Peso)33.4 billion of new five-year bonds in exchange for (Peso)15.0 billion of eligible bonds from 32 different series and (Peso)17.0 billion of new seven-year bonds in exchange for (Peso)15.0 billion of eligible bonds from 11 different series. The exchange was executed through a modified Dutch auction in which investors tendered their existing holdings of eligible bonds in exchange for the new bonds. As of December 31, 2006, outstanding Government securities amounted to (Peso)2.2 trillion, 69.5% of which were regularly issued of Treasury bills and Fixed Rate Treasury Bonds (“FXTBs”). FXTBs comprised (Peso)869 million, or 56.8% of the issuances for the year.
As of December 31, 2007, outstanding Government securities remained at (Peso)2.2 trillion; 60.5% of these were regular issuances of Treasury bills and FXTBs. On August 1, 2007, the Government raised (Peso)77.7 billion from the sale of three- and five-year Retail Treasury Bonds (“RTBs”). In weekly auctions of Treasury bills and bonds, total Treasury bills and bonds offered by the Government in 2007 were (Peso)263.8 billion, a decrease of 7.8% from the (Peso)286.0 billion offered in 2006. The global economic downturn in the second half of 2007 resulted in the rejection of some of the bids for Government securities. However, investors continued to access the Government securities market as total subscriptions or market tenders were more than twice the offered amount for both short-term Treasury bills and longer-term Treasury bonds.
As of August 31, 2008, outstanding Government securities amounted to (Peso)2.4 trillion, 60.4% of which were regular issuances of Treasury bills and FXTBs. The remaining 39.6% of Government issued debt securities were benchmark bonds, special bond issuances, other notes and bonds and Government guaranteed corporate debt. RTBs were again issued on July 31, 2008, raising (Peso)70 billion. In weekly auctions for 2008, offerings by the Government totaled (Peso)253 billion, an increase from the (Peso)198.8 billion registered during the same period in 2007. The Government accepted (Peso)125.9 billion of the (Peso)253 billion in securities offered, as higher quoted prices by dealers due to concerns over rising inflation led the Government to reject a large number of bids. The increase in the Bangko Sentral’s borrowing and lending rates by 25 basis points on August 28, 2008, following a combined increase of 75 basis points in June and July 2008, translated into an increase in the cost of borrowing of banks from the Bangko Sentral.
International Bond Market
In February 1997, Bangko Sentral approved guidelines governing the issuance of peso-denominated bonds in the international capital markets. Bangko Sentral requires the receipt of foreign currency by the Philippines and its exchange into pesos in the local banking system.
In 2005, the Monetary Board of the Bangko Sentral began to allow certain non-resident institutions such as the ADB and IFC, to issue peso-denominated bonds in the local market.
Public Finance
The Consolidated Financial Position
The consolidated public sector financial position measures the overall financial standing of the Republic’s public sector. It is comprised of the public sector borrowing requirement and the aggregate deficit or surplus of the Social Security System and the Government Service Insurance System, Bangko Sentral, the Government financial institutions and the local Government units. The public sector borrowing requirement reflects the aggregate deficit or surplus of the Government, the Central Bank-Board of Liquidation’s accounts, the Oil Price Stabilization Fund and the 14 monitored GOCCs.
79
頁 163 / 247424(b)(3)
2014/03/12file:///C:/blp/data/CFd424b3.htm

Table of ContentsTable of ContentsTable of ContentsTable of Contents
The following table sets out the consolidated financial position on a cash basis for the periods indicated.
CONSOLIDATED PUBLIC SECTOR FINANCIAL POSITION OF THE REPUBLIC
As of December 31,
2004 2005 2006 2007 2008
(in billions, except percentages)
Public sector borrowing requirement:National government (Peso)(187.1) (Peso)(146.8) (Peso)(64.8) (Peso)(12.4) (Peso) (68.1) Central Bank-Board of Liquidation (17.5) (16.3) 5.8 (8.2) (9.6) Oil Price Stabilization Fund 0.0 0.0 — — —
Monitored Government-owned corporations (85.4) (25.4) (13.2) 57.9 (27.2)
Government transfers to Government-owned corporations 9.2 1.5 (0.0) 10.6 13.8
Other adjustments 0.0 0.0 0.0 0.0 0.1
Total public sector borrowing requirement (280.8) (187.0) (79.1) 47.9 (91.0)
As a percentage of GDP (5.8)% (3.4)% (1.3)% 0.7% (1.2)% Other public sector:
Social Security System and Government Service Insurance System 24.4 48.9 59.4 34.2 66.7
Bangko Sentral 3.3 3.6 0.6 (89.2) 9.4Government financial institutions 5.2 6.6 8.0 5.9 7.5Local Government units 14.9 24.0 26.7 21.8 34.4Timing adjustment of interest payments to
Bangko Sentral 3.9 3.4 (0.7) 0.1 2.2Other adjustments (2.8) (0.1) (3.9) 0.6 0.0
Total other public sector 48.7 86.2 90.1 (26.6) 120.2
Consolidated public sector financial position (232.1) (100.7) 11.0 21.3 29.2
As a percentage of GDP (4.8)% (1.8)% 0.2% 0.3% 0.4%
Source:Fiscal Policy and Planning Office, Department of Finance.
(1) The Oil Price Stabilization Fund was created by the Government to stabilize the domestic price of oil products. Prior to deregulation in 1997, if exchange rates and international crude oil prices exceeded certain levels, oil companies received money from the fund, but if exchange rates and crude oil prices fell below those levels, oil companies contributed to the fund. The fund was technically abolished with the full deregulation of the oil industry in February 1998.
The consolidated financial position of the Republic recorded a surplus of (Peso)11.0 billion in 2006, a reversal from the (Peso)100.7 billion deficit in 2005. The reversal was mainly due to governance reform resulting in improved receipts and lower costs, including costs of debt servicing.
The consolidated financial position of the Republic recorded a surplus of (Peso)21.3 billion in 2007, almost twice the amount of the (Peso)11.0 billion surplus in 2006. The reversal was mainly due to improved spending policies and financial discipline by the Republic’s agencies.
In 2008, the consolidated financial position of the Republic recorded a surplus of (Peso)29.2 billion, which was approximately 37.1% higher than the surplus of (Peso)21.3 billion recorded in 2007. The increase in the public sector surplus was primarily due to the improved financial positions of Government-owned and controlled corporations, the BSP and local government units during the year. The Government expects the consolidated public sector position in 2009 to register a deficit primarily because of its stimulus program for the domestic economy.
80
(2) Amounts are net of interest rebates, dividends and other amounts remitted to the Government and the Central Bank-Board of Liquidation.
(1)
(2)
頁 164 / 247424(b)(3)
2014/03/12file:///C:/blp/data/CFd424b3.htm

Table of ContentsTable of ContentsTable of ContentsTable of Contents
Government Revenues and Expenditures
The following table sets out Government revenues and expenditures for the periods indicated.
GOVERNMENT REVENUES AND EXPENDITURES
Source: Department of Finance; Department of Budget and Management.
Actual Budget
2004 2005 2006 2007 2008 2009 2008 2009
(in billions, except percentages)Cash Revenues
Tax revenues
Bureau of Internal Revenue (Peso) 470.3 (Peso) 542.7 (Peso) 652.7 (Peso) 713.6 (Peso) 778.6 (Peso) 612.0 (Peso) 810.0 (Peso) 798.5Bureau of Customs 127.3 154.6 198.2 209.4 260.2 184.0 274.1 273.3Others 7.4 8.4 9.0 9.9 10.4 10.0 9.4 10.9
Total tax revenues 605.0 705.6 859.9 932.9 1,049.2 806.0 1,093.4 1,082.6As a percentage of GNP 11.5 12.0 13.2 12.9 12.7 — 13.2 —
Non-tax revenues
Bureau of the Treasury income (Peso) 64.7 (Peso) 70.6 (Peso) 74.4 (Peso) 67.9 (Peso) 63.7 56.3 (Peso) 57.3 60.1Fees and other charges 19.6 19.0 16.8 21.6 — 16.8 40.5 66.4Privatizations 0.4 2.4 5.8 90.6 31.3 1.1 34.0 30.0
Foreign grants 0.1 0.1 0.2 0.2 0.1 0.1 — —
Others 16.9 18.4 22.6 23.3 58.6 45.1 — —
Total non-tax revenues 101.7 110.5 119.8 203.6 153.7 119.4 131.8 156.5
Total cash revenues 699.7 795.6 959.0 1,106.4 1,144.2 881.4 1,212.9 1,183.8As a percentage of GNP 13.3 13.5 14.7 15.3 13.9 — 14.6 —
Non-Cash Revenues 7.0 20.5 20.7 30.1 58.7 44.0 12.3 55.3
Total Revenues 706.7 816.2 979.6 1,136.5 1,202.9 925.4 1,225.2 1,239.2
Cash Expenditures
Personnel (Peso) 283.1 (Peso) 296.4 (Peso) 324.7 (Peso) 350.3 374.7 290.7 (Peso) 397.3 432.0Maintenance and operating expense 83.8 84.8 100.0 128.3 138.7 119.7 136.0 187.5Interest payments
Foreign 90.9 109.5 112.8 110.6 101.7 102.6 106.4 —
Domestic 170.0 190.4 197.3 157.2 170.5 132.6 183.7 —
Total interest payments 260.9 299.8 310.1 267.8 272.2 249.4 295.8 311.2Subsidies to Government corporation 7.0 8.1 11.9 27.3 17.0 12.6 10.1 11.3Allotment to local government units 114.1 122.2 136.9 149.2 170.6 153.2 218.7 261.0Comprehensive Agrarian Reform Program (land
acquisition and credit) 7.3 4.1 1.9 4.0 4.1 0.0 4.1 1.0Infrastructure and other capital outlays 93.8 90.4 99.2 145.3 172.2 167.8 147.5 203.5Equity and net lending 5.7 1.9 3.7 13.5 16.1 12.0 14.5 26.6
Total cash expenditures 886.8 942.3 1,023.8 1,118.9 1,212.3 1,147.6 1,287.9 1,433.9
As a percentage of GNP 16.9 16.0 15.7 15.5 14.7 — 15.5 —
Non-Cash Expenditures 7.0 20.5 20.6 30.1 58.7 43.9 12.3 55.3
Total Expenditures 893.8 962.9 1,044.4 1,149.0 1,271.0 1,191.6 1,300.2 1,489.2
Surplus / (Deficit) (Peso)(187.1) (Peso)(146.8) (Peso) (64.8) (Peso) (12.4) (Peso) (68.1) (Peso) (266.1) (Peso) (75.0) (Peso) (250.0) Financing
Domestic financing (Peso) 105.9 (Peso) 54.1 (Peso) (56.0) (Peso) (43.8) (Peso) 77.3 (Peso) 126.5 (Peso) 50.4 153.8Net domestic borrowings 161.4 143.3 (10.6) 42.9 169.3 26.6 68.1 174.0Non-budgetary accounts (74.9) (66.9) (39.3) 20.3 (45.0) 17.9 (13.4) (14.5) Use of cash balances 19.4 (22.3) (6.1) (107.0) (47.5) 112.3 (4.3) (5.7)
Foreign financing 81.2 92.7 120.8 56.2 (9.2) 80.8 24.6 96.2
Total financing (Peso) 187.1 (Peso) 146.8 (Peso) 64.8 (Peso) 12.4 (Peso) 68.1 (Peso) 237.5 (Peso) 75.0 250.0
81
(1) Preliminary data as of November 18, 2009 for the first ten months of 2009.
(1) (2)
(3)
(4) (4)
(5)
(6)
(7)
(4) (4)
(4) (4)
(4) (4)
(4)
(4)
(4) (4)
頁 165 / 247424(b)(3)
2014/03/12file:///C:/blp/data/CFd424b3.htm

Table of ContentsTable of ContentsTable of ContentsTable of Contents
(2) To date, the Government is operating under Republic Act No. 9524 which enacted the 2009 budget.
(3) Represents tax revenues of the Department of Environment and Natural Resources, Bureau of Immigration and Deportation, Land Transportation Office and other Government entities.
(4) Data unavailable.
(5) Represents interest on deposits, interest on advances to Government-owned corporations, interest on securities, dividends from Government-owned corporations, earnings received from the Philippine Amusement and Gaming Corporation, earnings and terminal fees received from Ninoy Aquino International Airport, guarantee fees and others.
(6) Represents receipts from the Land Transportation Office, Department of Foreign Affairs and other Government agencies.
Recent Results
(7) Represents remittances to the National Government from the sale of interests in Government-owned corporations, Government financial institutions and other Government owned assets and from the sale of assets by the Presidential Commission on Good Government and the Asset Privatization Trust.
The Government recorded a deficit of (Peso)266.1 billion for the first ten months of 2009, compared to a deficit of (Peso)62.3 billion for the first ten months of 2008 and a budgetary target deficit of (Peso)250.0 billion for 2009. The deficit was primarily a result of increased spending by the Government as part of its stimulus program to mitigate the effects of the global economic downturn on the Republic. However, a decrease in revenues further increased the deficit.
Total Government revenues for the first ten months of 2009 were (Peso)925.4 billion, compared to (Peso)972.6 billion for the first ten months of 2008, reflecting a 4.8% decrease. Bureau of Internal Revenue (“BIR”) collections for the first ten months of 2009 were (Peso)612.0 billion (of which (Peso)589.2 billion were cash revenues), reflecting a decrease of 5.2% from BIR collections of (Peso)644.8 billion (of which (Peso)630.2 billion were cash revenues) for the corresponding period in 2008 as a result of the lowering of the corporate income tax rate as well as the implementation of various tax incentives and exemptions as part of the stimulus program. The Government’s budgetary target for BIR collections in 2009 was (Peso)810.1 billion (of which (Peso)790.5 billion was targeted to be in cash). Bureau of Customs (“BOC”) collections were (Peso)183.9 billion (of which (Peso)162.7 billion were cash revenues) in the first ten months of 2009, compared to (Peso)218.2 billion for the first ten months of 2008 (of which (Peso)185.4 billion were cash revenues), reflecting a 15.7% decrease. The decrease was due mainly to the contraction in imports during the period. The budgetary target for BOC collections in the first ten months of 2009 was (Peso)276.8 billion, of which (Peso)238.0 billion was targeted to be in cash. Other revenues were (Peso)73.2 billion in the first ten months of 2009, reflecting an increase of 29.7% from other revenues of (Peso)56.4 billion in the first ten months of 2008. Income from the Bureau of the Treasury was (Peso)56.3 billion in the first ten months of 2009, compared to income of (Peso)53.1 billion for the same period in 2008, representing a 6.0% increase.
In the first ten months of 2009, total Government expenditures were (Peso)1,191.5 billion (of which (Peso)249.4 billion were interest payments), representing a 15.1% increase from Government expenditures of (Peso)1,034.9 billion (of which (Peso)252.3 billion were interest payments) for the corresponding period in 2008. The budgetary target for expenditure for 2009 was (Peso)1,489.2 billion, of which (Peso)311.2 billion was targeted for interest payments.
Revenues
Sources. The Government derives its revenues from both tax and non-tax sources. The main sources of revenue include income taxes, value-added taxes, excise taxes and customs duties. The main sources of non-tax revenue consist of interest on deposits, amounts earned from Government-owned corporations and privatization receipts.
On May 24, 2005, President Arroyo signed into law the Reformed Value-Added Tax Act of 2005. The new law required the President to raise the VAT from 10% to 12%, effective February 1, 2006, upon the recommendation of the Philippine Secretary of Finance, if either of two conditions was satisfied: (i) the VAT to GDP ratio in 2005 was more than 2.8%; or (ii) the Government deficit to GDP ratio in 2005 was more than 1.5%. In 2005, the VAT to GDP ratio was 2.9%, while the deficit to GDP ratio was 2.7%. Several opposition
82
頁 166 / 247424(b)(3)
2014/03/12file:///C:/blp/data/CFd424b3.htm

Table of ContentsTable of ContentsTable of ContentsTable of Contents
lawmakers and an association of petroleum dealers filed petitions opposing the implementation of the new law on grounds that the provision in the new law allowing the President to increase the tax rate to 12% from 10% was unconstitutional for being an invalid delegation of legislative power. On September 1, 2005, the Supreme Court upheld the constitutionality of the Reformed Value-Added Tax Act of 2005. The Reformed Value-Added Tax Act of 2005 was implemented on November 1, 2005 and the VAT was raised to 12% effective February 1, 2006. In addition to sales of goods, the VAT is also imposed on all income derived by banks and non-bank financial intermediaries and finance companies, including from financial intermediation services, financial leasing, net foreign exchange gains, net trading gains, certain real estate sales and sales of other properties acquired through foreclosure and sales of goods and properties.
Since 2006, the BIR has implemented the following tax administration improvements:
• settlement of delinquent accounts or disputed assessments which are either being litigated in the courts or being challenged by taxpayers;
• a lateral attrition law, which provides incentives for revenue agencies which exceed their revenue targets for given periods and penalties if they fall short of their targets;
• specialized programs aimed at identification and prosecution of tax evaders, such as the Run After Tax Evaders (“RATES”) program of the BIR and the Run After The Smugglers (“RATS”) program of the BOC;
• use of electronic documentary stamp metering machines to accurately assess and monitor documentary stamp taxes;
• broadening the tax base to increase the number of registered taxpayers, specifically by matching BIR taxpayer records between Government agencies such as the Philippine SEC;
• issuance of revenue regulations regarding automobiles which are subject to excise tax; and
The BIR’s RATES program’s general goal is to effectively raise tax revenues; it is also intended to enhance voluntary taxpayer compliance with the law, provide a deterrent to tax evaders and promote public confidence in the tax collection system. The RATES program seeks to achieve these goals by providing the infrastructure, policy framework and information systems necessary to investigate possible cases of tax evasion and determine instances where prosecution is necessary.
The BOC RATS program focuses on detecting and prosecuting smugglers and other violators of customs and tariff laws that are not detected and acted upon during initial and secondary reviews and screenings by existing BOC programs. The RATS program seeks to achieve its policy objectives by improving external infrastructure and information systems that are used to monitor customs collections, while at the same time internally reviewing the BOC’s organizational integrity to improve its performance as well as public confidence in the customs tax collection system.
Total Government revenues for 2006 were (Peso)979.6 billion, compared to (Peso)816.2 billion for 2005, reflecting a 20.0% increase. BIR collections for 2006 were (Peso)652.7 billion (of which (Peso)641.7 billion were cash revenues), reflecting a 20.3% increase from BIR collections of (Peso)542.7 billion (of which (Peso)535.1 billion were cash revenues) for 2005. BOC collections were (Peso)198.2 billion (of which (Peso)188.5 billion were cash revenues) in 2006, compared to (Peso)154.6 billion for 2005 (of which (Peso)141.7 billion were cash revenues), reflecting a 28.2% increase. Other revenues were (Peso)54.3 billion in 2006, compared to other revenues of (Peso)48.3 billion in 2005. Income from the Bureau of the Treasury was (Peso)74.4 billion in 2006, compared to income of (Peso)70.6 billion for 2005.
Total Government revenues in 2007 were (Peso)1,136.6 billion, compared to (Peso)979.6 billion in 2006, reflecting a 16.0% increase. BIR collections in 2007 were (Peso)713.6 billion (of which (Peso)699.7 billion were cash revenues),
83
• implementing a ceiling on deductible representation expenses as mandated by the Tax Code of 1997.
頁 167 / 247424(b)(3)
2014/03/12file:///C:/blp/data/CFd424b3.htm

Table of ContentsTable of ContentsTable of ContentsTable of Contents
reflecting a 9.3% increase from BIR collections of (Peso)652.7 billion (of which (Peso)641.7 billion were cash revenues) in 2006. BOC collections in 2007 were (Peso)209.4 billion (of which (Peso)193.2 billion were cash revenues), compared to (Peso)198.2 billion in 2006 (of which (Peso)188.5 billion were cash revenues), reflecting a 5.7% increase. Revenues from other offices in 2007 were (Peso)145.7 billion, compared to revenues from other offices of (Peso)54.3 billion in 2006, representing a 168.3% increase. This increase was primarily attributable to the sale of Government assets. Income from the Bureau of the Treasury was (Peso)67.9 billion in 2007, compared to income of (Peso)74.4 billion in 2006, representing an 8.7% decrease.
Total Government revenues in 2008 were (Peso)1,202.9 billion, compared to (Peso)1,136.6 billion in 2007, reflecting a 5.8% increase. Total revenues in 2008 were below the target of (Peso)1,225.2 billion. BIR collections in 2008 were (Peso)778.6 billion (of which (Peso)761.9 billion were cash revenues), reflecting a 9.1% increase from BIR collections of (Peso)713.6 billion (of which (Peso)699.7 billion were cash revenues) in 2007. The Government’s target for BIR collections in 2008 was (Peso)810.0 billion (of which (Peso)794.3 billion was targeted to be in cash). BOC collections were (Peso)260.2 billion (of which (Peso)218.2 billion were cash revenues) in 2008, compared to (Peso)209.4 billion in 2007 (of which (Peso)193.2 billion were cash revenues), reflecting a 24.3% increase. 2008 target for BOC collection was (Peso)274.1 billion, of which (Peso)234.1 billion was targeted in cash. Other revenues were (Peso)100.4 billion in 2008, compared to other revenues of (Peso)145.6 billion in 2007. This represented a decrease of 31.0% from 2007 to 2008. The revenue derived from other offices was also well above the 2008 target of (Peso)9.4 billion set by the Government. Income from the Bureau of the Treasury was (Peso)63.7 billion in 2008, compared to income of (Peso)67.9 billion in 2007, representing a 6.3% decrease. The figure was also above the (Peso)57.3 billion target set by the Government for 2008.
Expenditures
For 2006, total Government expenditures were (Peso)1,044.4 billion (of which (Peso)310.1 billion were interest payments), representing an 8.5% increase from Government expenditures of (Peso)962.9 billion (of which (Peso)299.8 billion were interest payments) for 2005.
In 2007, total Government expenditures were (Peso)1,149.0 billion (of which (Peso)267.8 billion were interest payments), representing a 10.0% increase from Government expenditures of (Peso)1,044.4 billion (of which (Peso)3 10.1 billion were interest payments) in 2006.
In 2008, total Government expenditures were (Peso)1,271.0 billion (of which (Peso)272.2 billion were interest payments), representing a 10.6% increase from Government expenditures of (Peso)1,149.0 billion (of which (Peso)267.8 billion were interest payments) in 2007. Full year target expenditure in 2008 was set at (Peso)1,300.2 billion, of which (Peso)290.1 billion was targeted for interest payments.
The Government Budget
The Budget Process
The Administrative Code of 1987 requires the Government to formulate and implement a national budget. The President submits the budget to Congress within 30 days of the opening of each regular session of Congress, which occurs on the fourth Monday of each July. The House of Representatives reviews the budget and transforms it into a general appropriations bill. The Senate then reviews the budget. A conference committee composed of members of both houses of Congress then formulates a common version of the bill. Once both houses approve the budget, the bill goes to the President for signing as a general appropriations act.
2009 Budget
On March 12, 2009, President Arroyo signed into law Republic Act No. 9524, or the (Peso)1.41 trillion National Expenditure Program for 2009. The 2009 budget is approximately 15.3% or (Peso)188.0 billion higher than the (Peso)1.23
84
頁 168 / 247424(b)(3)
2014/03/12file:///C:/blp/data/CFd424b3.htm

Table of ContentsTable of ContentsTable of ContentsTable of Contents
trillion appropriated for 2008. The budget also includes a (Peso)10.1 billion economic stimulus fund to support the Philippine economy, which is experiencing difficulties as a result of the global economic downturn.
The ten Government agencies with the highest allocations under the 2009 budget compared to their corresponding allocations under the 2008 budget are set out below:
Allocations (in billions)
Agency 2008 2009
(in billions)
Department of Education (Peso)149.2 (Peso)171.5Department of Public Works and Highways 102.4 137.5Department of Interior and Local Government 53.5 63.2Department of National Defense 56.1 61.6Department of Agriculture 25.4 42.6Department of Health 20.3 28.5Department of Transportation and Communication 22.8 24.8Commission on Elections 4.4 16.9Department of Finance 8.1 13.9Department of Environment and Natural Resources 8.5 13.5
(1) Includes allocations for School Building Program.
(2) Includes allocations for AFP Modernization Program.
Under the 2009 budget, the priority sectors are infrastructure, education, health, environment, science and technology. The budget includes housing and salary adjustments for state workers. The economic services allocation increased from 24.4% of the general appropriations or (Peso)299.0 billion in 2008 to 26.8% in the 2009 budget, or (Peso)381.7 billion. Under the 2009 budget, funding for social services accounted for 31.7% of the national allocation or (Peso)452.2 billion, up by 19.8% or (Peso)74.7 billion. Among executive departments, the largest increases in budgetary allocations under the 2009 budget compared to 2008 were the following: the Department of Public Works and Highways with a (Peso)35.1 billion increase; the Department of Education (inclusive of allocations for its School Building Program) with (Peso)22.2 billion increase; the Department of Agriculture (inclusive of allocations for the Agriculture and Fisheries Modernization Program), which received a (Peso)17.1 billion increase; the Department of Interior and Local Government, with (Peso)9.7 billion increase; and Department of Health, whose allocation increased by (Peso)8.2 billion.
2010 Budget
(3) Includes allocations for Agriculture and Fisheries Modernization Program.
On November 9, 2009, the House of Representatives approved the proposed 2010 national budget of (Peso)1.54 trillion. This proposed budget is 8.1% or (Peso)115.0 billion higher than the 2009 budget. The increased budget is designed to allow the Government to complete ongoing infrastructure projects, develop human capital and support agricultural activity. In the proposed 2010 budget, (Peso)340.8 billion is designated for payment of the Republic’s debt service obligations in 2010, which are expected to increase by 34.9% from (Peso)252.6 billion in 2009. The proposed debt service allotment for 2010 includes (Peso)221.2 billion for domestic obligations and (Peso)119.6 billion for foreign obligations. The Department of Education (inclusive of allocations for its School Building Program) received the largest departmental allocation with (Peso)172.8 billion. The Department of Public Works and Highways was allotted (Peso)105.3 billion, 32.3% lower than its (Peso)137.5 billion allotment in 2009 due to the completion of certain infrastructure projects in 2009. The Department of Social Welfare and Development was allotted (Peso)16.4 billion, a 53.3% increase from the (Peso)10.7 billion it was allotted under the 2009 budget. The proposed 2010 budget anticipates a (Peso)233.4 billion budget deficit in 2010, or approximately 2.8% of the Republic’s expected GDP. The proposed budget is now being deliberated upon by the Senate.
85
1
2
3
頁 169 / 247424(b)(3)
2014/03/12file:///C:/blp/data/CFd424b3.htm

Table of ContentsTable of ContentsTable of ContentsTable of Contents
Debt
External Debt
For foreign borrowings by the private sector, Bangko Sentral approval is required if the loans (i) are guaranteed by the public sector; (ii) will be serviced with foreign exchange from the Philippine banking system or (iii) the loans will be obtained by banks for the purpose of re-lending and have maturities of more than one year.
The following table sets out the total outstanding Bangko Sentral-approved and registered external debt.
BANGKO SENTRAL APPROVED EXTERNAL DEBT
Source: Bangko Sentral.
As of December 31,
2004 2005 2006 2007 2008 2009
(in billions, except percentages)
By Maturity:Short-term $ 5,046 $ 6,395 $ 5,009 $ 7,084 $ 7,001 $ 5,753Medium and long-term 49,800 47,791 48,358 47,854 46,855 46,072
Total $54,846 $54,186 $53,367 $54,938 $53,856 $51,825
By Debtor:Banking system $ 9,651 $11,085 $ 9,874 $10,344 $ 8,130 $ 5,779Public sector 31,946 31,588 33,630 34,683 35,466 35,332Private sector 13,250 11,513 9,863 9,911 10,260 10,714
Total $54,846 $54,186 $53,367 $54,938 $53,856 $51,825
By Creditor Type:Multilateral $ 8,440 $ 7,349 $ 7,123 $ 7,708 $ 8,902 $ 8,816Bilateral 16,800 14,282 13,400 13,709 15,418 14,352Banks and financial institutions 11,175 12,899 10,699 10,488 9,040 7,281Bondholders / noteholders 15,839 17,184 18,709 18,562 17,319 17,652Others 2,592 2,472 3,436 4,471 3,177 3,724
Total $54,846 $54,186 $53,367 $54,938 $53,856 $51,825
Ratios:Debt service burden to exports of goods and services 13.8% 13.5% 12.0% 10.1% 9.6 13.4Debt service burden to GNP 7.7% 7.1% 6.4% 4.9% 4.0% 4.8External debt to GNP 58.6% 50.7% 41.9% 35.1% 29.0% 28.9
(1) Debt with original maturity of one year or less.
(2) Classification by debtor is based on the primary obligor under the relevant loan or rescheduling documentation.
(3) Includes public sector debt whether or not guaranteed by the Government; does not include public banks.
(4) This ratio is based on the debt service burden for the relevant period relative to the total exports of goods and receipts from services and income during such period based on the BPM5 framework.
(5) Preliminary data as of June 30, 2009.
Under the EPIRA, the Government was obligated to assume (Peso)200 billion of NPC’s debt. The Government completed the assumption of $3.4 billion and €500 million (amounting to approximately (Peso)200 billion) of NPC’s debt in March 2005.
86
(6) Based on annualized GNP.
(5)
(1)
(2)
(3)
(4)
(6)
頁 170 / 247424(b)(3)
2014/03/12file:///C:/blp/data/CFd424b3.htm

Table of ContentsTable of ContentsTable of ContentsTable of Contents
As of December 31, 2006, the Republic’s outstanding external debt approved by or registered with Bangko Sentral was $53.4 billion, a decrease of $0.8 billion from the $54.2 billion as of December 31, 2005. The decrease in debt was principally due to net repayments made in the year by both bank and non-bank borrowers.
As of December 31, 2007, outstanding external debt of the Republic approved by or registered with Bangko Sentral was $54.9 billion, an increase of $1.6 billion from the $53.4 billion as of December 31, 2006. The increase in debt was mainly attributable to an increase in holdings of Philippine debt by non-residents, as well as upward foreign exchange revaluation adjustments and net loans during the year.
As of December 31, 2008, outstanding external debt of the Republic approved by or registered with Bangko Sentral was $53.9 billion. Transactions during the year resulted in net repayments of $4.3 billion, but the impact of this was substantially offset by upward foreign exchange revaluation adjustments of $3.2 billion, representing the increase in the US dollar value of yen-denominated obligations due to the yen’s appreciation against the US dollar. As a result, the debt stock showed a decline of only $1.0 billion from last year’s $54.9 billion figure. Without the upward revaluation adjustments, external debt would have dropped by $4.3 billion during the year.
As of June 30, 2009, the Republic’s outstanding external debt registered with Bangko Sentral was $51.8 billion, a 3.9% decrease from the $53.9 billion recorded as of December 31, 2008, and a 5.4% decrease from the $54.8 billion recorded as of June 30, 2008. The decrease in external debt in the first six months of 2009 was due to net repayments of approximately $708 million in the first six months of 2009, increased investments by residents in Republic debt and other accounting adjustments. These inflows were offset in part by a $437 million foreign exchange revaluation adjustment resulting from the weakening of the US dollar against other currencies in the period.
As of June 30, 2009, Bangko Sentral-approved medium- and long-term external debt amounted to $46.1 billion. As of the same date, Bangko Sentral-approved short-term external debt amounted to $5.8 billion, equivalent to approximately 3.7% of annualized GDP for the period. Approximately 51.1% of total Bangko Sentral approved external debt (including short-term debt) was denominated in US dollars, 28.5% was denominated in Japanese yen and 20.4% denominated in other currencies. Loans from multilateral agencies such as the World Bank and the ADB accounted for 10.4% of total Bangko Sentral-approved external debt.
Government Financing Initiatives
The following are the major program loans obtained by the Government from January 2003 to November 2009.
87
Program Loan Creditor Amount Date Availed
Power Sector Development Program ADB $ 450 million December 2006Financial Market Regulation and Intermediation Program ADB $ 200 million December 2006Development Policy Loan WB $ 250 million March 2007Power Sector Development Program JBIC $ 300 million March 2007Development Policy Support Program ADB $ 250 million March 2007Local Government Financing and Budget Reform Program ADB $ 300 million December 2007Development Policy Support Program ADB $ 250 million September 2008Philippines National Roads Improvement and Management Program WB $ 232 million May 2008Governance in Justice Sector Reform Program ADB $ 300 million December 2008Global Food Crisis Response Program Development Policy Operation Project WB $ 200 million December 2008Development Policy Support Program ADB $ 250 million September 2009Local Government Financing and Budget Reform Program ADB $ 225 million November 2009
(1) Indicates loan approval date.
(1)
(1)
(1)
(1)
(1)
(1)
(1)
頁 171 / 247424(b)(3)
2014/03/12file:///C:/blp/data/CFd424b3.htm

Table of ContentsTable of ContentsTable of ContentsTable of Contents
Credit Ratings
The following table sets out the changes in the Republic’s long-term foreign currency credit ratings or rating outlooks for the three years preceding the date of this prospectus.
On February 9, 2006, Moody’s affirmed the Republic’s long term foreign and local currency ratings at B1 with a “negative” outlook. Moody’s noted that “while the Philippines has made progress in reducing fiscal deficits, more reform will be needed to bring down the exceptionally high public sector debt to a level that would prompt a change from Moody’s current negative outlook on the Government’s B1 rating”.
On February 9, 2006, Standard & Poor’s upgraded its long-term foreign and local currency ratings outlooks for the Republic from “negative” to “stable” while affirming the existing ratings of BB- and BB+, respectively. Standard and Poor’s noted that “the stable outlook reflects revised expectations concerning the prospects of policy continuity and adherence to fiscal consolidation, which foreshadows improved chances for overall deficit reduction and stabilization of the country’s debt dynamics”.
88
Date Rating Agency Credit Rating or Rating Outlook
February 9, 2006 Moody’s Affirmed at B1 with outlook “negative”
February 9, 2006 Standard & Poor’s Upgraded outlook from “negative” to “stable”
February 13, 2006 Fitch Ratings Upgraded outlook from “negative” to “stable”
August 17, 2006 Fitch Ratings Affirmed at BB with outlook “stable”
November 2, 2006 Moody’s Upgraded outlook from “negative” to “stable”
March 5, 2007 Fitch Ratings Affirmed at BB with outlook “stable”
June 12, 2007 Standard & Poor’s Affirmed at BB- with outlook “stable”
January 25, 2008 Moody’s Upgraded outlook from “stable” to “positive”
April 18, 2008 Standard & Poor’s Affirmed at BB- with outlook “stable”
June 27, 2008 Fitch Ratings Affirmed at BB with outlook “stable”
February 12, 2009 Moody’s Affirmed at B1 with outlook “positive”
May 6, 2009 Fitch Ratings Affirmed at BB with outlook “stable”
July 5, 2009 Standard & Poor’s Affirmed at BB- with outlook “stable”
July 24, 2009 Moody’s Affirmed at Ba3 with outlook “stable”
September 11, 2009 Standard & Poor’s Affirmed at BB- with outlook “stable”
頁 172 / 247424(b)(3)
2014/03/12file:///C:/blp/data/CFd424b3.htm

Table of ContentsTable of ContentsTable of ContentsTable of Contents
On February 13, 2006, Fitch Ratings upgraded its long term foreign and local currency ratings outlooks for the Republic from “negative” to “stable” while affirming the existing ratings of BB and BB+, respectively. Fitch noted that “the good 2005 fiscal performance and 2006 fiscal
outlook, together with a more settled political environment, warrant the change in outlook”. Fitch did, however, also say that the Government should undertake additional fiscal reform measures to prevent downward pressure on the Republic’s credit rating and warned that “political developments could still affect credit worthiness,” citing continuing efforts to revise the Constitution that could displace other legislative initiatives, and a likely revival of the opposition’s efforts to impeach President Arroyo in connection with alleged irregularities in the counting of votes during the May 2004 election. Fitch said renewed impeachment proceedings could cast doubt on the “plausible” tenure of President Arroyo and it said destabilizing political events could reduce tax collection or disrupt financial markets, with possible implications for public debt service. See also “Republic of the Philippines—Government—National Elections and Recent Political Developments”.
On August 17, 2006, Fitch Ratings upgraded its long-term foreign and local currency ratings outlooks for the Republic to “stable” while affirming the existing rating of BB and BB+, respectively. Fitch noted that the upgrade reflected greater liberalization and capital exchange controls in many emerging market economies such as the Republic, the strengthening of monetary and exchange rate regimes, and the deepening integration of such emerging markets in the global economy.
On November 2, 2006, Moody’s upgraded its long-term foreign and local currency outlook for the Republic from “stable” to “positive”. Moody’s cited the Arroyo administration’s efforts in reducing the country’s reliance on foreign currency-denominated debt, as well as easing its debt burden overall as the main reasons for the upgrade. However, Moody’s noted that the Republic would continue to face challenges in the form of political spending pressures ahead of the May 2007 elections.
On March 5, 2007, Fitch Ratings affirmed its long-term foreign and local currency ratings outlooks for the Republic at “stable” while affirming the existing ratings of BB and BB+, respectively. Fitch noted the major fiscal adjustment in the Republic and that “an extended period of restrained spending and the successful implementation of the VAT in 2006 demonstrated the government’s clear commitment to fiscal prudence”. However, Fitch said that it refrained from raising the Republic’s sovereign rating in light of concerns that “Philippine fiscal gains could be at risk without further significant improvements in tax collection to match new spending”. Citing the Republic’s debt to revenue ratio, which was expected to be 371% at year end, Fitch indicated that the Republic’s debt ratio still compared unfavorably with the median of 166% in the BB rating category. Fitch indicated that strong support for Philippine creditworthiness is derived from the Republic’s balance of payments performance, external debt repayment profile and international liquidity position.
On June 12, 2007, Standard & Poor’s affirmed its long-term foreign and local currency ratings outlooks for the Republic at “stable” while affirming the existing ratings of BB-. Standard & Poor’s maintained its rating citing revenue shortfalls due to inefficient tax collection, casting doubt over the administration’s ability to create a fiscal base for attaining its goals.
On January 25, 2008, Moody’s upgraded its long-term foreign and local currency outlook for the Republic from “stable” to “positive” while retaining the ratings at “B1”. Moody’s cited the mutual reinforcement of improved macroeconomic conditions and fiscal performance as the primary reason for the upgrade, as these factors contributed to an improved economic condition and a lower budget deficit. Moody’s also noted that low inflation in the Republic “has anchored inflationary expectations, despite upward pressure from high international food and oil prices”.
On April 18, 2008, Standard & Poor’s affirmed its long-term foreign and local currency ratings outlooks for the Republic at “stable” while affirming the existing ratings of BB-. Standard & Poor’s noted that the rating reflects the country’s improved external liquidity position, which along with fiscal consolidation efforts and a decrease in external borrowing, is resulting in a lower net external debt position. Standard & Poor’s indicated
89
頁 173 / 247424(b)(3)
2014/03/12file:///C:/blp/data/CFd424b3.htm

Table of ContentsTable of ContentsTable of ContentsTable of Contents
that “this is ameliorating one of the key vulnerabilities of the sovereign, given that over 40% of its debt is denominated in foreign currency”. The rating also took into account the continued efforts of the Republic to increase its tax revenues and the Republic’s record of economic growth. However, Standard & Poor’s also noted that “despite these advances, a number of key debt ratios reveal a still-high level of vulnerability to economic shocks or adverse policy shifts than what is generally associated with this rating category”.
On June 27, 2008, Fitch Ratings affirmed its long-term foreign and local currency ratings outlooks for the Republic at “stable” while affirming the existing ratings of BB and BB+ respectively. Fitch highlighted the country’s relatively strong external financial position as the main reason for the stable outlook, explaining that current account surpluses driven by overseas remittances have resulted in an increase in foreign exchange reserves and a reduction in the Republic’s external debt ratios. Fitch retained the view that Philippine public finances are fundamentally weak and stated that “it is critical that the various measures to enhance revenue collection begin to deliver more meaningful results, as spending pressures…mount”.
On February 12, 2009, Moody’s affirmed its long-term foreign and local currency outlook for the Republic at “positive” and affirmed its corresponding ratings at B1. Moody’s reported that the Republic exhibited resiliency during the global financial and economic crises and largely preserved the gains it achieved in its economic, external payments and fiscal fundamentals. In particular, Moody’s cited the stability of the peso as another factor which contributed to the Republic’s improved external payments and debt service capacity.
On May 6, 2009, Fitch Ratings affirmed its long-term foreign and local currency ratings outlook for the Republic at “stable,” while affirming the existing ratings of BB and BB+, respectively. Fitch highlighted the Republic’s strong remittance inflows, manageable external financing requirements and controlled government spending, which resulted in reduction in both the budget deficit and Government debt, as the main reasons for the stable outlook.
On July 5, 2009, Standard & Poor’s affirmed its BB- long-term and B short-term foreign currency sovereign credit ratings for the Republic, as well as the Republic’s BB+ long-term and B short-term local currency sovereign credit ratings. Standard & Poor’s also retained its “stable” outlook for the Republic, indicating that the sovereign ratings are unlikely to change in the short-term, largely due to the Republic’s improving liquidity position, which lessened external liquidity risk despite a challenging external environment.
On July 24, 2009, Moody’s upgraded its long-term foreign and local currency ratings for the Republic to Ba3 from B1, but downgraded its long-term foreign and local currency outlook from “positive” to “stable”. Moody’s reported that the Republic exhibited relative resiliency in its external payments position and showed stability in its financial system. In particular, Moody’s cited the rapid growth in remittance inflows from overseas workers as the primary factor that contributed to the Republic’s improved external payments position.
On September 11, 2009, Standard & Poor’s affirmed its BB- long-term and B short-term foreign currency sovereign credit ratings for the Republic, as well as the Republic’s BB+ long-term and B short-term local currency sovereign credit ratings. Standard & Poor’s also retained its “stable” outlook for the Republic, noting its resilient and improving external liquidity position, against a challenging external environment, as well
as the low likelihood of realization of contingent liabilities posed by the banking system. However, Standard & Poor’s also noted that the outlook may be further adjusted depending on actions by the new administration subsequent to the May 2010 elections.
Public Sector Debt
In January 2005, the Government revised its methodology for reporting public sector debt. Previously, the Department of Finance had reported total public sector debt, comprising the debt of the Government, the Central Bank Board of Liquidators (“CB-BOL”), the Social Security Institutions (“SSIs”), the 14 monitored GOCCs, the GFIs and the Bangko Sentral.
90
頁 174 / 247424(b)(3)
2014/03/12file:///C:/blp/data/CFd424b3.htm

Table of ContentsTable of ContentsTable of ContentsTable of Contents
The Government’s new methodology for determining public sector debt reflects international standards recommended by the IMF’s Government Finance Statistics Manual 2001. Also, the Government now excludes the financial sector from its reported public sector debt to distinguish between financial public sector debt and non-financial public sector debt and to bring its reporting more in line with international practice. The Government has made the following revisions to its public sector debt figures in conformity with the IMF standards:
• Debts of GFIs and Bangko Sentral, which were included in the previously reported public sector debt, are now excluded from public sector debt.
• Intra-sectoral debt holdings, such as Government debt held by the Bond Sinking Fund and GOCC debt held by the Government, are now excluded from public sector debt under the new methodology to avoid double-counting.
• The scope of public sector debt has been expanded to include the debt of local government units.
91
• Levels of outstanding debts of SSIs and GOCCs have been revised to reflect recent updated data from the respective institutions.
頁 175 / 247424(b)(3)
2014/03/12file:///C:/blp/data/CFd424b3.htm

Table of ContentsTable of ContentsTable of ContentsTable of Contents
OUTSTANDING PUBLIC SECTOR DEBT
Source: Fiscal Policy and Planning Office, Department of Finance.
As of December 31,
2004 2005 2006 2007 2008
(in billions, except percentages)
Consolidated nonfinancial public sector debtDomestic (Peso)1,573.7 (Peso)1,826.1 (Peso)1,730.4 (Peso)1,739.0 (Peso)1,888.7Foreign 3,055.1 2,849.3 2,729.2 2,320.0 2,628.5
Total 4,628.8 4,675.4 4,459.6 4,058.9 4,517.2
Financial public corporationsBangko Sentral
Domestic 550.3 604.1 1,014.5 1,548.9 1,640.4Foreign 377.0 288.7 160.0 118.6 162.7
Total 927.3 892.8 1,174.5 1,667.5 1,803.1
GFIsDomestic 246.4 6.8 11.4 42.0 11.1Foreign 157.8 151.5 140.5 133.2 166.6
Total 404.1 158.3 151.9 175.1 177.7
Domestic 796.7 610.9 1,025.9 1,590.9 1,651.5Foreign 534.8 440.3 300.5 251.8 329.3
Total 1,331.5 1,051.1 1,326.4 1,842.6 1,980.8
Less: Intrasector-debt holdingsDomestic
Government securities held by GFIs and BSP 314.2 280.4 344.9 475.9 447.4Government deposits at BSP 60.3 85.3 108.5 167.4 141.9Government/GOCCs deposits at GFIs 130.0 155.5 180.5 206.8 262.6SSI’s deposits held by BSP 0.0 0.0 0.0 0.0 0.0GFIs deposits at BSP 14.2 16.1 19.7 79.5 168.3GOCC deposits at BSP 5.3 1.5 1.4 22.4 2.0GOCC loans/other debt held by GSP 0.0 0.0 0.0 0.0 0.0GOCC loans/other debt held by GFIs 26.6 37.1 56.0 47.4 50.8GFIs loans/other debt held by BSP 81.0 73.4 82.3 69.8 72.6Local governments debt held by GFIs 38.9 42.4 49.1 58.9 58.3
Total 670.4 691.6 842.4 1,128.0 1,203.9
ForeignGovernments securities held by BSP 0.7 1.1 0.0 0.0 22.7
Total 671.1 692.7 842.4 1,128.0 1,226.6
Total public sectorDomestic 1,700.0 1,745.4 1,913.9 2,201.8 2,336.3Foreign 3,589.2 3,288.5 3,029.7 2,571.8 2,935.1
Total (Peso)5,289.2 (Peso)5,033.9 (Peso)4,943.6 (Peso)4,773.6 (Peso)5,271.4
(1) The consolidated public sector comprises the general government sector, nonfinancial public corporations, and financial public corporations, after elimination of intra-debt holdings among these sectors.
92
(2) Comprises all liabilities of Bangko Sentral (including currency issues) except for the following: Allocation of SDRs and Revaluation of International Reserves.
(1)
(2)
頁 176 / 247424(b)(3)
2014/03/12file:///C:/blp/data/CFd424b3.htm

Table of ContentsTable of ContentsTable of ContentsTable of Contents
The following table presents the Republic’s consolidated nonfinancial public sector debt.
OUTSTANDING CONSOLIDATED NONFINANCIAL
PUBLIC SECTOR DEBT
Source: Fiscal Policy and Planning Office, Department of Finance.
As of December 31,
2004 2005 2006 2007 2008
(in billions, except percentages)
Total (Peso)4,628.8 (Peso)4,675.4 (Peso)4,459.6 (Peso)4,058.9 (Peso)4,517.2Domestic 1,573.7 1,826.1 1,730.4 1,739.0 1,888.7Foreign 3,055.1 2,849.3 2,729.2 2,320.0 2,628.5
National government 3,812.0 3,888.2 3,851.5 3,712.5 4,220.9Domestic 2,001.2 2,164.3 2,154.1 2,201.2 2,414.4Foreign 1,810.7 1,723.9 1,697.4 1,511.3 1,806.5
Nonfinancial public corporations (14 GOCC’s) 1,546.1 1,573.5 1,450.7 1,212.6 1,308.2Domestic 301.4 460.1 417.9 398.2 480.6Foreign 1,244.7 1,113.4 1,032.8 814.4 827.7
CB-BOL 48.5 39.0 7.6 1.6 1.7Domestic 0.0 0.0 0.0 0.0 0.0Foreign 48.5 39.0 7.6 1.6 1.7
Social Security Institutions (SSIs) 7.1 0.0 0.0 0.0 0.0Domestic 7.1 0.0 0.0 0.0 0.0Foreign 0.0 0.0 0.0 0.0 0.0
Local government units (LGUs) 49.2 55.0 63.7 73.5 73.6Domestic 49.2 55.0 63.7 73.5 73.6Foreign 0.0 0.0 0.0 0.0 0.0
Less: Government debt held by Bond Sinking Fund 414.9 467.5 511.3 534.4 615.8Domestic 411.8 463.6 507.5 530.9 613.0Foreign 3.1 3.9 3.8 3.4 2.8
Intra-sector-debt holdings (domestic) 373.5 389.6 397.8 403.0 466.9Government debt held by SSIs 131.5 153.9 176.0 176.0 248.6Government debt held by LGUs 0.9 1.4 0.8 0.4 0.0Government debt held by GOCCs 102.9 118.4 118.5 138.2 145.7Onlending from national government to
GOCCs 122.3 101.6 89.9 77.6 72.6Onlending from GOCC to GOCC 15.9 14.3 12.6 10.8 0.0
Intra-sector-debt holdings (external) 45.7 23.2 4.8 4.0 4.6GOCCs debt held by national
Government 45.7 23.2 4.8 4.0 4.6Total (as % of GDP) 95.0% 85.9% 73.9% 61.1% 60.9%
Domestic (as % of GDP) 32.3% 33.5% 28.7% 26.2% 25.4% Foreign (as % of GDP) 62.7% 52.3% 45.3% 34.9% 35.4%
(1) The consolidated nonfinancial public sector comprises the general government sector and nonfinancial public corporations. The consolidated nonfinancial public sector does not include financial public corporations.
(2) Government debt under the revised methodology excludes contingent obligations. Data prior to 2002 excludes LGU debt and are therefore not strictly comparable with data from 2002 onwards.
(3) Excluding “reserve liabilities” (insurance technical reserves). Debt of the Employees Compensation Commission is not included.
93
(4) Including Securities Stabilization Fund.
(1)
(2)
(3)
(4)
頁 177 / 247424(b)(3)
2014/03/12file:///C:/blp/data/CFd424b3.htm

Table of ContentsTable of ContentsTable of ContentsTable of Contents
As of December 31, 2006, the outstanding public sector debt was (Peso)4.9 trillion, equivalent to 82.0% of the Republic’s GDP compared with a public sector debt-to-GDP ratio of 92.5% as of December 31, 2005. The level of outstanding public sector debt as of December 31, 2006 was a 1.8% decrease from debt of (Peso)5.0 trillion as of December 31, 2005. Total domestic debt increased by 9.7% from (Peso)1.7 trillion as of December 31, 2005 to (Peso)1.9 trillion as of December 31, 2006. Total foreign debt decreased by 7.9% from (Peso)3.3 trillion as of December 31, 2005 to (Peso)3.0 trillion as of December 31, 2006.
As of December 31, 2007, the outstanding public sector debt was (Peso)4.8 trillion, equivalent to 71.8% of the Republic’s GDP compared with a public sector debt-to-GDP ratio of 82.0% as of December 31, 2006. The level of outstanding public sector debt as of December 31, 2007 was a 3.4% decrease from debt of (Peso)4.9 trillion as of December 31, 2006. Total domestic debt increased by 15.0% from (Peso)1.9 trillion as of December 31, 2006 to (Peso)2.2 trillion as of December 31, 2007. Total foreign debt decreased by 15.1% from (Peso)3.0 trillion as of December 31, 2006 to (Peso)2.6 trillion as of December 31, 2007.
As of December 31 2008, preliminary data indicated that total outstanding Government debt was (Peso)5.3 trillion, an increase of 10.4% from the (Peso)4.8 trillion as of December 31, 2007. Total domestic debt increased by 6.1% from (Peso)2.2 trillion as of December 31, 2007 to (Peso)2.3 trillion as of December 31, 2008. Total foreign debt increased by 14.1% from (Peso)2.6 trillion as of December 31, 2007 to (Peso)2.9 trillion as of December 31, 2008.
As of August 31, 2009, preliminary data indicated that total outstanding Government debt was recorded at (Peso)4.2 trillion, an increase of 5.1% from the total debt of (Peso)4.0 trillion as of August 31, 2008. Of the total outstanding Government debt as of August 31, 2009, domestic debt comprised (Peso)2.3 trillion, a 2.1% decrease from domestic debt of (Peso)2.4 trillion as of August 31, 2008. As of August 31, 2009, foreign currency-denominated debt comprised (Peso)1.9 trillion, an increase of 15.4% from the (Peso)1.7 trillion recorded as of August 31, 2008. The overall increase in Government debt is attributable to increased borrowings by the Government to fund the targeted budget deficit of (Peso)250.0 billion in 2009.
Direct Debt of the Republic
The following table summarizes the outstanding direct debt of the Republic as of the dates indicated.
OUTSTANDING DIRECT DEBT OF THE REPUBLIC
Source: Bureau of the Treasury, Department of Finance.
As of December 31,
2004 2005 2006 2007 2008 2009
(in millions)
Medium/long-term debtDomestic (Peso)1,423,638 (Peso)1,526,688 (Peso)1,492,031 (Peso)1,587,042 (Peso)1,644,094 (Peso)1,816,790External $ 32,191 $ 32,466 $ 34,571 $ 36,330 $ 38,111 $ 40,214
Short-term debtDomestic (Peso) 577,583 (Peso) 637,605 (Peso) 662,047 (Peso) 614,125 (Peso) 770,334 (Peso) 607,412
Total debt (Peso)3,811,954 (Peso)3,888,231 (Peso)3,851,506 (Peso)3,712,487 (Peso)4,220,903 (Peso)4,338,411
(1) Includes Government debt that is on-lent to Government-owned corporations and other public sector entities. Excludes debt guaranteed by the Government and debt originally guaranteed by other public sector entities for which the guarantee has been assumed by the Government. The table reflects debt of the Government only and does not include any other public sector debt.
(2) Amounts in original currencies were converted to US dollars or pesos, as applicable, using Bangko Sentral’s reference exchange rates at the end of each period.
94
(3) Preliminary data as of September 30, 2009. On October 16, 2009, the Republic issued $1.0 billion in 6.375% bonds due 2034.
(1)(2)
(3)
(4)
(5)
(6)
頁 178 / 247424(b)(3)
2014/03/12file:///C:/blp/data/CFd424b3.htm

Table of ContentsTable of ContentsTable of ContentsTable of Contents
(4) Debt with original maturities of one year or longer.
(5) The Government issued an additional $500 million in external debt since December 31, 2007.
Direct Domestic Debt of the Republic
(6) Debt with original maturities of less than one year.
The following table summarizes the outstanding direct domestic debt of the Republic as of the dates indicated.
OUTSTANDING DIRECT DOMESTIC DEBT OF THE REPUBLIC
Source: Bureau of the Treasury, Department of Finance.
As of December 31,
2004 2005 2006 2007 2008 2009
(in millions)
LoansDirect (Peso) 28,300 (Peso) 27,852 (Peso) 20,085 (Peso) 20,079 (Peso) 13,586 (Peso) 6,997Assumed 2,294 2,294 2,294 2,294 2,294 2,294
Total loans 30,594 30,147 22,379 22,373 15,880 9,291Securities
Treasury bills 577,583 637,605 662,047 614,125 770,334 607,412Treasury notes/bonds 1,393,043 1,496,541 1,469,652 1,564,669 1,628,214 1,807,499
Total securities 1,970,626 2,134,147 2,131,699 2,178,794 2,398,548 2,414,911
Total debt (Peso)2,001,220 (Peso)2,164,293 (Peso)2,154,078 (Peso)2,201,167 (Peso)2,414,428 (Peso)2,424,202
(1) Includes Government debt that is on-lent to Government-owned corporations and other public sector entities. Excludes debt guaranteed by the Government and debt originally guaranteed by other public sector entities for which the guarantee has been assumed by the Government. The table reflects debt of the Government only, and does not include any other public sector debt.
(2) Amounts in original currencies were converted to US dollars or pesos, as applicable, using Bangko Sentral’s reference exchange rates at the end of each period.
The following table sets out the direct domestic debt service requirements of the Republic for the years indicated.
DIRECT DOMESTIC DEBT SERVICE REQUIREMENTS OF THE REPUBLIC
95
(3) Preliminary data as of September 30, 2009. On October 16, 2009, the Republic issued $1.0 billion in 6.375% bonds due 2034.
YearPrincipal
RepaymentsInterest
Payments Total
(in millions)
2004 (Peso)222,406 (Peso)169,997 (Peso)392,403 $ 6,9762005 253,492 190,352 443,844 8,3592006 262,598 212,194 474,792 8,4782007 284,004 157,220 441,224 9,5612008 264,666 183,690 448,356 9,9632009 290,031 188,557 478,588 9,7672010 271,486 221,230 492,716 10,0552011 270,377 255,994 526,371 10,7422012 291,123 297,270 588,393 12,008
(1)(2)
(3)
(1)
(2)
(3)
(3)
(3)
(3)
頁 179 / 247424(b)(3)
2014/03/12file:///C:/blp/data/CFd424b3.htm

Table of ContentsTable of ContentsTable of ContentsTable of Contents
Source: Bureau of the Treasury, Department of Finance.
(1) Excludes debt service in respect of Government debt that is on-lent to Government-owned corporations and other public sector entities guaranteed by the Government and debt originally guaranteed by other public sector entities for which the guarantee has been assumed by the Government. The table reflects debt of the Government only, and does not include any other public sector debt.
(2) For 2001 to 2008, amounts in pesos were converted to US dollars using the applicable Bangko Sentral reference exchange rates at the end of each period. For 2009 through 2012, amounts in pesos were converted to US dollars using an exchange rate of (Peso)49.00 per US Dollar.
Direct External Debt of the Republic
(3) Projected, based on debt outstanding as of December 31, 2008.
The following table summarizes the outstanding external direct debt of the Republic as of the dates indicated.
OUTSTANDING DIRECT EXTERNAL DEBT OF THE REPUBLIC
Source: Bureau of the Treasury, Department of Finance
As of December 31,
2004 2005 2006 2007 2008 2009
(in billions)
LoansMultilateral $ 4,581 $ 4,482 $ 5,017 $ 5,439 $ 5,855 $ 6,634Bilateral 9,503 8,248 8,036 8,510 10,069 9,914Commercial 971 582 705 802 818 904
Total loans 15,055 13,312 13,758 14,751 16,741 17,452Securities
Eurobonds 1,775 1,392 1,512 1,682 1,604 948Brady Bonds 846 774 126 0 0 0Yen Bonds 825 424 420 440 550 555Notes 0 0 0 0 0 0Global Bonds 13,064 16,314 18,754 19,456 19,216 21,260T-Bills 625 250 0 0 0 0
Total securities 17,135 19,154 20,813 21,578 21,370 22,762
Total $ 32,190 $ 32,466 $ 34,571 $ 36,329 $ 38,111 $ 40,214
(1) Includes Government debt that is on-lent to Government-owned corporations and other public sector entities. Excludes debt guaranteed by the Government and debt originally guaranteed by other public sector entities for which the guarantee has been assumed by the Government. The table reflects debt of the Government only, and does not include any other public sector debt.
(2) Amounts in original currencies were converted to US dollars using the applicable Bangko Sentral reference exchange rates at the end of each period.
96
(3) Preliminary data as of September 30, 2009. On October 16, 2009, the Republic issued $1.0 billion in 6.375% bonds due 2034.
(1)(2)
(3)
頁 180 / 247424(b)(3)
2014/03/12file:///C:/blp/data/CFd424b3.htm

Table of ContentsTable of ContentsTable of ContentsTable of Contents
The following table sets out, by designated currency and the equivalent amount in US dollars, the outstanding direct external debt of the Republic as of September 30, 2009.
SUMMARY OF OUTSTANDING DIRECT EXTERNAL DEBT BY THE REPUBLIC BY CURRENCY
(as of September 30, 2009)
Source: Bureau of the Treasury, Department of Finance.
Amount inOriginalCurrency
EquivalentAmount in
US dollars% ofTotal
(in millions, unless otherwise indicated, except percentages)
US Dollar 26,295 26,295 65.39% Japanese Yen 928,930 10,309 25.64European Currency Unit 1,337 1,950 4.85Special Drawing Rights 693 1,093 2.72French Franc 464 103 0.26Austrian Schilling 1,233 131 0.32China Yuan 1,199 176 0.44Swiss Franc 50 49 0.12Deutsche Mark 65 48 0.12Korean Won 27,477 23 0.06Belgian Franc 352 13 0.03Kuwait Dinar 3 12 0.03Pound Sterling 6 9 0.02Italian Lire 2,422 2 0.0Danish Kroner 4 1 0.0Saudi Riyal 3 1 0.0Canadian Dollar 1 1 0.0
Total 40,214 100.00%
(1) Includes Government debt that is on-lent to Government-owned corporations and other public sector entities. Excludes debt guaranteed by the Government and debt originally guaranteed by other public sector entities for which the guarantee has been assumed by the Government. The table reflects debt of the Government only, and does not include any other public sector debt.
97
(2) Amounts in original currencies were converted to US dollars using the applicable Bangko Sentral reference exchange rates as of September 30, 2009.
(1)
(2)
頁 181 / 247424(b)(3)
2014/03/12file:///C:/blp/data/CFd424b3.htm

Table of ContentsTable of ContentsTable of ContentsTable of Contents
The following table sets out the direct external debt service requirements of the Republic for the years indicated.
DIRECT EXTERNAL DEBT SERVICE REQUIREMENTS OF THE REPUBLIC
Source: Bureau of the Treasury, Department of Finance.
YearPrincipal
RepaymentsInterest
Payments Total
(in millions)
2004 $ 2,104 $ 1,616 $3,7202005 2,242 2,061 4,3042006 2,126 2,282 4,4092007 1,349 2,396 3,7452008 1,807 2,365 4,1712009 2,068 2,504 4,5722010 2,732 2,440 5,1732011 3,431 2,345 5,7762012 1,510 2,377 3,888
(1) Excludes debt service in respect of Government debt that is on-lent to Government-owned corporations and other public sector entities or guaranteed by the Government, other than debt originally guaranteed by other public sector entities for which the guarantee has been assumed by the Government. The table reflects debt of the Government only, and does not include any other public sector debt.
(2) For 2003 through 2008, amounts in original currencies were converted to US dollars using the applicable Bangko Sentral reference exchange rates prevailing on the date of payment. For 2009 through 2012, amounts in original currencies were converted to US dollars using an exchange rates of US$1.00=(Peso)49.00.
Government Guaranteed Debt
(3) Projected, based on debt outstanding as of December 31, 2008.
The following table sets out all Republic guarantees of indebtedness, including guarantees assumed by the Government, as of the dates indicated.
SUMMARY OF OUTSTANDING GUARANTEES OF THE REPUBLIC
Source: Bureau of the Treasury, Department of Finance.
As of December 31,
2004 2005 2006 2007 2008 2009
(in millions, unless otherwise indicated)
Domestic (Peso)33,135 (Peso)48,183 (Peso)72,113 (Peso)64,968 (Peso)72,904 (Peso)89,023External $ 14,232 $ 10,135 $ 10,139 $ 10,077 $ 9,972 $ 10,299
Total $ 12,120
(1) Includes debt originally guaranteed by the Government and debt guaranteed by other public sector entities for which the guarantee has been assumed by the Government.
(2) Amounts in original currencies were converted to US dollars or pesos, as applicable, using Bangko Sentral’s reference exchange rates at the end of each period.
98
(3) Preliminary data as of September 30, 2009.
(1)(2)
(3)
(3)
(3)
(3)
(3)
(1)(2)
(3)
頁 182 / 247424(b)(3)
2014/03/12file:///C:/blp/data/CFd424b3.htm

Table of ContentsTable of ContentsTable of ContentsTable of Contents
Payment History of Foreign Debt
In early 1985 and in 1987, the Government rescheduled principal maturities of most medium- and long-term liabilities owed to commercial bank creditors due between October 1983 and December 1992. The Philippines normalized its relationship with foreign bank creditors in 1992 after issuing Brady Bonds in exchange for its commercial bank debt.
The Philippines rescheduled portions of its obligations to official creditors, such as foreign Governments and their export credit agencies, five times between 1984 and 1994 as follows.
In December 1994, the Government decided not to avail itself of the July 1994 rescheduling agreement to accelerate the country’s graduation from rescheduling country status. As of June 30, 1999, the Republic’s rescheduled obligations with its bilateral creditors amounted to $2.2 billion, with Japan at $1.2 billion and the United States at $506 million having the largest exposures.
In addition to debt restructuring, the Republic has engaged in debt buyback, debt-to-equity, debt-for-debt, debt-for-nature and other debt reduction arrangements to reduce its debt by at least $6.0 billion. The Republic intends to maintain various efforts to manage its debt portfolio to improve yield and maturity profiles. The Republic may utilize proceeds from debt issues for the purpose of repurchasing outstanding debt through a variety of methods, including public auctions and repurchases of debt securities in the open markets.
While there have been a number of reschedulings of the Republic’s debt to its bilateral creditors in the past few years, the Republic has not defaulted on, and has not attempted to restructure, the payment of principal or interest on any of its external securities in the last 20 years.
In 1992, the Philippines issued approximately $3.3 billion of Brady Bonds, maturing between 2007 and 2018, in exchange for commercial bank debt, and secured, as to repayment of principal at stated maturity, $1.9 billion of the bonds with zero coupon bonds purchased by the Republic in the open market. Cash and short-term investment grade securities deposited with the Federal Reserve Bank of New York, as collateral agent, secured the payment of approximately 12 to 14 months of interest on $1.6 billion of the Brady Bonds. From 1996 to 2004, through a series of transactions, the Republic exchanged the outstanding Brady Bonds for newly-issued or reopened bonds. Completion of the exchange offerings generated significant savings in debt service and the partial release of US Treasury securities held as collateral. In 2006, the Republic redeemed the outstanding balance of the Brady Bonds and all of the remaining collateral was released.
On September 4, 2006, the Republic completed a domestic exchange offer, offering new 10-year bonds in exchange for various series of outstanding peso-denominated debt. In this offer, a 9.125% September 2016 Bond was issued in an aggregate principal amount of approximately (Peso)58.0 billion. A total of approximately (Peso)54.0 billion in eligible bonds were accepted and cancelled as part of the offer.
On September 16, 2006, the Republic exchanged its outstanding 7.50% Bonds due 2007, 8.875% Bonds due 2008, 8.375% Global Bonds due 2009, 9.875% Global Bonds due 2010, 9.00% Global Bonds due 2013, 8.25% Global Bonds due 2014, 8.875% Global Bonds due 2015, 8.75% Fixed Rate Bonds due October 2016, 9.375%
99
Date of Rescheduling AgreementRescheduled
Amount
New Maturity(From Date ofReschedulingAgreement) Grace Period
December 1984 $896 million 10 years 5 yearsJanuary 1987 $1.1 billion 10 years 5.5 yearsMay 1989 $1.8 billion 8.5 years 5 yearsJune 1991 $1.5 billion 15-20 years 6.5 yearsJuly 1994 $498 million 15-20 years 8-10 years
(1) Not implemented. See discussion in following paragraph.
(1)
頁 183 / 247424(b)(3)
2014/03/12file:///C:/blp/data/CFd424b3.htm

Table of ContentsTable of ContentsTable of ContentsTable of Contents
Global Bonds due 2017 and 9.875% Bonds due 2019 for newly issued US Dollar Amortizing Global Bonds due 2024 (the “Amortizing Bonds”), and its 9.50% US Dollar-Denominated Global Bonds due 2024 and 10.625% Global Bonds due 2025 for reopened 7.75% Global Bonds due 2031 (the “Reopened Bonds”). The Republic issued approximately $1.2 billion aggregate principal amount of new bonds, including approximately $764 million aggregate principal amount of Amortizing Bonds and approximately $435 million aggregate principal amount of Reopened Bonds pursuant to the invitation, and approximately $10 million aggregate principal amount of Amortizing Bonds for cash.
The following table sets out the foreign currency bonds issued by the Republic.
FOREIGN CURRENCY BONDS ISSUED BY THE REPUBLIC
Source: Bureau of the Treasury, Department of Finance.
OutstandingBalance as of
Issue Date
OutstandingBalance as of
September 30, 2009
(in millions)
Global bonds $ 25,168 $ 21,260Euro Bonds 2,427 948Japanese Yen Bonds 1,387 555
Total foreign bonds $ 34,290 $ 22,762
(1) Preliminary data as of September 30, 2009. On October 16, 2009, the Republic issued $1.0 billion in 6.375% bonds due 2034.
100
(2) Yen- and Euro-denominated bonds were converted to US dollars using Bangko Sentral’s reference exchange rate as of September 30, 2009 of US$1.00=(Peso)47.59.
(1)
(2)
(2)
頁 184 / 247424(b)(3)
2014/03/12file:///C:/blp/data/CFd424b3.htm

Table of ContentsTable of ContentsTable of ContentsTable of Contents
DESCRIPTION OF THE SECURITIES
Description of the Debt Securities
The Philippines may issue debt securities in separate series at various times. Each series of the debt securities will be issued pursuant to a fiscal agency agreement (each, as applicable to a series of debt securities, the “Fiscal Agency Agreement”). The description below summarizes the material provisions of the debt securities that are common to all series and the Fiscal Agency Agreement. Since it is only a summary, the description may not contain all of the information that is important to you as a potential investor in the debt securities. Therefore, the Philippines urges you to read the form of the Fiscal Agency Agreement and the form of global bond before deciding whether to invest in the debt securities. The Philippines has filed a copy of these documents with the Securities and Exchange Commission as exhibits to the registration statement of which this prospectus is a part. You should refer to such exhibits for more complete information.
The financial terms and other specific terms of your debt securities are described in the prospectus supplement relating to your debt securities. The description in the prospectus supplement will supplement this description or, to the extent inconsistent with this description, replace it.
You can find the definitions of certain capitalized terms in the subsection titled “Glossary of Certain Defined Terms” located at the end of this section.
General Terms of the Bonds
The prospectus supplement that relates to your debt securities will specify the following terms:
• The aggregate principal amount and the designation;
• The currency or currencies or composite currencies of denomination and payment;
• Any limitation on principal amount and authorized denominations;
• The percentage of their principal amount at which the debt securities will be issued;
• The maturity date or dates;
• The interest rate or rates, if any, for the debt securities and, if variable, the method by which the interest rate or rates will be calculated;
• Whether any amount payable in respect of the debt securities will be determined based on an index or formula, and how any such amount will be determined;
• The dates from which interest, if any, will accrue for payment of interest and the record dates for any such interest payments;
• Where and how the Philippines will pay principal and interest;
• Whether and in what circumstances the debt securities may be redeemed before maturity;
• Any sinking fund or similar provision;
• Whether any part or all of the debt securities will be in the form of a global security and the circumstances in which a global security is exchangeable for certificated securities;
• If issued in certificated form, whether the debt securities will be in bearer form with interest coupons, if any, or in registered form without interest coupons, or both forms, and any restrictions on exchanges from one form to the other; and
101
• Whether the debt securities will be designated “Collective Action Securities” (as described below under “Collective Action Securities”).
頁 185 / 247424(b)(3)
2014/03/12file:///C:/blp/data/CFd424b3.htm

Table of ContentsTable of ContentsTable of ContentsTable of Contents
If the Philippines issues debt securities at an original issue discount, in bearer form or payable in a currency other than the US dollar, the prospectus supplement relating to the debt securities will also describe applicable US federal income tax and other considerations additional to the disclosure in this prospectus.
Payments of Principal, Premium and Interest
On every payment date specified in the relevant prospectus supplement, the Philippines will pay the principal, premium and/or interest due on that date to the registered holder of the relevant debt security at the close of business on the related record date. The record date will be specified in the applicable prospectus supplement. The Philippines will make all payments at the place and in the currency set out in the prospectus supplement. Unless otherwise specified in the relevant prospectus supplement or the debt securities, the Philippines will make payments in US dollars at the New York office of the fiscal agent or, outside the United States, at the office of any paying agent. Unless otherwise specified in the applicable prospectus supplement, the Philippines will pay interest by check, payable to the registered holder.
If the relevant debt security has joint holders, the check will be payable to all of them or to the person designated by the joint holders at least three business days before payment. The Philippines will mail the check to the address of the registered holder in the bond register and, in the case of joint holders, to the address of the joint holder named first in the bond register.
The Philippines will make any payment on debt securities in bearer form at the designated offices or agencies of the fiscal agent, or any other paying agent, outside of the United States. At the option of the holder of debt securities, the Philippines will pay by check or by transfer to an account maintained by the payee with a bank located outside of the United States. The Philippines will not make payments on bearer securities at the corporate trust office of the fiscal agent in the United States or at any other paying agency in the United States. In addition, the Philippines will not make any payment by mail to an address in the United States or by transfer to an account with a bank in the United States, Nevertheless, the Philippines will make payments on a bearer security denominated and payable in US dollars at an office or agency in the United States if:
• payment outside the United States is illegal or effectively precluded by exchange controls or other similar restrictions; and
If the Philippines issues bearer securities, it will designate the offices of at least one paying agent outside the United States as the location for payment.
Repayment of Funds; Prescription
• the payment is then permitted under United States law, without material adverse consequences to the Philippines.
If no one claims money paid by the Philippines to the fiscal agent for the payment of principal or interest for two years after the payment was due and payable, the fiscal agent or paying agent will repay the money to the Philippines. After such repayment, the fiscal agent or paying agent will not be liable with respect to the amounts so repaid. However, the Philippines’ obligations to pay the principal of, and interest on, the debt securities as they become due will not be affected by such repayment.
You will not be permitted to submit a claim to the Philippines for payment of principal or interest on any series of debt securities unless made within ten years, in the case of principal, and five years, in the case of interest, from the date on which payment was due.
Global Securities
The prospectus supplement relating to a series of debt securities will indicate whether any of that series of debt securities will be represented by a global security. The prospectus supplement will also describe any unique
102
頁 186 / 247424(b)(3)
2014/03/12file:///C:/blp/data/CFd424b3.htm

Table of ContentsTable of ContentsTable of ContentsTable of Contents
specific terms of the depositary arrangement with respect to that series. Unless otherwise specified in the prospectus supplement, the Philippines anticipates that the following provisions will apply to depositary arrangements.
Registered Ownership of the Global Security. The global security will be registered in the name of a depositary identified in the prospectus supplement, or its nominee, and will be deposited with the depositary, its nominee or a custodian. The depositary, or its nominee, will therefore be considered the sole owner or holder of debt securities represented by the global security for all purposes under the Fiscal Agency Agreement. Except as specified below or in the applicable prospectus supplement, beneficial owners:
• will not be entitled to have any of the debt securities represented by the global security registered in their names;
• will not receive physical delivery of any debt securities in definitive form;
• will not be considered the owners or holders of the debt securities;
• must rely on the procedures of the depositary and, if applicable, any participants (institutions that have accounts with the depositary or a nominee of the depositary, such as securities brokers and dealers) to exercise any rights of a holder of the debt securities; and
The Philippines understands that, under existing industry practice, the depositary and participants will allow beneficial owners to take all actions required of, and exercise all rights granted to, the registered holders of the debt securities.
The Philippines will issue certificated securities and register debt securities in the name of a person other than the depositary or its nominee only if:
• will receive payments of principal and interest from the depositary or its participants rather than directly from the Philippines.
• the depositary for a series of debt securities is unwilling or unable to continue as depositary or ceases to be a clearing agency registered under the United States Securities Exchange Act of 1934, as amended, and the Philippines does not appoint a successor depositary within 90 days;
• the Philippines determines, in its sole discretion, not to have a series of debt securities represented by a global security; or
In these circumstances, an owner of a beneficial interest in a global security will be entitled to registration of a principal amount of debt securities equal to its beneficial interest in its name and to physical delivery of the debt securities in definitive form. Definitive debt securities in bearer form will not be issued in respect of a global security in registered form.
Beneficial Interests in and Payments on a Global Security. Only participants, and persons that may hold beneficial interests through participants, can own a beneficial interest in the global security. The depositary keeps records of the ownership and transfer of beneficial interests in the global security by its participants. In turn, participants keep records of the ownership and transfer of beneficial interests in the global security by other persons (such as their customers). No other records of the ownership and transfer of beneficial interests in the global security will be kept.
All payments on a global security will be made to the depositary or its nominee. When the depositary receives payment of principal or interest on the global security, the Philippines expects the depositary to credit its participants’ accounts with amounts that correspond to their respective beneficial interests in the global security.
103
• a default occurs that entitles the holders of the debt securities to accelerate the maturity date and such default has not been cured.
頁 187 / 247424(b)(3)
2014/03/12file:///C:/blp/data/CFd424b3.htm

Table of ContentsTable of ContentsTable of ContentsTable of Contents
The Philippines also expects that, after the participants’ accounts are credited, the participants will credit the accounts of the owners of beneficial interests in the global security with amounts that correspond to the owners’ respective beneficial interests in the global security.
The depositary and its participants establish policies and procedures governing payments, transfers, exchanges and other important matters that affect owners of beneficial interests in a global security. The depositary and its participants may change these policies and procedures from time to time. The Philippines has no responsibility or liability for the records of ownership of beneficial interests in the global security, or for payments made or not made to owners of such beneficial interests. The Philippines also has no responsibility or liability for any aspect of the relationship between the depositary and its participants or for any aspect of the relationship between participants and owners of beneficial interests in the global security.
Bearer Securities. The Philippines may issue debt securities of a series in the form of one or more bearer global debt securities deposited with a common depositary for the Euroclear System and Clearstream Banking, société anonyme, or with a nominee identified in the applicable prospectus supplement. The specific terms and procedures, including the specific terms of the depositary arrangement, with respect to any portion of a series of debt securities to be represented by a bearer global security will be described in the applicable prospectus supplement.
Additional Amounts
The Philippines will make all payments on the debt securities without withholding or deducting any present or future taxes imposed by the Philippines or any of its political subdivisions, unless required by law. If Philippine law requires the Philippines to deduct or withhold taxes, it will pay the holders of the debt securities such additional amounts as are necessary to ensure that they receive the same amount as they would have received without such withholding or deduction.
The Philippines will not pay, however, any additional amounts if the holder of the debt securities is liable for Philippine tax because:
• the holder of the debt securities is connected with the Philippines other than by merely owning the debt security or receiving income or payments on the bond; or
• the holder of the debt securities failed to comply with any reasonable certification, identification or other reporting requirement concerning the holder’s nationality, residence, identity or connection with the Philippines, if compliance with such requirement is required by any statute or regulation of the Philippines as a precondition to exemption from withholding or deduction of taxes; or
Status of Bonds
• the holder of the debt securities failed to present its debt security for payment within 30 days of when the payment is due or when the Philippines makes available to the holder of the debt securities or the relevant fiscal or paying agent a payment of principal or interest, whichever is later. Nevertheless, the Philippines will pay additional amounts to the extent the holder would have been entitled to such amounts had it presented its debt security for payment on the last day of the 30 day period.
While outstanding, the debt securities will:
• constitute direct, unconditional and unsecured obligations of the Philippines;
• rank at least equally in right of payment with all of the Philippines’ other unsecured and unsubordinated External Indebtedness, except as described below; and
104
• continue to be backed by the full faith and credit of the Philippines.
頁 188 / 247424(b)(3)
2014/03/12file:///C:/blp/data/CFd424b3.htm

Table of ContentsTable of ContentsTable of ContentsTable of Contents
Under Philippine law, unsecured debt (including guarantees of debt) of a borrower in insolvency or liquidation that is documented by a public instrument, as provided in Article 2244(14) of the Civil Code of the Philippines, ranks ahead of unsecured debt that is not so documented. Debt is treated as documented by a public instrument if it is acknowledged before a notary or any person authorized to administer oaths in the Philippines. The Government maintains that debt of the Philippines is not subject to the preferences granted under Article 2244(14) or cannot be documented by a public instrument without acknowledgment of the Philippines as debtor. The Philippine courts have never addressed this matter, however, and it is uncertain whether a document evidencing the Philippines’ Peso or non-Peso denominated debt (including External Indebtedness), notarized without the Philippines’ participation, would be considered documented by a public instrument. If such debt were considered documented by a public instrument, it would rank ahead of the debt securities if the Philippines could not meet its debt obligations.
The Philippines has represented that it has not prepared, executed or filed any public instrument, as provided in Article 2244(14) of the Civil Code of the Philippines, relating to any External Indebtedness. It also has not consented or assisted in the preparation or filing of any such public instrument. The Philippines also agreed that it will not create any preference or priority in respect of any External Public Indebtedness pursuant to Article 2244(14) of the Civil Code of the Philippines unless its grants equal and ratable preference or priority to amounts payable under the debt securities.
Negative Pledge Covenant
If any debt securities are outstanding, the Philippines will not create or permit any Liens on its assets or revenues as security for any of its External Public Indebtedness, unless the Lien also secures the Philippines’ obligations under the debt securities. In addition, the Philippines will not create any preference or priority for any of its External Public Indebtedness pursuant to Article 2244(14) of the Civil Code of the Philippines, or any successor law, unless it grants equal and ratable preference or priority to amounts due under the debt securities.
The Philippines may create or permit a Lien:
• on any property or asset (or any interest in such property or asset) incurred when the property or asset was purchased, improved, constructed, developed or redeveloped to secure payment of the cost of the activity;
• securing Refinanced External Public Indebtedness;
• arising out of the extension, renewal or replacement of any External Public Indebtedness that is permitted to be subject to a lien pursuant to either of the previous two bullet points, as long as the principal amount of the External Public Indebtedness so secured is not increased;
• arising in the ordinary course of banking transactions to secure External Public Indebtedness with a maturity not exceeding one year;
• existing on any property or asset at the time it was purchased, or arising after the acquisition under a contract entered into before and not in contemplation of the acquisition, and any extension and renewal of that Lien which is limited to the original property or asset and secures any extension or renewal of the original secured financing;
• that:
(A) arises pursuant to any legal process in connection with court proceedings so long as the enforcement of the lien is stayed and the Philippines is contesting the claims secured in good faith; or
(B) secures the reimbursement obligation under any surety given in connection with the release of any lien referred to in (A) above;
if it is released or discharged within one year of imposition; or
105
• arising by operation of law, provided that any such Lien is not created or permitted to be created by the Philippines for the purpose of securing any External Public Indebtedness.
頁 189 / 247424(b)(3)
2014/03/12file:///C:/blp/data/CFd424b3.htm

Table of ContentsTable of ContentsTable of ContentsTable of Contents
The international reserves of Bangko Sentral represent substantially all of the official gross international reserves of the Philippines. Because Bangko Sentral is an independent entity, the Philippines and Bangko Sentral believe that the debt securities’ negative pledge covenant does not apply to Bangko Sentral’s international reserves. Bangko Sentral could therefore incur External Indebtedness secured by international reserves without securing amounts payable under the debt securities.
Events of Default
The following description does not apply to any series of debt securities that has been designated Collective Action Securities. See “Collective Action Securities—Events of Default” below for a description of the corresponding terms of Collective Action Securities.
Each of the following constitutes an event of default with respect to any series of debt securities:
1. Non-Payment: the Philippines does not pay principal or interest on any debt securities of such series when due and such failure continues for 30 days;
2. Breach of Other Obligations: the Philippines fails to observe or perform any of the covenants in the series of debt securities (other than non-payment) for 60 days after written notice of the default is delivered by any holder of debt securities to the Philippines at the corporate trust office of the fiscal agent in New York City;
3. Cross Default and Cross Acceleration:
(a) the Philippines fails to make a payment of principal, premium, prepayment charge or interest when due on any External Public Indebtedness with a principal amount equal to or greater than $25,000,000 or its equivalent, and this failure continues beyond the applicable grace period; or
For purposes of this event of default, the US dollar equivalent for non-US dollar debt will be computed using the middle spot rate for the relevant currency against the US dollar as quoted by The Chase Manhattan Bank on the date of determination.
(b) any External Public Indebtedness of the Philippines or the central monetary authority in principal amount equal to or greater than $25,000,000 is accelerated, other than by optional or mandatory prepayment or redemption;
4. Moratorium: the Philippines declares a general moratorium on the payment of its or the central monetary authority’s External Indebtedness;
5. Validity:
(a) the Philippines, or any governmental body with the legal power and authority to declare such series of debt securities and the related Fiscal Agency Agreement invalid or unenforceable, challenges the validity of such series of debt securities or the related Fiscal Agency Agreement;
(b) the Philippines denies any of its obligations under such series of debt securities or the related Fiscal Agency Agreement; or
(c) any legislative executive, or constitutional measure or final judicial decision renders any material provision of such series of debt securities or the related Fiscal Agency Agreement invalid or unenforceable or prevents or delays the performance of the Philippines’ obligations under such series of debt securities or the related Fiscal Agency Agreement;
6. Failure of Authorizations: any legislative, executive or constitutional authorization necessary for the Philippines to perform its material obligations under the series of debt securities or the related Fiscal Agency Agreement ceases to be in full force and effect or is modified in a manner materially prejudicial to the holders of the debt securities;
7. Control of Assets: The Philippines or the central monetary authority does not at all times exercise full control over the Philippines’ International Monetary Assets; or
106
頁 190 / 247424(b)(3)
2014/03/12file:///C:/blp/data/CFd424b3.htm

Table of ContentsTable of ContentsTable of ContentsTable of Contents
8. IMF Membership: The Philippines ceases to be a member of the IMF or losses its eligibility to use the general resources of the IMF.
The events described in paragraphs 2, 4, 5 and 6 will be events of default only if they materially prejudice the interests of holders of the debt securities.
If any of the above events of default occurs and is continuing, holders of the debt securities representing at least 25% in principal amount of the debt securities of that series then outstanding may declare all of the debt securities of the series to be due and payable immediately by written notice to the Philippines and the fiscal agent. In the case of an event of default described in paragraphs 1 or 4 above, any holder of the debt securities may declare the principal amount of debt securities that it holds to be immediately due and payable by written notice to the Philippines and the fiscal agent.
Investors should note that:
• despite the procedure described above, no debt securities may be declared due and payable if the Philippines cures the applicable event of default before it receives the written notice from the holder of the debt securities;
• the Philippines is not required to provide periodic evidence of the absence of defaults; and
Modifications and Amendments; Bondholders’ Meetings
• the Fiscal Agency Agreement does not require the Philippines to notify holders of the debt securities of an event of default or grant any holder of the debt securities a right to examine the bond register.
The following description does not apply to any series of debt securities that has been designated Collective Action Securities. See “Collective Action Securities—Modifications and Amendments; Bondholders’ Meetings” for a description of the corresponding terms of
Collective Action Securities.
Each holder of a series of debt securities must consent to any amendment or modification of the terms of that series of debt securities or the Fiscal Agency Agreement that would:
• change the stated maturity of the principal of the debt securities or any installment of interest;
• reduce the principal amount of such series of debt securities or the portion of the principal amount payable upon acceleration of such debt securities;
• change the debt securities’ interest rate;
• change the currency of payment of principal or interest;
• change the obligation of the Philippines to pay additional amounts on account of withholding taxes or deductions; or
With respect to other types of amendment or modification, the Philippines may, with the consent of the holders of at least a majority in principal amount of the debt securities of a series that are outstanding, modify and amend that series of debt securities or, to the extent the modification or amendment affects that series of debt securities, the Fiscal Agency Agreement.
The Philippines may at any time call a meeting of the holders of a series of debt securities to seek the holders’ approval of the modification, or amendment, or obtain a waiver, of any provision of that series of debt securities. The meeting will be held at the time and place in the Borough of Manhattan in New York City as determined by the Philippines. The notice calling the meeting must be given at least 30 days and not more than 60 days prior to the meeting.
107
• reduce the percentage of the outstanding principal amount needed to modify or amend the related Fiscal Agency Agreement or the terms of such series of debt securities.
頁 191 / 247424(b)(3)
2014/03/12file:///C:/blp/data/CFd424b3.htm

Table of ContentsTable of ContentsTable of ContentsTable of Contents
While an event of default with respect to a series of debt securities is continuing, holders of at least 10% of the aggregate principal amount of that series of debt securities may compel the fiscal agent to call a meeting of all holders of debt securities of that series.
The Persons entitled to vote a majority in principal amount of the debt securities of the series that are outstanding at the time will constitute a quorum at a meeting of the holders of the debt securities. To vote at a meeting, a person must either hold outstanding debt securities of the relevant series or be duly appointed as a proxy for a holder of the debt securities. The fiscal agent will make all rules governing the conduct of any meeting.
The Fiscal Agency Agreement and a series of debt securities may be modified or amended, without the consent of the holders of the debt securities, to:
• add covenants of the Philippines that benefit holders of the debt securities;
• surrender any right or power given to the Philippines;
• secure the debt securities;
Replacement of Debt Securities
• cure any ambiguity or correct or supplement any defective provision in the Fiscal Agency Agreement or the debt securities, without materially and adversely affecting the interests of the holders of the debt securities.
If a debt security becomes mutilated, defaced, destroyed, lost or stolen, the Philippines may issue, and the fiscal agent will authenticate and deliver, a substitute debt security. The Philippines and the fiscal agent will require proof of any claim that a debt security was destroyed, lost or stolen.
The applicant for a substitute debt security must indemnify the Philippines, the fiscal agent and any other agent for any losses they may suffer relating to the debt security that was destroyed, lost or stolen. The applicant will be required to pay all expenses and reasonable charges associated with the replacement of the mutilated, defaced, destroyed, lost or stolen debt security.
Fiscal Agent
The Philippines will appoint a fiscal agent or agents in connection each series of the debt securities whose duties would be governed by the related Fiscal Agency Agreement. Different fiscal agents may be appointed for different series of debt securities. The Philippines may maintain bank accounts and a banking relationship with each fiscal agent. Each fiscal agent is the agent of the Philippines and does not act as a trustee for the holders of the debt securities.
Notices
All notices will be mailed to the registered holders of a series of debt securities. If a depositary is the registered holder of global securities, each beneficial holder must rely on the procedures of the depositary and its participants to receive notices, subject to any statutory or regulatory requirements.
If the Philippines lists a series of debt securities on the Luxembourg Stock Exchange, and the rules of that exchange so require, all notices to holders of that series of debt securities will be published in a daily newspaper of general circulation in Luxembourg. The Philippines expects that the Luxemburger Wort will be the newspaper. If notice cannot be published in an appropriate newspaper, notice will be considered validly given if made pursuant to the rules of the Luxembourg Stock Exchange.
108
頁 192 / 247424(b)(3)
2014/03/12file:///C:/blp/data/CFd424b3.htm

Table of ContentsTable of ContentsTable of ContentsTable of Contents
Governing Law
The Fiscal Agency Agreement and the debt securities will be governed by the laws of the State of New York without regard to any principles of New York law requiring the application of the laws of another jurisdiction. Nevertheless, all matters governing the authorization, execution and delivery of the debt securities and the Fiscal Agency Agreement by the Philippines will be governed by the laws of the Philippines.
Further Issues of Debt Securities
The following description does not apply to any series of debt securities that has been designated Collective Action Securities. See “Collective Action Securities—Further Issues of Debt Securities” for a description of the corresponding terms of Collective Action Securities.
The Philippines may, without the consent of the holders of the debt securities, create and issue additional debt securities with the same terms and conditions as any series of bonds (or that are the same in all respects except for the amount of the first interest payment and for the interest paid on the series of debt securities prior to the issuance of the additional debt securities). The Philippines may consolidate such additional debt securities with the outstanding debt securities to form a single series. Any further debt securities forming a single series with the outstanding Debt Securities of any series constituted by a Fiscal Agency Agreement shall be constituted by an agreement supplemental to such relevant Fiscal Agency Agreement.
Jurisdiction and Enforceability
The Philippines is a foreign sovereign government and your ability to collect on judgments of US courts against the Philippines may be limited.
The Philippines will irrevocably appoint the Philippine Consul General in New York, New York as its authorized agent to receive service of process in any suit based on any series of debt securities which any holder of the debt securities may bring in any state or federal court in New York City. The Philippines submits to the jurisdiction of any state or federal court in New York City or any competent court in the Philippines in such action. The Philippines waives, to the extent permitted by law, any objection to proceedings in such courts. The Philippines also waives irrevocably any immunity from jurisdiction to which it might otherwise be entitled in any suit based on any series of debt securities.
Because of its waiver of immunity, the Philippines would be subject to suit in competent courts in the Philippines. Judgments against the Philippines in state or federal court in New York City would be recognized and enforced by the courts of the Philippines in any enforcement action without re-examining the issues if:
• such judgment were not obtained by collusion or fraud;
• the foreign court rendering such judgment had jurisdiction over the case;
• the Philippines had proper notice of the proceedings before the foreign court; and
Notwithstanding any of the above, the Philippine Consul General is not the agent for receipt of service for suits under the US federal or state securities laws, and the Philippines’ waiver of immunity does not extend to those actions. In addition, the Philippines does not waive immunity relating to its:
• such judgment were not based upon a clear mistake of law or fact.
• properties and assets used by a diplomatic or consular mission;
• properties and assets under the control of its military authority or defense agency; and
109
• properties and assets located in the Philippines and dedicated to a public or Governmental use.
頁 193 / 247424(b)(3)
2014/03/12file:///C:/blp/data/CFd424b3.htm

Table of ContentsTable of ContentsTable of ContentsTable of Contents
If you bring a suit against the Philippines under federal or state securities laws, unless the Philippines waives immunity, you would be able to obtain a United States judgment against the Philippines only if a court determined that the Philippines is not entitled to sovereign immunity under the United States Foreign Sovereign Immunities Act. Even if you obtained a United States judgment in any such suit, you may not be able to enforce the judgment in the Philippines. Moreover, you may not be able to enforce a judgment obtained under the Foreign Sovereign Immunities Act against the Philippines’ property located in the United States except under the limited circumstances specified in the act.
Glossary of Certain Defined Terms
Certain definitions used in the Fiscal Agency Agreement are set forth below. For a full explanation of all of these terms or any capitalized terms used in this section you should refer to the Fiscal Agency Agreement.
“External Indebtedness” means Indebtedness denominated or payable by its terms, or at the option of the holder, in a currency or currencies
other than that of the Philippines.
“External Public Indebtedness” means any External Indebtedness in the form of bonds, debentures, notes or other similar instruments or
other securities which is, or is eligible to be, quoted, listed or ordinarily purchased and sold on any stock exchange, automated trading system or over-the-counter or other securities market.
“Indebtedness” means any indebtedness for money borrowed or any guarantee of indebtedness for money borrowed.
“International Monetary Assets” means all (i) gold, (ii) Special Drawing Rights, (iii) Reserve Positions in the Fund and (iv) Foreign
Exchange.
“Lien” means any mortgage, deed of trust, charge, pledge, lien or other encumbrance or preferential arrangement which has the practical
effect of constituting a security interest.
“Refinanced External Public Indebtedness” means the US$130,760,000 Series A Interest Reduction Bonds due 2007 issued by the Republic
on December 1, 1992, the US$626,616,000 Series B Interest Reduction Bonds due 2008 issued by the Republic on December 1, 1992, the US$153,490,000 Series A Principal Collateralized Interest Reduction Bonds due 2018 issued by the Republic on December 1, 1992 and the US$1,740,600,000 Series B Collateralized Interest Reduction Bonds due 2017 issued by the Republic on December 1, 1992.
“Special Drawing Rights,” “Reserve Positions in the Fund” and “Foreign Exchange”, have, as to the type of assets included, the meanings
given to them in the IMF’s publication entitled “International Financial Statistics” or any other meaning formally adopted by the IMF from time to time.
Description of the Warrants
Each series of warrants will be issued under a warrant agreement (each, as applicable to a series of warrants, the “Warrant Agreement”) to be entered into between the Republic and a bank or trust company as warrant agent. The description below summarizes some of the provisions of warrants for the purchase of bonds that the Republic may issue from time to time and of the Warrant Agreement. Copies of the forms of warrants and the Warrant Agreement are or will be filed as exhibits to the registration statement of which this prospectus is a part. Since it is only a summary, the description may not contain all of the information that is important to you as a potential investor in the warrants.
The description of the warrants that will be contained in the prospectus supplement will supplement this description and, to the extent inconsistent with this description, replace it.
110
頁 194 / 247424(b)(3)
2014/03/12file:///C:/blp/data/CFd424b3.htm

Table of ContentsTable of ContentsTable of ContentsTable of Contents
General Terms of the Warrants
The prospectus supplement relating to the series of warrants will set forth:
• The terms of the bonds purchasable upon exercise of the warrants, as described above under “Description of the Debt Securities—General Terms of the Bonds”;
• The principal amount of bonds purchasable upon exercise of one warrant and the exercise price;
• The procedures and conditions for the exercise of the warrants;
• The dates on which the right to exercise the warrants begins and expires;
• Whether and under what conditions the warrants and any bonds issued with the warrants will be separately transferable;
• Whether the warrants will be issued in certificated or global form and, if in global form, information with respect to applicable depositary arrangements;
• If issued in certificated form, whether the warrants will be issued in registered or bearer form, whether they will be exchangeable between such forms, and, if issued in registered form, where they may be transferred and registered; and
• Other specific provisions.
The warrants will be subject to the provisions set forth under “Description of the Securities—Description of the Debt Securities,” “—Governing Law” and “—Jurisdiction and Enforceability”.
Limitations on Issuance of Bearer Debt Securities
Bearer securities will not be offered, sold or delivered in the United States or its possessions or to a United States person, except in certain circumstances permitted by United States tax regulations. Bearer securities will initially be represented by temporary global securities (without interest coupons) deposited with a common depositary in London for the Euroclear System for credit to designated accounts. Unless otherwise indicated in the applicable Prospectus Supplement:
• each temporary global security will be exchangeable for definitive bearer securities on or after the date that is 40 days after issuance only upon receipt of certification of non-United States beneficial ownership of the temporary global security as provided in United States tax regulations, provided that no bearer security will be mailed or otherwise delivered to any location in the United States in connection with the exchange; and
Bearer securities (other than temporary global debt securities) and any related coupons will bear the following legend: “Any United States person who holds this obligation will be subject to limitations under the United States federal income tax laws, including the limitations provided in Sections 165(j) and 1287(a) of the Internal Revenue Code”. The sections referred to in the legend provide that, with certain exceptions, a United States person who holds a bearer security, or coupon will not be allowed to deduct any loss realized on the disposition of the bearer security, and any gain (which might otherwise be characterized as capital gain) recognized on the disposition will be treated as ordinary income.
For purposes of this section, “United States person” means:
• any interest payable on any portion of a temporary global security with respect to any interest payment date occurring prior to the issuance of definitive bearer securities will be paid only upon receipt of certification of non-United States beneficial ownership of the temporary global security as provided in United States tax regulations.
• an individual citizen or resident of the United States;
111
• a corporation, partnership or other entity created or organized in or under the laws of the United States or any political subdivision thereof;
頁 195 / 247424(b)(3)
2014/03/12file:///C:/blp/data/CFd424b3.htm

Table of ContentsTable of ContentsTable of ContentsTable of Contents
• an estate the income of which is subject to United States federal income taxation regardless of its source; or
For purposes of this section, “United States” means United States of America (including the States and the District of Columbia), its territories, its possessions and other areas subject to its jurisdiction.
112
• a trust if a United States court is able to exercise primary supervision over the trust’s administration and one or more United States persons have the authority to control all of the trust’s substantial decisions.
頁 196 / 247424(b)(3)
2014/03/12file:///C:/blp/data/CFd424b3.htm

Table of ContentsTable of ContentsTable of ContentsTable of Contents
COLLECTIVE ACTION SECURITIES
The Philippines may designate a particular series of debt securities to be “Collective Action Securities,” the specific terms of which will be described in the prospectus supplement relating to such series of debt securities. Collective Action Securities will have the same terms and conditions as the securities described under “Description of the Debt Securities”, except that such Collective Action Securities shall contain different provisions relating to certain aspects of default, acceleration, voting on amendments, modifications, changes or waivers and further issues of debt securities as follows:
Events of Default
Each of the following constitutes an event of default with respect to any series of debt securities:
(1) Non-Payment: the Philippines does not pay principal or interest on any debt securities of such series when due and such failure continues for 30 days;
(2) Breach of Other Obligations: the Philippines fails to observe or perform any of the covenants in the series of debt securities (other than non-payment) for 60 days after written notice of the default is delivered by any holder of debt securities to the Philippines at the corporate trust office of the fiscal agent in New York City;
(3) Cross Default and Cross Acceleration:
(a) the Philippines fails to make a payment of principal, premium, prepayment charge or interest when due on any External Public Indebtedness with a principal amount equal to or greater than $25,000,000 or its equivalent, and this failure continues beyond the applicable grace period; or
(b) any External Public Indebtedness of the Philippines or the central bank of the Philippines in principal amount equal to or greater than $25,000,000 is accelerated, other than by optional or mandatory prepayment or redemption;
For purposes of this event of default, the US dollar equivalent for non-US dollar debt will be computed using the middle spot rate for the relevant currency against the US dollar as quoted by JP Morgan Chase Bank on the date of determination.
(1) Moratorium: the Philippines declares a general moratorium on the payment of its or the central monetary authority’s External Indebtedness;
(2) Validity:
(a) the Philippines, or any governmental body with the legal power and authority to declare such series of debt securities and the related Fiscal Agency Agreement invalid or unenforceable, challenges the validity of such series of debt securities or the related Fiscal Agency Agreement;
(b) the Philippines denies any of its obligations under such series of debt securities or the related Fiscal Agency Agreement; or
(c) any legislative executive, or constitutional measure or final judicial decision renders any material provision of such series of debt securities or the related Fiscal Agency Agreement invalid or unenforceable or prevents or delays the performance of the Philippines’ obligations under such series of debt securities or the related Fiscal Agency Agreement;
(3) Failure of Authorizations: any legislative, executive or constitutional authorization necessary for the Philippines to perform its material obligations under the series of debt securities or the related Fiscal Agency Agreement ceases to be in full force and effect or is modified in a manner materially prejudicial to the holders of the debt securities;
(4) Control of Assets: The Philippines or the central bank of the Republic does not at all times exercise full control over the Republic’s International Monetary Assets; or
113
頁 197 / 247424(b)(3)
2014/03/12file:///C:/blp/data/CFd424b3.htm

Table of ContentsTable of ContentsTable of ContentsTable of Contents
(5) IMF Membership: The Philippines ceases to be a member of the IMF or loses its eligibility to use the general resources of the IMF.
The events described in paragraphs 2, 4, 5 and 6 will be events of default only if they materially prejudice the interests of holders of the debt securities.
If any of the above events of default occurs and is continuing, holders of the debt securities representing at least 25% in principal amount of the debt securities of that series then outstanding may declare all of the debt securities of the series to be due and payable immediately by written notice to the Philippines and the fiscal agent. The holders of more than 50% of the aggregate principal amount of the outstanding debt securities of the affected series may rescind a declaration of acceleration if the event or events of default giving rise to the declaration have been cured or waived.
Investors should note that:
• despite the procedure described above, no debt securities may be declared due and payable if the Philippines cures the applicable event of default before it receives the written notice from the holders of the debt securities;
• the Philippines is not required to provide periodic evidence of the absence of defaults; and
Modifications and Amendments; Bondholders’ Meetings
• the Fiscal Agency Agreement does not require the Philippines to notify holders of the debt securities of an event of default or grant any holder of the debt securities a right to examine the bond register.
The Philippines and the fiscal agent may, with the consent of the holders of not less than 75% of the aggregate principal amount of the outstanding debt securities, voting at a meeting or by written consent, make any amendment, modification, change or waiver with respect to the debt securities or the Fiscal Agency Agreement that would:
• change the stated maturity of the principal of the debt securities or the due date of any installment of interest;
• reduce the principal amount of such series of debt securities or the portion of the principal amount payable upon acceleration of such debt securities;
• change the debt securities’ interest rate;
• change the currency of payment of principal or interest;
• change the obligation of the Philippines to pay any additional amounts on account of withholding taxes or deductions;
• reduce the percentage of the outstanding principal amount needed to modify or amend the related Fiscal Agency Agreement, any amendment or supplement thereto, or the terms of such series of debt securities;
• change the definition of “outstanding” with respect to the debt securities of such series;
• permit early redemption of the debt securities of the series or, if early redemption is already permitted, set a redemption date earlier than the date previously specified or reduce the redemption price;
• change the governing law provision of the debt securities of that series;
114
• change the courts to the jurisdiction of which the Philippines has submitted, the Philippines’ obligation to appoint and maintain an agent for service of process in the Borough of Manhattan, The City of New York, or the Philippines’s waiver of immunity, in respect of actions or proceedings brought by any holder based upon the debt securities of that series;
頁 198 / 247424(b)(3)
2014/03/12file:///C:/blp/data/CFd424b3.htm

Table of ContentsTable of ContentsTable of ContentsTable of Contents
• in connection with an exchange offer for the debt securities of that series, amend any event of default under the debt securities of that series; or
We refer to the above subjects as “reserved matters”. A change to a reserved matter, including the payment terms of the debt securities, can be made without the holder’s consent, as long as a supermajority of the holders (that is, the holders of at least 75% of the aggregate principal amount of the outstanding debt securities) agree to the change.
With respect to other types of amendment or modification, the Philippines may, with the consent of the holders of at least 66 /3% in principal amount of the debt securities that are outstanding, modify and amend the debt securities or, to the extent the modification or amendment affects the debt securities, the Fiscal Agency Agreement or any amendment or supplement thereto.
The Philippines may at any time call a meeting of the holders of debt securities to seek the holders’ approval of the modification, or amendment, or obtain a waiver, of any provision of the debt securities. The meeting will be held at the time and place in the Borough of Manhattan in New York City as determined by the Philippines. The notice calling the meeting must be given at least 30 days and not more than 60 days prior to the meeting.
The holders of at least 10% of the aggregate principal amount of the debt securities that are outstanding may compel the fiscal agent to call a meeting of all holders of the debt securities.
For purposes of a meeting of the holders of the debt securities that does not propose to discuss reserved matters, the persons entitled to vote a majority in principal amount of the debt securities that are outstanding at the time will constitute a quorum. However, if such a meeting is adjourned for a lack of a quorum, then holders or proxies representing 25% of the outstanding principal amount will constitute a quorum when the meeting is rescheduled. For purposes of any meeting of holders that proposes to discuss reserved matters, as specified above, holders or proxies representing 75% of the aggregate principal amount of the outstanding notes will constitute a quorum. To vote at a meeting, a person must either hold outstanding debt securities or be duly appointed as a proxy for a holder of the debt securities. The fiscal agent will make all rules governing the conduct of any meeting.
The Fiscal Agency Agreement and the debt securities may be modified or amended, without the consent of the holders of the debt securities, to:
• change the pari passu ranking of the debt securities.
• add covenants of the Philippines that benefit holders of the debt securities;
• surrender any right or power given to the Philippines;
• secure the debt securities;
For purposes of determining whether the required percentage of holders of the debt securities of a series has approved any amendment, modification or change to, or waiver of, the debt securities or the fiscal agency agreement, or whether the required percentage of holders has delivered a notice of acceleration of the debt securities of that series, debt securities owned, directly or indirectly, by the Philippines or any public sector instrumentality of the Philippines will be disregarded and deemed not to be outstanding (except that in determining whether the fiscal agent shall be protected in relying upon any amendment, modification, change or waiver, or any notice from holders, only debt securities that the fiscal agent knows to be so owned shall be so disregarded). As used in this paragraph, “public sector instrumentality” means Bangko Sentral, any department, ministry or agency of the Philippines or any corporation, trust, financial institution or other entity owned or controlled by the Philippines or any of the foregoing, and “control” means the power, directly or indirectly,
115
• cure any ambiguity or correct or supplement any defective provision in the Fiscal Agency Agreement or the debt securities, without materially and adversely affecting the interests of the holders of the debt securities.
2
頁 199 / 247424(b)(3)
2014/03/12file:///C:/blp/data/CFd424b3.htm

Table of ContentsTable of ContentsTable of ContentsTable of Contents
through the ownership of voting securities or other ownership interests or otherwise, to direct the management of or elect or appoint a majority of the board of directors or other persons performing similar functions in lieu of, or in addition to, the board of directors of a corporation, trust, financial institution or other entity.
Further Issues of Debt Securities
The Philippines may, without the consent of the holders of the debt securities, create and issue additional debt securities with the same terms and conditions as any series of bonds (or that are the same in all respects except for the amount of the first interest payment and for the interest paid on the series of debt securities prior to the issuance of the additional debt securities) provided, however, that such additional notes do not have a greater amount of original issue discount for US federal tax purposes (“OID”) than the outstanding notes have as of the date of the issue of such additional notes. The Philippines may consolidate such additional debt securities with the outstanding debt securities to form a single series. Any further debt securities forming a single series with the outstanding debt securities of any series constituted by a Fiscal Agency Agreement shall be constituted by a supplement to such relevant Fiscal Agency Agreement.
116
頁 200 / 247424(b)(3)
2014/03/12file:///C:/blp/data/CFd424b3.htm

Table of ContentsTable of ContentsTable of ContentsTable of Contents
TAXATION
The following discussion summarizes certain Philippine and US federal income tax considerations that may be relevant to you if you invest in debt securities. This summary is based on laws, regulations, rulings and decisions now in effect, all of which may change. Any change could apply retroactively and could affect the continued validity of this summary.
This summary does not describe all of the tax considerations that may be relevant to you or your situation, particularly if you are subject to special tax rules. You should consult your tax advisor about the tax consequences of holding debt securities, including the relevance to your particular situation of the considerations discussed below, as well as of state, local or other tax laws.
Philippine Taxation
The following is a summary of certain Philippine tax consequences that may be relevant to non-Philippine holders of the global bonds in connection with the holding and disposition of the global bonds. The Republic uses the term “non-Philippine holders” to refer to (i) non-residents of the Philippines who are neither citizens of the Philippines nor are engaged in trade or business within the Philippines or (ii) non-Philippine corporations not engaged in trade or business in the Philippines.
This summary is based on Philippine laws, rules, and regulations now in effect, all of which are subject to change. It is not intended to constitute a complete analysis of the tax consequences under Philippine law of the receipt, ownership, or disposition of the global bonds, in each case by non-Philippine holders, nor to describe any of the tax consequences that may be applicable to residents of the Republic.
Effect of Holding Global Bonds
Payments by the Republic of principal of and interest on the global bonds to a non-Philippine holder will not subject such non-Philippine holder to taxation in the Philippines by reason solely of the holding of the global bonds or the receipt of principal or interest in respect thereof.
Taxation of Interest on the Global Bonds
When the Republic makes payments of principal and interest to you on the global bonds, no amount will be withheld from such payments for, or on account of, any taxes of any kind imposed, levied, withheld or assessed by the Philippines or any political subdivision or taxing authority thereof or therein.
Taxation of Capital Gains
Non-Philippine holders of the global bonds will not be subject to Philippine income or withholding tax in connection with the sale, exchange, or retirement of a global bond if such sale, exchange or retirement is made outside the Philippines or an exemption is available under an applicable tax treaty in force between the Philippines and the country of domicile of the non-Philippine holder.
Documentary Stamp Taxes
No documentary stamp tax is imposed upon the transfer of the global bonds. A documentary stamp tax is payable upon the issuance of the global bonds and will be for the account of the Republic.
Estate and Donor’s Taxes
The transfer of a global bond by way of succession upon the death of a non-Philippine holder will be subject to Philippine estate tax at progressive rates ranging from 5% to 20% if the value of the net estate of properties located in the Philippines is over (Peso)200,000.
117
頁 201 / 247424(b)(3)
2014/03/12file:///C:/blp/data/CFd424b3.htm

Table of ContentsTable of ContentsTable of ContentsTable of Contents
The transfer of a global bond by gift to an individual who is related to the nonresident holder will generally be subject to a Philippine donor’s tax at progressive rates ranging from 2% to 15% if the value of the net gifts of properties located in the Philippines exceed (Peso)100,000 during the relevant calendar year. Gifts to unrelated donees are generally subject to tax at a flat rate of 30%. An unrelated donee is a person who is not a (i) brother, sister (whether by whole or half blood), spouse, ancestor, or lineal descendant or (ii) relative by consanguinity in the collateral line within the fourth degree of relationship.
The foregoing apply even if the holder is a nonresident holder. However, the Republic will not collect estate and donor’s taxes on the transfer of the global bonds by gift or succession if the deceased at the time of death, or the donor at the time of donation, was a citizen and resident of a foreign country that provides certain reciprocal rights to citizens of the Philippines (a “Reciprocating Jurisdiction”). For these purposes, a Reciprocating Jurisdiction is a foreign country which at the time of death or donation (i) did not impose a transfer tax of any character in respect of intangible personal property of citizens of the Philippines not residing in that foreign country or (ii) allowed a similar exemption from transfer or death taxes of every character or description in respect of intangible personal property owned by citizens of the Philippines not residing in that foreign country.
United States Tax Considerations
The following discussion summarizes certain US federal income tax considerations that may be relevant to you if you invest in debt securities. This summary is based on the Internal Revenue Code of 1986, as amended (the “Code”), applicable US Treasury Regulations, published rulings, administrative pronouncements, and court decisions in effect on the date of this prospectus, all of which are subject to change, possibly with retroactive effect. Any such change could affect the tax consequences described below. This summary deals only with US holders that hold debt securities as capital assets. It does not address considerations that may be relevant to you if you are an investor that is subject to special tax rules, such as a bank, thrift, real estate investment trust, regulated investment company, insurance company, dealer in securities or currencies, trader in securities or commodities that elects mark to market treatment, a person that will hold debt securities as a hedge against currency risk or as a position in a “straddle” or conversion transaction, tax exempt organization or a person whose “functional currency” is not the US dollar.
You will be a US holder if you are (i) an individual who is a citizen or resident of the United States, (ii) a corporation for US federal income tax purposes created or organized in or under the laws of the United States or any state thereof (including the District of Columbia), (iii) an estate the income of which is subject to US federal income taxation regardless of its source or (iv) a trust if a court within the United States is able to execute primary supervision over its administration and one or more US persons have authority to control the substantial decisions of such trust. Notwithstanding the preceding sentence, to the extent provided in US Treasury Regulations, certain trusts in existence on August 20, 1996, and treated as United States persons prior to such date, that elected to be treated as a United States person shall also be considered US Holders. If you are a partner in a partnership that holds debt securities, the tax consequences of an investment in debt securities will generally depend on the status of the partners and the activities of the partnership. If you are not a US holder, consult the discussions below under the captions “Non-US Holders” and “Information Reporting and Backup Withholding”.
You should consult your own tax advisor concerning the particular US federal income tax consequences to you of ownership and disposition of debt securities, as well as the consequences to you arising under the laws of any other taxing jurisdiction.
United States Holders
Payments or Accruals of Interest
Payments or accruals of “qualified stated interest” (as defined below) on a debt security will be taxable to you as ordinary interest income at the time that you receive or accrue such amounts (in accordance with your regular method of tax accounting). If you use the cash method of tax accounting and you receive payments of
118
頁 202 / 247424(b)(3)
2014/03/12file:///C:/blp/data/CFd424b3.htm

Table of ContentsTable of ContentsTable of ContentsTable of Contents
interest pursuant to the terms of a debt security in a currency other than US dollars (a “foreign currency”), the amount of interest income you will realize will be the US dollar value of the foreign currency payment based on the exchange rate in effect on the date you receive the payment regardless of whether you convert the payment into US dollars. If you are an accrual basis US holder, the amount of interest income you will realize will be based on the average exchange rate in effect during the interest accrual period (or with respect to an interest accrual period that spans two taxable years, at the average exchange rate for the partial period within the taxable year). Alternatively, as an accrual basis US holder, you may elect to translate all interest income on foreign currency denominated debt securities at the spot rate of exchange on the last day of the accrual period (or the last day of the taxable year, in the case of an accrual period that spans more than one taxable year) or on the date that you receive the interest payment if that date is within five business days of the end of the accrual period. If you make this election you must apply it consistently to all debt instruments from year to year and you cannot change the election without the consent of the Internal Revenue Service (the “IRS”). If you use the accrual method of accounting for tax purposes you will recognize foreign currency gain or loss on the receipt of a foreign currency interest payment if the exchange rate in effect on the date the payment is received differs from the rate applicable to a previous accrual of that interest income. This foreign currency gain or loss will be treated as ordinary income or loss, but generally will not be treated as an adjustment to interest income received on the debt security.
Payments of interest on the debt securities will be treated as foreign source income for the purposes of calculating that holder’s foreign tax credit limitation. The limitation on foreign taxes eligible for the US foreign tax credit is calculated separately with respect to specific classes of income. The rules relating to foreign tax credits and the timing thereof are complex. You should consult your own tax advisors regarding the availability of a foreign tax credit under your particular situation.
The Purchase, Sale and Retirement of Debt Securities
Initially, your tax basis in a debt security generally will equal the cost of the debt security to you. Your basis will increase by any amounts that you are required to include in income under the rules governing original issue discount and market discount, and will decrease by the amount of any amortized premium and any payments other than qualified stated interest made on the debt security. The rules for determining these amounts are discussed below. If you purchase a debt security that is denominated in a foreign currency, the cost to you (and therefore generally your initial tax basis) will be the US dollar value of the foreign currency purchase price on the date of purchase calculated at (i) the exchange rate in effect on that date or (ii) if the foreign currency debt security is traded on an established securities market and you are a cash basis taxpayer, or if you are an accrual basis taxpayer that makes a special election, the spot rate of exchange on the settlement date of your purchase. The amount of any subsequent adjustments to your tax basis in a debt security in respect of foreign currency denominated original issue discount, market discount and premium will be determined in the manner described below. If you convert US dollars into a foreign currency and then immediately use that foreign currency to purchase a debt security, you generally will not have any taxable gain or loss as a result of the conversion or purchase.
When you sell or exchange a debt security, or if a debt security is retired, you generally will recognize gain or loss equal to the difference between the amount you realize on the transaction (less any accrued but unpaid interest not previously included in income, which will be subject to tax in the manner described above under “Payments or Accruals of Interest”) and your tax basis in the debt security. If you sell or exchange a debt security for a foreign currency, or receive foreign currency on the retirement of a debt security, the amount you will realize for US tax purposes generally will be the US dollar value of the foreign currency that you receive calculated at (i) the exchange rate in effect on the date the foreign currency debt security is disposed of or retired or (ii) if you dispose of a foreign currency debt security that is traded on an established securities market and you are a cash basis US holder, or if you are an accrual basis holder that makes a special election, the spot rate of exchange on the settlement date of the sale, exchange or retirement.
119
頁 203 / 247424(b)(3)
2014/03/12file:///C:/blp/data/CFd424b3.htm

Table of ContentsTable of ContentsTable of ContentsTable of Contents
The special election available to you if you are an accrual basis taxpayer in respect of the purchase and sale of foreign currency debt securities traded on an established securities market, which is discussed in the two preceding paragraphs, must be applied consistently to all debt instruments from year to year and cannot be changed without the consent of the IRS.
Except as discussed below with respect to market discount and foreign currency gain or loss, the gain or loss that you recognize on the sale, exchange or retirement of a debt security generally will be long-term capital gain or loss if you have held the debt security for more than one year. The Code provides preferential treatment under certain circumstances for net long-term capital gains recognized by individual non-corporate investors. Capital gain or loss, if any, recognized by a US holder generally will be treated as US source income or loss for US foreign tax credit purposes. The ability of US holders to offset capital losses against income is limited.
Despite the foregoing, the gain or loss that you recognize on the sale, exchange or retirement of a foreign currency debt security generally will be treated as ordinary income or loss to the extent that the gain or loss is attributable to changes in exchange rates during the period in which you held the debt security. This foreign currency gain or loss will not be treated as an adjustment to interest income that you receive on the debt security.
Original Issue Discount
If the Republic issues debt securities at a discount from their stated redemption price at maturity, and the discount is equal to or more than the product of one-fourth of one percent (0.25%) of the stated redemption price at maturity of the debt securities multiplied by the number of full years to their maturity, the debt securities will be “OID debt securities”. The difference between the issue price and the stated redemption price at maturity of the debt securities will be the “original issue discount” or “OID”. The “issue price” of the debt securities will be the first price at which a substantial amount of the debt securities are sold to the public (i.e., excluding sales of debt securities to underwriters, placement agents, wholesalers, or similar persons). The “stated redemption price at maturity” will include all payments under the debt securities other than payments of qualified stated interest. The term “qualified stated interest” generally means stated interest that is unconditionally payable in cash or property (other than debt instruments issued by the Republic) at least annually during the entire term of a debt security at a single fixed interest rate or, subject to certain conditions, based on one or more interest indices.
If you invest in OID debt securities you generally will be subject to the special tax accounting rules for OID obligations provided by the Code and certain US Treasury Regulations. You should be aware that, as described in greater detail below, if you invest in an OID debt security you generally will be required to include OID in ordinary gross income for US federal income tax purposes as it accrues, although you may not yet have received the cash attributable to that income.
In general, and regardless of whether you use the cash or the accrual method of tax accounting, if you are the holder of an OID debt security with a maturity greater than one year, you will be required to include in ordinary gross income the sum of the “daily portions” of OID on that debt security for all days during the taxable year that you own the debt security. The daily portions of OID on an OID debt security are determined by allocating to each day in any accrual period a ratable portion of the OID allocable to that period. Accrual periods may be any length and may vary in length over the term of an OID debt security, so long as no accrual period is longer than one year and each scheduled payment of principal or interest occurs on the first or last day of an accrual period. If you are the initial holder of the debt security, the amount of OID on an OID debt security allocable to each accrual period is determined by:
(i) multiplying the “adjusted issue price” (as defined below) of the debt security at the beginning of the accrual period by a fraction, the numerator of which is the annual yield to maturity of the debt security and the denominator of which is the number of accrual periods in a year; and
(ii) subtracting from that product the amount (if any) of qualified stated interest payments allocable to that accrual period.
120
頁 204 / 247424(b)(3)
2014/03/12file:///C:/blp/data/CFd424b3.htm

Table of ContentsTable of ContentsTable of ContentsTable of Contents
An OID debt security that is a floating rate debt security will be subject to special rules. Generally, if a floating rate debt security qualifies as a “variable rate debt instrument” (as defined in applicable US Treasury Regulations), then (i) all stated interest with respect to such floating rate debt security will be qualified stated interest and hence included in a US holder’s income in accordance with such US holder’s normal method of accounting for US federal income tax purposes, and (ii) the amount of OID, if any, will be determined under the general OID rules (as described above) by assuming that the variable rate is a fixed rate equal, in general, to the value, as of the issue date, of the floating rate.
If a floating rate debt security does not qualify as a “variable rate debt instrument”, such floating rate debt security will be classified as a contingent payment debt instrument and will be subject to special rules for calculating the accrual of stated interest and original issue discount.
Any special considerations with respect to the tax consequences of holding a floating rate debt security will be provided in the applicable prospectus supplement.
The “adjusted issue price” of an OID debt security at the beginning of any accrual period will generally be the sum of its issue price (including any accrued interest) and the amount of OID previously includable in the gross income of the holder, reduced by the amount of all payments other than any qualified stated interest payments on the debt security in all prior accrual periods. All payments on an OID debt security, other than qualified stated interest, generally will be viewed first as payments of previously accrued OID (to the extent of the previously accrued discount), with payments considered made from the earliest accrual periods first, and then as a payment of principal. The “annual yield to maturity” of a debt security is the discount rate (appropriately adjusted to reflect the length of accrual periods) that causes the present value on the issue date of all payments on the debt security to equal the issue price. As a result of this “constant yield” method of including OID income, you will generally be required to include in your gross income increasingly greater amounts of OID over the life of OID debt security.
You generally may make an irrevocable election to include in income your entire return on a debt security (i.e., the excess of all remaining payments to be received on the debt security, including payments of qualified stated interest, over the amount you paid for the debt security) under the constant yield method described above. For debt securities purchased at a premium or bearing market discount in your hands, if you make this election you will also be deemed to have made the election (discussed below under the caption “Premium and Market Discount”) to amortize premium or to accrue market discount in income currently on a constant yield basis.
In the case of an OID debt security that is also a foreign currency debt security, you should determine the US dollar amount includible as OID for each accrual period by (i) calculating the amount of OID allocable to each accrual period in the foreign currency using the constant yield method, and (ii) translating the foreign currency amount so determined at the average exchange rate in effect during that accrual period (or, with respect to an interest accrual period that spans two taxable years, at the average exchange rate for the partial period within the taxable year). Alternatively, you may translate the foreign currency amount so determined at the spot rate of exchange on the last day of the accrual period (or the last day of the taxable year, for an accrual period that spans two taxable years) or at the spot rate of exchange on the date of receipt, if that date is within five business days of the last day of the accrual period, provided that you have made the election described under the caption “Payment or Accruals of Interest” above. Because exchange rates may fluctuate, if you are the holder of an OID debt security that is also a foreign currency debt security you may recognize a different amount of OID income in each accrual period than would be the case if you were the holder of an otherwise similar OID debt security denominated in US dollars. Upon the receipt of an amount attributable to OID (whether in connection with a payment of an amount that is not qualified stated interest or the sale or retirement of the OID debt security), you will recognize ordinary income or loss measured by the difference between the amount received, translated into US dollars at the exchange rate in effect on the date of receipt or on the date of disposition of the OID debt security, as the case may be, and the amount accrued, using the exchange rate applicable to such previous accrual.
121
頁 205 / 247424(b)(3)
2014/03/12file:///C:/blp/data/CFd424b3.htm

Table of ContentsTable of ContentsTable of ContentsTable of Contents
If you purchase an OID debt security outside of the initial offering at a cost less than its “remaining redemption amount”, or if you purchase an OID debt security in the initial offering at a price other than the debt security’s issue price, you will also generally be required to include in gross income the daily portions of OID, calculated as described above. However, if you acquire an OID debt security at a price (i) less than or equal to the remaining redemption amount but (ii) greater than its adjusted issue price, you will be entitled to reduce your periodic inclusions to reflect the premium paid over the adjusted issue price. (As discussed under “Premium and Market Discount” below, if you purchase an OID debt security at a price greater than its remaining redemption amount, the OID rules described in this section will not apply.) The “remaining redemption amount” for an OID debt security is the total of all future payments to be made on the debt security other than qualified stated interest.
Certain of the OID debt securities may be redeemed prior to maturity, either at the option of the Republic or at the option of the holder, or may have special repayment or interest rate reset features as indicated in the pricing supplement. OID debt securities containing these features may be subject to rules that differ from the general rules discussed above. If you purchase OID debt securities with these features, you should carefully examine the pricing supplement and consult your tax advisor about their treatment since the tax consequences of OID will depend, in part, on the particular terms and features of the debt securities.
OID accrued with respect to an OID debt security will be treated as foreign source income for the purposes of calculating that holder’s foreign tax credit limitation. The limitation on foreign taxes eligible for the US foreign tax credit is calculated separately with respect to specific classes of income. The rules relating to foreign tax credits and the timing thereof are complex. You should consult your own tax advisors regarding the availability of a foreign tax credit under your particular situation.
Short-Term Debt Securities
Special rules may apply to a debt security with a maturity of one year or less (“a short-term debt security”). If you are an accrual basis holder, you will be required to accrue OID on the short-term debt security on either a straight line basis or, at the election of the holder, under a constant yield method (based on daily compounding). No interest payments on a short-term debt security will be qualified stated interest. Consequently, such interest payments are included in the short-term debt security’s stated redemption price at maturity. Since the amount of OID is calculated in the same manner as described above under “Original Issue Discount,” such interest payments may give rise to OID (or acquisition discount, as defined below) even if the short-term debt securities are not actually issued at a discount. If you are a cash basis holder and do not elect to include OID in income as it accrues, you will not be required to include OID in income until you actually receive payments on the debt security. However, you will be required to treat any gain upon the sale, exchange or retirement of the debt security as ordinary income to the extent of the accrued OID on the debt security that you have not yet taken into income at the time of the sale. Also, if you borrow money (or do not repay outstanding debt) to acquire or hold the debt security, you may not be allowed to deduct interest on the borrowing that corresponds to accrued OID on the debt security until you include the OID in your income.
Alternatively, regardless of whether you are a cash basis or accrual basis holder, you can elect to accrue any “acquisition discount” with respect to the short-term debt security on a current basis. Acquisition discount is the excess of the stated redemption price at maturity of the debt security over the purchase price. Acquisition discount will be treated as accruing rateably or, at the election of the holder, under a constant yield method (based on daily compounding). If you elect to accrue acquisition discount, the OID rules will not apply. US holders should consult their own tax advisors as to the application of these rules.
As described above, certain of the debt securities may be subject to special redemption features. These features may affect the determination of whether a debt security has a maturity of one year or less and thus is a short-term debt security. If you purchase a debt security, you should carefully examine the pricing supplement and consult your tax advisor about these features.
122
頁 206 / 247424(b)(3)
2014/03/12file:///C:/blp/data/CFd424b3.htm

Table of ContentsTable of ContentsTable of ContentsTable of Contents
Premium and Market Discount
If you purchase a debt security at a cost greater than the debt security’s remaining redemption amount, you will be considered to have purchased the debt security at a premium, and you may elect to amortize the premium as an offset to interest income, using a constant yield method, over the remaining term of the debt security. If you make this election, it generally will apply to all debt instruments that you hold at the time of the election, as well as any debt instruments that you subsequently acquire. In addition, you may not revoke the election without the consent of the IRS. If you elect to amortize the premium you will be required to reduce your tax basis in the debt security by the amount of the premium amortized during your holding period. In the case of premium on a foreign currency debt security, you should calculate the amortization of the premium in the foreign currency. Amortization deductions attributable to a period reduce interest payments in respect of that period, and therefore are translated into US dollars at the rate that you use for those interest payments. Exchange gain or loss will be realized with respect to amortized premium on a foreign currency debt security based on the difference between the exchange rate computed on the date or dates the premium is amortized against interest payments on the debt security and the exchange rate on the date when the holder acquired the debt security. For a US holder that does not elect to amortize premium, the amount of premium will be included in your tax basis when the debt security matures or is disposed of. Therefore, if you do not elect to amortize premium and you hold the debt security to maturity, you generally will be required to treat the premium as capital loss when the debt security matures.
A debt security, other than a short-term debt security, will be treated as purchased at a market discount (a “market discount debt security”) if the debt security’s stated redemption price at maturity or, in the case of OID debt security, the debt security’s “revised issue price”, exceeds the amount for which the US Holder purchased the debt security by at least one-fourth of one per cent (0.25%) of such debt security’s stated redemption price at maturity or revised issue price, respectively, multiplied by the number of complete years to the debt security’s maturity. For these purposes, the “revised issue price” of a debt security generally equals its issue price, increased by the amount of any OID that has accrued on the debt security.
Any gain recognized on the maturity or disposition of a market discount debt security will be treated as ordinary income to the extent that such gain does not exceed the accrued market discount on such debt security. Alternatively, a US holder of a market discount debt security may elect to include market discount in income currently over the life of the debt security. Such an election shall apply to all debt instruments with market discount acquired by the electing US holder on or after the first day of the first taxable year to which the election applies. This election may not be revoked without the consent of the IRS.
Market discount on a market discount debt security will accrue on a straight line basis unless the US holder elects to accrue such market discount on a constant yield method. Such an election shall apply only to the debt security with respect to which it is made and may not be revoked. A US holder of a market discount debt security that does not elect to include market discount in income currently generally will be required to defer deductions for interest on borrowings allocable to such debt security in an amount not exceeding the accrued market discount on such debt security until the maturity or disposition of such debt security. Any accrued market discount on a foreign currency debt security that is currently includable in income will generally be translated into US dollars at the average rate for the accrual periods (or portion thereof within the holder’s taxable year).
Warrants
A description of the tax consequences of an investment in warrants will be provided in the applicable prospectus supplement.
Indexed Debt Securities and Other Debt Securities Providing for Contingent Payment
Special rules govern the tax treatment of debt obligations that provide for contingent payments (“contingent debt obligations”). These rules generally require accrual of interest income on a constant yield basis in respect of contingent debt obligations at a yield determined at the time of issuance of the obligation, and may require
123
頁 207 / 247424(b)(3)
2014/03/12file:///C:/blp/data/CFd424b3.htm

Table of ContentsTable of ContentsTable of ContentsTable of Contents
adjustments to these accruals when any contingent payments are made. In addition, special rules may apply to floating rate debt securities if the interest payable on the debt securities is based on more than one interest rate index. We will provide a detailed description of the tax considerations relevant to US holders of any debt securities that are subject to the special rules discussed in this paragraph in the relevant prospectus supplement.
Non-US Holders
The following summary applies to you if you are not a US holder, as defined above.
Subject to the discussion below under the caption “Information Reporting and Backup Withholding”, the interest income that you derive in respect of the debt securities generally will be exempt from US federal income taxes, including US withholding tax on payments of interest (including OID) unless such income is effectively connected with the conduct of a trade or business within the United States. Further, any gain you realize on a sale or exchange of debt securities generally will be exempt from US federal income tax, including US withholding tax, unless:
• your gain is effectively connected with your conduct of a trade or business within the United States; or
Information Reporting and Backup Withholding
• you are an individual holder and are present in the United States for 183 days or more in the taxable year of the sale, and either (i) your gain is attributable to an office or other fixed place of business that you maintain in the United States or (ii) you have a tax home in the United States.
In general, information reporting requirements may apply to certain payments made within the United States of interest on a debt security, including payments made by the US office of a paying agent, broker or other intermediary, and to proceeds of a sale, exchange, or retirement of debt security effected at the US office of a US or foreign broker. A “backup withholding” tax may apply to such payments or proceeds if the beneficial owner fails to provide a correct taxpayer identification number or to otherwise comply with the applicable backup withholding rules. Certain persons (including, among others, corporations) and non-US holders which provide an appropriate certification or otherwise qualify for exemption are not subject to the backup withholding and information reporting requirements.
The proceeds of the sale, exchange, retirement or other disposition of debt securities effected through a foreign office of a broker that is a US controlled person will be subject to information reporting, but are not generally subject to backup withholding. A “US controlled person” is (i) a United States person, (ii) a controlled foreign corporation for United States federal income tax purposes, (iii) a foreign person for which 50% or more of its gross income from all sources, over as specified three year period, is effectively connected with a United States trade or business or (iv) a foreign partnership that, at any time in its taxable year, is 50% or more (by income or capital interest) owned by a United States person or is engaged in the conduct of a United States trade or business.
Backup withholding is not an additional tax. Any amounts withheld under the backup withholding rules from a payment made to a US holder generally may be claimed as a credit against such holder’s US federal income tax liability provided the appropriate information is furnished to the IRS.
124
頁 208 / 247424(b)(3)
2014/03/12file:///C:/blp/data/CFd424b3.htm

Table of ContentsTable of ContentsTable of ContentsTable of Contents
PLAN OF DISTRIBUTION
The Republic may sell the debt securities or warrants in any of three ways:
• through underwriters or dealers;
• directly to one or more purchasers; or
The prospectus supplement relating to a particular series of debt securities or warrants will set out:
• through agents.
• the names of any underwriters or agents;
• the purchase price of the securities;
• the proceeds to the Republic from the sale;
• any underwriting discounts and other compensation;
• the initial public offering price;
• any discounts or concessions allowed, reallowed or paid to dealers; and
Any underwriter involved in the sale of securities will acquire the securities for its own account. The underwriters may resell the securities from time to time in one or more transactions, including negotiated transactions, at a fixed public offering price or at varying prices to be determined at the time of sale. The securities may be offered to the public either by underwriting syndicates represented by managing underwriters or by underwriters without a syndicate. Unless the prospectus supplement states otherwise, the underwriters will benefit from certain conditions that must be satisfied before they are obligated to purchase such securities and they will be obligated to purchase all of the securities if any are purchased. The underwriters may change any initial public offering price and any discounts or concessions allowed or reallowed or paid to dealers.
If the Republic sells debt securities or warrants through agents, the prospectus supplement will identify the agent and indicate any commissions payable by the Republic. Unless the prospectus supplement states otherwise, all agents will act on a best efforts basis.
The Republic may authorize agents, underwriters or dealers to solicit offers by certain specified entities to purchase the securities from the Republic at the public offering price set forth in a prospectus supplement pursuant to delayed delivery contracts. The prospectus supplement will set out the conditions of the delayed delivery contracts and the commission receivable by the agents, underwriters or dealers for soliciting the contracts.
The Republic may offer securities as full, partial or alternative consideration for the purchase of other securities of the Republic, either in connection with a publicly announced tender, exchange or other offer for such securities or in privately negotiated transactions. The offer may be in addition to or in lieu of sales of securities directly or through underwriters or agents.
Agents and underwriters may be entitled to indemnification by the Republic against certain liabilities, including liabilities under the US Securities Act of 1933, as amended, or to contribution from the Republic with respect to certain payments which the agents or underwriters may be required to make. Agents and underwriters may be customers of, engage in transactions with, or perform services (including commercial and investment banking services) for, the Republic in the ordinary course of business.
In compliance with Financial Industry Regulatory Authority guidelines the maximum compensation to any underwriters or agents in connection with the sale of any securities pursuant to the prospectus and applicable
125
• any securities exchanges on which the securities will be listed.
頁 209 / 247424(b)(3)
2014/03/12file:///C:/blp/data/CFd424b3.htm

Table of ContentsTable of ContentsTable of ContentsTable of Contents
prospectus supplements will not exceed 8% of the aggregate total offering price to the public of such securities as set forth on the cover page of the applicable prospectus supplement; however, it is anticipated that the maximum compensation paid will be significantly less than 8%.
Unless otherwise specified in the applicable prospectus supplement, if the Republic offers and sells securities outside the United States, each underwriter or dealer will acknowledge that:
• the securities offered have not been and will not be registered under the US Securities Act of 1933; and
VALIDITY OF THE SECURITIES
The Secretary of the Department of Justice of the Republic will provide an opinion on behalf of the Republic as to the validity of the securities under Philippine law. Allen & Overy, United States counsel for the Republic, will provide an opinion on behalf of the Republic as to the validity of the securities under US and New York State law. US and Philippine counsel named in the applicable prospectus supplement will provide an opinion as to certain legal matters on behalf of the underwriters named in the applicable prospectus supplement.
AUTHORIZED REPRESENTATIVE IN THE UNITED STATES
The authorized agent of the Republic in the United States is Hon. Cecilia B. Rebong, Consul General, the Philippine Consulate General, 556 Fifth Avenue, New York, New York 10036-5095.
EXPERTS; OFFICIAL STATEMENTS AND DOCUMENTS
Hon. Roberto B. Tan, in his official capacity as National Treasurer of the Republic, reviewed the information set forth in the prospectus relating to the Republic, which information is included in the prospectus on his authority.
FURTHER INFORMATION
The Republic filed a registration statement with respect to the securities with the Securities and Exchange Commission under the US Securities Act of 1933, as amended, and its related rules and regulations. You can find additional information concerning the Republic and the securities in the registration statement and any pre- or post-effective amendment, including its various exhibits, which may be inspected at the public reference facilities maintained by the Commission at 100 F Street, N.E., Room 1580, Washington, D.C. 20549.
126
• may not be offered or sold in the United States except pursuant to an exemption from, or in a transaction not subject to, the registration requirements of the US Securities Act of 1933, as amended. Each participating underwriter or dealer will agree that it has not offered or sold, and will not offer or sell, any debt securities constituting part of its allotment in the United States except in accordance with Rule 903 of Regulation S under the US Securities Act of 1933. Accordingly, each underwriter or dealer will agree that neither the underwriter nor dealer nor its affiliates nor any persons acting on its or their behalf have engaged or will engage in any directed selling efforts with respect to the securities.
頁 210 / 247424(b)(3)
2014/03/12file:///C:/blp/data/CFd424b3.htm

Table of ContentsTable of ContentsTable of ContentsTable of Contents
DEBT TABLES OF THE REPUBLIC OF THE PHILIPPINES
T-1
Guaranteed External Debt of the Republic of the Philippines T-2External Debt of the Republic of the Philippines T-8Domestic Government Securities T-25Domestic Debt of the Republic of the Philippines (Other than Securities) T-34Guaranteed Domestic Debt of the Republic of the Philippines (Other than Securities) T-35
頁 211 / 247424(b)(3)
2014/03/12file:///C:/blp/data/CFd424b3.htm

Table of ContentsTable of ContentsTable of ContentsTable of Contents
GUARANTEED EXTERNAL DEBT OF THE REPUBLIC OF THE PHILIPPINES As of September 30, 2009
(In millions)
T-2
Interest Rate Basis
InterestRate/
Spread/ServiceCharge
(Per Annum)
Original AmountContracted
Outstanding Balanceas of September 30,
2009
CurrencyYear
ContractedYear of
Maturity(in OriginalCurrency)
(in USDollars) (in Original
Currency)
(in USDollars)
GRAND TOTAL 19,016.03 10,299.08
I. NATIONAL GOVERNMENT DIRECT GUARANTEE ON GOCC LOANS 19,016.03 10,213.18
A. LOANS 13,893.40 5,226.26
DEUTSCHE MARKS 664.70 492.23 254.06 189.42
FIXED RATE 2.0000% 1990 2020 150.00 111.83 17.07 12.73
FIXED RATE 2.0000% 1988 2018 46.00 34.30 20.70 15.43
FIXED RATE 9.0000% 1992 2036 72.00 53.68 56.59 42.19
FIXED RATE 9.0000% 1993 2033 60.00 44.73 53.33 39.76
FIXED RATE 9.0000% 1993 2023 30.40 22.67 25.04 18.67
FIXED RATE 2.0000% 1981 2016 15.50 11.56 2.34 1.74
FIXED RATE 2.0000% 1981 2011 0.60 0.45 0.08 0.06
FIXED RATE 7.5000% 1995 2035 14.75 11.00 13.03 9.71
FIXED RATE 7.5000% 1995 2035 50.10 34.00 44.69 33.32
FIXED RATE 2.0000% 1981 2011 4.70 3.50 0.56 0.42
FIXED RATE 2.0000% 1979 2015 35.80 26.69 3.43 2.56
FIXED RATE 9.0000% 1993 2033 145.00 108.11 8.44 6.29
FIXED RATE 9.0000% 1995 2036 12.80 9.54 6.74 5.03
GERMAN CAPITAL MARKET
RATE 0.0000% 1991 2031 17.25 12.86 2.03 1.51
EURO 164.16 222.67 117.58 171.46
FIXED RATE 0.7500% 1999 2039 25.56 37.28 14.12 20.59
FIXED RATE 7.0000% 1995 2035 30.70 44.77 12.49 18.21
FIXED RATE 0.7500% 2004 2044 5.11 7.45 5.11 7.46
FIXED RATE 0.7500% 2004 2045 5.28 7.70 5.29 7.71
FIXED RATE 0.7500% 2001 2040 14.77 21.54 14.61 21.31
FIXED RATE 0.7500% 2001 2040 9.35 13.63 9.36 13.64
FIXED RATE 5.7500% 2004 2044 5.28 7.70 4.22 6.16
FIXED RATE 0.7500% 2004 2044 5.28 7.70 4.48 6.53
FIXED RATE 0.7500% 2005 2045 11.70 17.06 3.94 5.75
FIXED RATE 0.7500% 2005 2045 15.00 21.87 17.36 25.32
FIXED RATE 3.0000% 2007 2025 2.54 3.70 2.54 3.70
FIXED RATE 4.0000% 2006 2021 10.50 4.99 9.07 13.22
FIXED RATE 5.7150% 2006 2018 7.80 4.99 6.80 9.91
INTEREST FREE 0.0000% 2000 2013 7.81 11.39 4.68 6.83
LIBOR 0.0000% 2003 2013 7.48 10.91 3.52 5.13
SPANISH PESETAS 631.12 5.53 209.38 1.84
FIXED RATE 2.5000% 1993 2013 631.12 5.53 209.38 1.84
FRENCH FRANCS 373.49 83.03 167.17 37.16
FIXED RATE 3.0000% 1988 2021 45.88 10.20 22.00 4.89
FIXED RATE 3.0000% 1988 2021 4.12 0.92 2.16 0.48
FIXED RATE 3.0000% 1990 2021 4.73 1.05 2.60 0.58
FIXED RATE 3.0000% 1990 2021 1.69 0.38 0.93 0.21
FIXED RATE 3.0000% 1990 2021 1.41 0.31 0.81 0.18
FIXED RATE 3.0000% 1990 2021 6.26 1.39 3.60 0.80
FIXED RATE 3.0000% 1990 2021 1.45 0.32 0.87 0.19
(2) (2)
頁 212 / 247424(b)(3)
2014/03/12file:///C:/blp/data/CFd424b3.htm

Table of ContentsTable of ContentsTable of ContentsTable of Contents
GUARANTEED EXTERNAL DEBT OF THE REPUBLIC OF THE PHILIPPINES—(Continued) As of September 30, 2009
(In millions)
T-3
Interest Rate Basis
InterestRate/
Spread/ServiceCharge
(Per Annum)
Original AmountContracted
Outstanding Balanceas of September 30,
2009
CurrencyYear
ContractedYear of
Maturity(in OriginalCurrency)
(in USDollars)
(in OriginalCurrency)
(in USDollars)
FIXED RATE 3.0000% 1990 2021 4.86 1.08 2.92 0.65
FIXED RATE 3.0000% 1990 2021 1.68 0.37 1.05 0.23
FIXED RATE 3.0000% 1990 2021 0.38 0.08 0.25 0.06
FIXED RATE 3.0000% 1990 2022 2.25 0.50 1.29 0.29
FIXED RATE 3.0000% 1990 2022 0.48 0.11 0.29 0.06
FIXED RATE 3.0000% 1990 2022 0.36 0.08 0.22 0.05
FIXED RATE 3.0000% 1990 2022 6.12 1.36 3.82 0.85
FIXED RATE 3.0000% 1990 2022 1.22 0.27 0.79 0.18
FIXED RATE 3.0000% 1990 2022 0.70 0.16 0.47 0.11
FIXED RATE 3.0000% 1990 2022 0.76 0.17 0.53 0.12
FIXED RATE 2.5000% 1991 2022 8.06 1.79 5.04 1.12
FIXED RATE 2.5000% 1991 2022 6.44 1.43 4.34 0.97
FIXED RATE 3.3000% 1994 2014 1.14 0.25 0.45 0.10
FIXED RATE 3.3000% 1994 2014 4.94 1.10 2.12 0.47
FIXED RATE 3.1000% 1994 2014 9.90 2.20 4.25 0.94
FIXED RATE 3.1000% 1994 2014 10.09 2.24 4.34 0.96
FIXED RATE 3.1000% 1994 2014 42.62 9.47 18.72 4.16
FIXED RATE 1.5000% 1996 2022 8.42 1.87 5.54 1.23
FIXED RATE 1.5000% 1996 2022 4.46 0.99 3.05 0.68
FIXED RATE 1.5000% 1996 2022 7.49 1.66 5.32 1.18
FIXED RATE 1.5000% 1996 2022 10.46 2.33 7.71 1.71
FIXED RATE 1.5000% 1996 2026 0.45 0.10 2.28 0.51
FIXED RATE 5.4500% 1990 2016 120.00 26.68 45.00 10.00
FIXED RATE 5.4500% 1991 2018 30.00 6.67 14.40 3.20
FIXED RATE
KOREAN WON 60,355.58 51.00 36,255.96 30.64
FIXED RATE 3.5000% 1995 2015 11,322.00 9.57 3,926.70 3.32
FIXED RATE 3.5000% 1995 2015 8,645.00 7.31 4,154.35 3.51
FIXED RATE 4.0000% 2004 2024 32,139.58 27.16 28,174.91 23.81
JAPANESE YEN 741,477.22 8,228.91 327,147.92 3,630.69
ADB FLOATING RATE 0.0000% 1998 2013 3,057.00 33.93 359.31 3.99
ADB FLOATING RATE 0.5000% 1996 2015 2,166.70 24.05 675.76 7.50
ADB FLOATING RATE 0.0000% 1992 2016 947.00 10.51 684.15 7.59
CQB 0.1000% 2001 2011 3,717.00 41.25 847.49 9.41
FIXED RATE 5.5000% 1992 2010 20,550.00 228.06 539.44 5.99
FIXED RATE 6.5000% 1991 2011 12,215.94 135.57 1,260.90 13.99
FIXED RATE 3.6900% 2004 2016 6,768.00 75.11 3,947.03 43.80
FIXED RATE 0.0000% 2002 2011 12,500.00 138.73 4,428.22 49.14
FIXED RATE 0.0000% 2003 2011 10,000.00 110.98 3,542.57 39.32
FIXED RATE 0.0000% 2004 2011 3,000.00 33.29 1,062.77 11.79
FIXED RATE 0.0000% 2004 2011 7,000.00 77.69 2,479.81 27.52
FIXED RATE 0.3600% 2009 2028 10,000.00 110.98 6,000.00 66.59
FIXED RATE 2.5000% 1991 2021 30,084.00 333.87 17,610.14 195.44
FIXED RATE 2.5000% 1992 2022 6,686.00 74.20 4,076.83 45.24
FIXED RATE 3.0000% 1994 2024 22,500.00 249.71 17,012.15 188.80
FIXED RATE 3.0000% 1994 2024 15,000.00 166.47 9,602.25 106.57
FIXED RATE 2.5000% 1995 2025 5,283.00 58.63 1,074.37 11.92
FIXED RATE 2.1000% 1995 2025 848.00 9.41 422.05 4.68
FIXED RATE 2.5000% 1995 2025 1,104.00 12.25 797.41 8.85
(2) (2)
頁 213 / 247424(b)(3)
2014/03/12file:///C:/blp/data/CFd424b3.htm

Table of ContentsTable of ContentsTable of ContentsTable of Contents
GUARANTEED EXTERNAL DEBT OF THE REPUBLIC OF THE PHILIPPINES—(Continued) As of September 30, 2009
(In millions)
T-4
Interest Rate Basis
InterestRate/
Spread/ServiceCharge
(Per Annum)
Original AmountContracted
Outstanding Balanceas of September 30,
2009
CurrencyYear
ContractedYear of
Maturity(in OriginalCurrency)
(in USDollars)
(in OriginalCurrency)
(in USDollars)
FIXED RATE 2.1000% 1995 2025 248.00 2.75 256.58 2.85
FIXED RATE 2.7000% 1995 2025 11,394.00 126.45 8,492.99 94.26
FIXED RATE 2.3000% 1995 2025 921.00 10.22 1,100.61 12.21
FIXED RATE 2.7000% 1996 2026 22,837.00 253.45 11,777.50 130.71
FIXED RATE 2.3000% 1996 2026 1,875.00 20.81 4,791.96 53.18
FIXED RATE 2.7000% 1996 2026 10,184.00 113.02 8,241.95 91.47
FIXED RATE 2.3000% 1996 2026 310.00 3.44 201.23 2.23
FIXED RATE 2.5000% 1996 2026 5,000.00 55.49 3,944.26 43.77
FIXED RATE 2.1000% 1996 2026 158.00 1.75 127.12 1.41
FIXED RATE 2.3000% 1997 2027 8,760.00 97.22 429.24 4.76
FIXED RATE 2.7000% 1997 2027 14,011.00 155.49 8,577.10 95.19
FIXED RATE 2.3000% 1997 2027 449.00 4.98 323.02 3.58
FIXED RATE 2.5000% 1997 2027 5,903.00 65.51 2,385.60 26.48
FIXED RATE 2.1000% 1997 2027 1,325.00 14.70 1,219.02 13.53
FIXED RATE 2.5000% 1997 2027 386.00 4.28 249.17 2.77
FIXED RATE 2.1000% 1997 2027 648.00 7.19 431.87 4.79
FIXED RATE 2.5000% 1997 2027 1,927.00 21.39 302.30 3.35
FIXED RATE 2.1000% 1997 2027 819.00 9.09 154.14 1.71
FIXED RATE 2.2000% 1998 2028 13,788.00 153.02 12,307.55 136.59
FIXED RATE 0.7500% 1998 2038 767.00 8.51 970.51 10.77
FIXED RATE 2.2000% 1998 2028 19,532.00 216.77 17,585.03 195.16
FIXED RATE 0.7500% 1998 2038 458.00 5.08 389.88 4.33
FIXED RATE 2.2000% 1998 2028 3,064.00 34.00 459.27 5.10
FIXED RATE 1.7000% 1998 2028 2,193.00 24.34 3,254.89 36.12
FIXED RATE 0.7500% 1998 2038 815.00 9.04 1,959.36 21.74
FIXED RATE 2.2000% 1999 2028 3,064.00 34.00 35,260.22 391.32
FIXED RATE 1.7000% 1999 2028 2,193.00 24.34 20,528.98 227.83
FIXED RATE 0.9500% 1999 2040 15,091.00 167.48 11,544.70 128.12
FIXED RATE 0.7500% 1999 2040 1,359.00 15.08 1,324.80 14.70
FIXED RATE 0.9500% 2001 2041 39,455.00 437.87 46,791.77 519.30
FIXED RATE 0.7500% 2001 2041 2,476.00 27.48 2,870.55 31.86
FIXED RATE 1.4000% 2009 2038 1,500.00 16.65 30.00 0.33
FIXED RATE 0.6500% 2009 2048 23,100.00 256.36 3,055.16 33.91
JAPAN LONG TERM PRIME 0.0000% 2003 2023 1,188.00 13.18 1,188.20 13.19
JAPAN LONG TERM PRIME 0.0000% 1994 2014 12,400.00 137.62 1,840.43 20.43
JAPAN LONG TERM PRIME 0.0000% 1992 2014 6,100.00 67.70 1,907.88 21.17
JAPAN LONG TERM PRIME 0.2000% 1999 2014 26,000.00 288.55 9,762.88 108.35
JAPAN LONG TERM PRIME 1.2500% 2003 2022 1,250.00 13.87 1,205.36 13.38
JAPAN LONG TERM PRIME 1.2500% 2005 2022 3,750.00 41.62 1,954.75 21.69
LIBOR BASE RATE 0.0000% 2000 2014 3,676.05 40.80 23.95 0.27
LIBOR BASE RATE 0.0000% 2002 2021 2,166.00 24.04 2,112.96 23.45
LIBOR BASE RATE 0.6000% 2003 2018 3,318.00 36.82 1,324.77 14.70
LIBOR BASE RATE 0.0000% 2005 2026 2,746.63 30.48 2,746.63 30.48
LIBOR BASE RATE 0.5000% 1996 2016 9,090.40 100.89 1,632.71 18.12
LIBOR BASE RATE 0.2500% 2005 2022 6,592.00 73.16 2,253.74 25.01
(2) (2)
頁 214 / 247424(b)(3)
2014/03/12file:///C:/blp/data/CFd424b3.htm

Table of ContentsTable of ContentsTable of ContentsTable of Contents
GUARANTEED EXTERNAL DEBT OF THE REPUBLIC OF THE PHILIPPINES—(Continued) As of September 30, 2009
(In millions)
T-5
Interest Rate Basis
InterestRate/
Spread/ServiceCharge
(Per Annum)
Original AmountContracted
Outstanding Balanceas of September 30,
2009
CurrencyYear
ContractedYear of
Maturity(in OriginalCurrency)
(in USDollars)
(in OriginalCurrency)
(in USDollars)
LIBOR BASE RATE 0.2500% 2006 2026 11,710.00 129.96 2,352.68 26.11
US LIBOR 0.0000% 2001 2020 2,400.00 26.64 1,760.00 19.53
LIBOR 0.0000% 2004 2025 25.00 0.28 1,726.55 19.16
JAPAN LONG TERM PRIME 0.1000% 2007 2022 5,593.00 62.07 5,593.50 62.08
SPECIAL DRAWING RIGHTS 18.50 29.18 6.08 9.60
INTEREST FREE 0.7500% 1998 2037 5.00 7.89 0.37 0.58
LIBOR 6MOS. DEPOSIT 0.8000% 1995 2034 3.50 5.52 3.16 4.99
LIBOR 6MOS. DEPOSIT 0.8000% 1995 2014 7.00 11.04 2.55 4.02
UNITED STATES DOLLARS 4,780.85 4,780.85 1,155.46 1,155.46
ADB FLOATING RATE 0.0000% 1988 2012 43.50 43.50 14.52 14.52
ADB FLOATING RATE 0.0000% 1989 2012 26.40 26.40 8.90 8.90
ADB FLOATING RATE 0.0000% 1989 2009 160.00 160.00 9.62 9.62
ADB FLOATING RATE 0.0000% 1989 2014 130.00 130.00 51.54 51.54
ADB FLOATING RATE 0.0000% 1992 2012 75.00 75.00 28.23 28.23
ADB FLOATING RATE 0.0000% 1993 2018 43.20 43.20 13.84 13.84
ADB FLOATING RATE 0.0000% 1993 2013 164.00 164.00 47.46 47.46
ADB FLOATING RATE 0.0000% 1995 2020 92.00 92.00 66.13 66.13
ADB FLOATING RATE 0.0000% 1998 2021 50.00 50.00 19.92 19.92
ADB FLOATING RATE 0.0000% 1996 2011 5.35 5.35 1.25 1.25
ADB FLOATING RATE 0.0000% 1998 2017 20.22 20.22 29.56 29.56
FIXED RATE 2.0000% 1993 2013 19.30 19.30 7.35 7.35
FIXED RATE 1.2500% 1993 2025 24.50 24.50 16.73 16.73
FIXED RATE 3.5750% 1995 2012 37.90 37.90 11.37 11.37
FIXED RATE 2.2500% 1996 2011 18.80 18.80 1.63 1.63
FIXED RATE 7.6500% 1996 2009 25.00 25.00 0.33 0.33
FIXED RATE 6.5000% 1997 2010 11.10 11.10 0.85 0.85
FIXED RATE 4.0000% 1995 2018 15.00 15.00 6.87 6.87
FIXED RATE 1.5000% 1990 2010 11.21 11.21 11.17 11.17
FIXED RATE 5.6300% 2004 2034 35.00 35.00 11.28 11.28
LIBOR 6MOS. DEPOSIT 1.0000% 2008 2018 90.00 90.00 71.41 71.41
IBRD COST OF QUALIFIED
BORROWINGS 0.5000% 1989 2009 40.00 40.00 2.05 2.05
IBRD COST OF QUALIFIED
BORROWINGS 0.5000% 1990 2010 200.00 200.00 21.52 21.52
IBRD COST OF QUALIFIED
BORROWINGS 0.5000% 1990 2010 150.00 150.00 14.97 14.97
IBRD COST OF QUALIFIED
BORROWINGS 0.5000% 1991 2011 175.00 175.00 27.69 27.69
IBRD COST OF QUALIFIED
BORROWINGS 0.5000% 1992 2012 91.30 91.30 16.02 16.02
IBRD COST OF QUALIFIED
BORROWINGS 0.5000% 1991 2011 150.00 150.00 31.08 31.08
(2) (2)
頁 215 / 247424(b)(3)
2014/03/12file:///C:/blp/data/CFd424b3.htm

Table of ContentsTable of ContentsTable of ContentsTable of Contents
GUARANTEED EXTERNAL DEBT OF THE REPUBLIC OF THE PHILIPPINES—(Continued) As of September 30, 2009
(In millions)
T-6
Interest Rate Basis
InterestRate/
Spread/ServiceCharge
(Per Annum)
Original AmountContracted
Outstanding Balanceas of September 30,
2009
CurrencyYear
ContractedYear of
Maturity(in OriginalCurrency)
(in USDollars)
(in OriginalCurrency)
(in USDollars)
IBRD COST OF QUALIFIED
BORROWINGS 0.5000% 1991 2011 15.00 15.00 0.31 0.31
IBRD COST OF QUALIFIED
BORROWINGS 0.5000% 1993 2013 110.00 110.00 19.22 19.22
IBRD COST OF QUALIFIED
BORROWINGS 0.5000% 1994 2014 127.35 127.35 53.27 53.27
IBRD COST OF QUALIFIED
BORROWINGS 0.5000% 1994 2014 19.65 19.65 5.24 5.24
IBRD COST OF QUALIFIED
BORROWINGS 0.5000% 1994 2013 64.00 64.00 22.32 22.32
IBRD COST OF QUALIFIED
BORROWINGS 0.5000% 1994 2014 40.00 40.00 17.35 17.35
IBRD COST OF QUALIFIED
BORROWINGS 0.5000% 1994 2014 113.00 113.00 40.58 40.58
IBRD COST OF QUALIFIED
BORROWINGS 0.5000% 1995 2014 88.00 88.00 4.63 4.63
IBRD COST OF QUALIFIED
BORROWINGS 0.5000% 1994 2014 114.00 114.00 22.90 22.90
IBRD COST OF QUALIFIED
BORROWINGS 0.5000% 1995 2015 50.00 50.00 12.69 12.69
IBRD COST OF QUALIFIED
BORROWINGS 0.5000% 1995 2011 50.00 50.00 3.09 3.09
LIBOR 6MOS. DEPOSIT 0.0000% 2000 2013 7.50 7.50 4.50 4.50
LIBOR 6MOS. DEPOSIT 0.0000% 1998 2008 25.00 25.00 2.50 2.50
LIBOR BASE RATE 0.0000% 2003 2022 40.00 40.00 35.05 35.05
LIBOR BASE RATE 0.0000% 2003 2013 3.26 3.26 0.80 0.80
LIBOR BASE RATE 0.5000% 1995 2015 50.00 50.00 20.03 20.03
LIBOR BASE RATE 0.5000% 1996 2016 100.00 100.00 18.98 18.98
LIBOR BASE RATE 0.5000% 1996 2016 150.00 150.00 60.55 60.55
LIBOR BASE RATE 0.5000% 1996 2016 57.00 57.00 19.92 19.92
LIBOR BASE RATE 0.5000% 1996 2017 60.00 60.00 14.84 14.84
LIBOR BASE RATE 0.5000% 1997 2017 54.50 54.50 8.51 8.51
LIBOR BASE RATE 0.5000% 1998 2018 150.00 150.00 107.19 107.19
LIBOR BASE RATE 0.5000% 2008 2025 12.94 12.94 11.71 11.71
IBRD COST OF QUALIFIED
BORROWINGS 5.0000% 1996 2015 24.07 24.07 13.67 13.67
US FLOATING RATE 0.9000% 1999 2014 200.00 200.00 92.34 92.34
B. BONDS 5,122.63 4,986.92
(2) (2)
頁 216 / 247424(b)(3)
2014/03/12file:///C:/blp/data/CFd424b3.htm

Table of ContentsTable of ContentsTable of ContentsTable of Contents
GUARANTEED EXTERNAL DEBT OF THE REPUBLIC OF THE PHILIPPINES—(Continued) As of September 30, 2009
(In millions)
T-7
Interest Rate Basis
InterestRate/
Spread/ServiceCharge
(Per Annum)
Original AmountContracted
Outstanding Balanceas of September 30,
2009
CurrencyYear
ContractedYear of
Maturity(in OriginalCurrency)
(in USDollars)
(in OriginalCurrency)
(in USDollars)
UNITED STATES DOLLARS 4,060.00 4,060.00 3,924.29 3,924.29
FIXED RATE 8.4000% 1996 2016 160.00 160.00 160.00 160.00
FIXED RATE 9.6250% 1998 2028 300.00 300.00 300.00 300.00
FIXED RATE 9.8750% 2000 2010 500.00 500.00 500.00 500.00
FIXED RATE 0.0000% 2002 2010 300.00 300.00 300.00 300.00
FIXED RATE 0.0000% 2003 2010 400.00 400.00 400.00 400.00
FIXED RATE 5.4500% 2003 2018 250.00 250.00 214.29 214.29
FIXED RATE 9.2500% 2003 2011 150.00 150.00 150.00 150.00
FIXED RATE 6.8750% 2006 2016 500.00 500.00 500.00 500.00
LIBOR RATE -3 MOS 0.0000% 2005 2011 300.00 300.00 300.00 300.00
LIBOR RATE -3 MOS 0.0000% 2005 2011 100.00 100.00 100.00 100.00
FIXED RATE 7.2500% 2009 2019 1,000.00 1,000.00 1,000.00 1,000.00
JAPANESE YEN 95,750.00 1,062.63 95,750.00 1,062.63
FIXED RATE 4.6500% 1995 2015 12,000.00 133.18 12,000.00 133.18FIXED RATE 2.3500% 2000 2010 22,000.00 244.16 22,000.00 244.16FIXED RATE 3.2000% 2002 2020 24,750.00 274.68 24,750.00 274.68FIXED RATE 3.5000% 2002 2022 37,000.00 410.63 37,000.00 410.63
II. GFI GUARANTEE ASSUMED BY NATIONAL GOVERNMENT 111.12 85.90 85.91
SAUDI RIAL 27.34 7.29 27.34 7.29
INTEREST FREE 0.0000% 1986 Upon Demand 2.96 0.79 2.96 0.79
INTEREST FREE 0.0000% 1986 Upon Demand 5.92 1.58 5.92 1.58
0.0000% 1986 Upon Demand 18.46 4.92 18.46 4.92
UNITED STATES DOLLARS 77.64 77.64 77.64 77.64
INTEREST FREE 0.0000% 1988 Upon Demand 7.51 7.51 7.51 7.51
INTEREST FREE 0.0000% 1986 Upon Demand 0.72 0.72 0.72 0.72
INTEREST FREE 0.0000% 1986 Upon Demand 2.18 2.18 2.18 2.18
INTEREST FREE 0.0000% 1986 Upon Demand 33.09 33.09 33.09 33.09
INTEREST FREE 0.0000% 1986 Upon Demand 18.60 18.60 18.60 18.60
INTEREST FREE 0.0000% 1986 Upon Demand 0.51 0.51 0.51 0.51
INTEREST FREE 0.0000% 1986 Upon Demand 5.22 5.22 5.22 5.22
INTEREST FREE 0.0000% 1986 Upon Demand 8.33 8.33 8.33 8.33
INTEREST FREE 0.0000% 1986 Upon Demand 0.97 0.97 0.97 0.97
INTEREST FREE 0.0000% 1986 Upon Demand 0.51 0.51 0.51 0.51
FRENCH FRANCS
INTEREST FREE 0.0000% 1986 Upon Demand 3.13 0.70 3.13 0.70
CANADIAN DOLLARS
INTEREST FREE 0.0000% 1986 Upon Demand 0.27 0.25 0.27 0.25
JAPANESE YEN
INTEREST FREE 0.0000% 1986 Upon Demand 2.74 0.03 2.74 0.03
(1) Includes government guarantee on GOCC (loans and bonds) GFI guarantee assumed by the Government per Proc. 50. (2) Amount in original currencies were converted to US Dollars using BSP reference rate on September 30, 2009.
(2) (2)
頁 217 / 247424(b)(3)
2014/03/12file:///C:/blp/data/CFd424b3.htm

Table of ContentsTable of ContentsTable of ContentsTable of Contents
EXTERNAL DEBT OF THE REPUBLIC OF THE PHILIPPINESAs of September 30, 2009
(In millions)
T-8
InterestRate/
Spread/ServiceCharge
(Per Annum)
Original AmountContracted
OutstandingBalance as of
September 30, 2009
Currency Interest Rate BasisYear
ContractedYear of
Maturity(in Orig.
Currency)(in US
Dollars)(in Orig.
Currency)(in US
Dollars)
GRAND TOTAL 60,735.25 40,214.47
I. DIRECT DEBT OF THE REPUBLIC 36,659.37 17,451.09
A. AVAILED OF BY GOVERNMENT AGENCIES 34,062.17 15,964.45
AUSTRIAN SCHILLINGS 1,407.12 149.11 1,233.00 130.66
FIXED RATE 4.0000% 1997 2014 199.86 21.18 66.62 7.06
FIXED RATE 4.5000% 2002 2019 207.26 21.96 167.40 17.74
FIXED RATE 4.5000% 1999 2022 1,000.00 105.97 998.98 105.86
CANADIAN DOLLARS 6.33 5.83 1.46 1.34
INTEREST FREE 0.0000% 1974 2024 6.33 5.83 1.46 1.34
SWISS FRANCS 164.13 158.38 50.37 48.61
FIXED RATE 4.6300% 1998 2014 37.60 36.28 3.52 3.39
CHF LIBOR 0.0000% 2001 2014 94.89 91.57 46.86 45.21
CHINA YUAN 1,200.00 175.75 1,199.21 175.63
FIXED RATE 2.0000% 2006 2031 400.00 58.58 399.21 58.47
FIXED RATE 2.0000% 2007 2027 800.00 117.16 800.00 117.16
DEUTSCHEMARKS 78.80 58.75 12.63 9.41
FIXED RATE 2.0000% 1984 2014 13.50 10.07 3.63 2.71
FIXED RATE 2.0000% 1984 2014 16.50 12.30 4.43 3.31
FIXED RATE 2.0000% 1990 2020 6.60 4.92 3.80 2.83
FIXED RATE 2.0000% 1982 2012 24.20 18.04 0.47 0.35
FIXED RATE 2.0000% 1981 2011 3.00 2.24 0.30 0.22
DANISH KRONER 80.00 15.67 0.48 0.09
INTEREST FREE 0.0000% 1985 2009 15.00 2.94 0.48 0.09
EURO 288.32 420.43 175.20 255.48
INTEREST FREE 0.0000% 2000 2016 8.48 12.37 4.08 5.95
INTEREST FREE 0.0000% 2000 2017 1.84 2.68 1.05 1.53
INTEREST FREE 0.0000% 2007 2024 5.30 7.73 5.21 7.59
INTEREST FREE 0.0000% 2008 2020 11.35 16.55 7.52 10.96
2008 2020 14.90 21.73 3.08 4.49
2008 2020 15.20 22.16 0.99 1.45
FIXED RATE 0.4700% 1998 2030 3.30 4.81 0.74 1.08
FIXED RATE 0.4700% 1998 2030 43.20 62.99 3.24 4.73
FIXED RATE 0.7500% 2002 2042 7.39 10.78 6.82 9.95
FIXED RATE 0.7500% 2002 2042 7.46 10.88 7.38 10.76
FIXED RATE 6.1000% 2002 2042 5.83 8.50 3.21 4.67
FIXED RATE 1.5000% 1995 2014 8.08 11.78 4.85 7.07
FIXED RATE 3.4500% 2002 2011 18.17 26.50 18.17 26.49
FIXED RATE 3.6500% 2002 2025 36.34 52.99 31.24 45.55
FIXED RATE 4.0000% 2000 2023 31.25 45.57 31.25 45.57
FIXED RATE 4.4000% 2001 2024 23.99 34.98 23.99 34.98
FIXED RATE 4.9400% 1999 2010 3.46 5.05 0.85 1.24
FIXED RATE 4.9400% 1999 2010 0.77 1.12 0.11 0.16
FIXED RATE 5.0600% 2008 2014 0.97 1.42 0.17 0.24
(1)
(2) (2)
頁 218 / 247424(b)(3)
2014/03/12file:///C:/blp/data/CFd424b3.htm

Table of ContentsTable of ContentsTable of ContentsTable of Contents
EXTERNAL DEBT OF THE REPUBLIC OF THE PHILIPPINES —(Continued) As of September 30, 2009
(In millions)
T-9
InterestRate/
Spread/ServiceCharge
(Per Annum)
Original AmountContracted
OutstandingBalance as of
September 30, 2009
Currency Interest Rate BasisYear
ContractedYear of
Maturity(in Orig.
Currency)(in US
Dollars)(in Orig.
Currency)(in US
Dollars)
EURO LIBOR 0.6000% 2005 2017 14.50 21.14 6.93 10.10
EURO LIBOR 0.3000% 2008 2021 12.50 18.23 10.24 14.94
EURO LIBOR 1.2500% 2008 2013 10.48 15.28 3.45 5.03
EURO LIBOR 2.5000% 2008 2014 0.66 0.96 0.50 0.72
FIXED RATE 5.1200% 2008 2019 2.90 4.23 0.15 0.21
FRENCH FRANCS 989.40 219.94 463.95 103.14
FIXED RATE 3.0000% 1989 2023 28.50 6.34 16.18 3.60
FIXED RATE 3.0000% 1989 2020 9.50 2.11 5.08 1.13
FIXED RATE 2.5000% 1990 2022 29.07 6.46 19.06 4.24
FIXED RATE 2.5000% 1990 2022 27.25 6.06 18.17 4.04
FIXED RATE 2.5000% 1990 2022 17.40 3.87 11.53 2.56
FIXED RATE 2.5000% 1992 2023 6.67 1.48 4.77 1.06
FIXED RATE 2.0000% 1992 2024 69.00 15.34 48.29 10.74
FIXED RATE 2.0000% 1992 2024 4.78 1.06 3.37 0.75
FIXED RATE 2.0000% 1992 2023 18.90 4.20 13.29 2.95
FIXED RATE 2.0000% 1992 2022 4.98 1.11 3.36 0.75
FIXED RATE 2.0000% 1990 2023 14.22 3.16 10.13 2.25
FIXED RATE 3.3000% 1993 2013 73.42 16.32 29.05 6.46
FIXED RATE 3.3000% 1993 2013 18.40 4.09 6.91 1.54
FIXED RATE 3.3000% 1993 2013 10.40 2.31 3.74 0.83
FIXED RATE 3.5000% 1995 2015 15.00 3.33 6.05 1.34
FIXED RATE 3.5000% 1995 2017 5.00 1.11 2.22 0.49
FIXED RATE 3.5000% 1996 2018 49.70 11.05 3.37 0.75
FIXED RATE 3.1000% 1993 2014 42.40 9.43 17.73 3.94
FIXED RATE 3.1000% 1993 2014 80.00 17.78 34.66 7.70
FIXED RATE 3.1000% 1993 2014 7.97 1.77 3.70 0.82
FIXED RATE 1.4000% 1994 2016 17.64 3.92 12.56 2.79
FIXED RATE 1.4000% 1994 2016 102.13 22.70 72.87 16.20
FIXED RATE 1.5000% 1995 2023 12.60 2.80 8.62 1.92
FIXED RATE 1.5000% 1995 2022 4.88 1.08 3.59 0.80
FIXED RATE 1.5000% 1995 2018 16.00 3.56 0.14 0.03
FIXED RATE 3.5000% 1997 2019 24.00 5.34 17.20 3.82
FIXED RATE 7.5000% 1995 2017 13.55 3.01 3.20 0.71
FIXED RATE 1.5000% 1995 2029 20.33 4.52 17.56 3.90
FIXED RATE 5.8200% 1997 2010 24.04 5.34 0.63 0.14
FIXED RATE 1.5000% 1997 2023 36.06 8.02 28.07 6.24
FIXED RATE 1.5000% 1997 2023 59.98 13.33 37.44 8.32
FIXED RATE 5.6800% 1997 2010 39.98 8.89 1.43 0.32
POUNDS STERLING 16.25 25.93 5.69 9.08
FIXED RATE 6.7400% 2001 2013 16.25 25.93 5.69 9.08
ITALIAN LIRA 10,185.74 7.67 2,421.57 1.82
LIBOR 6 MONTHS
DEPOSIT 1.5000% 1990 2011 10,185.74 7.67 2,421.57 1.82
JAPANESE YEN 1,670,799.88 18,542.54 769,590.98 8,540.92
ADB FLOATING RATE 0.0000% 1986 2012 82.00 0.91 2,912.31 32.32
ADB FLOATING RATE 0.0000% 1986 2010 24.00 0.27 444.45 4.93
ADB FLOATING RATE 0.0000% 1990 2020 33.00 0.37 2,579.53 28.63
ADB FLOATING RATE 0.0000% 1991 2015 150.00 1.66 7,701.13 85.47
(1)
(2) (2)
頁 219 / 247424(b)(3)
2014/03/12file:///C:/blp/data/CFd424b3.htm

Table of ContentsTable of ContentsTable of ContentsTable of Contents
EXTERNAL DEBT OF THE REPUBLIC OF THE PHILIPPINES —(Continued) As of September 30, 2009
(In millions)
T-10
InterestRate/
Spread/ServiceCharge
(Per Annum)
Original AmountContracted
OutstandingBalance as of
September 30, 2009
Currency Interest Rate BasisYear
ContractedYear of
Maturity(in Orig.
Currency)(in US
Dollars)(in Orig.
Currency)(in US
Dollars)
FIXED RATE 3.0000% 1987 2012 30,000.00 332.94 5,675.67 62.99
FIXED RATE 1.4000% 2009 2039 9,293.00 103.13 9,293.00 103.13
FIXED RATE 3.0000% 1980 2010 730.00 8.10 28.17 0.31
FIXED RATE 3.0000% 1980 2010 1,860.00 20.64 90.73 1.01
FIXED RATE 3.0000% 1980 2010 150.00 1.66 7.31 0.08
FIXED RATE 3.0000% 1980 2010 5,410.00 60.04 263.90 2.93
FIXED RATE 3.0000% 1980 2010 850.00 9.43 39.51 0.44
FIXED RATE 3.0000% 1980 2010 1,100.00 12.21 47.79 0.53
FIXED RATE 3.0000% 1981 2011 6,300.00 69.92 373.22 4.14
FIXED RATE 3.0000% 1981 2011 7,600.00 84.34 738.71 8.20
FIXED RATE 3.0000% 1982 2012 3,630.00 40.29 404.75 4.49
FIXED RATE 3.0000% 1982 2012 330.00 3.66 44.09 0.49
FIXED RATE 3.0000% 1982 2012 3,600.00 39.95 500.62 5.56
FIXED RATE 3.0000% 1982 2012 3,860.00 42.84 552.21 6.13
FIXED RATE 3.0000% 1983 2013 6,300.00 69.92 574.40 6.37
FIXED RATE 3.0000% 1983 2013 5,400.00 59.93 398.34 4.42
FIXED RATE 3.0000% 1983 2013 1,140.00 12.65 201.54 2.24
FIXED RATE 3.5000% 1984 2014 3,012.00 33.43 730.97 8.11
FIXED RATE 3.5000% 1984 2014 1,381.00 15.33 136.80 1.52
FIXED RATE 3.5000% 1986 2016 148.00 1.64 34.83 0.39
FIXED RATE 3.5000% 1986 2016 705.00 7.82 156.17 1.73
FIXED RATE 3.5000% 1986 2016 7,595.00 84.29 2,493.90 27.68
FIXED RATE 3.5000% 1986 2016 3,988.00 44.26 1,358.84 15.08
FIXED RATE 3.5000% 1986 2016 1,439.00 15.97 329.24 3.65
FIXED RATE 3.5000% 1986 2016 2,555.00 28.36 497.71 5.52
FIXED RATE 3.0000% 1988 2018 2,254.00 25.01 65.67 0.73
FIXED RATE 3.0000% 1988 2018 4,837.00 53.68 1,843.80 20.46
FIXED RATE 3.0000% 1988 2018 10,818.00 120.06 3,737.65 41.48
FIXED RATE 3.0000% 1988 2018 2,090.00 23.19 848.44 9.42
FIXED RATE 3.0000% 1988 2018 5,735.00 63.65 2,359.52 26.19
FIXED RATE 3.0000% 1988 2018 3,193.00 35.44 1,122.75 12.46
FIXED RATE 3.0000% 1988 2018 4,611.00 51.17 1,863.06 20.68
FIXED RATE 3.0000% 1988 2018 3,372.00 37.42 1,127.05 12.51
FIXED RATE 3.0000% 1988 2018 2,000.00 22.20 580.09 6.44
FIXED RATE 3.0000% 1988 2018 707.00 7.85 250.65 2.78
FIXED RATE 3.0000% 1988 2018 326.00 3.62 130.15 1.44
FIXED RATE 3.0000% 1988 2018 308.00 3.42 124.56 1.38
FIXED RATE 3.0000% 1988 2018 14,003.00 155.41 6,121.76 67.94
FIXED RATE 2.7000% 1989 2019 2,063.00 22.90 988.88 10.97
FIXED RATE 2.7000% 1989 2019 4,776.00 53.00 1,607.88 17.84
FIXED RATE 2.7000% 1989 2019 2,633.00 29.22 953.24 10.58
FIXED RATE 2.7000% 1989 2019 5,500.00 61.04 2,459.00 27.29
FIXED RATE 2.7000% 1989 2019 2,169.00 24.07 1,039.20 11.53
FIXED RATE 2.7000% 1990 2020 2,304.00 25.57 1,165.63 12.94
FIXED RATE 2.7000% 1990 2020 4,238.00 47.03 1,871.84 20.77
FIXED RATE 2.7000% 1990 2020 2,079.00 23.07 1,034.71 11.48
FIXED RATE 2.7000% 1990 2020 2,708.00 30.05 2,754.70 30.57
FIXED RATE 2.7000% 1990 2020 8,634.00 95.82 3,799.74 42.17
FIXED RATE 2.7000% 1990 2020 454.00 5.04 161.97 1.80
FIXED RATE 2.7000% 1990 2020 4,986.00 55.33 2,546.17 28.26
FIXED RATE 2.7000% 1990 2020 5,080.00 56.38 1,626.60 18.05
(1)
(2) (2)
頁 220 / 247424(b)(3)
2014/03/12file:///C:/blp/data/CFd424b3.htm

Table of ContentsTable of ContentsTable of ContentsTable of Contents
EXTERNAL DEBT OF THE REPUBLIC OF THE PHILIPPINES —(Continued) As of September 30, 2009
(In millions)
T-11
InterestRate/
Spread/ServiceCharge
(Per Annum)
Original AmountContracted
OutstandingBalance as of
September 30, 2009
Currency Interest Rate BasisYear
ContractedYear of
Maturity(in Orig.
Currency)(in US
Dollars)(in Orig.
Currency)(in US
Dollars)
FIXED RATE 2.7000% 1990 2020 21,752.00 241.40 8,372.28 92.92
FIXED RATE 2.7000% 1988 2013 15,000.00 166.47 3,648.65 40.49
FIXED RATE 2.7000% 1988 2013 25,000.00 277.45 6,081.08 67.49
FIXED RATE 2.7000% 1988 2013 12,500.00 138.73 3,040.53 33.74
FIXED RATE 2.7000% 1989 2014 40,000.00 443.92 11,891.89 131.98
FIXED RATE 2.7000% 1990 2020 4,301.00 47.73 2,202.69 24.45
FIXED RATE 2.7000% 1991 2016 13,219.00 146.70 4,644.51 51.54
FIXED RATE 2.7000% 1991 2021 2,065.00 22.92 1,062.67 11.79
FIXED RATE 2.7000% 1991 2021 1,663.00 18.46 885.07 9.82
FIXED RATE 2.7000% 1991 2021 1,795.00 19.92 736.51 8.17
FIXED RATE 2.7000% 1991 2021 5,266.00 58.44 2,825.45 31.36
FIXED RATE 2.7000% 1991 2021 10,790.00 119.75 6,192.05 68.72
FIXED RATE 2.7000% 1991 2021 20,020.00 222.18 11,718.98 130.06
FIXED RATE 2.7000% 1990 2020 28,200.00 312.96 15,819.49 175.56
FIXED RATE 2.7000% 1991 2016 10,575.00 117.36 3,715.53 41.23
FIXED RATE 2.7000% 1991 2016 13,219.00 146.70 5,001.78 55.51
FIXED RATE 2.7000% 1992 2021 7,655.00 84.96 2,841.25 31.53
FIXED RATE 3.0000% 1992 2017 25,380.00 281.67 10,975.12 121.80
FIXED RATE 3.0000% 1993 2023 6,872.00 76.27 4,552.27 50.52
FIXED RATE 3.0000% 1993 2023 4,633.00 51.42 2,709.67 30.07
FIXED RATE 3.0000% 1993 2023 3,803.00 42.21 2,429.31 26.96
FIXED RATE 3.0000% 1993 2023 3,055.00 33.90 2,086.31 23.15
FIXED RATE 3.0000% 1993 2023 9,294.00 103.14 3,919.27 43.50
FIXED RATE 3.0000% 1994 2024 9,620.00 106.76 7,226.19 80.20
FIXED RATE 3.0000% 1994 2024 4,616.00 51.23 3,268.95 36.28
FIXED RATE 3.0000% 1994 2024 11,754.00 130.45 8,887.05 98.63
FIXED RATE 2.7000% 1995 2025 5,356.00 59.44 3,925.92 43.57
FIXED RATE 2.3000% 1995 2025 795.00 8.82 613.41 6.81
FIXED RATE 2.7000% 1995 2025 3,454.00 38.33 2,582.27 28.66
FIXED RATE 2.3000% 1995 2025 586.00 6.50 455.26 5.05
FIXED RATE 2.5000% 1995 2025 7,470.00 82.90 5,818.91 64.58
FIXED RATE 2.1000% 1995 2025 842.00 9.34 649.92 7.21
FIXED RATE 2.7000% 1995 2025 16,396.00 181.96 12,486.37 138.57
FIXED RATE 2.3000% 1995 2025 1,995.00 22.14 1,856.32 20.60
FIXED RATE 2.7000% 1995 2025 4,982.00 55.29 3,663.33 40.66
FIXED RATE 2.3000% 1995 2025 597.00 6.63 443.97 4.93
FIXED RATE 2.7000% 1995 2025 5,386.00 59.77 4,106.66 45.58
FIXED RATE 2.3000% 1995 2025 1,000.00 11.10 734.75 8.15
FIXED RATE 2.7000% 1995 2025 11,000.00 122.08 8,191.52 90.91
FIXED RATE 2.3000% 1995 2025 1,895.00 21.03 1,560.03 17.31
FIXED RATE 2.7000% 1995 2025 4,275.00 47.44 2,644.38 29.35
FIXED RATE 2.3000% 1995 2025 490.00 5.44 355.46 3.94
FIXED RATE 2.7000% 1995 2025 7,120.00 79.02 5,072.16 56.29
FIXED RATE 2.3000% 1995 2025 2,431.00 26.98 1,897.44 21.06
FIXED RATE 2.7000% 1995 2025 2,303.00 25.56 980.80 10.88
FIXED RATE 2.3000% 1995 2025 569.00 6.31 436.32 4.84
FIXED RATE 2.5000% 1996 2026 5,956.00 66.10 4,793.84 53.20
FIXED RATE 2.1000% 1996 2026 954.78 10.60 768.44 8.53
FIXED RATE 2.3000% 1996 2026 305.00 3.38 182.85 2.03
FIXED RATE 2.7000% 1997 2027 4,844.00 53.76 2,892.44 32.10
FIXED RATE 2.3000% 1997 2027 902.00 10.01 631.93 7.01
(1)
(2) (2)
頁 221 / 247424(b)(3)
2014/03/12file:///C:/blp/data/CFd424b3.htm

Table of ContentsTable of ContentsTable of ContentsTable of Contents
EXTERNAL DEBT OF THE REPUBLIC OF THE PHILIPPINES —(Continued) As of September 30, 2009
(In millions)
T-12
InterestRate/
Spread/ServiceCharge
(Per Annum)
Original AmountContracted
OutstandingBalance as of
September 30, 2009
Currency Interest Rate BasisYear
ContractedYear of
Maturity(in Orig.
Currency)(in US
Dollars)(in Orig.
Currency)(in US
Dollars)
FIXED RATE 2.7000% 1997 2027 5,598.00 62.13 5,317.94 59.02
FIXED RATE 2.3000% 1997 2027 2,085.00 23.14 1,050.67 11.66
FIXED RATE 2.7000% 1997 2027 5,772.00 64.06 4,923.63 54.64
FIXED RATE 2.3000% 1997 2027 821.00 9.11 488.39 5.42
FIXED RATE 2.5000% 1997 2027 8,219.00 91.21 6,847.05 75.99
FIXED RATE 2.1000% 1997 2027 1,192.00 13.23 770.07 8.55
FIXED RATE 2.5000% 1997 2027 6,753.00 74.94 5,306.07 58.89
FIXED RATE 2.1000% 1997 2027 1,226.00 13.61 926.21 10.28
FIXED RATE 2.7000% 1997 2027 7,103.00 78.83 5,943.84 65.96
FIXED RATE 2.3000% 1997 2027 4,019.00 44.60 2,217.99 24.62
FIXED RATE 2.2000% 1998 2028 4,955.00 54.99 3,903.97 43.33
FIXED RATE 0.7500% 1998 2038 894.00 9.92 840.42 9.33
FIXED RATE 2.2000% 1998 2028 10,487.00 116.38 9,065.13 100.60
FIXED RATE 0.7500% 1998 2038 3,077.00 34.15 1,892.71 21.01
FIXED RATE 2.2000% 1998 2028 5,148.00 57.13 1,721.29 19.10
FIXED RATE 0.7500% 1998 2038 580.00 6.44 453.85 5.04
FIXED RATE 2.2000% 1998 2028 2,387.00 26.49 1,088.21 12.08
FIXED RATE 0.7500% 1998 2038 1,041.00 11.55 472.48 5.24
FIXED RATE 0.7500% 1998 2038 54.00 0.60 24.28 0.27
FIXED RATE 0.7500% 1998 2038 404.00 4.48 297.08 3.30
FIXED RATE 1.7000% 1998 2028 5,439.00 60.36 4,116.70 45.69
FIXED RATE 0.7500% 1998 2038 1,295.00 14.37 1,163.10 12.91
FIXED RATE 1.7000% 1998 2028 291.00 3.23 33.59 0.37
FIXED RATE 0.7500% 1998 2038 2,910.00 32.30 2,085.27 23.14
FIXED RATE 2.2000% 1998 2028 11,884.00 131.89 9,362.36 103.90
FIXED RATE 0.7500% 1998 2038 2,252.00 24.99 1,361.32 15.11
FIXED RATE 1.7000% 1998 2028 2,035.00 22.58 1,033.18 11.47
FIXED RATE 0.7500% 1998 2038 393.00 4.36 361.92 4.02
FIXED RATE 0.7500% 1999 2039 36,300.00 402.86 35,109.78 389.65
FIXED RATE 1.8000% 1999 2029 6,397.00 70.99 4,941.76 54.84
FIXED RATE 0.7500% 1999 2039 813.00 9.02 1,535.69 17.04
FIXED RATE 1.3000% 1999 2029 519.00 5.76 122.72 1.36
FIXED RATE 0.7500% 1999 2039 432.00 4.79 342.46 3.80
FIXED RATE 1.8000% 1999 2029 5,356.00 59.44 5,432.08 60.29
FIXED RATE 0.7500% 1999 2039 722.00 8.01 581.68 6.46
FIXED RATE 1.8000% 1999 2029 15,299.00 169.79 10,747.94 119.28
FIXED RATE 1.3000% 1999 2029 255.00 2.83 216.40 2.40
FIXED RATE 1.3000% 1999 2029 1,436.00 15.94 1,369.51 15.20
FIXED RATE 1.8000% 1999 2029 12,556.00 139.35 13,148.75 145.92
FIXED RATE 0.7500% 1999 2039 2,828.00 31.39 2,102.28 23.33
FIXED RATE 1.8000% 1999 2029 4,885.00 54.21 4,656.04 51.67
FIXED RATE 0.7500% 1999 2039 967.00 10.73 865.79 9.61
FIXED RATE 1.8000% 1999 2029 6,590.00 73.14 6,588.07 73.11
FIXED RATE 0.7500% 1999 2039 844.00 9.37 845.08 9.38
FIXED RATE 1.8000% 1999 2029 4,321.00 47.95 3,137.73 34.82
FIXED RATE 0.7500% 1999 2039 747.00 8.29 647.93 7.19
FIXED RATE 0.7500% 1999 2039 444.00 4.93 251.31 2.79
FIXED RATE 1.3000% 1999 2029 7,792.00 86.48 6,735.66 74.75
FIXED RATE 0.7500% 1999 2039 1,221.00 13.55 897.29 9.96
FIXED RATE 0.7500% 1999 2039 1,022.00 11.34 965.21 10.71
FIXED RATE 1.0000% 2000 2040 7,858.00 87.21 7,665.57 85.07
(1)
(2) (2)
頁 222 / 247424(b)(3)
2014/03/12file:///C:/blp/data/CFd424b3.htm

Table of ContentsTable of ContentsTable of ContentsTable of Contents
EXTERNAL DEBT OF THE REPUBLIC OF THE PHILIPPINES —(Continued) As of September 30, 2009
(In millions)
T-13
InterestRate/
Spread/ServiceCharge
(Per Annum)
Original AmountContracted
OutstandingBalance as of
September 30, 2009
Currency Interest Rate BasisYear
ContractedYear of
Maturity(in Orig.
Currency)(in US
Dollars)(in Orig.
Currency)(in US
Dollars)
FIXED RATE 0.7500% 2000 2040 1,071.00 11.89 1,120.52 12.44
FIXED RATE 0.9500% 2000 2040 13,486.00 149.67 12,879.34 142.93
FIXED RATE 0.7500% 2000 2040 1,238.00 13.74 1,442.86 16.01
FIXED RATE 0.9500% 2000 2040 2,970.00 32.96 2,946.94 32.71
FIXED RATE 0.7500% 2000 2040 579.00 6.43 559.30 6.21
FIXED RATE 2.2000% 2001 2041 6,948.00 77.11 5,518.26 61.24
FIXED RATE 0.7500% 2001 2041 1,346.00 14.94 1,344.85 14.93
FIXED RATE 0.7500% 2001 2041 856.00 9.50 287.29 3.19
FIXED RATE 2.2000% 2001 2041 10,645.00 118.14 5,682.27 63.06
FIXED RATE 0.7500% 2001 2041 1,098.00 12.19 760.80 8.44
FIXED RATE 2.2000% 2001 2041 5,135.00 56.99 1,324.57 14.70
FIXED RATE 0.7500% 2001 2041 1,070.00 11.87 712.32 7.91
FIXED RATE 2.2000% 2001 2041 4,130.00 45.83 1,965.08 21.81
FIXED RATE 0.7500% 2001 2041 1,080.00 11.99 755.55 8.39
FIXED RATE 2.2000% 2001 2041 5,523.00 61.29 4,811.87 53.40
FIXED RATE 0.7500% 2001 2041 992.00 11.01 985.88 10.94
FIXED RATE 1.7000% 2001 2041 2,556.00 28.37 2,628.73 29.17
FIXED RATE 0.7500% 2001 2041 233.00 2.59 147.76 1.64
FIXED RATE 1.7000% 2001 2041 5,175.00 57.43 5,173.86 57.42
FIXED RATE 0.7500% 2001 2041 1,134.00 12.59 1,122.08 12.45
FIXED RATE 1.7000% 2001 2041 2,034.00 22.57 1,955.64 21.70
FIXED RATE 0.7500% 2002 2042 5,582.00 61.95 5,825.73 64.65
FIXED RATE 1.7000% 2002 2042 1,141.00 12.66 798.38 8.86
FIXED RATE 1.7000% 2002 2032 5,389.00 59.81 4,027.87 44.70
FIXED RATE 0.7500% 2002 2042 1,401.00 15.55 1,188.75 13.19
FIXED RATE 0.9500% 2002 2042 16,310.00 181.01 8,600.83 95.45
FIXED RATE 0.7500% 2002 2042 2,178.00 24.17 1,436.89 15.95
FIXED RATE 1.8000% 2002 2032 1,988.00 22.06 755.67 8.39
FIXED RATE 2.2000% 2002 2032 2,651.00 29.42 1,569.87 17.42
FIXED RATE 0.7500% 2002 2042 573.00 6.36 650.31 7.22
FIXED RATE 0.7500% 2002 2042 6,223.00 69.06 589.25 6.54
FIXED RATE 2.2000% 2003 2033 2,470.00 27.41 1,326.50 14.72
FIXED RATE 2.2000% 2003 2033 3,717.00 41.25 650.91 7.22
FIXED RATE 0.7500% 2003 2047 8,529.00 94.65 1,543.78 17.13
FIXED RATE 3.0000% 1980 2010 5,400.00 59.93 263.41 2.92
FIXED RATE 3.0000% 1980 2010 70.00 0.78 3.04 0.03
FIXED RATE 3.0000% 1980 2010 90.00 1.00 4.15 0.05
FIXED RATE 3.0000% 1981 2011 5,000.00 55.49 465.08 5.16
FIXED RATE 3.0000% 1982 2012 5,000.00 55.49 583.19 6.47
FIXED RATE 3.0000% 1983 2013 4,600.00 51.05 876.77 9.73
FIXED RATE 2.7000% 1989 2019 2,500.00 27.75 1,219.50 13.53
FIXED RATE 2.7000% 1990 2020 10,560.00 117.19 3,216.53 35.70
FIXED RATE 2.7000% 1990 2020 4,867.00 54.01 2,304.10 25.57
FIXED RATE 2.7000% 1991 2021 3,516.00 39.02 2,040.91 22.65
FIXED RATE 2.7000% 1991 2021 9,427.00 104.62 5,439.67 60.37
FIXED RATE 2.7000% 1989 2019 6,300.00 69.92 2,423.40 26.89
FIXED RATE 2.7000% 1990 2010 5,066.00 56.22 2,655.09 29.47
FIXED RATE 2.7000% 1991 2021 8,283.00 91.92 4,339.90 48.16
FIXED RATE 3.0000% 1993 2022 3,653.00 40.54 2,078.16 23.06
FIXED RATE 3.0000% 1993 2023 9,099.00 100.98 1,967.06 21.83
FIXED RATE 3.0000% 1994 2024 7,056.00 78.31 4,806.15 53.34
FIXED RATE 3.0000% 1994 2024 6,630.00 73.58 4,208.84 46.71
(1)
(2) (2)
頁 223 / 247424(b)(3)
2014/03/12file:///C:/blp/data/CFd424b3.htm

Table of ContentsTable of ContentsTable of ContentsTable of Contents
EXTERNAL DEBT OF THE REPUBLIC OF THE PHILIPPINES —(Continued) As of September 30, 2009
(In millions)
T-14
InterestRate/
Spread/ServiceCharge
(Per Annum)
Original AmountContracted
OutstandingBalance as of
September 30, 2009
Currency Interest Rate BasisYear
ContractedYear of
Maturity(in Orig.
Currency)(in US
Dollars)(in Orig.
Currency)(in US
Dollars)
FIXED RATE 3.0000% 1994 2024 5,513.00 61.18 3,904.48 43.33
FIXED RATE 3.0000% 1994 2024 2,896.00 32.14 921.66 10.23
FIXED RATE 3.0000% 1994 2024 457.00 5.07 161.70 1.79
FIXED RATE 3.0000% 1980 2010 18,800.00 208.64 723.55 8.03
FIXED RATE 3.0000% 1981 2011 4,600.00 51.05 439.73 4.88
FIXED RATE 3.0000% 1982 2012 32,420.00 359.80 3,730.23 41.40
FIXED RATE 3.0000% 1983 2013 9,900.00 109.87 1,270.27 14.10
FIXED RATE 4.0000% 1983 2013 9,600.00 106.54 1,814.22 20.13
FIXED RATE 4.0000% 1987 2017 40,400.00 448.36 14,993.10 166.39
FIXED RATE 0.0100% 2007 2037 1,099.00 12.20 439.50 4.88
FIXED RATE 1.5000% 2007 2037 9,952.00 110.45 1,201.20 13.33
FIXED RATE 0.7500% 2007 2047 434.00 4.82 20.02 0.22
FIXED RATE 0.0100% 2007 2037 1,416.00 15.71 286.03 3.17
FIXED RATE 6.0000% 1993 2013 25,000.00 277.45 4,950.51 54.94
FIXED RATE 1.9500% 2000 2013 16,600.00 184.23 7,497.00 83.20
FIXED RATE 2.1000% 1999 2011 24,480.00 271.68 10,615.92 117.82
FIXED RATE 2.1000% 1999 2011 9,698.00 107.63 2,424.47 26.91
FIXED RATE 2.6900% 2005 2010 16,640.00 184.67 6,844.18 75.96
FIXED RATE 2.6900% 2006 2020 19,113.00 212.12 3,503.97 38.89
FIXED RATE 2.4900% 2008 2017 4,130.00 45.83 3,107.62 34.49
FIXED RATE 2.9000% 2008 2014 5,993.00 66.51 4,406.40 48.90
LIBOR 6 MONTHS 2.9500% 2005 2011 2,936.00 32.58 1,174.60 13.04
LIBOR 6 MONTHS 2.3000% 2006 2011 3,372.00 37.42 3,373.00 37.43
LIBOR 6 MONTHS 2.4000% 2008 2019 23,407.00 259.77 2,621.37 29.09
LIBOR 6 MONTHS 2.3500% 2008 2020 33,963.00 376.92 370.30 4.11
LIBOR 6 MONTHS 0.0000% 2008 2022 34,253.10 380.14 34,253.10 380.14
LONG TERM PRIME LEMDING
RATE -0.0200% 1999 2018 43,800.00 486.09 7,248.00 80.44
LONG TERM PRIME LEMDING
RATE -0.0200% 2000 2019 43,800.00 486.09 12,928.61 143.48
LONG TERM PRIME LEMDING
RATE 0.5000% 1997 2021 20,800.00 230.84 10,331.58 114.66
LONG TERM PRIME LEMDING
RATE 2.1600% 2007 2021 34,800.00 386.21 34,800.00 386.21
KOREAN WON 76,186.00 45.36 27,477.16 23.22
FIXED RATE 1.5000% 2005 2035 22,500.00 6,157.67 5.20
FIXED RATE 2.5000% 1998 2028 21,172.00 17.89 2,118.15 1.79
FIXED RATE 2.5000% 1998 2030 28,724.00 24.27 18,822.35 15.90
FIXED RATE 3.5000% 1991 2011 3,790.00 3.20 378.99 0.32
KUWAIT DINAR 11.05 38.26 3.39 11.74
FIXED RATE 3.5000% 1998 2018 6.15 21.29 3.27 11.31
SAUDI RIAL 75.00 20.00 3.01 0.80
FIXED RATE 2.0000% 2005 2030 75.00 20.00 3.01 0.80
SPECIAL DRAWING RIGHT 985.83 1,555.21 661.65 1,043.80
INTEREST FREE 1.0000% 1974 2014 5.80 9.15 1.97 3.11
INTEREST FREE 1.0000% 1978 2018 14.00 22.09 5.63 8.88
(1)
(2) (2)
頁 224 / 247424(b)(3)
2014/03/12file:///C:/blp/data/CFd424b3.htm

Table of ContentsTable of ContentsTable of ContentsTable of Contents
EXTERNAL DEBT OF THE REPUBLIC OF THE PHILIPPINES —(Continued) As of September 30, 2009
(In millions)
T-15
InterestRate/
Spread/ServiceCharge
(Per Annum)
Original AmountContracted
OutstandingBalance as of
September 30, 2009
Currency Interest Rate BasisYear
ContractedYear of
Maturity(in Orig.
Currency)(in US
Dollars)(in Orig.
Currency)(in US
Dollars)
INTEREST FREE 1.0000% 1979 2019 15.00 23.66 4.89 7.72
INTEREST FREE 1.0000% 1980 2020 20.00 31.55 5.09 8.04
INTEREST FREE 1.0000% 1981 2021 15.00 23.66 5.60 8.84
INTEREST FREE 1.0000% 1986 2026 43.40 68.47 38.67 61.00
INTEREST FREE 1.0000% 1988 2023 11.61 18.32 7.95 12.54
INTEREST FREE 1.0000% 1988 2023 43.44 68.53 33.06 52.16
INTEREST FREE 1.0000% 1988 2023 53.41 84.26 34.89 55.04
INTEREST FREE 1.0000% 1988 2023 18.68 29.47 11.80 18.61
INTEREST FREE 1.0000% 1988 2023 5.91 9.32 3.82 6.03
INTEREST FREE 1.0000% 1989 2023 25.85 40.78 18.07 28.50
INTEREST FREE 1.0000% 1989 2023 14.54 22.94 11.04 17.42
INTEREST FREE 1.0000% 1990 2025 18.25 28.79 14.40 22.72
INTEREST FREE 1.0000% 1989 2024 25.04 39.50 12.23 19.30
INTEREST FREE 1.0000% 1990 2025 69.70 109.96 61.73 97.39
INTEREST FREE 1.0000% 1991 2025 24.19 38.16 22.14 34.93
INTEREST FREE 1.0000% 1989 2024 39.77 62.74 37.54 59.23
INTEREST FREE 1.0000% 1990 2025 35.87 56.59 36.12 56.98
INTEREST FREE 1.0000% 1990 2025 14.36 22.65 10.74 16.95
INTEREST FREE 1.0000% 1990 2025 16.73 26.39 10.30 16.25
INTEREST FREE 1.0000% 1991 2026 22.03 34.75 18.17 28.67
INTEREST FREE 1.0000% 1992 2026 27.16 42.85 18.87 29.78
INTEREST FREE 1.0000% 1991 2026 35.25 55.61 25.50 40.22
INTEREST FREE 1.0000% 1992 2027 34.65 54.66 10.93 17.24
INTEREST FREE 1.0000% 1993 2028 18.02 28.43 12.11 19.11
INTEREST FREE 1.0000% 1995 2029 36.80 58.05 20.10 31.70
INTEREST FREE 1.0000% 1995 2029 11.93 18.82 6.40 10.09
INTEREST FREE 1.0000% 1996 2029 6.36 10.03 4.70 7.41
INTEREST FREE 1.0000% 1995 2030 9.63 15.19 7.91 12.47
INTEREST FREE 1.0000% 1995 2030 16.04 25.30 11.96 18.86
INTEREST FREE 1.0000% 1996 2021 12.76 20.13 6.67 10.53
INTEREST FREE 1.0000% 1997 2021 13.84 21.83 1.81 2.86
INTEREST FREE 1.0000% 1998 2032 11.02 17.38 9.15 14.43
INTEREST FREE 1.0000% 1998 2032 6.49 10.24 5.29 8.34
INTEREST FREE 1.0000% 1991 2026 50.00 78.88 39.38 62.12
INTEREST FREE 1.0000% 1992 2027 26.40 41.65 20.13 31.75
INTEREST FREE 1.0000% 1993 2028 50.50 79.67 21.49 33.90
INTEREST FREE 0.0000% 2000 2040 4.50 7.10 4.31 6.80
INTEREST FREE 0.0000% 2000 2040 6.00 9.47 5.03 7.93
INTEREST FREE 4.0000% 1992 2012 11.00 17.35 1.89 2.99
INTEREST FREE 0.7500% 1996 2030 6.15 9.70 3.41 5.38
INTEREST FREE 0.7500% 1998 2038 11.00 17.35 9.34 14.73
INTEREST FREE 0.7500% 2002 2041 11.60 18.30 8.45 13.33
INTEREST FREE 0.7500% 2008 2048 16.15 25.48 0.96 1.52
UNITED STATES DOLLARS 12,617.10 12,617.10 5,608.71 5,608.71
LIBOR 6 MONTHS DEPOSIT 0.5000% 2005 2024 16.00 16.00 7.41 7.41
ADB FLOATING RATE 0.0000% 1986 2016 18.80 18.80 9.99 9.99
ADB FLOATING RATE 0.0000% 1990 2015 9.00 9.00 4.47 4.47
ADB FLOATING RATE 0.0000% 1992 2017 50.00 50.00 12.06 12.06
ADB FLOATING RATE 0.0000% 1995 2016 23.50 23.50 13.37 13.37
(1)
(2) (2)
頁 225 / 247424(b)(3)
2014/03/12file:///C:/blp/data/CFd424b3.htm

Table of ContentsTable of ContentsTable of ContentsTable of Contents
EXTERNAL DEBT OF THE REPUBLIC OF THE PHILIPPINES —(Continued) As of September 30, 2009
(In millions)
T-16
InterestRate/
Spread/ServiceCharge
(Per Annum)
Original AmountContracted
OutstandingBalance as of
September 30, 2009
Currency Interest Rate BasisYear
ContractedYear of
Maturity(in Orig.
Currency)(in US
Dollars)(in Orig.
Currency)(in US
Dollars)
ADB FLOATING RATE 0.0000% 1995 2019 41.00 41.00 29.60 29.60
ADB FLOATING RATE 0.0000% 1995 2020 30.00 30.00 6.72 6.72
ADB FLOATING RATE 0.0000% 1996 2021 9.50 9.50 4.64 4.64
ADB FLOATING RATE 0.0000% 1996 2010 75.00 75.00 9.34 9.34
ADB FLOATING RATE 0.0000% 1995 2022 15.00 15.00 6.69 6.69
ADB FLOATING RATE 0.0000% 1997 2021 18.50 18.50 6.24 6.24
ADB FLOATING RATE 0.0000% 1997 2021 167.00 167.00 54.09 54.09
ADB FLOATING RATE 0.0000% 1998 2022 93.00 93.00 8.51 8.51
ADB FLOATING RATE 0.0000% 1998 2022 20.22 20.22 4.25 4.25
ADB FLOATING RATE 0.0000% 1998 2022 22.00 22.00 0.97 0.97
ADB FLOATING RATE 0.0000% 1998 2022 15.70 15.70 3.64 3.64
ADB FLOATING RATE 0.0000% 1998 2013 300.00 300.00 91.42 91.42
ADB FLOATING RATE 0.0000% 1998 2013 200.00 200.00 43.27 43.27
ADB FLOATING RATE 0.0000% 1998 2022 71.00 71.00 4.96 4.96
ADB FLOATING RATE 0.0000% 1999 2025 53.00 53.00 3.04 3.04
ADB FLOATING RATE 0.0000% 1999 2023 24.30 24.30 1.83 1.83
ADB FLOATING RATE 0.0000% 1999 2023 93.16 93.16 15.95 15.95
ADB FLOATING RATE 0.0000% 1999 2023 60.00 60.00 7.93 7.93
ADB FLOATING RATE 0.0000% 2000 2014 100.00 100.00 15.89 15.89
ADB FLOATING RATE 0.0000% 2000 2024 75.00 75.00 3.35 3.35
ADB FLOATING RATE 0.0000% 2000 2015 100.00 100.00 24.08 24.08
ADB FLOATING RATE 0.0000% 2000 2015 75.00 75.00 1.37 1.37
ADB FLOATING RATE 0.0000% 2000 2025 25.00 25.00 1.73 1.73
ADB FLOATING RATE 0.0000% 2001 2025 75.00 75.00 1.73 1.73
COST QUA. BOR. IBRD 6M 0.5000% 1989 2010 200.00 200.00 10.97 10.97
COST QUA. BOR. IBRD 6M 0.5000% 1990 2010 40.00 40.00 2.15 2.15
COST QUA. BOR. IBRD 6M 0.5000% 1990 2010 40.00 40.00 3.32 3.32
COST QUA. BOR. IBRD 6M 0.5000% 1993 2013 51.30 51.30 10.78 10.78
COST QUA. BOR. IBRD 6M 0.5000% 1993 2013 22.94 22.94 7.01 7.01
COST QUA. BOR. IBRD 6M 0.5000% 1992 2013 200.00 200.00 68.25 68.25
COST QUA. BOR. IBRD 6M 0.5000% 1992 2012 97.79 97.79 22.50 22.50
COST QUA. BOR. IBRD 6M 0.5000% 1992 2012 59.21 59.21 15.63 15.63
COST QUA. BOR. IBRD 6M 0.5000% 1993 2013 37.54 37.54 12.69 12.69
COST QUA. BOR. IBRD 6M 0.5000% 1993 2013 25.46 25.46 6.91 6.91
COST QUA. BOR. IBRD 6M 0.5000% 1990 2010 200.00 200.00 18.78 18.78
COST QUA. BOR. IBRD 6M 0.5000% 1995 2015 18.00 18.00 0.69 0.69
COST QUA. BOR. IBRD 6M 0.5000% 1995 2015 16.70 16.70 5.29 5.29
COST QUA. BOR. IBRD 6M 0.5000% 1991 2011 139.44 139.44 28.65 28.65
COST QUA. BOR. IBRD 6M 0.5000% 1991 2011 18.56 18.56 1.16 1.16
COST QUA. BOR. IBRD 6M 7.7300% 1990 2010 80.92 80.92 8.14 8.14
COST QUA. BOR. IBRD 6M 7.7300% 1990 2010 85.00 85.00 4.70 4.70
COST QUA. BOR. IBRD 6M 7.7300% 1990 2010 27.57 27.57 2.74 2.74
COST QUA. BOR. IBRD 6M 7.7300% 1990 2010 125.00 125.00 17.15 17.15
COST QUA. BOR. IBRD 6M 7.7300% 1992 2012 85.00 85.00 16.46 16.46
COST QUA. BOR. IBRD 6M 7.7300% 1992 2012 34.75 34.75 10.02 10.02
INTEREST FREE 1.0000% 1973 2022 12.70 12.70 4.95 4.95
INTEREST FREE 1.0000% 1974 2024 9.50 9.50 4.28 4.28
INTEREST FREE 1.0000% 1978 2027 28.00 28.00 11.94 11.94
INTEREST FREE 1.0000% 1979 2029 40.00 40.00 19.33 19.33
FIXED RATE 0.2000% 2006 2042 13.95 13.95 13.50 13.50
FIXED RATE 0.3000% 2002 2032 4.40 4.40 4.40 4.40
(1)
(2) (2)
頁 226 / 247424(b)(3)
2014/03/12file:///C:/blp/data/CFd424b3.htm

Table of ContentsTable of ContentsTable of ContentsTable of Contents
EXTERNAL DEBT OF THE REPUBLIC OF THE PHILIPPINES —(Continued) As of September 30, 2009
(In millions)
T-17
InterestRate/
Spread/ServiceCharge
(Per Annum)
Original AmountContracted
OutstandingBalance as of
September 30, 2009
Currency Interest Rate BasisYear
ContractedYear of
Maturity(in Orig.
Currency)(in US
Dollars)(in Orig.
Currency)(in US
Dollars)
FIXED RATE 0.3000% 2002 2032 6.78 6.78 6.78 6.78
FIXED RATE 0.3000% 2002 2032 15.56 15.56 18.56 18.56
FIXED RATE 0.3000% 2002 2032 12.94 12.94 12.94 12.94
FIXED RATE 1.0000% 2000 2030 7.01 7.01 7.01 7.01
FIXED RATE 2.0000% 1994 2019 15.00 15.00 7.84 7.84
FIXED RATE 4.0000% 1998 2018 10.00 10.00 6.25 6.25
FIXED RATE 2.0000% 1986 2016 40.00 40.00 9.84 9.84
FIXED RATE 2.0000% 1988 2018 30.00 30.00 10.38 10.38
FIXED RATE 2.0000% 1990 2020 21.00 21.00 9.69 9.69
FIXED RATE 3.0000% 1991 2021 10.00 10.00 8.12 8.12
FIXED RATE 3.0000% 1992 2022 20.00 20.00 10.83 10.83
FIXED RATE 3.0000% 1993 2023 20.00 20.00 12.50 12.50
FIXED RATE 2.0000% 1999 2019 16.06 16.06 10.40 10.40
FIXED RATE 2.0000% 1999 2020 13.94 13.94 10.22 10.22
FIXED RATE 2.0000% 2000 2021 23.36 23.36 17.52 17.52
FIXED RATE 1.5000% 1996 2026 25.75 25.75 21.99 21.99
FIXED RATE 1.7500% 2000 2016 10.00 10.00 4.50 4.50
FIXED RATE 2.0000% 2001 2021 7.00 7.00 4.84 4.84
FIXED RATE 2.0000% 1980 2021 5.70 5.70 2.54 2.54
FIXED RATE 2.0000% 1982 2023 9.90 9.90 3.13 3.13
FIXED RATE 2.0000% 1984 2021 3.20 3.20 0.02 0.02
FIXED RATE 2.0000% 1975 2017 15.00 15.00 5.33 5.33
FIXED RATE 2.0000% 1975 2017 3.50 3.50 1.16 1.16
FIXED RATE 2.0000% 1975 2017 5.00 5.00 1.72 1.72
FIXED RATE 2.0000% 1974 2016 2.00 2.00 0.46 0.46
FIXED RATE 2.0000% 1976 2017 10.00 10.00 3.16 3.16
FIXED RATE 2.0000% 1977 2018 3.00 3.00 1.15 1.15
FIXED RATE 2.0000% 1978 2019 5.00 5.00 2.01 2.01
FIXED RATE 2.0000% 1978 2018 2.25 2.25 0.60 0.60
FIXED RATE 2.0000% 1978 2018 0.78 0.78 0.29 0.29
FIXED RATE 2.0000% 1979 2020 10.66 10.66 4.97 4.97
FIXED RATE 2.0000% 1980 2021 6.38 6.38 3.09 3.09
FIXED RATE 2.0000% 1979 2021 4.40 4.40 2.08 2.08
FIXED RATE 2.0000% 1978 2021 5.00 5.00 2.00 2.00
FIXED RATE 2.0000% 1979 2020 5.00 5.00 1.70 1.70
FIXED RATE 2.0000% 1979 2022 2.62 2.62 0.43 0.43
FIXED RATE 2.0000% 1978 2024 0.88 0.88 0.26 0.26
FIXED RATE 2.0000% 1980 2021 1.50 1.50 0.20 0.20
FIXED RATE 2.0000% 1981 2021 10.12 10.12 5.02 5.02
FIXED RATE 2.0000% 1981 2022 1.00 1.00 0.49 0.49
FIXED RATE 2.0000% 1980 2021 2.30 2.30 1.05 1.05
FIXED RATE 2.0000% 1981 2022 7.10 7.10 1.58 1.58
FIXED RATE 2.0000% 1981 2021 1.60 1.60 0.44 0.44
FIXED RATE 2.0000% 1982 2023 4.50 4.50 0.46 0.46
FIXED RATE 2.0000% 1982 2023 8.30 8.30 0.12 0.12
FIXED RATE 2.0000% 1984 2023 7.00 7.00 0.02 0.02
FIXED RATE 2.0000% 1983 2024 13.50 13.50 0.11 0.11
FIXED RATE 2.0000% 1979 2021 2.50 2.50 0.51 0.51
FIXED RATE 2.0000% 1980 2023 7.50 7.50 2.20 2.20
FIXED RATE 2.0000% 1980 2023 9.20 9.20 0.30 0.30
FIXED RATE 2.0000% 1982 2023 2.90 2.90 0.17 0.17
(1)
(2) (2)
頁 227 / 247424(b)(3)
2014/03/12file:///C:/blp/data/CFd424b3.htm

Table of ContentsTable of ContentsTable of ContentsTable of Contents
EXTERNAL DEBT OF THE REPUBLIC OF THE PHILIPPINES —(Continued) As of September 30, 2009
(In millions)
T-18
InterestRate/
Spread/ServiceCharge
(Per Annum)
Original AmountContracted
OutstandingBalance as of
September 30, 2009
Currency Interest Rate BasisYear
ContractedYear of
Maturity(in Orig.
Currency)(in US
Dollars)(in Orig.
Currency)(in US
Dollars)
FIXED RATE 2.0000% 1983 2025 7.80 7.80 0.63 0.63
FIXED RATE 2.0000% 1983 2024 1.00 1.00 0.04 0.04
FIXED RATE 2.0000% 1984 2024 2.30 2.30 0.22 0.22
FIXED RATE 2.0000% 1979 2022 1.60 1.60 0.41 0.41
FIXED RATE 2.0000% 1980 2023 3.30 3.30 1.27 1.27
FIXED RATE 2.0000% 2000 2021 16.64 16.64 12.48 12.48
FIXED RATE 1.0000% 2001 2031 23.89 23.89 20.89 20.89
FIXED RATE 1.0000% 2001 2032 16.11 16.11 14.25 14.25
FIXED RATE 1.0000% 2002 2032 14.57 14.57 13.43 13.43
FIXED RATE 1.0000% 2002 2033 5.43 5.43 5.01 5.01
FIXED RATE 1.0000% 2003 2033 37.88 37.88 36.42 36.42
FIXED RATE 1.0000% 2003 2034 2.12 2.12 2.04 2.04
FIXED RATE 1.0000% 2004 2034 6.61 6.61 6.61 6.61
FIXED RATE 1.0000% 2004 2034 13.39 13.39 13.39 13.39
FIXED RATE 2.5000% 1997 2014 9.48 9.48 5.01 5.01
FIXED RATE 3.0000% 1980 2022 2.70 2.70 1.18 1.18
FIXED RATE 2.0000% 1985 2015 40.00 40.00 10.77 10.77
FIXED RATE 1.0000% 2006 2037 20.00 20.00 19.42 19.42
FIXED RATE 1.0000% 2007 2037 9.51 9.51 9.51 9.51
FIXED RATE 3.0000% 2001 2013 34.98 34.98 19.33 19.33
FIXED RATE 3.0000% 2002 2015 23.55 23.55 17.19 17.19
FIXED RATE 3.0000% 2005 2016 41.25 41.25 20.23 20.23
FIXED RATE 3.2500% 1997 2014 10.00 10.00 0.42 0.42
FIXED RATE 3.4000% 1996 2012 22.95 22.95 8.03 8.03
FIXED RATE 3.4000% 1997 2014 28.02 28.02 13.90 13.90
FIXED RATE 3.4000% 1998 2014 38.51 38.51 19.26 19.26
FIXED RATE 1.0000% 2008 2037 10.38 10.38 10.38 10.38
FIXED RATE 4.9800% 2006 2014 13.50 13.50 11.57 11.57
FIXED RATE 5.2000% 1998 2010 24.10 24.10 4.01 4.01
FIXED RATE 5.2000% 1999 2012 99.45 99.45 35.48 35.48
FIXED RATE 10.5000% 1983 2013 67.40 67.40 14.84 14.84
FIXED RATE 2.0000% 1988 2014 10.00 10.00 1.60 1.60
FIXED RATE 2.0000% 1989 2014 2.63 2.63 0.87 0.87
LIBOR 6 MONTHS
DEPOSIT 0.0000% 1995 2020 30.00 30.00 2.29 2.29
LIBOR 6 MONTHS
DEPOSIT 0.0000% 1996 2021 9.50 9.50 2.36 2.36
LIBOR 6 MONTHS
DEPOSIT 0.0000% 1995 2022 15.00 15.00 4.52 4.52
LIBOR 6 MONTHS
DEPOSIT 0.0000% 1997 2021 18.50 18.50 1.12 1.12
LIBOR 6 MONTHS
DEPOSIT 0.0000% 1997 2021 167.00 167.00 67.91 67.91
LIBOR 6 MONTHS
DEPOSIT 0.0000% 1998 2022 93.00 93.00 1.70 1.70
LIBOR 6 MONTHS
DEPOSIT 0.0000% 1998 2022 20.22 20.22 2.70 2.70
LIBOR 6 MONTHS
DEPOSIT 0.0000% 1998 2022 15.70 15.70 8.05 8.05
LIBOR 6 MONTHS
DEPOSIT 0.0000% 1998 2013 300.00 300.00 49.09 49.09
(1)
(2) (2)
頁 228 / 247424(b)(3)
2014/03/12file:///C:/blp/data/CFd424b3.htm

Table of ContentsTable of ContentsTable of ContentsTable of Contents
EXTERNAL DEBT OF THE REPUBLIC OF THE PHILIPPINES —(Continued) As of September 30, 2009
(In millions)
T-19
InterestRate/
Spread/ServiceCharge
(Per Annum)
Original AmountContracted
OutstandingBalance as of
September 30, 2009
Currency Interest Rate BasisYear
ContractedYear of
Maturity(in Orig.
Currency)(in US
Dollars)(in Orig.
Currency)(in US
Dollars)
LIBOR 6 MONTHS
DEPOSIT 0.0000% 1998 2013 200.00 200.00 53.47 53.47
LIBOR 6 MONTHS
DEPOSIT 0.0000% 1998 2022 71.00 71.00 19.02 19.02
LIBOR 6 MONTHS
DEPOSIT 0.0000% 1999 2025 53.00 53.00 27.45 27.45
LIBOR 6 MONTHS
DEPOSIT 0.0000% 1999 2023 24.30 24.30 1.13 1.13
LIBOR 6 MONTHS
DEPOSIT 0.0000% 1999 2023 93.16 93.16 50.23 50.23
LIBOR 6 MONTHS
DEPOSIT 0.0000% 1999 2023 60.00 60.00 33.70 33.70
LIBOR 6 MONTHS
DEPOSIT 0.0000% 2000 2024 75.00 75.00 1.58 1.58
LIBOR 6 MONTHS
DEPOSIT 0.0000% 2000 2015 100.00 100.00 36.95 36.95
LIBOR 6 MONTHS
DEPOSIT 0.0000% 2000 2015 75.00 75.00 58.01 58.01
LIBOR 6 MONTHS
DEPOSIT 0.0000% 2000 2025 25.00 25.00 16.21 16.21
LIBOR 6 MONTHS
DEPOSIT 0.0000% 2001 2025 75.00 75.00 29.67 29.67
LIBOR 6 MONTHS
DEPOSIT 0.0000% 2003 2018 150.00 150.00 127.07 127.07
LIBOR 6 MONTHS
DEPOSIT 0.0000% 2005 2019 200.00 200.00 185.82 185.82
LIBOR 6 MONTHS
DEPOSIT 0.0000% 2005 2020 13.00 13.00 2.76 2.76
LIBOR 6 MONTHS
DEPOSIT 0.0000% 2005 2024 150.00 150.00 150.00 150.00
LIBOR 6 MONTHS
DEPOSIT 0.0000% 2006 2021 200.00 200.00 200.00 200.00
LIBOR 6 MONTHS
DEPOSIT 0.0000% 2006 2021 450.00 450.00 450.00 450.00
LIBOR 6 MONTHS
DEPOSIT 0.0000% 2007 2022 250.00 250.00 250.00 250.00
LIBOR 6 MONTHS
DEPOSIT 0.0000% 2007 2025 33.80 33.80 0.90 0.90
LIBOR 6 MONTHS
DEPOSIT 0.0000% 2007 2025 33.80 33.80 250.00 250.00
LIBOR 6 MONTHS
DEPOSIT 0.0000% 2008 2027 70.00 70.00 0.53 0.53
LIBOR 6 MONTHS
DEPOSIT 0.0000% 2008 2023 300.00 300.00 150.00 150.00
LIBOR 6 MONTHS
DEPOSIT 0.0000% 2009 2014 500.00 500.00 500.00 500.00
LIBOR 6 MONTHS
DEPOSIT 0.0000% 2001 2016 75.00 75.00 53.80 53.80
LIBOR 6 MONTHS
DEPOSIT 0.0000% 1994 2024 5.75 5.75 3.75 3.75
LIBOR 6 MONTHS
DEPOSIT 0.0000% 1994 2024 9.25 9.25 7.50 7.50
(1)
(2) (2)
頁 229 / 247424(b)(3)
2014/03/12file:///C:/blp/data/CFd424b3.htm

Table of ContentsTable of ContentsTable of ContentsTable of Contents
EXTERNAL DEBT OF THE REPUBLIC OF THE PHILIPPINES —(Continued) As of September 30, 2009
(In millions)
T-20
InterestRate/
Spread/ServiceCharge
(Per Annum)
Original AmountContracted
OutstandingBalance as of
September 30, 2009
Currency Interest Rate BasisYear
ContractedYear of
Maturity(in Orig.
Currency)(in US
Dollars)(in Orig.
Currency)(in US
Dollars)
LIBOR 6 MONTHS
DEPOSIT 0.0000% 1992 2022 20.00 20.00 12.50 12.50
LIBOR 6 MONTHS
DEPOSIT 0.0000% 1995 2015 26.50 26.50 12.53 12.53
LIBOR 6 MONTHS
DEPOSIT 7.7300% 1990 2010 40.88 40.88 3.17 3.17
LIBOR 6 MONTHS
DEPOSIT 7.7300% 1990 2010 18.63 18.63 1.04 1.04
LIBOR 6 MONTHS
DEPOSIT 7.7300% 1992 2012 33.25 33.25 8.31 8.31
LIBOR 6 MONTHS
DEPOSIT 0.0000% 2000 2020 100.00 100.00 81.65 81.65
LIBOR 6 MONTHS
DEPOSIT 0.0000% 2000 2020 150.00 150.00 116.10 116.10
LIBOR 6 MONTHS
DEPOSIT 0.0000% 2000 2020 4.79 4.79 3.21 3.21
LIBOR 6 MONTHS
DEPOSIT 0.0000% 2001 2021 60.00 60.00 49.64 49.64
LIBOR 6 MONTHS
DEPOSIT 0.5000% 1996 2017 113.40 113.40 47.85 47.85
LIBOR 6 MONTHS
DEPOSIT 0.5000% 1996 2018 50.00 50.00 30.23 30.23
LIBOR 6 MONTHS
DEPOSIT 0.5000% 1997 2019 58.00 58.00 23.22 23.22
LIBOR 6 MONTHS
DEPOSIT 0.5000% 1997 2018 50.00 50.00 24.44 24.44
LIBOR 6 MONTHS
DEPOSIT 0.5000% 1998 2018 10.00 10.00 6.94 6.94
LIBOR 6 MONTHS
DEPOSIT 0.5000% 1998 2018 19.00 19.00 11.97 11.97
LIBOR 6 MONTHS
DEPOSIT 0.5000% 2002 2019 100.00 100.00 100.00 100.00
LIBOR 6 MONTHS
DEPOSIT 0.5000% 2002 2022 100.00 100.00 90.36 90.36
LIBOR 6 MONTHS
DEPOSIT 0.5000% 2004 2024 60.00 60.00 27.71 27.71
LIBOR 6 MONTHS
DEPOSIT 0.5000% 2003 2022 21.90 21.90 11.51 11.51
LIBOR 6 MONTHS
DEPOSIT 0.5000% 2003 2022 33.60 33.60 31.91 31.91
LIBOR 6 MONTHS
DEPOSIT 0.5000% 2003 2022 50.00 50.00 49.20 49.20
LIBOR 6 MONTHS
DEPOSIT 0.5000% 2004 2023 5.00 5.00 2.57 2.57
LIBOR 6 MONTHS
DEPOSIT 0.7500% 1998 2018 300.00 300.00 70.16 70.16
LIBOR 6 MONTHS
DEPOSIT 0.7500% 1999 2019 27.50 27.50 15.59 15.59
LIBOR 6 MONTHS
DEPOSIT 0.7500% 1999 2019 100.00 100.00 43.83 43.83
VARIABLE RATE 0.5000% 2005 2025 16.00 16.00 1.45 1.45
(1)
(2) (2)
頁 230 / 247424(b)(3)
2014/03/12file:///C:/blp/data/CFd424b3.htm

Table of ContentsTable of ContentsTable of ContentsTable of Contents
EXTERNAL DEBT OF THE REPUBLIC OF THE PHILIPPINES —(Continued) As of September 30, 2009
(In millions)
T-21
InterestRate/
Spread/ServiceCharge
(Per Annum)
Original AmountContracted
OutstandingBalance as of
September 30, 2009
Currency Interest Rate BasisYear
ContractedYear of
Maturity(in Orig.
Currency)(in US
Dollars)(in Orig.
Currency)(in US
Dollars)
VARIABLE RATE 0.5000% 2006 2026 200.00 200.00 104.12 104.12
VARIABLE RATE 0.5000% 2006 2026 110.00 110.00 20.41 20.41
LIBOR plus FIXED SPREAD 0.5000% 2007 2026 11.00 11.00 0.51 0.51
LIBOR plus FIXED SPREAD 0.5000% 2007 2026 83.75 83.75 6.44 6.44
LIBOR plus FIXED SPREAD 0.5000% 2007 2027 50.00 50.00 10.15 10.15
LIBOR plus FIXED SPREAD 0.5000% 2007 2026 250.00 250.00 250.00 250.00
LIBOR plus FIXED SPREAD 0.5000% 2008 2033 200.00 200.00 200.00 200.00
LIBOR plus FIXED SPREAD 0.5000% 2008 2032 232.00 232.00 3.58 3.58
LIBOR plus FIXED SPREAD 0.5000% 2009 2033 10.00 10.00 4.03 4.03
LIBOR 6 MONTHS DEPOSIT 0.0000% 2009 2033 31.10 31.10 2.58 2.58
B. RELENT TO GOCC’s 2,597.20 1,486.64
BELGIAN FRANCS 1,181.67 42.71 340.77 12.32
INTEREST FREE 0.0000% 1992 2022 150.00 5.42 105.00 3.80
INTEREST FREE 0.0000% 1983 2013 75.00 2.71 18.75 0.68
INTEREST FREE 0.0000% 1982 2012 75.00 2.71 15.00 0.54
INTEREST FREE 0.0000% 1981 2011 300.00 10.84 45.00 1.63
INTEREST FREE 0.0000% 1980 2010 450.00 16.27 45.00 1.63
INTEREST FREE 0.0000% 1996 2025 131.67 4.76 112.02 4.05
DEUTSCHEMARK 120.80 90.06 52.22 38.93
FIXED RATE 2.0000% 1989 2019 18.00 13.42 9.22 6.87
FIXED RATE 2.0000% 1982 2012 10.00 7.46 1.42 1.06
FIXED RATE 2.0000% 1989 2019 14.00 10.44 7.38 5.50
FIXED RATE 2.0000% 1989 2019 62.80 46.82 32.80 24.45
FIXED RATE 2.0000% 1981 2015 16.00 11.93 1.40 1.04
DANISH KRONER 110.00 21.55 3.08 0.60
INTEREST FREE 0.0000% 1985 2009 95.00 18.61 2.60 0.51
INTEREST FREE 0.0000% 1985 2009 15.00 2.94 0.48 0.09
EURO 8.27 12.06 11.80 17.21
FIXED RATE 5.0200% 2004 2024 1.97 2.87 5.67 8.26
INTEREST FREE 0.0000% 2004 2033 6.30 9.19 6.13 8.94
JAPANESE YEN 195,612.40 1,845.54 109,338.61 1,213.44
ADB FLOATING RATE 0.0000% 1991 2014 6.00 0.07 122.71 1.36
FIXED RATE 2.0000% 1995 2025 545.40 6.05 433.08 4.81
FIXED RATE 2.7000% 1991 2021 2,005.00 18.91 1,085.64 12.05
FIXED RATE 2.7000% 1991 2021 5,788.00 54.58 3,217.75 35.71
FIXED RATE 2.7000% 1992 2022 1,094.00 10.32 500.08 5.55
FIXED RATE 2.7000% 1991 2021 4,028.00 37.98 1,958.06 21.73
(1)
(2) (2)
頁 231 / 247424(b)(3)
2014/03/12file:///C:/blp/data/CFd424b3.htm

Table of ContentsTable of ContentsTable of ContentsTable of Contents
EXTERNAL DEBT OF THE REPUBLIC OF THE PHILIPPINES —(Continued) As of September 30, 2009
(In millions)
T-22
InterestRate/
Spread/ServiceCharge
(Per Annum)
Original AmountContracted
OutstandingBalance as of
September 30, 2009
Currency Interest Rate BasisYear
ContractedYear of
Maturity(in Orig.
Currency)(in US
Dollars)(in Orig.
Currency)(in US
Dollars)
FIXED RATE 3.0000% 1993 2023 18,120.00 170.87 12,302.33 136.53
FIXED RATE 3.0000% 1993 2023 1,259.00 11.87 816.65 9.06
FIXED RATE 3.0000% 1994 2024 11,433.00 107.81 7,126.65 79.09
FIXED RATE 3.0000% 1994 2024 10,756.00 101.43 242.02 2.69
FIXED RATE 3.0000% 1994 2024 9,795.00 92.37 7,050.58 78.25
FIXED RATE 3.0000% 1994 2024 6,212.00 58.58 1,759.84 19.53
FIXED RATE 2.7000% 1997 2027 25,865.00 243.91 21,947.49 243.57
FIXED RATE 2.7000% 1997 2027 479.00 4.52 339.08 3.76
FIXED RATE 1.0000% 2000 2040 20,675.00 194.97 18,707.98 207.62
FIXED RATE 0.7500% 2000 2040 1,587.00 14.97 1,832.34 20.34
FIXED RATE 1.0000% 2000 2040 7,445.00 70.21 7,434.78 82.51
FIXED RATE 0.7500% 2000 2040 821.00 7.74 830.21 9.21
FIXED RATE 3.0000% 1980 2010 1,540.00 14.52 74.62 0.83
FIXED RATE 3.0000% 1981 2011 10,800.00 101.84 830.86 9.22
FIXED RATE 3.0000% 1981 2011 7,560.00 71.29 737.05 8.18
FIXED RATE 3.0000% 1981 2011 140.00 1.32 13.32 0.15
FIXED RATE 3.0000% 1982 2012 670.00 6.32 68.47 0.76
FIXED RATE 3.0000% 1982 2012 490.00 4.62 21.82 0.24
FIXED RATE 3.0000% 1983 2013 4,500.00 42.44 877.32 9.74
FIXED RATE 3.0000% 1983 2013 240.00 2.26 33.12 0.37
FIXED RATE 3.5000% 1984 2014 2,905.00 27.39 707.43 7.85
FIXED RATE 3.5000% 1986 2016 175.00 1.65 48.75 0.54
FIXED RATE 3.0000% 1988 2018 1,272.00 11.99 391.94 4.35
FIXED RATE 3.0000% 1988 2018 6,015.00 56.72 2,460.70 27.31
FIXED RATE 3.0000% 1988 2018 2,478.00 23.37 25.45 0.28
FIXED RATE 3.0000% 1988 2018 192.00 1.81 70.11 0.78
FIXED RATE 2.7000% 1989 2019 5,054.00 47.66 2,456.90 27.27
FIXED RATE 0.7500% 1998 2038 23,668.00 223.19 12,813.48 142.20
SPECIAL DRAWING RIGHT 47.30 74.62 30.92 48.78
INTEREST FREE 0.7500% 1996 2036 10.15 16.01 8.70 13.72
INTEREST FREE 0.7500% 2005 2045 12.35 19.48 2.34 3.69
INTEREST FREE 1.0000% 1991 2025 11.18 17.64 7.68 12.11
INTEREST FREE 1.0000% 1997 2031 13.62 21.49 12.21 19.26
UNITED STATES DOLLAR 500.32 500.32 155.35 155.35
LIBOR 6 MONTHS DEPOSIT 0.5000% 1997 2017 2.30 2.30 1.25 1.25
SERVICE CHARGE 1.0000% 1972 2022 10.02 10.02 3.76 3.76
SERVICE CHARGE 1.0000% 1979 2029 22.00 22.00 11.24 11.24
FIXED RATE 2.0000% 1975 2016 20.00 20.00 5.86 5.86
FIXED RATE 2.0000% 1976 2017 20.00 20.00 5.31 5.31
FIXED RATE 2.0000% 1976 2017 20.00 20.00 7.08 7.08
FIXED RATE 3.0000% 1994 2011 6.00 6.00 0.36 0.36
FIXED RATE 3.0000% 2005 2040 400.00 400.00 120.49 120.49
II. NG ASSUMED DEBT (REAL) 4.35 1.04
BELGIAN FRANCS 50.00 1.81 11.25 0.41
FREE 0.0000% 1986 2012 25.00 0.90 5.00 0.18
FREE 0.0000% 1986 2013 25.00 0.90 6.25 0.23
(1)
(2) (2)
頁 232 / 247424(b)(3)
2014/03/12file:///C:/blp/data/CFd424b3.htm

Table of ContentsTable of ContentsTable of ContentsTable of Contents
EXTERNAL DEBT OF THE REPUBLIC OF THE PHILIPPINES —(Continued) As of September 30, 2009
(In millions)
T-23
InterestRate/
Spread/ServiceCharge
(Per Annum)
Original AmountContracted
OutstandingBalance as of
September 30, 2009
Currency Interest Rate BasisYear
ContractedYear of
Maturity(in Orig.
Currency)(in US
Dollars)(in Orig.
Currency)(in US
Dollars)
UNITED STATES DOLLARS 2.54 2.54 0.64 0.64
FIXED RATE 3.0000% 1992 2012 0.23 0.23 0.06 0.06
FIXED RATE 3.0000% 1992 2012 0.40 0.40 0.10 0.10
FIXED RATE 3.0000% 1992 2012 0.25 0.25 0.06 0.06
FIXED RATE 3.5000% 1992 2012 1.06 1.06 0.27 0.27
FIXED RATE 3.5000% 1992 2012 0.60 0.60 0.15 0.15
III. NG SECURITIZED LOANS 24,071.54 22,762.34
JAPANESE YEN BONDS 50,000.00 554.90 50,000.00 554.90
FIXED 4.3000% 2002 2011 50,000.00 554.90 50,000.00 554.90
GLOBAL BONDS 21,839.71 21,839.71 20,530.51 20,530.51
UNITED STATES DOLLARS 21,839.71 21,839.71 20,530.51 20,530.51
FIXED 8.7500% 1996 2016 690.00 690.00 629.70 629.70
FIXED 8.8750% 1999 2013 500.00 500.00 448.38 448.38
FIXED 9.0000% 2002 2013 500.00 500.00 500.00 500.00
FIXED 9.5000% 1999 2024 1,006.29 1,006.29 480.41 480.41
FIXED 9.8750% 1999 2019 500.00 500.00 362.47 362.47
FIXED 9.8750% 1999 2019 200.00 200.00 200.00 200.00
FIXED 9.8750% 1999 2019 400.00 400.00 400.00 400.00
FIXED 9.8750% 2000 2010 600.00 600.00 561.46 561.46
FIXED 10.6250% 2000 2025 1,000.00 1,000.00 854.74 854.74
FIXED 10.6250% 2003 2025 300.00 300.00 300.00 300.00
FIXED 10.6250% 2004 2025 700.00 700.00 700.00 700.00
FIXED 8.3750% 2004 2011 1,284.22 1,284.22 1,284.22 1,284.22
FIXED 8.3750% 2004 2011 200.00 200.00 200.00 200.00
FIXED 8.2500% 2003 2014 750.00 750.00 750.00 750.00
FIXED 8.2500% 2004 2014 200.00 200.00 200.00 200.00
FIXED 8.8750% 2004 2015 500.00 500.00 426.41 426.41
FIXED 8.8750% 2004 2015 300.00 300.00 300.00 300.00
FIXED 9.3750% 2002 2017 750.00 750.00 572.38 572.38
FIXED 9.5000% 2005 2030 1,500.00 1,500.00 1,500.00 1,500.00
FIXED 8.8750% 2004 2015 250.00 250.00 250.00 250.00
FIXED 9.5000% 2005 2030 500.00 500.00 500.00 500.00
FIXED 8.0000% 2005 2016 1,000.00 1,000.00 1,000.00 1,000.00
FIXED 7.7500% 2006 2031 1,500.00 1,500.00 1,500.00 1,500.00
FIXED 7.7500% 2006 2031 450.00 450.00 450.00 450.00
FIXED 8.0000% 2006 2016 300.00 300.00 300.00 300.00
FIXED 7.7500% 2006 2031 435.00 435.00 434.51 434.51
FIXED 7.7500% 2006 2024 774.20 774.20 774.20 774.20
FIXED 6.3750% 2007 2032 1,000.00 1,000.00 1,000.00 1,000.00
FIXED 8.2500% 2003 2014 750.00 750.00 651.62 651.62
FIXED 9.3750% 2004 2017 250.00 250.00 250.00 250.00
FIXED 6.3750% 2008 2032 500.00 500.00 500.00 500.00
FIXED 8.3750% 2009 2019 1,500.00 1,500.00 1,500.00 1,500.00
FIXED 6.5000% 2009 2020 750.00 750.00 750.00 750.00
EURO BONDS 1,150.00 1,676.93 1,150.00 1,676.93
(1)
(2) (2)
頁 233 / 247424(b)(3)
2014/03/12file:///C:/blp/data/CFd424b3.htm

Table of ContentsTable of ContentsTable of ContentsTable of Contents
EXTERNAL DEBT OF THE REPUBLIC OF THE PHILIPPINES —(Continued) As of September 30, 2009
(In millions)
T-24
InterestRate/
Spread/ServiceCharge
(Per Annum)
Original AmountContracted
OutstandingBalance as of
September 30, 2009
Currency Interest Rate BasisYear
ContractedYear of
Maturity(in Orig.
Currency)(in US
Dollars)(in Orig.
Currency)(in US
Dollars)
EUR 1,150.00 1,676.93 1,150.00 1,676.93
FIXED 9.1250% 2003 2010 300.00 437.46 300.00 437.46
FIXED 9.1250% 2004 2010 350.00 510.37 350.00 510.37
FIXED 6.2500% 2006 2016 500.00 729.10 500.00 729.10
(1) Excludes External Debt Guaranteed by the Republic. (2) Amount in original currencies were converted to US Dollars using BSP reference rate on September 30, 2009.
(1)
(2) (2)
頁 234 / 247424(b)(3)
2014/03/12file:///C:/blp/data/CFd424b3.htm

Table of ContentsTable of ContentsTable of ContentsTable of Contents
DOMESTIC GOVERNMENT SECURITIESAs of September 30, 2009
(In million Pesos)
T-25
Interest Rate BasisInterest Rate(Per Annum)
YearContracted
Year ofMaturity
OriginalAmount
OutstandingBalance as ofSeptember 30,
2009
TOTAL (I + II) 2,483,798.23
I. ACTUAL OBLIGATIONS 2,414,910.99
A. TREASURY BILLS 607,412.35
ADAPS Various 2009-2010 97,349.00 GOCC Series Various 2009-2010 322,247.65 TEIs Various 2009-2010 13,247.40 CB-BOL Floating Rate 2009-2010 174,568.30
B. BONDS 50,137.45 58,574.51
28.5 Yr FXTB 97.05 97.05
Fixed Rate 12.8400% 1996 2025 97.05 97.05
Treasury Bonds (CB-BoL) 50,000.00 50,000.00
182-Day T-Bill Rate 1993 2018 50,000.00 50,000.00
Agrarian Reform Bonds 8,477.46
91-Day T-Bill Rate
C. FIXED RATE T/BONDS 767,049.65 648,905.61
3 Yr FXTB 18,953.60 6,930.00
ADAPS 15,500.00 3,476.40
Fixed Rate 5.3750% 2008 2011 7,500.00 3,048.90Fixed Rate 5.8750% 2009 2012 8,000.00 427.50
GOCCs 2,333.60 2,333.60
Fixed Rate 5.3750% 2008 2011 863.70 863.70Fixed Rate 5.8750% 2009 2012 1,469.90 1,469.90
TEIs 1,120.00 1,120.00
Fixed Rate 5.3750% 2008 2011 952.50 952.50Fixed Rate 5.8750% 2009 2012 167.50 167.50
4 Yr FXTB 17,664.60 12,534.58
ADAPS 10,500.00 5,391.48
Fixed Rate 6.5000% 2006 2010 3,500.00 2,059.93Fixed Rate 5.8750% 2007 2011 7,000.00 3,331.55
GOCCs 6,183.30 6,183.30
Fixed Rate 6.5000% 2006 2010 5,871.90 5,871.90Fixed Rate 5.8750% 2007 2011 311.40 311.40
TEIs 981.30 959.80
Fixed Rate 6.5000% 2006 2010 543.70 543.70Fixed Rate 5.8750% 2007 2011 437.60 416.10
5 Yr FXTB 113,153.40 79,230.81
ADAPS 58,615.00 24,692.41
Fixed Rate 12.3750% 2004 2009 5,920.00 1,257.87Fixed Rate 11.5000% 2005 2010 23,000.00 11,323.58
(1)
頁 235 / 247424(b)(3)
2014/03/12file:///C:/blp/data/CFd424b3.htm

Table of ContentsTable of ContentsTable of ContentsTable of Contents
DOMESTIC GOVERNMENT SECURITIES —(Continued) As of September 30, 2009
(In million Pesos)
T-26
Interest Rate Basis
Interest Rate(Per
Annum)Year
ContractedYear of
MaturityOriginalAmount
OutstandingBalance as ofSeptember 30,
2009
Fixed Rate 10.7500% 2005 2010 8,000.00 4,525.38
Fixed Rate 10.8750% 2005 2010 3,952.00 1,749.42
Fixed Rate 9.3750% 2005 2010 4,000.00 1,670.18
Fixed Rate 10.6250% 2006 2011 3,500.00 1,431.98
Fixed Rate 7.2500% 2006 2011 8,000.00 1,720.72
Fixed Rate 6.6250% 2008 2013 2,243.00 1,013.26
TAP 2,000.00 2,000.00
Fixed Rate 11.5000% 2005 2010 2,000.00 2,000.00
GOCCs 34,683.90 34,683.90
Fixed Rate 12.3750% 2004 2009 5,733.40 5,733.40
Fixed Rate 11.5000% 2005 2010 9,140.20 9,140.20
Fixed Rate 10.7500% 2005 2010 5,219.00 5,219.00
Fixed Rate 10.8750% 2005 2010 7,478.00 7,478.00
Fixed Rate 9.3750% 2005 2010 1,559.30 1,559.30
Fixed Rate 7.2500% 2006 2011 500.00 500.00
Fixed Rate 6.6250% 2008 2013 5,054.00 5,054.00
TEIs 17,854.50 17,854.50
Fixed Rate 12.3750% 2004 2009 1,525.20 1,525.20
Fixed Rate 11.1375% 2004 2009 934.20 934.20
Fixed Rate 10.3500% 2005 2010 3,004.80 3,004.80
Fixed Rate 11.5000% 2005 2010 815.20 815.20
Fixed Rate 9.6750% 2005 2010 422.90 422.90
Fixed Rate 10.8750% 2005 2010 4,707.50 4,707.50
Fixed Rate 9.7875% 2005 2010 125.20 125.20
Fixed Rate 8.4375% 2005 2010 22.50 22.50
Fixed Rate 7.2500% 2006 2011 1,829.20 1,829.20
Fixed Rate 6.6250% 2008 2013 4,467.80 4,467.80
7 Yr FXTB 175,007.25 139,775.06
ADAPS 107,696.00 72,463.81
Fixed Rate 11.8750% 2003 2010 7,000.00 2,647.85
Fixed Rate 11.0000% 2004 2011 6,147.00 4,140.21
Fixed Rate 12.0000% 2004 2011 17,449.00 7,900.13
Fixed Rate 11.5000% 2005 2012 13,000.00 8,799.53
Fixed Rate 11.3750% 2005 2012 8,000.00 5,238.32
Fixed Rate 10.5000% 2005 2012 4,000.00 2,740.11
Fixed Rate 9.0000% 2006 2013 4,000.00 1,986.84
Fixed Rate 9.6250% 2006 2013 3,500.00 2,538.91
Fixed Rate 7.1250% 2006 2013 8,000.00 3,995.32
Fixed Rate 6.5000% 2007 2014 12,700.00 10,535.90
Fixed Rate 8.3750% 2008 2015 21,000.00 19,040.69
Fixed Rate 7.1250% 2008 2013 2,900.00 2,900.00
TAP 3,000.00 3,000.00
Fixed Rate 11.8750% 2003 2010 3,000.00 3,000.00
GOCCs 36,955.70 36,955.60
Fixed Rate 11.8750% 2003 2010 1,065.60 1,065.60
Fixed Rate 11.0000% 2004 2011 1,372.70 1,372.70
(1)
頁 236 / 247424(b)(3)
2014/03/12file:///C:/blp/data/CFd424b3.htm
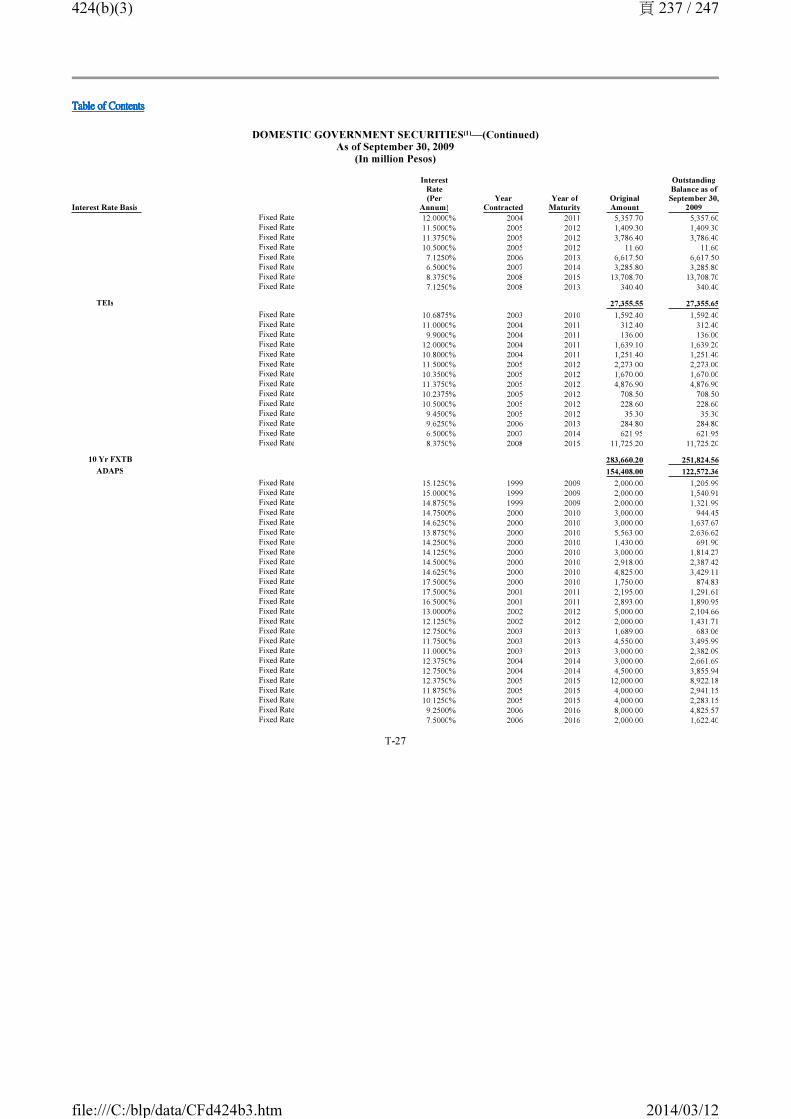
Table of ContentsTable of ContentsTable of ContentsTable of Contents
DOMESTIC GOVERNMENT SECURITIES —(Continued) As of September 30, 2009
(In million Pesos)
T-27
Interest Rate Basis
Interest Rate(Per
Annum)Year
ContractedYear of
MaturityOriginalAmount
OutstandingBalance as ofSeptember 30,
2009
Fixed Rate 12.0000% 2004 2011 5,357.70 5,357.60
Fixed Rate 11.5000% 2005 2012 1,409.30 1,409.30
Fixed Rate 11.3750% 2005 2012 3,786.40 3,786.40
Fixed Rate 10.5000% 2005 2012 11.60 11.60
Fixed Rate 7.1250% 2006 2013 6,617.50 6,617.50
Fixed Rate 6.5000% 2007 2014 3,285.80 3,285.80
Fixed Rate 8.3750% 2008 2015 13,708.70 13,708.70
Fixed Rate 7.1250% 2008 2013 340.40 340.40
TEIs 27,355.55 27,355.65
Fixed Rate 10.6875% 2003 2010 1,592.40 1,592.40
Fixed Rate 11.0000% 2004 2011 312.40 312.40
Fixed Rate 9.9000% 2004 2011 136.00 136.00
Fixed Rate 12.0000% 2004 2011 1,639.10 1,639.20
Fixed Rate 10.8000% 2004 2011 1,251.40 1,251.40
Fixed Rate 11.5000% 2005 2012 2,273.00 2,273.00
Fixed Rate 10.3500% 2005 2012 1,670.00 1,670.00
Fixed Rate 11.3750% 2005 2012 4,876.90 4,876.90
Fixed Rate 10.2375% 2005 2012 708.50 708.50
Fixed Rate 10.5000% 2005 2012 228.60 228.60
Fixed Rate 9.4500% 2005 2012 35.30 35.30
Fixed Rate 9.6250% 2006 2013 284.80 284.80
Fixed Rate 6.5000% 2007 2014 621.95 621.95
Fixed Rate 8.3750% 2008 2015 11,725.20 11,725.20
10 Yr FXTB 283,660.20 251,824.56
ADAPS 154,408.00 122,572.36
Fixed Rate 15.1250% 1999 2009 2,000.00 1,205.99
Fixed Rate 15.0000% 1999 2009 2,000.00 1,540.91
Fixed Rate 14.8750% 1999 2009 2,000.00 1,321.99
Fixed Rate 14.7500% 2000 2010 3,000.00 944.45
Fixed Rate 14.6250% 2000 2010 3,000.00 1,637.67
Fixed Rate 13.8750% 2000 2010 5,563.00 2,636.62
Fixed Rate 14.2500% 2000 2010 1,430.00 691.90
Fixed Rate 14.1250% 2000 2010 3,000.00 1,814.27
Fixed Rate 14.5000% 2000 2010 2,918.00 2,387.42
Fixed Rate 14.6250% 2000 2010 4,825.00 3,429.11
Fixed Rate 17.5000% 2000 2010 1,750.00 874.83
Fixed Rate 17.5000% 2001 2011 2,195.00 1,291.61
Fixed Rate 16.5000% 2001 2011 2,893.00 1,890.95
Fixed Rate 13.0000% 2002 2012 5,000.00 2,104.66
Fixed Rate 12.1250% 2002 2012 2,000.00 1,431.71
Fixed Rate 12.7500% 2003 2013 1,689.00 683.06
Fixed Rate 11.7500% 2003 2013 4,550.00 3,495.99
Fixed Rate 11.0000% 2003 2013 3,000.00 2,382.09
Fixed Rate 12.3750% 2004 2014 3,000.00 2,661.69
Fixed Rate 12.7500% 2004 2014 4,500.00 3,855.94
Fixed Rate 12.3750% 2005 2015 12,000.00 8,922.18
Fixed Rate 11.8750% 2005 2015 4,000.00 2,941.15
Fixed Rate 10.1250% 2005 2015 4,000.00 2,283.15
Fixed Rate 9.2500% 2006 2016 8,000.00 4,825.57
Fixed Rate 7.5000% 2006 2016 2,000.00 1,622.40
(1)
頁 237 / 247424(b)(3)
2014/03/12file:///C:/blp/data/CFd424b3.htm

Table of ContentsTable of ContentsTable of ContentsTable of Contents
DOMESTIC GOVERNMENT SECURITIES —(Continued) As of September 30, 2009
(In million Pesos)
T-28
Interest Rate Basis
Interest Rate(Per
Annum)Year
ContractedYear of
MaturityOriginalAmount
OutstandingBalance as ofSeptember 30,
2009
Fixed Rate 7.0000% 2006 2016 3,315.00 2,915.05
Fixed Rate 6.2500% 2006 2016 6,000.00 6,000.00
Fixed Rate 7.7500% 2007 2017 10,630.00 10,630.00
Fixed Rate 7.7500% 2008 2017 4,500.00 4,500.00
Fixed Rate 5.8750% 2008 2018 7,500.00 7,500.00
Fixed Rate 8.8750% 2008 2018 1,250.00 1,250.00
Fixed Rate 7.8750% 2009 2019 30,900.00 30,900.00
TAP 7,750.00 7,750.00
Fixed Rate 15.0000% 1999 2009 600.00 600.00
Fixed Rate 14.7500% 2000 2010 500.00 500.00
Fixed Rate 14.6250% 2000 2010 1,450.00 1,450.00
Fixed Rate 17.5000% 2000 2010 1,200.00 1,200.00
Fixed Rate 17.5000% 2001 2011 1,000.00 1,000.00
Fixed Rate 13.0000% 2002 2012 3,000.00 3,000.00
GOCCs 68,119.50 68,119.50
Fixed Rate 15.1250% 1999 2009 3,302.50 3,302.50
Fixed Rate 15.0000% 1999 2009 4,909.10 4,909.10
Fixed Rate 14.8750% 1999 2009 162.70 162.70
Fixed Rate 14.7500% 2000 2010 756.10 756.10
Fixed Rate 14.6250% 2000 2010 231.40 231.40
Fixed Rate 13.8750% 2000 2010 275.70 275.70
Fixed Rate 14.2500% 2000 2010 4.90 4.90
Fixed Rate 14.1250% 2000 2010 355.50 355.50
Fixed Rate 14.5000% 2000 2010 48.10 48.10
Fixed Rate 14.6250% 2000 2010 202.90 202.90
Fixed Rate 17.5000% 2000 2010 1.10 1.10
Fixed Rate 17.5000% 2001 2011 45.30 45.30
Fixed Rate 16.5000% 2001 2011 301.70 301.70
Fixed Rate 13.0000% 2002 2012 31.00 31.00
Fixed Rate 12.7500% 2003 2013 26.10 26.10
Fixed Rate 11.7500% 2003 2013 5.30 5.30
Fixed Rate 11.0000% 2003 2013 50.30 50.30
Fixed Rate 12.3750% 2004 2014 3,927.90 3,927.90
Fixed Rate 12.7500% 2004 2014 7,740.00 7,740.00
Fixed Rate 12.3750% 2005 2015 727.90 727.90
Fixed Rate 11.8750% 2005 2015 330.40 330.40
Fixed Rate 10.1250% 2005 2015 40.10 40.10
Fixed Rate 9.2500% 2006 2016 2,357.10 2,357.10
Fixed Rate 7.5000% 2006 2016 7,000.00 7,000.00
Fixed Rate 7.7500% 2007 2017 3,080.70 3,080.70
Fixed Rate 7.7500% 2007 2017 11,689.60 11,689.60
Fixed Rate 8.8750% 2008 2018 5,607.70 5,607.70
Fixed Rate 7.8750% 2009 2019 14,908.40 14,908.40
TEIs 53,382.70 53,382.70
Fixed Rate 15.0000% 1999 2009 200.00 200.00
Fixed Rate 14.6250% 2000 2010 400.00 400.00
Fixed Rate 14.2500% 2000 2010 200.00 200.00
Fixed Rate 14.1250% 2000 2010 200.00 200.00
Fixed Rate 17.5000% 2000 2010 200.00 200.00
Fixed Rate 17.5000% 2001 2011 744.70 744.70
(1)
頁 238 / 247424(b)(3)
2014/03/12file:///C:/blp/data/CFd424b3.htm

Table of ContentsTable of ContentsTable of ContentsTable of Contents
DOMESTIC GOVERNMENT SECURITIES —(Continued) As of September 30, 2009
(In million Pesos)
T-29
Interest Rate Basis
Interest Rate(Per
Annum)Year
ContractedYear of
MaturityOriginalAmount
OutstandingBalance as ofSeptember 30,
2009
Fixed Rate 15.7500% 2001 2011 4.50 4.50
Fixed Rate 16.5000% 2001 2011 700.00 700.00
Fixed Rate 14.8000% 2001 2011 300.40 300.40
Fixed Rate 11.7000% 2002 2012 199.10 199.10
Fixed Rate 12.7500% 2003 2013 500.00 500.00
Fixed Rate 11.4750% 2003 2013 564.40 564.40
Fixed Rate 10.5750% 2003 2013 177.60 177.60
Fixed Rate 9.9000% 2003 2013 10.30 10.30
Fixed Rate 11.1375% 2004 2014 447.30 447.30
Fixed Rate 12.7500% 2004 2014 200.00 200.00
Fixed Rate 11.4750% 2004 2014 1,739.90 1,739.90
Fixed Rate 12.3750% 2005 2015 3,526.30 3,526.30
Fixed Rate 11.1375% 2005 2015 3,409.50 3,409.50
Fixed Rate 11.8750% 2005 2015 8,246.40 8,246.40
Fixed Rate 10.8750% 2005 2015 587.90 587.90
Fixed Rate 9.1125% 2005 2015 38.00 38.00
Fixed Rate 9.2500% 2006 2016 987.20 987.20
Fixed Rate 8.3250% 2006 2016 110.00 110.00
Fixed Rate 7.5000% 2006 2016 106.20 106.20
Fixed Rate 7.7500% 2007 2017 1,039.60 1,039.60
Fixed Rate 7.7500% 2008 2017 3,055.50 3,055.50
Fixed Rate 8.8750% 2008 2018 7,327.50 7,327.50
Fixed Rate 7.8750% 2009 2019 18,160.40 18,160.40
20 Yr FXTB 105,799.31 105,799.31
ADAPS 76,745.00 76,745.00
Fixed Rate 14.3750% 1997 2017 2,000.00 2,000.00
Fixed Rate 15.0000% 2002 2022 4,000.00 4,000.00
Fixed Rate 12.7500% 2002 2022 1,000.00 1,000.00
Fixed Rate 13.0000% 2003 2023 4,500.00 4,500.00
Fixed Rate 11.8750% 2003 2023 6,972.00 6,972.00
Fixed Rate 11.3750% 2003 2023 3,000.00 3,000.00
Fixed Rate 12.3750% 2004 2024 3,252.00 3,252.00
Fixed Rate 12.8750% 2004 2024 2,948.00 2,948.00
Fixed Rate 13.7500% 2004 2024 3,330.00 3,330.00
Fixed Rate 12.1250% 2005 2025 8,500.00 8,500.00
Fixed Rate 10.2500% 2006 2026 13,578.00 13,578.00
Fixed Rate 8.0000% 2006 2026 4,322.00 4,322.00
Fixed Rate 8.6250% 2007 2027 5,925.00 5,925.00
Fixed Rate 9.5000% 2008 2028 4,918.00 4,918.00
Fixed Rate 9.5000% 2009 2028 8,500.00 8,500.00
TAP 11,769.90 11,769.90
Fixed Rate 14.3750% 1997 2017 3,804.90 3,804.90
Fixed Rate 13.0000% 2003 2023 1,900.00 1,900.00
Fixed Rate 11.3750% 2003 2023 670.00 670.00
Fixed Rate 8.6250% 2007 2027 1,895.00 1,895.00
Fixed Rate 8.6250% 2008 2027 3,500.00 3,500.00
GOCCs 12,750.81 12,750.81
Fixed Rate 14.3750% 1997 2017 4,020.10 4,020.10
Fixed Rate 12.8400% 1998 2018 10.45 10.45
(1)
頁 239 / 247424(b)(3)
2014/03/12file:///C:/blp/data/CFd424b3.htm

Table of ContentsTable of ContentsTable of ContentsTable of Contents
DOMESTIC GOVERNMENT SECURITIES —(Continued) As of September 30, 2009
(In million Pesos)
T-30
Interest Rate Basis
Interest Rate(Per
Annum)Year
ContractedYear of
MaturityOriginalAmount
OutstandingBalance as ofSeptember 30,
2009
Fixed Rate 12.8400% 1999 2019 6.52 6.52
Fixed Rate 12.8400% 2000 2020 2.20 2.20
Fixed Rate 12.8400% 2001 2021 2.42 2.42
Fixed Rate 12.8400% 2002 2022 2.67 2.67
Fixed Rate 15.0000% 2002 2022 3,116.10 3,116.10
Fixed Rate 12.8400% 2003 2023 2.95 2.95
Fixed Rate 13.0000% 2003 2023 5.40 5.40
Fixed Rate 11.8750% 2003 2023 14.50 14.50
Fixed Rate 11.3750% 2003 2023 1.80 1.80
Fixed Rate 12.3750% 2004 2024 0.80 0.80
Fixed Rate 12.8750% 2004 2024 276.80 276.80
Fixed Rate 13.7500% 2004 2024 863.80 863.80
Fixed Rate 12.1250% 2005 2025 276.90 276.90
Fixed Rate 10.2500% 2006 2026 2.70 2.70
Fixed Rate 8.6250% 2007 2027 162.50 162.50
Fixed Rate 9.5000% 2008 2028 3,982.20 3,982.20
TEI 4,533.60 4,533.60
Fixed Rate 13.5000% 2002 2022 35.00 35.00
Fixed Rate 13.0000% 2003 2023 900.00 900.00
Fixed Rate 11.7000% 2003 2023 287.00 287.00
Fixed Rate 11.1375% 2004 2024 258.30 258.30
Fixed Rate 11.5875% 2004 2024 60.00 60.00
Fixed Rate 12.3750% 2004 2024 15.90 15.90
Fixed Rate 10.9125% 2005 2025 119.00 119.00
Fixed Rate 12.1250% 2005 2025 453.10 453.10
Fixed Rate 10.2500% 2006 2026 1,163.90 1,163.90
Fixed Rate 8.6250% 2007 2027 997.80 997.80
Fixed Rate 8.6250% 2008 2027 18.00 18.00
Fixed Rate 9.5000% 2008 2028 225.60 225.60
25 Yr FXTB 52,811.30 52,811.30
ADAPS 27,390.00 27,390.00
Fixed Rate 18.2500% 2000 2025 5,286.00 5,286.00
Fixed Rate 12.5000% 2005 2030 4,000.00 4,000.00
Fixed Rate 11.2500% 2006 2031 3,104.00 3,104.00
Fixed Rate 9.3750% 2006 2031 8,000.00 8,000.00
Fixed Rate 8.5000% 2007 2032 7,000.00 7,000.00
TAP 10,351.00 10,351.00
Fixed Rate 18.2500% 2000 2025 2,320.00 2,320.00
Fixed Rate 12.5000% 2005 2030 3,000.00 3,000.00
Fixed Rate 8.5000% 2007 2032 4,064.00 4,064.00
Fixed Rate 8.5000% 2008 2032 967.00 967.00
GOCCs 10,583.40 10,582.70
Fixed Rate 18.2500% 2000 2025 96.10 96.10
Fixed Rate 12.5000% 2005 2030 57.50 57.50
Fixed Rate 11.2500% 2006 2031 70.60 69.90
Fixed Rate 8.5000% 2007 2032 10,359.20 10,359.20
TEIs 4,486.90 4,487.60
Fixed Rate 18.2500% 2000 2025 500.00 500.00
(1)
頁 240 / 247424(b)(3)
2014/03/12file:///C:/blp/data/CFd424b3.htm

Table of ContentsTable of ContentsTable of ContentsTable of Contents
DOMESTIC GOVERNMENT SECURITIES —(Continued) As of September 30, 2009
(In million Pesos)
T-31
Interest Rate Basis
Interest Rate(Per
Annum)Year
ContractedYear of
MaturityOriginalAmount
OutstandingBalance as ofSeptember 30,
2009
Fixed Rate 11.2500% 2005 2030 100.20 100.20
Fixed Rate 11.2500% 2006 2031 2,854.70 2,855.40
Fixed Rate 10.1250% 2006 2031 255.00 255.00
Fixed Rate 8.5000% 2007 2032 715.00 715.00
Fixed Rate 8.5000% 2008 2032 62.00 62.00
D. Retail Treasury Bonds 314,760.27 291,123.53
3 Yr 104,830.34 96,452.18
Fixed Rate 6.8750% 2007 2010 40,981.74 36,467.40
Fixed Rate 8.5000% 2008 2011 29,002.70 25,138.89
Fixed Rate 5.2500% 2009 2012 34,845.90 34,845.90
5 Yr 180,557.04 165,298.47
Fixed Rate 10.6250% 2005 2010 44,372.30 38,760.25
Fixed Rate 5.8750% 2006 2011 8,329.59 4,620.51
Fixed Rate 7.1250% 2007 2012 36,672.07 34,340.04
Fixed Rate 9.0000% 2008 2013 40,997.30 37,391.89
Fixed Rate 6.2500% 2009 2014 50,185.79 50,185.79
7 Yr 29,372.88 29,372.88
Fixed Rate 7.0000% 2009 2016 29,372.88 29,372.88
E. 10 Yr Special Purpose T/Bonds for CARP 16,157.62 16,157.62
ADAPS 9,988.00 9,988.00
Fixed Rate 15.5000% 2001 2011 3,173.00 3,173.00
Fixed Rate 14.0000% 2002 2012 2,815.00 2,815.00
Fixed Rate 12.2500% 2004 2014 4,000.00 4,000.00
TAP 5,769.62 5,769.62
Fixed Rate 15.5000% 2001 2011 2,769.62 2,769.62
Fixed Rate 12.2500% 2004 2014 3,000.00 3,000.00
TEIs 400.00 400.00
Fixed Rate 15.5000% 2001 2011 400.00 400.00
F. ZERO COUPON BOND 60,325.50 60,325.50
7 Yr 25,325.50 25,325.50
2003 2010 5,645.90 5,645.90
2004 2011 11,548.00 11,548.00
2005 2012 8,131.60 8,131.60
10 Yr Peace Bond 35,000.00 35,000.00
2001 2011 35,000.00 35,000.00
G. FIXED RATE PROMISSORY NOTES 6,700.00 6,700.00
7 Yr 6,700.00 6,700.00
Fixed Rate 10.250% 2003 2010 6,700.00 6,700.00
H. BENCHMARK BONDS 783,772.26 725,711.85
3 Yr 75,877.65 61,638.17
Fixed Rate 5.500% 2007 2010 61,605.35 47,365.87
(1)
頁 241 / 247424(b)(3)
2014/03/12file:///C:/blp/data/CFd424b3.htm

Table of ContentsTable of ContentsTable of ContentsTable of Contents
DOMESTIC GOVERNMENT SECURITIES —(Continued) As of September 30, 2009
(In million Pesos)
T-32
Interest Rate Basis
Interest Rate(Per
Annum)Year
ContractedYear of
MaturityOriginalAmount
OutstandingBalance as ofSeptember 30,
2009
Fixed Rate 5.500% 2007 2010 12,561.40 12,561.40
Fixed Rate 5.500% 2007 2010 1,710.90 1,710.90
5 Yr 370,646.94 339,762.28
Fixed Rate 8.500% 2006 2011 49,662.02 24,264.52
Fixed Rate 8.500% 2007 2011 28,228.60 28,228.60
Fixed Rate 8.500% 2008 2011 48,478.40 48,478.40
Fixed Rate 8.500% 2009 2011 803.20 803.20
Fixed Rate 5.750% 2007 2012 99,524.89 94,037.74
Fixed Rate 6.250% 2009 2014 143,949.82 143,949.82
7 Yr 235,320.62 222,384.36
Fixed Rate 8.750% 2006 2013 38,004.60 25,068.33
Fixed Rate 8.750% 2007 2013 14,904.60 14,904.60
Fixed Rate 8.750% 2008 2013 34,639.80 34,639.80
Fixed Rate 8.750% 2009 2013 8,067.00 8,067.00
Fixed Rate 7.000% 2009 2016 139,704.63 139,704.63
10 Yr 101,927.05 101,927.05
Fixed Rate 9.125% 2006 2016 65,716.55 65,716.55
Fixed Rate 9.125% 2007 2016 18,572.30 18,572.30
Fixed Rate 9.125% 2008 2016 17,433.50 17,433.50
Fixed Rate 9.125% 2009 2016 204.70 204.70
II. GUARANTEED LOANS 68,887.24
A. Land Bank Bonds 27.81
Fixed Rate 6.000% 27.81
B. NDC Agri-Agra (ERAP Bonds) 4,000.00 4,000.00
Fixed Rate 6.875% 2002 2009 2,000.00 2,000.00
Fixed Rate 5.875% 2006 2011 2,000.00 2,000.00
C. PAGIBIG Housing Bonds 7,000.00 7,000.00
Fixed Rate 8.750% 2005 2010 7,000.00 7,000.00
D. HGC ZERO COUPON BOND 14,998.43 14,998.43
7 YR 14,998.43 14,998.43
2004 2011 2,998.43 2,998.43
2006 2013 12,000.00 12,000.00
E. NFA Fixed Rate Coupon Bond 8,000.00 8,000.00
10 YR Fixed Rate 6.750% 2008 2018 8,000.00 8,000.00
F. NPC PESO ZERO COUPON BOND 19,800.00 19,800.00
7 YR 19,800.00 19,800.00
2004 2011 8,800.00 8,800.00
2005 2012 11,000.00 11,000.00
G. NPC FIXED RATE COUPON BOND 15,061.00 15,061.00
5 YR 5,741.00 5,741.00
Fixed Rate 9.125% 2005 2010 2,061.00 2,061.00
Fixed Rate 5.250% 2006 2011 3,680.00 3,680.00
(1)
頁 242 / 247424(b)(3)
2014/03/12file:///C:/blp/data/CFd424b3.htm

Table of ContentsTable of ContentsTable of ContentsTable of Contents
DOMESTIC GOVERNMENT SECURITIES —(Continued) As of September 30, 2009
(In million Pesos)
T-33
Interest Rate Basis
Interest Rate(Per
Annum)Year
ContractedYear of
MaturityOriginalAmount
OutstandingBalance as ofSeptember 30,
2009
7 YR 3,000.00 3,000.00
Fixed Rate 10.375% 2005 2012 3,000.00 3,000.00
10 YR 6,320.00 6,320.00
Fixed Rate 5.875% 2006 2016 6,320.00 6,320.00
(1) Excludes external securities of the Republic.
(1)
頁 243 / 247424(b)(3)
2014/03/12file:///C:/blp/data/CFd424b3.htm

Table of ContentsTable of ContentsTable of ContentsTable of Contents
DOMESTIC DEBT OF THE REPUBLIC OF THE PHILIPPINES (OTHER THAN SECURITIES) As of September 30, 2009
(In million Pesos)
T-34
Interest RateSpread
Original AmountContracted
Outstanding Balanceas of September 30, 2009
Interest Rate BasisYear
ContractedYear of
Maturityin OriginalCurrency
in PhilippinePesos
in OriginalCurrency
in PhilippinePesos
TOTAL 2,298 9,292
DIRECT LOANS 0
AGENCIES 0 6,997 6,997
PHILIPINE PESO 0 6,997 6,997 INTEREST FREE 0.00% 1953 79 79 INTEREST FREE 0.00% 1953 48 48 INTEREST FREE 0.00% 1945 29 29 INTEREST FREE 0.00% 1945 6,599 6,599 INTEREST FREE 0.00% 1993 27 27 INTEREST FREE 0.00% 1989 202 202 INTEREST FREE 0.00% 1989 13 13 INTEREST FREE 0.00% 1999 1 1
ASSUMED LOANS (REAL) 2,298 2,298 2,295 2,295
PHILIPINE PESO 2,298 2,298 2,295 2,295
INTEREST FREE 0.00% 1986 Upon Demand 63 63 63 63 INTEREST FREE 0.00% 1986 Upon Demand 134 134 134 134 INTEREST FREE 0.00% 1986 Upon Demand 120 120 120 120 INTEREST FREE 0.00% 1986 Upon Demand 72 72 72 72 INTEREST FREE 0.00% 1986 Upon Demand 50 50 50 50 INTEREST FREE 0.00% 1986 Upon Demand 200 200 200 200 INTEREST FREE 0.00% 1986 Upon Demand 1 1 1 1 INTEREST FREE 0.00% 1986 Upon Demand 66 66 66 66 INTEREST FREE 0.00% 1986 Upon Demand 3 3 3 3 INTEREST FREE 0.00% 1986 Upon Demand 3 3 3 3 INTEREST FREE 0.00% 1986 Upon Demand 4 4 4 4 INTEREST FREE 0.00% 1986 Upon Demand 8 8 8 8 INTEREST FREE 0.00% 1986 Upon Demand 1 1 1 1 INTEREST FREE 0.00% 1986 Upon Demand 1 1 1 1 INTEREST FREE 0.00% 1986 Upon Demand 9 9 9 9 INTEREST FREE 0.00% 1986 Upon Demand 84 84 84 84 INTEREST FREE 0.00% 1986 Upon Demand 3 3 0 0 INTEREST FREE 0.00% 1986 Upon Demand 6 6 6 6 INTEREST FREE 0.00% 1986 Upon Demand 1 1 1 1 INTEREST FREE 0.00% 1986 Upon Demand 261 261 261 261 INTEREST FREE 0.00% 1986 Upon Demand 913 913 913 913 INTEREST FREE 0.00% 1986 Upon Demand 6 6 6 6 INTEREST FREE 0.00% 1986 Upon Demand 54 54 54 54 INTEREST FREE 0.00% 1986 Upon Demand 229 229 229 229 INTEREST FREE 0.00% 1986 Upon Demand 6 6 6 6
頁 244 / 247424(b)(3)
2014/03/12file:///C:/blp/data/CFd424b3.htm

Table of ContentsTable of ContentsTable of ContentsTable of Contents
GUARANTEED DOMESTIC DEBT OF THE REPUBLIC OF THE PHILIPPINES (OTHER THAN SECURITIES)As of September 30, 2009
(In million Pesos)
T-35
InterestRate
Spread
Original AmountContracted
Outstanding Balanceas of September 30, 2009
Currency Interest Rate BasisYear
ContractedYear of
Maturityin OriginalCurrency
in PhilippinePesos
in OriginalCurrency
in PhilippinePesos
TOTAL 280 280 136
GFI GUARANTEE ASSUMED BY THE GOVERNMENT PER PROC. 50. 280 280 280 136
PHILIPPINE PESOS
INTEREST FREE 0.0000% 1986 Upon Demand 7 7 7 7
INTEREST FREE 0.0000% 1986 Upon Demand 30 30 30 30
INTEREST FREE 0.0000% 1986 2009 12 12 12 12
INTEREST FREE 0.0000% 1986 2009 17 17 17 17
INTEREST FREE 0.0000% 1986 2009 35 35 35 15
INTEREST FREE 0.0000% 1986 2009 7 7 7 7
INTEREST FREE 0.0000% 1986 2009 6 6 6 6
INTEREST FREE 0.0000% 1986 2009 5 5 5 5
INTEREST FREE 0.0000% 1986 2009 3 3 3 3
INTEREST FREE 0.0000% 1986 2009 1 1 1 1
INTEREST FREE 0.0000% 1986 2009 19 19 19 19
INTEREST FREE 0.0000% 1986 2009 32 32 32 1
INTEREST FREE 0.0000% 1986 2009 32 32 32 5
INTEREST FREE 0.0000% 1986 2009 8 8 8 3
INTEREST FREE 0.0000% 1986 2009 4 4 4 4
(1) Excludes securities issued by GOCCs.
(1)
頁 245 / 247424(b)(3)
2014/03/12file:///C:/blp/data/CFd424b3.htm

Table of ContentsTable of ContentsTable of ContentsTable of Contents
ISSUER
Republic of the Philippines Department of Finance Officer of the Secretary
Department of Finance Building BSP Complex
Manila Republic of the Philippines
JOINT DEALER MANAGERS FOR THE GLOBAL BOND OFFERING
INFORMATION AND EXCHANGE AGENT
Bondholder Communications Group, LLC Attn: Ruth Perez
E-mail: [email protected] Website: www.bondcom.com/rop
LEGAL ADVISORS TO THE REPUBLIC OF THE PHILIPPINES
LEGAL ADVISORS TO THE JOINT DEALER MANAGERS
Citigroup Global Markets Inc.388 Greenwich Street
New York, New York 10013 United States of America
The Hongkong and ShanghaiBanking Corporation LimitedLevel 17, HSBC Main Building
1 Queen’s Road CentralHong Kong
UBS AG52/F Two International
Finance Center8 Finance Street
Hong Kong
In New York: In London:30 Broad St., 46th floor
New York, New York 10004United States of America
Tel: +1 212 809 2663Fax: +1 212 437 9827
28 Throgmorton St., 1st floorLondon EC2N 2AN
United KingdomTel: +44 (0)20 7382 4580Fax: +44 (0)20 7067 9239
As to law of the United States of America: As to Philippine law:Allen & Overy
9 Floor, Three Exchange SquareCentral
Hong Kong
Department of JusticePadre Faura Street
MalateManila
Republic of the Philippines
As to law of the United States of America: As to Philippine law:Cleary Gottlieb Steen & Hamilton LLP
Bank of China TowerOne Garden Road
Hong Kong
Romulo, Mabanta, Buenaventura,Sayoc & de Los Angeles
30th Floor, Citibank Tower8741 Paseo de Roxas
Makati CityRepublic of the Philippines
FISCAL AGENT, REGISTAR, TRANSFER AGENT AND PRINCIPAL PAYMENT AGENT
LUXEMBOURG LISTING AGENT
The Bank of New York Mellon101 Barclay Street
New York, New York 10286United States of America
The Bank of New York (Luxembourg) S.A.Corporate Trust Services
Aerogolf Center-1A, HoehenhofL-1736 Senningerberg
Luxembourg
LUXEMBOURG PAYING AND TRANSFER AGENT
The Bank of New York (Luxembourg) S.A.Corporate Trust Services
Aerogolf Center-1A, HoehenhofL-1736 Senningerberg
Luxembourg
th
頁 246 / 247424(b)(3)
2014/03/12file:///C:/blp/data/CFd424b3.htm

Table of ContentsTable of ContentsTable of ContentsTable of Contents
頁 247 / 247424(b)(3)
2014/03/12file:///C:/blp/data/CFd424b3.htm