Embed Size (px)
Citation preview
www.iisd.org © 2013 The International Institute for Sustainable Development
Republic of Rwanda: Greenhouse gas emissions baseline projectionSeton Stiebert March 2013
© 2013 The International Institute for Sustainable DevelopmentIISD REPORT MARCH 2013Republic of Rwanda: Greenhouse gas emissions baseline projection ii
© 2013 The International Institute for Sustainable DevelopmentPublished by the International Institute for Sustainable Development.
International Institute for Sustainable DevelopmentThe International Institute for Sustainable Development (IISD) contributes to sustainable development by advancing policy recommendations on international trade and investment, economic policy, climate change and energy, and management of natural and social capital, as well as the enabling role of communication technologies in these areas. We report on international negotiations and disseminate knowledge gained through collaborative projects, resulting in more rigorous research, capacity building in developing countries, better networks spanning the North and the South, and better global connections among researchers, practitioners, citizens and policy-makers.
IISD’s vision is better living for all—sustainably; its mission is to champion innovation, enabling societies to live sustainably. IISD is registered as a charitable organization in Canada and has 501(c)(3) status in the United States. IISD receives core operating support from the Government of Canada, provided through the Canadian International Development Agency (CIDA), the International Development Research Centre (IDRC), and from the Province of Manitoba. The Institute receives project funding from numerous governments inside and outside Canada, United Nations agencies, foundations and the private sector.
Head Office161 Portage Avenue East, 6th Floor, Winnipeg, Manitoba, Canada R3B 0Y4 Tel: +1 (204) 958-7700 | Fax: +1 (204) 958-7710 | Website: www.iisd.org
Republic of Rwanda: Greenhouse gas emissions baseline projection
March 2013
Written by Seton Stiebert
This project was undertaken with financial support of:
This document is an output from a project funded by Environment Canada. However, the views expressed and information contained in it are not necessarily those of or endorsed by Environment Canada, who can accept no responsibility for such views or information or for any reliance placed on them.
© 2013 The International Institute for Sustainable DevelopmentIISD REPORT MARCH 2013Republic of Rwanda: Greenhouse gas emissions baseline projection iii
Table of Contents1.0 Introduction .................................................................................................................................................................................................... 1
2.0 Emissions Baseline ......................................................................................................................................................................................2
2.1 Historical GHG Emissions .................................................................................................................................................................2
2.2 Projection of baseline emissions ....................................................................................................................................................5
3.0 Agriculture .....................................................................................................................................................................................................7
3.1 Methodology and Data ......................................................................................................................................................................7
3.2 Data and Assumptions ......................................................................................................................................................................7
3.3 Data Availability and Uncertainty ................................................................................................................................................10
4.0 LULUCF ..........................................................................................................................................................................................................11
4.1 Methodology ........................................................................................................................................................................................11
4.2 Data and Assumptions ....................................................................................................................................................................11
4.3 Data Availability and Uncertainty................................................................................................................................................13
5.0 Electricity Generation ...............................................................................................................................................................................14
5.1 Methodology........................................................................................................................................................................................14
5.2 Data and Assumptions....................................................................................................................................................................14
5.3 Data Availability and Uncertainty ................................................................................................................................................15
6.0 Energy Demand ..........................................................................................................................................................................................16
6.1 Methodology .......................................................................................................................................................................................16
6.2 Data and Assumptions ...................................................................................................................................................................16
6.3 Data Availability and Uncertainty ................................................................................................................................................17
7.0 Transportation .............................................................................................................................................................................................18
7.1 Methodology ........................................................................................................................................................................................18
7.2 Data and Assumptions ....................................................................................................................................................................18
7.3 Data Availability and Uncertainty ................................................................................................................................................19
8.0 Industrial Processes .................................................................................................................................................................................20
8.1 Methodology ......................................................................................................................................................................................20
8.2 Data and Assumptions ..................................................................................................................................................................20
8.3 Data Availability and Uncertainty ................................................................................................................................................21
9.0 Waste ............................................................................................................................................................................................................22
9.1 Methodology.......................................................................................................................................................................................22
9.2 Data and Assumptions...................................................................................................................................................................22
9.3 Data Availability and Uncertainty ...............................................................................................................................................22
Reference List ......................................................................................................................................................................................................23
© 2013 The International Institute for Sustainable DevelopmentIISD REPORT MARCH 2013Republic of Rwanda: Greenhouse gas emissions baseline projection iv
AbbreviationsAEEI autonomous energy efficiency improvement
CH4 methane
CO2 carbon dioxide
CO2e carbon dioxide equivalent
FAO Food and Agricultural Organization of the United Nations
GDP gross domestic product
GHG greenhouse gas
GWh gigawatt hour
ha hectare
IPCC Intergovernmental Panel on Climate Change
Ktoe kilotonne oil equivalent
LULUCF land use, land-use change and forestry
MT megatonne
N2O nitrous oxide
NAMA nationally appropriate mitigation action
toe tonnes of oil equivlaent
© 2013 The International Institute for Sustainable DevelopmentIISD REPORT MARCH 2013Republic of Rwanda: Greenhouse gas emissions baseline projection 1
1.0 Introduction Rwanda is interested in the development of nationally appropriate mitigation actions (NAMAs). This emissions baseline projection report helps to identify the potential for NAMAs to reduce emissions and contributes to building capacity in Rwanda to select, design and implement NAMAs.
This report describes the methodology used to develop an emissions baseline projection to 2030 for the entire Rwandan economy as well as by sector. The information is organized by the seven sectors: agriculture, land use, land-use change and forestry, energy (both energy supply and energy demand), transportation, industrial processes and waste. This baseline scenario is not suitable for reporting to the United Nations Framework Convention on Climate Change, but is a very strong starting point and can easily be built on. The purpose of developing the baseline emissions projection is to provide a business-as-usual or reference scenario against which mitigation policies and measures can be evaluated. As such, the baseline emissions projection should be a plausible and consistent description of how these sectors might evolve in the future in the absence of explicit policies or regulation directed at greenhouse gas (GHG) emissions.
This report builds on the work that Rwanda has undertaken in the preparation for their second national communication to the United Nations Framework Convention on Climate Change. This work includes the development of a GHG inventory and identification of measures to mitigate climate change. The second national communication includes estimates of GHG emissions between 2003 and 2006. No emissions inventory data is currently available for years after 2006.
Section 2 describes and provides context for the overall emissions baseline projection. Sections 3 through 9 provide the specific methodologies and data used to generate an emissions baseline reference case (to 2030) for each of the seven sectors.
© 2013 The International Institute for Sustainable DevelopmentIISD REPORT MARCH 2013Republic of Rwanda: Greenhouse gas emissions baseline projection 2
2.0 Emissions BaselineAs illustrated in Figures 2 and 3 on page 5, the reference case includes the development of an inventory of historical emissions from 1990 to 2010, and the projection of annual emissions out to 2030. This forms the reference case—or the baseline—against which it is possible to demonstrate the abatement potential of low-carbon development options out to 2030. This baseline is meant to represent a conservative estimate of future emissions that considers existing climate policies and regulations in Rwanda and does not reflect aspirational targets and goals under Vision 2020 that will require additional financing (Ministry of Finance and Economic Planning, 2009). The report focuses on a single baseline reference case for ease of analysis. A more detailed mitigation or low-carbon analysis might assess uncertainty by considering multiple baseline reference cases.
All emission data presented in this section is based on our own modelling results. Details on how these emissions were calculated by sector are provided in Sections 3 through 9.
2.1 Historical GHG EmissionsTrends in historical GHG emissions were based on and calibrated against the second national communication emissions inventory, which is referred to as the SNC inventory (SNC) in this report (Ministry of Natural Resources, 2012). The SNC inventory divides emissions between five major sectors that align with the 1996 Intergovernmental Panel on Climate Change (IPCC) guidelines for conducting emissions inventories.
In order to develop this emissions baseline projection, it was necessary to reproduce historical emissions estimated in the SNC inventory using appropriate activity data, emission factors and methodologies. We began this process by collecting this data and using a spreadsheet model to calculate historical emissions from 2003 to 2006 using the same Tier 1 methodology approaches undertaken in the SNC Inventory. This may seem like a duplication of effort; however, it is critically important when developing projections because future changes in emissions are dependent on changes in activity data, as well as potential changes in emission factors and parameters. Reliable emission projections therefore must be based on this type of bottom-up analysis. An additional advantage of reproducing the SNC inventory is that assumptions and data are independently reviewed and questioned, which may lead to more robust and accurate emission inventories in the future. Within this report, we discuss extensively how emission data may be improved over time.
Emissions in this report deviate from the SNC inventory in a few cases. Differences between the SNC inventory and the emissions baseline projection were informed by a review of the literature and are documented in this report for each of the seven sectors.
The relationship between the seven sectors of the low-carbon analysis and the major IPCC sectors in the SNC inventory and 1996 guidelines is set out in Table 1.
© 2013 The International Institute for Sustainable DevelopmentIISD REPORT MARCH 2013Republic of Rwanda: Greenhouse gas emissions baseline projection 3
TABLE 1: RELATIONSHIP OF EMISSION BASELINE REFERENCE CASE SECTORS TO INVENTORY SECTORS
MITIGATION ANALYSIS SECTORS SNC INVENTORY SECTORS (BASED ON 1996 IPCC GUIDELINES)
Energy demand
EnergyEnergy supply
Transportation
Industrial processes Industrial processes
Agriculture Agriculture
Land use, land-use change and forestry (LULUCF) Land use, land-use change and forestry (LULUCF)
Waste Waste
Source: IPCC (1996); UNFCCC (1999)
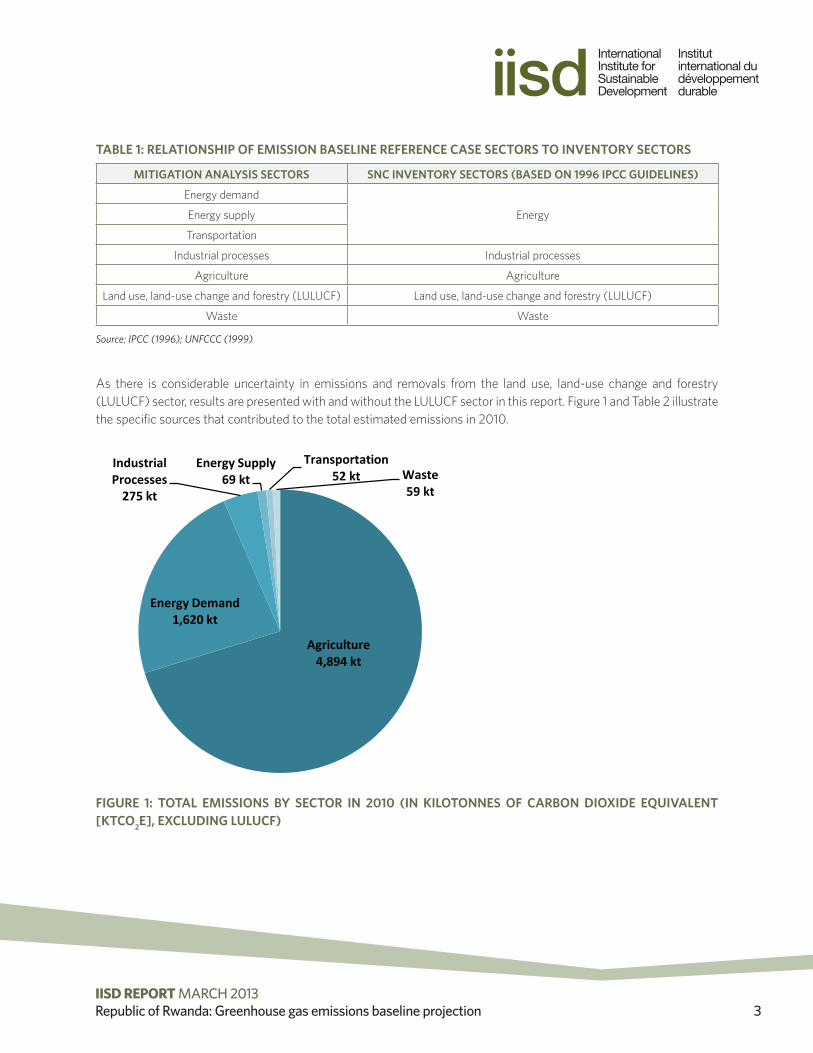
As there is considerable uncertainty in emissions and removals from the land use, land-use change and forestry (LULUCF) sector, results are presented with and without the LULUCF sector in this report. Figure 1 and Table 2 illustrate the specific sources that contributed to the total estimated emissions in 2010.
FIGURE 1: TOTAL EMISSIONS BY SECTOR IN 2010 (IN KILOTONNES OF CARBON DIOXIDE EQUIVALENT [KTCO2E], EXCLUDING LULUCF)
Agriculture4,894 kt
Energy Demand1,620 kt
Industrial Processes
275 kt
Energy Supply69 kt
Transportation52 kt Waste
59 kt
© 2013 The International Institute for Sustainable DevelopmentIISD REPORT MARCH 2013Republic of Rwanda: Greenhouse gas emissions baseline projection 4
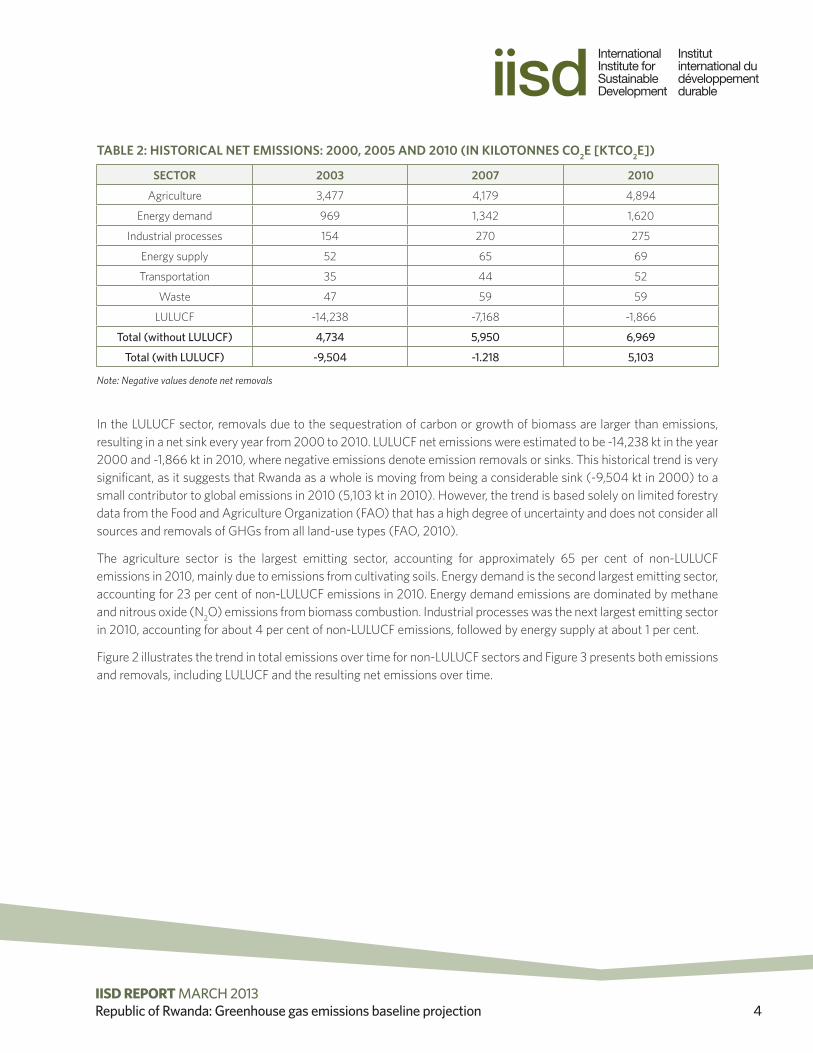
TABLE 2: HISTORICAL NET EMISSIONS: 2000, 2005 AND 2010 (IN KILOTONNES CO2E [KTCO2E])
SECTOR 2003 2007 2010
Agriculture 3,477 4,179 4,894
Energy demand 969 1,342 1,620
Industrial processes 154 270 275
Energy supply 52 65 69
Transportation 35 44 52
Waste 47 59 59
LULUCF -14,238 -7,168 -1,866
Total (without LULUCF) 4,734 5,950 6,969
Total (with LULUCF) -9,504 -1.218 5,103
Note: Negative values denote net removals
In the LULUCF sector, removals due to the sequestration of carbon or growth of biomass are larger than emissions, resulting in a net sink every year from 2000 to 2010. LULUCF net emissions were estimated to be -14,238 kt in the year 2000 and -1,866 kt in 2010, where negative emissions denote emission removals or sinks. This historical trend is very significant, as it suggests that Rwanda as a whole is moving from being a considerable sink (-9,504 kt in 2000) to a small contributor to global emissions in 2010 (5,103 kt in 2010). However, the trend is based solely on limited forestry data from the Food and Agriculture Organization (FAO) that has a high degree of uncertainty and does not consider all sources and removals of GHGs from all land-use types (FAO, 2010).
The agriculture sector is the largest emitting sector, accounting for approximately 65 per cent of non-LULUCF emissions in 2010, mainly due to emissions from cultivating soils. Energy demand is the second largest emitting sector, accounting for 23 per cent of non-LULUCF emissions in 2010. Energy demand emissions are dominated by methane and nitrous oxide (N2O) emissions from biomass combustion. Industrial processes was the next largest emitting sector in 2010, accounting for about 4 per cent of non-LULUCF emissions, followed by energy supply at about 1 per cent.
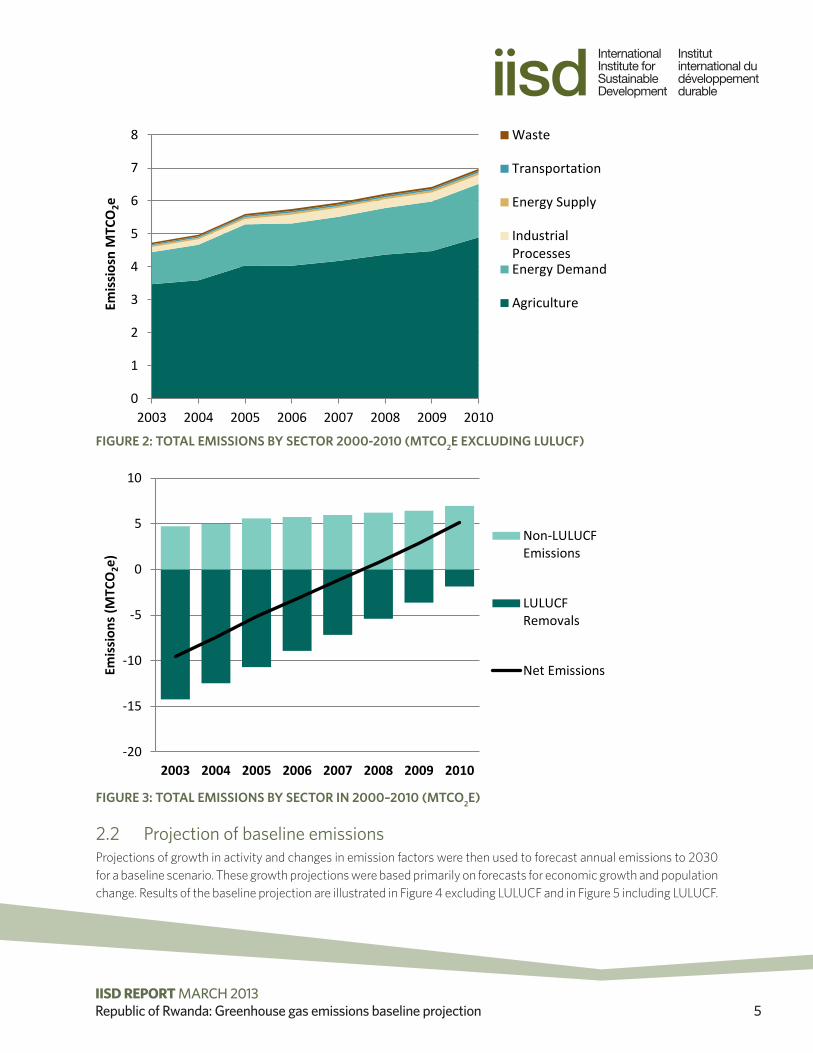
Figure 2 illustrates the trend in total emissions over time for non-LULUCF sectors and Figure 3 presents both emissions and removals, including LULUCF and the resulting net emissions over time.
© 2013 The International Institute for Sustainable DevelopmentIISD REPORT MARCH 2013Republic of Rwanda: Greenhouse gas emissions baseline projection 5
FIGURE 2: TOTAL EMISSIONS BY SECTOR 2000-2010 (MTCO2E EXCLUDING LULUCF)
FIGURE 3: TOTAL EMISSIONS BY SECTOR IN 2000–2010 (MTCO2E)
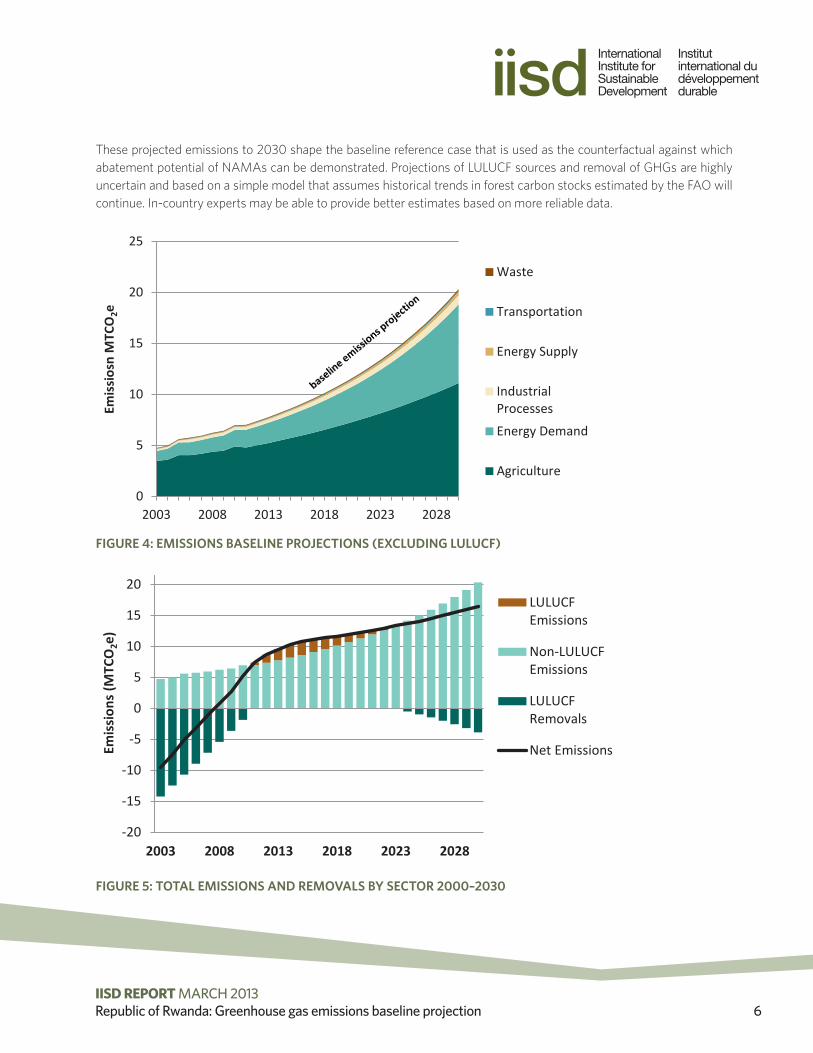
2.2 Projection of baseline emissionsProjections of growth in activity and changes in emission factors were then used to forecast annual emissions to 2030 for a baseline scenario. These growth projections were based primarily on forecasts for economic growth and population change. Results of the baseline projection are illustrated in Figure 4 excluding LULUCF and in Figure 5 including LULUCF.
0
1
2
3
4
5
6
7
8
2003 2004 2005 2006 2007 2008 2009 2010
Emiss
iosn
MTC
O2e
Waste
Transportation
Energy Supply
IndustrialProcessesEnergy Demand
Agriculture
-20
-15
-10
-5
0
5
10
2003 2004 2005 2006 2007 2008 2009 2010
Emis
sions
(MTC
O2e
)
Non-LULUCFEmissions
LULUCFRemovals
Net Emissions
© 2013 The International Institute for Sustainable DevelopmentIISD REPORT MARCH 2013Republic of Rwanda: Greenhouse gas emissions baseline projection 6
These projected emissions to 2030 shape the baseline reference case that is used as the counterfactual against which abatement potential of NAMAs can be demonstrated. Projections of LULUCF sources and removal of GHGs are highly uncertain and based on a simple model that assumes historical trends in forest carbon stocks estimated by the FAO will continue. In-country experts may be able to provide better estimates based on more reliable data.
FIGURE 4: EMISSIONS BASELINE PROJECTIONS (EXCLUDING LULUCF)
FIGURE 5: TOTAL EMISSIONS AND REMOVALS BY SECTOR 2000–2030
0
5
10
15
20
25
2003 2008 2013 2018 2023 2028
Emis
siosn
MTC
O2e
Waste
Transportation
Energy Supply
IndustrialProcesses
Energy Demand
Agriculture
-20
-15
-10
-5
0
5
10
15
20
25
2003 2008 2013 2018 2023 2028
Emis
sions
(MTC
O2e
)
LULUCFEmissions
Non-LULUCFEmissions
LULUCFRemovals
Net Emissions
© 2013 The International Institute for Sustainable DevelopmentIISD REPORT MARCH 2013Republic of Rwanda: Greenhouse gas emissions baseline projection 7
3.0 Agriculture
3.1 Methodology and DataIn the 2006 IPCC guidelines, the agriculture sector is combined with the forestry and other land-use sector for developing emission inventories. This report examines the agriculture sector separately from the forestry and other land-use sector to enable an assessment of agricultural emissions alone. The LULUCF sector analysis includes all carbon releases and sinks that are a result of a land conversion from one type to another.
The agricultural sector does not include energy emissions from fuel combustion, which are included within other sectors, such as transportation and the energy demand sectors.
The agricultural sector is currently the largest net source of GHG emissions of all sectors. Almost two thirds of total non-LULUCF emissions are from this sector alone. Despite its prevalence, data required to calculate GHG emissions is lacking and there is higher uncertainty in the calculation of agricultural emissions compared to the energy demand, energy supply and industrial processes.
Four different types of emission sources are considered in SNC Inventory and in this analysis:
• Enteric fermentation and manure management from livestock
• Burning of savannah
• Burning of agricultural residues
• Cultivated soils
• Flooding rice
Insufficient information is presented in the SNC inventory to back-calculate burning of savannah, burning of agricultural residues and cultivated soils emissions. In this case, we have accepted these emissions as is without identifying appropriate emission factors or activity data. For others sources, the emissions baseline uses the same Tier 1 methodologies, activity data and emission factors as the SNC inventory.
3.2 Data and Assumptions
Enteric Fermentation and Manure Management Emissions from LivestockHistoric livestock populations summarized in Table 3 were obtained from the SNC inventory and from recent statistics (National Institute of Statistics of Rwanda, 2012).
© 2013 The International Institute for Sustainable DevelopmentIISD REPORT MARCH 2013Republic of Rwanda: Greenhouse gas emissions baseline projection 8
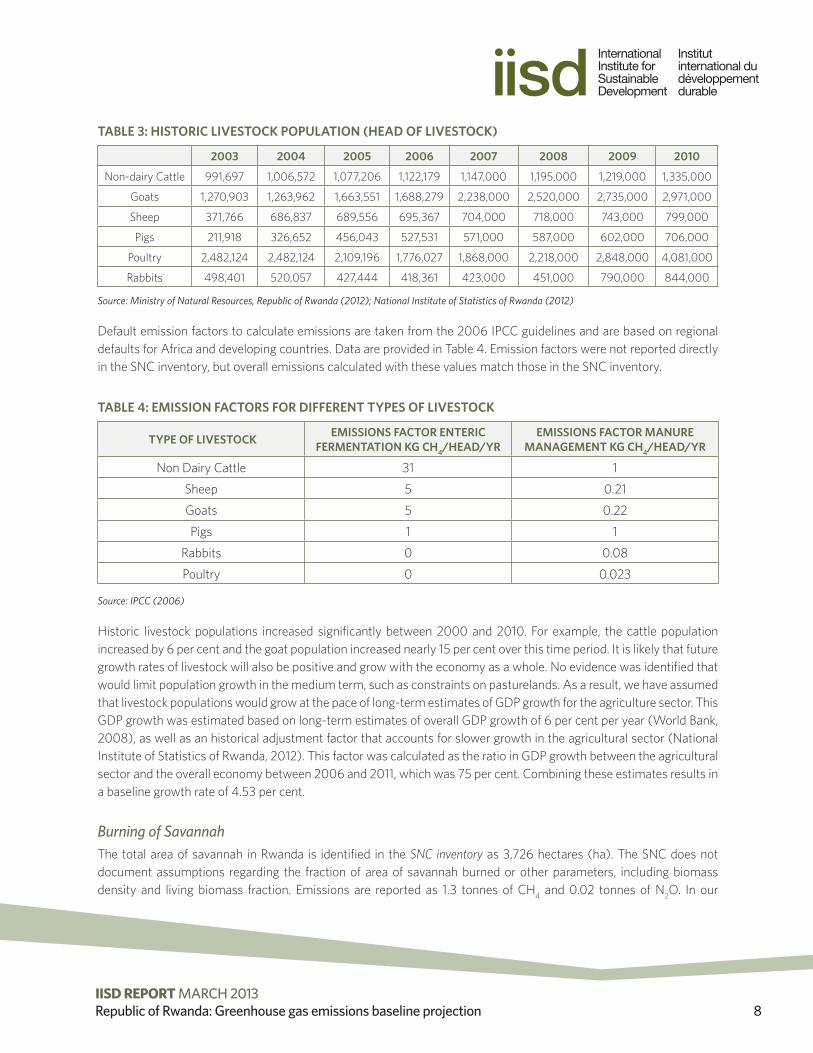
TABLE 3: HISTORIC LIVESTOCK POPULATION (HEAD OF LIVESTOCK)
2003 2004 2005 2006 2007 2008 2009 2010
Non-dairy Cattle 991,697 1,006,572 1,077,206 1,122,179 1,147,000 1,195,000 1,219,000 1,335,000
Goats 1,270,903 1,263,962 1,663,551 1,688,279 2,238,000 2,520,000 2,735,000 2,971,000
Sheep 371,766 686,837 689,556 695,367 704,000 718,000 743,000 799,000
Pigs 211,918 326,652 456,043 527,531 571,000 587,000 602,000 706,000
Poultry 2,482,124 2,482,124 2,109,196 1,776,027 1,868,000 2,218,000 2,848,000 4,081,000
Rabbits 498,401 520,057 427,444 418,361 423,000 451,000 790,000 844,000
Source: Ministry of Natural Resources, Republic of Rwanda (2012); National Institute of Statistics of Rwanda (2012)
Default emission factors to calculate emissions are taken from the 2006 IPCC guidelines and are based on regional defaults for Africa and developing countries. Data are provided in Table 4. Emission factors were not reported directly in the SNC inventory, but overall emissions calculated with these values match those in the SNC inventory.
TABLE 4: EMISSION FACTORS FOR DIFFERENT TYPES OF LIVESTOCK
TYPE OF LIVESTOCK EMISSIONS FACTOR ENTERIC FERMENTATION KG CH4/HEAD/YR
EMISSIONS FACTOR MANURE MANAGEMENT KG CH4/HEAD/YR
Non Dairy Cattle 31 1
Sheep 5 0.21
Goats 5 0.22
Pigs 1 1
Rabbits 0 0.08
Poultry 0 0.023
Source: IPCC (2006)
Historic livestock populations increased significantly between 2000 and 2010. For example, the cattle population increased by 6 per cent and the goat population increased nearly 15 per cent over this time period. It is likely that future growth rates of livestock will also be positive and grow with the economy as a whole. No evidence was identified that would limit population growth in the medium term, such as constraints on pasturelands. As a result, we have assumed that livestock populations would grow at the pace of long-term estimates of GDP growth for the agriculture sector. This GDP growth was estimated based on long-term estimates of overall GDP growth of 6 per cent per year (World Bank, 2008), as well as an historical adjustment factor that accounts for slower growth in the agricultural sector (National Institute of Statistics of Rwanda, 2012). This factor was calculated as the ratio in GDP growth between the agricultural sector and the overall economy between 2006 and 2011, which was 75 per cent. Combining these estimates results in a baseline growth rate of 4.53 per cent.
Burning of SavannahThe total area of savannah in Rwanda is identified in the SNC inventory as 3,726 hectares (ha). The SNC does not document assumptions regarding the fraction of area of savannah burned or other parameters, including biomass density and living biomass fraction. Emissions are reported as 1.3 tonnes of CH4 and 0.02 tonnes of N2O. In our
© 2013 The International Institute for Sustainable DevelopmentIISD REPORT MARCH 2013Republic of Rwanda: Greenhouse gas emissions baseline projection 9
calculations, this would correspond to a small fraction of savannah burned, around 100 ha, or less than 5 per cent of the total savannah area. However, we do not have any additional data to update this information so we have adopted the emissions reported in the SNC. These calculations should be reviewed; however, source emissions from burning of savannah are so small that any changes are not likely to impact the overall trend in emissions.
The baseline projection assumes no changes in the area of savannah and the burning frequency over time and, as a result, emissions levels do not change over time. This assumption may be outdated, as there is evidence that Rwanda has introduced regulations that could reduce the amount of savannah burned.
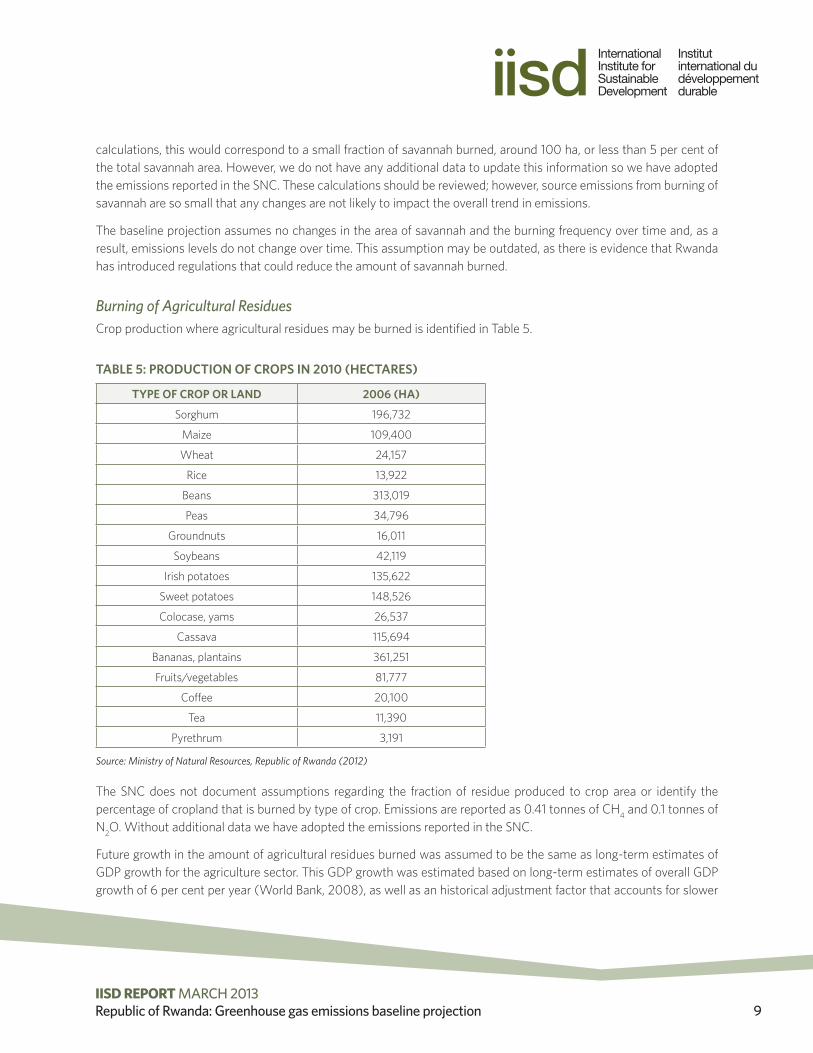
Burning of Agricultural ResiduesCrop production where agricultural residues may be burned is identified in Table 5.
TABLE 5: PRODUCTION OF CROPS IN 2010 (HECTARES)
TYPE OF CROP OR LAND 2006 (HA)
Sorghum 196,732
Maize 109,400
Wheat 24,157
Rice 13,922
Beans 313,019
Peas 34,796
Groundnuts 16,011
Soybeans 42,119
Irish potatoes 135,622
Sweet potatoes 148,526
Colocase, yams 26,537
Cassava 115,694
Bananas, plantains 361,251
Fruits/vegetables 81,777
Coffee 20,100
Tea 11,390
Pyrethrum 3,191
Source: Ministry of Natural Resources, Republic of Rwanda (2012)
The SNC does not document assumptions regarding the fraction of residue produced to crop area or identify the percentage of cropland that is burned by type of crop. Emissions are reported as 0.41 tonnes of CH4 and 0.1 tonnes of N2O. Without additional data we have adopted the emissions reported in the SNC.
Future growth in the amount of agricultural residues burned was assumed to be the same as long-term estimates of GDP growth for the agriculture sector. This GDP growth was estimated based on long-term estimates of overall GDP growth of 6 per cent per year (World Bank, 2008), as well as an historical adjustment factor that accounts for slower
© 2013 The International Institute for Sustainable DevelopmentIISD REPORT MARCH 2013Republic of Rwanda: Greenhouse gas emissions baseline projection 10
growth in the agricultural sector (National Institute of Statistics of Rwanda, 2012). This factor was calculated as the ratio in GDP growth between the agricultural sector and the overall economy between 2006 and 2011, which was 75 per cent. Combining these estimates results in a baseline growth rate of 4.53 per cent. This assumption may be outdated as there is evidence that Rwanda has introduced regulations banning burning of agricultural lands; however, in this analysis, we are not able to estimate the impact of the regulations.
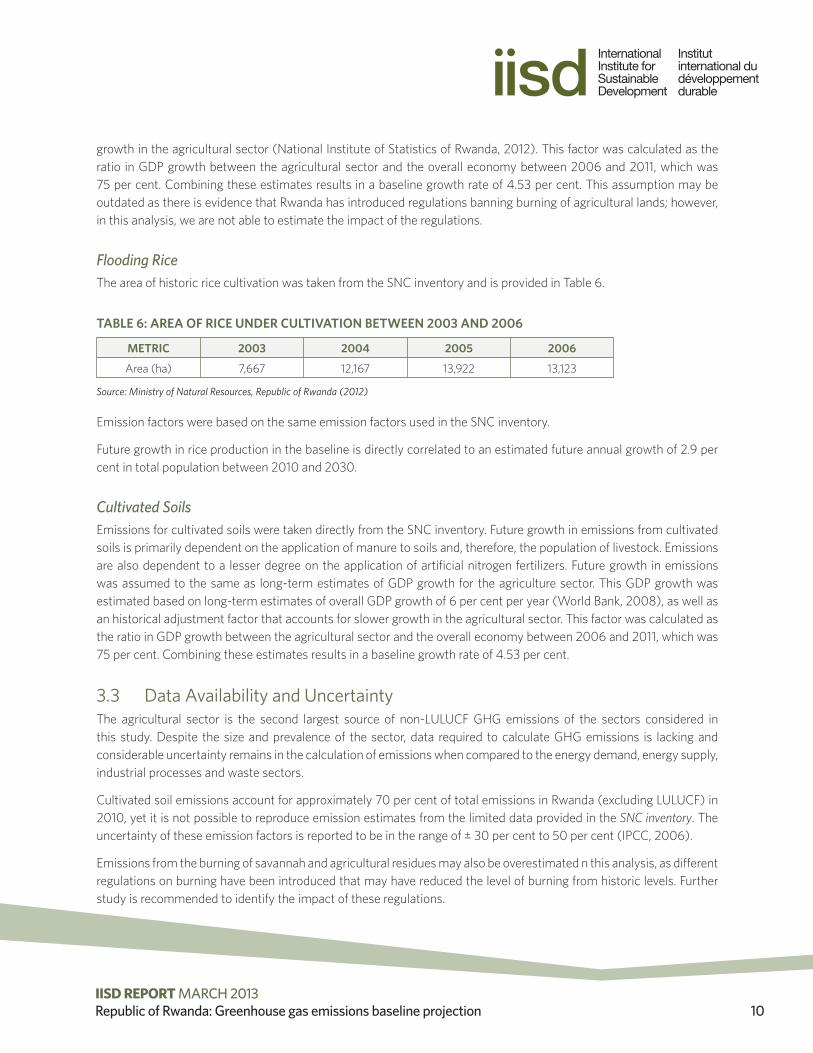
Flooding RiceThe area of historic rice cultivation was taken from the SNC inventory and is provided in Table 6.
TABLE 6: AREA OF RICE UNDER CULTIVATION BETWEEN 2003 AND 2006
METRIC 2003 2004 2005 2006
Area (ha) 7,667 12,167 13,922 13,123
Source: Ministry of Natural Resources, Republic of Rwanda (2012)
Emission factors were based on the same emission factors used in the SNC inventory.
Future growth in rice production in the baseline is directly correlated to an estimated future annual growth of 2.9 per cent in total population between 2010 and 2030.
Cultivated SoilsEmissions for cultivated soils were taken directly from the SNC inventory. Future growth in emissions from cultivated soils is primarily dependent on the application of manure to soils and, therefore, the population of livestock. Emissions are also dependent to a lesser degree on the application of artificial nitrogen fertilizers. Future growth in emissions was assumed to the same as long-term estimates of GDP growth for the agriculture sector. This GDP growth was estimated based on long-term estimates of overall GDP growth of 6 per cent per year (World Bank, 2008), as well as an historical adjustment factor that accounts for slower growth in the agricultural sector. This factor was calculated as the ratio in GDP growth between the agricultural sector and the overall economy between 2006 and 2011, which was 75 per cent. Combining these estimates results in a baseline growth rate of 4.53 per cent.
3.3 Data Availability and UncertaintyThe agricultural sector is the second largest source of non-LULUCF GHG emissions of the sectors considered in this study. Despite the size and prevalence of the sector, data required to calculate GHG emissions is lacking and considerable uncertainty remains in the calculation of emissions when compared to the energy demand, energy supply, industrial processes and waste sectors.
Cultivated soil emissions account for approximately 70 per cent of total emissions in Rwanda (excluding LULUCF) in 2010, yet it is not possible to reproduce emission estimates from the limited data provided in the SNC inventory. The uncertainty of these emission factors is reported to be in the range of ± 30 per cent to 50 per cent (IPCC, 2006).
Emissions from the burning of savannah and agricultural residues may also be overestimated n this analysis, as different regulations on burning have been introduced that may have reduced the level of burning from historic levels. Further study is recommended to identify the impact of these regulations.
© 2013 The International Institute for Sustainable DevelopmentIISD REPORT MARCH 2013Republic of Rwanda: Greenhouse gas emissions baseline projection 11
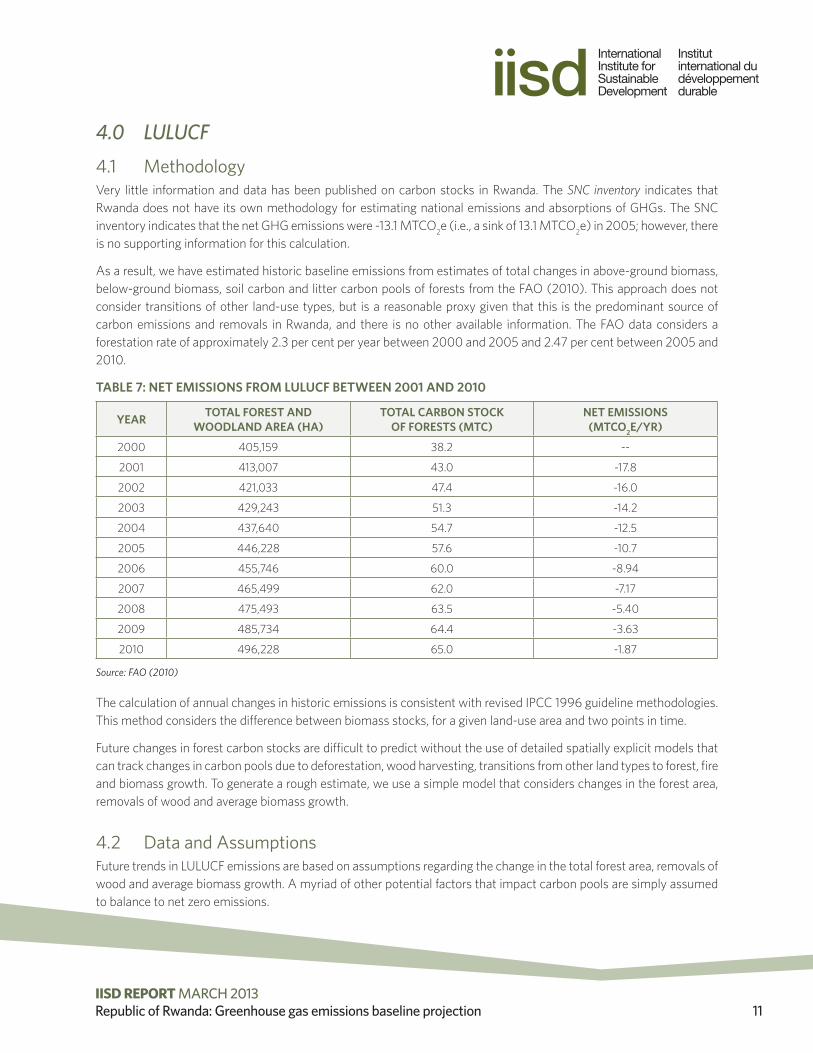
4.0 LULUCF4.1 MethodologyVery little information and data has been published on carbon stocks in Rwanda. The SNC inventory indicates that Rwanda does not have its own methodology for estimating national emissions and absorptions of GHGs. The SNC inventory indicates that the net GHG emissions were -13.1 MTCO2e (i.e., a sink of 13.1 MTCO2e) in 2005; however, there is no supporting information for this calculation.
As a result, we have estimated historic baseline emissions from estimates of total changes in above-ground biomass, below-ground biomass, soil carbon and litter carbon pools of forests from the FAO (2010). This approach does not consider transitions of other land-use types, but is a reasonable proxy given that this is the predominant source of carbon emissions and removals in Rwanda, and there is no other available information. The FAO data considers a forestation rate of approximately 2.3 per cent per year between 2000 and 2005 and 2.47 per cent between 2005 and 2010.
TABLE 7: NET EMISSIONS FROM LULUCF BETWEEN 2001 AND 2010
YEAR TOTAL FOREST AND WOODLAND AREA (HA)
TOTAL CARBON STOCK OF FORESTS (MTC)
NET EMISSIONS (MTCO2E/YR)
2000 405,159 38.2 --
2001 413,007 43.0 -17.8
2002 421,033 47.4 -16.0
2003 429,243 51.3 -14.2
2004 437,640 54.7 -12.5
2005 446,228 57.6 -10.7
2006 455,746 60.0 -8.94
2007 465,499 62.0 -7.17
2008 475,493 63.5 -5.40
2009 485,734 64.4 -3.63
2010 496,228 65.0 -1.87
Source: FAO (2010)
The calculation of annual changes in historic emissions is consistent with revised IPCC 1996 guideline methodologies. This method considers the difference between biomass stocks, for a given land-use area and two points in time.
Future changes in forest carbon stocks are difficult to predict without the use of detailed spatially explicit models that can track changes in carbon pools due to deforestation, wood harvesting, transitions from other land types to forest, fire and biomass growth. To generate a rough estimate, we use a simple model that considers changes in the forest area, removals of wood and average biomass growth.
4.2 Data and AssumptionsFuture trends in LULUCF emissions are based on assumptions regarding the change in the total forest area, removals of wood and average biomass growth. A myriad of other potential factors that impact carbon pools are simply assumed to balance to net zero emissions.
© 2013 The International Institute for Sustainable DevelopmentIISD REPORT MARCH 2013Republic of Rwanda: Greenhouse gas emissions baseline projection 12
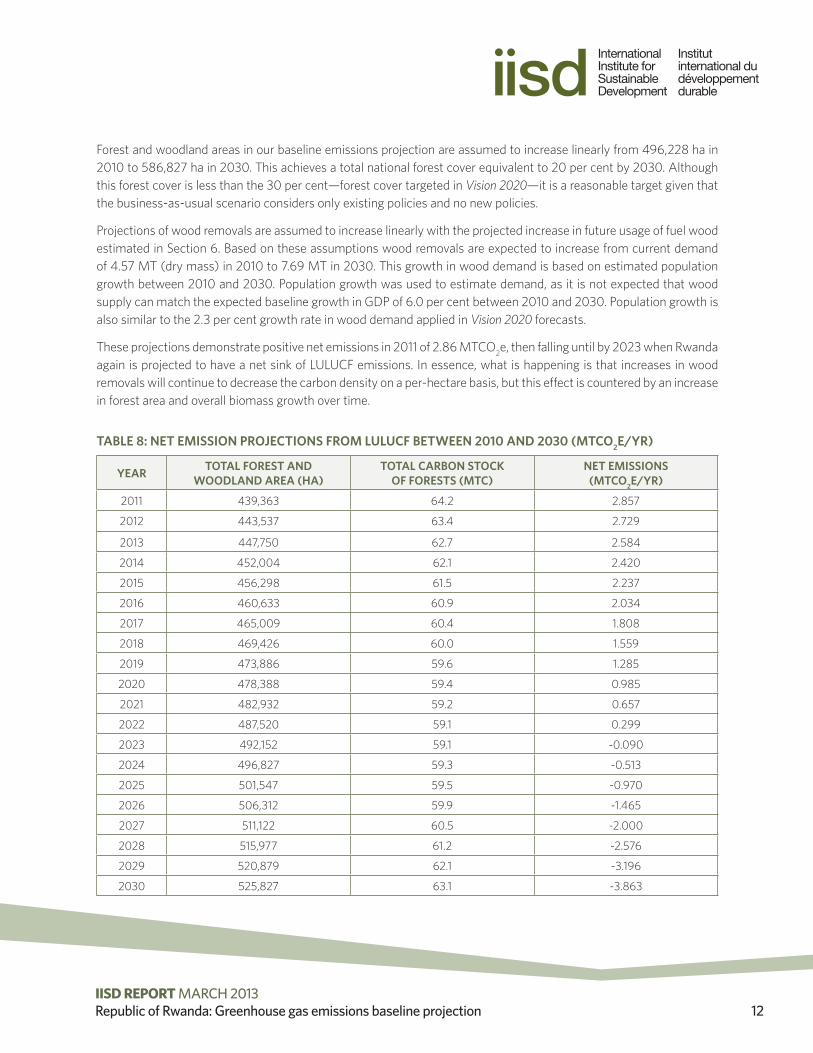
Forest and woodland areas in our baseline emissions projection are assumed to increase linearly from 496,228 ha in 2010 to 586,827 ha in 2030. This achieves a total national forest cover equivalent to 20 per cent by 2030. Although this forest cover is less than the 30 per cent—forest cover targeted in Vision 2020—it is a reasonable target given that the business-as-usual scenario considers only existing policies and no new policies.
Projections of wood removals are assumed to increase linearly with the projected increase in future usage of fuel wood estimated in Section 6. Based on these assumptions wood removals are expected to increase from current demand of 4.57 MT (dry mass) in 2010 to 7.69 MT in 2030. This growth in wood demand is based on estimated population growth between 2010 and 2030. Population growth was used to estimate demand, as it is not expected that wood supply can match the expected baseline growth in GDP of 6.0 per cent between 2010 and 2030. Population growth is also similar to the 2.3 per cent growth rate in wood demand applied in Vision 2020 forecasts.
These projections demonstrate positive net emissions in 2011 of 2.86 MTCO2e, then falling until by 2023 when Rwanda again is projected to have a net sink of LULUCF emissions. In essence, what is happening is that increases in wood removals will continue to decrease the carbon density on a per-hectare basis, but this effect is countered by an increase in forest area and overall biomass growth over time.
TABLE 8: NET EMISSION PROJECTIONS FROM LULUCF BETWEEN 2010 AND 2030 (MTCO2E/YR)
YEAR TOTAL FOREST AND WOODLAND AREA (HA)
TOTAL CARBON STOCK OF FORESTS (MTC)
NET EMISSIONS (MTCO2E/YR)
2011 439,363 64.2 2.857
2012 443,537 63.4 2.729
2013 447,750 62.7 2.584
2014 452,004 62.1 2.420
2015 456,298 61.5 2.237
2016 460,633 60.9 2.034
2017 465,009 60.4 1.808
2018 469,426 60.0 1.559
2019 473,886 59.6 1.285
2020 478,388 59.4 0.985
2021 482,932 59.2 0.657
2022 487,520 59.1 0.299
2023 492,152 59.1 -0.090
2024 496,827 59.3 -0.513
2025 501,547 59.5 -0.970
2026 506,312 59.9 -1.465
2027 511,122 60.5 -2.000
2028 515,977 61.2 -2.576
2029 520,879 62.1 -3.196
2030 525,827 63.1 -3.863
© 2013 The International Institute for Sustainable DevelopmentIISD REPORT MARCH 2013Republic of Rwanda: Greenhouse gas emissions baseline projection 13
4.3 Data Availability and UncertaintyGHG emissions trends in the forestry sector are difficult to determine because of the uncertainty in measuring biomass carbon pools for the entire country. The SNC inventory indicates that LULUCF emissions have an uncertainty of ±40 per cent. Conducting forest and land-use inventories of carbon stocks is complex and a detailed forestry inventory and projection is beyond the scope of the research undertaken for this report.
The model employed to estimate sequestration of carbon is very basic because resources or data were not available to conduct detailed modelling. The uncertainty in these estimates is very high, certainly higher than ±40 per cent for the inventory, as the modelling does not account for numerous important factors including: conversions of land to different types (e.g., agriculture, settlement), the age of forests, specific biomass growth rates of different forest types and forest fires. In addition, small changes in model input values for the emissions baseline can lead to drastically different results. It is recommended that reliable estimates of LULUCF emissions be developed to reduce uncertainty. For example, detailed Tier 3 modelling could be conducted using consistent spatially explicit observations of land use and land-use change using remote sensing and geographic information systems.
© 2013 The International Institute for Sustainable DevelopmentIISD REPORT MARCH 2013Republic of Rwanda: Greenhouse gas emissions baseline projection 14
5.0 Electricity Generation
5.1 MethodologyDeveloping a reference case for Rwanda’s electricity sector is challenging because of some uncertainty in the amount of fossil fuels that are consumed by the sector and how the sector may expand in the future. Current and projected growth rates are very large in an effort to meet a large suppressed demand for electricity; however, the main constraint on growth is the capital investment to add capacity and connect potential customers. Historical annual growth in electricity consumption in Rwanda exceeds 10 per cent annually between 2004 and 2011 (National Institute of Statistics of Rwanda, 2012). This high growth rate is expected to continue and there are 83 megawatts of methane capacity that may be commissioned by 2013.
An emissions baseline for the electricity sector is developed by estimating the total fossil fuel consumption of different generation technologies and then multiplying the total consumption by appropriate emission factors. This method is the same as the Tier 1 approach used in the SNC inventory for stationary combustion sources.
5.2 Data and AssumptionsIn recent years, thermal generation has increased to nearly 50 per cent of total electricity production in Rwanda. It is estimated that approximately 40 megawatts of thermal capacity was installed by the end of 2011.
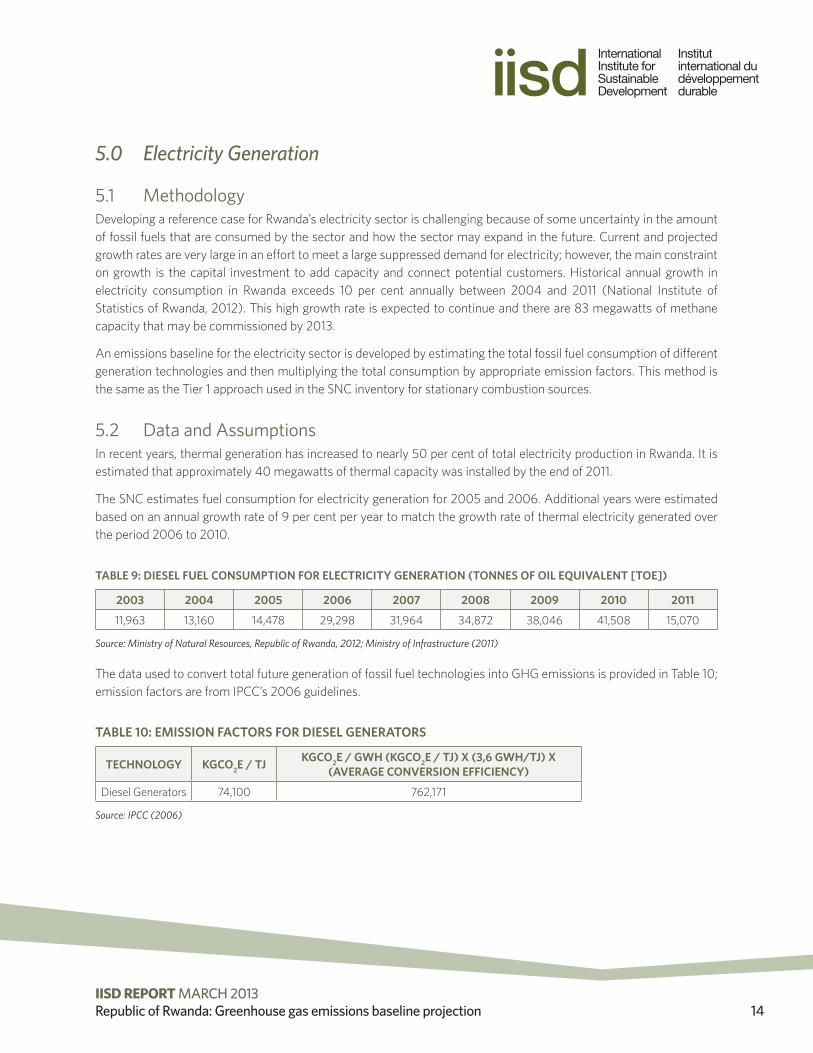
The SNC estimates fuel consumption for electricity generation for 2005 and 2006. Additional years were estimated based on an annual growth rate of 9 per cent per year to match the growth rate of thermal electricity generated over the period 2006 to 2010.
TABLE 9: DIESEL FUEL CONSUMPTION FOR ELECTRICITY GENERATION (TONNES OF OIL EQUIVALENT [TOE])
2003 2004 2005 2006 2007 2008 2009 2010 2011
11,963 13,160 14,478 29,298 31,964 34,872 38,046 41,508 15,070
Source: Ministry of Natural Resources, Republic of Rwanda, 2012; Ministry of Infrastructure (2011)
The data used to convert total future generation of fossil fuel technologies into GHG emissions is provided in Table 10; emission factors are from IPCC’s 2006 guidelines.
TABLE 10: EMISSION FACTORS FOR DIESEL GENERATORS
TECHNOLOGY KGCO2E / TJ KGCO2E / GWH (KGCO2E / TJ) X (3,6 GWH/TJ) X (AVERAGE CONVERSION EFFICIENCY)
Diesel Generators 74,100 762,171
Source: IPCC (2006)
© 2013 The International Institute for Sustainable DevelopmentIISD REPORT MARCH 2013Republic of Rwanda: Greenhouse gas emissions baseline projection 15
Thermal electricity consumption has increased from approximately 70.5 gigawatt hours (GWh) in 2005 to 196 GWh in 2011 (Ministry of Infrastructure, 2011). It is likely that high growth will continue in the future as additional customers are added to the electricity grid; however, the choice of electricity generation technology will play an important factor. The emissions baseline assumes that demand for diesel fuel for electricity generation will increase until 2030 at the rate of 10 per cent per year between 2010 and 2030. It may be that methane gas will be the fossil fuel that sees highest growth (Ministry of Infrastructure, 2011). This assumed rate is substantially higher than GDP growth forecasts but still considerably lower than Vision 2020 growth forecasts in electricity production of 17.1 per cent (Ministry of Finance and Economic Planning, 2009).
5.3 Data Availability and UncertaintyThere are a number of studies available that examine electricity supply in the short term for Rwanda. However, it is difficult to estimate fossil fuel demand from this information as it focuses on overall generation and not specifically thermal generation. As a result, there is a high degree of uncertainty related to the installed capacity of thermal plants and their consumption of fossil fuels.
© 2013 The International Institute for Sustainable DevelopmentIISD REPORT MARCH 2013Republic of Rwanda: Greenhouse gas emissions baseline projection 16
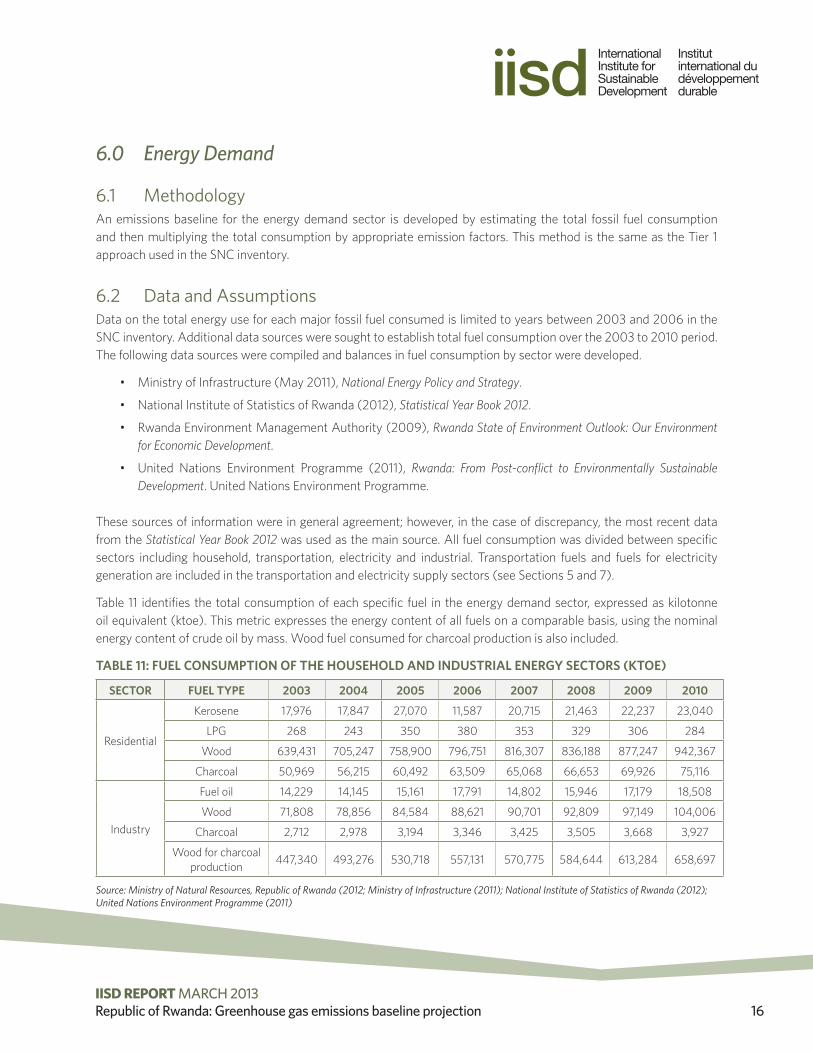
6.0 Energy Demand
6.1 MethodologyAn emissions baseline for the energy demand sector is developed by estimating the total fossil fuel consumption and then multiplying the total consumption by appropriate emission factors. This method is the same as the Tier 1 approach used in the SNC inventory.
6.2 Data and AssumptionsData on the total energy use for each major fossil fuel consumed is limited to years between 2003 and 2006 in the SNC inventory. Additional data sources were sought to establish total fuel consumption over the 2003 to 2010 period. The following data sources were compiled and balances in fuel consumption by sector were developed.
• Ministry of Infrastructure (May 2011), National Energy Policy and Strategy.
• National Institute of Statistics of Rwanda (2012), Statistical Year Book 2012.
• Rwanda Environment Management Authority (2009), Rwanda State of Environment Outlook: Our Environment for Economic Development.
• United Nations Environment Programme (2011), Rwanda: From Post-conflict to Environmentally Sustainable Development. United Nations Environment Programme.
These sources of information were in general agreement; however, in the case of discrepancy, the most recent data from the Statistical Year Book 2012 was used as the main source. All fuel consumption was divided between specific sectors including household, transportation, electricity and industrial. Transportation fuels and fuels for electricity generation are included in the transportation and electricity supply sectors (see Sections 5 and 7).
Table 11 identifies the total consumption of each specific fuel in the energy demand sector, expressed as kilotonne oil equivalent (ktoe). This metric expresses the energy content of all fuels on a comparable basis, using the nominal energy content of crude oil by mass. Wood fuel consumed for charcoal production is also included.
TABLE 11: FUEL CONSUMPTION OF THE HOUSEHOLD AND INDUSTRIAL ENERGY SECTORS (KTOE)
SECTOR FUEL TYPE 2003 2004 2005 2006 2007 2008 2009 2010
Residential
Kerosene 17,976 17,847 27,070 11,587 20,715 21,463 22,237 23,040
LPG 268 243 350 380 353 329 306 284
Wood 639,431 705,247 758,900 796,751 816,307 836,188 877,247 942,367
Charcoal 50,969 56,215 60,492 63,509 65,068 66,653 69,926 75,116
Industry
Fuel oil 14,229 14,145 15,161 17,791 14,802 15,946 17,179 18,508
Wood 71,808 78,856 84,584 88,621 90,701 92,809 97,149 104,006
Charcoal 2,712 2,978 3,194 3,346 3,425 3,505 3,668 3,927
Wood for charcoal production 447,340 493,276 530,718 557,131 570,775 584,644 613,284 658,697
Source: Ministry of Natural Resources, Republic of Rwanda (2012; Ministry of Infrastructure (2011); National Institute of Statistics of Rwanda (2012); United Nations Environment Programme (2011)
© 2013 The International Institute for Sustainable DevelopmentIISD REPORT MARCH 2013Republic of Rwanda: Greenhouse gas emissions baseline projection 17
Future growth in petroleum product consumption is projected in the Vision 2020 document at 10.1 per cent (Ministry of Finance and Economic Planning, 2009). This contrasts with expected long-term GDP growth of 6 per cent between 2007 and 2027. Baseline projections assume that demand for fossil fuels will fall between these growth rates. The mid value is used and a correction for autonomous energy efficiency improvement (AEEI) is also applied. AEEI is estimated to be -1 per cent per year. This AEEI is based on research that end-uses of fuels such as cookstoves become more fuel-efficient over time, reducing the overall demand for energy (Graus et al., 2009). Combining these estimates results in a total growth rate of 9.1 per cent per year for petroleum products. Future biomass consumption has not increased in the same manner. Historic growth in biomass fuels has been around 5 per cent between 2003 and 2010. There is a significant constraint of biomass growth based on the available supply of biomass fuels in the baseline. Without significant efforts to restore, protect and manage forests, demand for wood will continue to lead to deforestation in Rwanda and deplete existing sustainable wood supplies. Because of these constraints, we have limited growth in biomass fuels to the forecast population growth rate of 2.6 per cent, which is based on historical growth rates between 2000 and 2012 (National Institute of Statistics of Rwanda, 2012). This aligns reasonably well with the projected Vision 2020 growth rate for biomass of 2.3 per cent (Ministry of Finance and Economic Planning, 2009).
Emission factors for fuel consumption are the same as the emission factors used in the SNC inventory report and are based on IPCC default values.
6.3 Data Availability and UncertaintyUncertainty in the emissions reference case is relatively low for the total emissions of fossil fuels, as there is a low degree of uncertainty related to the total consumption of these fuels in Rwanda during the historic period and the related emission factors. The uncertainty is higher for biomass fuels, as the data on total biomass fuels consumed in Rwanda is based on limited surveys. It is likely that the range of uncertainty for these types of surveys is within 30–60 per cent (IPCC, 2006).
© 2013 The International Institute for Sustainable DevelopmentIISD REPORT MARCH 2013Republic of Rwanda: Greenhouse gas emissions baseline projection 18
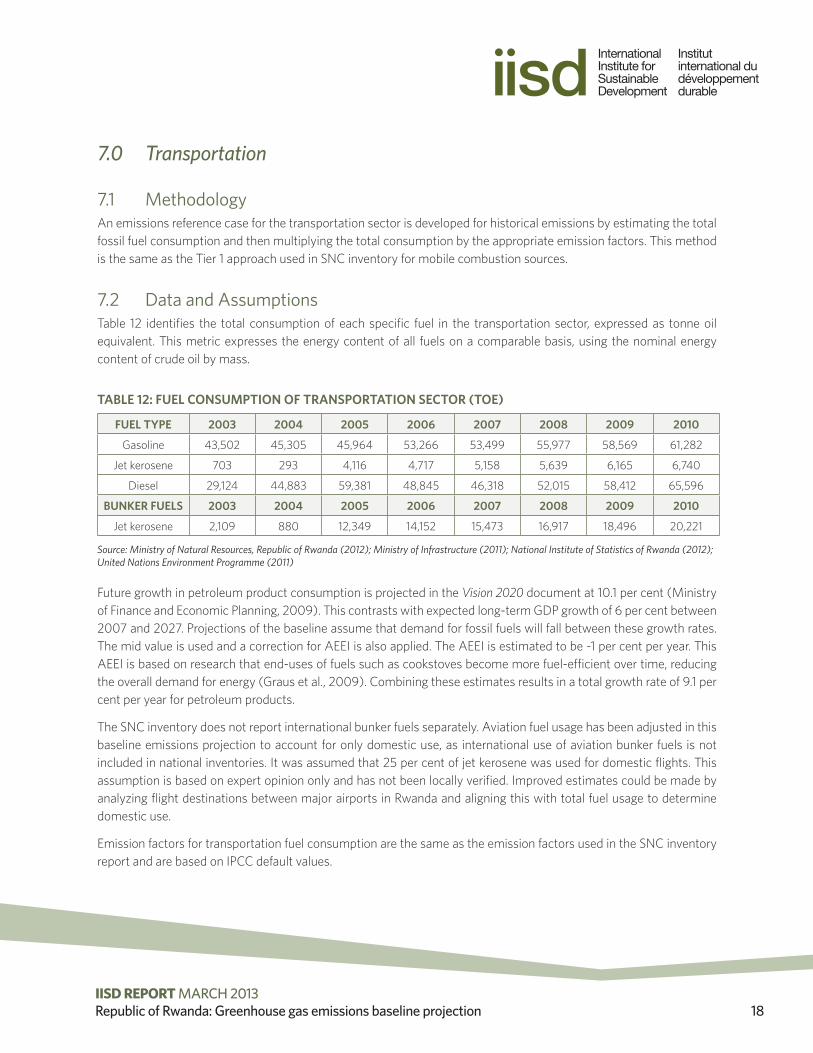
7.0 Transportation
7.1 MethodologyAn emissions reference case for the transportation sector is developed for historical emissions by estimating the total fossil fuel consumption and then multiplying the total consumption by the appropriate emission factors. This method is the same as the Tier 1 approach used in SNC inventory for mobile combustion sources.
7.2 Data and AssumptionsTable 12 identifies the total consumption of each specific fuel in the transportation sector, expressed as tonne oil equivalent. This metric expresses the energy content of all fuels on a comparable basis, using the nominal energy content of crude oil by mass.
TABLE 12: FUEL CONSUMPTION OF TRANSPORTATION SECTOR (TOE)
FUEL TYPE 2003 2004 2005 2006 2007 2008 2009 2010
Gasoline 43,502 45,305 45,964 53,266 53,499 55,977 58,569 61,282
Jet kerosene 703 293 4,116 4,717 5,158 5,639 6,165 6,740
Diesel 29,124 44,883 59,381 48,845 46,318 52,015 58,412 65,596
BUNKER FUELS 2003 2004 2005 2006 2007 2008 2009 2010
Jet kerosene 2,109 880 12,349 14,152 15,473 16,917 18,496 20,221
Source: Ministry of Natural Resources, Republic of Rwanda (2012); Ministry of Infrastructure (2011); National Institute of Statistics of Rwanda (2012); United Nations Environment Programme (2011)
Future growth in petroleum product consumption is projected in the Vision 2020 document at 10.1 per cent (Ministry of Finance and Economic Planning, 2009). This contrasts with expected long-term GDP growth of 6 per cent between 2007 and 2027. Projections of the baseline assume that demand for fossil fuels will fall between these growth rates. The mid value is used and a correction for AEEI is also applied. The AEEI is estimated to be -1 per cent per year. This AEEI is based on research that end-uses of fuels such as cookstoves become more fuel-efficient over time, reducing the overall demand for energy (Graus et al., 2009). Combining these estimates results in a total growth rate of 9.1 per cent per year for petroleum products.
The SNC inventory does not report international bunker fuels separately. Aviation fuel usage has been adjusted in this baseline emissions projection to account for only domestic use, as international use of aviation bunker fuels is not included in national inventories. It was assumed that 25 per cent of jet kerosene was used for domestic flights. This assumption is based on expert opinion only and has not been locally verified. Improved estimates could be made by analyzing flight destinations between major airports in Rwanda and aligning this with total fuel usage to determine domestic use.
Emission factors for transportation fuel consumption are the same as the emission factors used in the SNC inventory report and are based on IPCC default values.
© 2013 The International Institute for Sustainable DevelopmentIISD REPORT MARCH 2013Republic of Rwanda: Greenhouse gas emissions baseline projection 19
7.3 Data Availability and Uncertainty
Uncertainty in the overall fuel demand and historic emissions from the transportation sector is fairly low, as these estimates are based on total reported fuel usage from national statistics.
For the domestic aviation sector, estimates of the fuel demand were based on a crude approximation of the fuel demand between international bunker fuels for international aviation flights, which are not included in the domestic GHG inventory, and domestic usage. This split in fuel consumption could be improved if flight data for the entire country was available.
© 2013 The International Institute for Sustainable DevelopmentIISD REPORT MARCH 2013Republic of Rwanda: Greenhouse gas emissions baseline projection 20
8.0 Industrial Processes
8.1 MethodologyThe main industrial processes emission sources in Rwanda are releases from processes that chemically or physically transform materials (for example, the manufacture of cement is a process that release a significant amount of CO2). Different GHGs—including CO2, CH4, N2O, hydrofluorocarbons and perfluorocarbons—can be produced during these processes.
Only the major industries with significant emissions from industrial processes that were identified in the SNC inventory were considered: cement and lime production. Emissions from products such as refrigerators, foams or aerosol cans were not included in the analysis, as these emissions were not included in the SNC inventory. These emissions are likely to be relatively small.
In general, the emissions baseline for the industrial process sector was developed by estimating the total production of an industrial product that in its transformation contributes to GHG emissions, and then multiplying this value by appropriate emission factors. The methods used follow the same Tier 1 approach used in the SNC inventory.
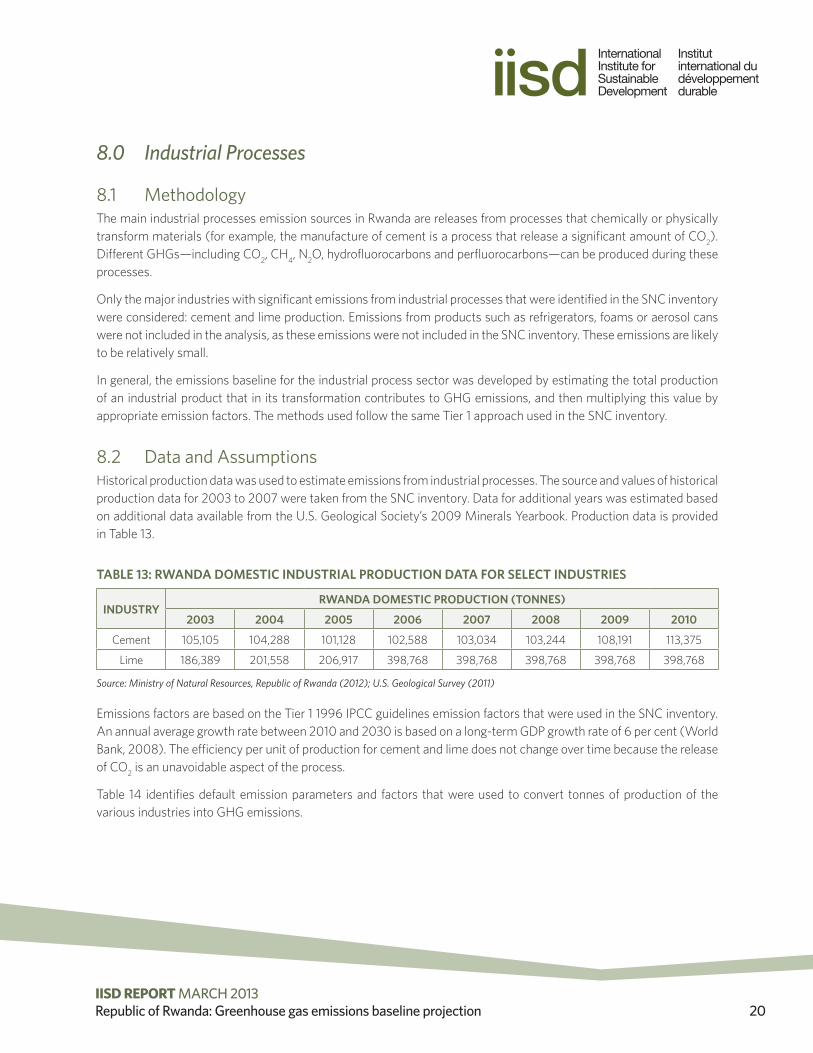
8.2 Data and AssumptionsHistorical production data was used to estimate emissions from industrial processes. The source and values of historical production data for 2003 to 2007 were taken from the SNC inventory. Data for additional years was estimated based on additional data available from the U.S. Geological Society’s 2009 Minerals Yearbook. Production data is provided in Table 13.
TABLE 13: RWANDA DOMESTIC INDUSTRIAL PRODUCTION DATA FOR SELECT INDUSTRIES
INDUSTRYRWANDA DOMESTIC PRODUCTION (TONNES)
2003 2004 2005 2006 2007 2008 2009 2010
Cement 105,105 104,288 101,128 102,588 103,034 103,244 108,191 113,375
Lime 186,389 201,558 206,917 398,768 398,768 398,768 398,768 398,768
Source: Ministry of Natural Resources, Republic of Rwanda (2012); U.S. Geological Survey (2011)
Emissions factors are based on the Tier 1 1996 IPCC guidelines emission factors that were used in the SNC inventory. An annual average growth rate between 2010 and 2030 is based on a long-term GDP growth rate of 6 per cent (World Bank, 2008). The efficiency per unit of production for cement and lime does not change over time because the release of CO2 is an unavoidable aspect of the process.
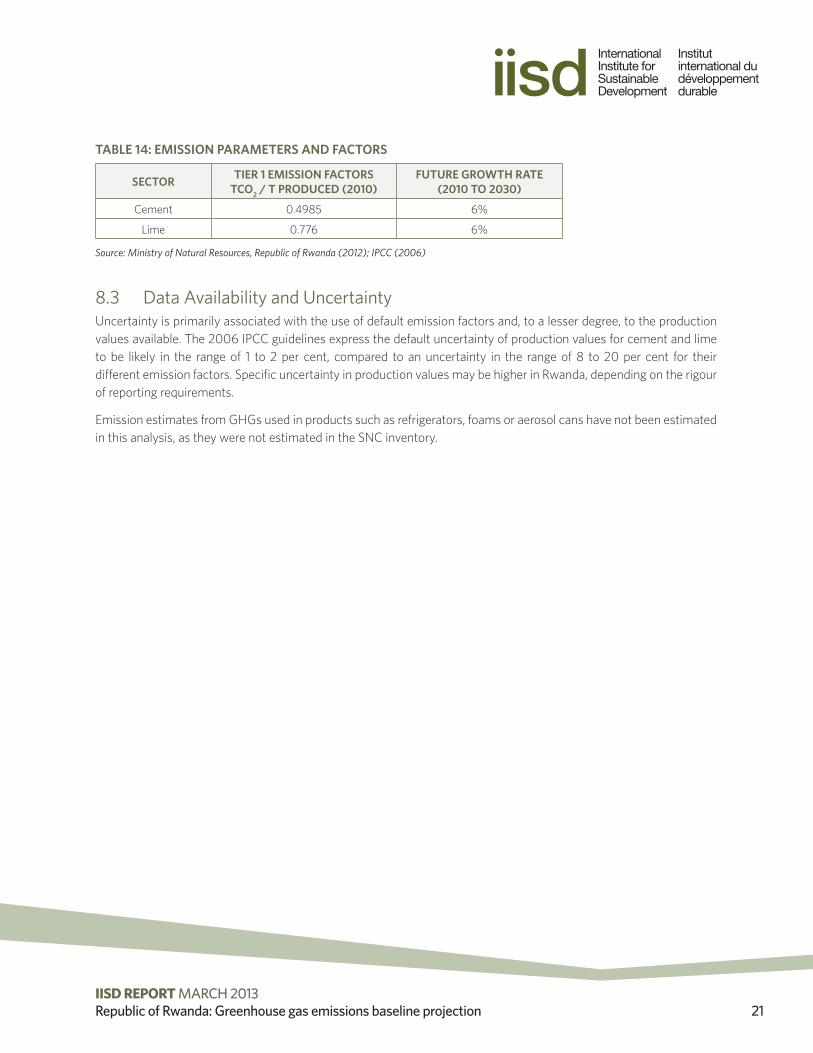
Table 14 identifies default emission parameters and factors that were used to convert tonnes of production of the various industries into GHG emissions.
© 2013 The International Institute for Sustainable DevelopmentIISD REPORT MARCH 2013Republic of Rwanda: Greenhouse gas emissions baseline projection 21
TABLE 14: EMISSION PARAMETERS AND FACTORS
SECTOR TIER 1 EMISSION FACTORS TCO2 / T PRODUCED (2010)
FUTURE GROWTH RATE (2010 TO 2030)
Cement 0.4985 6%
Lime 0.776 6%
Source: Ministry of Natural Resources, Republic of Rwanda (2012); IPCC (2006)
8.3 Data Availability and UncertaintyUncertainty is primarily associated with the use of default emission factors and, to a lesser degree, to the production values available. The 2006 IPCC guidelines express the default uncertainty of production values for cement and lime to be likely in the range of 1 to 2 per cent, compared to an uncertainty in the range of 8 to 20 per cent for their different emission factors. Specific uncertainty in production values may be higher in Rwanda, depending on the rigour of reporting requirements.
Emission estimates from GHGs used in products such as refrigerators, foams or aerosol cans have not been estimated in this analysis, as they were not estimated in the SNC inventory.
© 2013 The International Institute for Sustainable DevelopmentIISD REPORT MARCH 2013Republic of Rwanda: Greenhouse gas emissions baseline projection 22
9.0 Waste
9.1 MethodologyThe emissions baseline for the waste sector is adopted directly from the SNC inventory. There was insufficient data available to develop independent projections.
Future growth in emissions from the waste sector was based on the urban population growth rate of 5.2 per cent per year (National Institute of Statistics of Rwanda, 2012).
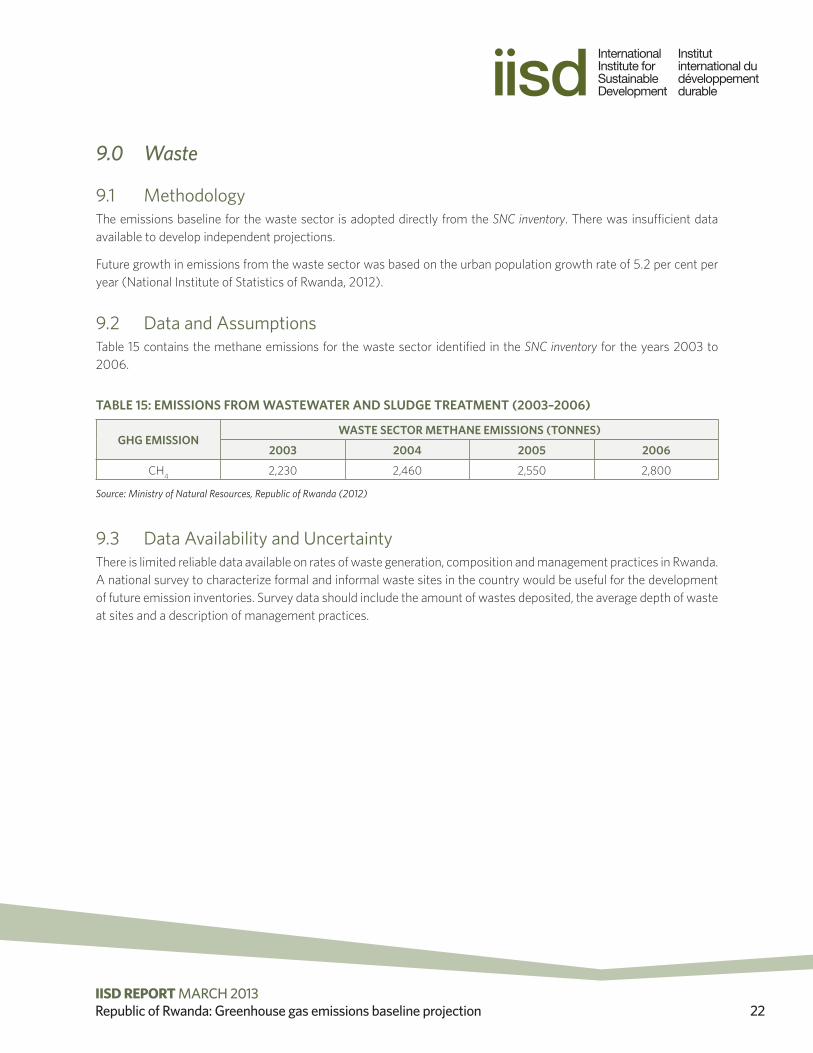
9.2 Data and AssumptionsTable 15 contains the methane emissions for the waste sector identified in the SNC inventory for the years 2003 to 2006.
TABLE 15: EMISSIONS FROM WASTEWATER AND SLUDGE TREATMENT (2003–2006)
GHG EMISSIONWASTE SECTOR METHANE EMISSIONS (TONNES)
2003 2004 2005 2006
CH4 2,230 2,460 2,550 2,800
Source: Ministry of Natural Resources, Republic of Rwanda (2012)
9.3 Data Availability and UncertaintyThere is limited reliable data available on rates of waste generation, composition and management practices in Rwanda. A national survey to characterize formal and informal waste sites in the country would be useful for the development of future emission inventories. Survey data should include the amount of wastes deposited, the average depth of waste at sites and a description of management practices.
© 2013 The International Institute for Sustainable DevelopmentIISD REPORT MARCH 2013Republic of Rwanda: Greenhouse gas emissions baseline projection 23
Reference ListFood and Agriculture Organization. (2010). Evaluation des ressources forestières mondiales, Édition 2010 (FRA-2010). Retrieved from http://www.fao.org/docrep/013/i1757f/i1757f.pdf
Graus, W., Blomen, E., Kleßmann, C., Capone, C. & Stricker, E. (2009). Global technical potentials for energy efficiency improvement. Presented at IAEE European Conference, September 2009. Retrieved from http://www.aaee.at/2009-IAEE/uploads/fullpaper_iaee09/P_176_Graus_Wina_31-Aug-2009,%2012:55.pdf
Intergovernmental Panel on Climate Change. (1996.) Revised 1996 IPCC guidelines for national greenhouse gas inventories. Retrieved from http://www.ipcc-nggip.iges.or.jp/public/gl/invs6.html
Intergovernmental Panel on Climate Change. (2006). 2006 IPCC guidelines for national greenhouse gas inventories. Retrieved from http://www.ipcc-nggip.iges.or.jp/public/2006gl/vol4.html
Ministry of Finance and Economic Planning, Government of Rwanda. (2009). Rwanda Vision 2020. Retrieved from http://www.gesci.org/assets/files/Rwanda_Vision_2020.pdf
Ministry of Infrastructure. (2011, May). National energy policy and strategy. Retrieved from https://energypedia.info/images/7/77/ENERGY_POLICY_and_STRATEGY.pdf
Ministry of Natural Resources, Republic of Rwanda. (2012, June 5). Second national communication under the United Nations Framework Convention on Climate Change. Retrieved from http://unfccc.int/resource/docs/natc/rwanc2.pdf
National Institute of Statistics of Rwanda. (2012). Statistical year book 2012. Retrieved from http://www.statistics.gov.rw/publications/statistical-yearbook-2012
Rwanda Environment Management Authority. (2009) Rwanda state of environment outlook: Our environment for economic development. Retrieved from http://www.unep.org/pdf/rwanda_outlook.pdf
United Nations Environment Programme. (2011). Rwanda: From post-conflict to environmentally sustainable development. Retrieved from http://postconflict.unep.ch/publications/UNEP_Rwanda.pdf
U.S. Geological Survey. (2011). 2009 minerals yearbook, Rwanda. Retrieved from http://minerals.usgs.gov/minerals/pubs/country/2009/myb3-2009-rw.pdf
World Bank (2008, August 7). Country assistance strategy for the Republic of Rwanda for the period Y09-Y12. Report No 44938RW. Washington, D.C.: International Finance Corporation Sub-Saharan Africa Department.
www.iisd.org © 2013 The International Institute for Sustainable Development
Published by the International Institute for Sustainable Development.
International Institute for Sustainable DevelopmentHead Office161 Portage Avenue East, 6th Floor, Winnipeg, Manitoba, Canada R3B 0Y4Tel: +1 (204) 958-7700 | Fax: +1 (204) 958-7710 | Website: www.iisd.org