Embed Size (px)
Citation preview
1 | P a g e
Republic of Namibia
2017/18 MID-YEAR BUDGET REVIEW AND MEDIUM-TERM BUDGET
POLICY STATEMENT
FOR THE
FY 2018/19-2020/2021 MTEF
Presented By Calle Schlettwein, MP
Minister of Finance
November 2017

2 | P a g e
Contents
1 OVERVIEW OF THE GLOBAL ECONOMIC DEVELOPMENTS AND OUTLOOK ..................... 4
1.1 GLOBAL AND REGIONAL ECONOMIC DEVELOPMENTS ................................................................................... 4 1.2 DOMESTIC ECONOMICS DEVELOPMENTS ....................................................................................................... 7
1.2.1 GDP GROWTH ................................................................................................................................................. 7 1.2.2 INFLATION ....................................................................................................................................................... 8 1.2.4 EXTERNAL SECTOR .......................................................................................................................................... 9
2 OUTLOOK FOR THE DOMESTIC ECONOMY .............................................................................. 12
2.1 SUPPLY-SIDE PROJECTIONS .................................................................................................................................. 12 2.2 DEMAND SIDE PROJECTIONS ................................................................................................................................ 12
2.1.1 Gross Fixed Capital Formation ...................................................................................................................... 12 2.1.2 Exports .......................................................................................................................................................... 13 2.2.3 Imports .......................................................................................................................................................... 13
3 FISCAL POLICY REVIEW ............................................................................................................... 14
3.1 PRINCIPLE POLICY OBJECTIVES ..................................................................................................................................... 14 3.2 GLOBAL FISCAL DEVELOPMENTS ................................................................................................................................... 15 3.3 DOMESTIC FISCAL POLICY DEVELOPMENTS ..................................................................................................................... 16 3.4 DEVELOPMENTS IN FISCAL AGGREGATES ........................................................................................................................ 17 3.5 REVENUE OUTTURN ................................................................................................................................................... 18 3.6 EXPENDITURE OUTTURN AND PUBLIC DEBT .................................................................................................................... 19 3.7 MID-YEAR OUTTURN ................................................................................................................................................. 19
4 MEDIUM-TERM FISCAL POLICY AND BUDGETARY FRAMEWORK .................................... 21
4.1 REVENUE OUTLOOK ................................................................................................................................................... 21 4.2 ASSUMPTIONS UNDERLYING REVENUE FORECAST ............................................................................................................. 23 4.3 AGGREGATE EXPENDITURE AND DEBT OUTLOOK ............................................................................................................. 24 4.4 FINANCING OF OPTION FOR ADDITIONAL SPENDING .......................................................................................................... 25 4.5 FISCAL POLICY STANCE FOR THE MTEF .......................................................................................................................... 26 4.6 FISCAL POLICY AND BUDGET PRIORITIES FOR THE 2018/2019-2020/2021 MTEF .............................................................. 26 4.7 FISCAL POLICY INTERVENTION STRATEGIES FOR THE 2018/19-2020/21MTEF ................................................................... 27 4.8 POLICY CONCLUSIONS FOR THE MTEF ........................................................................................................................... 31
5 EXPENDITURE ALIGNMENT AND REVISED CEILINGS .............................................................................. 33
5.1 EXPENDITURE ALIGNMENT .......................................................................................................................................... 33 5.2 OPERATIONAL AND DEVELOPMENT BUDGET SUSPENSIONS ............................................................................... 40 5.3 MEASURES TAKEN TO AVOID RECURRENCE OF OUTSTANDING INVOICES............................................................................... 42
TECHNICAL ANNEXURE: BUDGET REDUCTIONS AND ALLOCATIONS BY VOTE ................................................ 43

3 | P a g e
Foreword
The 2017/2018 Mid-Year Budget Review is undertaken at a time when global economy undergoes
major transformations including slowdown in productivity and economic growth, policy
uncertainty, technological change and global economic integration. In the wake of macroeconomic
policy uncertainty, fiscal policy is largely seen as a powerful tool for promoting inclusive growth
and contributing to economic stability, a situation that could lead to the deterioration in fiscal
indicators.
Most advanced economies have eased their fiscal stance by one-fifth of 1 percent of GDP in 2016,
breaking a five-year trend of gradual fiscal consolidation. In emerging market and developing
economies, there are signs that deterioration in fiscal positions comes to an end, although the
expected improvement depends crucially on developments in commodity markets.
The global fiscal outlook remains clouded by uncertainty regarding future policies as well as
macroeconomic risks as a more rapid increase in interest rates, a significant appreciation of the
U.S. dollar, and lower commodity prices could exacerbate debt vulnerabilities and trigger the
materialization of contingent liabilities in emerging market and developing economies.
The steep fiscal consolidation initiated since FY2016/17 Mid-Year Review had a pro-cyclical
effect on growth, at the time when economic downturn impacted on various sectors of our
economy, which resulted in further macro-fiscal vulnerabilities. The economic growth rate for
2016 turned out significantly low at 1.1 percent compared to 6.0 percent recorded in 2015, but
closer to 1.3 percent estimated in the 2017/2018 Fiscal Strategy. However, with the
commencement of production streams of recent investments in the mining sector and continued
resilience in tertiary industries, the Namibian economy is projected to post positive but moderate
economic growth rates over the Medium Term Economic Framework.
We are positive that the uptick in the world economy offers a window of opportunity for
increasing trade due to demand improvements in Advanced Economies, especially the EU which is
one of the main export destination for Namibian products.
The fiscal stance adopted in the 2017/2018-2019/2020 MTEF anticipated the reduction in the
budget deficit from a revised estimate of 6.3 percent of GDP in FY2016/17 to the budgeted 3.6
percent in FY2017/18 and further reduce this to 2.6 percent in FY2018/19 and reach a near
balanced budget by FY2019/20. While this will be challenging to achieve, government remains
committed to supportive policy interventions within a narrow fiscal space. In this regard, the total
indicative expenditure ceilings for FY2018/19 and FY2019/20 are further strengthened by
additional N$2.60 billion and N$2.81 billion with consideration of revenue mobilization efforts.
Going forward, government remains committed to implement a more balanced fiscal consolidation
framework that is supportive of medium to long-term growth, mitigate current and medium-term
risks and implement structural reforms to strengthen future prospects and enhance macro-fiscal
fundamentals.
Calle Schlettwein, MP
MINISTER

4 | P a g e
1 OVERVIEW OF THE GLOBAL ECONOMIC DEVELOPMENTS
AND OUTLOOK
1.1 GLOBAL AND REGIONAL ECONOMIC DEVELOPMENTS
The pickup in global activity that started in 2016 gained momentum in the first half of 2017,
reflecting firmer domestic demand growth in advanced economies and China, as well as improved
performance in other large emerging market economies.
Since April 2017, the global upswing in economic activity has been strengthening, with IMF in its
October 2017 release, projected global economic growth to rise to 3.6 percent in 2017 and 3.7
percent in 2018, representing a 0.1 percent upward adjustment respectively. The adjustment by the
IMF was attributed to continuous global recovery, happening at a faster pace than anticipated in
April 2017.
The IMF expects accelerating cyclical upswings that will boost major economies, including
Europe, China, Japan, and the United States, as well as emerging Asia. The notable pickups in
investment, trade, and industrial production, coupled with strengthening business and consumer
confidence, are supporting the recovery.
With growth outcomes in the first half of 2017 generally stronger than expected, upward revisions
to growth are broad based, including the euro area, Japan, China, emerging Europe, and Russia.
However, the IMF cautioned that the growth remains weak in many countries, and inflation is
below targets in most advanced economies. The commodity exporters, especially of fuel, are
particularly hard hit as their adjustment to a sharp stepdown in foreign earnings continues.
The outlook for advanced economies has improved, notably for the euro area, but in many
countries inflation remains weak, indicating that loose ends have yet to be eliminated. Therefore,
prospects for growth in GDP per capita are held back by weak productivity growth and rising old-
age dependency ratios. Prospects for many emerging market and developing economies in sub-
Saharan Africa, the Middle East, and Latin America are lacklustre, with several experiencing
stagnant per capita incomes. Fuel exporters are particularly hard hit by the protracted adjustment to
lower commodity revenues.
Following a growth rate of 1.7 percent in 2016, output in Advanced Economies (AE) is estimated
to grow by 2.2 percent in 2017 and by 2.0 percent in 2018 – representing an upward revision of 0.2
percentage points in 2017, relative to April 2017 economic outlook.
The Euro Area is expected to record a growth of 2.1 percent and 1.9 percent in 2017 and 2018
respectively, an upward revision of 0.4 percent and 0.3 percent from April 2017. The stronger
private consumption, investment, and external demand bolstered overall growth momentum in the
first half of the year and expected to maintain impetus through the second quarter of the year.
Growth in the US economy is estimated at 2.2 percent and 2.3 percent in 2017 and 2018,
representing a down ward adjustment of 0.1 percent and 0.2 percent respectively from the April
2017 projections. Domestic consumption was weak in the first quarter of the year although it was
believed to be a temporary cycle going forward as business investment continued to strengthen,
partly reflecting a recovery in the energy sector.

5 | P a g e
After the growth of 1.0 percent recorded in 2016, the output in Japan is projected to grow by 1.5
percent and 0.7 percent in 2017 and 2018 respectively, reflecting an upward revision of 0.3 percent
and 0.1 percent respectively. The upward adjustment is mainly attributed to stronger private
consumption, investment, and external demand during the first half of 2017.
The Emerging Markets and Developing economies are expected to grow by 4.6 percent in
2017 and 4.9 percent in 2018, following 4.3 percent recorded in 2016. The growth rates for both
2017 was revised upwards by 0.1 percent percentage points, with higher domestic demand in
China and continued recovery in key emerging market economies supported growth in the first
half of 2017. The figure 1, below reflects global economic growth and prospects.
Figure 1:Global real GDP growth 2012-2021
Source: IMF World Economic Outlook October 2017
Sub-Saharan Africa (SSA) output growth is expected to recover and expand by 2.6 percent in
2017 and 3.4 percent in 2018 following a low growth of 1.4 percent in 2016. The SSA’s growth
projections were however revised downward by 0.1percentage points in 2017 from the April 2017.
The output growth in Nigeria is expected to recover from a decline of 1.6 percent recorded in 2016
with estimated growth rate of 0.8 percent in 2017 and 1.9 percent in 2018, same as April forecast.
Economic growth in South African is expected at 0.7 percent in 2017 and 1.1 percent in 2018,
representing a downward revision by 0.1 percent and 0.5 percent respectively. The downward
revision is mainly attributable to elevated political uncertainty, weaker consumer demand and low
business confidence.
The Angolan economy grew by 1.1 percent in 2016 on the back of government’s fiscal policy
response intervention on mitigating the impact of oil price shock on the economy. The current
focus is on the elimination of fuel subsidies, significant increase in mobilizing non-oil revenues,
and allowing the exchange rate to depreciate to improve export competitiveness and reduce the
imports trend of the country.

6 | P a g e
Figure 2:Global real GDP growth 2012-2021
S
ource: IMF World Economic Outlook October 2017update
1.1 COMMODITY PRICES
The IMF’s Primary Commodities Price Index declined by 5 percent between the reference periods,
that is, April 2017 WEO and the October 2017 WEO, with some of the biggest price drops
occurred among fuel products.
Oil prices is reported to have fallen by 8.1 percent between February and August, even as the
Organization of the Petroleum Exporting Countries (OPEC) and some non-OPEC oil exporters
announced in May that they would extend oil production cuts through the first quarter of 2018.
The natural gas price index, an average for Europe, Japan, and the United States, decreased by
9.6 percent between February and August 2017. The decline was mostly tied to seasonal factors
and robust supply from the United States and Russia, and lower oil prices, which some natural gas
prices are indexed to.
On the other hand, the coal price index—an average of Australian and South African prices,
increased by 16.5 percent between February and August 2017, on the back of strong demand from
China.
According to IMF, by June 2017, the metal price index had reached its lowest point in eight
months as demand projections, especially from the United States and China, were revised down.
However, prices rebounded ever since and remained on an upward trajectory in August with the
improvement in macroeconomic sentiment, especially in China. On average, Metal prices have
increased modestly (0.8 percent) from February to August, with considerable variation across
commodities.
The Copper and aluminium prices increased by slightly more than 9 percent between February and
August 2017, reflecting strong demand and tight supplies; while iron ore prices dropped by about
16 percent over the same period mainly because of an increase in supply from Australia, Brazil,
and China.
Prices of zinc and lead increased by 27 percent and 24.5 percent y-o-y, and by 0.4 percent increase
in lead prices month-on-month while the zinc prices declined by 0.6 percent month-on-month. The
uranium prices recorded a decline both on a monthly and annual basis of 8.7 percent and 27.5

7 | P a g e
percent respectively. The decline stumps as the industry continue struggling to recover from low
prices due to low demand.
Gold prices has increased on monthly basis by 0.65 percent while annually, the price fell by
6.02percent, the change in the prices is attributed to the US dollar, interest rate and lower inflation
expectations. According to the diamond price index (IDEX) diamond prices fell in June by 4.8
percent on y-o-y basis and marginally by 0.8 percent on a monthly basis; the price decline is
attributed to inventory over-shoot and relatively low demand.
1.2 DOMESTIC ECONOMICS DEVELOPMENTS
1.2.1 GDP GROWTH
Real GDP registered a slower growth of 1.1 percent in 2016 compared to a strong growth of 6.0
percent recorded in 2015, and below 1.3 percent estimated in the current Fiscal Strategy. The main
factors behind the growth were the primary and secondary industries that recorded a contraction of
2.0 percent and a slower growth of 7.8 percent, respectively compared to estimated contractions of
1.7 percent 3.7 percent in Fiscal Strategy.
The contraction in primary industries were attributed to decline of 5.7 percent in the output from
mining and quarrying subsectors, with both diamond and other mining and quarrying registered a
decline. Another factor was the dismal growth in metal ores triggered by low production due to
expected closure (ending of life of mine in 2017) of a zinc mine.
The contraction observed in the secondary industries was mainly attributable to a decline in the
construction sector. The sector recorded a contraction of 26.5 percent in 2016 compared to a strong
performance of 26.0 percent in 2015, and above the 11.5 percent estimated in the Fiscal Strategy.
The poor performance in the construction sector stems from the completion of construction
projects done by the mining and quarrying sector, following the construction of the Husab
Uranium and Tschudi mines which came to an end and since then no new projects have taken off
in the mining sector.
The electricity and water sector slowed to 6.8 percent in in 2016 compared to 14.2 percent
recorded in 2015. The performance in the sector was attributed to the electricity supply sub-sector
and imports of the power through the purchasing contract with Eskom.
A positive growth of 3.4 percent in the manufacturing sector is observed in 2016 compared to a
decline of 4.6 percent recorded in 2015. This performance is mainly attributed to diamond
processing and other food products sub-sectors that recorded growth rates of 65.9 percent and 4.0
percent in 2016 compared to declines of 24.1 percent and 12.3 percent in 2015, respectively. The
recovery in diamond processing owes to the increased supply of rough diamonds. This follows an
intervention by government and De Beers to increase the number of quality stone to processors1 as
well as the processing of diamonds that were held in inventory during the previous year due to low
market absorption capacity.
1 The agreement between the Government and De Beers entails the supply of rough diamonds worth of USD 430
million for local processing

8 | P a g e
The tertiary industries registered slower growth of 3.9 percent in 2016 compared to 7.6 percent in
2015, despite that it remains the biggest contributor to GDP, with a contribution of more than 50
percent share to GDP. Year-on-year, all the sectors within the tertiary industries slowed down
indicating slower economic activities across the service sector except for financial intermediation
which remained flat.
The wholesale and retail sector has been driven highly by increase in consumptive demand in the
last couple of years. The sector has slowdown to 3.4 percent in 2016, compared to 7.4 percent in
2015. The downward performance is due to the subdued Angolan economic performance as a
result of continued low oil prices. Furthermore, the fiscal policy stance pursuit by the government
impacted further on this sector.
The hotels and restaurants sector slowed down to 5.1 percent in 2016 compared to 5.6 percent in
2015. The slow performance in the sector was attributed to the sub-sector hotels’2. On the other
hand, the sub-sector restaurants’ has performed exceptionally due to stable macroeconomic
environment as inflation eased during the year, while the exchange rate appreciated against some
of the major foreign currencies.
1.2.2 INFLATION
The annual inflation rate slowed to 5.6 percent in September 2017 from the 6.9 percent registered
in September 2016, resulting in a slowdown of 1.3 percentage points. The slowdown in the annual
inflation rate stemmed from Food and non-alcoholic beverages (12.0 to 4.2 percent), Health (7.2
to 5.9 percent), Furnishings, Household Equipment and Routine maintenance of the house (6.1 to
3.6 percent), Recreation and culture (5.7 to 3.1 percent), Hotels, Cafés and Restaurants (9.5 to 6.2
percent), Miscellaneous Goods and Services (5.7 to 4.1 percent) and Clothing and Footwear
declined from 1.1 to -1.7 percent.
The average annual inflation rate for the period January 2017 to September 2017 stood at 6.5
percent which showed no change when compared to the corresponding average rate registered
during the corresponding period of 2016. However, on a monthly basis, the inflation rate increased
by 0.4 percent compared to that recorded in August 2017
1.2.3 MONETARY DEVELOPMENTS
Exchange Rates and Competitiveness
Namibia’s nominal effective exchange rate (NEER) appreciated by 5.5 percent year-on-year
between the second quarter of 2016 and the second quarter of 2017. Similarly, the real effective
exchange rate (REER) also appreciated by 7.5 percent over the same period. Quarter-on-quarter,
the NEER depreciated by 0.7 percent between the first quarter of 2017 and the second quarter of
2017, reflecting weaknesses in some trading partner currencies such as the US Dollar, coupled
with the strengthening of the Rand. Over the same period, the REER depreciated by 1.3 percent,
indicating that Namibia has gained some competitiveness versus its key trading partners (Figure
4).
2 Suppressed growth in South Africa continues to weigh heavily on the tourism sector given the links between the two
economies. Furthermore, the government’s fiscal stance is likely to exert pressure on this sector as public
conferencing constitutes a significant portion of revenue streams.

9 | P a g e
Figure 3: Effective Exchange Rates, 2012 to 2017
Source: Bank of Namibia, September 2017
Interest Rate Developments
The repo rate was reduced by 25 basis points to 6.75 percent in August 2017. The reduction happened after
a period of 16 months when the repurchase rate (Repo) remained unchanged at 7.0 percent. The cut in the
Repo rate was aimed at supporting the weak domestic economy, but noting that Namibia’s inflation is
slowing down. In the meantime, Government has been consolidating its spending and the country’s foreign
reserve position has improved since recently. Thus, these developments have provided more room to focus
on supporting the economy to recover from a slowdown of 1.1 percent for 2016 to better GDP growth in
2017.
Figure 4: Bank of Namibia Repurchase Rate, 2015 to 2017
Source: Bank of Namibia, September 2017
1.2.4 EXTERNAL SECTOR
Trade and Balance of Payments
Merchandise exports from Namibia decreased by 2.8 percent during the first half of 2017, when compared
to the corresponding period of 2016 (Figure 6). Specifically, noted decreases in merchandise exports came
from diamonds, other mineral products and other commodities. Meanwhile, exports for food and live
animals as well as for manufactured products recorded strong increases over the same period.
Merchandise imports fell by 13.3 percent between the first half of 2016 and the first half of 2017 (Figure 6).
The fall in merchandise imports were more visible amongst mineral fuels, oils and products; base metals
and articles of base metal; products of the chemical industries; vehicles, aircraft and vessels; as well as
machinery, mechanical and electrical appliances. There was, however, a substantial increase in imports for
precious and semi-precious stones during the same period.

10 | P a g e
On the net basis, the above developments in in merchandise trade led to the easing of Namibia’s
merchandise trade deficit (covering goods only), which reduced by 32.6 percent from N$14.0 billion during
the first half of 2016 to N$9.4 billion during the first half of 2017.
Figure 5: Exports and Imports of goods (N$ millions), 2009 to 2017
Source: Bank of Namibia, September 2017
Current Account Balance
Namibia recorded high trade deficits since the year 2012, and this was due to factors such as increased
investments in the mining sector, which required the importation of construction materials and equipment;
expansionary fiscal policy as well as expansionary monetary policy. With many construction projects at
mines and in government having come to an end, imports started to stabilise, while exports increased faster
in 2016 and during the first half of 2017.
At the same time, SACU inflows increased during 2017 in line with SACU estimates for 2017. Namibia’s
revenue share from SACU revenue pool increased to N$19.6 billion in 2017, from N$14.8 billion in 2016.
Namibia’s current account deficit narrowed to N$1.8 billion during the first half of 2017, compared to
N$8.6 billion during the same period of 2016 (Figure 7). The improvement in the current account deficit
was primarily attributed to the narrowing of the trade deficit, a reduction in net investment income
payments and increased inflows in the secondary income account, particularly SACU receipts. Although
SACU revenues are expected to decrease after 2017, the combination of a moderation in import growth and
increased mineral exports are expected to sustain an improved external position for Namibia going forward.
Figure 6: Current Account Balance (N$ millions)
Source: Bank of Namibia, September 2017

11 | P a g e
Capital Account
Namibia’s capital account balance improved to N$1.6 billion during the first half of 2017, which is 77.9
percent higher than N$878.0 million for the same period of 2016. This improvement was reflected in
increased in capital transfer receipts from foreign governments and institutions as well as debt forgiveness
by a foreign direct investor to its direct investment enterprise during the first half of 2017.
Given the developments in both the current and capital account, Namibia’s net borrowing from the rest of
the world declined to N$340.9 million during the first half of 2017, from N$7.7 billion during the
corresponding period of 2016.
Financial Account
The financial account remained in deficit during the first half of 2017, but recorded a substantially reduced
net borrowing when compared to a year ago, mainly due to a significant increase in reserve assets. In this
connection, Namibia’s net borrowing from the rest of the world reduced to N$1.4 billion during the first
half of 2017, which is much lower than N$6.6 billion for the first half of 2016.
International Reserves
The stock of foreign reserves at the Bank of Namibia increased to N$29.6 billion at the end of August 2017,
from N$20.5 billion at the end of August 2016. In terms of import coverage, the reserves increased to 4.9
months of imports at the end of the second quarter of 2017, up from 3.0 months in the corresponding
quarter of 2016 (Figure 8).
The international benchmark, which is used as a rule-of-thump in indicating the sufficiency of international
reserves is at 3.0 months of import cover and Namibia is now above that level as at the end of the second
quarter of 2017. The increase in reserves was helped by a significant reduction in the trade deficit, external
borrowing by Government, the repayment of the Kwanza debt by the National Bank of Angola and
increased SACU receipts. In the context of maintaining the peg to the Rand, Namibia is required to
maintain reserves that are sufficient to cover the currency in circulation. In this regard, the stock of reserves
at the end of the second quarter of 2017 was 7.0 times higher than the currency in circulation.
Figure 7: International Reserves at Bank of Namibia (N$ billions)
Source: Bank of Namibia, September 2017

12 | P a g e
2 OUTLOOK FOR THE DOMESTIC ECONOMY
2.1 SUPPLY-SIDE PROJECTIONS
Real GDD is estimated to register growth of 1.6 percent for 2017, revised downwards from 2.5
percent projected in January 2017. The downward revision came on the back of lower-than-
expected performances across the industries, especially slow recovery expected in secondary
industries and slowdown in tertiary industries
Table 1: Macroeconomic Outlook
2016 2017 2018 2019 2020 2021
Primary industries -2.0 10.0 4.9 5.8 2.8 4.1
Secondary industries -7.8 -0.5 4.9 4.7 3.7 3.0
Tertiary industries 3.9 1.7 3.1 4.2 3.9 3.8
GDP at market prices 1.1 2.3 3.7 4.5 3.6 3.7 Source: Macroeconomic Working Group
2.2 DEMAND SIDE PROJECTIONS
Final consumption expenditure is expected to contract by 2.1 percent in 2017, same level as
earlier projected, mainly due to a significant contraction in general government expenditure, and
despite positive growth in private expenditure.
Private consumption expenditure is expected to grow by 2.1 percent in 2017, an upwards from
earlier estimated contraction of 1.2 percent, but still lower than the 6.8 percent recorded in 2016.
The lower growth is attributed to the high levels of indebtedness and weaker disposable income of
households, in addition to the weak consumer spending and confidence levels. General
government expenditure is estimated to decline by 15.6 percent, revised downwards from a
contraction of 4.8 percent projected at the beginning of the year, on the back of the government’s
fiscal stance.
Growth final consumption expenditure in 2018 is projected at 2.5 percent, revised downwards from
3.5 percent, on the back of below expectation growth in private consumption. However, it is
expected to pick up pace with the effect of lower interest rates as it filters through and consumer
confidence prevails. Government expenditure is projected to records a moderate contraction of 0.5
percent with the expectations of a recovery in public expenditure framework.
Over the latter years of the medium term, growth in final consumption expenditure is expected to
average around 3.7 percent as government expenditure is expected to recover to sustainable levels
with an average of 2.2 percent growth and private consumption expected to average around 4.0
percent - as economic activity stabilizes and consumer confidence is restored.
2.1.1 Gross Fixed Capital Formation
Gross fixed capital formation is expected to decline by a lower 2.3 percent in 2017, an upward
revision from the earlier estimated contraction of 7.4 percent, as a result of the slowdown in
economic activities that caused lower investment due to fragile investment confidence as well as

13 | P a g e
the completion of major capital projects (Namport port expansion due to reach completion during
mid-2018, Neckartal dam reaching due to be completed in first quarter 2018 and suspension of the
mass housing project).
In 2018, gross fixed capital formation is expected to bottom out with a growth of 2.1 percent
(upward revision from 0.1 percent), backed by increased investments in private property3
developments. Going forward, gross fixed capital formation is projected to grow at an average of
2.7 percent on the back of improved government and private investment as economic activities
stabilizes.
2.1.2 Exports
Total exports are estimated to record 7.9 percent growth in 2017, a slight upward revision from 7.8
percent, based on the anticipated increases in the production of most minerals due to the prospects
of improved commodity prices (zinc, lead, and gold prices) as well as improved infrastructure4 in
diamond mining. In 2018, growth is expected to slow down to 3.2 percent (downward revision
from 3.5 percent) as diamond production reached full capacity the previous year and,
consequently, diamond exports start to slow down. In 2019 and beyond, exports are envisaged to
grow by an average of 2.8 percent riding on increased uranium production and processed zinc.
2.2.3 Imports
Imports are estimated to contract by 2.4 percent in 2017 (upward revision from 7.8 percent) on the
back of reduced spending by government, the completion of major investment projects as well as
subdued final consumption expenditure. In 2018 and beyond, imports are expected to grow
marginally by 1.9 percent average on the prospects of improved private consumption and
investment growth.
Table 2: GDP by Activity: Demand Side
2016a 2017e 2018p 2019p 2020p 2021p
Final consumption expenditure 5.0 -2.1 2.5 3.3 4.4 3.3
Private 6.8 2.1 3.1 3.7 4.8 3.6
General government -0.2 -15.6 -0.5 1.7 2.9 1.9
Gross fixed capital formation -25.3 -2.3 2.1 2.2 3.2 2.9
Gross domestic expenditure -1.4 0.3 2.7 3.5 3.6 2.7
Exports of goods and services 6.1 7.9 3.2 4.5 2.3 1.5
Imports of goods and services -4.7 -2.4 1.2 1.8 3.6 1.1
Gross domestic product at
market prices
1.1 1.6 2.9 4.5 3.6 3.7
Source: Macroeconomic Working Group
3 Expansion of Wernhill Mall (N$500 mil), Gobabis mall (N$90mill), Oshana Mall (N$100mill), Walvis Bay dunemall
(N$200 mil), MTC network infrastructure investment (N$1 Billion), IPP investment project (N$200 mil), Fishcor fish
factory (N$100 mil), Standard head office (N$650mill).
4 New exploration vessel SS Nujoma, additional mining vessel and Mafuta vessel back on stream after maintenance in
2016

14 | P a g e
3 FISCAL POLICY REVIEW
3.1 Principle Policy Objectives
At the global level, fiscal policy is faced with a daunting task of coping with the post 2008
financial crisis legacies and the rising expectations to achieve more with less. The main legacies
entail sluggish economic growth in some economies and its attendant downside risks, weak public
sector balance sheets, elevated public debt and the remaining vulnerabilities in the financial sector.
In respect of the Developing Economies, particularly for the resource-based economies such as
Namibia, fiscal fragilities are further reinforced by weak commodity prices which, due to the
aggregate weight of commodities in total exports, are material to the growth fortunes of these
economies.
Five core principle objectives generally underpin the conduct of fiscal policy. At a country level,
the extent to which each objective is pursued in a policy package is depended on country
circumstances and its fiscal position. Taking these factors into consideration, fiscal policy should
be:
Counter-cyclical: Fiscal counter-cyclicality is anchored on the symmetry that fiscal policy
is expansionary in bad times and tightens in good times with gradualism along the fiscal
adjustment path. Expansion supports the growth objectives to overcome economic slump
and tightening allows the rebuilding fiscal buffers and avoiding pro-cyclicality as growth
takes hold.
Growth-friendly: Acting in close coordination with monetary policy, fiscal policy is
increasingly called upon to play a greater role to support economic growth objectives
through its effect on investment; directly through carefully selected and well-managed
public infrastructure spending and indirectly through a pro-growth tax system. Investment
in public infrastructure and spending on education and health are highly correlated with
long-term productivity and a high premium on growth.
Inclusive: In this changing world with disparities in income, complexities arising from
increasing globalization and economies operating below full employment, there is a
growing concern whether future generations will have better living standards than current.
Inclusive policies promise to allay this concern. Fiscal policy can play a key role in
fostering sustainable and inclusive growth and mainstreaming the middle-class, the youth
and vulnerable into economic activity through its incidence on poverty, income
inequalities and investment in education and training. The inclusivity dimension is
especially significant for sustainable economic growth.
Supported by tax capacity: The ability to conduct fiscal policy, especially in respect of
fiscal counter-cyclicality is hinged on efficacy of the tax system and revenue collection
capacity. Public policy advocates for a tax system which is less distortionary and creates
15 | P a g e
the incentive to produce and invest through effective tax administration to collect elastic
revenue in tandem with economic activity.
Conducted with prudence: The countercyclical role of fiscal policy comes with associated
difficulties to reverse fiscal expansion which results in limited buffers. The key policy
decision remains how best to strike a balance between rebuilding depleted fiscal space and
supporting growth and social investment spending. The conduct of fiscal policy requires
prudence to avert escalation of public debt which constrains room for fiscal support to the
economy.
The flexibility to achieve these objectives is largely depended on available fiscal space for each
country, allowing for the overall fiscal deficit and public debt to expand within sustainable
thresholds and reinforcing fiscal multipliers in the economy, through increased public expenditure.
For countries with fiscal space, carefully selected expenditure expansion helps to shore up growth.
Countries with eroded fiscal space have to increasingly rely on other structural reforms to realise
efficiency, competitiveness and productivity gains as a means of influencing the pace of economic
activity.
3.2 Global Fiscal Developments
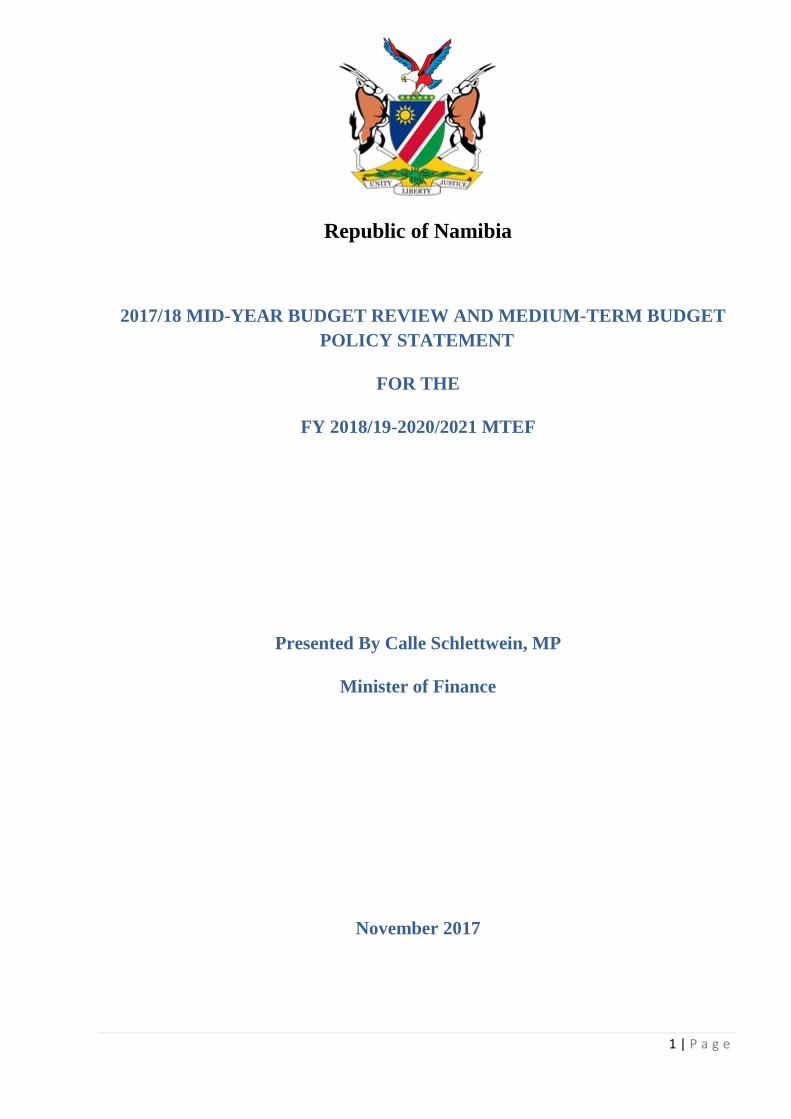
The global fiscal developments as assessed by the International Monetary Fund reflect
deterioration in fiscal indices, with aggregate fiscal deficits widening (Table 5). This is due to a
combination of increased spending and adjustment to revenue shocks, especially for commodity
producers. Rising fiscal deficits, which became more pronounced since 2015 threatens to reverse
the gains from gradual fiscal consolidation adopted since 2011. The global fiscal deficits increased
to 3.6 percent in 2016, up from 3.3 percent in 2015, with moderate improvements estimated for
2017 and 2018.
Table 3: World fiscal deficits for selected economies
Region/Country 2009 2010 2011 2012 2013 2014 2015 2016 2017 2018
Estimate Projection Projection
World Overall Fiscal Balance -7.2 -5.7 -4.3 -3.7 -2.8 -2.9 -3.3 -3.6 -3.4 -3.1
Advanced Economies -8.8 -7.6 -6.2 -5.4 -3.6 -3.1 -2.6 -2.9 -2.7 -2.7
United States -13.1 -10.9 -9.6 -7.9 -4.4 -4.0 -3.5 -4.4 -4.0 -4.5
Euro area -6.3 -6.2 -4.2 -3.7 -3.0 -2.6 -2.1 -1.7 -1.5 -1.2
Japan -10.4 -9.1 -9.1 -8.3 -7.6 -5.4 -3.5 -4.2 -4.0 -3.3
United Kingdom -10.7 -9.5 -7.5 -7.7 -5.6 -5.7 -4.4 -3.1 -2.8 -2.2
Canada -3.9 -4.7 -3.3 -2.5 -1.5 0.0 -1.1 -1.9 -2.4 -2.2
Other advanced economies -0.8 -0.2 0.4 0.4 0.2 0.2 -0.1 0.0 -0.2 0.2
Emerging markets and Developing
Economies -3.7 -2.1 -1.0 -0.9 -1.4 -2.4 -4.4 -4.8 -4.4 -3.9
Namibia* -1.7 -5.2 -7.0 -0.1 -3.8 -6.2 -8.2 -6.9 -5.2 -3.9
South Africa* -4.7 -4.7 -3.7 -4.0 -3.9 -3.6 -3.6 -3.5 -3.3 -4.3
Europe: Other -5.7 -3.5 -0.1 -0.7 -1.5 -1.5 -2.7 -2.9 -3.1 -2.2
Russia -5.9 -3.2 1.4 0.4 -1.2 -1.1 -3.4 -3.7 -2.6 -1.9
China -1.8 -0.4 -0.1 -0.3 -0.8 -0.9 -2.8 -3.7 -3.7 -3.4
India -9.8 -8.6 -8.3 -7.5 -7.0 -7.2 -7.1 -6.6 -6.4 -6.3
Latin America and Caribbean -3.8 -3.1 -2.8 -3.2 -3.2 -5.1 -7.3 -6.4 -6.5 -5.6
Brazil -3.2 -2.7 -2.5 -2.5 -3.0 -6.0 -10.3 -9.0 -9.1 -7.5
Actual
Source: IMF, Fiscal Monitor, April 2017. *Data for Namibia and South Africa refer to budget balances and fiscal years and
adopted from national budgets
16 | P a g e
The upward adjustments in fiscal deficits mainly mirrors the deterioration in Emerging Markets
and Developing Economies as well as for Low Income Developing Countries. For Emerging
Markets and Developing Economies, overall fiscal balances have nearly doubled from 2.4 percent
in 2014, to above 4 percent in 2016 and 2017, with similar trends observed in Low Income
Countries on account of weaker public revenue outturn, resulting from weak commodity prices.
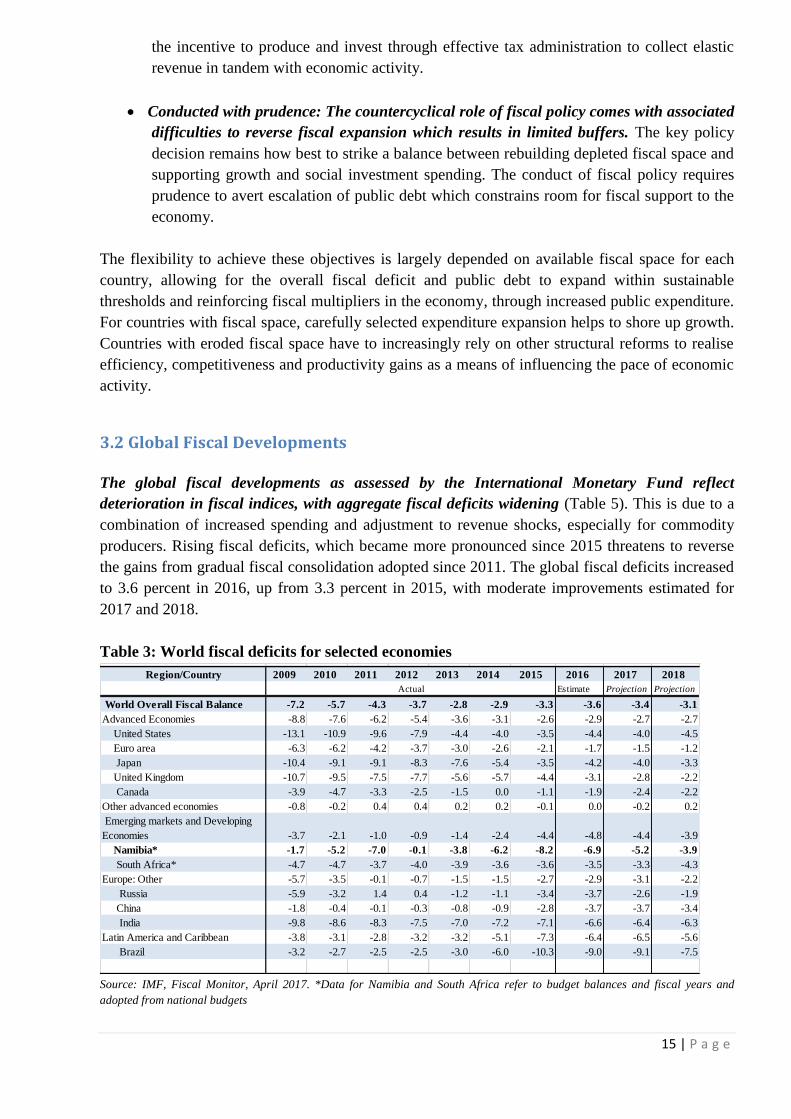
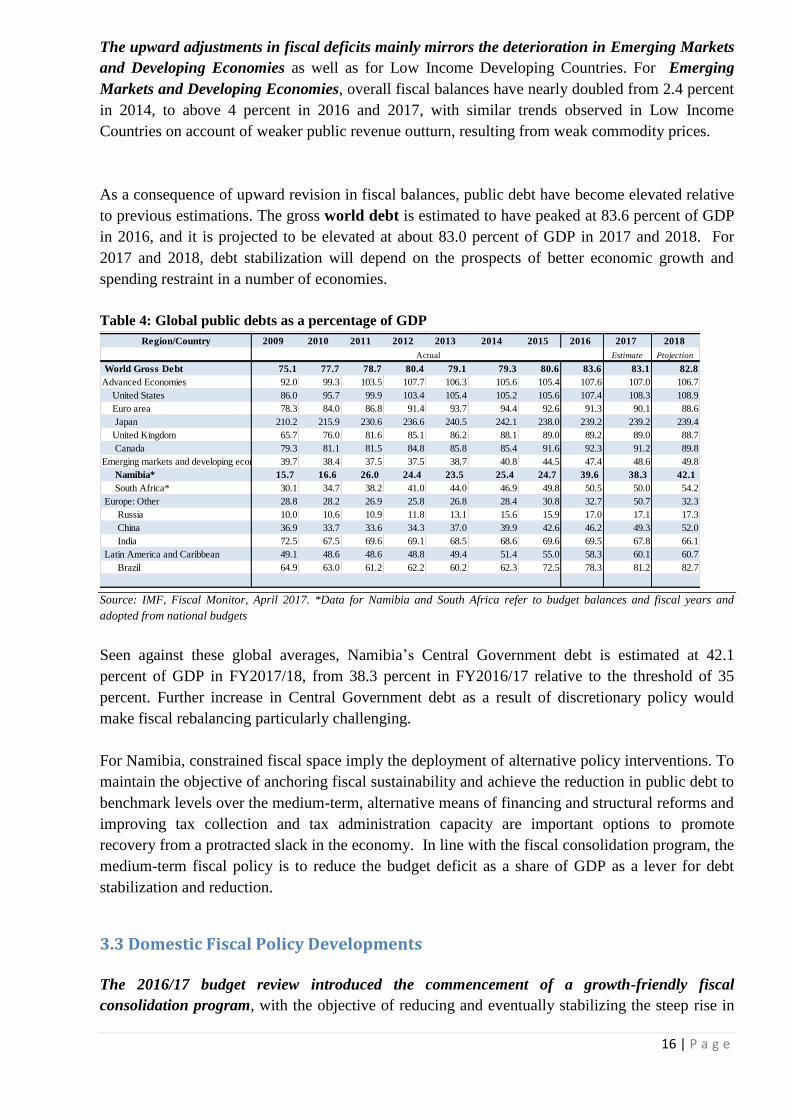
As a consequence of upward revision in fiscal balances, public debt have become elevated relative
to previous estimations. The gross world debt is estimated to have peaked at 83.6 percent of GDP
in 2016, and it is projected to be elevated at about 83.0 percent of GDP in 2017 and 2018. For
2017 and 2018, debt stabilization will depend on the prospects of better economic growth and
spending restraint in a number of economies.
Table 4: Global public debts as a percentage of GDP
Region/Country 2009 2010 2011 2012 2013 2014 2015 2016 2017 2018
Estimate Ptojection
World Gross Debt 75.1 77.7 78.7 80.4 79.1 79.3 80.6 83.6 83.1 82.8
Advanced Economies 92.0 99.3 103.5 107.7 106.3 105.6 105.4 107.6 107.0 106.7
United States 86.0 95.7 99.9 103.4 105.4 105.2 105.6 107.4 108.3 108.9
Euro area 78.3 84.0 86.8 91.4 93.7 94.4 92.6 91.3 90.1 88.6
Japan 210.2 215.9 230.6 236.6 240.5 242.1 238.0 239.2 239.2 239.4
United Kingdom 65.7 76.0 81.6 85.1 86.2 88.1 89.0 89.2 89.0 88.7
Canada 79.3 81.1 81.5 84.8 85.8 85.4 91.6 92.3 91.2 89.8
Emerging markets and developing economies 39.7 38.4 37.5 37.5 38.7 40.8 44.5 47.4 48.6 49.8
Namibia* 15.7 16.6 26.0 24.4 23.5 25.4 24.7 39.6 38.3 42.1
South Africa* 30.1 34.7 38.2 41.0 44.0 46.9 49.8 50.5 50.0 54.2
Europe: Other 28.8 28.2 26.9 25.8 26.8 28.4 30.8 32.7 50.7 32.3
Russia 10.0 10.6 10.9 11.8 13.1 15.6 15.9 17.0 17.1 17.3
China 36.9 33.7 33.6 34.3 37.0 39.9 42.6 46.2 49.3 52.0
India 72.5 67.5 69.6 69.1 68.5 68.6 69.6 69.5 67.8 66.1
Latin America and Caribbean 49.1 48.6 48.6 48.8 49.4 51.4 55.0 58.3 60.1 60.7
Brazil 64.9 63.0 61.2 62.2 60.2 62.3 72.5 78.3 81.2 82.7
Actual
Source: IMF, Fiscal Monitor, April 2017. *Data for Namibia and South Africa refer to budget balances and fiscal years and
adopted from national budgets
Seen against these global averages, Namibia’s Central Government debt is estimated at 42.1
percent of GDP in FY2017/18, from 38.3 percent in FY2016/17 relative to the threshold of 35
percent. Further increase in Central Government debt as a result of discretionary policy would
make fiscal rebalancing particularly challenging.
For Namibia, constrained fiscal space imply the deployment of alternative policy interventions. To
maintain the objective of anchoring fiscal sustainability and achieve the reduction in public debt to
benchmark levels over the medium-term, alternative means of financing and structural reforms and
improving tax collection and tax administration capacity are important options to promote
recovery from a protracted slack in the economy. In line with the fiscal consolidation program, the
medium-term fiscal policy is to reduce the budget deficit as a share of GDP as a lever for debt
stabilization and reduction.
3.3 Domestic Fiscal Policy Developments
The 2016/17 budget review introduced the commencement of a growth-friendly fiscal
consolidation program, with the objective of reducing and eventually stabilizing the steep rise in

17 | P a g e
public debt. In this regard, the 2017 Fiscal Policy Strategy proposed a phased narrowing of the
budget deficit through the reduction of non-core recurrent expenditure and non-productive
development spending, while protecting social spending and critical infrastructure development
objectives. The provision for phased fiscal consolidation was engendered in the following policy
actions:-
stabilizing growth in public debt at about 42 percent of GDP, through a
combination of the budget deficit reduction, leveraging alternative forms of
financing and implementing structural policy reforms,
gradually reducing the budget deficit from the excess of 8.3 percent in FY2015/16
to 6.3 percent FY2016/17 and further achieve a steep reduction of this ratio to 3.6
percent in FY2017/18 with the expressed objective reaching budget balance by
FY2019/20. Average budget deficit was projected to 2.3 percent over the
FY2017/18 – 2019/20 MTEF,
targeting expenditure reduction on non-core operational expenditure items such as
overtime allocation, furniture, office equipment and vehicles, material supplies and
subsistence travel for reallocation and postponement of non-productive capital
expenditure, especially the expenditure allocations for office buildings for which no
contractual obligations have been set,
leveraging on alternative forms of financing to support infrastructure development
and capital formation through sovereign guarantee to Public Enterprises,
Development Finance Institutions (DFIs), and through Public, Private
Partnerships, and
promoting private sector development through structural policy reforms and
financing by DFIs.
3.4 Developments in Fiscal Aggregates
Economic growth outturn has come out at a low level as anticipated, as a result of a
combination of domestic and external factors. The low growth rate of 1.1 percent in 2016
approximate the projected rate of 1.3 percent and mirrors much of the Sub-Saharan Africa growth
outturn of 1.4 percent, reflecting the impact of commodity price and the effect of prolonged
drought conditions in the agricultural sector.
The phased fiscal consolidation commenced in FY2016/17 was aimed at placing public finances
on a sustainable path, while maintaining fiscal support to the economy by retaining spending on
items with high growth potential. This course of policy action was undertaken amidst the
challenging domestic economic circumstances. Its fiscal outcomes presented mixed results, with
the budget deficit relatively higher than anticipated and a build-up of the stock of spending arrears,
causing a further drag on economic activity and eroding the effectiveness of the fiscal
consolidation effort. The steep expenditure correction proved difficult to implement in the first roll

18 | P a g e
out of fiscal consolidation programme and requires recalibration to balance between the intended
consolidation, impact on growth and the provision of basic services.
3.5 Revenue Outturn
The revenue outturn for FY2016/17 of N$50.87 billion was 1.3 percent lower than the revised
target of N$51.51 billion, reflecting a collection rate of 98.7 percent relative to revised budget
forecast. The outturn reflects shortfalls in Value Added Tax (VAT) as a result slackness in
domestic demand conditions associated with contractions in the construction and wholesale and
retail trade sectors. Better performance in Personal Income Tax and various categories on non-tax
revenue helped to counteract the impact of slow outturn on VAT. As a result of low growth outturn
for 2016 relative to previous years, revenue declined by 2.6 percent from N$52.22 billion to
N$50.86 billion in FY2016/17.
Table 5: Main revenue categories and mid-year outturn, FY 2006/7 – FY2016/17
Financial
Year
Income Tax
on
Individuals
Company
Taxes
Witholding
Tax on
Interest
Other
Taxes on
Income and
Profits
Taxes on
Property
Domestic
Taxes on
Goods and
Services
Taxes on
International
Trade and
Transactions
Other
Taxes Total
2006/7 3 374 2 161 - 141 142 3 197 6 698 130 15 843
2007/8 3 714 2 834 - 181 149 4 082 8 085 138 19 183
2008/9 4 606 3 269 - 194 171 4 339 8 502 142 21 223
2009/10 5 084 2 852 53 148 222 5 162 8 585 167 22 273
2010/11 5 945 3 585 156 225 139 5 303 5 976 208 21 537
2011/12 7 326 3 916 98 257 194 8 009 7 137 211 27 148
2012/13 8 880 5 045 346 281 289 6 516 13 796 260 35 413
2013/14 9 537 3 434 212 844 261 9 650 14 727 241 38 906
2014/15 10 197 7 019 264 300 286 10 403 18 117 251 46 836
2015/16 10 794 7 723 279 209 313 12 015 17 355 216 48 903
2016/17 12 002 7 708 522 374 284 12 497 14 071 183 47 641
2017/18E 12 398 8 265 345 280 292 12 153 19 597 299 53 629
2006/7 21.3 13.6 0.0 0.9 0.9 20.2 42.3 0.8 100.0
2007/8 19.4 14.8 - 0.9 0.8 21.3 42.1 0.7 100.0
2008/9 21.7 15.4 0.0 0.9 0.8 20.4 40.1 0.7 100.0
2009/10 22.8 12.8 0.2 0.7 1.0 23.2 38.5 0.7 100.0
2010/11 27.6 16.6 0.7 1.0 0.6 24.6 27.7 1.0 100.0
2011/12 27.0 14.4 0.4 0.9 0.7 29.5 26.3 0.8 100.0
2012/13 25.1 14.2 1.0 0.8 0.8 18.4 39.0 0.7 100.0
2013/14 24.5 8.8 0.5 2.2 0.7 24.8 37.9 0.6 100.0
2014/15 21.8 15.0 0.6 0.6 0.6 22.2 38.7 0.5 100.0
2015/16 22.1 15.8 0.6 0.4 0.6 24.6 35.5 0.4 100.0
2016/17P 25.2 16.2 1.1 0.8 0.6 26.2 29.5 0.4 100.0
2017/18E 23.1 15.4 0.6 0.5 0.5 22.7 36.5 0.6 100.0
2007/8 10.1 31.1 28.4 4.9 27.7 20.7 6.2 21.1
2008/9 24.0 15.3 7.2 14.8 6.3 5.2 2.9 10.6
2009/10 10.4 -12.8 --- -23.7 29.8 19.0 1.0 17.6 4.9
2010/11 16.9 25.7 196.7 52.1 -37.6 2.7 -30.4 24.8 -3.3
2011/12 23.2 9.2 -37.3 14.2 40.1 51.0 19.4 1.3 26.1
2012/13 21.2 28.8 253.1 9.3 49.0 -18.6 93.3 23.2 30.4
2013/14 7.4 -31.9 -38.6 200.3 -9.5 48.1 6.7 -7.3 9.9
2014/15 6.9 104.4 24.5 -64.5 9.2 7.8 23.0 4.2 20.4
2015/16 5.9 10.0 5.6 -30.4 9.6 15.5 -4.2 -13.9 4.4
2016/17P 11.2 -0.2 87.0 79.3 -9.2 4.0 -18.9 -15.3 -2.6
2017/18E 3.3 7.2 -33.9 -25.1 2.8 -2.8 39.3 63.4 12.6
Percentage of Total
Year-on-Year Change
Source: Ministry of Finance.

19 | P a g e
3.6 Expenditure Outturn and Public Debt
Total expenditure outturn for FY2016/17 stood N$62.22 billion, which was 101.4 percent relative
to the revised appropriation of N$61.50 billion. This reflects expenditure overrun on personnel
spending relative to the budget. As a result of a combination of revenue shortfall and expenditure
outturn, the budget deficit deteriorated to 6.9 percent in FY2016/17, compared to the budgeted
deficit of 6.3 percent.
Table 6: Outturn on fiscal aggregates FY2009/10 – 2017/18 ITEM 2009-10 2010-11 2011-12 2012-13 2013-14 2014-15 2015-16
Actual Actual Actual Actual Actual Actual Actual
Revised
Budget Actual Estimate
GDP 75 836 83 780 95 313 110 835 126 937 140 981 150 984 158 615 164 156 176 119
Revenue 24 017 23 375 29 922 37 997 41 910 49 931 52 215 51 512 50 865 56 723
% of GDP 31.7% 27.9% 31.4% 34.3% 33.0% 35.4% 34.6% 32.5% 31.0% 32.2%
Expenditure 24 914 27 253 36 611 38 112 46 734 58 704 64 638 61 496 62 228 66 543
% of GDP 32.9% 32.5% 38.4% 34.4% 36.8% 41.6% 42.8% 38.8% 37.9% 37.8%
Budget Balance -897 -3 879 -6 689 -114 -4 824 -8 773 -12 423 -9 984 -11 363 -9 370
% of GDP -1.2% -4.6% -7.0% -0.1% -3.8% -6.2% -8.2% -6.3% -6.9% -5.3%
Debt 11 923 13 893 24 734 27 550 30 852 35 949 59 789 61 986 62 865 74 229
% of GDP 15.7% 16.6% 26.0% 24.9% 24.3% 25.5% 39.6% 39.1% 38.3% 42.1%
Interest payments 1 196 965 1 841 2 617 1 788 2 065 2 630 3 875 4 192 4263
% of Revenue 5.0% 4.1% 6.2% 6.9% 4.3% 4.1% 5.0% 7.5% 8.2% 7.5%
Guarantees 2 635 2 450 2 771 2 610 7 371 6 389 6 457 6 351 8 774 11 874
% of GDP 3.5% 2.9% 2.9% 2.4% 5.8% 4.5% 4.3% 4.0% 5.3% 6.7%
2017-18E2016-17
Source: Ministry of Finance.
The debt stock increased to N$62.87 billion, corresponding to 38.3 percent of GDP. Interest
payments as a ratio of total revenue stood at 8.2 percent a gradual increase from 7.5 percent,
relative to a 10 percent threshold. Guarantees stood at 5.3 percent of GDP, which remains well
within the 10 percent cap, but reflects gradual increase over time.
3.7 Mid-Year Outturn
In respect of the FY2017/18, the Mid-Year revenue collection amounted to N$28.03 billion,
equivalent to 50 percent of the budgeted revenue of N$56.44 billion, compared to a similar
collection rate achieved in the previous corresponding period and better than the historical average
of 47 percent half-yearly. This collection rate suggests potential target collection or moderate over
performance, but potential shortfalls in VAT collections may be expected, while Personal Income
Tax is expected to outperform.
20 | P a g e
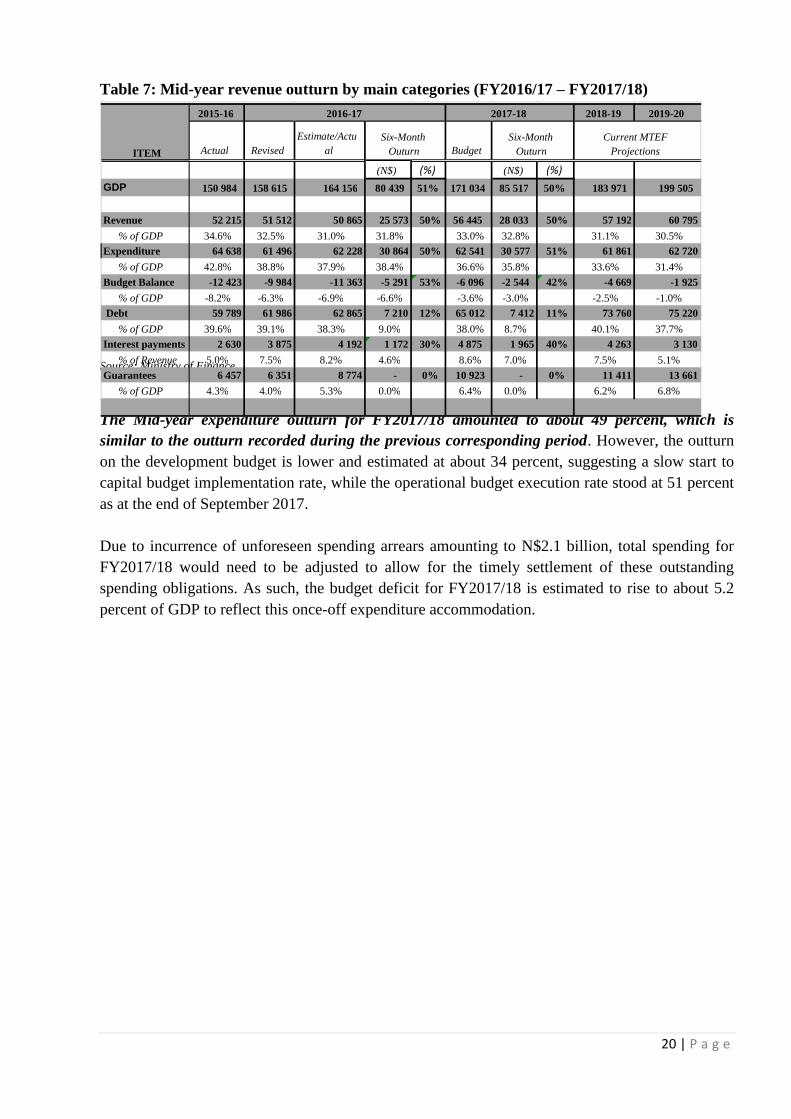
Table 7: Mid-year revenue outturn by main categories (FY2016/17 – FY2017/18)
Source: Ministry of Finance
The Mid-year expenditure outturn for FY2017/18 amounted to about 49 percent, which is
similar to the outturn recorded during the previous corresponding period. However, the outturn
on the development budget is lower and estimated at about 34 percent, suggesting a slow start to
capital budget implementation rate, while the operational budget execution rate stood at 51 percent
as at the end of September 2017.
Due to incurrence of unforeseen spending arrears amounting to N$2.1 billion, total spending for
FY2017/18 would need to be adjusted to allow for the timely settlement of these outstanding
spending obligations. As such, the budget deficit for FY2017/18 is estimated to rise to about 5.2
percent of GDP to reflect this once-off expenditure accommodation.
2015-16 2018-19 2019-20
Actual Revised Estimate/Actu
al Budget
(N$) (%) (N$) (%) GDP 150 984 158 615 164 156 80 439 51% 171 034 85 517 50% 183 971 199 505
Revenue 52 215 51 512 50 865 25 573 50% 56 445 28 033 50% 57 192 60 795 % of GDP 34.6% 32.5% 31.0% 31.8% 33.0% 32.8% 31.1% 30.5%
Expenditure 64 638 61 496 62 228 30 864 50% 62 541 30 577 51% 61 861 62 720 % of GDP 42.8% 38.8% 37.9% 38.4% 36.6% 35.8% 33.6% 31.4%
Budget Balance -12 423 -9 984 -11 363 -5 291 53% -6 096 -2 544 42% -4 669 -1 925 % of GDP -8.2% -6.3% -6.9% -6.6% -3.6% -3.0% -2.5% -1.0%
Debt 59 789 61 986 62 865 7 210 12% 65 012 7 412 11% 73 760 75 220 % of GDP 39.6% 39.1% 38.3% 9.0% 38.0% 8.7% 40.1% 37.7%
Interest payments 2 630 3 875 4 192 1 172 30% 4 875 1 965 40% 4 263 3 130 % of Revenue 5.0% 7.5% 8.2% 4.6% 8.6% 7.0% 7.5% 5.1%
Guarantees 6 457 6 351 8 774 - 0% 10 923 - 0% 11 411 13 661 % of GDP 4.3% 4.0% 5.3% 0.0% 6.4% 0.0% 6.2% 6.8%
ITEM
2016-17 2017-18
Six-Month Outurn
Six-Month Outurn
Current MTEF Projections
21 | P a g e
4 MEDIUM-TERM FISCAL POLICY AND BUDGETARY
FRAMEWORK
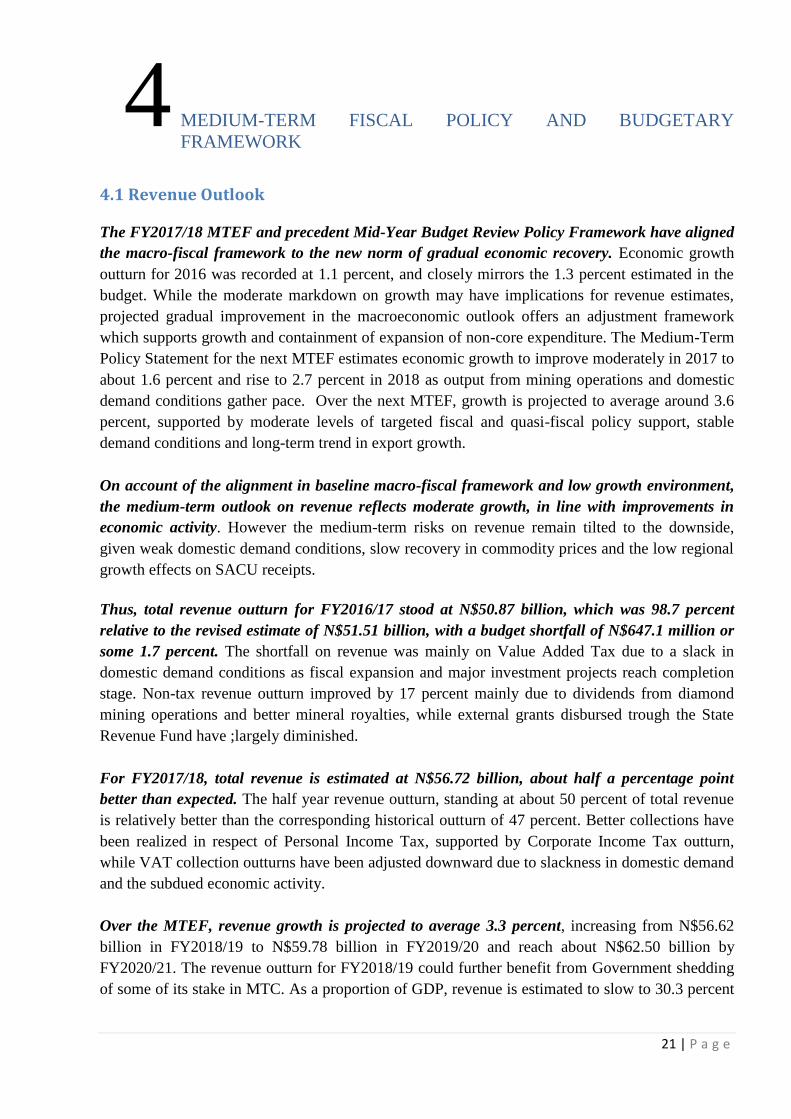
4.1 Revenue Outlook
The FY2017/18 MTEF and precedent Mid-Year Budget Review Policy Framework have aligned
the macro-fiscal framework to the new norm of gradual economic recovery. Economic growth
outturn for 2016 was recorded at 1.1 percent, and closely mirrors the 1.3 percent estimated in the
budget. While the moderate markdown on growth may have implications for revenue estimates,
projected gradual improvement in the macroeconomic outlook offers an adjustment framework
which supports growth and containment of expansion of non-core expenditure. The Medium-Term
Policy Statement for the next MTEF estimates economic growth to improve moderately in 2017 to
about 1.6 percent and rise to 2.7 percent in 2018 as output from mining operations and domestic
demand conditions gather pace. Over the next MTEF, growth is projected to average around 3.6
percent, supported by moderate levels of targeted fiscal and quasi-fiscal policy support, stable
demand conditions and long-term trend in export growth.
On account of the alignment in baseline macro-fiscal framework and low growth environment,
the medium-term outlook on revenue reflects moderate growth, in line with improvements in
economic activity. However the medium-term risks on revenue remain tilted to the downside,
given weak domestic demand conditions, slow recovery in commodity prices and the low regional
growth effects on SACU receipts.
Thus, total revenue outturn for FY2016/17 stood at N$50.87 billion, which was 98.7 percent
relative to the revised estimate of N$51.51 billion, with a budget shortfall of N$647.1 million or
some 1.7 percent. The shortfall on revenue was mainly on Value Added Tax due to a slack in
domestic demand conditions as fiscal expansion and major investment projects reach completion
stage. Non-tax revenue outturn improved by 17 percent mainly due to dividends from diamond
mining operations and better mineral royalties, while external grants disbursed trough the State
Revenue Fund have ;largely diminished.
For FY2017/18, total revenue is estimated at N$56.72 billion, about half a percentage point
better than expected. The half year revenue outturn, standing at about 50 percent of total revenue
is relatively better than the corresponding historical outturn of 47 percent. Better collections have
been realized in respect of Personal Income Tax, supported by Corporate Income Tax outturn,
while VAT collection outturns have been adjusted downward due to slackness in domestic demand
and the subdued economic activity.
Over the MTEF, revenue growth is projected to average 3.3 percent, increasing from N$56.62
billion in FY2018/19 to N$59.78 billion in FY2019/20 and reach about N$62.50 billion by
FY2020/21. The revenue outturn for FY2018/19 could further benefit from Government shedding
of some of its stake in MTC. As a proportion of GDP, revenue is estimated to slow to 30.3 percent

22 | P a g e
in FY2018/19, from 32.2 percent estimated for FY2017/18 and hover around 30.5 percent over the
next MTEF as SACU revenue moderates.
The moderate growth outlook for revenue over the MTEF reflects the overall outlook on
economic activity and potential risks on SACU receipts which accounts for about 32 percent of
tax revenue for Namibia. The most significant risk to the outlook is the further materialization of
the downside risks to economic growth and continued weak growth for the South African economy
in respect to SACU receipts. Globally, uranium commodity prices are projected to remain weak,
on account of weak global demand, particularly for demand from China.
On the domestic front, timely implementation of further tax policy and tax administration reforms,
alongside structural policy reforms as well as continued implementation of the Tax Arrear
Recovery Incentive Program will enhance revenue buoyancy over the MTEF. This is especially
important as Namibia continues to implement a growth-friendly fiscal consolidation over the
MTEF.
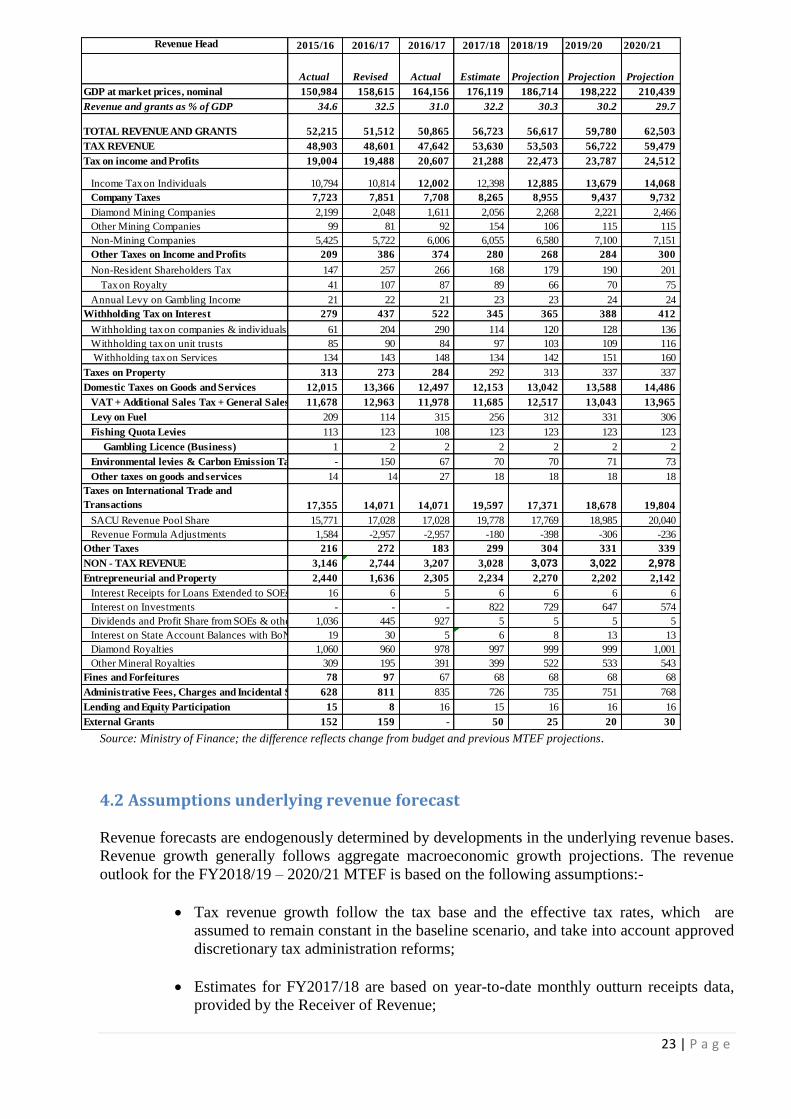
Table 8: Revenue outturn and projected outlook, 2015/16 – 2020/21 MTEF
(N$ millions)
23 | P a g e
Revenue Head 2015/16 2016/17 2016/17 2017/18 2018/19 2019/20 2020/21
Actual Revised Actual Estimate Projection Projection Projection
GDP at market prices, nominal 150,984 158,615 164,156 176,119 186,714 198,222 210,439
Revenue and grants as % of GDP 34.6 32.5 31.0 32.2 30.3 30.2 29.7
TOTAL REVENUE AND GRANTS 52,215 51,512 50,865 56,723 56,617 59,780 62,503
TAX REVENUE 48,903 48,601 47,642 53,630 53,503 56,722 59,479
Tax on income and Profits 19,004 19,488 20,607 21,288 22,473 23,787 24,512
Income Tax on Individuals 10,794 10,814 12,002 12,398 12,885 13,679 14,068
Company Taxes 7,723 7,851 7,708 8,265 8,955 9,437 9,732
Diamond Mining Companies 2,199 2,048 1,611 2,056 2,268 2,221 2,466
Other Mining Companies 99 81 92 154 106 115 115
Non-Mining Companies 5,425 5,722 6,006 6,055 6,580 7,100 7,151
Other Taxes on Income and Profits 209 386 374 280 268 284 300
Non-Resident Shareholders Tax 147 257 266 168 179 190 201
Tax on Royalty 41 107 87 89 66 70 75
Annual Levy on Gambling Income 21 22 21 23 23 24 24
Withholding Tax on Interest 279 437 522 345 365 388 412
Withholding tax on companies & individuals 61 204 290 114 120 128 136
Withholding tax on unit trusts 85 90 84 97 103 109 116
Withholding tax on Services 134 143 148 134 142 151 160
Taxes on Property 313 273 284 292 313 337 337
Domestic Taxes on Goods and Services 12,015 13,366 12,497 12,153 13,042 13,588 14,486
VAT + Additional Sales Tax + General Sales Tax11,678 12,963 11,978 11,685 12,517 13,043 13,965
Levy on Fuel 209 114 315 256 312 331 306
Fishing Quota Levies 113 123 108 123 123 123 123
Gambling Licence (Business) 1 2 2 2 2 2 2
Environmental levies & Carbon Emission Taxes - 150 67 70 70 71 73
Other taxes on goods and services 14 14 27 18 18 18 18
Taxes on International Trade and
Transactions 17,355 14,071 14,071 19,597 17,371 18,678 19,804
SACU Revenue Pool Share 15,771 17,028 17,028 19,778 17,769 18,985 20,040
Revenue Formula Adjustments 1,584 -2,957 -2,957 -180 -398 -306 -236
Other Taxes 216 272 183 299 304 331 339
NON - TAX REVENUE 3,146 2,744 3,207 3,028 3,073 3,022 2,978
Entrepreneurial and Property 2,440 1,636 2,305 2,234 2,270 2,202 2,142
Interest Receipts for Loans Extended to SOEs 16 6 5 6 6 6 6
Interest on Investments - - - 822 729 647 574
Dividends and Profit Share from SOEs & other companies 1,036 445 927 5 5 5 5
Interest on State Account Balances with BoN 19 30 5 6 8 13 13
Diamond Royalties 1,060 960 978 997 999 999 1,001
Other Mineral Royalties 309 195 391 399 522 533 543
Fines and Forfeitures 78 97 67 68 68 68 68
Administrative Fees, Charges and Incidental Sales 628 811 835 726 735 751 768
Lending and Equity Participation 15 8 16 15 16 16 16
External Grants 152 159 - 50 25 20 30 Source: Ministry of Finance; the difference reflects change from budget and previous MTEF projections.
4.2 Assumptions underlying revenue forecast
Revenue forecasts are endogenously determined by developments in the underlying revenue bases.
Revenue growth generally follows aggregate macroeconomic growth projections. The revenue
outlook for the FY2018/19 – 2020/21 MTEF is based on the following assumptions:-
Tax revenue growth follow the tax base and the effective tax rates, which are
assumed to remain constant in the baseline scenario, and take into account approved
discretionary tax administration reforms;
Estimates for FY2017/18 are based on year-to-date monthly outturn receipts data,
provided by the Receiver of Revenue;
24 | P a g e
SACU revenue outlook is based on the projections for the SACU Common Revenue
Pool and adjustments thereof presented by the National Treasury, South Africa in
the 2017 Medium-Term Budget Policy Statement, and
Non-tax revenue estimates are based on projections made by O/M/As, adjusted to
historical trends, and outlook of underlying revenue bases.
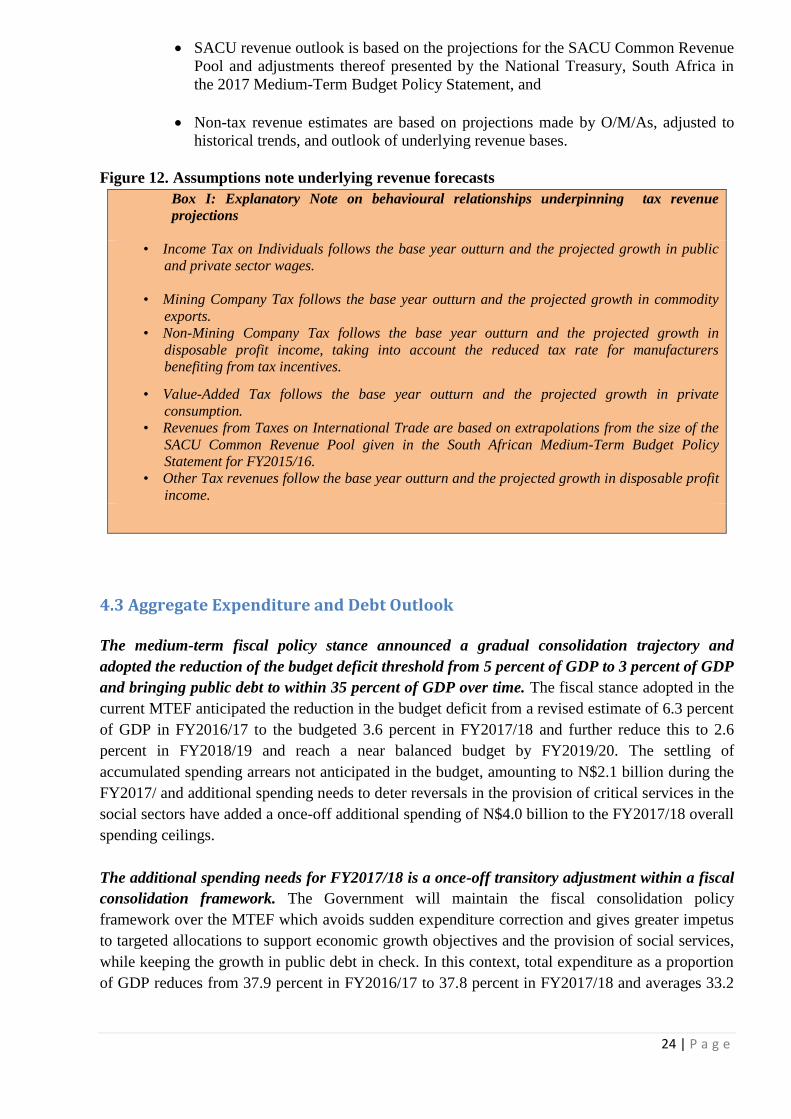
Figure 12. Assumptions note underlying revenue forecasts
Box I: Explanatory Note on behavioural relationships underpinning tax revenue
projections
• Income Tax on Individuals follows the base year outturn and the projected growth in public
and private sector wages.
• Mining Company Tax follows the base year outturn and the projected growth in commodity
exports.
• Non-Mining Company Tax follows the base year outturn and the projected growth in
disposable profit income, taking into account the reduced tax rate for manufacturers
benefiting from tax incentives.
• Value-Added Tax follows the base year outturn and the projected growth in private
consumption.
• Revenues from Taxes on International Trade are based on extrapolations from the size of the
SACU Common Revenue Pool given in the South African Medium-Term Budget Policy
Statement for FY2015/16.
• Other Tax revenues follow the base year outturn and the projected growth in disposable profit
income.
4.3 Aggregate Expenditure and Debt Outlook
The medium-term fiscal policy stance announced a gradual consolidation trajectory and
adopted the reduction of the budget deficit threshold from 5 percent of GDP to 3 percent of GDP
and bringing public debt to within 35 percent of GDP over time. The fiscal stance adopted in the
current MTEF anticipated the reduction in the budget deficit from a revised estimate of 6.3 percent
of GDP in FY2016/17 to the budgeted 3.6 percent in FY2017/18 and further reduce this to 2.6
percent in FY2018/19 and reach a near balanced budget by FY2019/20. The settling of
accumulated spending arrears not anticipated in the budget, amounting to N$2.1 billion during the
FY2017/ and additional spending needs to deter reversals in the provision of critical services in the
social sectors have added a once-off additional spending of N$4.0 billion to the FY2017/18 overall
spending ceilings.
The additional spending needs for FY2017/18 is a once-off transitory adjustment within a fiscal
consolidation framework. The Government will maintain the fiscal consolidation policy
framework over the MTEF which avoids sudden expenditure correction and gives greater impetus
to targeted allocations to support economic growth objectives and the provision of social services,
while keeping the growth in public debt in check. In this context, total expenditure as a proportion
of GDP reduces from 37.9 percent in FY2016/17 to 37.8 percent in FY2017/18 and averages 33.2

25 | P a g e
percent of GDP along the fiscal consolidation path over the MTEF. Along this moderately paced
budget deficit reduction path, public debt is expected to rise.
Table 9: Policy Scenario: Fiscal stance, aggregate expenditure and public debt consistent
with the medium-term policy stance, 2017/18 - 2019/20 MTEF
Item 2015/16 2016/17 2017/18 2018/19 2019/20 2020/21
Actual Actual Estimate Projection Projection Projection
GDP 150,984 164,156 176,119 186,714 198,222 210,439
Total Revenue and Grants 52,215 50,865 56,723 56,617 59,780 62,503
As % of GDP 34.6% 31.0% 32.2% 30.3% 31.5% 29.7%
Potential Additional Expenditure - (450) - -
Expenditure (Budget/MTEF) 65996 62541 61861 62720 66922.31838
Expenditure Adjustments (4,500) 4,002 2,598 2,808 -
Total Expenditure (Actual/Revised) 64,638 62,228 66,543 64,459 65,528 66,922
As % of GDP 42.8% 37.9% 37.8% 34.5% 33.1% 31.8%
Own financing (cash reserves) 450
Potential Budget Balance (12,423) (11,363) (9,370) (7,842) (5,748) (4,419)
As % of GDP -8.2% -6.9% -5.3% -4.2% -2.9% -2.1%
Potential Average Budget Balance for MTEF
Domestic Debt Stock 31,457 36,603 45,981 48,963 53,919 57,076
NEW PROJECTS LOANS
ADB Loan Mechanisation program for Agric 500 500
ADB Loan Transport (Rail ZAR1,350) 450 450 450
ADB Loan Transport (Road) 217 217 217
ADB Loan Basic Education (School Renov) 333 333 333
Foreign Debt Stock (est.) 28,332 26,262 28,249 32,249 33,749 33,676
Total Debt 59,789 62,865 74,229 80,212 86,168 89,251
Net Debt (Less Investment) 56,499 69,210 74,892 79,248 82,152
Domestic Debt Stock 20.8% 22.3% 26.1% 26.2% 27.2% 27.1%
Foreign Debt Stock 18.8% 16.0% 16.0% 17.3% 17.0% 16.0%
Total Debt 39.6% 34.4% 39.3% 40.1% 40.0% 39.0%
Growth in GDP 6.9% 8.7% 7.3% 6.0% 6.2% 6.2%
Growth in Debt 66.3% 5.1% 18.1% 8.1% 5.6% 3.6%
Guarantees
Domestic Guarantee 1,290 1,151 3,151 4,151 5,151
Foreign Gurantee 4,313 11,812 11,812 11,812 12,112
Total Guarantees 5,603 12,963 14,963 15,963 17,263
As a % of GDP 3.4% 7.4% 8.0% 8.1% 8.2%
-0.030666667
Source: Ministry of Finance
To support the macroeconomic stability and debt stabilization objectives, the policy scenario
over the MTEF is to maintain the phased fiscal consolidation which balances between debt
stabilization and inclusive growth objectives over the MTEF. In this regard and on account of
revenue mobilization efforts, the total indicative expenditure ceilings for FY2018/19 and
FY2019/20 are further strengthened by additional N$2.60 billion and N$2.81 billion. Overall
expenditure level is projected to slow by 2.2 percent from a once-off increase of N$66.54 billion in
FY2017/18 to N$64.50 billion and grow and an average rate of about 0.2 percent over the
remainder of the MTEF, thus maintain expenditure in real terms and giving effect to targeted
development interventions.
4.4 Financing of option for additional spending
26 | P a g e
The net additional expenditure allocation for 2018/19 and 2019/20 would require mobilisation of
additional resources. In this regard, a combination of cash and borrowing options will be utilised
for fund additional spending.
4.5 Fiscal Policy Stance for the MTEF
Government’s fiscal policy remains grounded on fiscal counter-cyclicality, promotion of
economic growth and social welfare as well as long-term sustainability of fiscal outcomes. The
fiscal stance for the next MTEF takes into account the expressed need to entrench fiscal
sustainability, providing fiscal policy support to the fledgling economic growth outlook and the
achievement of socio-economic objectives set out in the Harambee Prosperity Plan and Vision
2030.
During the next MTEF:-
Government will maintain a balanced fiscal consolidation policy with the express objective
of stabilizing the growth in public debt over the medium to long-term, while maintaining
the growth-friendliness and social development objectives of fiscal policy. In this regard, a
total of N$6.1 billion will further support the indicative expenditure ceilings for the next
two years of the MTEF, and
Persist to gradually reduce the expenditure- to-GDP ratio threshold from 40 percent of
GDP to 30 percent over the MTEF and reduce the budget deficit threshold from 5 percent
of GDP to below 3 percent of GDP over the MTEF,
reduce the growth of total public debt after a peak of about 44.2 percent of GDP through
gradual reduction in the budget deficit, and
implement alternative forms of financing, particularly PPPs and leveraging of categories
of state assets and structural reforms to aid the fiscal consolidation path, while keeping
contingency liabilities in check.
4.6 Fiscal Policy and Budget Priorities for the 2018/2019-2020/2021 MTEF
For the FY2018/19 – 2020/21 MTEF, Government will pursue the following fiscal priorities:-
Maintain gradual fiscal consolidation policy stance to safeguard macroeconomic
stability and long-term fiscal sustainability. The fiscal consolidation policy stance
has aligned the macro-fiscal framework and endeavoured to align expenditure to
revenue. Securing long-term sustainability of fiscal outcomes requires that Government
consistently implements a well targeted and paced fiscal adjustment to stabilize growth
in public debt, while supporting economic growth and the provision of basic services to
all Namibians. More prioritization is needed, limiting new spending commitments to
the most essential basic needs only and seeking to achieve efficient utilization of the
resources within the budget provisions. This stance will allow the Government to
continue reducing the budget deficit over the MTEF as a lever for debt reduction.
Provide targeted support to fledgling economic growth. Growth is a necessary
condition for growing incomes, public revenue and achieving sustainable socio-
27 | P a g e
economic development objectives. To further support economic growth objectives in an
increasingly constrained fiscal space, targeted budgetary allocation will be made to
specific programmes with growth and job creation potential. The envisaged
Infrastructure Fund will provide ring-fenced funding and completion of existing mega
infrastructure development projects. Harnessing other alternative means of
infrastructure financing such PPPs and promoting access to finance for SMEs through
an SME Financing Strategy will be critical to support economic growth and job
creation objectives. Long-term inclusive growth lies in the structural transformation of
the economy and steady implementation of industrial development interventions
envisaged in Industrial Development Policy and Growth at Home Strategy.
Protecting expenditure in the social sectors of education, health and skills
development as critical enablers for human resources development, enhancing the
quality of life, labour force productivity and medium to long-term prospects for job
creation and economic growth. A combination of additional resource allocation and
measures to optimize internal efficiencies in spending allocations to the social sectors
will aim to deter reversals in gains achieved.
Mobilizing domestic resources for development through tax policy and tax
administration reforms, increasing domestic asset requirement for institutional investors
alongside measures to improve investment climate, establishment and
operationalization of the Revenue Agency for Namibia, introduction of measures to
protect the revenue base from base erosion, while deepening existing streams of public
revenue, and
implementing supportive policies and structural reforms to bolster the
competitiveness of the national economy, crowd-in private sector in project financing
and investment.
4.7 Fiscal Policy Intervention Strategies for the 2018/19-2020/21MTEF
To realise the twin objectives of the reinvigorating fiscal sustainability while supporting
economic growth, outcomes in the identified priority areas and the “Harambee” Prosperity
Plan, Government will implement the following measures annually over the MTEF:-
Maintaining pro-growth fiscal consolidation policy stance
The Government will maintain the fiscal consolidation framework that is moderately paced to
avoid sudden withdrawal of fiscal support to the economy and the provision of basic services.
The steep fiscal consolidation initiated since FY2016/17 Mid-Year Review had a procyclical
effect on growth, at the time when economic downturn impacted on various economic sectors
which resulted in further macro-fiscal vulnerabilities. Over the next MTEF:-
the speed of fiscal consolidation will be evenly paced, with a systematic reduction in
expenditure a proportion of GDP by about 2 percentage points annually, from 37.8
percent of GDP in FY2017/18 to about 31.7 percent by FY2020/21.
the reduction in the budged deficit will be systematic , from a once-off high of 5.3
percent in FY2017/18 to 3.9 percent in FY2018/19 and hover around 2.6 percent over
the next MTEF.
28 | P a g e
the pacing of the magnitude of consolidation will allow for systematic allocation of
resources to priority and growth enhancing programme interventions,
expenditure allocation to non-core activities will be kept at the bare minimum for the
purpose of rendering basic services and administration of priority programmes.
public debt is expected tapper of around 44 percent of GDP over the MTEF, and
key important strategy in the containment of the civil service wage bill, currently
estimated at 52.5 percent of revenue and about 16.3 percent of GDP,
the consolidation stance will be supported by timely implementation of other structural
reforms and alternative forms of financing to aid the implementation of the fiscal
consolidation process
Promote effective Public Finance Management and fiscal discipline. As the Draft Public
Finance Management Bill progresses to finality,
Treasury will tighten expenditure commitment procedures through system enhancement
and implementing measures to promote timely monitoring and reporting of occurrence
of spending arrears.
instil fiscal discipline by containing all new contractual obligations and service
contracts within the allocated budget, system-based expenditure commitments as well as
regular management accounts appraisal, and
Holding accounting officers accountable for the expenditure excess which overcommit
the state, while promoting fiscal transparency and responsible management of the
resources
Promoting inclusive economic growth and job creation
Government believes that high and inclusive economic growth is a necessary condition for the
eradication of poverty, job creation, and growing public revenue, which eventually facilitates
the reduction of income inequalities. To contribute to the achievement of the inclusive growth
prerequisite, Government will:-
promote diversification of the economy by prioritizing development interventions in the
priority sectors of transport and logistics, agriculture, manufacturing and tourism, in line
with the objectives of the Harambee Prosperity Plan and sectoral priorities contemplated in
NDP5 to accelerate growth and job creation,
enhance greater access to development finance through specific interventions to promote
SME access to finance and private sector development through support by Development
Financial Institutions,
prioritize and provide funding for development projects with the high economic growth
potential and promote private sector investment in private sector investment in economic
infrastructure in the fields of energy, housing, transport, water, port in line with the
infrastructure development pillar of the Harambee Prosperity Plan
Develop and invest in priority public infrastructure programme through the establishment
of an Infrastructure Fund with initial capital spending outlay of about N$2.5 billion,
implementation of AfDB funded capital projects estimated at N$4 billion over the MTEF
and targeted infrastructure development through PPPs. Assessment for potential project
29 | P a g e
candidates for PPPs are being persued in respect to the revamping of Hosea Kutako
Airport, Management of the Walvis Bay Container Terminal and public sector office
complex. These infrastructure investment programme will further capital investment,
effectively doubling the size of the development budget over the next MTEF,
crowding-in private sector investment through implementation of a reviewed fiscal
incentive regime, the new Investment Promotion Action and diversification of sources of
financing through leveraging Public Private Partnerships (PPPs) and encouraging the
partial listing of some of the SOEs on the Namibian Stock Exchange (NSX) and e, and
continuous development of functional and technical skills through continued targeted to the
Students Financial Assistance Fund and vocational training and targeted utilization of the
skills levy funds.
Implement Public Enterprises Reforms to promote profitability and efficiency in affordable
service delivery. Among others, Public Enterprises reforms will aim to achieve financial
sustainability of the Enterprises and enhance the role of the Public Enterprises in the economy. In
particular:-
all targeted subsidies for infrastructure and service delivery will be accounted for in the
framework of the performance agreements and subsidy agreements,
partial listing of categories of some of the economic Public Enterprises will be undertaken
as an empowerment tool and a means to raise capital,
promote the utilization of their asset base to raise capital for funding development
interventions,
Implementing targeted measures to reduce poverty and vulnerability
Government believes that creating opportunities for employment and economic empowerment is
the most effective mechanism to sustainably eradicate poverty and create wealth, while shielding
the vulnerable members of society from the effects poverty. This requires a developmental
approach for state interventions and nurturing a conducive environment for private investment and
job creation. During the next MTEF, Government will implement the following measures to
reduce poverty and vulnerability:-
Promote inclusive growth through investment in the priority economic and social
infrastructure sectors with high growth and high job creation potential in line with the
aspirations of the HPP,
Assess the options for consolidating the management of social safety nets with the view to
establish the central registry system to improve internal efficiency
Strengthen the coverage of Old Age Pension, OVCs, Veterans of the liberation struggle and
disability grants as a first line of defence against poverty for the vulnerable members of
society
Implementing of industrial development pilot projects

30 | P a g e
The National Industrial Policy was adopted in 2012 and, to this effect, Government developed and
adopted the “Growth at home” Strategy as an implementation framework for the Industrial Policy.
During the next MTEF, the Government, in consultation with the private sector and other
stakeholders will identify and fund potential industrial development projects in the strategic areas
of value-addition and economic diversification as well as securing market access, taking advantage
of domestic and regional value chains.
Protecting expenditure in the social sectors
Government will continue according the highest budgetary priority to education, health and social
sectors for human resources development, plugging social deficits and addressing competitiveness
challenges in these sectors.
In the education sector, the focus will be on improving the quality of outcomes on the back
of free access to primary and secondary education, improvement of teacher upgrading
programmes and educational facilities to enhance access to especially tertiary education
and vocational training for expanded skills formation,
Maintain funding for the health sector in real terms to address gaps in health facilities and
improve service delivery in areas of high intervention priorities.
Specific budgetary allocations will be made for land servicing and mass housing
programme over the MTEF to address backlogs in the housing and sanitation sectors, and
Further improve coverage and outreach of social safety nets to beneficiary groups.
Tax policy and tax administration reform agenda
Tax policy contribution to development objects relates to the growth-friendliness of tax system, its
redistributive property and the revenue generation capacity. These essential features of the tax
system are reinforced by the modernization and efficiency of tax administration systems. In the
next MTEF, Government will further implement reforms in both tax policy and administration by:-
Implement measures to protect the tax base from base erosion, profit shifting and illicit
flows through elimination various categories of tax exemptions, both of VAT and income
taxes specific amendments to income tax acts and Transfer Duty Act, while keeping the tax
rates unchanged,
design and implement the Presumptive Tax proposal to bring the relatively larger units in
the informal sector into the tax net,
Persist with the implementation of the Tax Arrear Recovery Incentive Programme for
recovery of outstanding tax for different categories of tax,
leverage regional and international tax cooperation as a mechanism to enhance national
technical capacity in various areas of tax administration,
Commence with renegotiation of Double Taxation Agreements in the context of Namibia’s
Double Taxation Policy aimed at achieving mutually-beneficial outcomes for Namibia,
establish the Namibia Revenue Agency through a phased transitional arrangement to bring
about greater efficiency in the collection, assessment and administration of the tax laws

31 | P a g e
Structural reforms
The execution of the above strategies would require a supportive policy environment and structural
reforms to optimise outcomes. Over the next MTEF, the Government will, among others,
spearhead the following structural reform policies to broaden economic base, local economic
development and advance national industrialization and economic diversification agenda:
improving the productive capacity of the economy for domestic industrial and
consumption demand by addressing supply-side constraints and implementing preference
provisions of new Public Procurement Act,
establishment of a National Single Window facility to facilitate the ease of doing business
and shore up national competitiveness,
assessing infrastructure and service options for PPP and implementing such undertakings
if and when they are found feasible,
finalisation of the review of the provisions of the Investment Bill to provide for a modern
investment framework investment for both foreign and domestic investors, and
Further undertake Public Finance Reforms (PFM) reforms through amendments and
modernization of the State Finance Act and conducting Public Expenditure Reviews in for
specific Budget Votes,
4.8 Policy Conclusions for the MTEF
The key priority for the FY2017/18 Mid-Year Budget Review is to contain excess spending
arrears arising from the steep fiscal consolidation stance implemented since FY2016/17, further
align expenditure to the revised macro-fiscal framework and further anchor public finances on
a sustainable path, while supporting economic growth objectives. The elevated public debt, high
budget deficits and concerns raised by credit ratings agencies require a consistent policy response
package to address these vulnerabilities.
This entails implementing a four-pronged set of actions comprising consolidation of non-core
expenditure, increasing ring-fenced investment in infrastructure, revenue raising interventions and
implementing supportive structural reforms.
On the macro-fiscal front, the Namibian economy is projected to post positive but moderate
economic growth rates over the MTEF, thanks to the coming on production stream of recent
investments in the mining sector and continued resilience in tertiary services sector and a robust
tourism sector. This growth outlook is gradual and fragile, warranting a package of supportive
policy interventions within a narrow fiscal space. The construction industry remains under subdued
pressure resulting from the completion of major investment projects and the effects of the fiscal
consolidation adjustments. However, the medium-term outlook is also clouded with risks. The
main poignant risk to revenue stems from SACU revenues which are expected to slow down
mainly due to the low economic growth environment for especially the South African economy.

32 | P a g e
Globally, the uptick in the world economy offers a window of opportunity for increasing trade
due to demand improvements in Advanced Economies. The projected gradual recovery in the
Euro Area is especially important for Namibia as the EU is one of the main export destination for
Namibian products. Risks to global growth should not, however, be discounted. A further
monetary policy rate hike in the United States will likely impact on capital flows and currency
volatilities across the globe, while the rebalancing China continues to cause a drag on global
growth and commodity price demand. Regionally, the South African and Angolan economies,
which are closely linked to the Namibian economy are contenting with low growth spells in recent
years.
In this context, the priorities for Government over the next MTEF is to implement a more balanced
fiscal consolidation framework that is supportive of medium to long-term growth, mitigate current
and medium-term risks and implement structural reforms to fortify future prospects and enhance
macro-fiscal fundamentals. The following key policy actions for the next six months and MTEF
are important:-
Maintain the fiscal consolidation framework, giving more fiscal impetus to economic
growth and aligning expenditure to priorities, while consolidating non-core expenditure
allocation. The fiscal consolidation framework balances between socio-economic growth
objectives and the indispensable need to continue entrenching fiscal sustainability and
macroeconomic stability.
Implement a growth-friendly fiscal policy, anchored on increased spending on carefully
selected infrastructure projects through establishment and operationalization of an
infrastructure Fund ring-fenced for priority infrastructure projects over the short and long-
term horizons. The magnitude of fiscal support to the economy takes into consideration the
constrained fiscal space and the policy imperative of avoiding procylicality as growth
strengthens. As such, the Government will utilize other alternative means of financing
centered on Public, Private Partnerships, private sector investment and better leveraging of
selected state assets.
Implementing targeted measures to reduce poverty and vulnerability through
implementation of the of four pillars under the “Harambee” Prosperity Plan supporting
job creation efforts, access to finance for especially the Micro, Small and Medium-sized
Enterprises (MSME), vocational training skills, strengthening OVC and other social safety
nets through improved coverage and administrative efficiency,
Enforce fiscal discipline, accountability and oversight to deter reoccurrence of
significant spending arrears. This requires Government-wide adherence to public finance
management provisions, financial system enhancement and keeping contractual and
spending obligations well within the budgeted ceilings.
Provide targeted budgetary allocations to industrialization programmes to give effect to
industrialization policy and Growth at Home strategy. This is in recognition that Namibia
potential inclusive growth lies in the structural transformation of the economy and
improvement of productive capacity leveraging on the regional and global value-chains.
Maintain budgetary priorities to education, health and social sectors to further advance
human resources development, enhance long-term prospects for economic growth, job
creation and improved quality of life.

33 | P a g e
Implement tax policy and tax administration reforms to provide for alternative forms of
revenue by strengthening provisions for protecting the revenue base from erosion and illicit
flows, improve the progressivity of the tax system, introduce an integrated tax
administration system and establish the autonomous Revenue Agency for Namibia.
In order to reinforce the outcomes in the priority areas of intervention during the MTEF,
Government should implement structural reforms in the various sectors of the economy.
This is especially in regard to the competitiveness of the national economy, ease of doing
business, national investment framework, value-addition policy, fiscal incentives and
public finance management.
5 EXPENDITURE ALIGNMENT AND REVISED CEILINGS
5.1 Expenditure Alignment
The purpose of Mid-Term Budget Review is, amongst others, for possible fiscal policy redirection,
meant for mitigating the challenges experienced during the first half of the financial year. The
implementation of 2017/18 budget experienced headwinds as noted by the occurrence of the
2016/17 expenditure arears of N$2.9 billion inclusive of N$ 807 million for the Ministry of High
Education and additional funds requests.
The Mid-Year Budget Review considered an additional amount of N$4,558,986,000
FY2017/2018. Of this allocation, 40.5% is earmarked for Social Programmes: Education, Health
and Social Grants while 12%, is for operational activities (Office Rentals, Transport and Utilities)
and 47.5% for reconciling payments for expenditure arrears that were settled by August 2017.
Specifically, expenditure alignment for FY 2017/18 as informed by the Mid-Term Budget Review
resulted in Original Operational Budget being reduced by N$121 million before a consideration of
additional allocation of N$4 billion. The net result was an upward revision of the Operational
Budget from N$50.9 billion to N$55.4 billion. The Original Development Budget was revised
downward by N$365 million, from N$6.7 billion to N$6.3 billion. The Total Appropriation
amount for FY 2017/18 is revised from N$57 billion to N$61 billion excluding statutory payments
of N$4.9 billion.
On the public investment side, an additional allocation of N$2.5 billion was considered for the
implementation of four (4) ongoing strategic road infrastructure projects and the construction of
Neckartal Dam up to the end of March 2018. These funds will be sourced from the Infrastructure
Fund, a vehicle that was established to fund infrastructure projects outside the Government balance

34 | P a g e
sheet. This facility has become the umbrella funding pool for the Government, both in short and
long term. It further aims to leveraging domestic savings through PPP arrangements. The Fund
will be managed by Development Bank of Namibia. The use of this Fund will increase on
aggregate, the spending of Capital Projects (Development Budget) from N$6.3 billion to about
N$8.8 billion in FY 2017/18.
Changes on both original Development and Operational budgets are reflected in tables: 5A, 5B and
5C.
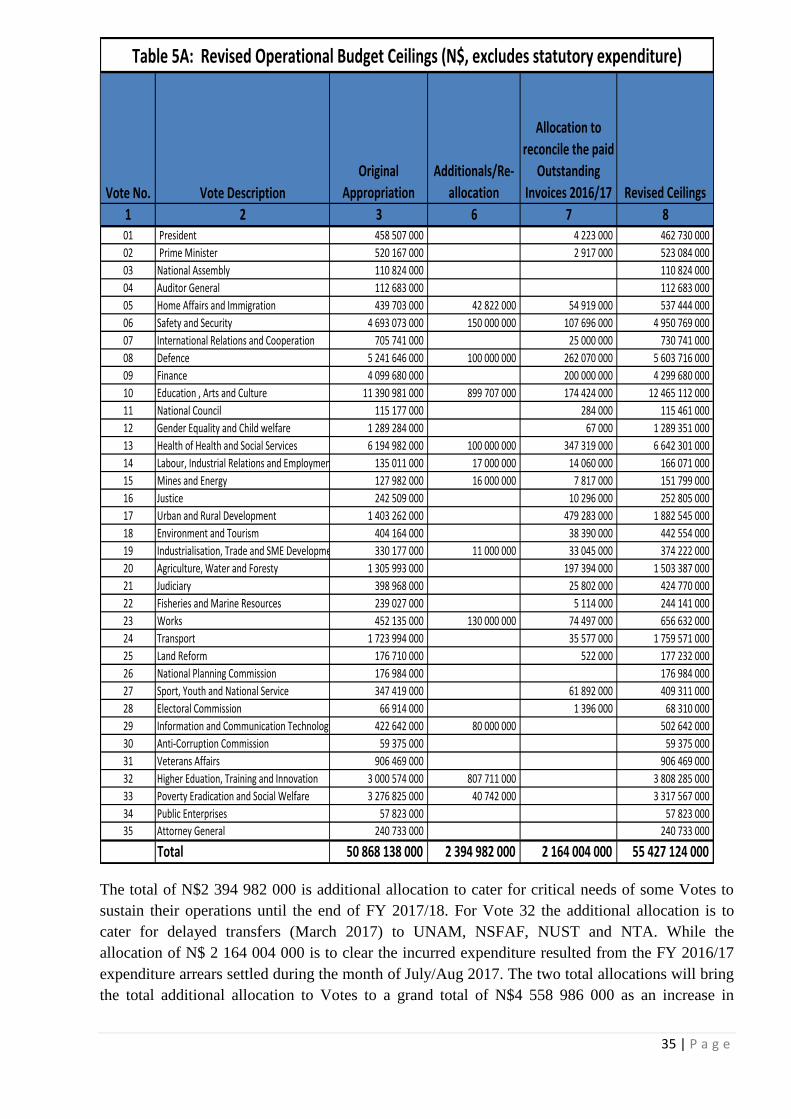
35 | P a g e
Vote No. Vote Description
Original
Appropriation
Additionals/Re-
allocation
Allocation to
reconcile the paid
Outstanding
Invoices 2016/17 Revised Ceilings
1 2 3 6 7 801 President 458 507 000 4 223 000 462 730 000
02 Prime Minister 520 167 000 2 917 000 523 084 000
03 National Assembly 110 824 000 110 824 000
04 Auditor General 112 683 000 112 683 000
05 Home Affairs and Immigration 439 703 000 42 822 000 54 919 000 537 444 000
06 Safety and Security 4 693 073 000 150 000 000 107 696 000 4 950 769 000
07 International Relations and Cooperation 705 741 000 25 000 000 730 741 000
08 Defence 5 241 646 000 100 000 000 262 070 000 5 603 716 000
09 Finance 4 099 680 000 200 000 000 4 299 680 000
10 Education , Arts and Culture 11 390 981 000 899 707 000 174 424 000 12 465 112 000
11 National Council 115 177 000 284 000 115 461 000
12 Gender Equality and Child welfare 1 289 284 000 67 000 1 289 351 000
13 Health of Health and Social Services 6 194 982 000 100 000 000 347 319 000 6 642 301 000
14 Labour, Industrial Relations and Employment Creation 135 011 000 17 000 000 14 060 000 166 071 000
15 Mines and Energy 127 982 000 16 000 000 7 817 000 151 799 000
16 Justice 242 509 000 10 296 000 252 805 000
17 Urban and Rural Development 1 403 262 000 479 283 000 1 882 545 000
18 Environment and Tourism 404 164 000 38 390 000 442 554 000
19 Industrialisation, Trade and SME Development 330 177 000 11 000 000 33 045 000 374 222 000
20 Agriculture, Water and Foresty 1 305 993 000 197 394 000 1 503 387 000
21 Judiciary 398 968 000 25 802 000 424 770 000
22 Fisheries and Marine Resources 239 027 000 5 114 000 244 141 000
23 Works 452 135 000 130 000 000 74 497 000 656 632 000
24 Transport 1 723 994 000 35 577 000 1 759 571 000
25 Land Reform 176 710 000 522 000 177 232 000
26 National Planning Commission 176 984 000 176 984 000
27 Sport, Youth and National Service 347 419 000 61 892 000 409 311 000
28 Electoral Commission 66 914 000 1 396 000 68 310 000
29 Information and Communication Technology 422 642 000 80 000 000 502 642 000
30 Anti-Corruption Commission 59 375 000 59 375 000
31 Veterans Affairs 906 469 000 906 469 000
32 Higher Eduation, Training and Innovation 3 000 574 000 807 711 000 3 808 285 000
33 Poverty Eradication and Social Welfare 3 276 825 000 40 742 000 3 317 567 000
34 Public Enterprises 57 823 000 57 823 000
35 Attorney General 240 733 000 240 733 000
Total 50 868 138 000 2 394 982 000 2 164 004 000 55 427 124 000
Table 5A: Revised Operational Budget Ceilings (N$, excludes statutory expenditure)
The total of N$2 394 982 000 is additional allocation to cater for critical needs of some Votes to
sustain their operations until the end of FY 2017/18. For Vote 32 the additional allocation is to
cater for delayed transfers (March 2017) to UNAM, NSFAF, NUST and NTA. While the
allocation of N$ 2 164 004 000 is to clear the incurred expenditure resulted from the FY 2016/17
expenditure arrears settled during the month of July/Aug 2017. The two total allocations will bring
the total additional allocation to Votes to a grand total of N$4 558 986 000 as an increase in

36 | P a g e
expenditure. However, with the total net-off budget suspensions of N$486 795 000 the 2017/18
increase in expenditure is revised downward to N$4 072 191 000.
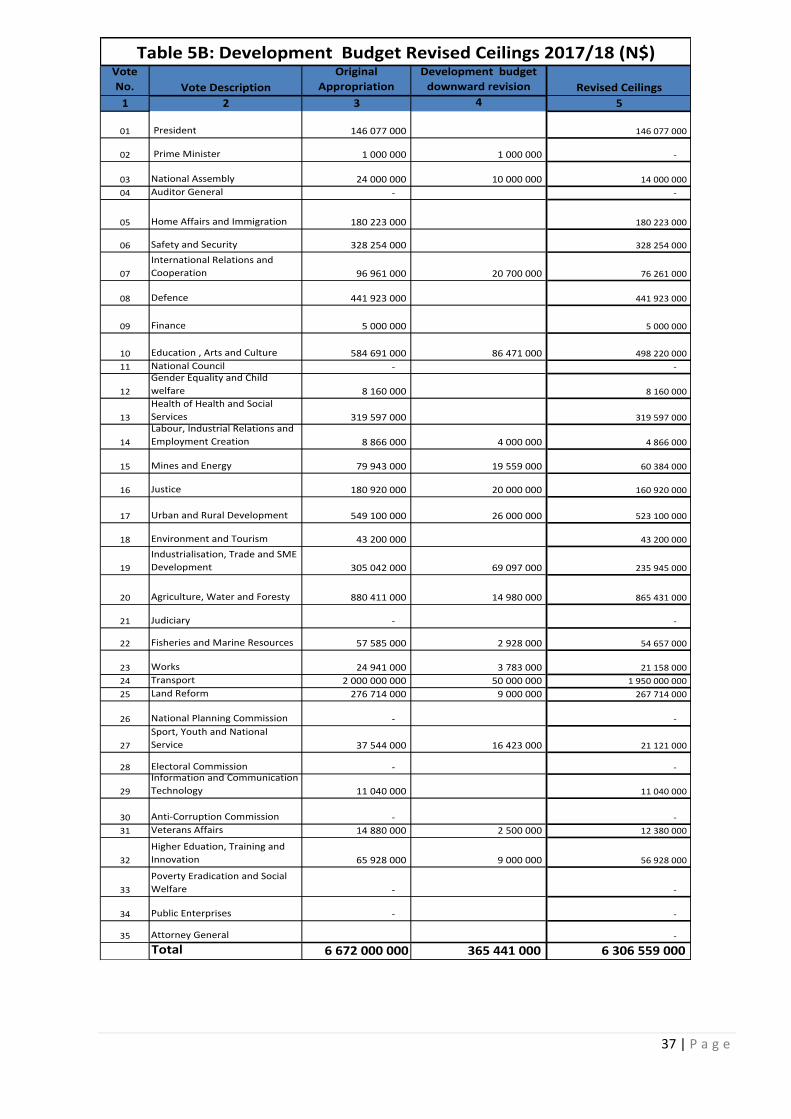
37 | P a g e
Vote
No. Vote Description
Original
Appropriation
Development budget
downward revision Revised Ceilings
1 2 3 4 5
01 President 146 077 000 146 077 000
02 Prime Minister 1 000 000 1 000 000 -
03 National Assembly 24 000 000 10 000 000 14 000 000
04 Auditor General - -
05 Home Affairs and Immigration 180 223 000 180 223 000
06 Safety and Security 328 254 000 328 254 000
07
International Relations and
Cooperation 96 961 000 20 700 000 76 261 000
08 Defence 441 923 000 441 923 000
09 Finance 5 000 000 5 000 000
10 Education , Arts and Culture 584 691 000 86 471 000 498 220 000
11 National Council - -
12
Gender Equality and Child
welfare 8 160 000 8 160 000
13
Health of Health and Social
Services 319 597 000 319 597 000
14
Labour, Industrial Relations and
Employment Creation 8 866 000 4 000 000 4 866 000
15 Mines and Energy 79 943 000 19 559 000 60 384 000
16 Justice 180 920 000 20 000 000 160 920 000
17 Urban and Rural Development 549 100 000 26 000 000 523 100 000
18 Environment and Tourism 43 200 000 43 200 000
19
Industrialisation, Trade and SME
Development 305 042 000 69 097 000 235 945 000
20 Agriculture, Water and Foresty 880 411 000 14 980 000 865 431 000
21 Judiciary - -
22 Fisheries and Marine Resources 57 585 000 2 928 000 54 657 000
23 Works 24 941 000 3 783 000 21 158 000
24 Transport 2 000 000 000 50 000 000 1 950 000 000
25 Land Reform 276 714 000 9 000 000 267 714 000
26 National Planning Commission - -
27
Sport, Youth and National
Service 37 544 000 16 423 000 21 121 000
28 Electoral Commission - -
29
Information and Communication
Technology 11 040 000 11 040 000
30 Anti-Corruption Commission - -
31 Veterans Affairs 14 880 000 2 500 000 12 380 000
32
Higher Eduation, Training and
Innovation 65 928 000 9 000 000 56 928 000
33
Poverty Eradication and Social
Welfare - -
34 Public Enterprises - -
35 Attorney General -
Total 6 672 000 000 365 441 000 6 306 559 000
Table 5B: Development Budget Revised Ceilings 2017/18 (N$)

38 | P a g e
Vote No. Vote Description Original Appropriation Revised Ceilings
1 2 3
01 President 604 584 000 608 535 000
02 Prime Minister 521 167 000 508 071 000
03 National Assembly 134 824 000 124 200 000
04 Auditor General 112 683 000 112 676 000
05
Home Affairs and
Immigration 619 926 000 679 538 000
06 Safety and Security 5 021 327 000 5 279 023 000
07
International Relations and
Cooperation 802 702 000 804 796 000
08 Defence 5 683 569 000 6 045 639 000
09 Finance 4 104 680 000 4 298 477 000
10 Education , Arts and Culture 11 975 672 000 12 963 332 000
11 National Council 115 177 000 115 424 000
12
Gender Equality and Child
welfare 1 297 444 000 1 297 511 000
13 Health and Social Services 6 514 579 000 6 961 898 000
14
Labour, Industrial Relations
and Employment Creation 143 877 000 168 888 000
15 Mines and Energy 207 925 000 212 183 000
16 Justice 423 429 000 406 547 000
17
Urban and Rural
Development 1 952 362 000 2 404 145 000
18 Environment and Tourism 447 364 000 485 703 000
19
Industrialisation, Trade and
SME Development 635 219 000 575 190 000
20
Agriculture, Water and
Foresty 2 186 404 000 2 368 818 000
21 Judiciary 398 968 000 424 588 000
22
Fisheries and Marine
Resources 296 612 000 298 798 000
23 Works 477 076 000 677 790 000
24 Transport 3 723 994 000 3 705 741 000
25 Land Reform 453 424 000 443 261 000
26
National Planning
Commission 176 984 000 176 220 000
27
Sport, Youth and National
Service 384 963 000 429 524 000
28 Electoral Commission 66 914 000 67 910 000
29
Information and
Communication Technology 433 682 000 509 282 000
30 Anti-Corruption Commission 59 375 000 59 168 000
31 Veterans Affairs 921 349 000 918 685 000
32
Higher Eduation, Training and
Innovation 3 066 502 000 3 865 213 000
33
Poverty Eradication and
Social Welfare 3 276 825 000 3 317 073 000
34 Public Enterprises 57 823 000 57 749 000
35 Attorney General 240 733 000 240 733 000
Total 57 540 138 000 61 612 329 000
Table 5C: Global Revised Ceilings (Operational & Development)
On the Development Budget, expenditure revision targeted projects with zero implementation
rates, especially for feasibility studies. The revision totalled N$365 441 000 which accounts for

39 | P a g e
5.5% reduction from the 2017/18 Approved Budget. Given the fact that development projects tend
to have a direct and positive impact on economic growth, due diligence was given to project’s
phases that could be differed to subsequent financial years without negative consequences.
On the Operational Budget expenditure downward revision targeted the following non-essential
spending items: DSA, Training, Office Refreshments, Corporate Gifts, Printing, Office Furniture
and Transfers to some SOEs.
Suspensions were divided between the Operational and Development budgets. Figure 5A, below,
depicts the split in absolute terms and in percentages of the Operational budget amounting to
N$121 354 000 or 25%, whereas those from the Development budget amounts to N$365 441 000
or 75% of the total revisions (N$486 million).
Figure 5A: Share of Downward Revisions between Operational and Development budgets
(N$, % of all suspensions)
After the N$486 795 000 downward revisions under the Mid-Year Review of the FY2017/18
Budget, the available balances of Government from October 2017 to March 2018 will be split as
shown in Figure 5D, below. Personnel expenditure under the Operational Budget will remain the
largest sub-category of the budget, equivalent to 50% of the remaining balances of Government,
followed by the Operational sub-categories of Subsidies and Other Current Transfers, Goods and
Other Services and Acquisition of Capital Assets, which will comprise 30%, 12% and 8% of the
remaining budget balances, respectively.

40 | P a g e
Figure: 5B Revised Sectoral Allocation for 2017/18
Sector Original Budget FY17-18Revised Budget FY17-18 Growth
01 Administrative 4 454 290 000 4 914 645 000 10.34%
02 Economic 8 566 435 000 8 916 399 000 4.09%
03 Infrastructure 4 634 752 000 4 892 813 000 5.57%
04 Public Safety 12 447 327 000 13 135 236 000 5.53%
05 Social 27 437 334 000 29 753 236 000 8.44%
Grand Total 57 540 138 000 61 612 329 000 7.08%
5.2 OPERATIONAL AND DEVELOPMENT BUDGET SUSPENSIONS
The overall Appropriation expenditure excluding statutory increased by 7.08% (N$4,072,
191,000). This expenditure revision is a thoughtful, pro-active reaction to anticipated weaker-than-
anticipated levels government revenue with an eye on also maintaining the economy’s ability to
function to have a positive impact on economic growth. The approach will unfortunately cause the
fiscal deficit to rise.
Figure 5C: Revised Budget Sectoral Allocation (in %)

41 | P a g e
Figure 5D: Revised Available Budget (October 2017 – March 2018) by Sub-Category, largest
to smallest
010PersonnelExpenditure
50%
030GoodsandOtherServices
12%
080Subsidiesandothercurrent
transfers30%
110Acquisitionofcapitalassets
8%

42 | P a g e
5.3 Measures Taken to Avoid Recurrence of Outstanding invoices
The unexpected and unforeseen uncovering of the outstanding invoices was one of the unfortunate
events in the country reputable fiscal prudence and strong institutional framework’s history. It is
regrettably one of the trigger for the country’s first downgrade in 12 years since Namibia was
rated.
It is a lesson learnt and it is an event which should not be allowed to repeat itself given the
undesirable implication it has on the macroeconomic stability. This implies therefore that measures
have to be instituted as soon as possible to avoid future recurrence.
One of the primary reasons for the cause of the outstanding invoices was a mismatch between the
budgeted amounts for the projects vis-à-vis what is contained in the signed contracts. As a result,
the Cabinet made a decision that the implementation of the large projects must now be centralized
at Treasury to ensure proper budgeting and funding of these projects.
Proper monitoring and reporting on commitments on the projects have also been improved overall
in Government. This is in addition, to other measures such as tightening approval on virementions
by Treasury and improving information flows and coordination among the implementing agencies
involved in the implementation of capital projects.
Most important as well is the implementation of the Central Procurement Act and subsequent
introduction of the Central Procurement Board (CPB). The awards of the large projects, including
the projects of SOEs and local authorities, fall under the jurisdiction of the CBP, which ensures
that before an award is done, the entity must first prove that a particular project is fully funded.
The establishment of the Infrastructure Fund at DBN is likewise expected to improve governance
and project management in Government. The Fund will be set up in line with the best practices,
with a view of attracting private capital. One of the key requirements is a periodic reporting and
monitoring of these projects. Funds utilization on these projects will be moreover subject to regular
financial and performance audit.

43 | P a g e
TECHNICAL ANNEXURE: BUDGET REDUCTIONS AND ALLOCATIONS BY VOTE

44 | P a g e
Revised Budget FY2017/2018
Vote 01 President
Vote Past and Planned Expenditures by Major Category
Expenditure Sub Divisions 2016-17 2017-18 2017-18 2018-19 2019-20
Actual Budget Revised Projection Projection 300 Operational
010 Personnel Expenditure
001 Remuneration 90 038 000 88 410 000 88 410 000 91 620 000 94 176 000
002 Employers Contribution to 8 568 000 9 722 000 9 722 000 10 152 000 10 852 000 the G.I.P.F. and M.P.O.O.B.P.F.
003 Other Conditions of Service 415 000 750 000 750 000 740 000 1 830 000
004 Improvement of 0 250 000 250 000 630 000 650 000 Remuneration Structure
005 Employers Contribution to 0 432 000 432 000 508 000 537 000 the Social Security
010 Personnel Expenditure 99 021 000 99 564 000 99 564 000 103 650 000 108 045 000 Total
030 Goods and Other Services
021 Travel and Subsistence 44 921 000 43 961 000 43 961 000 46 161 000 47 249 000 Allowance
022 Materials and Supplies 2 515 000 3 589 000 3 589 000 4 375 000 4 000 000
023 Transport 47 270 000 31 651 000 31 651 000 35 184 000 37 731 000
024 Utilities 20 763 000 20 613 000 20 613 000 22 827 000 23 718 000
025 Maintenance Expenses 1 804 000 1 320 000 1 320 000 1 807 000 1 897 000
027-1 Training Courses, 0 3 183 000 3 183 000 3 893 000 4 321 000 Symposiums and Workshops
027-2 Printing and 0 1 734 000 1 734 000 1 815 000 1 888 000 Advertisements
027-3 Security Contracts 0 20 000 20 000 20 000 20 000
027-4 Entertainment-Politicians 0 592 000 592 000 610 000 610 000
027-5 Office Refreshment 0 325 000 325 000 380 000 450 000
027-6 Official 0 4 404 000 4 404 000 4 603 000 4 683 000 Entertainment/Corporate Gifts
027-7 Others 0 15 130 000 15 130 000 13 449 000 14 353 000
030 Goods and Other Services 117 273 000 126 522 000 126 522 000 135 124 000 140 920 000 Total
080 Subsidies and other current transfers
041 Membership Fees And 0 464 000 464 000 464 000 464 000 Subscriptions: International
043-1 Sub National Bodies 0 9 000 000 9 000 000 0 0
043-2 Other Extra Budgetary 240 062 001 216 347 000 216 347 000 222 837 000 222 837 000 Bodies
044-1 Social Grant 0 0 4 223 000 0 0
080 Subsidies and other current 240 062 001 225 811 000 230 034 000 223 301 000 223 301 000 transfers Total
110 Acquisition of capital assets
101 Furniture And Office 7 123 000 6 165 000 5 893 000 5 886 000 5 001 000 Equipment
103 Operational Equipment, 299 000 445 000 445 000 634 000 700 000 Machinery And Plants

45 | P a g e
110 Acquisition of capital 7 422 000 6 610 000 6 338 000 6 520 000 5 701 000 assets Total
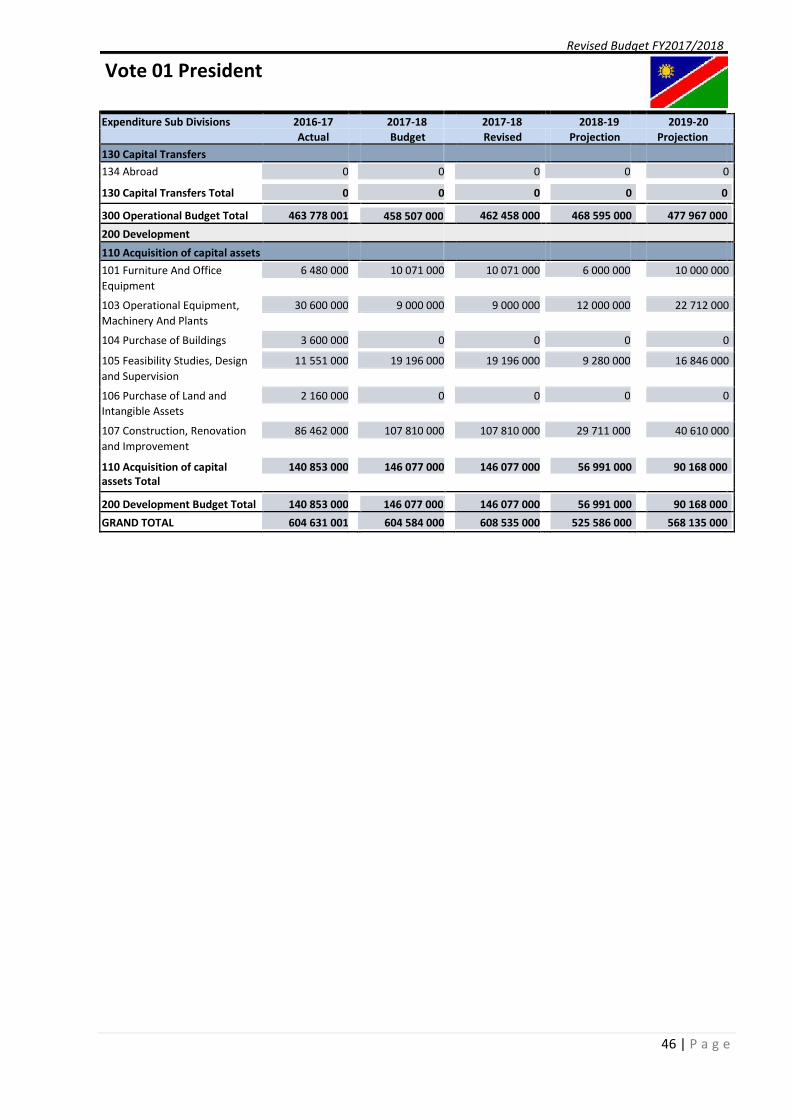
46 | P a g e
Revised Budget FY2017/2018
Vote 01 President
Expenditure Sub Divisions 2016-17 2017-18 2017-18 2018-19 2019-20
Actual Budget Revised Projection Projection
130 Capital Transfers
134 Abroad 0 0 0 0 0
130 Capital Transfers Total 0 0 0 0 0
300 Operational Budget Total 463 778 001
462 458 000
468 595 000
477 967 000
458 507 000
200 Development
110 Acquisition of capital assets
101 Furniture And Office 6 480 000 10 071 000 10 071 000 6 000 000 10 000 000
Equipment
103 Operational Equipment, 30 600 000 9 000 000 9 000 000 12 000 000 22 712 000
Machinery And Plants
104 Purchase of Buildings 3 600 000 0 0 0 0
105 Feasibility Studies, Design 11 551 000 19 196 000 19 196 000 9 280 000 16 846 000
and Supervision
106 Purchase of Land and 2 160 000 0 0 0 0
Intangible Assets
107 Construction, Renovation 86 462 000 107 810 000 107 810 000 29 711 000 40 610 000
and Improvement
110 Acquisition of capital 140 853 000 146 077 000 146 077 000 56 991 000 90 168 000
assets Total
200 Development Budget Total 140 853 000
146 077 000
56 991 000
90 168 000
146 077 000
GRAND TOTAL 604 631 001 604 584 000 608 535 000 525 586 000 568 135 000

47 | P a g e
Revised Budget FY2017/2018
Vote 02 Prime Minister
Vote Past and Planned Expenditures by Major Category
Expenditure Sub Divisions 2016-17 2017-18 2017-18 2018-19 2019-20
Actual Budget Revised Projection Projection 300 Operational
010 Personnel Expenditure
001 Remuneration 146 141 000 165 318 000 165 318 000 189 820 000 201 487 000
002 Employers Contribution to 17 400 000 18 756 000 18 756 000 18 757 000 18 757 000 the G.I.P.F. and M.P.O.O.B.P.F.
003 Other Conditions of Service 767 000 1 786 000 1 786 000 1 100 000 1 100 000
004 Improvement of 0 0 0 0 0 Remuneration Structure
005 Employers Contribution to 355 000 471 000 471 000 750 000 750 000 the Social Security
010 Personnel Expenditure 164 663 000 186 331 000 186 331 000 210 427 000 222 094 000 Total
030 Goods and Other Services
021 Travel and Subsistence 6 857 000 9 050 000 9 033 000 10 350 000 11 350 000 Allowance
022 Materials and Supplies 3 027 000 3 000 000 3 000 000 3 500 000 3 500 000
023 Transport 2 407 000 17 000 000 17 000 000 41 668 000 48 517 000
024 Utilities 18 084 000 17 631 000 17 631 000 21 000 000 21 000 000
025 Maintenance Expenses 11 929 000 44 074 000 39 074 000 7 771 000 3 200 000
026 Property Rental and Related 2 089 000 4 288 000 4 288 000 4 717 000 5 188 000 Charges
027-1 Training Courses, 0 2 000 000 2 000 000 3 000 000 3 000 000 Symposiums and Workshops
027-2 Printing and 0 600 000 600 000 1 000 000 1 000 000 Advertisements
027-3 Security Contracts 302 530 1 000 000 1 000 000 1 000 000 1 000 000
027-4 Entertainment-Politicians 0 690 000 690 000 690 000 690 000
027-5 Office Refreshment 0 500 000 500 000 550 000 700 000
027-6 Official 0 396 000 396 000 396 000 476 000 Entertainment/Corporate Gifts
027-7 Others 0 94 423 000 94 423 000 113 405 000 114 105 000
030 Goods and Other Services 44 695 530 194 652 000 189 635 000 209 047 000 213 726 000 Total
080 Subsidies and other current transfers
041 Membership Fees And 0 627 000 627 000 627 000 627 000 Subscriptions: International
042 Membership Fees And 0 0 0 0 0 Subscriptions: Domestic
043-1 Sub National Bodies 4 000 000 104 400 000 94 404 000 76 059 000 68 346 000
043-2 Other Extra Budgetary 0 26 537 000 26 537 000 30 000 000 32 000 000 Bodies
044-1 Social Grant 3 210 300 3 670 000 6 587 000 5 000 000 5 000 000
045-3 S.M.E 0 450 000 450 000 450 000 450 000
080 Subsidies and other current 7 210 300 135 684 000 128 605 000 112 136 000 106 423 000 transfers Total

48 | P a g e
110 Acquisition of capital assets
evised Budget FY2017/2018
Vote 02 Prime Minister
Expenditure Sub Divisions 2016-17 2017-18 2017-18 2018-19 2019-20
Actual Budget Revised Projection Projection
101 Furniture And Office 1 796 000 3 500 000 3 500 000 0 0
Equipment
102 Vehicles 0 0 0 0 0
110 Acquisition of capital 1 796 000 3 500 000 3 500 000 0 0
assets Total
300 Operational Budget Total 218 364 830
508 071 000
531 610 000
542 243 000
520 167 000
200 Development
110 Acquisition of capital assets
105 Feasibility Studies, Design 0 1 000 000 0 31 086 000 47 617 000
and Supervision
107 Construction, Renovation 4 657 000 0 0 0 0
and Improvement
110 Acquisition of capital 4 657 000 1 000 000 0 31 086 000 47 617 000
assets Total
200 Development Budget Total 4 657 000
0
31 086 000
47 617 000
1 000 000
GRAND TOTAL 223 021 830 521 167 000 508 071 000 562 696 000 589 860 000
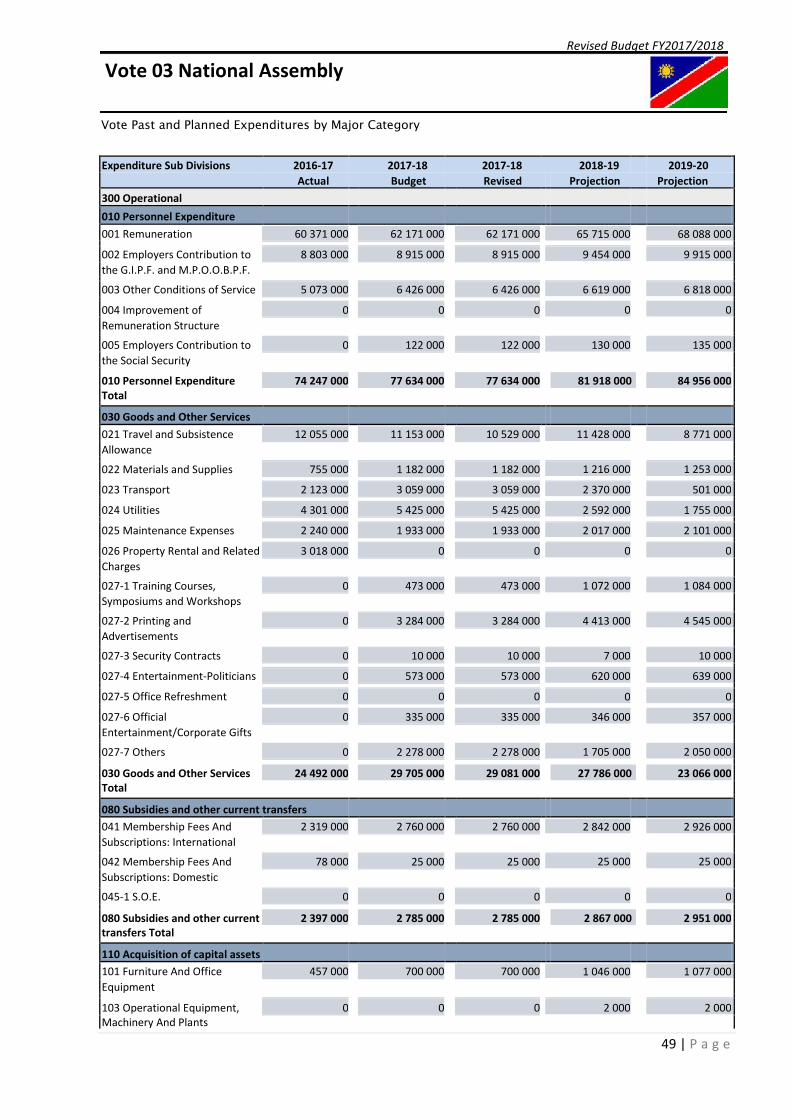
49 | P a g e
Revised Budget FY2017/2018
Vote 03 National Assembly
Vote Past and Planned Expenditures by Major Category
Expenditure Sub Divisions 2016-17 2017-18 2017-18 2018-19 2019-20
Actual Budget Revised Projection Projection 300 Operational
010 Personnel Expenditure
001 Remuneration 60 371 000 62 171 000 62 171 000 65 715 000 68 088 000
002 Employers Contribution to 8 803 000 8 915 000 8 915 000 9 454 000 9 915 000 the G.I.P.F. and M.P.O.O.B.P.F.
003 Other Conditions of Service 5 073 000 6 426 000 6 426 000 6 619 000 6 818 000
004 Improvement of 0 0 0 0 0 Remuneration Structure
005 Employers Contribution to 0 122 000 122 000 130 000 135 000 the Social Security
010 Personnel Expenditure 74 247 000 77 634 000 77 634 000 81 918 000 84 956 000 Total
030 Goods and Other Services
021 Travel and Subsistence 12 055 000 11 153 000 10 529 000 11 428 000 8 771 000 Allowance
022 Materials and Supplies 755 000 1 182 000 1 182 000 1 216 000 1 253 000
023 Transport 2 123 000 3 059 000 3 059 000 2 370 000 501 000
024 Utilities 4 301 000 5 425 000 5 425 000 2 592 000 1 755 000
025 Maintenance Expenses 2 240 000 1 933 000 1 933 000 2 017 000 2 101 000
026 Property Rental and Related 3 018 000 0 0 0 0 Charges
027-1 Training Courses, 0 473 000 473 000 1 072 000 1 084 000 Symposiums and Workshops
027-2 Printing and 0 3 284 000 3 284 000 4 413 000 4 545 000 Advertisements
027-3 Security Contracts 0 10 000 10 000 7 000 10 000
027-4 Entertainment-Politicians 0 573 000 573 000 620 000 639 000
027-5 Office Refreshment 0 0 0 0 0
027-6 Official 0 335 000 335 000 346 000 357 000 Entertainment/Corporate Gifts
027-7 Others 0 2 278 000 2 278 000 1 705 000 2 050 000
030 Goods and Other Services 24 492 000 29 705 000 29 081 000 27 786 000 23 066 000 Total
080 Subsidies and other current transfers
041 Membership Fees And 2 319 000 2 760 000 2 760 000 2 842 000 2 926 000 Subscriptions: International
042 Membership Fees And 78 000 25 000 25 000 25 000 25 000 Subscriptions: Domestic
045-1 S.O.E. 0 0 0 0 0
080 Subsidies and other current 2 397 000 2 785 000 2 785 000 2 867 000 2 951 000 transfers Total
110 Acquisition of capital assets
101 Furniture And Office 457 000 700 000 700 000 1 046 000 1 077 000 Equipment
103 Operational Equipment, 0 0 0 2 000 2 000 Machinery And Plants

50 | P a g e
110 Acquisition of capital 457 000 700 000 700 000 1 048 000 1 079 000 assets Total

51 | P a g e
Revised Budget FY2017/2018
Vote 03 National Assembly
Expenditure Sub Divisions 2016-17 2017-18 2017-18 2018-19 2019-20
Actual Budget Revised Projection Projection
300 Operational Budget Total 101 593 000
110 200 000
113 619 000
112 052 000
110 824 000
200 Development
110 Acquisition of capital assets
107 Construction, Renovation 7 992 000 24 000 000 14 000 000 0 0
and Improvement
110 Acquisition of capital 7 992 000 24 000 000 14 000 000 0 0
assets Total
200 Development Budget Total 7 992 000
14 000 000
0
0
24 000 000
GRAND TOTAL 109 585 000 134 824 000 124 200 000 113 619 000 112 052 000
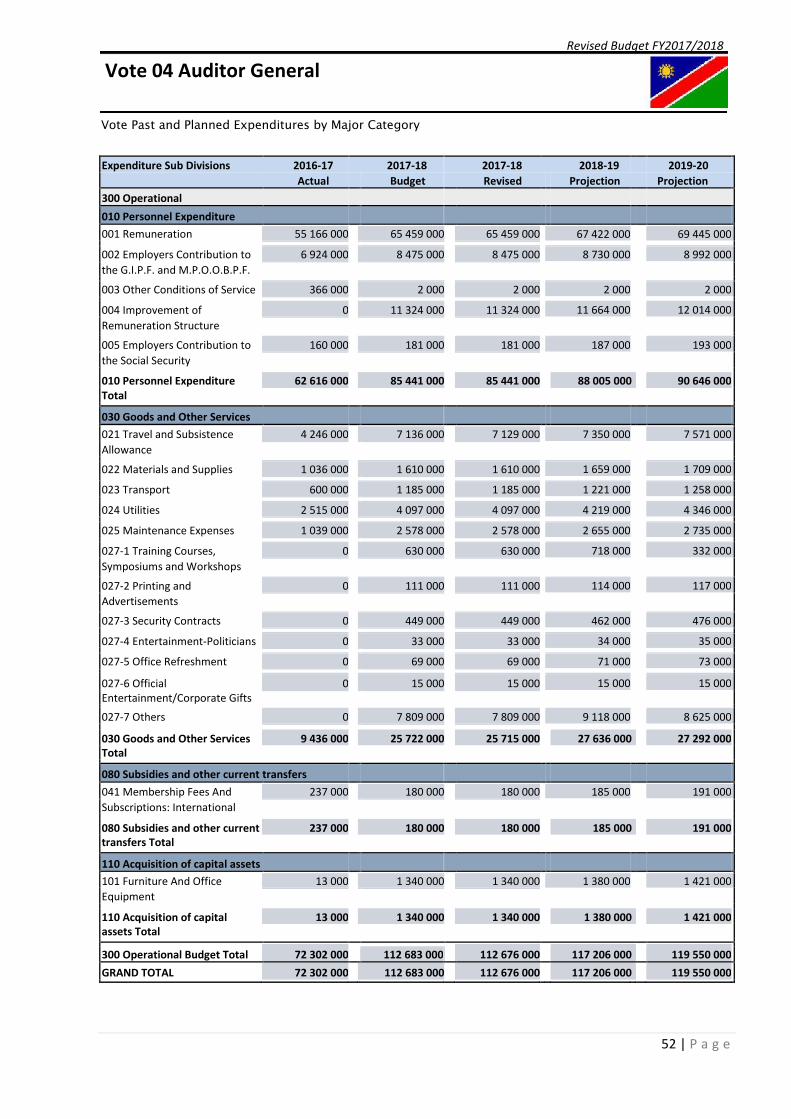
52 | P a g e
Revised Budget FY2017/2018
Vote 04 Auditor General
Vote Past and Planned Expenditures by Major Category
Expenditure Sub Divisions 2016-17 2017-18 2017-18 2018-19 2019-20
Actual Budget Revised Projection Projection
300 Operational
010 Personnel Expenditure
001 Remuneration 55 166 000 65 459 000 65 459 000 67 422 000 69 445 000
002 Employers Contribution to 6 924 000 8 475 000 8 475 000 8 730 000 8 992 000
the G.I.P.F. and M.P.O.O.B.P.F.
003 Other Conditions of Service 366 000 2 000 2 000 2 000 2 000
004 Improvement of 0 11 324 000 11 324 000 11 664 000 12 014 000
Remuneration Structure
005 Employers Contribution to 160 000 181 000 181 000 187 000 193 000
the Social Security
010 Personnel Expenditure 62 616 000 85 441 000 85 441 000 88 005 000 90 646 000
Total
030 Goods and Other Services
021 Travel and Subsistence 4 246 000 7 136 000 7 129 000 7 350 000 7 571 000
Allowance
022 Materials and Supplies 1 036 000 1 610 000 1 610 000 1 659 000 1 709 000
023 Transport 600 000 1 185 000 1 185 000 1 221 000 1 258 000
024 Utilities 2 515 000 4 097 000 4 097 000 4 219 000 4 346 000
025 Maintenance Expenses 1 039 000 2 578 000 2 578 000 2 655 000 2 735 000
027-1 Training Courses, 0 630 000 630 000 718 000 332 000
Symposiums and Workshops
027-2 Printing and 0 111 000 111 000 114 000 117 000
Advertisements
027-3 Security Contracts 0 449 000 449 000 462 000 476 000
027-4 Entertainment-Politicians 0 33 000 33 000 34 000 35 000
027-5 Office Refreshment 0 69 000 69 000 71 000 73 000
027-6 Official 0 15 000 15 000 15 000 15 000
Entertainment/Corporate Gifts
027-7 Others 0 7 809 000 7 809 000 9 118 000 8 625 000
030 Goods and Other Services 9 436 000 25 722 000 25 715 000 27 636 000 27 292 000
Total
080 Subsidies and other current transfers
041 Membership Fees And 237 000 180 000 180 000 185 000 191 000
Subscriptions: International
080 Subsidies and other current 237 000 180 000 180 000 185 000 191 000
transfers Total
110 Acquisition of capital assets
101 Furniture And Office 13 000 1 340 000 1 340 000 1 380 000 1 421 000
Equipment
110 Acquisition of capital 13 000 1 340 000 1 340 000 1 380 000 1 421 000
assets Total
300 Operational Budget Total 72 302 000
112 676 000
117 206 000
119 550 000
112 683 000
GRAND TOTAL 72 302 000 112 683 000 112 676 000 117 206 000 119 550 000

53 | P a g e
Revised Budget FY2017/2018
Vote 05 Home Affairs and Immigration
Vote Past and Planned Expenditures by Major Category
Expenditure Sub Divisions 2016-17 2017-18 2017-18 2018-19 2019-20
Actual Budget Revised Projection Projection 300 Operational
010 Personnel Expenditure
001 Remuneration 219 400 000 202 939 000 237 950 000 216 815 000 232 749 000
002 Employers Contribution to 22 328 000 21 462 000 24 242 000 22 630 000 23 309 000 the G.I.P.F. and M.P.O.O.B.P.F.
003 Other Conditions of Service 4 591 000 0 5 031 000 0 0
004 Improvement of 0 0 0 0 0 Remuneration Structure
005 Employers Contribution to 0 819 000 819 000 843 000 868 000 the Social Security
010 Personnel Expenditure 246 319 000 225 220 000 268 042 000 240 288 000 256 926 000 Total
030 Goods and Other Services
021 Travel and Subsistence 8 114 000 4 200 000 4 200 000 6 750 000 6 976 000 Allowance
022 Materials and Supplies 1 652 000 4 944 000 4 944 000 3 606 000 4 976 000
023 Transport 608 000 7 030 000 7 030 000 15 750 000 7 422 000
024 Utilities 28 100 000 27 322 000 27 322 000 26 856 000 27 661 000
025 Maintenance Expenses 62 051 000 54 227 000 54 227 000 41 520 000 40 345 000
026 Property Rental and Related 11 391 000 21 342 000 21 342 000 21 381 000 21 581 000 Charges
027-1 Training Courses, 0 767 000 767 000 1 586 000 1 649 000 Symposiums and Workshops
027-2 Printing and 0 42 185 000 42 185 000 33 796 000 31 171 000 Advertisements
027-3 Security Contracts 0 644 000 644 000 769 000 796 000
027-4 Entertainment-Politicians 0 35 000 35 000 56 000 57 000
027-5 Office Refreshment 0 74 000 74 000 59 000 59 000
027-6 Official 19 000 30 000 30 000 37 000 39 000 Entertainment/Corporate Gifts
027-7 Others 32 947 969 000 969 000 4 710 000 4 857 000
030 Goods and Other Services 111 967 947 163 769 000 163 769 000 156 876 000 147 589 000 Total
080 Subsidies and other current transfers
041 Membership Fees And 9 000 199 000 199 000 295 000 298 000 Subscriptions: International
042 Membership Fees And 0 0 0 0 0 Subscriptions: Domestic
043-1 Sub National Bodies 0 0 0 0 0
044-1 Social Grant 0 50 000 000 66 807 000 0 0
080 Subsidies and other current 9 000 50 199 000 67 006 000 295 000 298 000 transfers Total
110 Acquisition of capital assets
101 Furniture And Office 401 000 308 000 308 000 476 000 1 079 000 Equipment

54 | P a g e
102 Vehicles 0 0 0 0 0
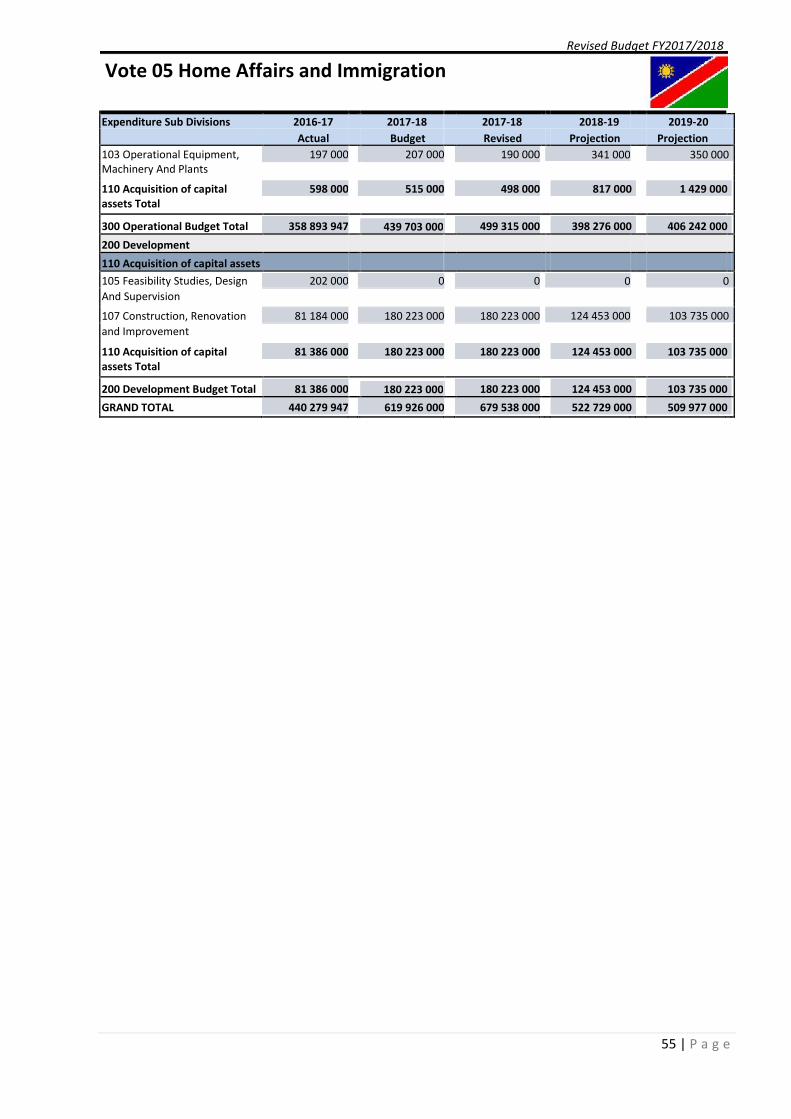
55 | P a g e
Revised Budget FY2017/2018
Vote 05 Home Affairs and Immigration
Expenditure Sub Divisions 2016-17 2017-18 2017-18 2018-19 2019-20
Actual Budget Revised Projection Projection
103 Operational Equipment, 197 000 207 000 190 000 341 000 350 000
Machinery And Plants
110 Acquisition of capital 598 000 515 000 498 000 817 000 1 429 000
assets Total
300 Operational Budget Total 358 893 947
499 315 000
398 276 000
406 242 000
439 703 000
200 Development
110 Acquisition of capital assets
105 Feasibility Studies, Design 202 000 0 0 0 0
And Supervision
107 Construction, Renovation 81 184 000 180 223 000 180 223 000 124 453 000 103 735 000
and Improvement
110 Acquisition of capital 81 386 000 180 223 000 180 223 000 124 453 000 103 735 000
assets Total
200 Development Budget Total 81 386 000
180 223 000
124 453 000
103 735 000
180 223 000
GRAND TOTAL 440 279 947 619 926 000 679 538 000 522 729 000 509 977 000

56 | P a g e
Revised Budget FY2017/2018
Vote 06 Ministry of Safety and Security
Vote Past and Planned Expenditures by Major Category
Expenditure Sub Divisions 2016-17 2017-18 2017-18 2018-19 2019-20
Actual Budget Revised Projection Projection 300 Operational
010 Personnel Expenditure
001 Remuneration 3 610 710 000 3 860 807 000 3 860 807 000 3 688 811 000 3 731 806 000
002 Employers Contribution to 444 105 000 490 146 000 490 146 000 490 146 000 490 146 000 the G.I.P.F. and M.P.O.O.B.P.F.
003 Other Conditions of Service 47 110 000 107 123 000 107 123 000 107 148 000 107 174 000
004 Improvement of 0 0 0 0 0 Remuneration Structure
005 Employers Contribution to 3 000 2 675 000 2 675 000 2 675 000 2 675 000 the Social Security
010 Personnel Expenditure 4 101 928 000 4 460 751 000 4 460 751 000 4 288 780 000 4 331 801 000 Total
030 Goods and Other Services
021 Travel and Subsistence 70 303 000 15 341 000 15 341 000 33 639 000 36 480 000 Allowance
022 Materials and Supplies 126 989 000 16 774 000 16 774 000 64 532 000 71 433 000
023 Transport 196 416 000 37 402 000 37 402 000 69 693 000 70 392 000
024 Utilities 159 176 000 57 274 000 57 274 000 69 902 000 108 194 000
025 Maintenance Expenses 5 780 000 3 800 000 3 800 000 10 639 000 10 537 000
026 Property Rental and Related 3 180 000 0 0 1 000 000 1 000 000 Charges
027-1 Training Courses, 0 2 333 000 152 333 000 6 005 000 4 975 000 Symposiums and Workshops
027-2 Printing and 0 12 330 000 12 330 000 5 688 000 5 930 000 Advertisements
027-4 Entertainment-Politicians 0 63 000 63 000 63 000 63 000
027-5 Office Refreshment 0 86 000 86 000 690 000 749 000
027-6 Official 0 33 000 33 000 535 000 565 000 Entertainment/Corporate Gifts
027-7 Others 0 29 993 000 29 993 000 59 371 000 61 897 000
030 Goods and Other Services 561 844 000 175 429 000 325 429 000 321 757 000 372 215 000 Total
080 Subsidies and other current transfers
041 Membership Fees And 6 052 000 2 548 000 2 548 000 2 671 000 2 696 000 Subscriptions: International
043-1 Sub National Bodies 0 0 0 21 000 22 000
044-1 Social Grant 0 54 345 000 162 041 000 2 505 000 3 064 000
080 Subsidies and other current 6 052 000 56 893 000 164 589 000 5 197 000 5 782 000 transfers Total
110 Acquisition of capital assets
101 Furniture And Office 115 000 0 0 1 390 000 1 200 000 Equipment
102 Vehicles 0 0 0 500 000 74 000 000
103 Operational Equipment, 42 228 000 0 0 123 872 000 51 328 000 Machinery And Plants

57 | P a g e
110 Acquisition of capital 42 343 000 0 0 125 762 000 126 528 000 assets Total

58 | P a g e
Revised Budget FY2017/2018
Vote 06 Ministry of Safety and Security
Expenditure Sub Divisions 2016-17 2017-18 2017-18 2018-19 2019-20
Actual Budget Revised Projection Projection
300 Operational Budget Total 4 712 167 000
4 950 769 000
4 741 496 000
4 836 326 000
4 693 073 000
200 Development
110 Acquisition of capital assets
103 Operational Equipment, 9 279 000 0 0 0 945 994 000
Machinery And Plants
105 Feasibility Studies, Design 3 772 000 0 0 0 200 000 000
And Supervision
107 Construction, Renovation 472 011 000 328 254 000 328 254 000 435 809 000 0
and Improvement
110 Acquisition of capital 485 062 000 328 254 000 328 254 000 435 809 000 1 145 994 000
assets Total
200 Development Budget Total 485 062 000
328 254 000
435 809 000
1 145 994 000
328 254 000
GRAND TOTAL 5 197 229 000 5 021 327 000 5 279 023 000 5 177 305 000 5 982 320 000
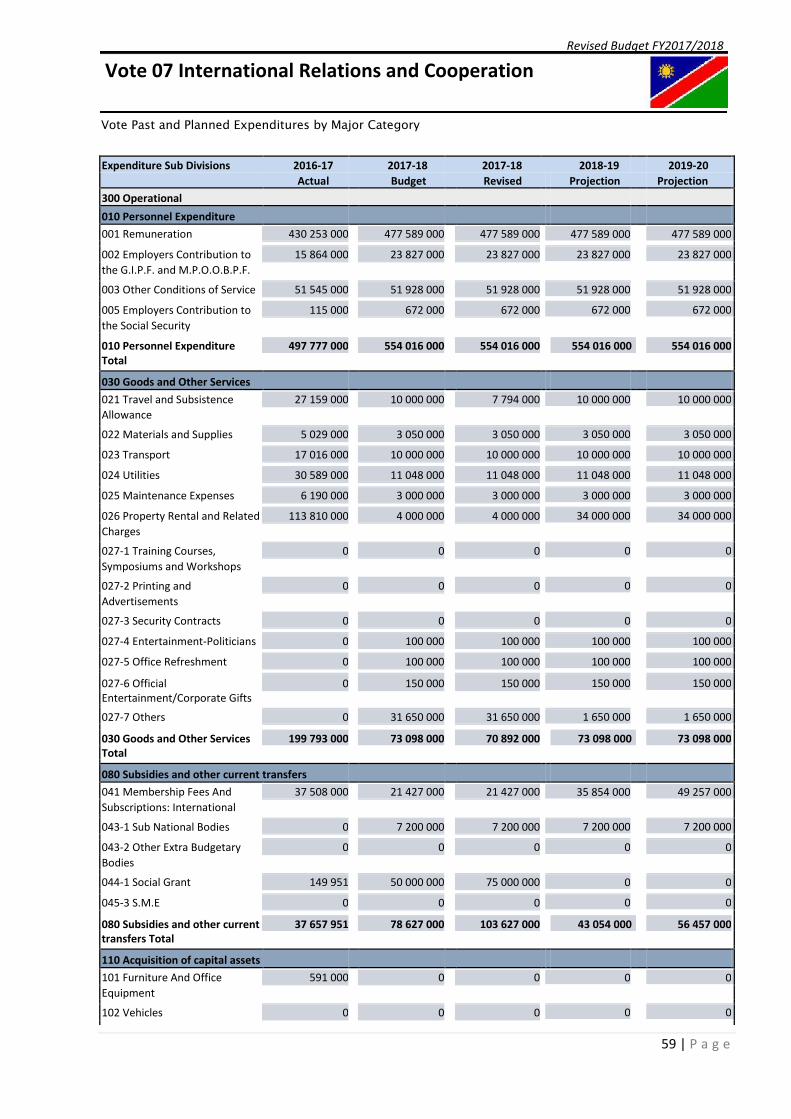
59 | P a g e
Revised Budget FY2017/2018
Vote 07 International Relations and Cooperation
Vote Past and Planned Expenditures by Major Category
Expenditure Sub Divisions 2016-17 2017-18 2017-18 2018-19 2019-20
Actual Budget Revised Projection Projection 300 Operational
010 Personnel Expenditure
001 Remuneration 430 253 000 477 589 000 477 589 000 477 589 000 477 589 000
002 Employers Contribution to 15 864 000 23 827 000 23 827 000 23 827 000 23 827 000 the G.I.P.F. and M.P.O.O.B.P.F.
003 Other Conditions of Service 51 545 000 51 928 000 51 928 000 51 928 000 51 928 000
005 Employers Contribution to 115 000 672 000 672 000 672 000 672 000 the Social Security
010 Personnel Expenditure 497 777 000 554 016 000 554 016 000 554 016 000 554 016 000 Total
030 Goods and Other Services
021 Travel and Subsistence 27 159 000 10 000 000 7 794 000 10 000 000 10 000 000 Allowance
022 Materials and Supplies 5 029 000 3 050 000 3 050 000 3 050 000 3 050 000
023 Transport 17 016 000 10 000 000 10 000 000 10 000 000 10 000 000
024 Utilities 30 589 000 11 048 000 11 048 000 11 048 000 11 048 000
025 Maintenance Expenses 6 190 000 3 000 000 3 000 000 3 000 000 3 000 000
026 Property Rental and Related 113 810 000 4 000 000 4 000 000 34 000 000 34 000 000 Charges
027-1 Training Courses, 0 0 0 0 0 Symposiums and Workshops
027-2 Printing and 0 0 0 0 0 Advertisements
027-3 Security Contracts 0 0 0 0 0
027-4 Entertainment-Politicians 0 100 000 100 000 100 000 100 000
027-5 Office Refreshment 0 100 000 100 000 100 000 100 000
027-6 Official 0 150 000 150 000 150 000 150 000 Entertainment/Corporate Gifts
027-7 Others 0 31 650 000 31 650 000 1 650 000 1 650 000
030 Goods and Other Services 199 793 000 73 098 000 70 892 000 73 098 000 73 098 000 Total
080 Subsidies and other current transfers
041 Membership Fees And 37 508 000 21 427 000 21 427 000 35 854 000 49 257 000 Subscriptions: International
043-1 Sub National Bodies 0 7 200 000 7 200 000 7 200 000 7 200 000
043-2 Other Extra Budgetary 0 0 0 0 0 Bodies
044-1 Social Grant 149 951 50 000 000 75 000 000 0 0
045-3 S.M.E 0 0 0 0 0
080 Subsidies and other current 37 657 951 78 627 000 103 627 000 43 054 000 56 457 000 transfers Total
110 Acquisition of capital assets
101 Furniture And Office 591 000 0 0 0 0 Equipment
102 Vehicles 0 0 0 0 0

60 | P a g e
110 Acquisition of capital 591 000 0 0 0 0 assets Total

61 | P a g e
Revised Budget FY2017/2018
Vote 07 International Relations and Cooperation
Expenditure Sub Divisions 2016-17 2017-18 2017-18 2018-19 2019-20
Actual Budget Revised Projection Projection
300 Operational Budget Total 735 818 951
728 535 000
670 168 000
683 571 000
705 741 000
200 Development
110 Acquisition of capital assets
107 Construction, Renovation 841 000 11 500 000 8 800 000 11 500 000 11 500 000
and Improvement
124 Abroad 105 767 000 85 461 000 67 461 000 172 578 000 186 211 000
110 Acquisition of capital 106 608 000 96 961 000 76 261 000 184 078 000 197 711 000
assets Total
200 Development Budget Total 106 608 000
76 261 000
184 078 000
197 711 000
96 961 000
GRAND TOTAL 842 426 951 802 702 000 804 796 000 854 246 000 881 282 000

62 | P a g e
Revised Budget FY2017/2018
Vote 08 Defence
Vote Past and Planned Expenditures by Major Category
Expenditure Sub Divisions 2016-17 2017-18 2017-18 2018-19 2019-20
Actual Budget Revised Projection Projection
300 Operational
010 Personnel Expenditure
001 Remuneration 3 631 549 000 3 785 183 000 3 785 183 000 3 785 183 000 3 785 183 000
002 Employers Contribution to 427 675 000 500 700 000 500 741 000 500 700 000 500 700 000
the G.I.P.F. and M.P.O.O.B.P.F.
003 Other Conditions of Service 114 130 000 143 956 000 159 956 000 143 956 000 143 956 000
004 Improvement of 0 258 529 000 258 529 000 258 529 000 258 529 000
Remuneration Structure
005 Employers Contribution to 13 989 000 19 162 000 19 162 000 19 162 000 19 162 000
the Social Security
010 Personnel Expenditure 4 187 343 000 4 707 530 000 4 723 571 000 4 707 530 000 4 707 530 000
Total
030 Goods and Other Services
021 Travel and Subsistence 47 994 000 0 3 175 000 0 0
Allowance
022 Materials and Supplies 414 232 000 336 754 000 337 754 000 349 883 000 399 581 000
023 Transport 153 936 000 0 4 784 000 72 275 000 105 782 000
024 Utilities 130 292 000 92 001 000 104 001 000 114 168 000 135 716 000
025 Maintenance Expenses 160 894 000 0 0 0 0
026 Property Rental and Related 19 425 000 8 000 000 16 000 000 13 603 000 14 000 000
Charges
027-7 Others 8 417 583 0 2 000 000 0 0
030 Goods and Other Services 935 190 583 436 755 000 467 714 000 549 929 000 655 079 000
Total
080 Subsidies and other current transfers
041 Membership Fees And 394 000 0 0 0 0
Subscriptions: International
042 Membership Fees And 0 0 0 0 0
Subscriptions: Domestic
043-2 Other Extra Budgetary 0 0 1 000 000 0 0
Bodies
044-1 Social Grant 15 481 000 97 361 000 361 431 000 0 0
080 Subsidies and other current 15 875 000 97 361 000 362 431 000 0 0
transfers Total
110 Acquisition of capital assets
101 Furniture And Office 13 078 000 0 0 0 0
Equipment
102 Vehicles 23 976 000 0 0 0 0
103 Operational Equipment, 384 010 000 0 50 000 000 0 0
Machinery And Plants
110 Acquisition of capital 421 064 000 0 50 000 000 0 0
assets Total
300 Operational Budget Total 5 559 472 583
5 603 716 000
5 257 459 000
5 362 609 000
5 241 646 000
200 Development
110 Acquisition of capital assets
103 Operational Equipment, 265 085 000 263 000 000 263 000 000 178 000 000 125 045 000

63 | P a g e
Machinery And Plants

64 | P a g e
Revised Budget FY2017/2018
Vote 08 Defence
Expenditure Sub Divisions 2016-17 2017-18 2017-18 2018-19 2019-20
Actual Budget Revised Projection Projection
105 Feasibility Studies, Design 1 700 000 0 0 0 0
and Supervision
107 Construction, Renovation 195 821 000 178 923 000 178 923 000 172 480 000 190 276 000
and Improvement
110 Acquisition of capital 462 606 000 441 923 000 441 923 000 350 480 000 315 321 000
assets Total
200 Development Budget Total 462 606 000
441 923 000
350 480 000
315 321 000
441 923 000
GRAND TOTAL 6 022 078 583 5 683 569 000 6 045 639 000 5 607 939 000 5 677 930 000
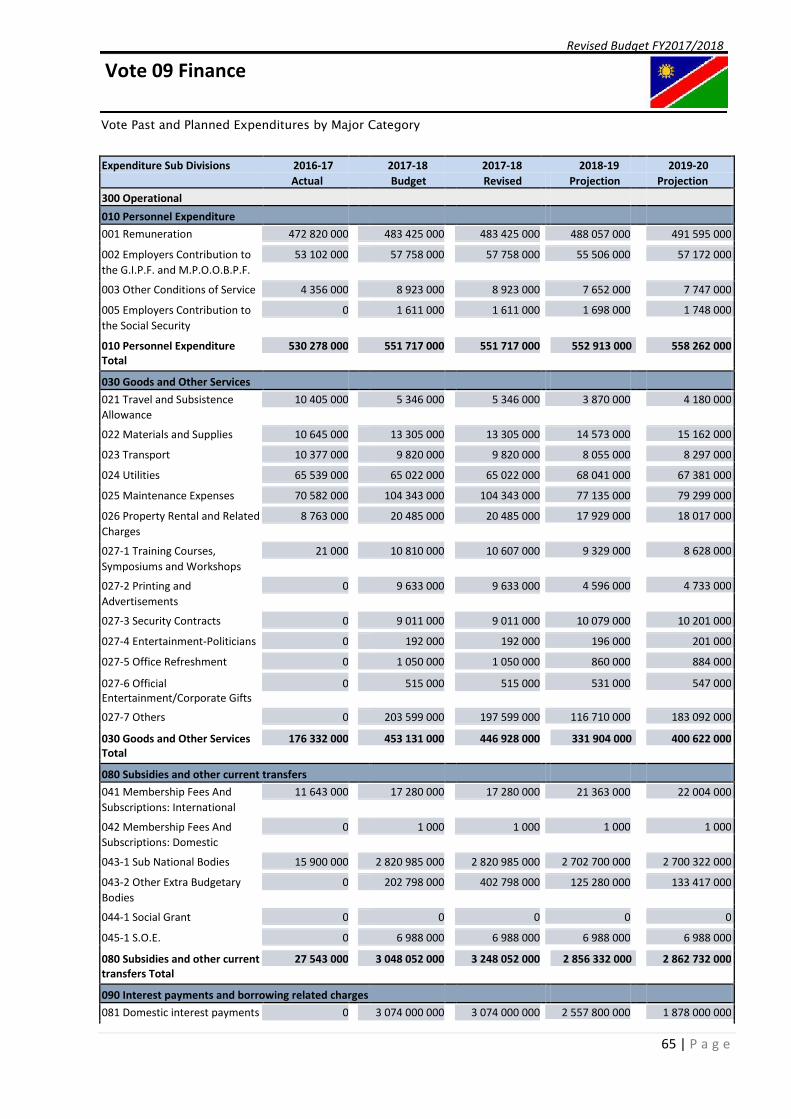
65 | P a g e
Revised Budget FY2017/2018
Vote 09 Finance
Vote Past and Planned Expenditures by Major Category
Expenditure Sub Divisions 2016-17 2017-18 2017-18 2018-19 2019-20
Actual Budget Revised Projection Projection 300 Operational
010 Personnel Expenditure
001 Remuneration 472 820 000 483 425 000 483 425 000 488 057 000 491 595 000
002 Employers Contribution to 53 102 000 57 758 000 57 758 000 55 506 000 57 172 000 the G.I.P.F. and M.P.O.O.B.P.F.
003 Other Conditions of Service 4 356 000 8 923 000 8 923 000 7 652 000 7 747 000
005 Employers Contribution to 0 1 611 000 1 611 000 1 698 000 1 748 000 the Social Security
010 Personnel Expenditure 530 278 000 551 717 000 551 717 000 552 913 000 558 262 000 Total
030 Goods and Other Services
021 Travel and Subsistence 10 405 000 5 346 000 5 346 000 3 870 000 4 180 000 Allowance
022 Materials and Supplies 10 645 000 13 305 000 13 305 000 14 573 000 15 162 000
023 Transport 10 377 000 9 820 000 9 820 000 8 055 000 8 297 000
024 Utilities 65 539 000 65 022 000 65 022 000 68 041 000 67 381 000
025 Maintenance Expenses 70 582 000 104 343 000 104 343 000 77 135 000 79 299 000
026 Property Rental and Related 8 763 000 20 485 000 20 485 000 17 929 000 18 017 000 Charges
027-1 Training Courses, 21 000 10 810 000 10 607 000 9 329 000 8 628 000 Symposiums and Workshops
027-2 Printing and 0 9 633 000 9 633 000 4 596 000 4 733 000 Advertisements
027-3 Security Contracts 0 9 011 000 9 011 000 10 079 000 10 201 000
027-4 Entertainment-Politicians 0 192 000 192 000 196 000 201 000
027-5 Office Refreshment 0 1 050 000 1 050 000 860 000 884 000
027-6 Official 0 515 000 515 000 531 000 547 000 Entertainment/Corporate Gifts
027-7 Others 0 203 599 000 197 599 000 116 710 000 183 092 000
030 Goods and Other Services 176 332 000 453 131 000 446 928 000 331 904 000 400 622 000 Total
080 Subsidies and other current transfers
041 Membership Fees And 11 643 000 17 280 000 17 280 000 21 363 000 22 004 000 Subscriptions: International
042 Membership Fees And 0 1 000 1 000 1 000 1 000 Subscriptions: Domestic
043-1 Sub National Bodies 15 900 000 2 820 985 000 2 820 985 000 2 702 700 000 2 700 322 000
043-2 Other Extra Budgetary 0 202 798 000 402 798 000 125 280 000 133 417 000 Bodies
044-1 Social Grant 0 0 0 0 0
045-1 S.O.E. 0 6 988 000 6 988 000 6 988 000 6 988 000
080 Subsidies and other current 27 543 000 3 048 052 000 3 248 052 000 2 856 332 000 2 862 732 000 transfers Total
090 Interest payments and borrowing related charges
081 Domestic interest payments 0 3 074 000 000 3 074 000 000 2 557 800 000 1 878 000 000

66 | P a g e
082 Foreign interest payments 0 1 926 000 000 1 926 000 000 1 705 200 000 1 252 000 000
083 Borrowing related charges 0 1 000 000 1 000 000 0 0

67 | P a g e
Revised Budget FY2017/2018
Vote 09 Finance Expenditure Sub Divisions 2016-17 2017-18 2017-18 2018-19 2019-20
Actual Budget Revised Projection Projection 090 Interest payments and 0 5 001 000 000 5 001 000 000 4 263 000 000 3 130 000 000 borrowing related charges Total
110 Acquisition of capital assets
101 Furniture And Office 18 000 0 0 0 0 Equipment
103 Operational Equipment, 0 0 0 0 0 Machinery And Plants 110 Acquisition of capital 18 000 0 0 0 0 assets Total
130 Capital Transfers
121-1 Sub National Bodies 0 20 000 000 20 000 000 20 000 000 20 000 000
130 Capital Transfers Total 0 20 000 000 20 000 000 20 000 000 20 000 000
180 Lending and Equity Participation
175 Equity Participation: Joint 0 26 780 000 26 780 000 27 583 000 28 410 000 Ventures and Domestic
Enterprises
180 Lending and Equity 0 26 780 000 26 780 000 27 583 000 28 410 000 Participation Total
300 Operational Budget Total 734 171 000 9 100 680 000 9 294 477 000 8 051 732 000 7 000 026 000
200 Development
110 Acquisition of capital assets
105 Feasibility Studies, Design 0 5 000 000 5 000 000 0 0 and Supervision
107 Construction, Renovation 5 298 000 0 0 0 0 and Improvement
110 Acquisition of capital 5 298 000 5 000 000 5 000 000 0 0 assets Total
200 Development Budget Total 5 298 000 5 000 000 5 000 000 0 0
GRAND TOTAL 739 469 000 9 105 680 000 9 299 477 000 8 051 732 000 7 000 026 000

68 | P a g e
Revised Budget FY2017/2018
Vote 10 Education, Arts and Culture
Vote Past and Planned Expenditures by Major Category
Expenditure Sub Divisions 2016-17 2017-18 2017-18 2018-19 2019-20
Actual Budget Revised Projection Projection 300 Operational
010 Personnel Expenditure
001 Remuneration 11 305 293 000 8 646 855 000 8 646 855 000 8 863 311 000 9 048 912 000
002 Employers Contribution to 960 611 000 992 631 000 992 631 000 1 022 417 000 1 053 085 000 the G.I.P.F. and M.P.O.O.B.P.F.
003 Other Conditions of Service 266 598 000 531 197 000 531 197 000 547 136 000 563 551 000
004 Improvement of 0 0 0 0 0 Remuneration Structure
005 Employers Contribution to 27 000 32 967 000 32 967 000 33 958 000 34 977 000 the Social Security
010 Personnel Expenditure 12 532 529 000 10 203 650 000 10 203 650 000 10 466 822 000 10 700 525 000 Total
030 Goods and Other Services
021 Travel and Subsistence 10 147 000 5 250 000 5 250 000 5 679 000 5 842 000 Allowance
022 Materials and Supplies 15 794 000 36 888 000 36 888 000 37 816 000 38 951 000
023 Transport 9 069 000 10 748 000 10 748 000 11 482 000 11 827 000
024 Utilities 17 222 000 18 648 000 18 648 000 19 208 000 19 787 000
025 Maintenance Expenses 2 509 000 500 000 500 000 516 000 532 000
026 Property Rental and Related 874 000 600 000 600 000 618 000 637 000 Charges
027-1 Training Courses, 0 4 955 000 4 955 000 5 104 000 5 256 000 Symposiums and Workshops
027-2 Printing and 0 3 700 000 3 700 000 3 811 000 3 925 000 Advertisements
027-3 Security Contracts 0 985 000 985 000 1 015 000 1 045 000
027-4 Entertainment-Politicians 0 0 0 0 0
027-5 Office Refreshment 0 50 000 50 000 51 000 53 000
027-6 Official 0 0 0 0 0 Entertainment/Corporate Gifts
027-7 Others 0 41 500 000 71 500 000 42 745 000 44 027 000
030 Goods and Other Services 55 615 000 123 824 000 153 824 000 128 045 000 131 882 000 Total
080 Subsidies and other current transfers
041 Membership Fees And 2 185 000 3 192 000 3 192 000 3 286 000 3 383 000 Subscriptions: International
042 Membership Fees And 270 500 413 000 413 000 425 000 438 000 Subscriptions: Domestic
043-1 Sub National Bodies 164 191 393 1 007 364 000 1 877 071 000 477 890 000 461 227 000
043-2 Other Extra Budgetary 9 697 000 10 987 000 10 987 000 11 317 000 11 658 000 Bodies
044-1 Social Grant 14 014 999 16 551 000 190 975 000 17 048 000 17 558 000
045-1 S.O.E. 0 25 000 000 25 000 000 25 750 000 26 523 000
080 Subsidies and other current 190 358 892 1 063 507 000 2 107 638 000 535 716 000 520 787 000 transfers Total

69 | P a g e
110 Acquisition of capital assets
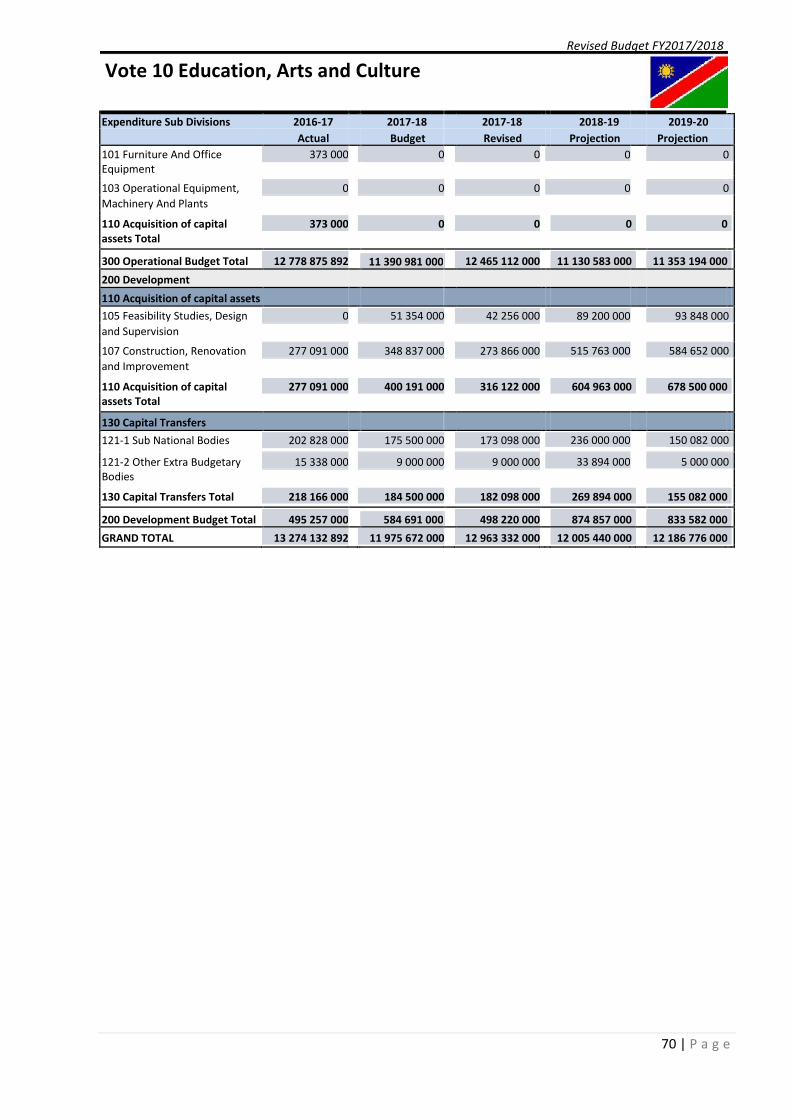
70 | P a g e
Revised Budget FY2017/2018
Vote 10 Education, Arts and Culture
Expenditure Sub Divisions 2016-17 2017-18 2017-18 2018-19 2019-20
Actual Budget Revised Projection Projection
101 Furniture And Office 373 000 0 0 0 0
Equipment
103 Operational Equipment, 0 0 0 0 0
Machinery And Plants
110 Acquisition of capital 373 000 0 0 0 0
assets Total
300 Operational Budget Total 12 778 875 892
12 465 112 000
11 130 583 000
11 353 194 000
11 390 981 000
200 Development
110 Acquisition of capital assets
105 Feasibility Studies, Design 0 51 354 000 42 256 000 89 200 000 93 848 000
and Supervision
107 Construction, Renovation 277 091 000 348 837 000 273 866 000 515 763 000 584 652 000
and Improvement
110 Acquisition of capital 277 091 000 400 191 000 316 122 000 604 963 000 678 500 000
assets Total
130 Capital Transfers
121-1 Sub National Bodies 202 828 000 175 500 000 173 098 000 236 000 000 150 082 000
121-2 Other Extra Budgetary 15 338 000 9 000 000 9 000 000 33 894 000 5 000 000
Bodies
130 Capital Transfers Total 218 166 000 184 500 000 182 098 000 269 894 000 155 082 000
200 Development Budget Total 495 257 000
498 220 000
874 857 000
833 582 000
584 691 000
GRAND TOTAL 13 274 132 892 11 975 672 000 12 963 332 000 12 005 440 000 12 186 776 000

71 | P a g e
Revised Budget FY2017/2018
Vote 11 National Council
Vote Past and Planned Expenditures by Major Category
Expenditure Sub Divisions 2016-17 2017-18 2017-18 2018-19 2019-20
Actual Budget Revised Projection Projection
300 Operational
010 Personnel Expenditure
001 Remuneration 50 171 000 60 990 000 60 990 000 61 950 000 63 167 000
002 Employers Contribution to 7 216 000 8 048 000 8 048 000 7 970 000 8 104 000
the G.I.P.F. and M.P.O.O.B.P.F.
003 Other Conditions of Service 4 804 000 1 323 000 1 323 000 1 270 000 1 318 000
004 Improvement of 0 0 0 0 0
Remuneration Structure
005 Employers Contribution to 76 000 111 000 111 000 112 000 116 000
the Social Security
010 Personnel Expenditure 62 267 000 70 472 000 70 472 000 71 302 000 72 705 000
Total
030 Goods and Other Services
021 Travel and Subsistence 13 717 000 21 945 000 21 945 000 23 000 000 23 300 000
Allowance
022 Materials and Supplies 259 000 505 000 505 000 536 000 563 000
023 Transport 764 000 6 859 000 6 859 000 8 300 000 8 412 000
024 Utilities 2 549 000 5 038 000 5 038 000 5 535 000 4 580 000
025 Maintenance Expenses 731 000 2 650 000 2 650 000 1 319 000 500 000
027-1 Training Courses, 0 1 210 000 1 210 000 1 485 000 1 650 000
Symposiums and Workshops
027-2 Printing and 0 800 000 800 000 865 000 980 000
Advertisements
027-4 Entertainment-Politicians 0 0 0 0 0
027-5 Office Refreshment 0 145 000 145 000 155 000 165 000
027-6 Official 0 535 000 535 000 585 000 635 000
Entertainment/Corporate Gifts
027-7 Others 0 2 550 000 2 550 000 2 900 000 3 150 000
030 Goods and Other Services 18 020 000 42 237 000 42 237 000 44 680 000 43 935 000
Total
080 Subsidies and other current transfers
041 Membership Fees And 792 000 845 000 845 000 880 000 900 000
Subscriptions: International
042 Membership Fees And 4 000 5 000 289 000 5 000 5 000
Subscriptions: Domestic
043-1 Sub National Bodies 0 0 0 0 0
080 Subsidies and other current 796 000 850 000 1 134 000 885 000 905 000
transfers Total
110 Acquisition of capital assets
101 Furniture And Office 490 000 1 618 000 1 581 000 1 000 000 1 000 000
Equipment
110 Acquisition of capital 490 000 1 618 000 1 581 000 1 000 000 1 000 000
assets Total
300 Operational Budget Total 81 573 000
115 424 000
117 867 000
118 545 000
115 177 000
GRAND TOTAL 81 573 000 115 177 000 115 424 000 117 867 000 118 545 000

72 | P a g e
Revised Budget FY2017/2018
Vote 12 Gender Equality and Child Welfare
Vote Past and Planned Expenditures by Major Category
Expenditure Sub Divisions 2016-17 2017-18 2017-18 2018-19 2019-20
Actual Budget Revised Projection Projection 300 Operational
010 Personnel Expenditure
001 Remuneration 115 863 000 135 545 000 135 545 000 139 612 000 143 800 000
002 Employers Contribution to 14 068 000 16 457 000 16 457 000 16 950 000 17 458 000 the G.I.P.F. and M.P.O.O.B.P.F.
003 Other Conditions of Service 2 399 000 7 668 000 7 668 000 2 298 000 2 535 000
004 Improvement of 0 0 0 0 0 Remuneration Structure
005 Employers Contribution to 454 000 508 000 508 000 523 000 539 000 the Social Security
010 Personnel Expenditure 132 784 000 160 178 000 160 178 000 159 383 000 164 332 000 Total
030 Goods and Other Services
021 Travel and Subsistence 5 543 000 6 061 000 6 061 000 6 243 000 6 430 000 Allowance
022 Materials and Supplies 3 754 000 8 136 000 8 136 000 8 569 000 8 825 000
023 Transport 29 117 000 24 645 000 24 645 000 25 384 000 26 146 000
024 Utilities 15 265 000 18 445 000 18 445 000 18 998 000 19 569 000
025 Maintenance Expenses 480 000 560 000 560 000 577 000 594 000
026 Property Rental and Related 1 346 000 1 568 000 1 568 000 1 615 000 1 663 000 Charges
027-1 Training Courses, 0 3 112 000 3 112 000 3 206 000 3 302 000 Symposiums and Workshops
027-2 Printing and 0 780 000 780 000 803 000 827 000 Advertisements
027-3 Security Contracts 0 6 468 000 6 468 000 6 662 000 6 862 000
027-4 Entertainment-Politicians 0 46 000 46 000 47 000 49 000
027-5 Office Refreshment 0 139 000 139 000 144 000 149 000
027-6 Official 0 155 000 155 000 160 000 166 000 Entertainment/Corporate Gifts
027-7 Others 6 051 603 2 293 000 2 293 000 2 362 000 2 432 000
030 Goods and Other Services 61 556 603 72 408 000 72 408 000 74 770 000 77 014 000 Total
080 Subsidies and other current transfers
041 Membership Fees And 30 000 5 240 000 5 240 000 5 397 000 5 559 000 Subscriptions: International
044-1 Social Grant 20 600 000 1 013 930 000 1 013 997 000 1 050 128 000 1 068 185 000
045-1 S.O.E. 0 8 579 000 8 579 000 8 836 000 9 101 000
045-2 Public And Departmental 0 21 768 000 21 768 000 22 421 000 23 094 000 Enterprises And Private
Industries
080 Subsidies and other current 20 630 000 1 049 517 000 1 049 584 000 1 086 782 000 1 105 939 000 transfers Total
110 Acquisition of capital assets
101 Furniture And Office 122 000 7 181 000 7 181 000 6 933 000 7 141 000 Equipment
73 | P a g e
110 Acquisition of capital 122 000 7 181 000 7 181 000 6 933 000 7 141 000 assets Total

74 | P a g e
Revised Budget FY2017/2018
Vote 12 Gender Equality and Child Welfare
Expenditure Sub Divisions 2016-17 2017-18 2017-18 2018-19 2019-20
Actual Budget Revised Projection Projection
300 Operational Budget Total 215 092 603
1 289 351 000
1 327 868 000
1 354 426 000
1 289 284 000
200 Development
110 Acquisition of capital assets
105 Feasibility Studies, Design 1 096 000 3 462 000 3 462 000 0 500 000
and Supervision
106 Purchase of Land and 0 300 000 300 000 0 0
Intangible Assets
107 Construction, Renovation 3 243 000 4 398 000 4 398 000 25 600 000 38 309 000
and Improvement
110 Acquisition of capital 4 339 000 8 160 000 8 160 000 25 600 000 38 809 000
assets Total
200 Development Budget Total 4 339 000
8 160 000
25 600 000
38 809 000
8 160 000
GRAND TOTAL 219 431 603 1 297 444 000 1 297 511 000 1 353 468 000 1 393 235 000

75 | P a g e
Revised Budget FY2017/2018
Vote 13 Health and Social Services
Vote Past and Planned Expenditures by Major Category
Expenditure Sub Divisions 2016-17 2017-18 2017-18 2018-19 2019-20
Actual Budget Revised Projection Projection 300 Operational
010 Personnel Expenditure
001 Remuneration 3 087 171 000 2 914 299 000 3 014 299 000 3 001 728 000 3 091 778 000
002 Employers Contribution to 249 786 000 262 294 000 262 294 000 270 215 000 278 322 000 the G.I.P.F. and M.P.O.O.B.P.F.
003 Other Conditions of Service 121 590 000 99 083 000 99 083 000 102 060 000 105 123 000
005 Employers Contribution to 8 092 000 14 632 000 14 632 000 15 071 000 15 522 000 the Social Security
010 Personnel Expenditure 3 466 639 000 3 290 308 000 3 390 308 000 3 389 074 000 3 490 745 000 Total
030 Goods and Other Services
021 Travel and Subsistence 50 767 000 10 005 000 10 005 000 10 302 000 10 610 000 Allowance
022 Materials and Supplies 1 647 238 000 1 277 034 000 1 277 034 000 1 265 733 000 1 240 397 000
023 Transport 103 120 000 86 878 000 86 878 000 89 483 000 92 167 000
024 Utilities 284 265 000 343 195 000 343 195 000 353 490 000 364 092 000
025 Maintenance Expenses 80 131 000 29 371 000 29 371 000 30 252 000 31 159 000
026 Property Rental and Related 21 854 000 25 347 000 25 347 000 26 108 000 26 891 000 Charges
027-1 Training Courses, 0 0 0 0 0 Symposiums and Workshops
027-2 Printing and 0 14 439 000 14 439 000 14 872 000 15 317 000 Advertisements
027-3 Security Contracts 0 54 581 000 54 581 000 56 218 000 57 905 000
027-4 Entertainment-Politicians 0 41 000 41 000 43 000 45 000
027-5 Office Refreshment 0 2 120 000 2 120 000 2 184 000 2 249 000
027-6 Official 0 10 000 10 000 10 000 10 000 Entertainment/Corporate Gifts
027-7 Others 0 706 370 000 706 370 000 727 562 000 749 392 000
030 Goods and Other Services 2 187 375 000 2 549 391 000 2 549 391 000 2 576 257 000 2 590 234 000 Total
080 Subsidies and other current transfers
041 Membership Fees And 2 652 000 3 044 000 3 044 000 3 135 000 3 229 000 Subscriptions: International
042 Membership Fees And 0 14 000 14 000 14 000 14 000 Subscriptions: Domestic
043-2 Other Extra Budgetary 8 845 000 1 500 000 1 500 000 1 545 000 1 591 000 Bodies
044-1 Social Grant 0 262 887 000 610 206 000 270 774 000 278 897 000
044-2 Support to N.P.O 0 2 065 000 2 065 000 2 127 000 2 191 000
080 Subsidies and other current 11 497 000 269 510 000 616 829 000 277 595 000 285 922 000 transfers Total
110 Acquisition of capital assets
101 Furniture And Office 5 371 000 0 0 0 0 Equipment
76 | P a g e
102 Vehicles 62 524 000 40 242 000 40 242 000 41 449 000 42 692 000

77 | P a g e
Revised Budget FY2017/2018
Vote 13 Health and Social Services
Expenditure Sub Divisions 2016-17 2017-18 2017-18 2018-19 2019-20
Actual Budget Revised Projection Projection
103 Operational Equipment, 86 050 000 45 531 000 45 531 000 46 897 000 48 304 000
Machinery And Plants
110 Acquisition of capital 153 945 000 85 773 000 85 773 000 88 346 000 90 996 000
assets Total
300 Operational Budget Total 5 819 456 000
6 642 301 000
6 331 272 000
6 457 897 000
6 194 982 000
200 Development
030 Goods and Other Services
022 Materials and Supplies 929 000 0 0 0 0
030 Goods and Other Services 929 000 0 0 0 0
Total
110 Acquisition of capital assets
101 Furniture And Office 35 299 000 37 511 000 37 511 000 64 430 000 48 771 000
Equipment
105 Feasibility Studies, Design 49 191 000 48 390 000 48 390 000 81 738 000 62 164 000
and Supervision
107 Construction, Renovation 268 462 000 233 696 000 233 696 000 398 751 000 303 491 000
and Improvement
110 Acquisition of capital 352 952 000 319 597 000 319 597 000 544 919 000 414 426 000
assets Total
200 Development Budget Total 353 881 000
319 597 000
544 919 000
414 426 000
319 597 000
GRAND TOTAL 6 173 337 000 6 514 579 000 6 961 898 000 6 876 191 000 6 872 323 000
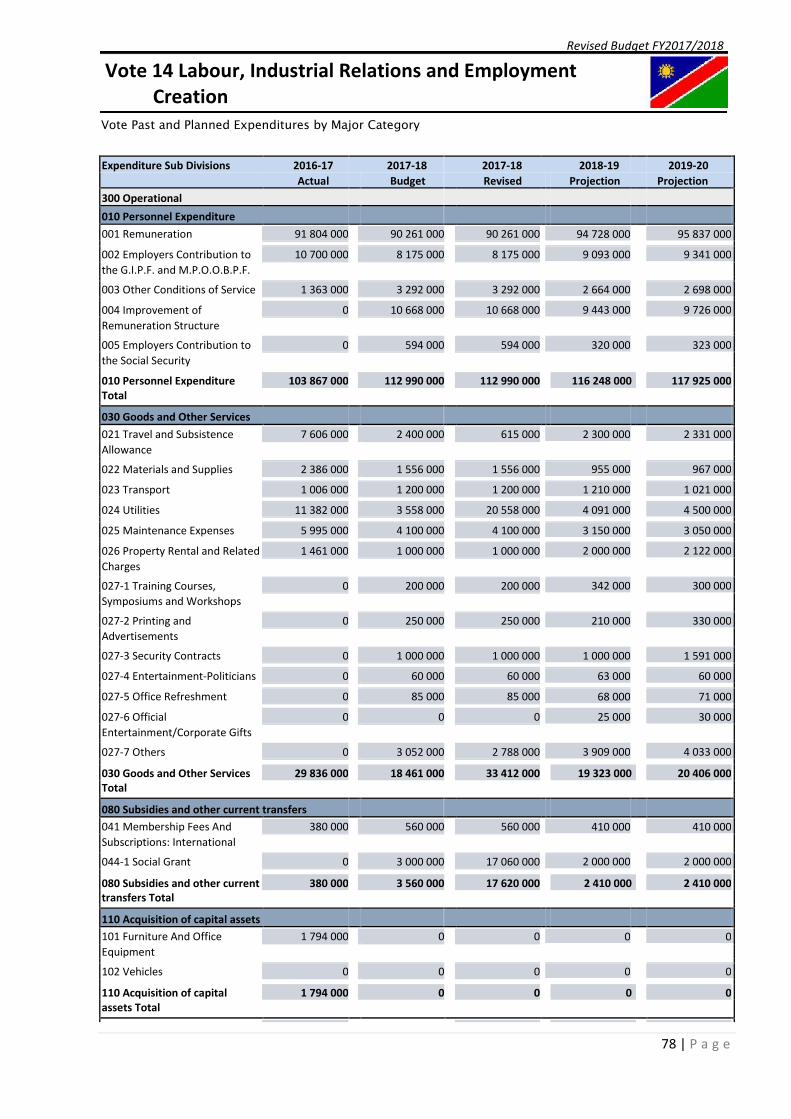
78 | P a g e
Revised Budget FY2017/2018
Vote 14 Labour, Industrial Relations and Employment
Creation Vote Past and Planned Expenditures by Major Category
Expenditure Sub Divisions 2016-17 2017-18 2017-18 2018-19 2019-20
Actual Budget Revised Projection Projection
300 Operational
010 Personnel Expenditure
001 Remuneration 91 804 000 90 261 000 90 261 000 94 728 000 95 837 000
002 Employers Contribution to 10 700 000 8 175 000 8 175 000 9 093 000 9 341 000
the G.I.P.F. and M.P.O.O.B.P.F.
003 Other Conditions of Service 1 363 000 3 292 000 3 292 000 2 664 000 2 698 000
004 Improvement of 0 10 668 000 10 668 000 9 443 000 9 726 000
Remuneration Structure
005 Employers Contribution to 0 594 000 594 000 320 000 323 000
the Social Security
010 Personnel Expenditure 103 867 000 112 990 000 112 990 000 116 248 000 117 925 000
Total
030 Goods and Other Services
021 Travel and Subsistence 7 606 000 2 400 000 615 000 2 300 000 2 331 000
Allowance
022 Materials and Supplies 2 386 000 1 556 000 1 556 000 955 000 967 000
023 Transport 1 006 000 1 200 000 1 200 000 1 210 000 1 021 000
024 Utilities 11 382 000 3 558 000 20 558 000 4 091 000 4 500 000
025 Maintenance Expenses 5 995 000 4 100 000 4 100 000 3 150 000 3 050 000
026 Property Rental and Related 1 461 000 1 000 000 1 000 000 2 000 000 2 122 000
Charges
027-1 Training Courses, 0 200 000 200 000 342 000 300 000
Symposiums and Workshops
027-2 Printing and 0 250 000 250 000 210 000 330 000
Advertisements
027-3 Security Contracts 0 1 000 000 1 000 000 1 000 000 1 591 000
027-4 Entertainment-Politicians 0 60 000 60 000 63 000 60 000
027-5 Office Refreshment 0 85 000 85 000 68 000 71 000
027-6 Official 0 0 0 25 000 30 000
Entertainment/Corporate Gifts
027-7 Others 0 3 052 000 2 788 000 3 909 000 4 033 000
030 Goods and Other Services 29 836 000 18 461 000 33 412 000 19 323 000 20 406 000
Total
080 Subsidies and other current transfers
041 Membership Fees And 380 000 560 000 560 000 410 000 410 000
Subscriptions: International
044-1 Social Grant 0 3 000 000 17 060 000 2 000 000 2 000 000
080 Subsidies and other current 380 000 3 560 000 17 620 000 2 410 000 2 410 000
transfers Total
110 Acquisition of capital assets
101 Furniture And Office 1 794 000 0 0 0 0
Equipment
102 Vehicles 0 0 0 0 0
110 Acquisition of capital 1 794 000 0 0 0 0
assets Total
300 Operational Budget Total 135 877 000
164 022 000
137 981 000
140 741 000
79 | P a g e
135 011 000
200 Development

80 | P a g e
Revised Budget FY2017/2018
Vote 14 Labour, Industrial Relations and Employment
Creation
Expenditure Sub Divisions 2016-17 2017-18 2017-18 2018-19 2019-20
Actual Budget Revised Projection Projection
110 Acquisition of capital assets
101 Furniture And Office 0 0 0 0 0
Equipment
105 Feasibility Studies, Design 71 000 100 000 100 000 0 0
and Supervision
107 Construction, Renovation 5 762 000 8 766 000 4 766 000 16 715 000 112 146 000
and Improvement
110 Acquisition of capital 5 833 000 8 866 000 4 866 000 16 715 000 112 146 000
assets Total
200 Development Budget Total 5 833 000
4 866 000
16 715 000
112 146 000
8 866 000
GRAND TOTAL 141 710 000 143 877 000 168 888 000 154 696 000 252 887 000

81 | P a g e
Revised Budget FY2017/2018
Vote 15 Mines and Energy
Vote Past and Planned Expenditures by Major Category
Expenditure Sub Divisions 2016-17 2017-18 2017-18 2018-19 2019-20
Actual Budget Revised Projection Projection
300 Operational
010 Personnel Expenditure
001 Remuneration 82 532 000 92 179 000 92 179 000 92 760 000 100 688 000
002 Employers Contribution to 9 458 000 7 617 000 8 153 000 7 825 000 7 840 000
the G.I.P.F. and M.P.O.O.B.P.F.
003 Other Conditions of Service 871 000 748 000 4 254 000 797 000 809 000
005 Employers Contribution to 0 244 000 244 000 258 000 267 000
the Social Security
010 Personnel Expenditure 92 861 000 100 788 000 104 830 000 101 640 000 109 604 000
Total
030 Goods and Other Services
021 Travel and Subsistence 4 319 000 1 420 000 3 420 000 1 850 000 2 700 000
Allowance
022 Materials and Supplies 560 000 1 000 000 1 500 000 1 452 000 1 700 000
023 Transport 2 754 000 1 595 000 2 595 000 3 574 000 3 500 000
024 Utilities 7 297 000 2 500 000 6 028 000 3 300 000 4 000 000
025 Maintenance Expenses 1 448 000 200 000 700 000 300 000 500 000
027-1 Training Courses, 158 000 0 0 0 0
Symposiums and Workshops
027-2 Printing and 0 0 0 0 0
Advertisements
027-3 Security Contracts 0 350 000 350 000 312 000 512 000
027-4 Entertainment-Politicians 0 48 000 48 000 48 000 48 000
027-5 Office Refreshment 77 000 0 0 0 0
027-6 Official 0 0 0 0 0
Entertainment/Corporate Gifts
027-7 Others 0 1 000 000 1 000 000 2 000 000 2 000 000
030 Goods and Other Services 16 613 000 8 113 000 15 641 000 12 836 000 14 960 000
Total
080 Subsidies and other current transfers
041 Membership Fees And 1 700 000 2 533 000 5 033 000 3 888 000 3 088 000
Subscriptions: International
042 Membership Fees And 1 000 10 000 10 000 0 0
Subscriptions: Domestic
043-1 Sub National Bodies 0 0 0 0 0
044-2 Support to N.P.O 0 6 538 000 14 355 000 0 0
045-1 S.O.E. 9 782 000 10 000 000 11 500 000 12 434 000 5 262 000
080 Subsidies and other current 11 483 000 19 081 000 30 898 000 16 322 000 8 350 000
transfers Total
110 Acquisition of capital assets
101 Furniture And Office 37 000 0 0 0 500 000
Equipment
110 Acquisition of capital 37 000 0 0 0 500 000
assets Total
300 Operational Budget Total 120 994 000
151 369 000
130 798 000
133 414 000
127 982 000

82 | P a g e
200 Development
030 Goods and Other Services
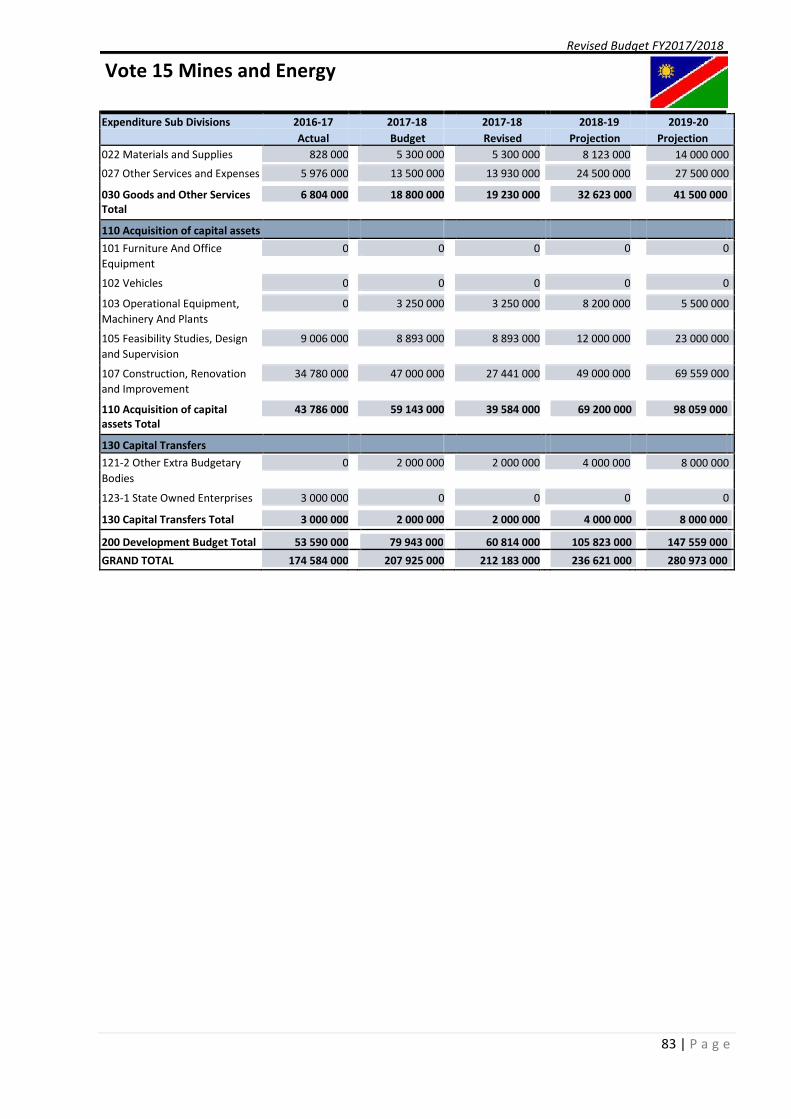
83 | P a g e
Revised Budget FY2017/2018
Vote 15 Mines and Energy
Expenditure Sub Divisions 2016-17 2017-18 2017-18 2018-19 2019-20
Actual Budget Revised Projection Projection
022 Materials and Supplies 828 000 5 300 000 5 300 000 8 123 000 14 000 000
027 Other Services and Expenses 5 976 000 13 500 000 13 930 000 24 500 000 27 500 000
030 Goods and Other Services 6 804 000 18 800 000 19 230 000 32 623 000 41 500 000
Total
110 Acquisition of capital assets
101 Furniture And Office 0 0 0 0 0
Equipment
102 Vehicles 0 0 0 0 0
103 Operational Equipment, 0 3 250 000 3 250 000 8 200 000 5 500 000
Machinery And Plants
105 Feasibility Studies, Design 9 006 000 8 893 000 8 893 000 12 000 000 23 000 000
and Supervision
107 Construction, Renovation 34 780 000 47 000 000 27 441 000 49 000 000 69 559 000
and Improvement
110 Acquisition of capital 43 786 000 59 143 000 39 584 000 69 200 000 98 059 000
assets Total
130 Capital Transfers
121-2 Other Extra Budgetary 0 2 000 000 2 000 000 4 000 000 8 000 000
Bodies
123-1 State Owned Enterprises 3 000 000 0 0 0 0
130 Capital Transfers Total 3 000 000 2 000 000 2 000 000 4 000 000 8 000 000
200 Development Budget Total 53 590 000
60 814 000
105 823 000
147 559 000
79 943 000
GRAND TOTAL 174 584 000 207 925 000 212 183 000 236 621 000 280 973 000

84 | P a g e
Revised Budget FY2017/2018
Vote 16 Justice
Vote Past and Planned Expenditures by Major Category
Expenditure Sub Divisions 2016-17 2017-18 2017-18 2018-19 2019-20
Actual Budget Revised Projection Projection 300 Operational
010 Personnel Expenditure
001 Remuneration 115 314 000 115 307 000 115 307 000 115 307 000 115 307 000
002 Employers Contribution to 12 616 000 12 979 000 12 979 000 12 979 000 12 979 000 the G.I.P.F. and M.P.O.O.B.P.F.
003 Other Conditions of Service 1 332 000 3 527 000 3 527 000 3 532 000 3 547 000
004 Improvement of 1 081 000 0 0 0 0 Remuneration Structure
005 Employers Contribution to 0 283 000 283 000 285 000 287 000 the Social Security
010 Personnel Expenditure 130 343 000 132 096 000 132 096 000 132 103 000 132 120 000 Total
030 Goods and Other Services
021 Travel and Subsistence 6 493 000 6 546 000 6 261 000 6 546 000 6 545 000 Allowance
022 Materials and Supplies 2 521 000 3 175 000 3 175 000 3 175 000 3 175 000
023 Transport 0 4 593 000 4 593 000 4 593 000 4 593 000
024 Utilities 22 325 000 16 060 000 16 060 000 16 048 000 16 048 000
025 Maintenance Expenses 1 003 000 2 079 000 2 079 000 2 079 000 2 079 000
026 Property Rental and Related 1 459 000 1 600 000 1 600 000 1 600 000 1 600 000 Charges
027-1 Training Courses, 0 229 000 229 000 250 000 250 000 Symposiums and Workshops
027-2 Printing and 0 1 825 000 1 825 000 1 825 000 1 825 000 Advertisements
027-3 Security Contracts 0 0 0 0 0
027-4 Entertainment-Politicians 0 87 000 87 000 86 000 86 000
027-5 Office Refreshment 0 55 000 55 000 105 000 105 000
027-6 Official 43 706 48 000 48 000 98 000 98 000 Entertainment/Corporate Gifts
027-7 Others 52 625 253 58 054 000 57 692 000 62 928 000 67 548 000
030 Goods and Other Services 86 469 959 94 351 000 93 704 000 99 333 000 103 952 000 Total
080 Subsidies and other current transfers
041 Membership Fees And 500 000 560 000 560 000 566 000 572 000 Subscriptions: International
042 Membership Fees And 59 000 79 000 79 000 79 000 79 000 Subscriptions: Domestic
044-1 Social Grant 0 15 423 000 19 188 000 0 0
080 Subsidies and other current 559 000 16 062 000 19 827 000 645 000 651 000 transfers Total
110 Acquisition of capital assets
101 Furniture And Office 968 000 0 0 0 0 Equipment
102 Vehicles 0 0 0 0 0
85 | P a g e
110 Acquisition of capital 968 000 0 0 0 0 assets Total

86 | P a g e
Revised Budget FY2017/2018
Vote 16 Justice
Expenditure Sub Divisions 2016-17 2017-18 2017-18 2018-19 2019-20
Actual Budget Revised Projection Projection
300 Operational Budget Total 218 339 959
245 627 000
232 081 000
236 723 000
242 509 000
200 Development
110 Acquisition of capital assets
104 Purchase of Buildings 0 66 500 000 66 500 000 0 65 860 000
105 Feasibility Studies, Design 18 416 000 8 440 000 8 440 000 38 050 000 0
and Supervision
107 Construction, Renovation 41 659 000 105 980 000 85 980 000 89 037 000 182 367 000
and Improvement
110 Acquisition of capital 60 075 000 180 920 000 160 920 000 127 087 000 248 227 000
assets Total
200 Development Budget Total 60 075 000
160 920 000
127 087 000
248 227 000
180 920 000
GRAND TOTAL 278 414 959 423 429 000 406 547 000 359 168 000 484 950 000

87 | P a g e
Revised Budget FY2017/2018
Vote 17 Urban and Rural Development
Vote Past and Planned Expenditures by Major Category
Expenditure Sub Divisions 2016-17 2017-18 2017-18 2018-19 2019-20
Actual Budget Revised Projection Projection 300 Operational
010 Personnel Expenditure
001 Remuneration 130 932 000 156 192 000 156 192 000 155 207 000 163 848 000
002 Employers Contribution to 13 002 000 15 025 000 15 025 000 15 398 000 15 861 000 the G.I.P.F. and M.P.O.O.B.P.F.
003 Other Conditions of Service 2 174 000 5 815 000 5 815 000 6 314 000 9 730 000
005 Employers Contribution to 0 361 000 361 000 345 000 557 000 the Social Security
010 Personnel Expenditure 146 108 000 177 393 000 177 393 000 177 264 000 189 996 000 Total
030 Goods and Other Services
021 Travel and Subsistence 13 814 000 10 971 000 10 471 000 15 048 000 16 082 000 Allowance
022 Materials and Supplies 3 542 000 4 159 000 4 159 000 6 311 000 6 327 000
023 Transport 4 933 000 7 506 000 7 506 000 8 242 000 8 987 000
024 Utilities 10 948 000 7 781 000 7 781 000 8 014 000 8 254 000
025 Maintenance Expenses 2 304 000 3 018 000 3 018 000 3 109 000 3 202 000
026 Property Rental and Related 2 745 000 3 377 000 3 377 000 4 242 000 3 774 000 Charges
027-1 Training Courses, 0 5 701 000 5 701 000 6 754 000 11 284 000 Symposiums and Workshops
027-2 Printing and 0 1 342 000 1 342 000 1 465 000 1 510 000 Advertisements
027-3 Security Contracts 0 3 780 000 3 780 000 5 893 000 5 910 000
027-4 Entertainment-Politicians 0 330 000 330 000 345 000 355 000
027-5 Office Refreshment 0 1 564 000 1 564 000 1 617 000 1 663 000
027-6 Official 90 897 152 000 152 000 156 000 160 000 Entertainment/Corporate Gifts
027-7 Others 52 984 357 35 673 000 34 673 000 61 461 000 65 064 000
030 Goods and Other Services 91 361 254 85 354 000 83 854 000 122 657 000 132 572 000 Total
080 Subsidies and other current transfers
041 Membership Fees And 421 000 1 049 000 480 332 000 1 128 000 1 162 000 Subscriptions: International
043-1 Sub National Bodies 988 937 718 912 897 000 912 897 000 914 383 000 982 234 000
044-1 Social Grant 481 043 140 178 694 000 178 694 000 102 065 000 85 622 000
044-2 Support to N.P.O 0 7 000 000 7 000 000 7 500 000 7 700 000
045-1 S.O.E. 117 562 000 37 525 000 37 525 000 55 686 000 63 531 000
045-2 Public And Departmental 0 0 0 50 000 000 0 Enterprises And Private
Industries
080 Subsidies and other current 1 587 963 858 1 137 165 000 1 616 448 000 1 130 762 000 1 140 249 000 transfers Total
110 Acquisition of capital assets
101 Furniture And Office 946 000 3 350 000 3 350 000 3 451 000 0
88 | P a g e
Equipment
102 Vehicles 0 0 0 0 0
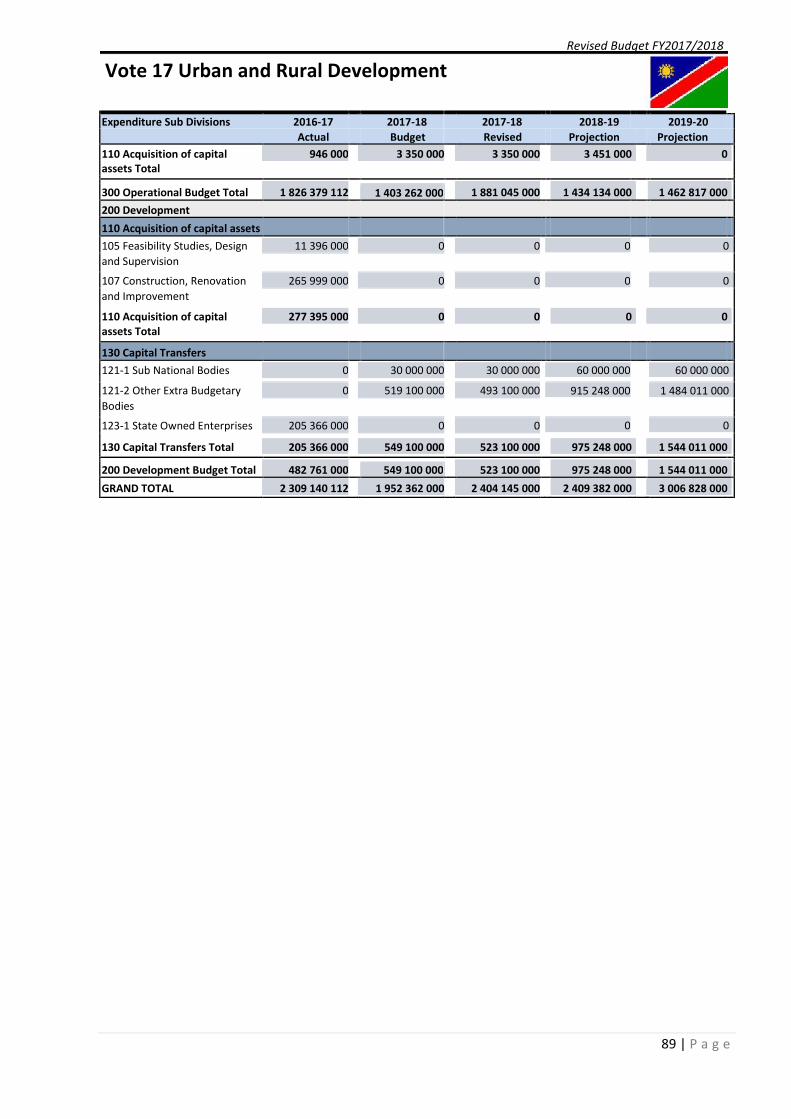
89 | P a g e
Revised Budget FY2017/2018
Vote 17 Urban and Rural Development
Expenditure Sub Divisions 2016-17 2017-18 2017-18 2018-19 2019-20
Actual Budget Revised Projection Projection
110 Acquisition of capital 946 000 3 350 000 3 350 000 3 451 000 0
assets Total
300 Operational Budget Total 1 826 379 112
1 881 045 000
1 434 134 000
1 462 817 000
1 403 262 000
200 Development
110 Acquisition of capital assets
105 Feasibility Studies, Design 11 396 000 0 0 0 0
and Supervision
107 Construction, Renovation 265 999 000 0 0 0 0
and Improvement
110 Acquisition of capital 277 395 000 0 0 0 0
assets Total
130 Capital Transfers
121-1 Sub National Bodies 0 30 000 000 30 000 000 60 000 000 60 000 000
121-2 Other Extra Budgetary 0 519 100 000 493 100 000 915 248 000 1 484 011 000
Bodies
123-1 State Owned Enterprises 205 366 000 0 0 0 0
130 Capital Transfers Total 205 366 000 549 100 000 523 100 000 975 248 000 1 544 011 000
200 Development Budget Total 482 761 000
523 100 000
975 248 000
1 544 011 000
549 100 000
GRAND TOTAL 2 309 140 112 1 952 362 000 2 404 145 000 2 409 382 000 3 006 828 000
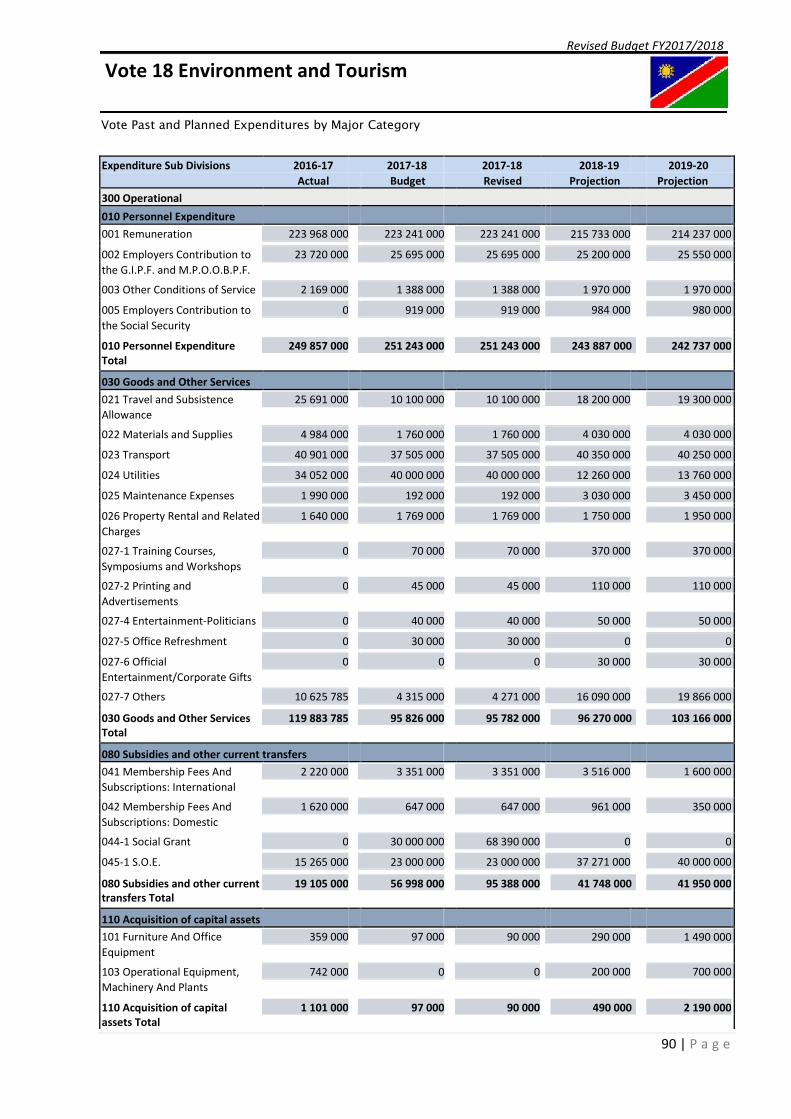
90 | P a g e
Revised Budget FY2017/2018
Vote 18 Environment and Tourism
Vote Past and Planned Expenditures by Major Category
Expenditure Sub Divisions 2016-17 2017-18 2017-18 2018-19 2019-20
Actual Budget Revised Projection Projection
300 Operational
010 Personnel Expenditure
001 Remuneration 223 968 000 223 241 000 223 241 000 215 733 000 214 237 000
002 Employers Contribution to 23 720 000 25 695 000 25 695 000 25 200 000 25 550 000
the G.I.P.F. and M.P.O.O.B.P.F.
003 Other Conditions of Service 2 169 000 1 388 000 1 388 000 1 970 000 1 970 000
005 Employers Contribution to 0 919 000 919 000 984 000 980 000
the Social Security
010 Personnel Expenditure 249 857 000 251 243 000 251 243 000 243 887 000 242 737 000
Total
030 Goods and Other Services
021 Travel and Subsistence 25 691 000 10 100 000 10 100 000 18 200 000 19 300 000
Allowance
022 Materials and Supplies 4 984 000 1 760 000 1 760 000 4 030 000 4 030 000
023 Transport 40 901 000 37 505 000 37 505 000 40 350 000 40 250 000
024 Utilities 34 052 000 40 000 000 40 000 000 12 260 000 13 760 000
025 Maintenance Expenses 1 990 000 192 000 192 000 3 030 000 3 450 000
026 Property Rental and Related 1 640 000 1 769 000 1 769 000 1 750 000 1 950 000
Charges
027-1 Training Courses, 0 70 000 70 000 370 000 370 000
Symposiums and Workshops
027-2 Printing and 0 45 000 45 000 110 000 110 000
Advertisements
027-4 Entertainment-Politicians 0 40 000 40 000 50 000 50 000
027-5 Office Refreshment 0 30 000 30 000 0 0
027-6 Official 0 0 0 30 000 30 000
Entertainment/Corporate Gifts
027-7 Others 10 625 785 4 315 000 4 271 000 16 090 000 19 866 000
030 Goods and Other Services 119 883 785 95 826 000 95 782 000 96 270 000 103 166 000
Total
080 Subsidies and other current transfers
041 Membership Fees And 2 220 000 3 351 000 3 351 000 3 516 000 1 600 000
Subscriptions: International
042 Membership Fees And 1 620 000 647 000 647 000 961 000 350 000
Subscriptions: Domestic
044-1 Social Grant 0 30 000 000 68 390 000 0 0
045-1 S.O.E. 15 265 000 23 000 000 23 000 000 37 271 000 40 000 000
080 Subsidies and other current 19 105 000 56 998 000 95 388 000 41 748 000 41 950 000
transfers Total
110 Acquisition of capital assets
101 Furniture And Office 359 000 97 000 90 000 290 000 1 490 000
Equipment
103 Operational Equipment, 742 000 0 0 200 000 700 000
Machinery And Plants
110 Acquisition of capital 1 101 000 97 000 90 000 490 000 2 190 000
assets Total

91 | P a g e
300 Operational Budget Total 389 946 785
442 503 000
382 395 000
390 043 000
404 164 000

92 | P a g e
Revised Budget FY2017/2018
Vote 18 Environment and Tourism
Expenditure Sub Divisions 2016-17 2017-18 2017-18 2018-19 2019-20
Actual Budget Revised Projection Projection
200 Development
030 Goods and Other Services
022 Materials and Supplies 0 0 0 0 0
027 Other Services and Expenses 811 563 0 0 0 0
030 Goods and Other Services 811 563 0 0 0 0
Total
110 Acquisition of capital assets
105 Feasibility Studies, Design 1 487 000 250 000 250 000 0 0
and Supervision
106 Purchase of Land and 1 700 000 0 0 0 0
Intangible Assets
107 Construction, Renovation 75 335 000 42 950 000 42 950 000 54 248 000 59 627 000
and Improvement
110 Acquisition of capital 78 522 000 43 200 000 43 200 000 54 248 000 59 627 000
assets Total
200 Development Budget Total 79 333 563
43 200 000
54 248 000
59 627 000
43 200 000
GRAND TOTAL 469 280 348 447 364 000 485 703 000 436 643 000 449 670 000
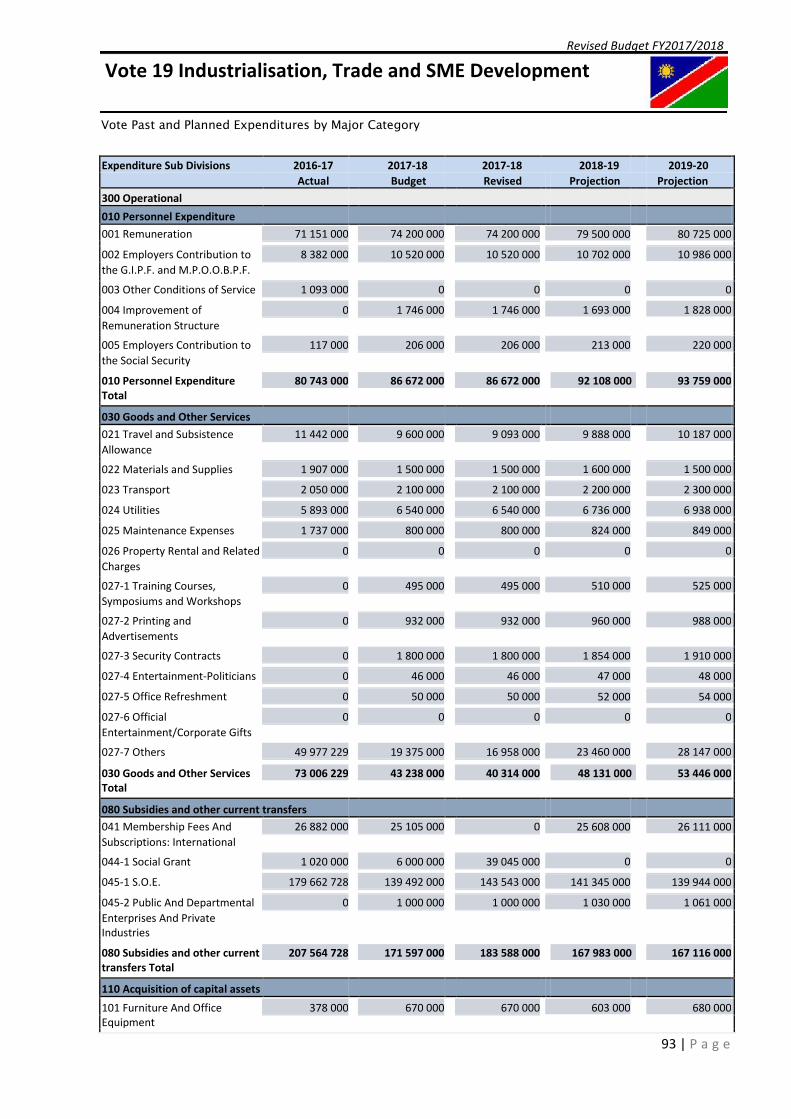
93 | P a g e
Revised Budget FY2017/2018
Vote 19 Industrialisation, Trade and SME Development
Vote Past and Planned Expenditures by Major Category
Expenditure Sub Divisions 2016-17 2017-18 2017-18 2018-19 2019-20
Actual Budget Revised Projection Projection 300 Operational
010 Personnel Expenditure
001 Remuneration 71 151 000 74 200 000 74 200 000 79 500 000 80 725 000
002 Employers Contribution to 8 382 000 10 520 000 10 520 000 10 702 000 10 986 000 the G.I.P.F. and M.P.O.O.B.P.F.
003 Other Conditions of Service 1 093 000 0 0 0 0
004 Improvement of 0 1 746 000 1 746 000 1 693 000 1 828 000 Remuneration Structure
005 Employers Contribution to 117 000 206 000 206 000 213 000 220 000 the Social Security
010 Personnel Expenditure 80 743 000 86 672 000 86 672 000 92 108 000 93 759 000 Total
030 Goods and Other Services
021 Travel and Subsistence 11 442 000 9 600 000 9 093 000 9 888 000 10 187 000 Allowance
022 Materials and Supplies 1 907 000 1 500 000 1 500 000 1 600 000 1 500 000
023 Transport 2 050 000 2 100 000 2 100 000 2 200 000 2 300 000
024 Utilities 5 893 000 6 540 000 6 540 000 6 736 000 6 938 000
025 Maintenance Expenses 1 737 000 800 000 800 000 824 000 849 000
026 Property Rental and Related 0 0 0 0 0 Charges
027-1 Training Courses, 0 495 000 495 000 510 000 525 000 Symposiums and Workshops
027-2 Printing and 0 932 000 932 000 960 000 988 000 Advertisements
027-3 Security Contracts 0 1 800 000 1 800 000 1 854 000 1 910 000
027-4 Entertainment-Politicians 0 46 000 46 000 47 000 48 000
027-5 Office Refreshment 0 50 000 50 000 52 000 54 000
027-6 Official 0 0 0 0 0 Entertainment/Corporate Gifts
027-7 Others 49 977 229 19 375 000 16 958 000 23 460 000 28 147 000
030 Goods and Other Services 73 006 229 43 238 000 40 314 000 48 131 000 53 446 000 Total
080 Subsidies and other current transfers
041 Membership Fees And 26 882 000 25 105 000 0 25 608 000 26 111 000 Subscriptions: International
044-1 Social Grant 1 020 000 6 000 000 39 045 000 0 0
045-1 S.O.E. 179 662 728 139 492 000 143 543 000 141 345 000 139 944 000
045-2 Public And Departmental 0 1 000 000 1 000 000 1 030 000 1 061 000 Enterprises And Private
Industries
080 Subsidies and other current 207 564 728 171 597 000 183 588 000 167 983 000 167 116 000 transfers Total
110 Acquisition of capital assets
101 Furniture And Office 378 000 670 000 670 000 603 000 680 000 Equipment

94 | P a g e
102 Vehicles 0 0 0 0 0

95 | P a g e
Revised Budget FY2017/2018
Vote 19 Industrialisation, Trade and SME Development
Expenditure Sub Divisions 2016-17 2017-18 2017-18 2018-19 2019-20
Actual Budget Revised Projection Projection
103 Operational Equipment, 0 0 0 0 0
Machinery And Plants
110 Acquisition of capital 378 000 670 000 670 000 603 000 680 000
assets Total
130 Capital Transfers
134 Abroad 0 28 000 000 28 000 000 21 000 000 11 000 000
130 Capital Transfers Total 0 28 000 000 28 000 000 21 000 000 11 000 000
300 Operational Budget Total 361 691 957
339 244 000
329 825 000
326 001 000
330 177 000
200 Development
110 Acquisition of capital assets
103 Operational Equipment, 12 450 000 21 000 000 20 000 000 41 000 000 35 000 000
Machinery And Plants
105 Feasibility Studies, Design 7 019 000 10 500 000 -3 000 000 10 000 000 15 000 000
and Supervision
106 Purchase of Land and 3 750 000 0 0 0 0
Intangible Assets
107 Construction, Renovation 142 166 000 273 542 000 218 946 000 167 545 000 148 571 000
and Improvement
110 Acquisition of capital 165 385 000 305 042 000 235 946 000 218 545 000 198 571 000
assets Total
200 Development Budget Total 165 385 000
235 946 000
218 545 000
198 571 000
305 042 000
GRAND TOTAL 527 076 957 635 219 000 575 190 000 548 370 000 524 572 000

96 | P a g e
Revised Budget FY2017/2018
Vote 20 Agriculture, Water and Forestry
Vote Past and Planned Expenditures by Major Category
Expenditure Sub Divisions 2016-17 2017-18 2017-18 2018-19 2019-20
Actual Budget Revised Projection Projection 300 Operational
010 Personnel Expenditure
001 Remuneration 641 177 000 684 705 000 684 705 000 650 006 000 650 006 000
002 Employers Contribution to 65 344 000 69 300 000 69 300 000 72 713 000 72 713 000 the G.I.P.F. and M.P.O.O.B.P.F.
003 Other Conditions of Service 13 984 000 10 795 000 10 795 000 11 012 000 11 012 000
005 Employers Contribution to 0 2 665 000 2 665 000 2 736 000 2 736 000 the Social Security
010 Personnel Expenditure 720 505 000 767 465 000 767 465 000 736 467 000 736 467 000 Total
030 Goods and Other Services
021 Travel and Subsistence 33 889 000 23 899 000 23 899 000 29 000 000 28 994 000 Allowance
022 Materials and Supplies 13 290 000 15 190 000 15 190 000 18 259 000 22 259 000
023 Transport 49 549 000 41 290 000 41 290 000 37 518 000 41 518 000
024 Utilities 77 387 000 48 047 000 48 047 000 42 835 000 43 296 000
025 Maintenance Expenses 2 579 000 3 825 000 3 825 000 5 513 000 5 513 000
026 Property Rental and Related 168 000 180 000 180 000 180 000 180 000 Charges
027-1 Training Courses, 0 1 700 000 1 700 000 9 666 000 11 667 000 Symposiums and Workshops
027-2 Printing and 0 930 000 930 000 3 401 000 3 401 000 Advertisements
027-3 Security Contracts 0 20 801 000 20 801 000 13 104 000 13 104 000
027-4 Entertainment-Politicians 0 0 0 93 000 93 000
027-5 Office Refreshment 0 177 000 177 000 155 000 155 000
027-6 Official 20 906 462 100 000 100 000 116 000 116 000 Entertainment/Corporate Gifts
027-7 Others 21 661 690 5 225 000 5 225 000 15 627 000 15 627 000
030 Goods and Other Services 219 430 152 161 364 000 161 364 000 175 467 000 185 923 000 Total
080 Subsidies and other current transfers
041 Membership Fees And 2 568 000 6 022 000 6 022 000 7 139 000 9 139 000 Subscriptions: International
042 Membership Fees And 87 400 1 226 000 1 226 000 1 547 000 1 547 000 Subscriptions: Domestic
043-1 Sub National Bodies 52 349 069 40 000 000 40 000 000 48 415 000 46 179 000
044-1 Social Grant 32 869 674 23 396 000 220 790 000 19 396 000 18 077 000
044-2 Support to N.P.O 0 300 000 000 300 000 000 0 0
045-1 S.O.E. 33 970 000 5 500 000 5 500 000 8 429 000 16 041 000
080 Subsidies and other current 121 844 143 376 144 000 573 538 000 84 926 000 90 983 000 transfers Total
110 Acquisition of capital assets
101 Furniture And Office 1 490 000 625 000 625 000 9 302 000 9 302 000 Equipment

97 | P a g e
102 Vehicles 5 000 000 0 0 6 444 000 6 444 000

98 | P a g e
Revised Budget FY2017/2018
Vote 20 Agriculture, Water and Forestry
Expenditure Sub Divisions 2016-17 2017-18 2017-18 2018-19 2019-20
Actual Budget Revised Projection Projection
103 Operational Equipment, 896 000 395 000 395 000 3 369 000 3 369 000
Machinery And Plants
110 Acquisition of capital 7 386 000 1 020 000 1 020 000 19 115 000 19 115 000
assets Total
130 Capital Transfers
121-1 Sub National Bodies 0 0 0 4 050 000 4 050 000
122-1 Social Grant 0 0 0 4 050 000 4 050 000
123-1 SOE 0 0 0 0 4 050 000
134 Abroad 0 0 0 4 050 000 4 050 000
130 Capital Transfers Total 0 0 0 12 150 000 16 200 000
300 Operational Budget Total 1 069 165 295
1 503 387 000
1 028 125 000
1 048 688 000
1 305 993 000
200 Development
030 Goods and Other Services
022 Materials and Supplies 18 725 000 20 768 000 17 768 000 52 056 000 88 517 000
027 Other Services and Expenses 43 214 489 73 474 000 71 474 000 105 876 000 139 465 000
030 Goods and Other Services 61 939 489 94 242 000 89 242 000 157 932 000 227 982 000
Total
110 Acquisition of capital assets
101 Furniture And Office 1 579 000 0 0 0 0
Equipment
102 Vehicles 0 4 362 000 4 362 000 1 500 000 6 803 000
103 Operational Equipment, 20 151 000 48 292 000 40 312 000 38 446 000 69 355 000
Machinery And Plants
105 Feasibility Studies, Design 51 326 000 0 0 0 0
and Supervision
106 Purchase of Land and 0 217 000 217 000 499 000 4 217 000
Intangible Assets
107 Construction, Renovation 1 334 472 000 733 298 000 731 298 000 740 531 000 898 420 000
and Improvement
110 Acquisition of capital 1 407 528 000 786 169 000 776 189 000 780 976 000 978 795 000
assets Total
200 Development Budget Total 1 469 467 489
865 431 000
938 908 000
1 206 777 000
880 411 000
GRAND TOTAL 2 538 632 784 2 186 404 000 2 368 818 000 1 967 033 000 2 255 465 000

99 | P a g e
Revised Budget FY2017/2018
Vote 21 Judiciary
Vote Past and Planned Expenditures by Major Category
Expenditure Sub Divisions 2016-17 2017-18 2017-18 2018-19 2019-20
Actual Budget Revised Projection Projection 300 Operational
010 Personnel Expenditure
001 Remuneration 0 227 734 000 227 734 000 230 450 000 231 105 000
002 Employers Contribution to 0 26 550 000 26 550 000 26 986 000 28 261 000 the G.I.P.F. and M.P.O.O.B.P.F.
003 Other Conditions of Service 0 5 113 000 5 113 000 5 341 000 5 965 000
004 Improvement of 0 2 340 000 2 340 000 0 0 Remuneration Structure
005 Employers Contribution to 0 565 000 565 000 579 000 595 000 the Social Security
010 Personnel Expenditure 0 262 302 000 262 302 000 263 356 000 265 926 000 Total
030 Goods and Other Services
021 Travel and Subsistence 0 10 050 000 9 950 000 10 950 000 11 600 000 Allowance
022 Materials and Supplies 0 4 878 000 4 878 000 5 770 000 5 830 000
023 Transport 0 4 500 000 4 500 000 8 200 000 8 300 000
024 Utilities 0 15 500 000 15 500 000 16 500 000 16 700 000
025 Maintenance Expenses 0 500 000 500 000 573 000 600 000
026 Property Rental and Related 0 8 000 000 8 000 000 0 0 Charges
027-1 Training Courses, 99 259 2 710 000 2 628 000 3 070 000 3 359 000 Symposiums and Workshops
027-2 Printing and 1 664 743 360 000 360 000 460 000 560 000 Advertisements
027-3 Security Contracts 0 600 000 600 000 650 000 650 000
027-4 Entertainment-Politicians 0 30 000 30 000 30 000 30 000
027-5 Office Refreshment 14 355 846 70 000 70 000 70 000 100 000
027-6 Official 0 186 000 186 000 300 000 350 000 Entertainment/Corporate Gifts
027-7 Others 0 32 546 000 32 546 000 39 320 000 41 690 000
030 Goods and Other Services 16 119 848 79 930 000 79 748 000 85 893 000 89 769 000 Total
080 Subsidies and other current transfers
041 Membership Fees And 205 936 390 000 26 192 000 422 000 485 000 Subscriptions: International
042 Membership Fees And 78 547 45 000 45 000 45 000 50 000 Subscriptions: Domestic
044-1 Social Grant 0 500 000 500 000 1 000 000 1 500 000
044-2 Support to N.P.O 0 55 801 000 55 801 000 0 0
080 Subsidies and other current 284 483 56 736 000 82 538 000 1 467 000 2 035 000 transfers Total
110 Acquisition of capital assets
101 Furniture And Office 0 0 0 0 0 Equipment

100 | P a g e
102 Vehicles 0 0 0 0 0

101 | P a g e
Revised Budget FY2017/2018
Vote 21 Judiciary
Expenditure Sub Divisions 2016-17 2017-18 2017-18 2018-19 2019-20
Actual Budget Revised Projection Projection
110 Acquisition of capital 0 0 0 0 0
assets Total
300 Operational Budget Total 16 404 331
424 588 000
350 716 000
357 730 000
398 968 000
GRAND TOTAL 16 404 331 398 968 000 424 588 000 350 716 000 357 730 000

102 | P a g e
Revised Budget FY2017/2018
Vote 22 Fisheries and Marine Resources
Vote Past and Planned Expenditures by Major Category
Expenditure Sub Divisions 2016-17 2017-18 2017-18 2018-19 2019-20
Actual Budget Revised Projection Projection 300 Operational
010 Personnel Expenditure
001 Remuneration 156 187 000 136 683 000 136 683 000 138 882 000 141 189 000
002 Employers Contribution to 14 560 000 22 860 000 22 860 000 23 324 000 18 188 000 the G.I.P.F. and M.P.O.O.B.P.F.
003 Other Conditions of Service 1 218 000 2 324 000 2 324 000 1 987 000 2 041 000
004 Improvement of 0 0 0 0 0 Remuneration Structure
005 Employers Contribution to 0 992 000 992 000 992 000 948 000 the Social Security
010 Personnel Expenditure 171 965 000 162 859 000 162 859 000 165 185 000 162 366 000 Total
030 Goods and Other Services
021 Travel and Subsistence 7 531 000 9 084 000 9 084 000 8 563 000 8 659 000 Allowance
022 Materials and Supplies 4 658 000 15 473 000 15 473 000 16 447 000 16 929 000
023 Transport 5 320 000 4 511 000 4 511 000 4 221 000 4 658 000
024 Utilities 16 970 000 13 290 000 13 290 000 11 344 000 14 099 000
025 Maintenance Expenses 9 759 000 10 173 000 10 173 000 10 791 000 11 681 000
026 Property Rental and Related 138 000 154 000 154 000 135 000 156 000 Charges
027-1 Training Courses, 0 1 135 000 1 135 000 1 247 000 1 295 000 Symposiums and Workshops
027-2 Printing and 0 233 000 233 000 199 000 281 000 Advertisements
027-3 Security Contracts 0 1 935 000 1 935 000 1 944 000 2 636 000
027-4 Entertainment-Politicians 0 34 000 34 000 30 000 35 000
027-5 Office Refreshment 0 39 000 39 000 26 000 32 000
027-6 Official 96 074 54 000 54 000 52 000 58 000 Entertainment/Corporate Gifts
027-7 Others 8 240 237 7 574 000 7 574 000 7 315 000 9 089 000
030 Goods and Other Services 52 712 311 63 689 000 63 689 000 62 314 000 69 608 000 Total
080 Subsidies and other current transfers
041 Membership Fees And 458 000 2 158 000 2 158 000 2 530 000 2 164 000 Subscriptions: International
042 Membership Fees And 953 000 1 088 000 1 088 000 922 000 1 165 000 Subscriptions: Domestic
043-2 Other Extra Budgetary 11 749 200 7 603 000 7 603 000 12 049 000 8 638 000 Bodies
044-1 Social Grant 0 32 000 5 146 000 46 000 32 000
045-2 Public And Departmental 0 31 000 31 000 30 000 32 000 Enterprises And Private
Industries
080 Subsidies and other current 13 160 200 10 912 000 16 026 000 15 577 000 12 031 000 transfers Total
103 | P a g e
110 Acquisition of capital assets

104 | P a g e
Revised Budget FY2017/2018
Vote 22 Fisheries and Marine Resources
Expenditure Sub Divisions 2016-17 2017-18 2017-18 2018-19 2019-20
Actual Budget Revised Projection Projection
101 Furniture And Office 0 1 203 000 1 203 000 768 000 4 775 000
Equipment
103 Operational Equipment, 75 000 364 000 364 000 441 000 391 000
Machinery And Plants
110 Acquisition of capital 75 000 1 567 000 1 567 000 1 209 000 5 166 000
assets Total
300 Operational Budget Total 237 912 511
244 141 000
244 285 000
249 171 000
239 027 000
200 Development
110 Acquisition of capital assets
107 Construction, Renovation 20 860 000 57 585 000 54 657 000 22 248 000 25 620 000
and Improvement
110 Acquisition of capital 20 860 000 57 585 000 54 657 000 22 248 000 25 620 000
assets Total
200 Development Budget Total 20 860 000
54 657 000
22 248 000
25 620 000
57 585 000
GRAND TOTAL 258 772 511 296 612 000 298 798 000 266 533 000 274 791 000
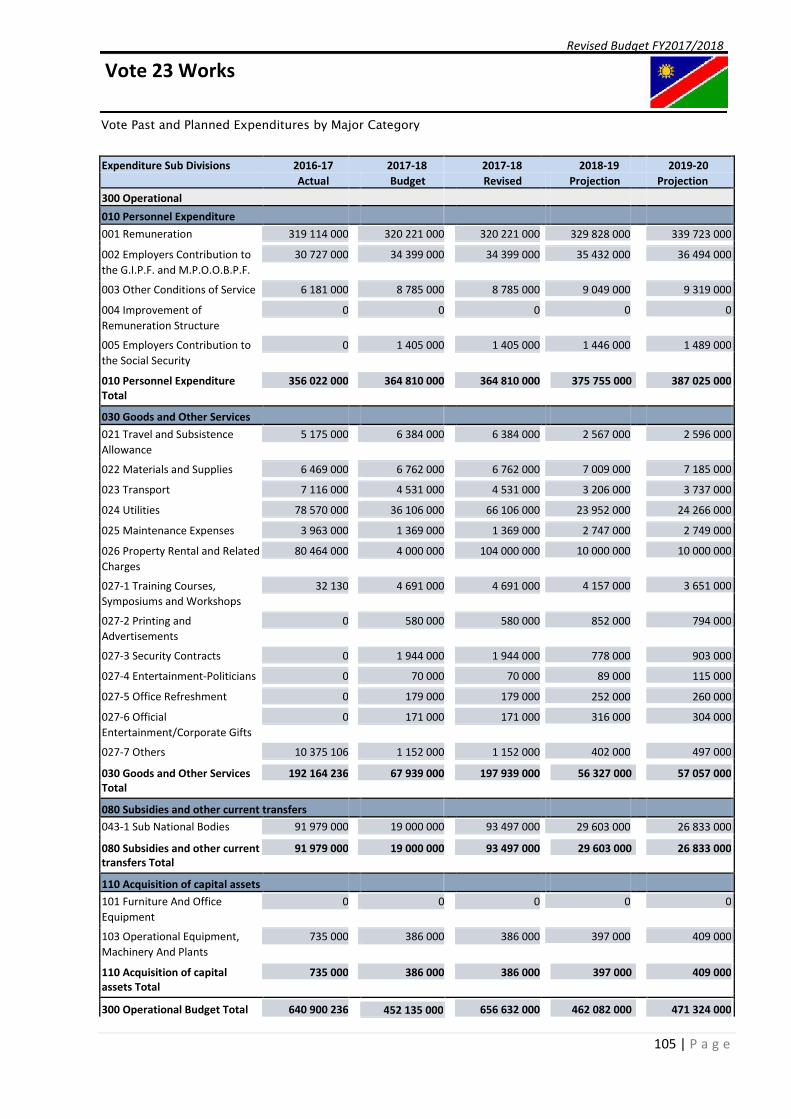
105 | P a g e
Revised Budget FY2017/2018
Vote 23 Works
Vote Past and Planned Expenditures by Major Category
Expenditure Sub Divisions 2016-17 2017-18 2017-18 2018-19 2019-20
Actual Budget Revised Projection Projection
300 Operational
010 Personnel Expenditure
001 Remuneration 319 114 000 320 221 000 320 221 000 329 828 000 339 723 000
002 Employers Contribution to 30 727 000 34 399 000 34 399 000 35 432 000 36 494 000
the G.I.P.F. and M.P.O.O.B.P.F.
003 Other Conditions of Service 6 181 000 8 785 000 8 785 000 9 049 000 9 319 000
004 Improvement of 0 0 0 0 0
Remuneration Structure
005 Employers Contribution to 0 1 405 000 1 405 000 1 446 000 1 489 000
the Social Security
010 Personnel Expenditure 356 022 000 364 810 000 364 810 000 375 755 000 387 025 000
Total
030 Goods and Other Services
021 Travel and Subsistence 5 175 000 6 384 000 6 384 000 2 567 000 2 596 000
Allowance
022 Materials and Supplies 6 469 000 6 762 000 6 762 000 7 009 000 7 185 000
023 Transport 7 116 000 4 531 000 4 531 000 3 206 000 3 737 000
024 Utilities 78 570 000 36 106 000 66 106 000 23 952 000 24 266 000
025 Maintenance Expenses 3 963 000 1 369 000 1 369 000 2 747 000 2 749 000
026 Property Rental and Related 80 464 000 4 000 000 104 000 000 10 000 000 10 000 000
Charges
027-1 Training Courses, 32 130 4 691 000 4 691 000 4 157 000 3 651 000
Symposiums and Workshops
027-2 Printing and 0 580 000 580 000 852 000 794 000
Advertisements
027-3 Security Contracts 0 1 944 000 1 944 000 778 000 903 000
027-4 Entertainment-Politicians 0 70 000 70 000 89 000 115 000
027-5 Office Refreshment 0 179 000 179 000 252 000 260 000
027-6 Official 0 171 000 171 000 316 000 304 000
Entertainment/Corporate Gifts
027-7 Others 10 375 106 1 152 000 1 152 000 402 000 497 000
030 Goods and Other Services 192 164 236 67 939 000 197 939 000 56 327 000 57 057 000
Total
080 Subsidies and other current transfers
043-1 Sub National Bodies 91 979 000 19 000 000 93 497 000 29 603 000 26 833 000
080 Subsidies and other current 91 979 000 19 000 000 93 497 000 29 603 000 26 833 000
transfers Total
110 Acquisition of capital assets
101 Furniture And Office 0 0 0 0 0
Equipment
103 Operational Equipment, 735 000 386 000 386 000 397 000 409 000
Machinery And Plants
110 Acquisition of capital 735 000 386 000 386 000 397 000 409 000
assets Total
300 Operational Budget Total 640 900 236
656 632 000
462 082 000
471 324 000
452 135 000

106 | P a g e
200 Development
110 Acquisition of capital assets

107 | P a g e
Revised Budget FY2017/2018
Vote 23 Works
Expenditure Sub Divisions 2016-17 2017-18 2017-18 2018-19 2019-20
Actual Budget Revised Projection Projection
101 Furniture And Office 644 000 0 0 0 0
Equipment
103 Operational Equipment, 297 000 0 0 0 0
Machinery And Plants
105 Feasibility Studies, Design 725 000 0 -1 379 000 0 0
and Supervision
107 Construction, Renovation 11 920 000 24 941 000 22 537 000 23 387 000 12 099 000
and Improvement
110 Acquisition of capital 13 586 000 24 941 000 21 158 000 23 387 000 12 099 000
assets Total
200 Development Budget Total 13 586 000
21 158 000
23 387 000
12 099 000
24 941 000
GRAND TOTAL 654 486 236 477 076 000 677 790 000 485 469 000 483 423 000
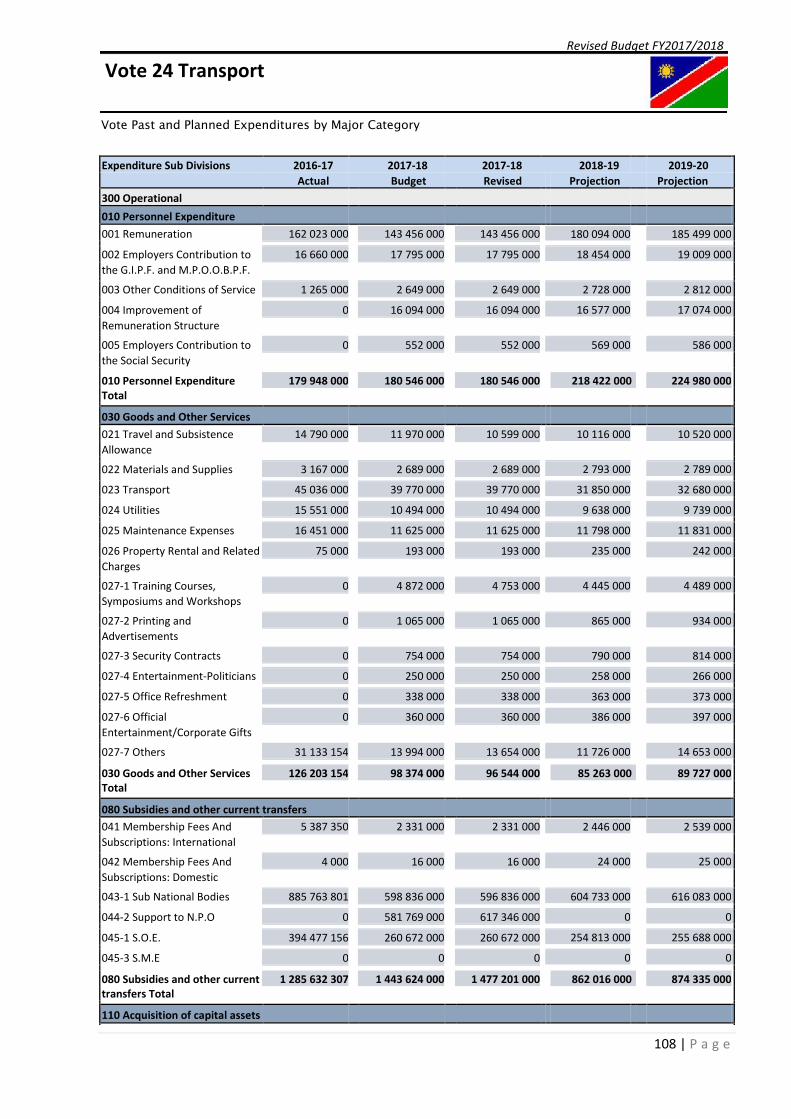
108 | P a g e
Revised Budget FY2017/2018
Vote 24 Transport
Vote Past and Planned Expenditures by Major Category
Expenditure Sub Divisions 2016-17 2017-18 2017-18 2018-19 2019-20
Actual Budget Revised Projection Projection 300 Operational
010 Personnel Expenditure
001 Remuneration 162 023 000 143 456 000 143 456 000 180 094 000 185 499 000
002 Employers Contribution to 16 660 000 17 795 000 17 795 000 18 454 000 19 009 000 the G.I.P.F. and M.P.O.O.B.P.F.
003 Other Conditions of Service 1 265 000 2 649 000 2 649 000 2 728 000 2 812 000
004 Improvement of 0 16 094 000 16 094 000 16 577 000 17 074 000 Remuneration Structure
005 Employers Contribution to 0 552 000 552 000 569 000 586 000 the Social Security
010 Personnel Expenditure 179 948 000 180 546 000 180 546 000 218 422 000 224 980 000 Total
030 Goods and Other Services
021 Travel and Subsistence 14 790 000 11 970 000 10 599 000 10 116 000 10 520 000 Allowance
022 Materials and Supplies 3 167 000 2 689 000 2 689 000 2 793 000 2 789 000
023 Transport 45 036 000 39 770 000 39 770 000 31 850 000 32 680 000
024 Utilities 15 551 000 10 494 000 10 494 000 9 638 000 9 739 000
025 Maintenance Expenses 16 451 000 11 625 000 11 625 000 11 798 000 11 831 000
026 Property Rental and Related 75 000 193 000 193 000 235 000 242 000 Charges
027-1 Training Courses, 0 4 872 000 4 753 000 4 445 000 4 489 000 Symposiums and Workshops
027-2 Printing and 0 1 065 000 1 065 000 865 000 934 000 Advertisements
027-3 Security Contracts 0 754 000 754 000 790 000 814 000
027-4 Entertainment-Politicians 0 250 000 250 000 258 000 266 000
027-5 Office Refreshment 0 338 000 338 000 363 000 373 000
027-6 Official 0 360 000 360 000 386 000 397 000 Entertainment/Corporate Gifts
027-7 Others 31 133 154 13 994 000 13 654 000 11 726 000 14 653 000
030 Goods and Other Services 126 203 154 98 374 000 96 544 000 85 263 000 89 727 000 Total
080 Subsidies and other current transfers
041 Membership Fees And 5 387 350 2 331 000 2 331 000 2 446 000 2 539 000 Subscriptions: International
042 Membership Fees And 4 000 16 000 16 000 24 000 25 000 Subscriptions: Domestic
043-1 Sub National Bodies 885 763 801 598 836 000 596 836 000 604 733 000 616 083 000
044-2 Support to N.P.O 0 581 769 000 617 346 000 0 0
045-1 S.O.E. 394 477 156 260 672 000 260 672 000 254 813 000 255 688 000
045-3 S.M.E 0 0 0 0 0
080 Subsidies and other current 1 285 632 307 1 443 624 000 1 477 201 000 862 016 000 874 335 000 transfers Total
110 Acquisition of capital assets

109 | P a g e
101 Furniture And Office 0 0 0 0 0 Equipment

110 | P a g e
Revised Budget FY2017/2018
Vote 24 Transport
Expenditure Sub Divisions 2016-17 2017-18 2017-18 2018-19 2019-20
Actual Budget Revised Projection Projection
102 Vehicles 0 0 0 0 0
103 Operational Equipment, 2 569 000 1 450 000 1 450 000 1 653 000 1 659 000
Machinery And Plants
110 Acquisition of capital 2 569 000 1 450 000 1 450 000 1 653 000 1 659 000
assets Total
130 Capital Transfers
134 Abroad 0 0 0 72 056 000 50 157 000
130 Capital Transfers Total 0 0 0 72 056 000 50 157 000
300 Operational Budget Total 1 594 352 461
1 755 741 000
1 239 410 000
1 240 858 000
1 723 994 000
200 Development
030 Goods and Other Services
022 Materials and Supplies 103 798 000 523 728 000 523 728 000 65 034 000 50 105 000
027 Other Services and Expenses 0 0 0 1 500 000 1 500 000
030 Goods and Other Services 103 798 000 523 728 000 523 728 000 66 534 000 51 605 000
Total
110 Acquisition of capital assets
101 Furniture And Office 895 000 4 400 000 4 400 000 1 105 000 1 400 000
Equipment
103 Operational Equipment, 72 343 000 70 940 000 70 940 000 37 125 000 22 970 000
Machinery And Plants
105 Feasibility Studies, Design 233 109 000 210 683 000 210 683 000 555 741 000 353 841 000
and Supervision
106 Purchase of Land and 629 000 0 0 10 500 000 0
Intangible Assets
107 Construction, Renovation 1 396 211 000 1 179 349 000 1 129 349 000 1 514 966 000 1 259 133 000
and Improvement
110 Acquisition of capital 1 703 187 000 1 465 372 000 1 415 372 000 2 119 437 000 1 637 344 000
assets Total
130 Capital Transfers
121-2 Other Extra Budgetary 0 10 900 000 10 900 000 10 000 000 10 000 000
Bodies
130 Capital Transfers Total 0 10 900 000 10 900 000 10 000 000 10 000 000
200 Development Budget Total 1 806 985 000
1 950 000 000
2 195 971 000
1 698 949 000
2 000 000 000
GRAND TOTAL 3 401 337 461 3 723 994 000 3 705 741 000 3 435 381 000 2 939 807 000
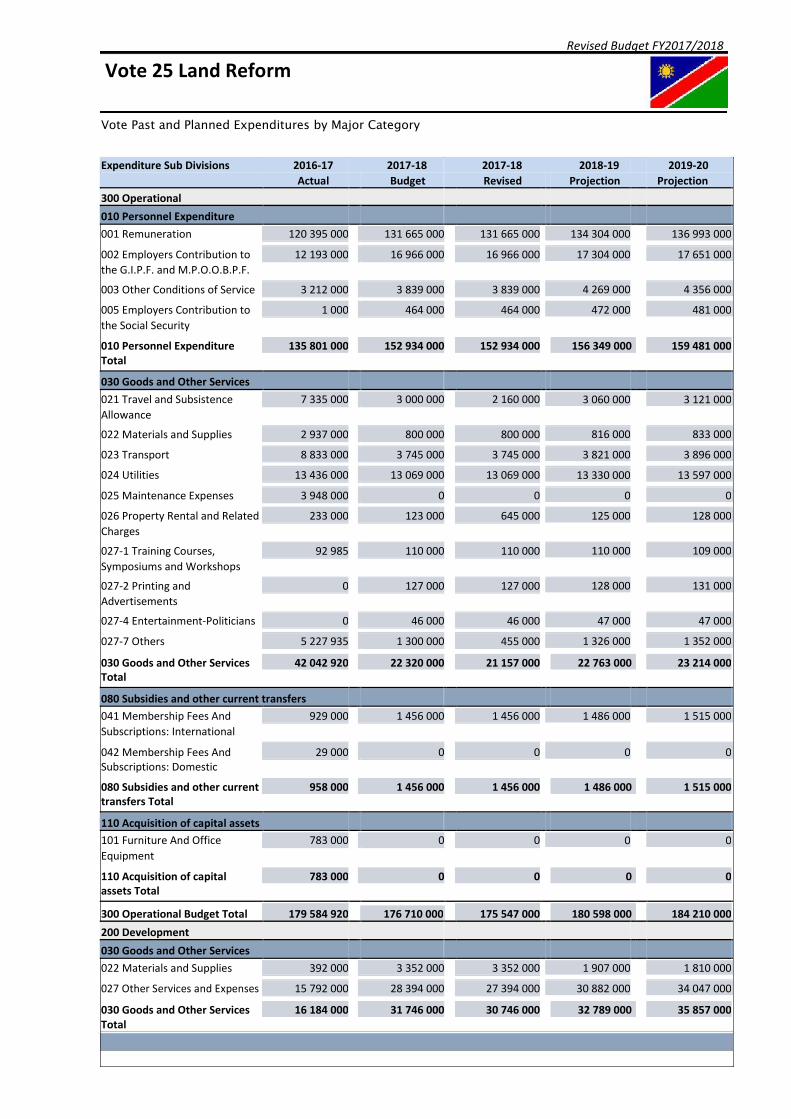
111 | P a g e
Revised Budget FY2017/2018
Vote 25 Land Reform
Vote Past and Planned Expenditures by Major Category
Expenditure Sub Divisions 2016-17 2017-18 2017-18 2018-19 2019-20
Actual Budget Revised Projection Projection
300 Operational
010 Personnel Expenditure
001 Remuneration 120 395 000 131 665 000 131 665 000 134 304 000 136 993 000
002 Employers Contribution to 12 193 000 16 966 000 16 966 000 17 304 000 17 651 000
the G.I.P.F. and M.P.O.O.B.P.F.
003 Other Conditions of Service 3 212 000 3 839 000 3 839 000 4 269 000 4 356 000
005 Employers Contribution to 1 000 464 000 464 000 472 000 481 000
the Social Security
010 Personnel Expenditure 135 801 000 152 934 000 152 934 000 156 349 000 159 481 000
Total
030 Goods and Other Services
021 Travel and Subsistence 7 335 000 3 000 000 2 160 000 3 060 000 3 121 000
Allowance
022 Materials and Supplies 2 937 000 800 000 800 000 816 000 833 000
023 Transport 8 833 000 3 745 000 3 745 000 3 821 000 3 896 000
024 Utilities 13 436 000 13 069 000 13 069 000 13 330 000 13 597 000
025 Maintenance Expenses 3 948 000 0 0 0 0
026 Property Rental and Related 233 000 123 000 645 000 125 000 128 000
Charges
027-1 Training Courses, 92 985 110 000 110 000 110 000 109 000
Symposiums and Workshops
027-2 Printing and 0 127 000 127 000 128 000 131 000
Advertisements
027-4 Entertainment-Politicians 0 46 000 46 000 47 000 47 000
027-7 Others 5 227 935 1 300 000 455 000 1 326 000 1 352 000
030 Goods and Other Services 42 042 920 22 320 000 21 157 000 22 763 000 23 214 000
Total
080 Subsidies and other current transfers
041 Membership Fees And 929 000 1 456 000 1 456 000 1 486 000 1 515 000
Subscriptions: International
042 Membership Fees And 29 000 0 0 0 0
Subscriptions: Domestic
080 Subsidies and other current 958 000 1 456 000 1 456 000 1 486 000 1 515 000
transfers Total
110 Acquisition of capital assets
101 Furniture And Office 783 000 0 0 0 0
Equipment
110 Acquisition of capital 783 000 0 0 0 0
assets Total
300 Operational Budget Total 179 584 920
175 547 000
180 598 000
184 210 000
176 710 000
200 Development
030 Goods and Other Services
022 Materials and Supplies 392 000 3 352 000 3 352 000 1 907 000 1 810 000
027 Other Services and Expenses 15 792 000 28 394 000 27 394 000 30 882 000 34 047 000
030 Goods and Other Services 16 184 000 31 746 000 30 746 000 32 789 000 35 857 000
Total

112 | P a g e
110 Acquisition of capital assets
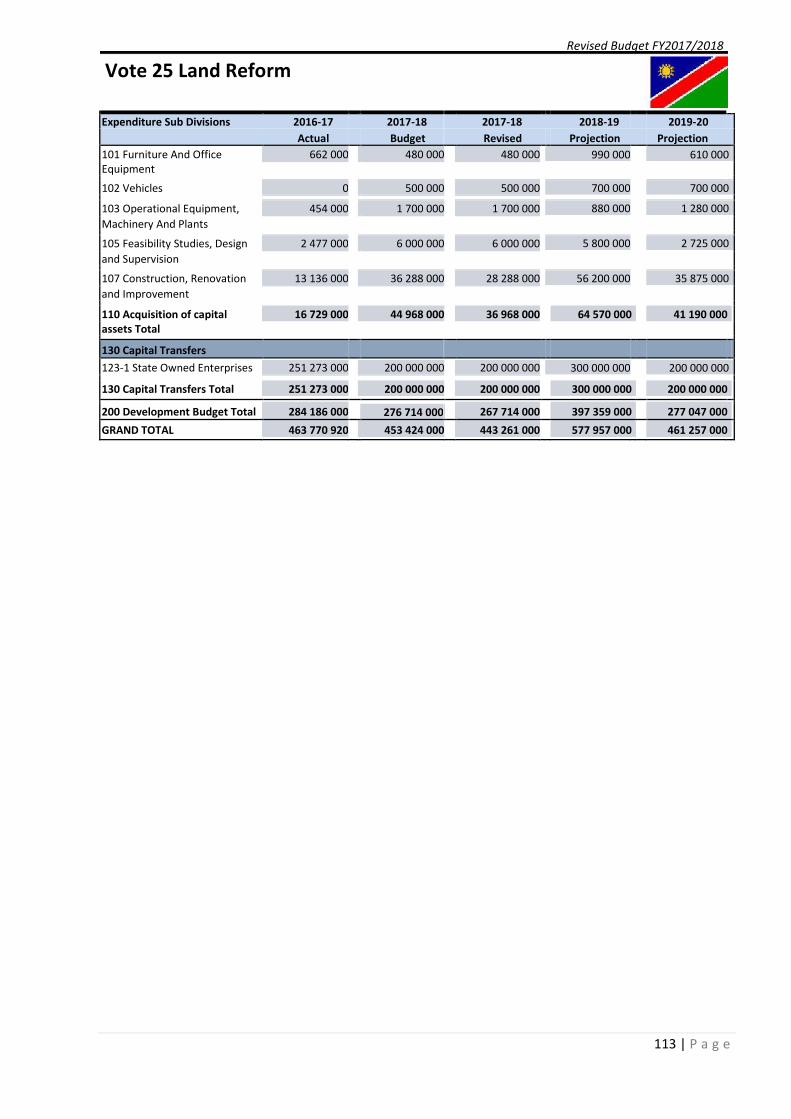
113 | P a g e
Revised Budget FY2017/2018
Vote 25 Land Reform
Expenditure Sub Divisions 2016-17 2017-18 2017-18 2018-19 2019-20
Actual Budget Revised Projection Projection
101 Furniture And Office 662 000 480 000 480 000 990 000 610 000
Equipment
102 Vehicles 0 500 000 500 000 700 000 700 000
103 Operational Equipment, 454 000 1 700 000 1 700 000 880 000 1 280 000
Machinery And Plants
105 Feasibility Studies, Design 2 477 000 6 000 000 6 000 000 5 800 000 2 725 000
and Supervision
107 Construction, Renovation 13 136 000 36 288 000 28 288 000 56 200 000 35 875 000
and Improvement
110 Acquisition of capital 16 729 000 44 968 000 36 968 000 64 570 000 41 190 000
assets Total
130 Capital Transfers
123-1 State Owned Enterprises 251 273 000 200 000 000 200 000 000 300 000 000 200 000 000
130 Capital Transfers Total 251 273 000 200 000 000 200 000 000 300 000 000 200 000 000
200 Development Budget Total 284 186 000
267 714 000
397 359 000
277 047 000
276 714 000
GRAND TOTAL 463 770 920 453 424 000 443 261 000 577 957 000 461 257 000
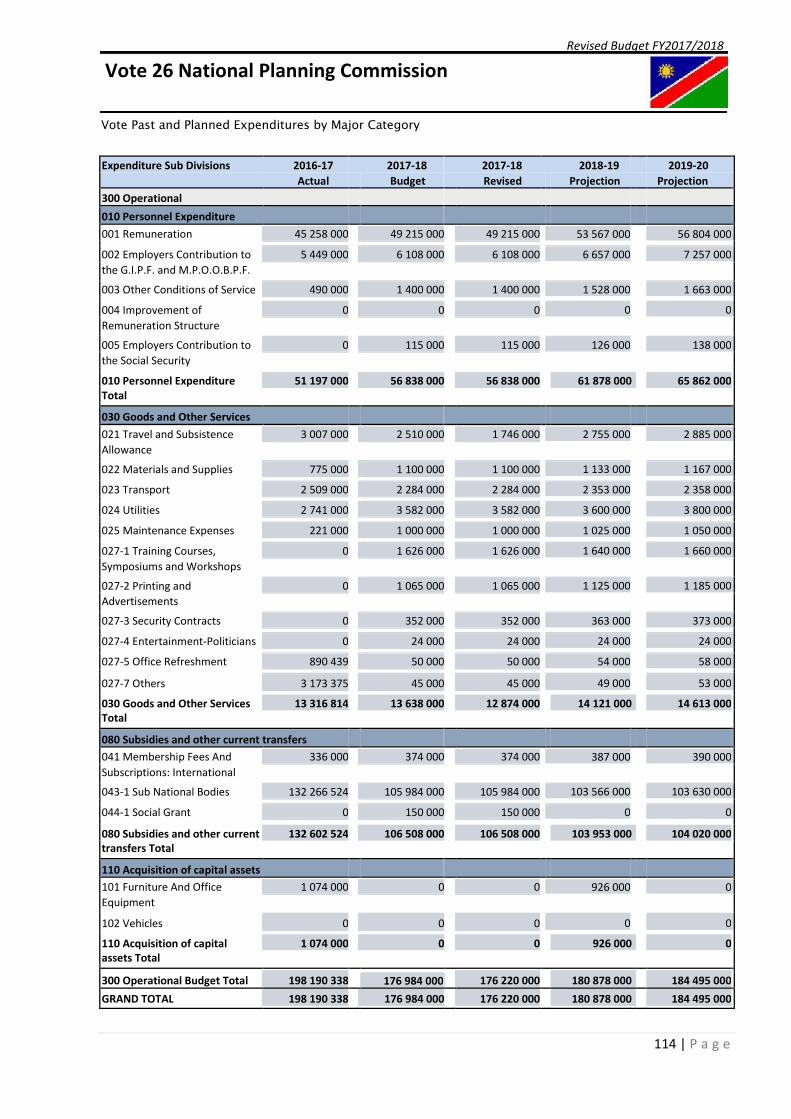
114 | P a g e
Revised Budget FY2017/2018
Vote 26 National Planning Commission
Vote Past and Planned Expenditures by Major Category
Expenditure Sub Divisions 2016-17 2017-18 2017-18 2018-19 2019-20
Actual Budget Revised Projection Projection
300 Operational
010 Personnel Expenditure
001 Remuneration 45 258 000 49 215 000 49 215 000 53 567 000 56 804 000
002 Employers Contribution to 5 449 000 6 108 000 6 108 000 6 657 000 7 257 000
the G.I.P.F. and M.P.O.O.B.P.F.
003 Other Conditions of Service 490 000 1 400 000 1 400 000 1 528 000 1 663 000
004 Improvement of 0 0 0 0 0
Remuneration Structure
005 Employers Contribution to 0 115 000 115 000 126 000 138 000
the Social Security
010 Personnel Expenditure 51 197 000 56 838 000 56 838 000 61 878 000 65 862 000
Total
030 Goods and Other Services
021 Travel and Subsistence 3 007 000 2 510 000 1 746 000 2 755 000 2 885 000
Allowance
022 Materials and Supplies 775 000 1 100 000 1 100 000 1 133 000 1 167 000
023 Transport 2 509 000 2 284 000 2 284 000 2 353 000 2 358 000
024 Utilities 2 741 000 3 582 000 3 582 000 3 600 000 3 800 000
025 Maintenance Expenses 221 000 1 000 000 1 000 000 1 025 000 1 050 000
027-1 Training Courses, 0 1 626 000 1 626 000 1 640 000 1 660 000
Symposiums and Workshops
027-2 Printing and 0 1 065 000 1 065 000 1 125 000 1 185 000
Advertisements
027-3 Security Contracts 0 352 000 352 000 363 000 373 000
027-4 Entertainment-Politicians 0 24 000 24 000 24 000 24 000
027-5 Office Refreshment 890 439 50 000 50 000 54 000 58 000
027-7 Others 3 173 375 45 000 45 000 49 000 53 000
030 Goods and Other Services 13 316 814 13 638 000 12 874 000 14 121 000 14 613 000
Total
080 Subsidies and other current transfers
041 Membership Fees And 336 000 374 000 374 000 387 000 390 000
Subscriptions: International
043-1 Sub National Bodies 132 266 524 105 984 000 105 984 000 103 566 000 103 630 000
044-1 Social Grant 0 150 000 150 000 0 0
080 Subsidies and other current 132 602 524 106 508 000 106 508 000 103 953 000 104 020 000
transfers Total
110 Acquisition of capital assets
101 Furniture And Office 1 074 000 0 0 926 000 0
Equipment
102 Vehicles 0 0 0 0 0
110 Acquisition of capital 1 074 000 0 0 926 000 0
assets Total
300 Operational Budget Total 198 190 338
176 220 000
180 878 000
184 495 000
176 984 000
GRAND TOTAL 198 190 338 176 984 000 176 220 000 180 878 000 184 495 000

115 | P a g e
Revised Budget FY2017/2018
Vote 27 Sport, Youth and National Service
Vote Past and Planned Expenditures by Major Category
Expenditure Sub Divisions 2016-17 2017-18 2017-18 2018-19 2019-20
Actual Budget Revised Projection Projection 300 Operational
010 Personnel Expenditure
001 Remuneration 107 002 000 118 084 000 118 084 000 121 036 000 124 071 000
002 Employers Contribution to 12 985 000 12 771 000 12 771 000 13 120 000 13 515 000 the G.I.P.F. and M.P.O.O.B.P.F.
003 Other Conditions of Service 1 555 000 1 609 000 1 609 000 1 678 000 1 727 000
004 Improvement of 0 0 0 0 0 Remuneration Structure
005 Employers Contribution to 0 436 000 436 000 451 000 457 000 the Social Security
010 Personnel Expenditure 121 542 000 132 900 000 132 900 000 136 285 000 139 770 000 Total
030 Goods and Other Services
021 Travel and Subsistence 8 300 000 1 400 000 1 002 000 1 800 000 2 200 000 Allowance
022 Materials and Supplies 5 221 000 7 800 000 7 800 000 7 775 000 4 380 000
023 Transport 9 187 000 20 000 000 20 000 000 12 000 000 10 443 000
024 Utilities 17 911 000 26 232 000 26 232 000 4 625 000 3 000 000
025 Maintenance Expenses 6 742 000 4 500 000 4 500 000 4 000 000 2 500 000
026 Property Rental and Related 1 381 000 950 000 950 000 1 465 000 1 509 000 Charges
027-1 Training Courses, 0 0 0 1 397 000 1 464 000 Symposiums and Workshops
027-2 Printing and 0 0 0 39 000 45 000 Advertisements
027-3 Security Contracts 0 16 000 000 16 000 000 11 500 000 9 000 000
027-4 Entertainment-Politicians 0 8 000 8 000 10 000 12 000
027-5 Office Refreshment 0 0 0 25 000 35 000
027-6 Official 0 0 0 5 000 6 000 Entertainment/Corporate Gifts
027-7 Others 56 428 955 23 496 000 22 986 000 24 057 000 8 620 000
030 Goods and Other Services 105 170 955 100 386 000 99 478 000 68 698 000 43 214 000 Total
080 Subsidies and other current transfers
041 Membership Fees And 651 000 500 000 500 000 618 000 625 000 Subscriptions: International
042 Membership Fees And 32 000 0 0 0 0 Subscriptions: Domestic
043-2 Other Extra Budgetary 114 789 988 92 002 000 92 002 000 93 981 000 120 282 000 Bodies
044-1 Social Grant 38 656 183 21 631 000 83 523 000 24 201 000 27 000 000
080 Subsidies and other current 154 129 171 114 133 000 176 025 000 118 800 000 147 907 000 transfers Total
110 Acquisition of capital assets
101 Furniture And Office 1 337 000 0 0 350 000 0 Equipment
116 | P a g e
103 Operational Equipment, 400 000 0 0 270 000 0 Machinery And Plants

117 | P a g e
Revised Budget FY2017/2018
Vote 27 Sport, Youth and National Service
Expenditure Sub Divisions 2016-17 2017-18 2017-18 2018-19 2019-20
Actual Budget Revised Projection Projection
110 Acquisition of capital 1 737 000 0 0 620 000 0
assets Total
300 Operational Budget Total 382 579 126
408 403 000
324 403 000
330 891 000
347 419 000
200 Development
110 Acquisition of capital assets
107 Construction, Renovation 21 116 000 37 544 000 21 121 000 59 524 000 57 809 000
and Improvement
110 Acquisition of capital 21 116 000 37 544 000 21 121 000 59 524 000 57 809 000
assets Total
200 Development Budget Total 21 116 000
21 121 000
59 524 000
57 809 000
37 544 000
GRAND TOTAL 403 695 126 384 963 000 429 524 000 383 927 000 388 700 000
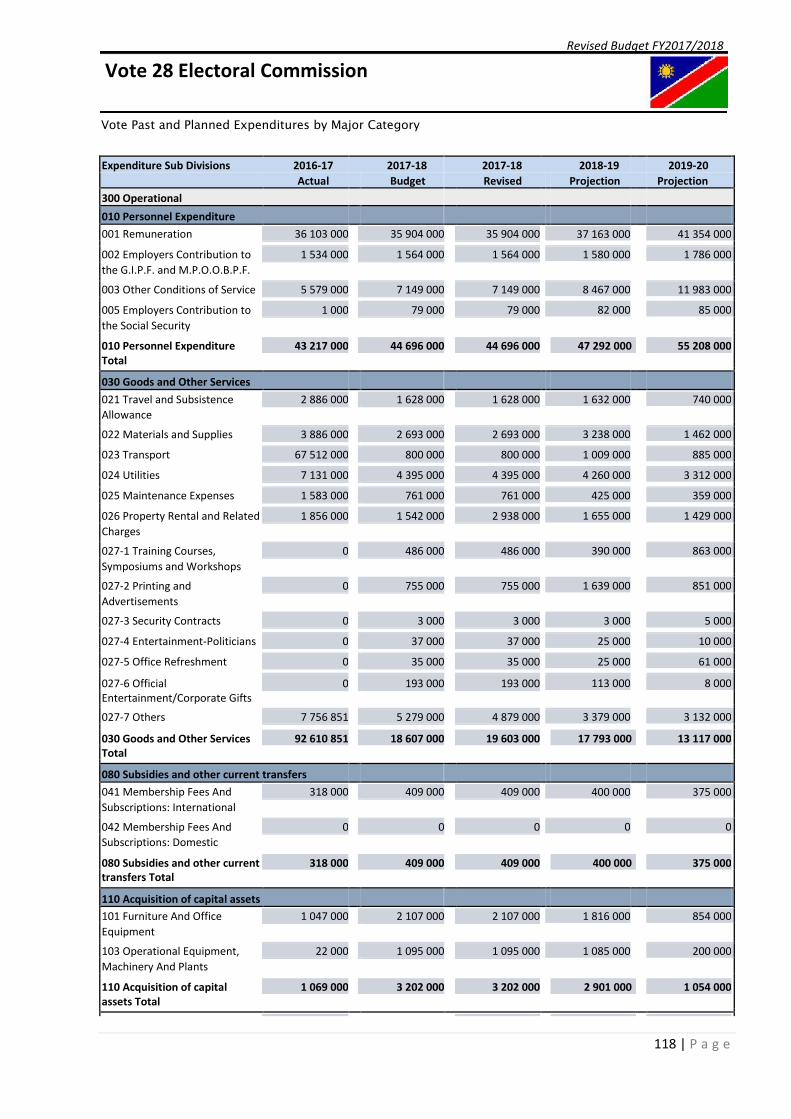
118 | P a g e
Revised Budget FY2017/2018
Vote 28 Electoral Commission
Vote Past and Planned Expenditures by Major Category
Expenditure Sub Divisions 2016-17 2017-18 2017-18 2018-19 2019-20
Actual Budget Revised Projection Projection
300 Operational
010 Personnel Expenditure
001 Remuneration 36 103 000 35 904 000 35 904 000 37 163 000 41 354 000
002 Employers Contribution to 1 534 000 1 564 000 1 564 000 1 580 000 1 786 000
the G.I.P.F. and M.P.O.O.B.P.F.
003 Other Conditions of Service 5 579 000 7 149 000 7 149 000 8 467 000 11 983 000
005 Employers Contribution to 1 000 79 000 79 000 82 000 85 000
the Social Security
010 Personnel Expenditure 43 217 000 44 696 000 44 696 000 47 292 000 55 208 000
Total
030 Goods and Other Services
021 Travel and Subsistence 2 886 000 1 628 000 1 628 000 1 632 000 740 000
Allowance
022 Materials and Supplies 3 886 000 2 693 000 2 693 000 3 238 000 1 462 000
023 Transport 67 512 000 800 000 800 000 1 009 000 885 000
024 Utilities 7 131 000 4 395 000 4 395 000 4 260 000 3 312 000
025 Maintenance Expenses 1 583 000 761 000 761 000 425 000 359 000
026 Property Rental and Related 1 856 000 1 542 000 2 938 000 1 655 000 1 429 000
Charges
027-1 Training Courses, 0 486 000 486 000 390 000 863 000
Symposiums and Workshops
027-2 Printing and 0 755 000 755 000 1 639 000 851 000
Advertisements
027-3 Security Contracts 0 3 000 3 000 3 000 5 000
027-4 Entertainment-Politicians 0 37 000 37 000 25 000 10 000
027-5 Office Refreshment 0 35 000 35 000 25 000 61 000
027-6 Official 0 193 000 193 000 113 000 8 000
Entertainment/Corporate Gifts
027-7 Others 7 756 851 5 279 000 4 879 000 3 379 000 3 132 000
030 Goods and Other Services 92 610 851 18 607 000 19 603 000 17 793 000 13 117 000
Total
080 Subsidies and other current transfers
041 Membership Fees And 318 000 409 000 409 000 400 000 375 000
Subscriptions: International
042 Membership Fees And 0 0 0 0 0
Subscriptions: Domestic
080 Subsidies and other current 318 000 409 000 409 000 400 000 375 000
transfers Total
110 Acquisition of capital assets
101 Furniture And Office 1 047 000 2 107 000 2 107 000 1 816 000 854 000
Equipment
103 Operational Equipment, 22 000 1 095 000 1 095 000 1 085 000 200 000
Machinery And Plants
110 Acquisition of capital 1 069 000 3 202 000 3 202 000 2 901 000 1 054 000
assets Total
300 Operational Budget Total 137 214 851
67 910 000
68 386 000
69 754 000

119 | P a g e
66 914 000
GRAND TOTAL 137 214 851 66 914 000 67 910 000 68 386 000 69 754 000

120 | P a g e
Revised Budget FY2017/2018
Vote 29 Information and Communication Technology
Vote Past and Planned Expenditures by Major Category
Expenditure Sub Divisions 2016-17 2017-18 2017-18 2018-19 2019-20
Actual Budget Revised Projection Projection 300 Operational
010 Personnel Expenditure
001 Remuneration 63 723 000 76 695 000 76 695 000 80 527 000 84 555 000
002 Employers Contribution to 7 564 000 12 746 000 12 746 000 13 382 000 14 053 000 the G.I.P.F. and M.P.O.O.B.P.F.
003 Other Conditions of Service 590 000 4 300 000 4 300 000 4 515 000 4 740 000
004 Improvement of 0 0 0 0 0 Remuneration Structure
005 Employers Contribution to 0 432 000 432 000 453 000 477 000 the Social Security
010 Personnel Expenditure 71 877 000 94 173 000 94 173 000 98 877 000 103 825 000 Total
030 Goods and Other Services
021 Travel and Subsistence 6 218 000 6 290 000 4 730 000 9 650 000 10 500 000 Allowance
022 Materials and Supplies 2 042 000 1 187 000 1 187 000 1 247 000 1 327 000
023 Transport 11 313 000 10 000 000 10 000 000 11 056 000 9 000 000
024 Utilities 9 962 000 11 027 000 11 027 000 12 000 000 9 000 000
025 Maintenance Expenses 697 000 2 140 000 2 140 000 2 248 000 2 357 000
026 Property Rental and Related 2 998 000 4 500 000 4 500 000 4 000 000 2 185 000 Charges
027-1 Training Courses, 0 3 050 000 3 050 000 2 287 000 2 472 000 Symposiums and Workshops
027-2 Printing and 5 397 149 17 660 000 17 660 000 11 410 000 9 639 000 Advertisements
027-3 Security Contracts 0 2 600 000 2 600 000 2 000 000 1 000 000
027-4 Entertainment-Politicians 0 62 000 62 000 65 000 67 000
027-5 Office Refreshment 0 0 0 0 0
027-6 Official 0 0 0 0 0 Entertainment/Corporate Gifts
027-7 Others 3 233 137 8 200 000 5 360 000 4 500 000 3 500 000
030 Goods and Other Services 41 860 286 66 716 000 62 316 000 60 463 000 51 047 000 Total
080 Subsidies and other current transfers
041 Membership Fees And 2 380 000 1 800 000 1 800 000 1 890 000 1 985 000 Subscriptions: International
042 Membership Fees And 45 000 200 000 200 000 210 000 221 000 Subscriptions: Domestic
044-1 Social Grant 298 403 045 0 0 0 0
045-1 S.O.E. 5 742 097 254 753 000 334 753 000 268 500 000 282 500 000
080 Subsidies and other current 306 570 142 256 753 000 336 753 000 270 600 000 284 706 000 transfers Total
110 Acquisition of capital assets
101 Furniture And Office 509 000 5 000 000 5 000 000 2 000 000 1 000 000 Equipment
121 | P a g e
110 Acquisition of capital 509 000 5 000 000 5 000 000 2 000 000 1 000 000 assets Total

122 | P a g e
Revised Budget FY2017/2018
Vote 29 Information and Communication Technology
Expenditure Sub Divisions 2016-17 2017-18 2017-18 2018-19 2019-20
Actual Budget Revised Projection Projection
300 Operational Budget Total 420 816 428
498 242 000
431 940 000
440 578 000
422 642 000
200 Development
110 Acquisition of capital assets
105 Feasibility Studies, Design 6 973 000 0 0 0 0
and Supervision
107 Construction, Renovation 25 248 000 11 040 000 11 040 000 42 667 000 14 452 000
and Improvement
110 Acquisition of capital 32 221 000 11 040 000 11 040 000 42 667 000 14 452 000
assets Total
200 Development Budget Total 32 221 000
11 040 000
42 667 000
14 452 000
11 040 000
GRAND TOTAL 453 037 428 433 682 000 509 282 000 474 607 000 455 030 000

123 | P a g e
Revised Budget FY2017/2018
Vote 30 Anti-Corruption Commission
Vote Past and Planned Expenditures by Major Category
Expenditure Sub Divisions 2016-17 2017-18 2017-18 2018-19 2019-20
Actual Budget Revised Projection Projection
300 Operational
010 Personnel Expenditure
001 Remuneration 33 218 000 39 631 000 39 631 000 43 122 000 47 554 000
002 Employers Contribution to 4 168 000 4 413 000 4 413 000 4 738 000 4 947 000
the G.I.P.F. and M.P.O.O.B.P.F.
003 Other Conditions of Service 100 000 483 000 483 000 369 000 400 000
005 Employers Contribution to 0 74 000 74 000 45 000 51 000
the Social Security
010 Personnel Expenditure 37 486 000 44 601 000 44 601 000 48 274 000 52 952 000
Total
030 Goods and Other Services
021 Travel and Subsistence 1 441 000 2 120 000 1 913 000 2 160 000 1 570 000
Allowance
022 Materials and Supplies 560 000 759 000 759 000 610 000 639 000
023 Transport 1 148 000 2 085 000 2 085 000 1 460 000 1 267 000
024 Utilities 2 491 000 1 516 000 1 516 000 1 460 000 1 320 000
025 Maintenance Expenses 67 000 343 000 343 000 197 000 95 000
026 Property Rental and Related 937 000 1 332 000 1 332 000 1 150 000 1 140 000
Charges
027-1 Training Courses, 0 1 648 000 1 648 000 1 656 000 875 000
Symposiums and Workshops
027-2 Printing and 0 660 000 660 000 954 000 480 000
Advertisements
027-3 Security Contracts 0 703 000 703 000 470 000 319 000
027-4 Entertainment-Politicians 0 19 000 19 000 25 000 26 000
027-5 Office Refreshment 0 50 000 50 000 55 000 50 000
027-6 Official 0 210 000 210 000 186 000 220 000
Entertainment/Corporate Gifts
027-7 Others 2 955 763 2 305 000 2 305 000 820 000 418 000
030 Goods and Other Services 9 599 763 13 750 000 13 543 000 11 203 000 8 419 000
Total
080 Subsidies and other current transfers
041 Membership Fees And 124 000 154 000 154 000 170 000 177 000
Subscriptions: International
042 Membership Fees And 0 34 000 34 000 35 000 37 000
Subscriptions: Domestic
080 Subsidies and other current 124 000 188 000 188 000 205 000 214 000
transfers Total
110 Acquisition of capital assets
101 Furniture And Office 44 000 836 000 836 000 1 000 000 310 000
Equipment
110 Acquisition of capital 44 000 836 000 836 000 1 000 000 310 000
assets Total
300 Operational Budget Total 47 253 763
59 168 000
60 682 000
61 895 000
59 375 000
GRAND TOTAL 47 253 763 59 375 000 59 168 000 60 682 000 61 895 000
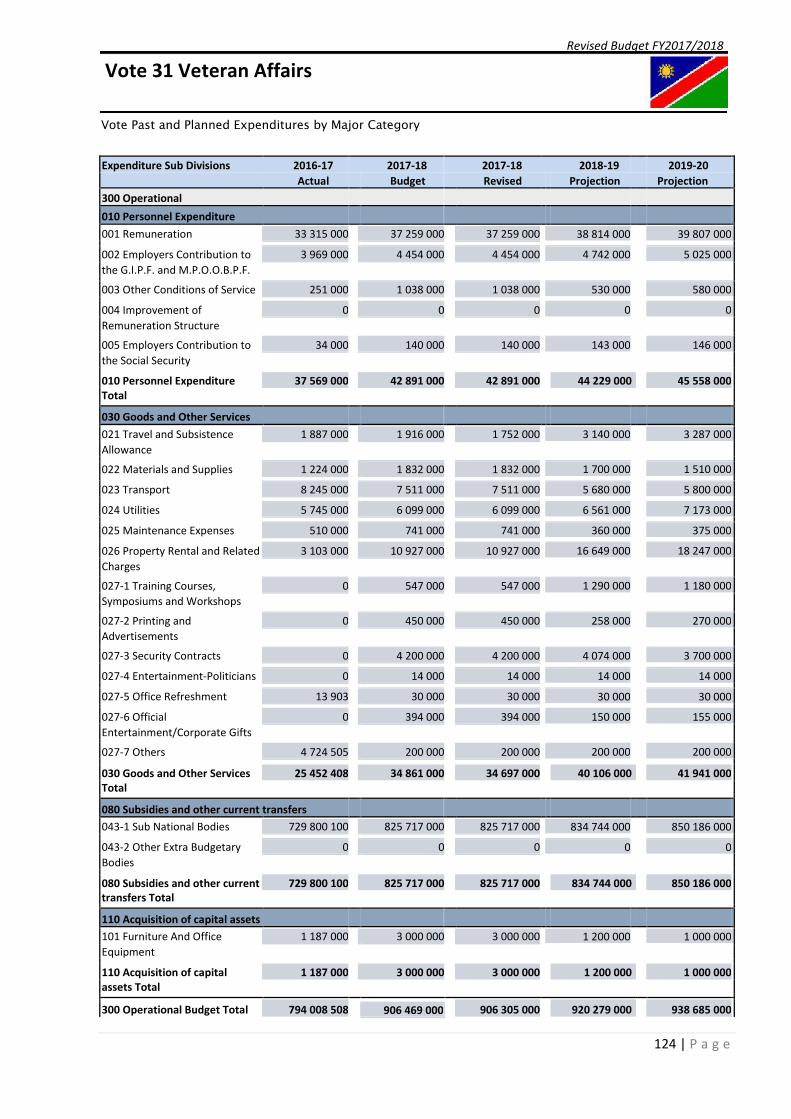
124 | P a g e
Revised Budget FY2017/2018
Vote 31 Veteran Affairs
Vote Past and Planned Expenditures by Major Category
Expenditure Sub Divisions 2016-17 2017-18 2017-18 2018-19 2019-20
Actual Budget Revised Projection Projection
300 Operational
010 Personnel Expenditure
001 Remuneration 33 315 000 37 259 000 37 259 000 38 814 000 39 807 000
002 Employers Contribution to 3 969 000 4 454 000 4 454 000 4 742 000 5 025 000
the G.I.P.F. and M.P.O.O.B.P.F.
003 Other Conditions of Service 251 000 1 038 000 1 038 000 530 000 580 000
004 Improvement of 0 0 0 0 0
Remuneration Structure
005 Employers Contribution to 34 000 140 000 140 000 143 000 146 000
the Social Security
010 Personnel Expenditure 37 569 000 42 891 000 42 891 000 44 229 000 45 558 000
Total
030 Goods and Other Services
021 Travel and Subsistence 1 887 000 1 916 000 1 752 000 3 140 000 3 287 000
Allowance
022 Materials and Supplies 1 224 000 1 832 000 1 832 000 1 700 000 1 510 000
023 Transport 8 245 000 7 511 000 7 511 000 5 680 000 5 800 000
024 Utilities 5 745 000 6 099 000 6 099 000 6 561 000 7 173 000
025 Maintenance Expenses 510 000 741 000 741 000 360 000 375 000
026 Property Rental and Related 3 103 000 10 927 000 10 927 000 16 649 000 18 247 000
Charges
027-1 Training Courses, 0 547 000 547 000 1 290 000 1 180 000
Symposiums and Workshops
027-2 Printing and 0 450 000 450 000 258 000 270 000
Advertisements
027-3 Security Contracts 0 4 200 000 4 200 000 4 074 000 3 700 000
027-4 Entertainment-Politicians 0 14 000 14 000 14 000 14 000
027-5 Office Refreshment 13 903 30 000 30 000 30 000 30 000
027-6 Official 0 394 000 394 000 150 000 155 000
Entertainment/Corporate Gifts
027-7 Others 4 724 505 200 000 200 000 200 000 200 000
030 Goods and Other Services 25 452 408 34 861 000 34 697 000 40 106 000 41 941 000
Total
080 Subsidies and other current transfers
043-1 Sub National Bodies 729 800 100 825 717 000 825 717 000 834 744 000 850 186 000
043-2 Other Extra Budgetary 0 0 0 0 0
Bodies
080 Subsidies and other current 729 800 100 825 717 000 825 717 000 834 744 000 850 186 000
transfers Total
110 Acquisition of capital assets
101 Furniture And Office 1 187 000 3 000 000 3 000 000 1 200 000 1 000 000
Equipment
110 Acquisition of capital 1 187 000 3 000 000 3 000 000 1 200 000 1 000 000
assets Total
300 Operational Budget Total 794 008 508
906 305 000
920 279 000
938 685 000
906 469 000

125 | P a g e
200 Development
110 Acquisition of capital assets

126 | P a g e
Revised Budget FY2017/2018
Vote 31 Veteran Affairs
Expenditure Sub Divisions 2016-17 2017-18 2017-18 2018-19 2019-20
Actual Budget Revised Projection Projection
105 Feasibility Studies, Design 0 0 0 0 0
and Supervision
107 Construction, Renovation 8 434 000 14 880 000 12 380 000 26 393 000 17 517 000
and Improvement
110 Acquisition of capital 8 434 000 14 880 000 12 380 000 26 393 000 17 517 000
assets Total
200 Development Budget Total 8 434 000
12 380 000
26 393 000
17 517 000
14 880 000
GRAND TOTAL 802 442 508 921 349 000 918 685 000 946 672 000 956 202 000

127 | P a g e
Revised Budget FY2017/2018
Vote 32 Higher Education, Training and Innovation
Vote Past and Planned Expenditures by Major Category
Expenditure Sub Divisions 2016-17 2017-18 2017-18 2018-19 2019-20
Actual Budget Revised Projection Projection
300 Operational
010 Personnel Expenditure
001 Remuneration 31 799 000 32 674 000 32 674 000 33 653 000 34 662 000
002 Employers Contribution to 2 914 000 3 071 000 3 071 000 3 163 000 3 258 000
the G.I.P.F. and M.P.O.O.B.P.F.
003 Other Conditions of Service 1 326 000 4 977 000 4 977 000 5 125 000 5 277 000
005 Employers Contribution to 0 108 000 108 000 111 000 114 000
the Social Security
010 Personnel Expenditure 36 039 000 40 830 000 40 830 000 42 052 000 43 311 000
Total
030 Goods and Other Services
021 Travel and Subsistence 1 957 000 6 245 000 6 245 000 6 432 000 6 626 000
Allowance
022 Materials and Supplies 800 000 1 701 000 1 701 000 1 750 000 1 799 000
023 Transport 1 862 000 906 000 906 000 933 000 961 000
024 Utilities 426 000 2 980 000 2 980 000 3 068 000 3 159 000
025 Maintenance Expenses 20 000 239 000 239 000 246 000 253 000
027-1 Training Courses, 0 4 009 000 4 009 000 4 125 000 4 247 000
Symposiums and Workshops
027-2 Printing and 0 1 121 000 1 121 000 1 155 000 1 190 000
Advertisements
027-3 Security Contracts 0 94 000 94 000 97 000 100 000
027-4 Entertainment-Politicians 0 80 000 80 000 81 000 82 000
027-5 Office Refreshment 0 165 000 165 000 169 000 173 000
027-6 Official 0 215 000 215 000 212 000 219 000
Entertainment/Corporate Gifts
027-7 Others 27 310 955 11 571 000 11 571 000 11 918 000 12 275 000
030 Goods and Other Services 32 375 955 29 326 000 29 326 000 30 186 000 31 084 000
Total
080 Subsidies and other current transfers
041 Membership Fees And 422 000 749 000 749 000 750 000 755 000
Subscriptions: International
042 Membership Fees And 0 22 000 22 000 23 000 24 000
Subscriptions: Domestic
043-2 Other Extra Budgetary 1 306 236 920 1 524 052 000 1 899 906 000 1 506 337 000 1 537 907 000
Bodies
044-1 Social Grant 1 291 434 689 1 404 868 000 1 822 993 000 1 384 294 000 1 409 851 000
045-1 S.O.E. 0 0 0 0 0
080 Subsidies and other current 2 598 093 609 2 929 691 000 3 723 670 000 2 891 404 000 2 948 537 000
transfers Total
110 Acquisition of capital assets
101 Furniture And Office 1 799 000 727 000 727 000 745 000 742 000
Equipment
110 Acquisition of capital 1 799 000 727 000 727 000 745 000 742 000
assets Total
300 Operational Budget Total 2 668 307 564
3 794 553 000
2 964 387 000
3 023 674 000

128 | P a g e
3 000 574 000
200 Development
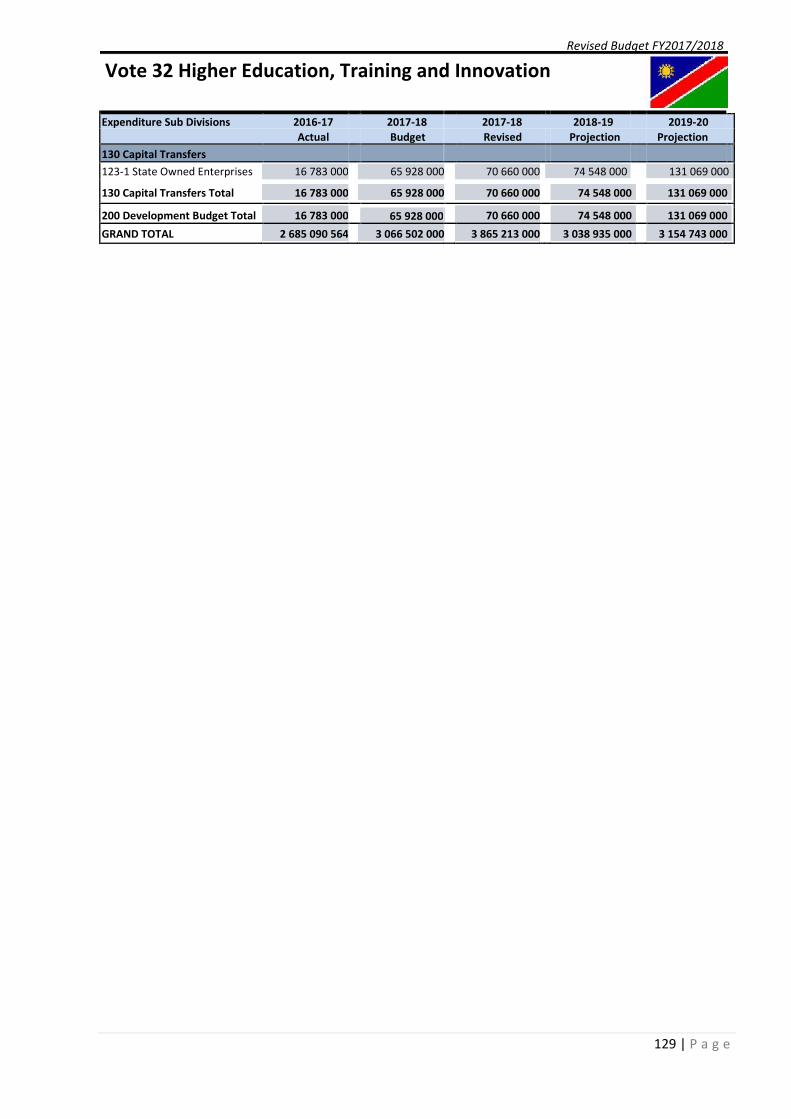
129 | P a g e
Revised Budget FY2017/2018
Vote 32 Higher Education, Training and Innovation
Expenditure Sub Divisions 2016-17 2017-18 2017-18 2018-19 2019-20
Actual Budget Revised Projection Projection
130 Capital Transfers
123-1 State Owned Enterprises 16 783 000 65 928 000 70 660 000 74 548 000 131 069 000
130 Capital Transfers Total 16 783 000 65 928 000 70 660 000 74 548 000 131 069 000
200 Development Budget Total 16 783 000
70 660 000
74 548 000
131 069 000
65 928 000
GRAND TOTAL 2 685 090 564 3 066 502 000 3 865 213 000 3 038 935 000 3 154 743 000
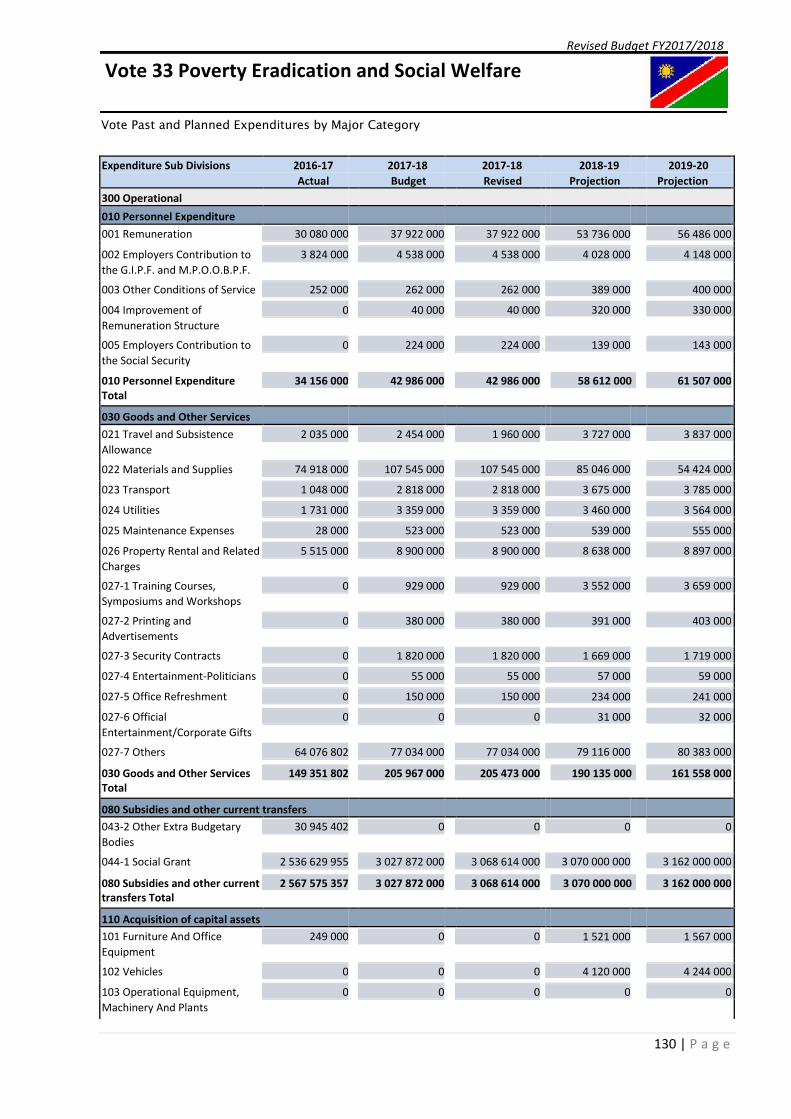
130 | P a g e
Revised Budget FY2017/2018
Vote 33 Poverty Eradication and Social Welfare
Vote Past and Planned Expenditures by Major Category
Expenditure Sub Divisions 2016-17 2017-18 2017-18 2018-19 2019-20
Actual Budget Revised Projection Projection 300 Operational
010 Personnel Expenditure
001 Remuneration 30 080 000 37 922 000 37 922 000 53 736 000 56 486 000
002 Employers Contribution to 3 824 000 4 538 000 4 538 000 4 028 000 4 148 000 the G.I.P.F. and M.P.O.O.B.P.F.
003 Other Conditions of Service 252 000 262 000 262 000 389 000 400 000
004 Improvement of 0 40 000 40 000 320 000 330 000 Remuneration Structure
005 Employers Contribution to 0 224 000 224 000 139 000 143 000 the Social Security
010 Personnel Expenditure 34 156 000 42 986 000 42 986 000 58 612 000 61 507 000 Total
030 Goods and Other Services
021 Travel and Subsistence 2 035 000 2 454 000 1 960 000 3 727 000 3 837 000 Allowance
022 Materials and Supplies 74 918 000 107 545 000 107 545 000 85 046 000 54 424 000
023 Transport 1 048 000 2 818 000 2 818 000 3 675 000 3 785 000
024 Utilities 1 731 000 3 359 000 3 359 000 3 460 000 3 564 000
025 Maintenance Expenses 28 000 523 000 523 000 539 000 555 000
026 Property Rental and Related 5 515 000 8 900 000 8 900 000 8 638 000 8 897 000 Charges
027-1 Training Courses, 0 929 000 929 000 3 552 000 3 659 000 Symposiums and Workshops
027-2 Printing and 0 380 000 380 000 391 000 403 000 Advertisements
027-3 Security Contracts 0 1 820 000 1 820 000 1 669 000 1 719 000
027-4 Entertainment-Politicians 0 55 000 55 000 57 000 59 000
027-5 Office Refreshment 0 150 000 150 000 234 000 241 000
027-6 Official 0 0 0 31 000 32 000 Entertainment/Corporate Gifts
027-7 Others 64 076 802 77 034 000 77 034 000 79 116 000 80 383 000
030 Goods and Other Services 149 351 802 205 967 000 205 473 000 190 135 000 161 558 000 Total
080 Subsidies and other current transfers
043-2 Other Extra Budgetary 30 945 402 0 0 0 0 Bodies
044-1 Social Grant 2 536 629 955 3 027 872 000 3 068 614 000 3 070 000 000 3 162 000 000
080 Subsidies and other current 2 567 575 357 3 027 872 000 3 068 614 000 3 070 000 000 3 162 000 000 transfers Total
110 Acquisition of capital assets
101 Furniture And Office 249 000 0 0 1 521 000 1 567 000 Equipment
102 Vehicles 0 0 0 4 120 000 4 244 000
103 Operational Equipment, 0 0 0 0 0 Machinery And Plants
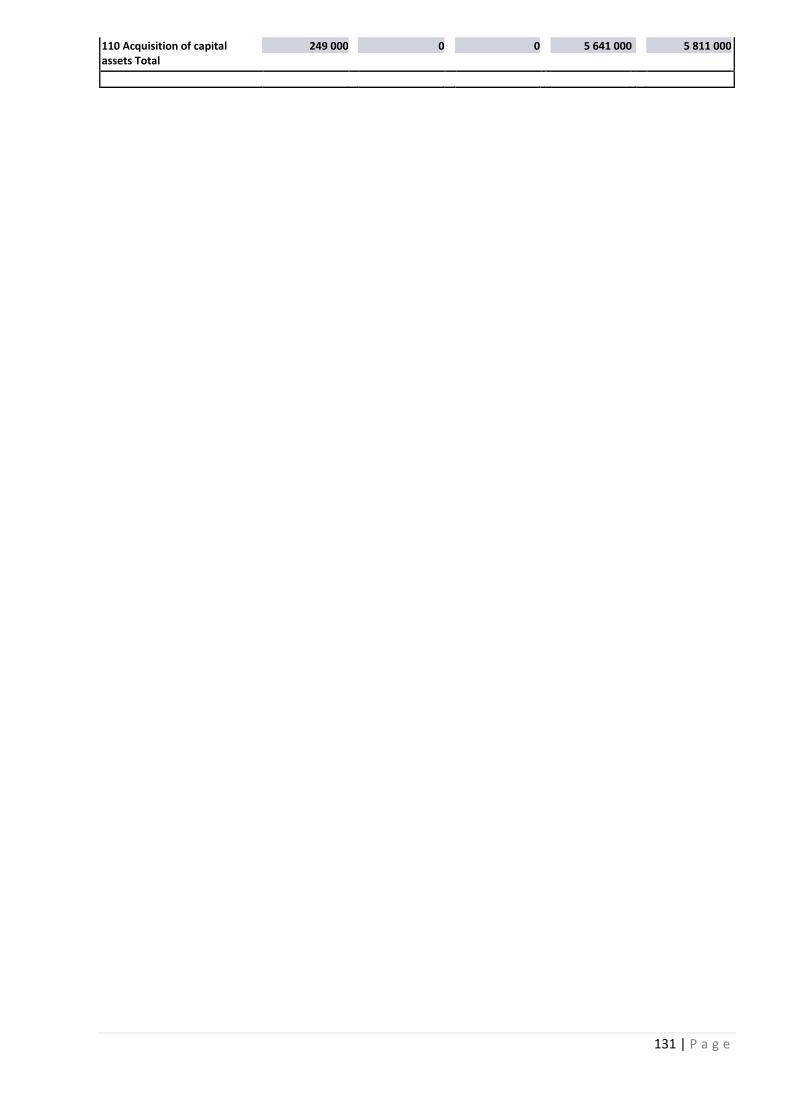
131 | P a g e
110 Acquisition of capital 249 000 0 0 5 641 000 5 811 000 assets Total

132 | P a g e
Revised Budget FY2017/2018
Vote 33 Poverty Eradication and Social Welfare
Expenditure Sub Divisions 2016-17 2017-18 2017-18 2018-19 2019-20
Actual Budget Revised Projection Projection
300 Operational Budget Total 2 751 332 159
3 317 073 000
3 324 388 000
3 390 876 000
3 276 825 000
GRAND TOTAL 2 751 332 159 3 276 825 000 3 317 073 000 3 324 388 000 3 390 876 000

133 | P a g e
Revised Budget FY2017/2018
Vote 34 Public Enterprises
Vote Past and Planned Expenditures by Major Category
Expenditure Sub Divisions 2016-17 2017-18 2017-18 2018-19 2019-20
Actual Budget Revised Projection Projection
300 Operational
010 Personnel Expenditure
001 Remuneration 20 044 000 24 150 000 24 150 000 25 251 000 26 395 000
002 Employers Contribution to 1 621 000 2 780 000 2 780 000 2 780 000 2 813 000
the G.I.P.F. and M.P.O.O.B.P.F.
003 Other Conditions of Service 0 30 000 30 000 30 000 30 000
004 Improvement of 0 0 0 0 0
Remuneration Structure
005 Employers Contribution to 0 86 000 86 000 86 000 77 000
the Social Security
010 Personnel Expenditure 21 665 000 27 046 000 27 046 000 28 147 000 29 315 000
Total
030 Goods and Other Services
021 Travel and Subsistence 2 036 000 2 350 000 2 350 000 2 350 000 2 350 000
Allowance
022 Materials and Supplies 647 000 392 000 392 000 392 000 392 000
023 Transport 40 000 300 000 300 000 300 000 300 000
024 Utilities 2 428 000 3 000 000 3 000 000 3 000 000 3 000 000
025 Maintenance Expenses 11 000 50 000 50 000 50 000 50 000
026 Property Rental and Related 7 900 000 8 866 000 8 866 000 8 866 000 8 866 000
Charges
027-1 Training Courses, 0 300 000 300 000 0 0
Symposiums and Workshops
027-2 Printing and 0 150 000 150 000 150 000 150 000
Advertisements
027-4 Entertainment-Politicians 0 40 000 40 000 40 000 40 000
027-5 Office Refreshment 0 45 000 45 000 45 000 45 000
027-6 Official 0 0 0 0 0
Entertainment/Corporate Gifts
027-7 Others 5 084 809 12 584 000 12 584 000 15 455 000 15 469 000
030 Goods and Other Services 18 146 809 28 077 000 28 077 000 30 648 000 30 662 000
Total
080 Subsidies and other current transfers
044-2 Support to N.P.O 0 2 200 000 2 200 000 0 0
080 Subsidies and other current 0 2 200 000 2 200 000 0 0
transfers Total
110 Acquisition of capital assets
101 Furniture And Office 70 000 500 000 426 000 300 000 300 000
Equipment
102 Vehicles 0 0 0 0 0
110 Acquisition of capital 70 000 500 000 426 000 300 000 300 000
assets Total
300 Operational Budget Total 39 881 809
57 749 000
59 095 000
60 277 000
57 823 000
GRAND TOTAL 39 881 809 57 823 000 57 749 000 59 095 000 60 277 000

134 | P a g e
Revised Budget FY2017/2018
Vote 35 Attorney General
Vote Past and Planned Expenditures by Major Category
Expenditure Sub Divisions 2016-17 2017-18 2017-18 2018-19 2019-20
Actual Budget Revised Projection Projection
300 Operational
010 Personnel Expenditure
001 Remuneration 106 680 000 126 930 000 126 930 000 127 031 000 127 031 000
002 Employers Contribution to 11 790 000 12 472 000 12 472 000 12 459 000 12 459 000
the G.I.P.F. and M.P.O.O.B.P.F.
003 Other Conditions of Service 2 372 000 3 858 000 3 858 000 3 858 000 3 858 000
004 Improvement of 0 0 0 0 0
Remuneration Structure
005 Employers Contribution to 0 258 000 258 000 258 000 258 000
the Social Security
010 Personnel Expenditure 120 842 000 143 518 000 143 518 000 143 606 000 143 606 000
Total
030 Goods and Other Services
021 Travel and Subsistence 4 920 000 7 710 000 7 710 000 7 820 000 7 831 000
Allowance
022 Materials and Supplies 1 267 000 2 440 000 2 440 000 2 254 000 2 256 000
023 Transport 0 5 000 000 5 000 000 5 000 000 5 000 000
024 Utilities 742 000 4 000 000 4 000 000 4 300 000 4 500 000
025 Maintenance Expenses 0 3 000 000 3 000 000 3 000 000 3 000 000
026 Property Rental and Related 2 181 000 5 700 000 5 700 000 3 300 000 3 500 000
Charges
027-1 Training Courses, 0 0 0 0 0
Symposiums and Workshops
027-2 Printing and 0 3 600 000 3 600 000 3 600 000 3 600 000
Advertisements
027-4 Entertainment-Politicians 0 40 000 40 000 41 000 42 000
027-5 Office Refreshment 10 317 0 0 0 0
027-6 Official 0 0 0 0 0
Entertainment/Corporate Gifts
027-7 Others 9 940 958 29 410 000 29 410 000 35 978 000 39 735 000
030 Goods and Other Services 19 061 275 60 900 000 60 900 000 65 293 000 69 464 000
Total
080 Subsidies and other current transfers
041 Membership Fees And 21 000 115 000 115 000 118 000 122 000
Subscriptions: International
042 Membership Fees And 28 000 200 000 200 000 220 000 230 000
Subscriptions: Domestic
044-1 Social Grant 0 36 000 000 36 000 000 0 0
080 Subsidies and other current 49 000 36 315 000 36 315 000 338 000 352 000
transfers Total
110 Acquisition of capital assets
101 Furniture And Office 0 0 0 0 0
Equipment

135 | P a g e
110 Acquisition of capital 0 0 0 0 0
assets Total
300 Operational Budget Total 139 952 275
240 733 000
209 237 000
213 422 000
240 733 000
GRAND TOTAL 139 952 275 240 733 000 240 733 000 209 237 000 213 422 000

136 | P a g e
Vote number Vote Name Project Code Main Division Expenditure Item Project Name Savings
02 Prime Minister 20139 03 105 OPM Head Quater's Renovation 1 000 000
1 000 000
Vote number Vote Name Project Code Main Division Expenditure Item Project Name Savings
03 National Assembly 001219 02 107 Upgrading/Renovation Of Parliament Buildings 10 000 000
10 000 000
Vote number Vote Name Project Code Main Division Expenditure Item Project Name Savings
07 International Relations And Cooperation 018634 02 107
Renovation of the Ministryof International Relations and
Cooperation Head Quarter 18 000 000
639 06 105 Purchasing, Constructing and Renovating Diplomatic Premises 2 700 000
20 700 000
Vote number Vote Name Project Code Main Division Expenditure Item Project Name Savings
10 Education, Arts And Culture 005093 04 105 Construction Of School At Evululuko (Ongwediva Combined School) 4 598 000
005145 04 131 Upgrading Of Bravel Ps 2 402 000
005146 04 107 Construction Of Otjomuise Ps 3 210 000
018433 04 107 Construction Of A New Primary School: Swakopmund 6 049 000
018441 04 107 Construction Of New Primary School Rundu Rural West 4 008 000
18448 04 107 Construction Of Havana Primary School 5 602 000
018468 04 105 Construction Of Onguta Primary School 3 500 000
018471 04 107 Construction Of Oshakati South Primary School 4 853 000
018475 04 107 Construction Of Primary School At Tsaraxa-Aibes (Otjiwarongo) 413 000
018719 04 107 Structural Upgrading & Support To Community Hostels In
Erongo, Karas, Kavango & Omaheke 8 733 000
018803 04 107 Construction Of Otuzemba Primary School 2 911 000
018799 04 107 Construction Of Combined School: Aussenkehr 6 572 000
18801 04 107 Construction Of Mix Primary School 3 868 000
018797 04 107 Construction Of A Primary School For Walvis Bay 500 000
18798 04 107 Construction Of A New Combined School: Oranjemund 8 036 000
004174 04 107 Construction Of New Ps At Ehangano 3 590 000
005089 05 107 Construction Of Senior Secondary School In Grootfontein
(Donatus) 5 706 000
005096 05 107 Renovation Of Mureti Secondary School (Opuwo) 1 163 000
005249 05 107 Upgrading And Extension Of Oshikunde Ss 5 824 000
005251 05 107 Renovation And Upgrading Of Nehale Senior Secondary School 1 500 000
018449 05 107 Construction Of Havana Secondary School 2 433 000
018450 05 105 Otjomuise Secondary School 500 000
018464 05 105 Construction Of Etayi Senior Secondary School 500 000
86 471 000
Vote number Vote Name Project Code Main Division Expenditure Item Project Name Savings
14 Labour, Industrial Relations and Employment Creation 018263 03 107 Construction of the Ministry Of Labour'S Head Office 4 000 000
4 000 000
Vote number Vote Name Project Code Main Division Expenditure Item Project Name Savings
15 Mines and Energy 000749 5 107 Rural Electrification 19 559 000
Total 19 559 000
Vote number Vote Name Project Code Main Division Expenditure Item Project Name Savings
16 Justice 008072 02 107 High Court Upgrading 20 000 000
20 000 000
Vote number Vote Name Project Code Main Division Expenditure Item Project Name Savings
018143 05 131 Construction Of Services Infrastructure - Uukwangula 2 000 000
018142 05 131
Construction Of Services Infastructure (Water, Sewerage, Road, Etc) -
Eheke 3 000 000
018717 05 131 Costruction Of Services Oshakati 21 000 000
26 000 000
Summary of Savings Realized per Vote
Total
Total
Urban And Rural Development17
Total
Total
Total
Total
Total

137 | P a g e
Vote number Vote Name Project Code Main Division Expenditure Item Project Name Savings
19 Industrialisation, Trade And Sme Development 018240 02 107 Construction Of Ministry of Trade Headquarters (Trade House) 835 000
018126 03 107 External Trade Infrastructure Development 3 000 000
018883 03 105 Development National Single Window 9 500 000
018344 04 107 Garment Factories Development Programme 12 000 000
018345 04 107 Agro Processing Development 10 761 449
018575 04 105 Socio-Economic Development In Hardap And Karas Regions 4 000 000
018884 04 103 Product Development And Group Purchasing Project 1 000 000
020121 04 107 Construction Of Pharmaceutical Manufacturing Plant 17 000 000
020183 04 131 Agro Processing - Tomato Paste Production 11 000 000
69 096 449
Vote number Vote Name Project Code Main Division Expenditure Item Project Name Savings
18743 03 103 Beef Value Chain Development In The Northern Central Areas 2 000 000
18173 04 107
Upgrading Of Farm Infrastructure, Improvement Of Irrigation
Systems On Farms & Training Institutions 2 000 000
018846 04 103 Seed Production At Research Centre 3 000 000
008061 10 027 Water Resources Management 2 000 000
000240 12 103 Integrated Forest Resource Management 2 000 000
018848 12 103 De-Bushing In Commercial And Communal Areas 980 000
018871 05 022
Comprehensive Conservation Agriculture Programme For
Namibia 3 000 000
14 980 000
Vote number Vote Name Project Code Main Division Expenditure Item Project Name Savings
018764 04 107 Henties Bay Satellite Office 1 700 000
018141 04 131
Extension/ Construction Of Offices Of Fisheries Observer
Agency In Walvis Bay 1 228 000
2 928 000
Vote number Vote Name Project Code Main Division Expenditure Item Project Name Savings
325 03 107 Government Offices-Voltaic and Electrification Installation 1 515 000
325 03 105 Government Offices-Voltaic and Electrification Installation 179 000
327 03 105 Infrastructure Investigation 1 200 000329 03 107 Ministerial Head Quarters 889 313
3 783 313
Vote number Vote Name Project Code Main Division Expenditure Item Project Name Savings
20191 05 107 Rehabilitation of Eros Airport 40 000 000
20195 05 107 Upgrading of Mpacha Airport 10 000 000
50 000 000
Vote number Vote Name Project Code
Main Division Expenditure Item
Project Name Savings
18334 02 107 Construction of Ministerial Regional Office in Katima Mulilo 4 000 000
18844 02 107 Upgrading of the Ministerial Regional Office in Outapi 4 000 000
18653 05
027
Upgrading of Computerised Deeds RegistrationSystem to
Version 3.0 1 000 000
Total 9 000 000
Vote number Vote Name Project Code Main Division Expenditure Item Project Name Savings
20051 03 105 Construction of Nkurenkure Multi-purpose Resource Centre 500 000
900 03 107
Fran'S Dim Bare Integrated Rural Youth Development Centre
Constrcution 3 000 000
20052 06 105 Constrcution of Nkurenkure Sport Complex 500 000
2094 06 107 Eenhana Sport Complex Constrcution 3 879 443
18628 06 107 Renovation of Katimamulilo Sports Stadium 8 544 000
16 423 443
Vote number Vote Name Project Code Main Division Expenditure Item Project Name Savings
018352 03 105 Erection and Perservation Of Liberation Struggle Monuments 2 000 000
018352 03 107 Erection and Perservation Of Liberation Struggle Monuments 500 000
2 500 000
Vote number Vote Name Project Code Main Division Expenditure Item Project Name Savings
32 Higher Education, Training And Innovation008100 03 131 Construction Of Namibia Qualification Authority Office (NQA
House) 9 000 000
9 000 000
365 441 205
Land Reform25
Total
Fisheries And Marine Resources22
GRAND TOTAL
Total
27 Sport, Youth And National Service
Total
23
Veterans Affairs31
Total
Total
Transport24
Total
Total
Agriculture, Water And Forestry20
Total
Works
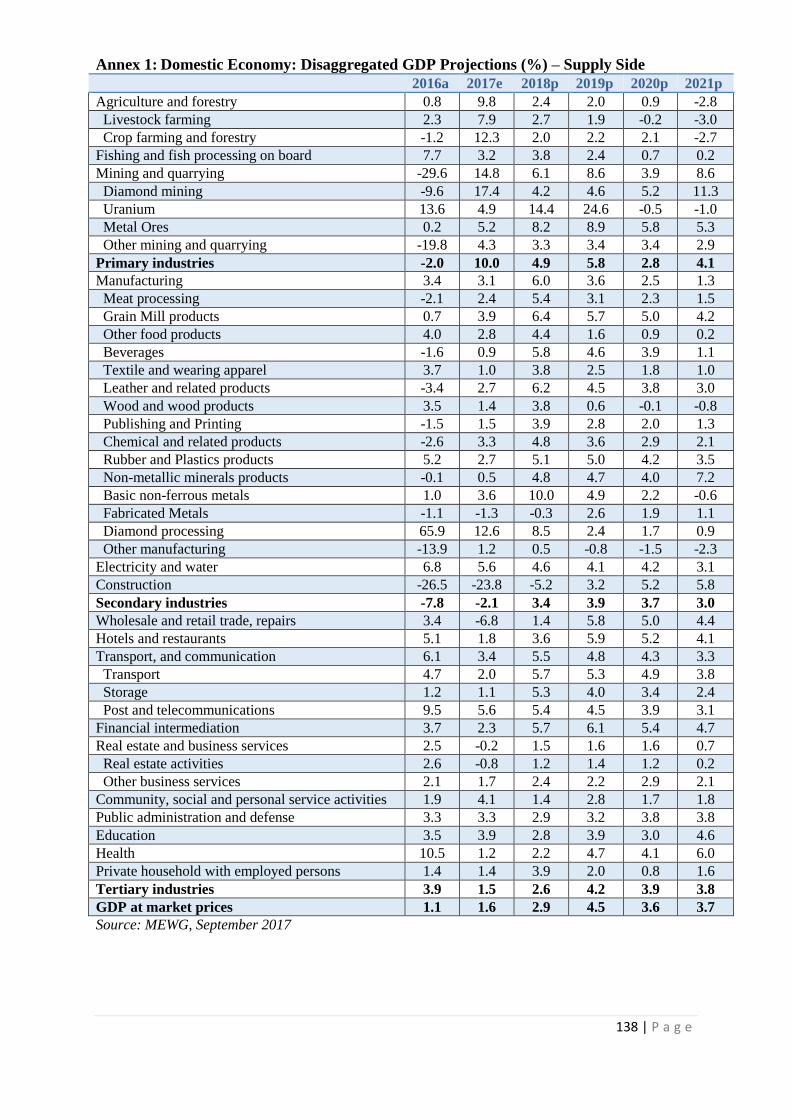
138 | P a g e
Annex 1: Domestic Economy: Disaggregated GDP Projections (%) – Supply Side
2016a 2017e 2018p 2019p 2020p 2021p
Agriculture and forestry 0.8 9.8 2.4 2.0 0.9 -2.8
Livestock farming 2.3 7.9 2.7 1.9 -0.2 -3.0
Crop farming and forestry -1.2 12.3 2.0 2.2 2.1 -2.7
Fishing and fish processing on board 7.7 3.2 3.8 2.4 0.7 0.2
Mining and quarrying -29.6 14.8 6.1 8.6 3.9 8.6
Diamond mining -9.6 17.4 4.2 4.6 5.2 11.3
Uranium 13.6 4.9 14.4 24.6 -0.5 -1.0
Metal Ores 0.2 5.2 8.2 8.9 5.8 5.3
Other mining and quarrying -19.8 4.3 3.3 3.4 3.4 2.9
Primary industries -2.0 10.0 4.9 5.8 2.8 4.1
Manufacturing 3.4 3.1 6.0 3.6 2.5 1.3
Meat processing -2.1 2.4 5.4 3.1 2.3 1.5
Grain Mill products 0.7 3.9 6.4 5.7 5.0 4.2
Other food products 4.0 2.8 4.4 1.6 0.9 0.2
Beverages -1.6 0.9 5.8 4.6 3.9 1.1
Textile and wearing apparel 3.7 1.0 3.8 2.5 1.8 1.0
Leather and related products -3.4 2.7 6.2 4.5 3.8 3.0
Wood and wood products 3.5 1.4 3.8 0.6 -0.1 -0.8
Publishing and Printing -1.5 1.5 3.9 2.8 2.0 1.3
Chemical and related products -2.6 3.3 4.8 3.6 2.9 2.1
Rubber and Plastics products 5.2 2.7 5.1 5.0 4.2 3.5
Non-metallic minerals products -0.1 0.5 4.8 4.7 4.0 7.2
Basic non-ferrous metals 1.0 3.6 10.0 4.9 2.2 -0.6
Fabricated Metals -1.1 -1.3 -0.3 2.6 1.9 1.1
Diamond processing 65.9 12.6 8.5 2.4 1.7 0.9
Other manufacturing -13.9 1.2 0.5 -0.8 -1.5 -2.3
Electricity and water 6.8 5.6 4.6 4.1 4.2 3.1
Construction -26.5 -23.8 -5.2 3.2 5.2 5.8
Secondary industries -7.8 -2.1 3.4 3.9 3.7 3.0
Wholesale and retail trade, repairs 3.4 -6.8 1.4 5.8 5.0 4.4
Hotels and restaurants 5.1 1.8 3.6 5.9 5.2 4.1
Transport, and communication 6.1 3.4 5.5 4.8 4.3 3.3
Transport 4.7 2.0 5.7 5.3 4.9 3.8
Storage 1.2 1.1 5.3 4.0 3.4 2.4
Post and telecommunications 9.5 5.6 5.4 4.5 3.9 3.1
Financial intermediation 3.7 2.3 5.7 6.1 5.4 4.7
Real estate and business services 2.5 -0.2 1.5 1.6 1.6 0.7
Real estate activities 2.6 -0.8 1.2 1.4 1.2 0.2
Other business services 2.1 1.7 2.4 2.2 2.9 2.1
Community, social and personal service activities 1.9 4.1 1.4 2.8 1.7 1.8
Public administration and defense 3.3 3.3 2.9 3.2 3.8 3.8
Education 3.5 3.9 2.8 3.9 3.0 4.6
Health 10.5 1.2 2.2 4.7 4.1 6.0
Private household with employed persons 1.4 1.4 3.9 2.0 0.8 1.6
Tertiary industries 3.9 1.5 2.6 4.2 3.9 3.8
GDP at market prices 1.1 1.6 2.9 4.5 3.6 3.7
Source: MEWG, September 2017

139 | P a g e
Annex 2: GOVERNMENT OPERATIONSActualActual Estimates Estimates Estimates Estimates Estimates
(N$ In Millions) 2011/122015/16 2016/17 2017/18 2018/19 2019/20 2020/21
GDP in Fiscal Year 149,115 164,156 176,119 186,714 198,222 210,439
Taxes on income and profits
Normal Income Tax on Individuals 10,794 12,002 12,398 12,885 13,679 14,068
Diamond Mining Companies 2,199 1,611 2,056 2,268 2,221 2,466
Other Mining Companies 99 92 154 106 115 115
Non-Mining Companies 5,425 6,006 6,055 6,580 7,100 7,151
Non-Resident Shareholders Tax 147 266 168 179 190 201
Tax on Royalty 41 87 89 66 70 75
Annual Levy on Gambling Income 21 21 23 23 24 24
Withholding tax on companies & individuals 61 290 114 120 128 136
Withholding Tax on Unit Trusts 85 84 97 103 109 116
Withholding Tax on services 134 148 134 142 151 160
Taxes on income and profits 19,004 20,607 21,288 22,473 23,787 24,512
TAXES ON PROPERTY 313 284 292 313 337 337
Taxes on property 313 284 292 313 337 337
Domestic taxes on goods and services
VAT 11,678 11,978 11,685 12,517 13,043 13,965
Levy on Fuel 209 315 256 312 331 306
Other on goods and services 14 27 18 18 18 18
Environmental levies and Carbon Emission taxes 0 67 70 70 71 73
Domestic taxes on goods and services 11,901 12,387 12,028 12,917 13,463 14,361
Taxes on international trade 17,355 14,071 19,597 17,371 18,678 19,804
Other taxes
Stamp Duties and Fees 216 183 299 304 331 339
Other taxes 216 183 299 304 331 339
Total Tax Revenue 48,789 47,532 53,505 53,378 56,597 59,354
Entrepreneurial and property income
Interest Receipts for Loans Extended to - 16 5 6 6 6 6
Interest on Investments 0 0 822 729 647 574
Dividends and Profit Share from: 1,036 927 5 5 5 5
Interest on State Account Balances with BON 19 5 6 8 13 13
Diamond Royalties 1,060 978 997 999 999 1,001
Other Mineral Royalties 309 391 399 522 533 543
Entrepreneurial and property income 2,440 2,305 2,234 2,270 2,202 2,142
Fines and forfeitures 78 67 68 68 68 68
Other Licence fees
Fishing Quota Levies 113 108 123 123 123 123
Gambling Licence (Business) 1 2 2 2 2 2
Sub-Total 114 110 125 125 125 125
Administrative fees 706 835 726 735 751 768
Total Non-Tax Revenue 3,259 3,140 2,960 3,004 2,953 2,910
Return of principal capital from Lending 15 16 15 16 16 16
Total revenue (own sources) 52,048 50,849 56,658 56,576 59,744 62,457
Grants 152 0 50 25 20 30
Loans earmarked for on-lending 1 0 0 0 0 0
Total Revenue and Grants 52,215 50,865 56,723 56,617 59,780 62,503
As % of GDP 34.3% 31.0% 32.2% 30.3% 30.2% 29.7%
Estimates Estimates Estimates Estimates Estimates
Expenditure 2016/17 2017/18 2018/19 2019/20 2020/21
Operational & Development Expenditure
Social Sector 25,664 28,403 29,753 28,250 28,319 28,871
Public Safety Sector 11,938 12,126 13,135 12,442 12,472 12,716
Administrative Sector 4,970 6,642 4,915 4,655 4,666 4,758
Economic Sector 6,654 6,633 8,916 8,446 8,466 8,632
Infrastructure Sector 2,908 4,549 4,893 4,634 4,646 4,737 Expenditure, MTEF 52,134 58,353 61,612 58,427 58,569 59,713
Total Operational & Development Expenditure 61,947 58,353 61,612 58,427 58,569 59,713
As % of GDP 42% 36% 35% 31% 30% 28%
Sectoral as % total Expenditure
Social Sector 43% 17% 17% 15% 14% 14%
Public Safety Sector 22% 7% 7% 7% 6% 6%
Administrative Sector 11% 4% 3% 2% 2% 2%
Economic Sector 15% 4% 5% 5% 4% 4%
Infrastructure Sector 9% 3% 3% 2% 2% 2%
Primary Budget Balance -9,731 -7,488 -4,889 -1,810 1,211 2,790
As % of GDP -7% -5% -3% -1% 1% 1%
Domestic Interest Payments 12,423 2,532 3,007 3,466 3,940 3,971
Foreign Interest Payments 1,342 1,923 2,216 2,519 2,539
Capitalisation of Infrastructure Fund 1 350 500 700
Interest Payments 12,423 3,875 4,930 6,032 6,959 7,209
As % of GDP 8.3% 2.4% 2.8% 3.2% 3.5% 3.4%
As % of Revenue 23.8% 7.6% 8.7% 10.7% 11.6% 11.5%
Total Expenditure 74,370 62,228 66,093 64,459 65,528 66,922
As % of GDP 50% 38% 38% 35% 33% 32%
Budget Balance -22,154 -11,363 -9,369 -7,842 -5,748 -4,419As % of GDP -6.1% -6.9% -5.3% -4.2% -2.9% -2.1%
Domestic Debt Stock 36,603 45,981 48,963 53,919 57,076Foreign Debt 26,262 28,249 31,249 32,249 32,176New ProjectsADB Loan Mechanisation program for Agric 500 500ADB Loan Transport (Rail ZAR1,350) 450 450 450ADB Loan Transport (Hosea Kutako Road) 24,327,000 217 217 217
ADB Loan Basic Education (School Renovation) 12,404,405 333 333 333
Total Foreign Debt 26,262 28,249 32,249 33,749 33,676
Gross Total Debt 62,865 74,230 80,212 86,168 89,252
Net Debt (Less Investment) 56,499 69,210 74,892 79,248 82,152
Redemption Accounts (IRSRA, Local Bonds) 1,600 850 1,150 2,750 2,930
Redemption Accounts (Eurobond) 4,766 4,170 4,170 4,170 4,170
Total Investments 6,366 5,020 5,320 6,920 7,100
As a % of GDP
Domestic Debt Stock 16314.25% 22.30% 26.11% 26.22% 27.20% 27.12%
Foreign Debt Stock 8318.68% 16.00% 16.04% 17.27% 17.03% 16.00%
Total Debt Stock 24632.9% 38.3% 42.1% 43.5% 44.2% 43.1%
Net Debt Stock 34.4% 39.3% 40.1% 40.0% 39.0%
Guarantees
Domestic Guarantee 798,328 1,290 1,151 3,151 4,151 5,151
Foreign Guarantee 5,591,672 4,313 11,812 11,812 11,212 11,612
Total Guarantees 6,390,000 5,603 12,963 14,963 15,363 16,763
As a % of GDP 4.4% 3.4% 7.4% 8.0% 7.8% 8.0%

140 | P a g e
ANNEX 3: OPARATIONAL BUDGET EXECUTION RATE UP TO SEPT 2017
Vote Vote nameExcecution Rate
16/17
Excecution Rate
17/18
% %
1 President 38% 43%
2 Prime Minister 45% 37%
3 National Assembly 46% 39%
4 Auditor General 47% 42%
5 Home Affairs and Immigration 46% 55%
6 Police 45% 52%
7International Relations and
Cooperation52% 54%
8 Defence 45% 50%
9 Finance 56% 55%
10 Education, Arts and Culture 44% 54%
11 National Council 45% 39%
12Gender Equality and Child
Welfare42% 42%
13 Health and Social Services 54% 47%
14Labour, Industrial Relations
and Employment Creation44% 49%
15 Mines and Energy 52% 35%
16 Justice 45% 34%
17 Urban and Rural Development 36% 37%
18 Environment and Tourism 56% 45%
19Industrialisation, Trade and
SME Development45% 35%
20Agriculture, Water and
Forestry46% 65%
21 Judiciary 47% 47%
22Fisheries and Marine
Resources46% 43%
23 Works 52% 47%
24 Transport 55% 52%
25 Land Reform 41% 39%
26 National Planning Commission 37% 37%
27Sport, Youth and National
Service49% 43%
28Electoral Commission of
Namibia29% 37%
29Information and
Communication Technology45% 60%
30 Anti-Corruption Commission 49% 47%
31 Veterans Affairs 42% 42%
32Higher Education, Training and
Innovation35% 58%
33Poverty Eradication and Social
Welfare39% 49%
34 Public Enterprises 22% 40%
35 Attorney General 62% 55%
Overall 46% 51%

141 | P a g e
ANNEX 4: DEVELOPMENT BUDGET EXECUTION RATE UP TO SEPT 2017
Vote Vote name Excecution Rate 16/17 Excecution Rate 17/18
% %
1 President 51% 19%
2 Prime Minister 2% 0%
3 National Assembly 79% 2%
4 Auditor General 0% 0%
5 Home Affairs and Immigration 42% 34%
6 Police 52% 62%
7 International Relations and Cooperation 86% 5%
8 Defence 60% 49%
9 Finance 46% 0%
10 Education, Arts and Culture 19% 35%
11 National Council 13% 0%
12 Gender Equality and Child Welfare 40% 9%
13 Health and Social Services 24% 43%
14 Labour, Industrial Relations and Employment Creation 31% 4%
15 Mines and Energy 26% 3%
16 Justice 74% 10%
17 Urban and Rural Development 24% 19%
18 Environment and Tourism 37% 36%
19 Industrialisation, Trade and SME Development 33% 14%
20 Agriculture, Water and Forestry 73% 68%
21 Judiciary 0% 0%
22 Fisheries and Marine Resources 20% 16%
23 Works 14% 14%
24 Transport 45% 26%
25 Land Reform 42% 27%
26 National Planning Commission 0% 0%
27 Sport, Youth and National Service 17% 2%
28 Electoral Commission of Namibia 22% 0%
29 Information and Communication Technology 74% 37%
30 Anti-Corruption Commission 0% 0%
31 Veterans Affairs 15% 27%
32 Higher Education, Training and Innovation 1% 19%
33 Poverty Eradication and Social Welfare 2% 0%
34 Public Enterprises 0% 0%
35 Attorney General 0% 0%
Overall 42% 34%