Embed Size (px)
Citation preview
1
ASIA-PACIFIC FORESTRY SECTOR OUTLOOK STUDY II
WORKING PAPER SERIES
Working Paper No. APFSOS II/WP/2012/34
REPUBLIC OF KOREA FORESTRY OUTLOOK
STUDY1
FOOD AND AGRICULTURE ORGANIZATION OF THE UNITED NATIONS
REGIONAL OFFICE FOR ASIA AND THE PACIFIC
Bangkok, 2012
1 Contributing authors: Rin Won Joo (Director, Korea Forest Research Institute); Byung Heon
Jung (Researcher, Korea Forest Research Institute); Seong Youn Lee (Researcher, Korea Forest
Research Institute); Jae Soo Bae (Researcher, Korea Forest Research Institute); Kyongha Kim (Senior
Researcher, Korea Forest Research Institute); Sang-Yoel Han (Professor, Kyungpook National
University); Jong-Hwan Lim (Senior Researcher, Korea Forest Research Institute); Kyeong-hak Lee
(Director, Korea Forest Research Institute); Rheehwa Yoo (Researcher, Korea Forest Research
Institute).
APFSOS II: Republic of Korea
2
Contents
EXECUTIVE SUMMARY…………………………………………………………………..4
1. INTRODUCTION………………………………………………………………………..10
Objectives………………………………………………………………………………….....10
Scope of the study…………………………………………………………….........................10
Methodology………………………………………..………………………………………...11
Structure of the report………………………………………………..……………………….12
2. BACKGROUND INFORMATION……………………………………………………..13
Changes in social value of forests……………………………………………….…………...13
Contribution of forest sector………………………………………………………………….14
State of the world’s forest resources………………………………………………………….16
3. TRENDS AND BASE PROJECTIONS…………………………………………………18
Assumptions…………………………………………………………………………………..18
Historical trends and projections ……………………………………………………………..24
4. ALTERNATIVE SCENARIOS…………………………………………………………..71
Population changes…………………………………………………………………………...72
Changes in GDP growth rate and investment in construction sector…………………………76
Market
liberalization……………………………………………………………………………….....77
5. CONCLUSION AND RECOMMENDATIONS……………………………….….……80
Major results…………………………………………………………………………..……...80
Implications for sustainable forest management………………………………….….………83
Policy recommendations…………………………………………………….………….…….84
6. REFERENCES………………………………………………………………..…………..87
APFSOS II: Republic of Korea
3
INFORMATION NOTE ON THE ASIA-PACIFIC FORESTRY SECTOR OUTLOOK STUDY
The Asia-Pacific Forestry Sector Outlook Study (APFSOS) is a wide-ranging initiative to gather
information on, and examine, the evolution of key forestry issues as well as to review important trends
in forests and forestry. The main purpose of the study is to provide a better understanding of the
changing relationships between society and forests and thus to facilitate timely policy reviews and
reforms in national forest sectors. The specific objectives are to:
1. Identify emerging socio-economic changes impacting on forest and forestry
2. Analyze probable scenarios for forestry developments to 2020
3. Identify priorities and strategies to address emerging opportunities and challenges
The first APFSOS was completed in 1998, with an outlook horizon to 2010. During its twenty-first
session, held in Dehradun, India, in April 2006, the Asia-Pacific Forestry Commission (APFC) resolved
to update the outlook extending the horizon to 2020. The study commenced in October 2006 and is
expected to be completed by September 2009.
The study has been coordinated by the Food and Agriculture Organization of the United Nations
(FAO), through its regional office in Bangkok and its headquarters in Rome, and implemented in close
partnership with APFC member countries with support from a number of international and regional
agencies. The Asian Development Bank (ADB), the International Tropical Timber Organization
(ITTO), and the United Kingdom’s Department for International Development (DFID) provided
substantial financial support to implement the study. Partnerships with the Asia-Pacific Association of
Forest Research Institutes (APAFRI) and the Secretariat of the Pacific Community (SPC) supported the
organizing and implementing of national focal points’ workshops and other activities, which have been
crucial to the success of this initiative. The contributions of many other individuals and institutions are
gratefully acknowledged in the main APFSOS report.
Working papers have been contributed or commissioned on a wide range of topics. These fall under the
following categories: country profiles, sub-regional studies and thematic studies. Working papers have
been prepared by individual authors or groups of authors and represent their personal views and
perspectives; therefore, opinions expressed do not necessarily reflect the views of their employers, the
governments of the APFC member countries or of FAO. Material from these working papers has been
extracted and combined with information from a wide range of additional sources to produce the main
regional outlook report.
Working papers are moderately edited for style and clarity and are formatted to provide a measure of
uniformity, but otherwise remain the work of the authors. Copies of these working papers, as well as
more information on the Asia-Pacific Forestry Sector Study, can be obtained from:
Mr. Patrick Durst
Senior Forestry Officer
FAO Regional Office for Asia and the Pacific
39 Phra Atit Road
Bangkok 10200
THAILAND
Ph. (66-2) 697 4000
Fax: (66-2) 697 4445
Email: [email protected]
APFSOS II: Republic of Korea
4
EXECUTIVE SUMMARY
Introduction
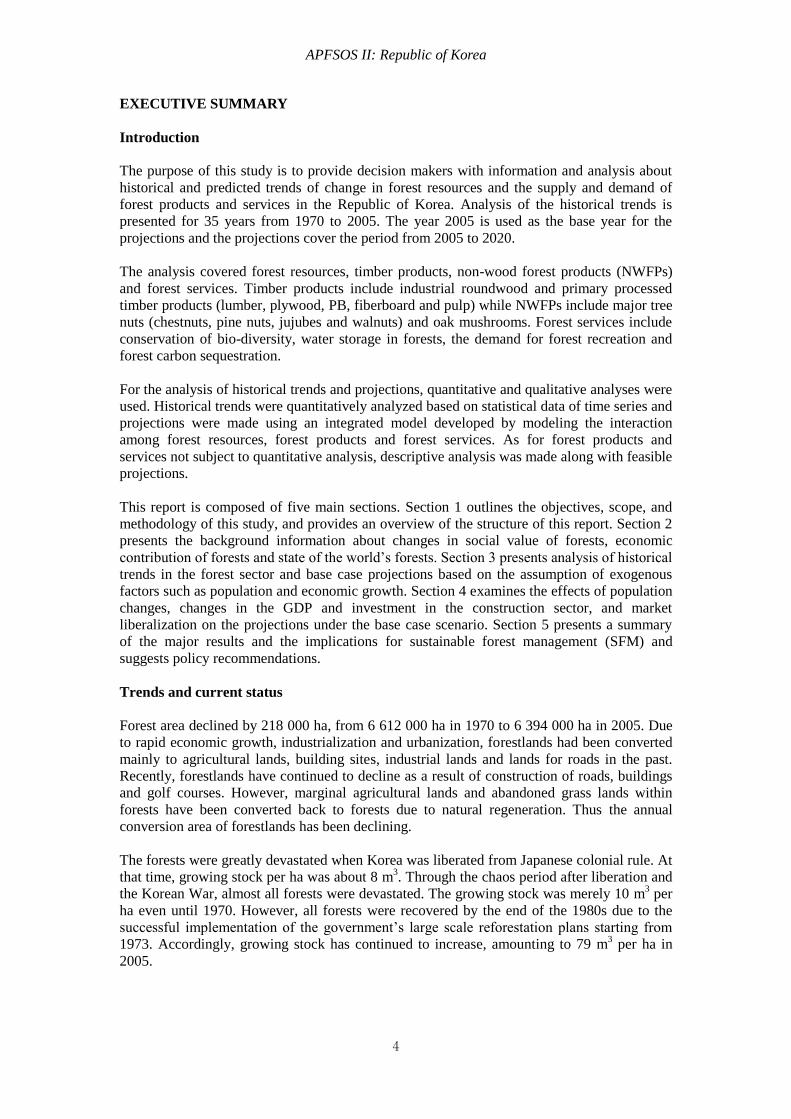
The purpose of this study is to provide decision makers with information and analysis about
historical and predicted trends of change in forest resources and the supply and demand of
forest products and services in the Republic of Korea. Analysis of the historical trends is
presented for 35 years from 1970 to 2005. The year 2005 is used as the base year for the
projections and the projections cover the period from 2005 to 2020.
The analysis covered forest resources, timber products, non-wood forest products (NWFPs)
and forest services. Timber products include industrial roundwood and primary processed
timber products (lumber, plywood, PB, fiberboard and pulp) while NWFPs include major tree
nuts (chestnuts, pine nuts, jujubes and walnuts) and oak mushrooms. Forest services include
conservation of bio-diversity, water storage in forests, the demand for forest recreation and
forest carbon sequestration.
For the analysis of historical trends and projections, quantitative and qualitative analyses were
used. Historical trends were quantitatively analyzed based on statistical data of time series and
projections were made using an integrated model developed by modeling the interaction
among forest resources, forest products and forest services. As for forest products and
services not subject to quantitative analysis, descriptive analysis was made along with feasible
projections.
This report is composed of five main sections. Section 1 outlines the objectives, scope, and
methodology of this study, and provides an overview of the structure of this report. Section 2
presents the background information about changes in social value of forests, economic
contribution of forests and state of the world’s forests. Section 3 presents analysis of historical
trends in the forest sector and base case projections based on the assumption of exogenous
factors such as population and economic growth. Section 4 examines the effects of population
changes, changes in the GDP and investment in the construction sector, and market
liberalization on the projections under the base case scenario. Section 5 presents a summary
of the major results and the implications for sustainable forest management (SFM) and
suggests policy recommendations.
Trends and current status
Forest area declined by 218 000 ha, from 6 612 000 ha in 1970 to 6 394 000 ha in 2005. Due
to rapid economic growth, industrialization and urbanization, forestlands had been converted
mainly to agricultural lands, building sites, industrial lands and lands for roads in the past.
Recently, forestlands have continued to decline as a result of construction of roads, buildings
and golf courses. However, marginal agricultural lands and abandoned grass lands within
forests have been converted back to forests due to natural regeneration. Thus the annual
conversion area of forestlands has been declining.
The forests were greatly devastated when Korea was liberated from Japanese colonial rule. At
that time, growing stock per ha was about 8 m3. Through the chaos period after liberation and
the Korean War, almost all forests were devastated. The growing stock was merely 10 m3 per
ha even until 1970. However, all forests were recovered by the end of the 1980s due to the
successful implementation of the government’s large scale reforestation plans starting from
1973. Accordingly, growing stock has continued to increase, amounting to 79 m3 per ha in
2005.
APFSOS II: Republic of Korea
5
Rapid economic growth, population increase and expansion of the construction market
resulted in increased demand for timber products. Consumption of all timber products except
for hardwood lumber has increased rapidly.
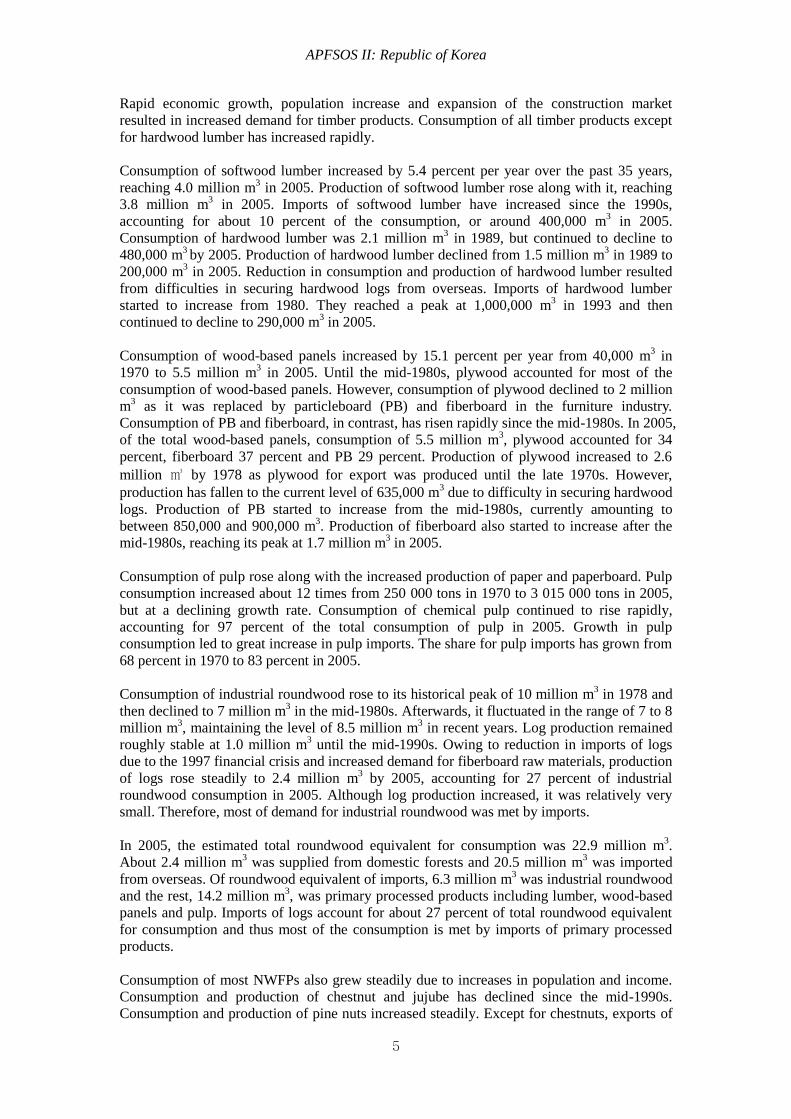
Consumption of softwood lumber increased by 5.4 percent per year over the past 35 years,
reaching 4.0 million m3 in 2005. Production of softwood lumber rose along with it, reaching
3.8 million m3 in 2005. Imports of softwood lumber have increased since the 1990s,
accounting for about 10 percent of the consumption, or around 400,000 m3 in 2005.
Consumption of hardwood lumber was 2.1 million m3 in 1989, but continued to decline to
480,000 m3 by 2005. Production of hardwood lumber declined from 1.5 million m
3 in 1989 to
200,000 m3 in 2005. Reduction in consumption and production of hardwood lumber resulted
from difficulties in securing hardwood logs from overseas. Imports of hardwood lumber
started to increase from 1980. They reached a peak at 1,000,000 m3 in 1993 and then
continued to decline to 290,000 m3 in 2005.
Consumption of wood-based panels increased by 15.1 percent per year from 40,000 m3 in
1970 to 5.5 million m3 in 2005. Until the mid-1980s, plywood accounted for most of the
consumption of wood-based panels. However, consumption of plywood declined to 2 million
m3 as it was replaced by particleboard (PB) and fiberboard in the furniture industry.
Consumption of PB and fiberboard, in contrast, has risen rapidly since the mid-1980s. In 2005,
of the total wood-based panels, consumption of 5.5 million m3, plywood accounted for 34
percent, fiberboard 37 percent and PB 29 percent. Production of plywood increased to 2.6
million ㎥ by 1978 as plywood for export was produced until the late 1970s. However,
production has fallen to the current level of 635,000 m3 due to difficulty in securing hardwood
logs. Production of PB started to increase from the mid-1980s, currently amounting to
between 850,000 and 900,000 m3. Production of fiberboard also started to increase after the
mid-1980s, reaching its peak at 1.7 million m3 in 2005.
Consumption of pulp rose along with the increased production of paper and paperboard. Pulp
consumption increased about 12 times from 250 000 tons in 1970 to 3 015 000 tons in 2005,
but at a declining growth rate. Consumption of chemical pulp continued to rise rapidly,
accounting for 97 percent of the total consumption of pulp in 2005. Growth in pulp
consumption led to great increase in pulp imports. The share for pulp imports has grown from
68 percent in 1970 to 83 percent in 2005.
Consumption of industrial roundwood rose to its historical peak of 10 million m3 in 1978 and
then declined to 7 million m3 in the mid-1980s. Afterwards, it fluctuated in the range of 7 to 8
million m3, maintaining the level of 8.5 million m
3 in recent years. Log production remained
roughly stable at 1.0 million m3 until the mid-1990s. Owing to reduction in imports of logs
due to the 1997 financial crisis and increased demand for fiberboard raw materials, production
of logs rose steadily to 2.4 million m3 by 2005, accounting for 27 percent of industrial
roundwood consumption in 2005. Although log production increased, it was relatively very
small. Therefore, most of demand for industrial roundwood was met by imports.
In 2005, the estimated total roundwood equivalent for consumption was 22.9 million m3.
About 2.4 million m3 was supplied from domestic forests and 20.5 million m
3 was imported
from overseas. Of roundwood equivalent of imports, 6.3 million m3 was industrial roundwood
and the rest, 14.2 million m3, was primary processed products including lumber, wood-based
panels and pulp. Imports of logs account for about 27 percent of total roundwood equivalent
for consumption and thus most of the consumption is met by imports of primary processed
products.
Consumption of most NWFPs also grew steadily due to increases in population and income.
Consumption and production of chestnut and jujube has declined since the mid-1990s.
Consumption and production of pine nuts increased steadily. Except for chestnuts, exports of
APFSOS II: Republic of Korea
6
tree nuts are negligible. About 30 percent of chestnut production is exported. Imports of
chestnuts, pine nuts and jujubes have gradually increased since markets were opened by
conclusion of the Urugay Round (UR) negotiation. However, the share of imports for
consumption is not high; 14 percent for chestnuts, 11 percent for pine nuts and 5 percent for
jujubes. Consumption of walnuts rose rapidly but production somewhat declined and was
relatively small. Thus, imports of walnuts increased significantly, accounting for 90 percent
of consumption. Consumption of oak mushrooms rose rapidly along with production growth.
The growth rate of consumption exceeded that of production, leading to steady growth in
imports to fill the shortfall between production and consumption.
Demand for environmental services provided by forests rapidly increased. Social demand for
conservation of biodiversity and conservation of forest soil and water increasingly attracted
people’s attention. Increased disposable income and leisure time, improved infrastructure in
rural areas, and an increase in the number of self-driving vehicles accelerated the demand for
forest recreation. Recently, with greater interest in global warming, interest in forest carbon
storage function has risen. As forest resources were expanded quantitatively and improved
qualitatively, potential for supply of their environmental services was enhanced greatly.
Various policies to expand the supply of forest services are being implemented as well.
Outlook
Population is expected to show continued growth over the projection period. GDP growth and
investment in the construction sector are also projected to increase over the next 15 years.
However, the growth rate will be lower than in the past. Population will reach its peak in 2018
and then is projected to decline by 2020. The annual growth of GDP is expected to drop from
4.5 percent to 4.3 percent in 2020. The growth rate of investment in the construction sector is
projected to be lower than the GDP growth rate and will increase by 2.1 percent per year over
the projection period.
Based on these projections for exogenous factors, the forest area is projected to decline until
mid-2010 and then increase through 2020. The forest area will decline gradually, reaching the
lowest level in mid-2010, and then rise to 6 382 000 ha in 2020. The annual conversion area
of forestlands will continue to decline while the area converted from marginal agricultural and
grass lands to forests is expected to increase gradually.
Over the projection period, the growing stock will continue to increase due to the annual
increment exceeding the annual removals. The forest growing stock is projected to rise from
506 million m3 in 2005 to 727 million m
3 in 2020. The growing stock per ha will increase
from 79 m3 in 2005 to 114 m
3 in 2020.
Consumption of timber products is expected to show stable growth. Over the next 15 years,
the annual growth rate in consumption is projected to be 1.2 percent for lumber, 2.0 percent
for wood-based panels, and 0.3 percent for pulp. The annual growth rate in production will be
1.1 percent for lumber, and 0.6 percent for wood-based panels. Thus increasing share of
consumption will be met by imports through 2020.
The total roundwood equivalent of consumption of timber products is expected to rise by 1.0
percent per year over the next 15 years, to 26.5 million m3 in 2020. The share of pulp will
drop and the share of lumber and wood-based panels will rise accordingly. The volume of
logs from domestic forests is projected to increase by 1.8 million m3 between 2005 and 2020,
reaching 4.2 million m3 in 2020 due to increasing growing stock. The ratio of log production
to the roundwood equivalent of consumption will increase from 10 percent in 2005 to 16
percent in 2020, somewhat easing the dependency on imports.
Future trends in consumption and production of NWFPs will vary by product. Consumption
APFSOS II: Republic of Korea
7
and production of chestnuts are expected to remain stable at the current level. Consumption
and production of jujubes are expected to increase slightly from the current level.
Consumption of pine nuts and walnuts is projected to increase rapidly. However, production
of pine nuts will increase slightly while production of walnuts will drop somewhat.
Consumption of oak mushrooms is projected to rise rapidly but their production is projected
to decline slightly.
Demand for forest services will increase even more and become diversified. To expand the
supply of forest services, the government formulated and has been implementing various
plans, including a basic plan for forest biodiversity, projects for construction of green dams
and basic plans for forest recreation and expansion of carbon sinks. These government
policies will have significant impacts on the supply of forest services in the future.
Implications for sustainable forest management
Forest fires have recently increased in frequency and damage from forest fires is getting larger
in scale. Damage from pests and diseases is also increasing. Forest fires and pests and
diseases will continue to occur, damaging the health and vitality of the forest ecosystem.
However, it is almost impossible to predict the occurrence of damage from forest fires, pests
and diseases. Therefore, taking precautionary measures is critical to prevent the negative
effects on future forest resources.
Coniferous forest area accounts for 57 percent because the government policy focused on
establishing coniferous species plantations in the past. Recently, however, plantation area of
non-coniferous species is expanding and thus the coniferous forest area is projected to decline
slightly, accounting for 55 percent in 2020. Korean forests are mostly rehabilitated secondary
forests with the initial and intermediate stages of ecological succession. Therefore, mature
forests of over 60 years of age are rare. The existing age-class structure of mostly 30 years
will change into one of 40 to 50 years. Reduction in coniferous forest area and increases in the
mature forests will have positive impacts on the conservation of biodiversity. The area of
protected forests is also expected to increase, positively affecting the conservation of
biodiversity.
Forest resources will greatly expand in quantity. In addition, the quality of forest resources
will be improved if the government-led intensive management is implemented as planned. If
the current trends in population changes are sustained and policy on agricultural lands
changes little, the forest area will slightly decline from the current level of 6,394,000 ha to
6,372,000 ha by the mid-2010s, and then slightly increase to 6,382,000 ha by 2020. The ratio
of removals to increment was about 19 percent in 2005 and is expected to increase to 30
percent in 2020. However, growing stock will continue to increase due to increment
exceeding removal. Therefore, production capacity of the forest ecosystem will be either
maintained or somewhat enhanced.
Due to expanded forest resources, production of roundwood will increase until 2020.
Production of NWFPs is expected to remain roughly stable at the current level. Owing to
increase in the age of stand and intensive management, soil will be developed further,
increasing the forests’ water storage capacity from 18.8 billion tons in 2005 to 19.6 billion
tons in 2020. Because of the continued investment increases in forest recreation resources,
expanding forest recreation opportunities will fulfill increasing demand for recreation. Forests
will play a more important role as a carbon sink due to the expansion of forest resources.
Therefore, socio-economic benefits provided by forests will continue to rise.
In conclusion, if preventive measures are taken to prevent forest damage that degrades the
health and vitality of forests, and a system is introduced to achieve social consensus for
harmony between forest conservation and development, sustainability of forests will be

APFSOS II: Republic of Korea
8
enhanced and the forest sector will further contribute to sustainable development.
Policy recommendations
The existing age-class structure tilted to a single tree age will change little over the projection
period. Such a structure is not desirable in conserving biodiversity and maintaining forest
sustainability. Long-term efforts are required to realign into a uniform age-class structure
through conserving old natural forests and adopting various felling ages and silvicultural
systems for the production forest.
Over the past decades, reforestation-oriented measures have been taken to recover degraded
forestlands as early as possible. Thus, follow-up management for reforested areas has not
been appropriately conducted and this has made forest resources extremely vulnerable to the
outbreak of pests and diseases as well as forest fires. In order to maintain the health of forests,
policy support must be strengthened for forest-tending projects implemented to curb the
unemployment problem arising in the aftermath of the financial crisis of 1997.
Small-diameter thinned logs are produced in significant quantities from the forest-tending
projects but they are left within forests without being industrially utilized because of high
harvesting and transportation costs. Therefore, measures are urgently required to expand
government support for continuous implementation of intensive management and also to
expand the use of small-diameter thinned logs.
Lower removal than increment and increases in the resources available for timber supply
present the potential to increase roundwood supply in a sustainable manner. In order to realize
such supply potential to the actual market supply, technology innovation must take place to
enhance labor productivity in timber growing, harvesting and processing. Since imported
timbers are primarily used for raw materials in the wood-processing industry, large-scale
timber-processing companies are located near ports. Due to the location of the
wood-processing industry, it is very costly to harvest trees and transport them to the
processing industry, which further weakens the competitiveness of Korean industry. It is
imperative to gradually locate the wood-processing industry in the areas to be expected to
produce timbers, enhancing the utilization of domestic wood and contributing to activating
the local economy.
Consumption of NWFPs will increase due to higher income levels and market liberalization
and thus competition in price and quality between domestic and imported goods will be even
fiercer in the domestic market. Production structure must be realigned by arranging the
cultivated land being neglected or extensively managed and by establishing infrastructure
including operation paths and mechanization. In addition, structural improvements must be
triggered to enhance competitiveness by selectively supporting and fostering forward-looking
forest professionals. Safety management systems must be in place by securing consumer trust
and by introducing quality management systems based on stringent quality management and
branding.
Demand for forest services will increase even more. However, economic incentives based on
market mechanisms must be introduced in order to provide the desirable level of forest
services demanded by society. Economic incentives can solve the problem of public goods
like forest services through the market mechanism. In addition, they have the advantage of
maintaining the sustainability of forests by promoting sustainable management of forests as
well as by optimally producing forest services and increasing social welfare. One solution is
to introduce a system in which beneficiaries pay the price for the environmental service
provided by forests.
Finally, in the conflict between economic development and environmental conservation,

APFSOS II: Republic of Korea
9
harmony of the two must be pursued and social consensus systems must be established to
resolve and prevent conflicts. Recently, the conflict surrounding forests has been expressed in
various ways. Some argue that functions provided by forests must be divided into two
categories, economic function and environmental service; and that forests must be
dichotomously managed as economic forests and environmental forests. At the same time,
there are conflicts between the general public, putting priority on environmental services in
utilizing forest resources, and others, mostly forest owners, focusing on the economic
function. Sometimes, there are conflicts between policies on economy and environment. Thus,
institutions and processes must be in place to manage conflicts surrounding forests. While the
20th century was the era of the government, the 21
st century will be that of governance. The
framework of coexistence should be established through constraint and cooperation among
government, market and NGOs and a mechanism must be created to manage conflicts that are
multifaceted, diversified and democratized.
APFSOS II: Republic of Korea
10
1. INTRODUCTION
Objectives
Demand for forests has been greatly diversified. Demand for social and environmental
functions of forests has increased along with that for wood and NWFPs traditionally provided
by forests. The general public’s interest in forest resources has also increased. Due to
diversified demand for forests, a need for rational allocation of limited forest resources has
risen, while the government roles in allocation of forest resources have become even more
critical. Meanwhile, development of the market economy has weakened the direct control for
the government’s planned production. Therefore, the government is obligated to develop
market-based forest policies instead of intervening in the market to meet various demands for
forests.
This study was conducted to provide decision makers with information and analysis about
historical and predicted trends of changes in forest resources and the supply and demand of
forest products and services. Numerous investigations were conducted on supply and demand
projections in the past, whose focus was on the demand and supply of wood products and the
supply of timbers from domestic forests. In this study, various demands for forests were
reflected so that the analysis was expanded to include changes in forest resources, the demand
and supply of NWFPs and forest services. Due to limited availability of statistical data and
analytical methodologies, all products and services could not be included, and the
co-relationship between forest product markets and forest services failed to be adequately
modeled. However, we developed an integrated model that combines separate models to
reflect interactions among forest resources, forest products and forest services. By using the
integrated model developed in this study, projections were made on the changes in forest
resources and the supply and demand for forest products and services. In instances in which
quantitative analysis for future trends could not be made, descriptive analysis was made.
In this study, projections for the changes in forest resources and the trends in supply and
demand were made based on the assumption that the current policies will sustain, and
socio-economic factors determining the supply and demand will continue in the future as well.
Therefore, the projections are not to suggest a desirable level to achieve in the future. The
projections represent basic useful information for determining whether or not the current
policies need to be adjusted or if new policies must be developed.
Scope of the study
The time horizon for the analysis of past trends was based on the availability of statistical data.
In most cases, data from 1970 and onwards were available, so results are presented for the
period of 35 years from 1970 to 2005. However, in cases where the data prior to 1970 were
available or only recent data were available, analysis was made from the point of availability.
The year 2005 was used as the base year for the projections; projections covered the period
2005 to 2020.
The forest sector was defined to cover forest resources, timber products, NWFPs and forest
services. The analysis of forest resources included analysis of trends in the changes in the
forest area and growing stock. The analysis of timber products and NWFPs focused on trends
in consumption, production, exports and imports. Forest services included conservation of
biodiversity, forests’ water storage, demand for forest recreation and forest carbon absorption.
Timber products include primary processed products such as lumber, wood-based panels and
pulp. Secondary processed products including furniture, window frames and wooden doors
were not included due to lack of data. Paper and paperboard were not included in projection
analysis but they were included in the historical trend analysis. NWFPs covered major
APFSOS II: Republic of Korea
11
products including tree nuts and mushrooms. Other NWFPs were included but the analysis is
limited due to the lack of quantitative statistics. Of various forest services, only forest
recreation demand and changes in water storage were quantitatively analyzed because it was
possible to collect visitor statistics on forest recreation and to obtain scientific information on
the technical relationship between forest water storage and age of stand, and forest practices.
Carbon dioxide storage and biodiversity conservation functions were also included but their
quantitative analysis was not conducted.
Methodology
In this study, both quantitative and descriptive analyses were used to analyze the changes in
forest resources and the supply and demand for forest goods and services. Historical trends
were quantitatively analyzed based on statistical data of time series and projections were
made using an integrated model developed by modeling the interaction among forest
resources, forest products and forest services.
The changes in forest resources are closely linked with the supply and demand for forest
goods and services. Changes in forest resources influence the demand and supply of forest
products and services. By contrast, the changes in forest product markets cause changes in
forest resources. In addition, sometimes there is a trade-off between forest goods and forest
services. Therefore, an integrated model combining separate models was developed to
identify interactions among forest resources, forest products and forest services and long-term
projections were made for the changes in forest resources and markets.
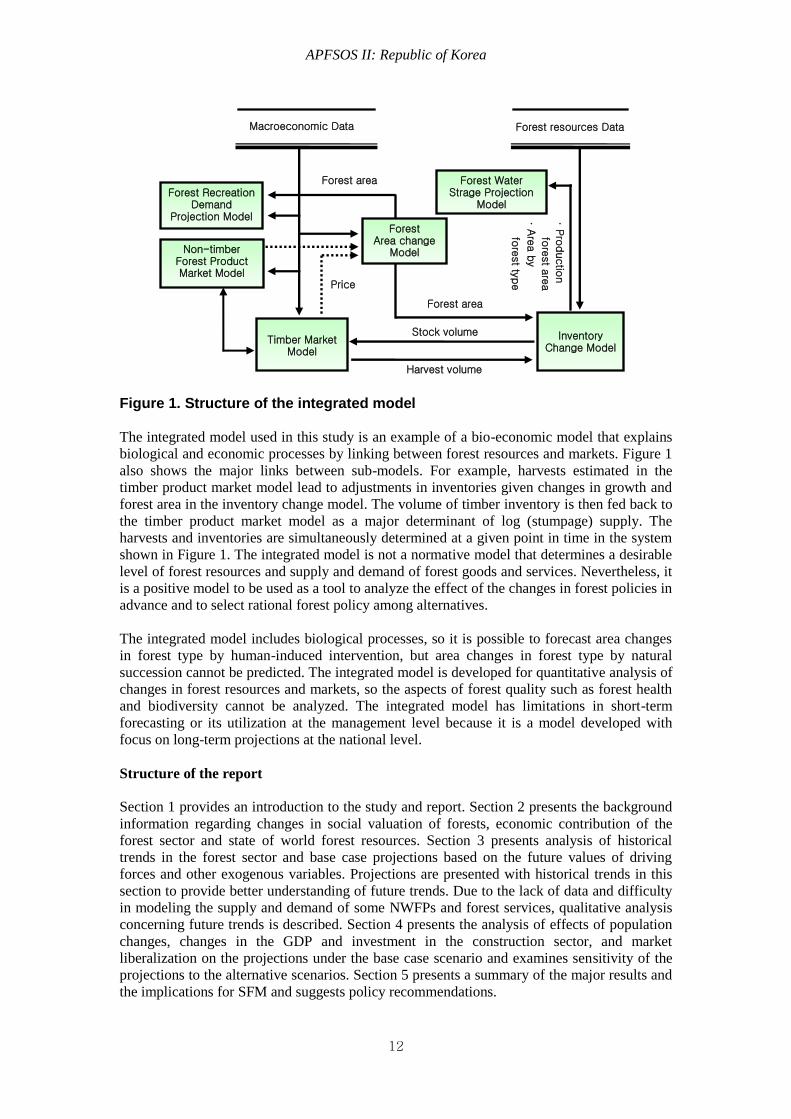
Figure 1 shows the structure of the integrated model used to make projections of future trends.
The integrated model is composed of six sub-models and provides linkages among them. The
forest area change model is a model that explains area changes in land uses between forestry
and other sectors. The inventory change model is a biological model that projects the changes
in timber growth and inventory over time given timber harvest and the forest area. The timber
product market model is an econometric model to make projections of production, trade,
consumption and prices of timber products (the prices of processed timber products cannot be
endogenously determined because the model for product market is not an equilibrium model).
In the model, log market is vertically linked to the product market to consider the feedback
effects of market changes. The NWFP market model is an economic model predicting
production, trade, consumption and prices of major tree nuts and oak mushrooms. The
recreation demand projection model is an economic model to forecast both visit days and
visitor numbers depending on visitors’ stays in forest recreation sites. The forest water storage
projection model is a model to project the water storage capacity within forests using the
relationship between the storage capacity of forest soil and the increase in the age of stand by
forest type and relationship between storage capacity of forest soil and thinning. Details of
rationale, estimation methods and results for sub-models can be found in “Development of a
Model for making projections of Long-term Supply and Demand of Forest Resources” (Joo et
al., 2006).
APFSOS II: Republic of Korea
12
Figure 1. Structure of the integrated model
The integrated model used in this study is an example of a bio-economic model that explains
biological and economic processes by linking between forest resources and markets. Figure 1
also shows the major links between sub-models. For example, harvests estimated in the
timber product market model lead to adjustments in inventories given changes in growth and
forest area in the inventory change model. The volume of timber inventory is then fed back to
the timber product market model as a major determinant of log (stumpage) supply. The
harvests and inventories are simultaneously determined at a given point in time in the system
shown in Figure 1. The integrated model is not a normative model that determines a desirable
level of forest resources and supply and demand of forest goods and services. Nevertheless, it
is a positive model to be used as a tool to analyze the effect of the changes in forest policies in
advance and to select rational forest policy among alternatives.
The integrated model includes biological processes, so it is possible to forecast area changes
in forest type by human-induced intervention, but area changes in forest type by natural
succession cannot be predicted. The integrated model is developed for quantitative analysis of
changes in forest resources and markets, so the aspects of forest quality such as forest health
and biodiversity cannot be analyzed. The integrated model has limitations in short-term
forecasting or its utilization at the management level because it is a model developed with
focus on long-term projections at the national level.
Structure of the report
Section 1 provides an introduction to the study and report. Section 2 presents the background
information regarding changes in social valuation of forests, economic contribution of the
forest sector and state of world forest resources. Section 3 presents analysis of historical
trends in the forest sector and base case projections based on the future values of driving
forces and other exogenous variables. Projections are presented with historical trends in this
section to provide better understanding of future trends. Due to the lack of data and difficulty
in modeling the supply and demand of some NWFPs and forest services, qualitative analysis
concerning future trends is described. Section 4 presents the analysis of effects of population
changes, changes in the GDP and investment in the construction sector, and market
liberalization on the projections under the base case scenario and examines sensitivity of the
projections to the alternative scenarios. Section 5 presents a summary of the major results and
the implications for SFM and suggests policy recommendations.
Macroeconomic Data
Stock volume
Harvest volume
Forest area
Price
· Pro
ductio
n
fore
st a
rea
· Are
a b
y
fore
st ty
pe
Forest area
Timber Market
Model
Non-timber Forest Product Market Model
Forest Recreation Demand
Projection Model
Inventory
Change Model
Forest Area change
Model
Forest Water Strage Projection
Model
Forest resources Data
APFSOS II: Republic of Korea
13
2. BACKGROUND INFORMATION
Changes in social value of forests
Wood has been valued as fuel and as an industrial commodity, especially after the 1960s, due
to its beauty and usability. These days, there is also growing recognition that wood is an
environmentally-friendly product. In addition to wood, NWFPs are major income sources of
rural areas and their value has recently increased as environmentally-friendly crops.
Furthermore, there has been an expanding awareness of environmental and social functions of
forests.
Forest goods refer to timber and NWFPs such as tree nuts and mushrooms. Forests provide
various services including air purification, water resources conservation, flood prevention,
national land conservation, recreation and biodiversity conservation, all of which are called
forest services. Recently, the social value of forest services rather than forest goods has
become much higher and is rapidly increasing.
Reflecting changes in the social value of forests, forest management has changed its focus
from sustained yield to multiple use management, and to SFM. It is difficult to forecast what
kind of goods or services will have higher social value. Thus, it is not easy to determine
strategies to manage forests for future generations.
Forest goods and services are joint products from growing trees. Not all forest products and
services are compatible with each other. In order to produce environmental functions of
forests, wood production must be either reduced or stopped. The forest ecosystem does not
have to consist entirely of mature stands to conserve biodiversity because some wildlife
species prefer younger and more vigorous stands as their habitats. Projections for the forest
sector in this study do not include all forest goods and services provided by forests, but they
will be conducive to identifying the interaction between the status of forest resources and the
supply of forest goods and services.
APFSOS II: Republic of Korea
14
Contribution of the forest sector
Forests provide various benefits. While forest products including timber and NWFPs provide
direct benefits, ecosystem functions, that is, forest services, offer indirect benefits to us.
Conservation of water, water purification, prevention of soil erosion and protection of soil, air
purification, sequestration of carbon dioxide, recreation and wildlife protection are publicly
beneficial functions of forests, and these functions are valued at about 66 trillion Won.
However, such services provided by forests are not traded in the market, so they are not
regarded as direct benefits.
In 2005, about 2.4 million m3 of roundwood timber products were harvested in the Republic
of Korea, which is a miniscule volume given the amount produced from forests of 6.4 million
ha. These products were valued at 100 billion Won, accounting for 3 to 4 percent of the value
of all forest products. The forests started to be degraded from the end of the Joseon period due
to reckless felling for fuelwood. Degradation of forests became even more severe as a result
of Japanese plundering, the post-liberation confusion and the Korean War. In order to restore
the degraded forests after liberation from Japan, numerous reforestation projects were
implemented, but these failed. The growing stock per ha was merely 10 m3 in 1970, a slight
increase from 7.9 m3 in the late 1940s. However, thanks to successful implementation of
large-scale reforestation plans beginning in 1973, all degraded forests were restored by the
end of the 1980s and the growing stock increased to 79 m3 per ha in 2005. Since forests were
established from the early 1970s, most of Korea’s forests are young stands below 30 years old.
Thus, the extent of forests for felling and industrial use is small.
Production costs of roundwood timber products are relatively high. Wages in rural areas have
increased rapidly due to rapid economic growth. However, the increased labor productivity as
a result of wide uses of machinery failed to catch up with the wage increases. Higher wages
largely lowered profitability in labor-intensive forestry. High production costs of wood
products weakened price competitiveness against that of imported wood. Therefore, higher
wood production cost due to higher wages is another cause of limited production of
roundwood timber products.
Currently, about 10 percent of the total roundwood equivalent for consumption of timber
products comes from the domestically produced wood. As most of the domestically produced
roundwood is small-diameter logs, they are used for low value-added timber products such as
pit props and roundwood for pulp and fiberboard. Sawlogs and veneer logs are almost 100
percent imported. As mentioned, immature forest resources and high production costs make it
difficult to produce timbers that can compete with imported timbers in terms of quality and
price.
NWFPs are a more important source of income in rural areas than timber products. NWFPs
include both products picked in forests (pine mushrooms, edible plants, medical plants, etc.)
and products cultivated in mountains (chestnuts, pine nuts, edible plants, etc.). In addition,
jujubes, walnuts, bitter persimmons and plants for landscape uses are included in NWFPs.
They are cultivated on fields but administered directly by the Korea Forest Service instead of
the Ministry of Agriculture and Forestry. The annual production value of NWFPs amounts to
about two trillion Won, accounting for about 60 to 65 percent of the total production value of
forestry. Plants for landscape use account for about 40 percent of the total production value of
NWFPs, tree nuts about 20 percent, and mushrooms about 10 percent.
APFSOS II: Republic of Korea
15
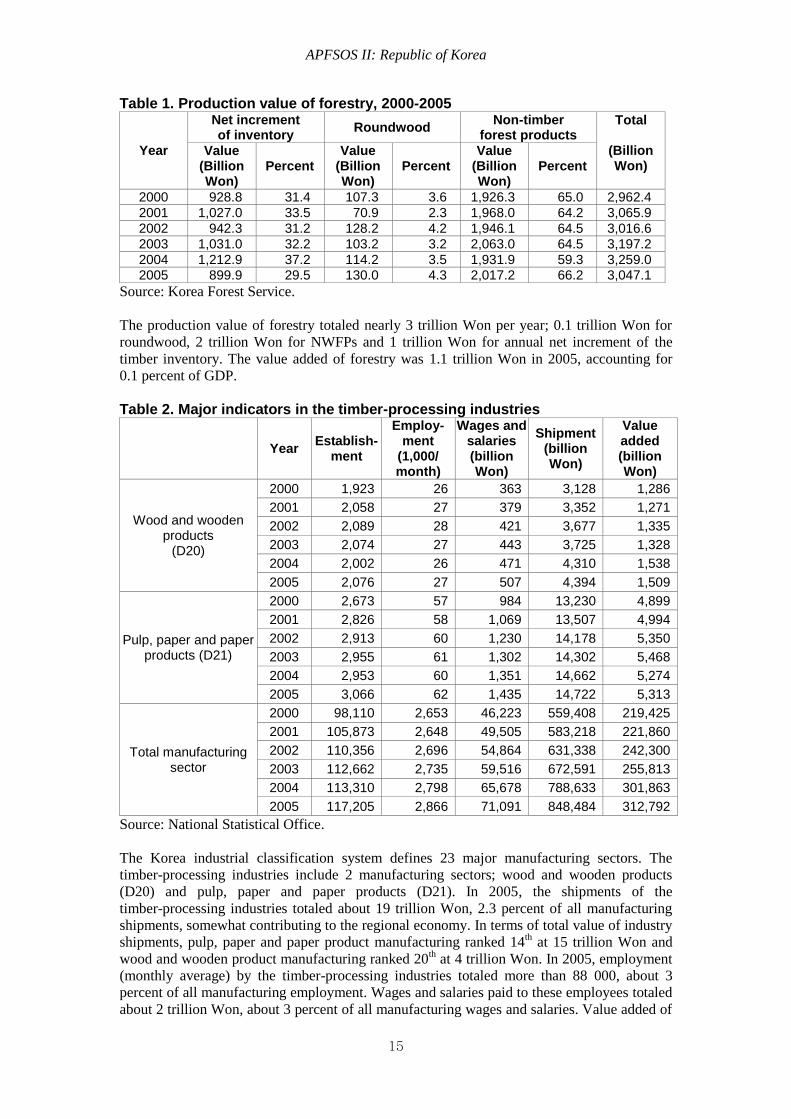
Table 1. Production value of forestry, 2000-2005
Year
Net increment of inventory
Roundwood Non-timber
forest products Total
(Billion Won)
Value (Billion Won)
Percent Value
(Billion Won)
Percent Value
(Billion Won)
Percent
2000 928.8 31.4 107.3 3.6 1,926.3 65.0 2,962.4
2001 1,027.0 33.5 70.9 2.3 1,968.0 64.2 3,065.9
2002 942.3 31.2 128.2 4.2 1,946.1 64.5 3,016.6
2003 1,031.0 32.2 103.2 3.2 2,063.0 64.5 3,197.2
2004 1,212.9 37.2 114.2 3.5 1,931.9 59.3 3,259.0 2005 899.9 29.5 130.0 4.3 2,017.2 66.2 3,047.1
Source: Korea Forest Service.
The production value of forestry totaled nearly 3 trillion Won per year; 0.1 trillion Won for
roundwood, 2 trillion Won for NWFPs and 1 trillion Won for annual net increment of the
timber inventory. The value added of forestry was 1.1 trillion Won in 2005, accounting for
0.1 percent of GDP.
Table 2. Major indicators in the timber-processing industries
Year Establish-
ment
Employ- ment
(1,000/ month)
Wages and salaries (billion Won)
Shipment (billion Won)
Value added (billion Won)
Wood and wooden products
(D20)
2000 1,923 26 363 3,128 1,286
2001 2,058 27 379 3,352 1,271
2002 2,089 28 421 3,677 1,335
2003 2,074 27 443 3,725 1,328
2004 2,002 26 471 4,310 1,538
2005 2,076 27 507 4,394 1,509
Pulp, paper and paper products (D21)
2000 2,673 57 984 13,230 4,899
2001 2,826 58 1,069 13,507 4,994
2002 2,913 60 1,230 14,178 5,350
2003 2,955 61 1,302 14,302 5,468
2004 2,953 60 1,351 14,662 5,274
2005 3,066 62 1,435 14,722 5,313
Total manufacturing sector
2000 98,110 2,653 46,223 559,408 219,425
2001 105,873 2,648 49,505 583,218 221,860
2002 110,356 2,696 54,864 631,338 242,300
2003 112,662 2,735 59,516 672,591 255,813
2004 113,310 2,798 65,678 788,633 301,863
2005 117,205 2,866 71,091 848,484 312,792
Source: National Statistical Office.
The Korea industrial classification system defines 23 major manufacturing sectors. The
timber-processing industries include 2 manufacturing sectors; wood and wooden products
(D20) and pulp, paper and paper products (D21). In 2005, the shipments of the
timber-processing industries totaled about 19 trillion Won, 2.3 percent of all manufacturing
shipments, somewhat contributing to the regional economy. In terms of total value of industry
shipments, pulp, paper and paper product manufacturing ranked 14th at 15 trillion Won and
wood and wooden product manufacturing ranked 20th at 4 trillion Won. In 2005, employment
(monthly average) by the timber-processing industries totaled more than 88 000, about 3
percent of all manufacturing employment. Wages and salaries paid to these employees totaled
about 2 trillion Won, about 3 percent of all manufacturing wages and salaries. Value added of

APFSOS II: Republic of Korea
16
these timber-processing industries totaled nearly 7 trillion Won, accounting for 2.2 percent of
all manufacturing value added.
State of the world’s forest resources
World forests cover 3,952 million ha, about 30 percent of the land area, with per capita forest
cover of 0.62 ha (FAO, 2006). Europe accounts for 25 percent of world forest cover. South
America and North and Central America account for 21 percent and 18 percent, respectively.
Forests in Russia account for 20 percent of world forest cover. More than half of the world’s
forests are in Russia, Brazil, Canada, the USA and China. Forests in Korea amount to about
6.4 million ha, or 0.16 percent of world forest cover.
World forest cover has been declining, but at a slower rate than in the past. The area of forests
worldwide declined by 13 million ha per year over the period 2000 to 2005. Owing to
increases in forest area by afforestation, restoration and natural recovery, the net annual forest
loss is about 7.3 million ha, a decrease from 8.9 million ha for the period 1990 to 2000. The
rate of deforestation is greatest in South America and Africa. Conversely, forest cover is
increasing in Europe.
World growing stock is estimated at about 434 billion m3. South America accounts for 30
percent of the world timber inventory. Growing stock in Brazil is 81 billion m3, 19 percent of
world growing stock. The average worldwide growing stock per ha is 110 m3. Eight countries
out of 11 that reported average growing stock per ha over 250 m3 are in Central Europe.
Growing stock in Korea is 506 million m3, about 0.1 percent of world growing stock. The
growing stock per ha in Korea is 79 m3, similar to the average of 82 m
3 for Asian countries.
Table 3. World’s forest resources
Region Land area (1,000 ha)
Forest area Growing stock
(1,000 ha) Percent of
Total (Million m
3) (m
3/ha)
Africa 2,962,656 635,412 21.4 64,957 102
Asia 3,097,913 571,577 18.5 47,111 82 Europe 2,260,180 1,001,394 44.3 107,264 107
North and Central America
2,143,910 705,849 32.9 78,582 111
Oceania 849,116 206,254 24.3 7,361 36
South America 1,753,646 831,540 47.4 128,944 156
Total 13,067,421 3,952,025 30.2 434,219 110
Source: FAO, 2006.
The global wood harvests amount to 3 billion ㎥ and industrial roundwood accounts for
approximately 50 percent. For the past 15 years, there were no significant changes in the
volume of wood harvests and the production ratio between industrial roundwood and
fuelwood. Wood harvests in Africa, Latin America and the Caribbean and Southeast Asia are
mainly used for fuelwood, and wood harvests in North and Central America, Europe and
Oceania are used for industrial roundwood. Harvests in five countries, namely, the USA,
Brazil, Canada, Russia and China, account for 45 percent of the global wood harvests. Wood
harvests in Asia show declining trends because of the wood harvest reduction policy in China,
India, Indonesia and Malaysia. Wood harvests in Korea are about 2.4 m3, about 0.1 percent of
the global industrial roundwood of 1,799 million m3.
Plantation forests occupy 140 million ha, about 3.8 percent of the world’s forests. About 80
percent of plantations are managed for production of industrial roundwood. The plantation
forest area increased by 2.8 million ha per year over the period 2000 to 2005. Production
APFSOS II: Republic of Korea
17
forests in temperate zones are mostly managed to produce industrial roundwood and are
mainly composed of coniferous species. These plantations are mostly established on harvested
forestlands and thus they generally do not expand existing forest cover. Native species
account for the majority of the plantation area in most of the Northern Hemisphere. Most
plantations in the Southern Hemisphere are fast growing and exotic species. Production from
exotic coniferous plantations in New Zealand, Chile and Australia have increased
significantly, accounting for about 3 percent of world softwood industrial roundwood
production. By the year 2020, harvests from coniferous plantations in the Southern
Hemisphere are expected to be as much as four times the current level. Harvests from
plantations are projected to account for more than 40 percent of world wood harvests by 2030.
In terms of trade in timber products, there are three regional markets, that is, North America,
Europe and Pacific Rim markets. Major importers in the Pacific Rim market are Japan, China
and Korea and major exporters are New Zealand, Chile, Russia, the USA and Southeast Asian
countries. In the past, Southeast Asian countries and the USA were major log exporters.
Russia and New Zealand have become major log exporters since Southeast Asian countries
and the USA banned or regulated log exports in order to develop local industries and to
protect the environment. India is emerging as a major importer. Imports of logs by China, one
of the lowest cost producers of timber products, have also increased rapidly. Korea’s wood
production costs are relatively high. Higher harvesting and manufacturing costs have made
Korean timber products less competitive even in local markets and have caused increased
imports of timber products to meet increased domestic demand.
APFSOS II: Republic of Korea
18
3. TRENDS AND BASE PROJECTIONS
Projections for changes in forest resources and supply and demand directly depend on the
assumptions for the factors determining the demand for forest products and services and the
characteristics of forest resources. If the assumptions change, the projections will be changed.
This chapter explains the assumptions for the factors that directly determine changes in forest
resources and supply and demand, and describes the projected results from the integrated
model based on the baseline scenario along with historical trends.
The assumptions are keys to understanding the projected trends in changes in forest resources
and the supply and demand for forest products and services. The baseline scenario is based on
two assumptions: i) Population, economic development, final consumers’ activities in wood
products, investment in forest industry, and real prices of forest products will develop as
stated in this chapter; and ii) overall economic policies and forest policies will remain
unchanged from the format and structure observed in the early 2000s.
Projections under the baseline scenario must be regarded as the most probable ones, not the
most desirable ones. Therefore, projections under the baseline scenario must be used as basic
information for determining the directions of forest management policy and for analyzing
economic, social and environmental implications for the alternative scenarios regarding
changes in macroeconomic activities and forest policies. In addition, projections under the
baseline scenario will serve as valuable basic information for the discussion of public
awareness of forest resources, and such discussion will, in the end, affect decision-making
processes for desirable forest resources management.
Assumptions
Population
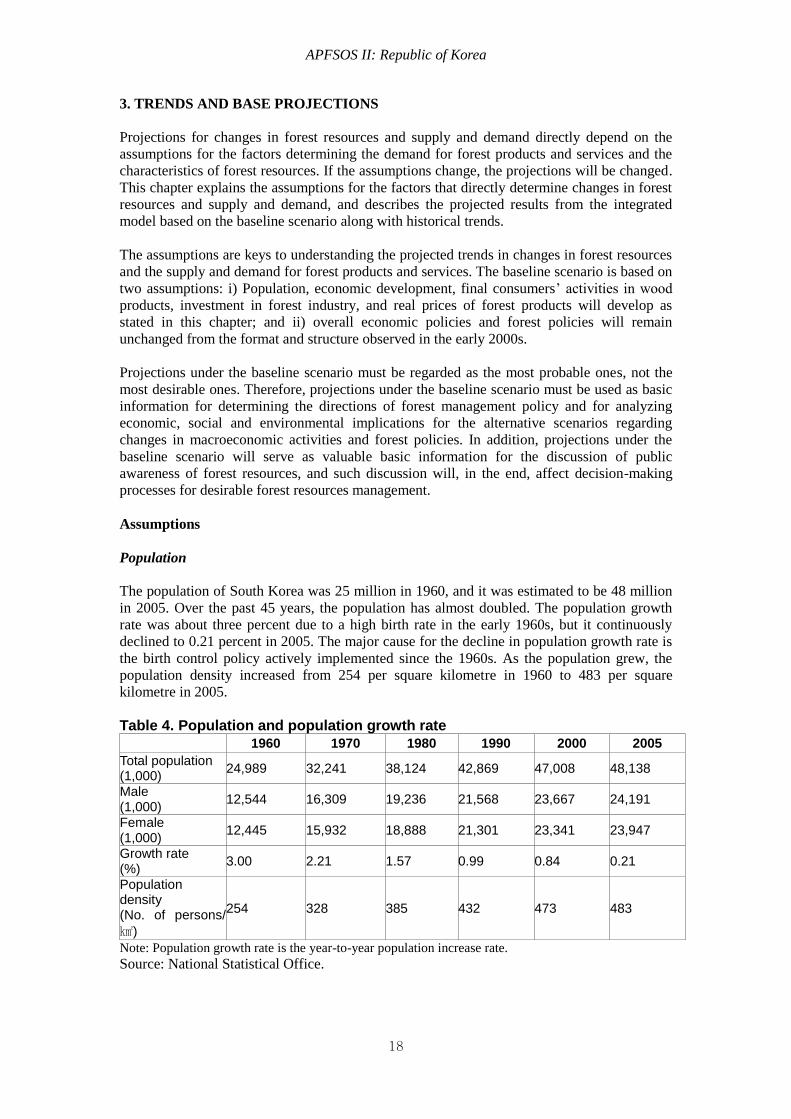
The population of South Korea was 25 million in 1960, and it was estimated to be 48 million
in 2005. Over the past 45 years, the population has almost doubled. The population growth
rate was about three percent due to a high birth rate in the early 1960s, but it continuously
declined to 0.21 percent in 2005. The major cause for the decline in population growth rate is
the birth control policy actively implemented since the 1960s. As the population grew, the
population density increased from 254 per square kilometre in 1960 to 483 per square
kilometre in 2005.
Table 4. Population and population growth rate
1960 1970 1980 1990 2000 2005
Total population (1,000)
24,989 32,241 38,124 42,869 47,008 48,138
Male (1,000)
12,544 16,309 19,236 21,568 23,667 24,191
Female (1,000)
12,445 15,932 18,888 21,301 23,341 23,947
Growth rate (%)
3.00 2.21 1.57 0.99 0.84 0.21
Population density (No. of persons/
㎢)
254 328 385 432 473 483
Note: Population growth rate is the year-to-year population increase rate. Source: National Statistical Office.
APFSOS II: Republic of Korea
19
Population increased rapidly because of baby boomers after the Korean War in 1953. The
population in 1955 increased by 6.6 percent compared to 1949. In 1960, it increased by 16.2
percent compared to 1955 while in 1965, it increased by 15.1 percent compared to 1960. In
Korea, a country lacking in natural resources, such a rapid population increase was
recognized as an obstacle to economic growth, so the need to control population growth arose.
The first population policy to curb population growth was fully implemented during the First
Five-Year Economic Development Plan (1962-1966), while the population control policy to
curb birth rates continued up to the 1990s.
Rapid industrialization and economic growth along with successful implementation of the
seven Economic Development Plans encouraged active participation of women in the labor
market. Such increased female participation in the labor market was another reason for the
declining growth rate of population.
As a result of birth control policies and increased female participation in the labor market, the
Total Fertility Rate (TFR) gradually declined from 4.53 in 1970, to 1.59 in 1990 and 1.08 in
2005. The number of newborns also dropped from 1,007,000 in 1970, to 659,000 in 1990 and
438,000 in 2005.
Table 5. Changes in the Total Fertility Rate (TFR)
1970 1980 1990 1995 2000 2004 2005
4.53 2.83 1.59 1.65 1.47 1.16 1.08
Note: Total Fertility Rate (TFR) is the average number of children that would be born by a woman over
her lifetime if she were to experience the exact current age-specific fertility rates (ASFRs)
through her lifetime from the age of 15 to 49.
Source: National Statistical Office.
The proportion of the elderly population (persons 65 years old and over) increased from 3.1
percent in 1970 to 5.1 percent in 1990, to 7.2 percent in 2000 and 9.1 percent in 2005. If we
define the aging society as one where the rate of the elderly population aged 65 and older
takes up over 7 percent of the total population, Korea had already entered the aging society
stage in 2000.
According to the National Statistical Office, the number of newborns is expected to drop to
434,000 in 2010 to 377,000 in 2020 and to 226,000 in 2050 (around the half of 438,000 in
2005). The life expectancy continuously increased from 62.3 years in 1971 to 78.6 years in
2005, and will rise to 81.5 years in 2020 and 86.0 years in 2050. As for the international
migration of the population, the number of emigrants was bigger than the number of
immigrants for the past five years, which resulted in net decrease of population. If this trend
continues, the total net population migration is expected to drop as a result of the age structure
shift induced by lower numbers of newborns.
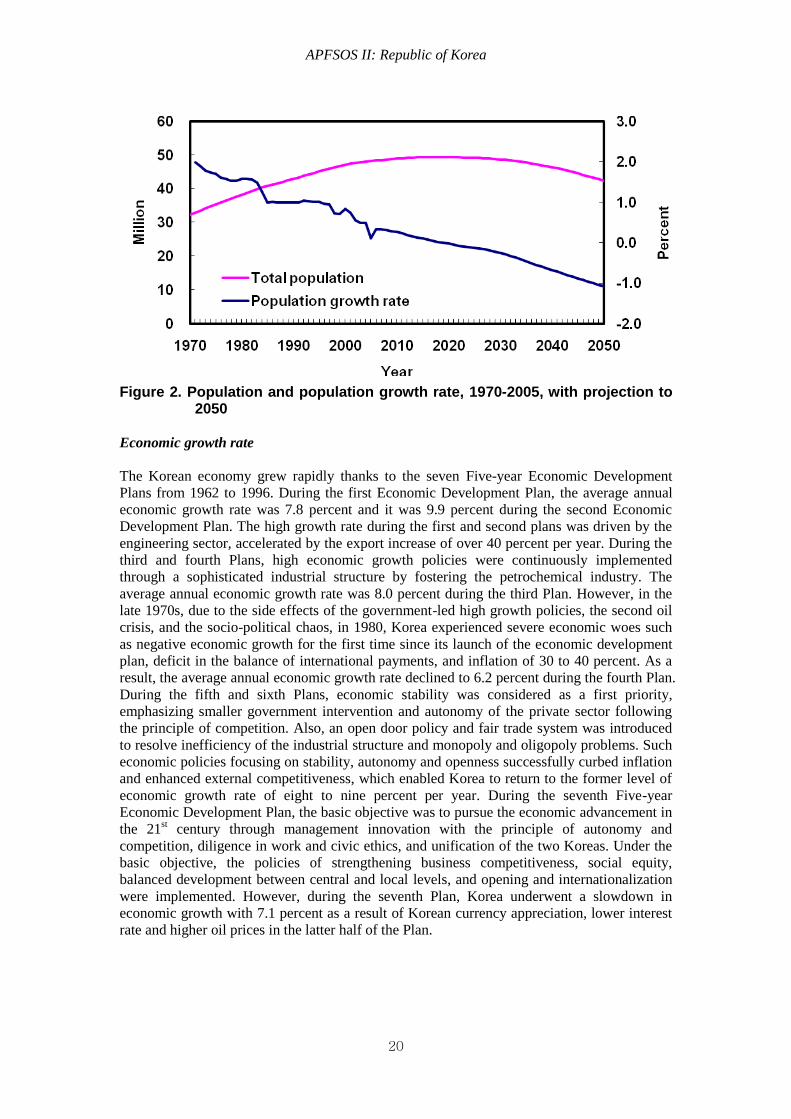
Reflecting these trends, the National Statistical Office projected population will reach its peak
of 49,340,000 in 2018, and then it will decline from 49,326,000 in 2020 to 48,635,000 in
2030 and to 42,343,000 in 2050 (Figure 2). In this study, the baseline scenario for population
is based on the future population projections released by the National Statistical Office.
APFSOS II: Republic of Korea
20
Figure 2. Population and population growth rate, 1970-2005, with projection to
2050
Economic growth rate
The Korean economy grew rapidly thanks to the seven Five-year Economic Development
Plans from 1962 to 1996. During the first Economic Development Plan, the average annual
economic growth rate was 7.8 percent and it was 9.9 percent during the second Economic
Development Plan. The high growth rate during the first and second plans was driven by the
engineering sector, accelerated by the export increase of over 40 percent per year. During the
third and fourth Plans, high economic growth policies were continuously implemented
through a sophisticated industrial structure by fostering the petrochemical industry. The
average annual economic growth rate was 8.0 percent during the third Plan. However, in the
late 1970s, due to the side effects of the government-led high growth policies, the second oil
crisis, and the socio-political chaos, in 1980, Korea experienced severe economic woes such
as negative economic growth for the first time since its launch of the economic development
plan, deficit in the balance of international payments, and inflation of 30 to 40 percent. As a
result, the average annual economic growth rate declined to 6.2 percent during the fourth Plan.
During the fifth and sixth Plans, economic stability was considered as a first priority,
emphasizing smaller government intervention and autonomy of the private sector following
the principle of competition. Also, an open door policy and fair trade system was introduced
to resolve inefficiency of the industrial structure and monopoly and oligopoly problems. Such
economic policies focusing on stability, autonomy and openness successfully curbed inflation
and enhanced external competitiveness, which enabled Korea to return to the former level of
economic growth rate of eight to nine percent per year. During the seventh Five-year
Economic Development Plan, the basic objective was to pursue the economic advancement in
the 21st century through management innovation with the principle of autonomy and
competition, diligence in work and civic ethics, and unification of the two Koreas. Under the
basic objective, the policies of strengthening business competitiveness, social equity,
balanced development between central and local levels, and opening and internationalization
were implemented. However, during the seventh Plan, Korea underwent a slowdown in
economic growth with 7.1 percent as a result of Korean currency appreciation, lower interest
rate and higher oil prices in the latter half of the Plan.

APFSOS II: Republic of Korea
21
Table 6. GDP growth rate per year for each Five-year Economic Development Plan
First
(1962-66) Second
(1967-71) Third
(1972-76) Fourth
(1977-81) Fifth
(1982-86) Sixth
(1987-91) Seventh (1992-97)
Growth rate (%)
7.8 9.9 8.0 6.2 8.7 9.4 7.1
Source: The Bank of Korea.
As noted above, Korea achieved rapid economic growth by implementing high economic
growth policies throughout the seven Economic Development Plans. However, the current
account deficit has continued to widen and foreign debt has increased rapidly. In late 1997,
Korea met an unstable economic environment, especially in the financial and foreign
exchange markets, caused by bankruptcies of conglomerates, increased bad loans and the
financial crisis in Southeast Asia. This had Korea’s international credit ratings downgraded
and resulted in outflow of overseas investors. As a result, Korea faced a foreign exchange
crisis with depreciation of the Won and depletion of foreign exchange reserves beginning in
late 1997. As domestic consumption and investment markets rapidly shrank due to the 1998
foreign exchange crisis and corresponding restructuring efforts, the GDP growth rate declined
to minus 6.9 percent. However, thanks to recovery of foreign exchange liquidity, successful
economic restructuring and ease of actual economic shrinkage, since 1999, Korea has
maintained current account surplus and stability in prices. This helped shift the economic
growth rate to the positive level. In recent years, the economic growth rate has hovered
around four to five percent.
Recently, Korea has shown lower economic growth, owing to demographic factors including
a low birth rate and rapid advancement to an aging society. Aside from these internal factors,
economic expansion of China, a rapid shift of industrial structure toward the IT (information
technology) industry, and other external factors such as labor-management disputes and
weaker investment sentiments due to political and economic uncertainties could be counted as
the main reasons for slow economic growth.
Korea’s economic growth in the past resulted from input-driven quantitative expansion.
According to the analysis of the Bank of Korea (The Bank of Korea, 2005), personnel and
physical input contributed about 68.4 percent of the total growth between 1983 and 2002. In
comparison with developed countries, where the contribution driven by technological
innovation is around 50 percent, it should be noted that Korea’s economic growth has greatly
depended on input-driven quantitative expansion. Therefore, it is expected that future growth
potentials will be determined by advancement of technology, securing human resources, and
improvement in relationships of inter-linked industries.
The Bank of Korea calculated the potential GDP growth rate between 2005 and 2014 using a
production function approach. The potential GDP growth rates are expected to be around 4.0
to 5.2 percent depending on the scenario. Under the neutral scenario (labor and capital stocks
would change reflecting the changes in population structure and investment growth rate, and
the factors determining Total Factor Productivity [TFP] would follow the recent trends), the
annual potential growth rate between 2005 and 2014 will be at around 4.6 percent. Meanwhile,
under the optimistic scenario where active efforts of the government and the private sector are
pursued, the potential growth rate is expected to rise up to 5.2 percent. However, under the
pessimistic scenario where the government and private sectors neglect to expand growth
potentials, the potential growth rate is expected to drop to around 4.0 percent.
APFSOS II: Republic of Korea
22
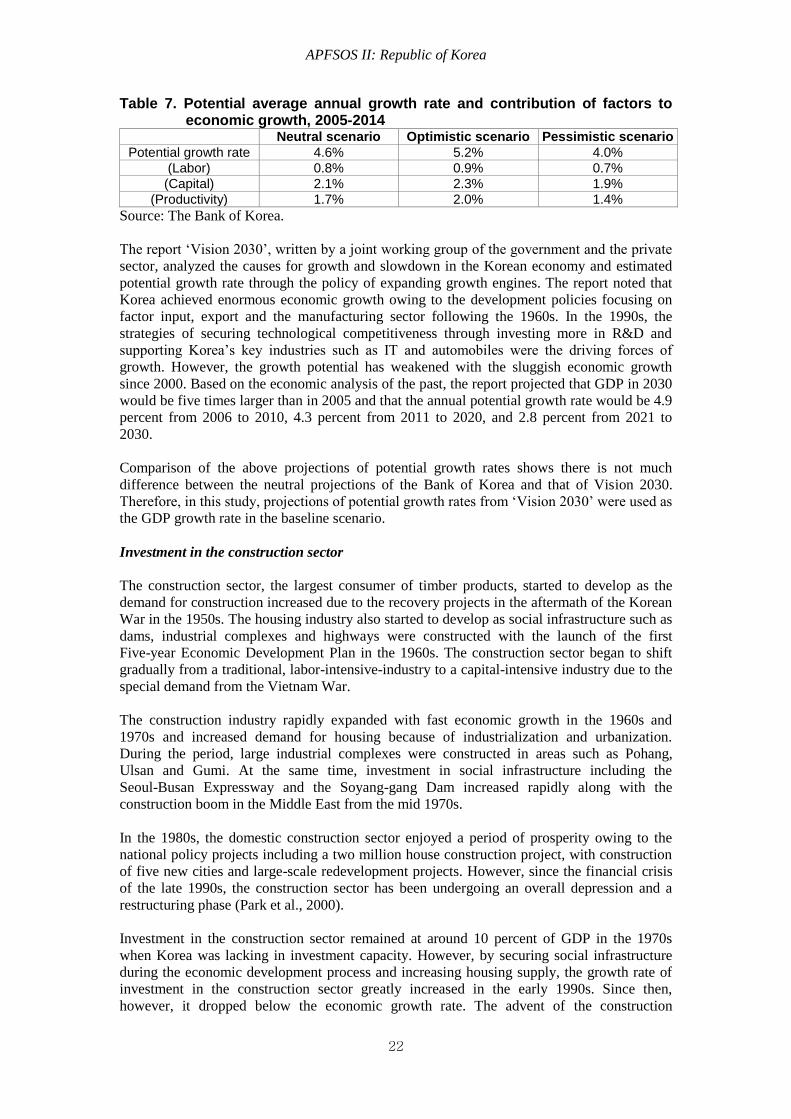
Table 7. Potential average annual growth rate and contribution of factors to economic growth, 2005-2014 Neutral scenario Optimistic scenario Pessimistic scenario
Potential growth rate 4.6% 5.2% 4.0%
(Labor) 0.8% 0.9% 0.7%
(Capital) 2.1% 2.3% 1.9%
(Productivity) 1.7% 2.0% 1.4%
Source: The Bank of Korea.
The report ‘Vision 2030’, written by a joint working group of the government and the private
sector, analyzed the causes for growth and slowdown in the Korean economy and estimated
potential growth rate through the policy of expanding growth engines. The report noted that
Korea achieved enormous economic growth owing to the development policies focusing on
factor input, export and the manufacturing sector following the 1960s. In the 1990s, the
strategies of securing technological competitiveness through investing more in R&D and
supporting Korea’s key industries such as IT and automobiles were the driving forces of
growth. However, the growth potential has weakened with the sluggish economic growth
since 2000. Based on the economic analysis of the past, the report projected that GDP in 2030
would be five times larger than in 2005 and that the annual potential growth rate would be 4.9
percent from 2006 to 2010, 4.3 percent from 2011 to 2020, and 2.8 percent from 2021 to
2030.
Comparison of the above projections of potential growth rates shows there is not much
difference between the neutral projections of the Bank of Korea and that of Vision 2030.
Therefore, in this study, projections of potential growth rates from ‘Vision 2030’ were used as
the GDP growth rate in the baseline scenario.
Investment in the construction sector
The construction sector, the largest consumer of timber products, started to develop as the
demand for construction increased due to the recovery projects in the aftermath of the Korean
War in the 1950s. The housing industry also started to develop as social infrastructure such as
dams, industrial complexes and highways were constructed with the launch of the first
Five-year Economic Development Plan in the 1960s. The construction sector began to shift
gradually from a traditional, labor-intensive-industry to a capital-intensive industry due to the
special demand from the Vietnam War.
The construction industry rapidly expanded with fast economic growth in the 1960s and
1970s and increased demand for housing because of industrialization and urbanization.
During the period, large industrial complexes were constructed in areas such as Pohang,
Ulsan and Gumi. At the same time, investment in social infrastructure including the
Seoul-Busan Expressway and the Soyang-gang Dam increased rapidly along with the
construction boom in the Middle East from the mid 1970s.
In the 1980s, the domestic construction sector enjoyed a period of prosperity owing to the
national policy projects including a two million house construction project, with construction
of five new cities and large-scale redevelopment projects. However, since the financial crisis
of the late 1990s, the construction sector has been undergoing an overall depression and a
restructuring phase (Park et al., 2000).
Investment in the construction sector remained at around 10 percent of GDP in the 1970s
when Korea was lacking in investment capacity. However, by securing social infrastructure
during the economic development process and increasing housing supply, the growth rate of
investment in the construction sector greatly increased in the early 1990s. Since then,
however, it dropped below the economic growth rate. The advent of the construction
APFSOS II: Republic of Korea
23
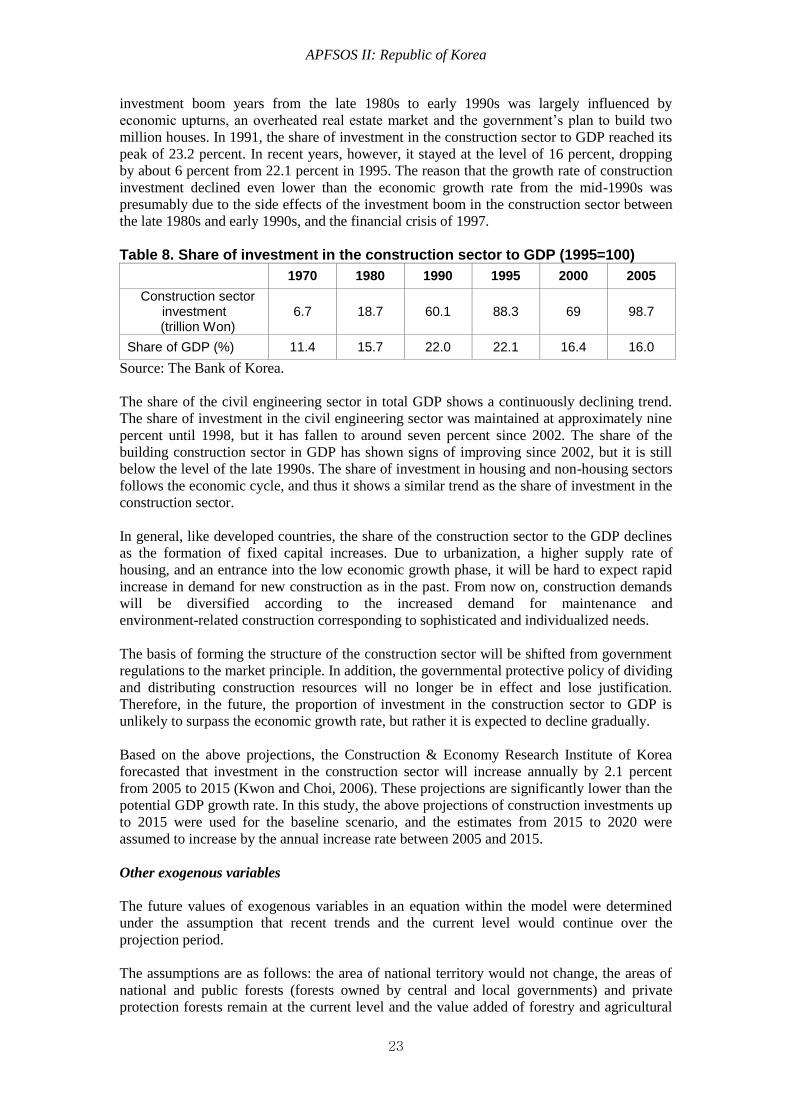
investment boom years from the late 1980s to early 1990s was largely influenced by
economic upturns, an overheated real estate market and the government’s plan to build two
million houses. In 1991, the share of investment in the construction sector to GDP reached its
peak of 23.2 percent. In recent years, however, it stayed at the level of 16 percent, dropping
by about 6 percent from 22.1 percent in 1995. The reason that the growth rate of construction
investment declined even lower than the economic growth rate from the mid-1990s was
presumably due to the side effects of the investment boom in the construction sector between
the late 1980s and early 1990s, and the financial crisis of 1997.
Table 8. Share of investment in the construction sector to GDP (1995=100)
1970 1980 1990 1995 2000 2005
Construction sector investment (trillion Won)
6.7 18.7 60.1 88.3 69 98.7
Share of GDP (%) 11.4 15.7 22.0 22.1 16.4 16.0
Source: The Bank of Korea.
The share of the civil engineering sector in total GDP shows a continuously declining trend.
The share of investment in the civil engineering sector was maintained at approximately nine
percent until 1998, but it has fallen to around seven percent since 2002. The share of the
building construction sector in GDP has shown signs of improving since 2002, but it is still
below the level of the late 1990s. The share of investment in housing and non-housing sectors
follows the economic cycle, and thus it shows a similar trend as the share of investment in the
construction sector.
In general, like developed countries, the share of the construction sector to the GDP declines
as the formation of fixed capital increases. Due to urbanization, a higher supply rate of
housing, and an entrance into the low economic growth phase, it will be hard to expect rapid
increase in demand for new construction as in the past. From now on, construction demands
will be diversified according to the increased demand for maintenance and
environment-related construction corresponding to sophisticated and individualized needs.
The basis of forming the structure of the construction sector will be shifted from government
regulations to the market principle. In addition, the governmental protective policy of dividing
and distributing construction resources will no longer be in effect and lose justification.
Therefore, in the future, the proportion of investment in the construction sector to GDP is
unlikely to surpass the economic growth rate, but rather it is expected to decline gradually.
Based on the above projections, the Construction & Economy Research Institute of Korea
forecasted that investment in the construction sector will increase annually by 2.1 percent
from 2005 to 2015 (Kwon and Choi, 2006). These projections are significantly lower than the
potential GDP growth rate. In this study, the above projections of construction investments up
to 2015 were used for the baseline scenario, and the estimates from 2015 to 2020 were
assumed to increase by the annual increase rate between 2005 and 2015.
Other exogenous variables
The future values of exogenous variables in an equation within the model were determined
under the assumption that recent trends and the current level would continue over the
projection period.
The assumptions are as follows: the area of national territory would not change, the areas of
national and public forests (forests owned by central and local governments) and private
protection forests remain at the current level and the value added of forestry and agricultural
APFSOS II: Republic of Korea
24
net return would maintain recent increasing trends.
The average value of the past five years was assumed as the beginning year values of the
variables in the Inventory Change Model. Average tree mortality was assumed to be sustained
throughout the projection period. Thinning was assumed to be done twice in 20 and 30 years,
and the implementation rate of thinning was assumed to increase from 70 percent in 2005 to
77 percent in 2050. Thinning intensity (the ratio of volumes thinned to the total growing
stock) was assumed to be the current level of 35 percent throughout the projection period. The
harvest rate by management type was assumed to be sustained at the current level. However,
the harvest rate by age class was assumed to gradually shift from harvests in the current 3 to 4
age classes to harvests in 6 and over age classes over the projection period. The rate and
pattern of afforestation was assumed to remain the current status of afforestation.
The future values of exogenous variables in the Timber Product Market Model were
based either on expert opinions or on historical trends. The input-output coefficient, the share
of softwood and hardwood veneer logs in plywood production, the share of recovered paper
and the share of domestic wood of the total pulpwood required were assumed to be equal to
the current level over the projection period. The future values of exogenous variables in the
NWFP Market model were determined based on historical trends. The production quantity per
unit area and precipitation were assumed to remain at the current level.
The total water storage capacity of forests was projected by adding the estimate of water
storage capacity (18 billion tons) in 1992 calculated by the Korea Forest Research Institute
and net annual change from the Water Storage Projection Model. Soil depth, which is a
critical factor in calculating the water storage capacity by soil, is expected to deepen as time
elapses. However, due to the lack of data, it was assumed that the current soil depth would not
change.
Regional population for the projections of demand for forest recreation was based on data
from the National Statistical Office. Per capita income by region was calculated by dividing
the estimated region-specific GDP by total population of the region. The annual expenditures
for social development, which is a proxy variable of investment in recreational facilities, were
assumed to increase at the recent average annual growth rate. The physical distance between
the starting point and destination can be changed due to improved infrastructure and
developed means of transportation but it is difficult to quantitatively project the physical
distance. So the physical distance was assumed to be unchanged over the projection period.
Historical trends and projections
Forest resources
Forest area
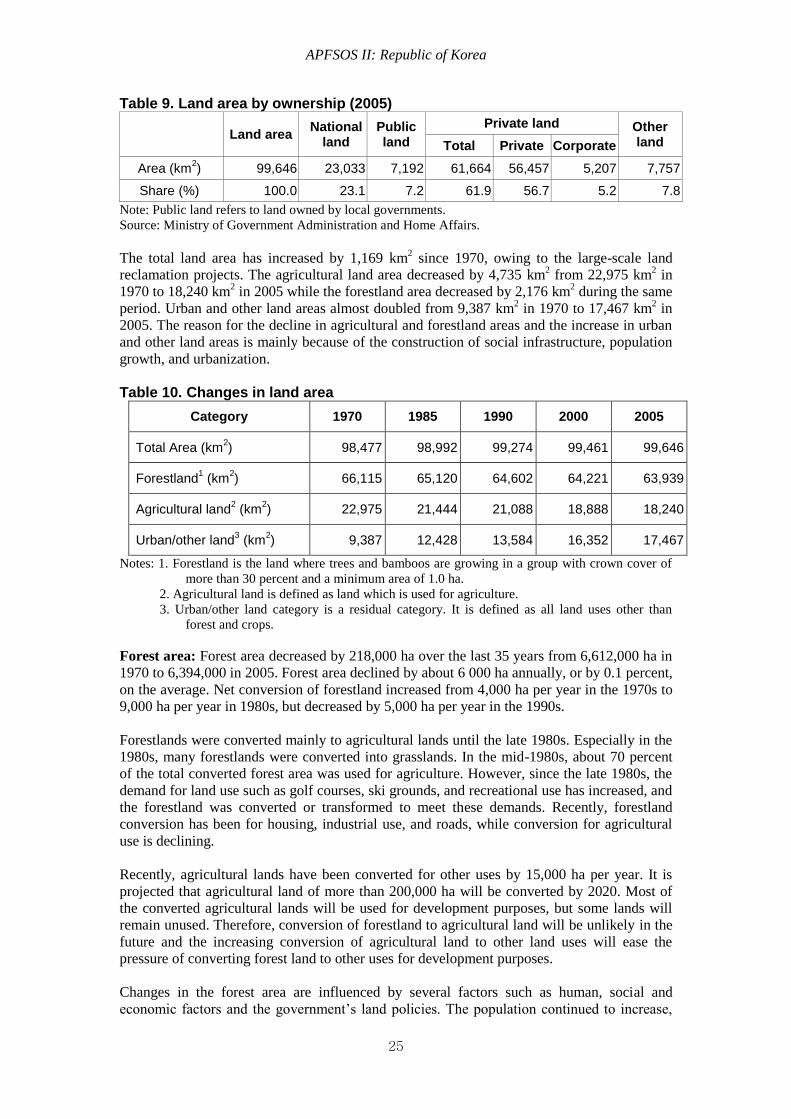
Land area: Korea had a total area of 99,646 km2 in 2005. Private land occupied 61,664 km
2,
62 percent of the total land area. The land area owned by the public sector was 30,225 km2, 30
percent of the total area. Other land areas, including the land owned by foreigners, accounted
for 8 percent of the total land area.
APFSOS II: Republic of Korea
25
Table 9. Land area by ownership (2005)
Land area National
land Public land
Private land Other land Total Private Corporate
Area (km2) 99,646 23,033 7,192 61,664 56,457 5,207 7,757
Share (%) 100.0 23.1 7.2 61.9 56.7 5.2 7.8
Note: Public land refers to land owned by local governments.
Source: Ministry of Government Administration and Home Affairs.
The total land area has increased by 1,169 km2 since 1970, owing to the large-scale land
reclamation projects. The agricultural land area decreased by 4,735 km2 from 22,975 km
2 in
1970 to 18,240 km2 in 2005 while the forestland area decreased by 2,176 km
2 during the same
period. Urban and other land areas almost doubled from 9,387 km2 in 1970 to 17,467 km
2 in
2005. The reason for the decline in agricultural and forestland areas and the increase in urban
and other land areas is mainly because of the construction of social infrastructure, population
growth, and urbanization.
Table 10. Changes in land area
Category 1970 1985 1990 2000 2005
Total Area (km2) 98,477 98,992 99,274 99,461 99,646
Forestland1 (km
2)
66,115 65,120 64,602 64,221 63,939
Agricultural land2 (km
2)
22,975 21,444 21,088 18,888 18,240
Urban/other land3 (km
2)
9,387 12,428 13,584 16,352 17,467
Notes: 1. Forestland is the land where trees and bamboos are growing in a group with crown cover of
more than 30 percent and a minimum area of 1.0 ha.
2. Agricultural land is defined as land which is used for agriculture.
3. Urban/other land category is a residual category. It is defined as all land uses other than
forest and crops.
Forest area: Forest area decreased by 218,000 ha over the last 35 years from 6,612,000 ha in
1970 to 6,394,000 in 2005. Forest area declined by about 6 000 ha annually, or by 0.1 percent,
on the average. Net conversion of forestland increased from 4,000 ha per year in the 1970s to
9,000 ha per year in 1980s, but decreased by 5,000 ha per year in the 1990s.
Forestlands were converted mainly to agricultural lands until the late 1980s. Especially in the
1980s, many forestlands were converted into grasslands. In the mid-1980s, about 70 percent
of the total converted forest area was used for agriculture. However, since the late 1980s, the
demand for land use such as golf courses, ski grounds, and recreational use has increased, and
the forestland was converted or transformed to meet these demands. Recently, forestland
conversion has been for housing, industrial use, and roads, while conversion for agricultural
use is declining.
Recently, agricultural lands have been converted for other uses by 15,000 ha per year. It is
projected that agricultural land of more than 200,000 ha will be converted by 2020. Most of
the converted agricultural lands will be used for development purposes, but some lands will
remain unused. Therefore, conversion of forestland to agricultural land will be unlikely in the
future and the increasing conversion of agricultural land to other land uses will ease the
pressure of converting forest land to other uses for development purposes.
Changes in the forest area are influenced by several factors such as human, social and
economic factors and the government’s land policies. The population continued to increase,
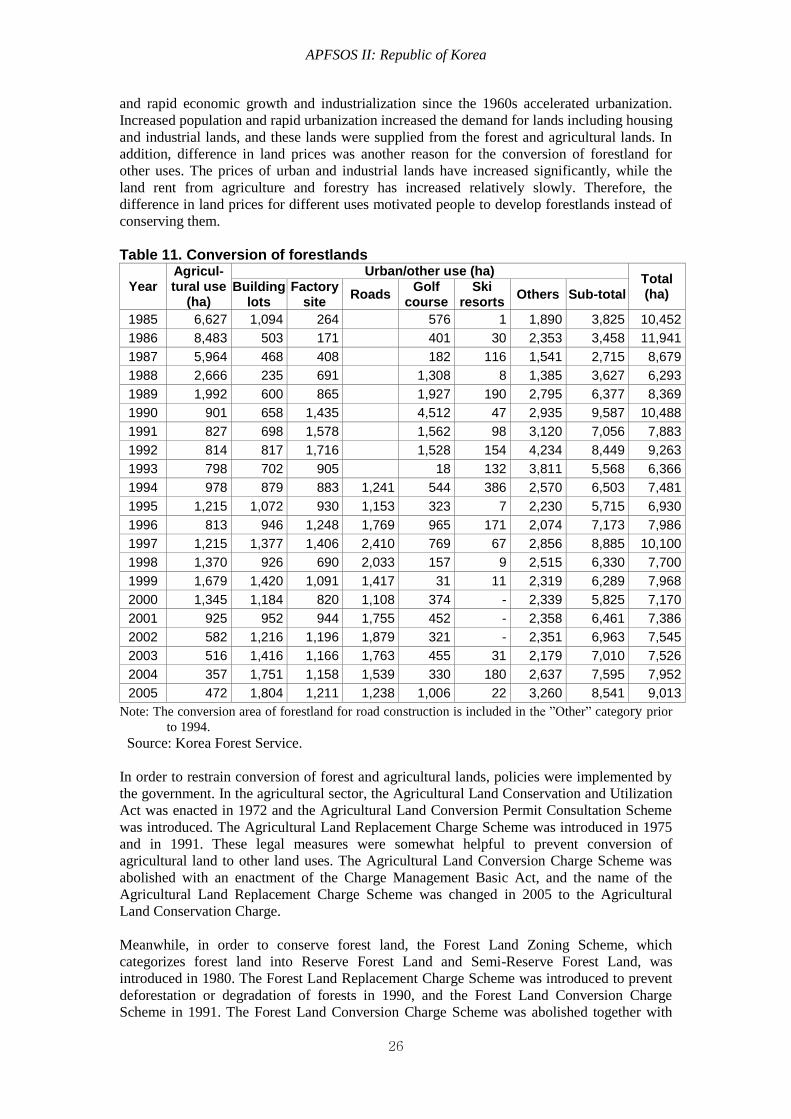
APFSOS II: Republic of Korea
26
and rapid economic growth and industrialization since the 1960s accelerated urbanization.
Increased population and rapid urbanization increased the demand for lands including housing
and industrial lands, and these lands were supplied from the forest and agricultural lands. In
addition, difference in land prices was another reason for the conversion of forestland for
other uses. The prices of urban and industrial lands have increased significantly, while the
land rent from agriculture and forestry has increased relatively slowly. Therefore, the
difference in land prices for different uses motivated people to develop forestlands instead of
conserving them.
Table 11. Conversion of forestlands
Year Agricul- tural use
(ha)
Urban/other use (ha) Total (ha)
Building lots
Factory site
Roads Golf
course Ski
resorts Others Sub-total
1985 6,627 1,094 264 576 1 1,890 3,825 10,452
1986 8,483 503 171 401 30 2,353 3,458 11,941
1987 5,964 468 408 182 116 1,541 2,715 8,679
1988 2,666 235 691 1,308 8 1,385 3,627 6,293
1989 1,992 600 865 1,927 190 2,795 6,377 8,369
1990 901 658 1,435 4,512 47 2,935 9,587 10,488
1991 827 698 1,578 1,562 98 3,120 7,056 7,883
1992 814 817 1,716 1,528 154 4,234 8,449 9,263
1993 798 702 905 18 132 3,811 5,568 6,366
1994 978 879 883 1,241 544 386 2,570 6,503 7,481
1995 1,215 1,072 930 1,153 323 7 2,230 5,715 6,930
1996 813 946 1,248 1,769 965 171 2,074 7,173 7,986
1997 1,215 1,377 1,406 2,410 769 67 2,856 8,885 10,100
1998 1,370 926 690 2,033 157 9 2,515 6,330 7,700
1999 1,679 1,420 1,091 1,417 31 11 2,319 6,289 7,968
2000 1,345 1,184 820 1,108 374 - 2,339 5,825 7,170
2001 925 952 944 1,755 452 - 2,358 6,461 7,386
2002 582 1,216 1,196 1,879 321 - 2,351 6,963 7,545
2003 516 1,416 1,166 1,763 455 31 2,179 7,010 7,526
2004 357 1,751 1,158 1,539 330 180 2,637 7,595 7,952
2005 472 1,804 1,211 1,238 1,006 22 3,260 8,541 9,013
Note: The conversion area of forestland for road construction is included in the ”Other” category prior
to 1994.
Source: Korea Forest Service.
In order to restrain conversion of forest and agricultural lands, policies were implemented by
the government. In the agricultural sector, the Agricultural Land Conservation and Utilization
Act was enacted in 1972 and the Agricultural Land Conversion Permit Consultation Scheme
was introduced. The Agricultural Land Replacement Charge Scheme was introduced in 1975
and in 1991. These legal measures were somewhat helpful to prevent conversion of
agricultural land to other land uses. The Agricultural Land Conversion Charge Scheme was
abolished with an enactment of the Charge Management Basic Act, and the name of the
Agricultural Land Replacement Charge Scheme was changed in 2005 to the Agricultural
Land Conservation Charge.
Meanwhile, in order to conserve forest land, the Forest Land Zoning Scheme, which
categorizes forest land into Reserve Forest Land and Semi-Reserve Forest Land, was
introduced in 1980. The Forest Land Replacement Charge Scheme was introduced to prevent
deforestation or degradation of forests in 1990, and the Forest Land Conversion Charge
Scheme in 1991. The Forest Land Conversion Charge Scheme was abolished together with
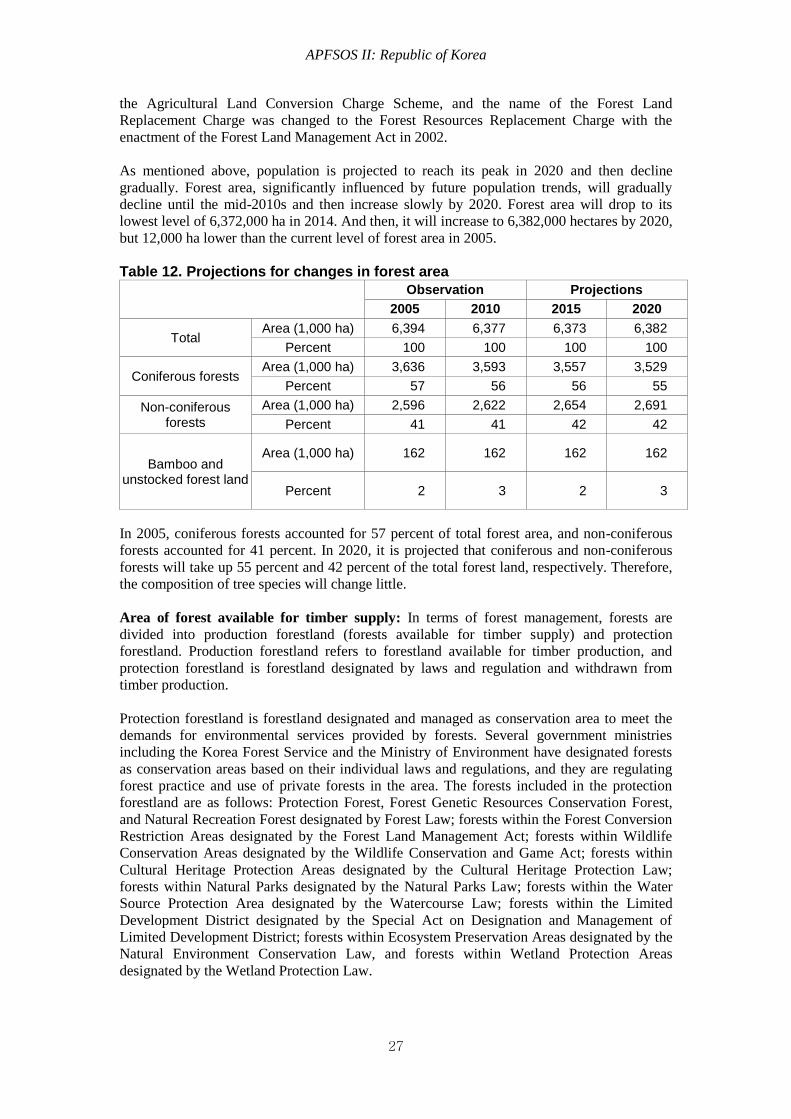
APFSOS II: Republic of Korea
27
the Agricultural Land Conversion Charge Scheme, and the name of the Forest Land
Replacement Charge was changed to the Forest Resources Replacement Charge with the
enactment of the Forest Land Management Act in 2002.
As mentioned above, population is projected to reach its peak in 2020 and then decline
gradually. Forest area, significantly influenced by future population trends, will gradually
decline until the mid-2010s and then increase slowly by 2020. Forest area will drop to its
lowest level of 6,372,000 ha in 2014. And then, it will increase to 6,382,000 hectares by 2020,
but 12,000 ha lower than the current level of forest area in 2005.
Table 12. Projections for changes in forest area
Observation Projections
2005 2010 2015 2020
Total Area (1,000 ha) 6,394 6,377 6,373 6,382
Percent 100 100 100 100
Coniferous forests Area (1,000 ha) 3,636 3,593 3,557 3,529
Percent 57 56 56 55
Non-coniferous forests
Area (1,000 ha) 2,596 2,622 2,654 2,691
Percent 41 41 42 42
Bamboo and unstocked forest land
Area (1,000 ha) 162 162 162 162
Percent 2 3 2 3
In 2005, coniferous forests accounted for 57 percent of total forest area, and non-coniferous
forests accounted for 41 percent. In 2020, it is projected that coniferous and non-coniferous
forests will take up 55 percent and 42 percent of the total forest land, respectively. Therefore,
the composition of tree species will change little.
Area of forest available for timber supply: In terms of forest management, forests are
divided into production forestland (forests available for timber supply) and protection
forestland. Production forestland refers to forestland available for timber production, and
protection forestland is forestland designated by laws and regulation and withdrawn from
timber production.
Protection forestland is forestland designated and managed as conservation area to meet the
demands for environmental services provided by forests. Several government ministries
including the Korea Forest Service and the Ministry of Environment have designated forests
as conservation areas based on their individual laws and regulations, and they are regulating
forest practice and use of private forests in the area. The forests included in the protection
forestland are as follows: Protection Forest, Forest Genetic Resources Conservation Forest,
and Natural Recreation Forest designated by Forest Law; forests within the Forest Conversion
Restriction Areas designated by the Forest Land Management Act; forests within Wildlife
Conservation Areas designated by the Wildlife Conservation and Game Act; forests within
Cultural Heritage Protection Areas designated by the Cultural Heritage Protection Law;
forests within Natural Parks designated by the Natural Parks Law; forests within the Water
Source Protection Area designated by the Watercourse Law; forests within the Limited
Development District designated by the Special Act on Designation and Management of
Limited Development District; forests within Ecosystem Preservation Areas designated by the
Natural Environment Conservation Law, and forests within Wetland Protection Areas
designated by the Wetland Protection Law.
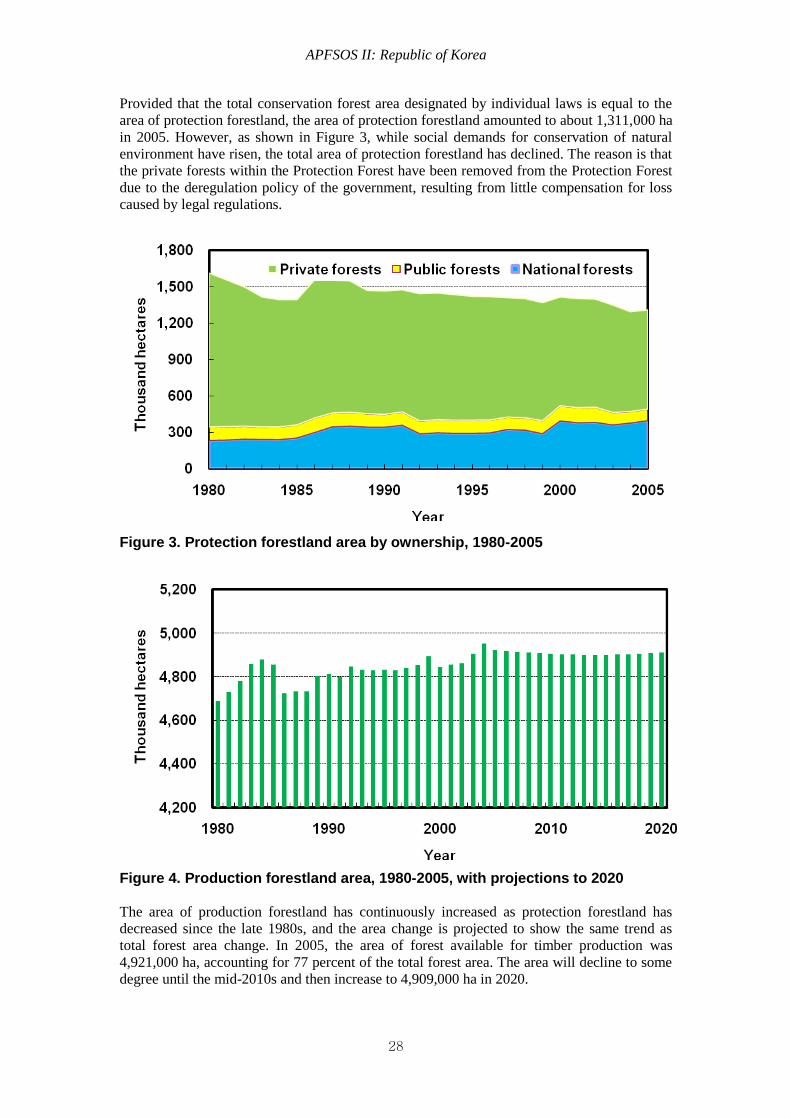
APFSOS II: Republic of Korea
28
Provided that the total conservation forest area designated by individual laws is equal to the
area of protection forestland, the area of protection forestland amounted to about 1,311,000 ha
in 2005. However, as shown in Figure 3, while social demands for conservation of natural
environment have risen, the total area of protection forestland has declined. The reason is that
the private forests within the Protection Forest have been removed from the Protection Forest
due to the deregulation policy of the government, resulting from little compensation for loss
caused by legal regulations.
Figure 3. Protection forestland area by ownership, 1980-2005
Figure 4. Production forestland area, 1980-2005, with projections to 2020
The area of production forestland has continuously increased as protection forestland has
decreased since the late 1980s, and the area change is projected to show the same trend as
total forest area change. In 2005, the area of forest available for timber production was
4,921,000 ha, accounting for 77 percent of the total forest area. The area will decline to some
degree until the mid-2010s and then increase to 4,909,000 ha in 2020.
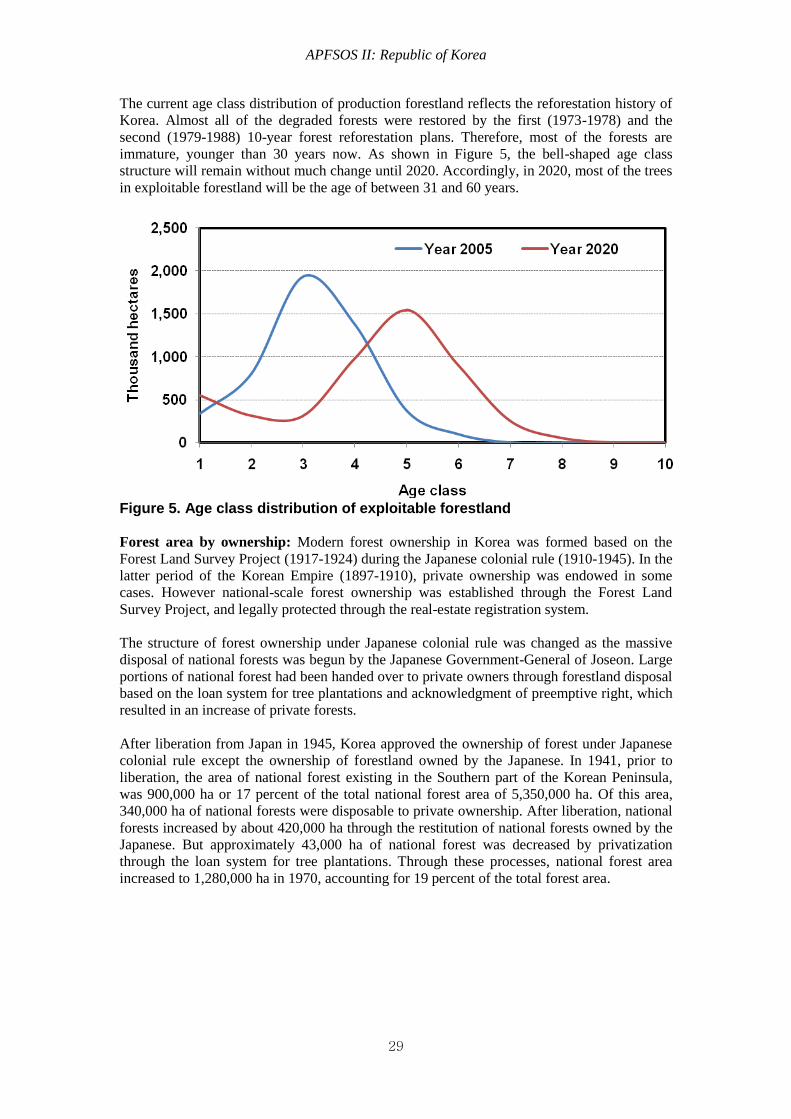
APFSOS II: Republic of Korea
29
The current age class distribution of production forestland reflects the reforestation history of
Korea. Almost all of the degraded forests were restored by the first (1973-1978) and the
second (1979-1988) 10-year forest reforestation plans. Therefore, most of the forests are
immature, younger than 30 years now. As shown in Figure 5, the bell-shaped age class
structure will remain without much change until 2020. Accordingly, in 2020, most of the trees
in exploitable forestland will be the age of between 31 and 60 years.
Figure 5. Age class distribution of exploitable forestland
Forest area by ownership: Modern forest ownership in Korea was formed based on the
Forest Land Survey Project (1917-1924) during the Japanese colonial rule (1910-1945). In the
latter period of the Korean Empire (1897-1910), private ownership was endowed in some
cases. However national-scale forest ownership was established through the Forest Land
Survey Project, and legally protected through the real-estate registration system.
The structure of forest ownership under Japanese colonial rule was changed as the massive
disposal of national forests was begun by the Japanese Government-General of Joseon. Large
portions of national forest had been handed over to private owners through forestland disposal
based on the loan system for tree plantations and acknowledgment of preemptive right, which
resulted in an increase of private forests.
After liberation from Japan in 1945, Korea approved the ownership of forest under Japanese
colonial rule except the ownership of forestland owned by the Japanese. In 1941, prior to
liberation, the area of national forest existing in the Southern part of the Korean Peninsula,
was 900,000 ha or 17 percent of the total national forest area of 5,350,000 ha. Of this area,
340,000 ha of national forests were disposable to private ownership. After liberation, national
forests increased by about 420,000 ha through the restitution of national forests owned by the
Japanese. But approximately 43,000 ha of national forest was decreased by privatization
through the loan system for tree plantations. Through these processes, national forest area
increased to 1,280,000 ha in 1970, accounting for 19 percent of the total forest area.
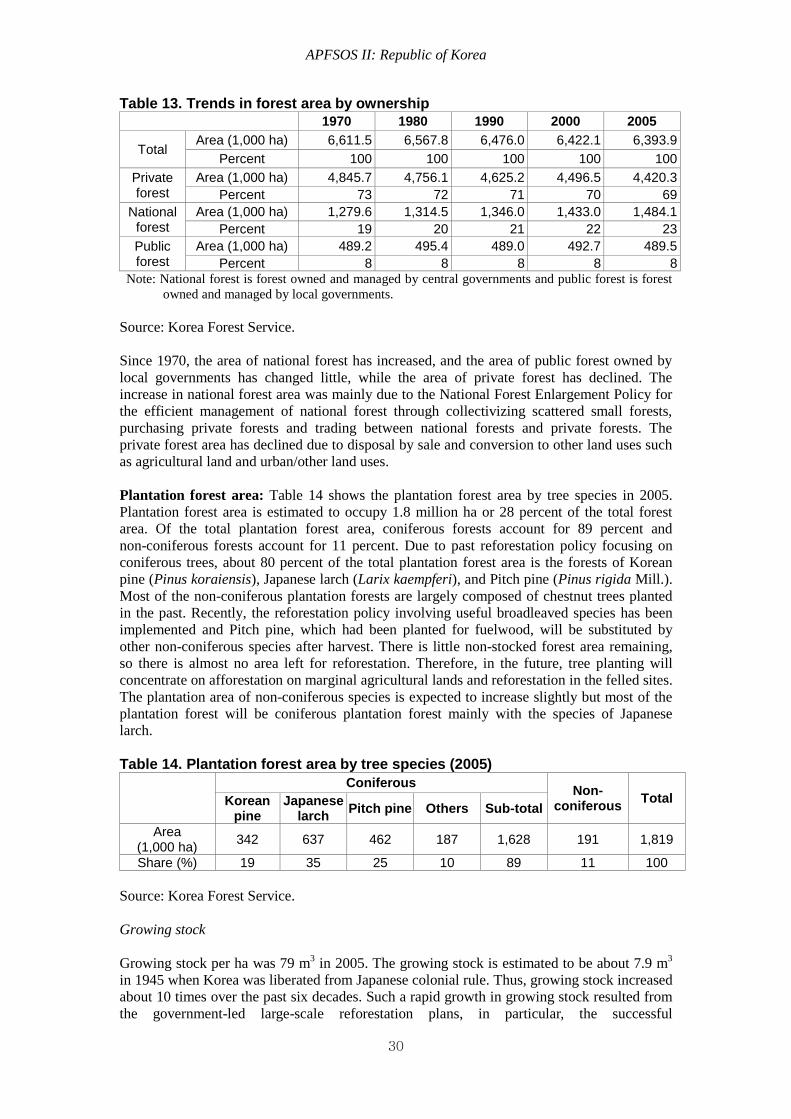
APFSOS II: Republic of Korea
30
Table 13. Trends in forest area by ownership
1970 1980 1990 2000 2005
Total Area (1,000 ha) 6,611.5 6,567.8 6,476.0 6,422.1 6,393.9
Percent 100 100 100 100 100
Private forest
Area (1,000 ha) 4,845.7 4,756.1 4,625.2 4,496.5 4,420.3
Percent 73 72 71 70 69
National forest
Area (1,000 ha) 1,279.6 1,314.5 1,346.0 1,433.0 1,484.1
Percent 19 20 21 22 23
Public forest
Area (1,000 ha) 489.2 495.4 489.0 492.7 489.5
Percent 8 8 8 8 8 Note: National forest is forest owned and managed by central governments and public forest is forest
owned and managed by local governments.
Source: Korea Forest Service.
Since 1970, the area of national forest has increased, and the area of public forest owned by
local governments has changed little, while the area of private forest has declined. The
increase in national forest area was mainly due to the National Forest Enlargement Policy for
the efficient management of national forest through collectivizing scattered small forests,
purchasing private forests and trading between national forests and private forests. The
private forest area has declined due to disposal by sale and conversion to other land uses such
as agricultural land and urban/other land uses.
Plantation forest area: Table 14 shows the plantation forest area by tree species in 2005.
Plantation forest area is estimated to occupy 1.8 million ha or 28 percent of the total forest
area. Of the total plantation forest area, coniferous forests account for 89 percent and
non-coniferous forests account for 11 percent. Due to past reforestation policy focusing on
coniferous trees, about 80 percent of the total plantation forest area is the forests of Korean
pine (Pinus koraiensis), Japanese larch (Larix kaempferi), and Pitch pine (Pinus rigida Mill.).
Most of the non-coniferous plantation forests are largely composed of chestnut trees planted
in the past. Recently, the reforestation policy involving useful broadleaved species has been
implemented and Pitch pine, which had been planted for fuelwood, will be substituted by
other non-coniferous species after harvest. There is little non-stocked forest area remaining,
so there is almost no area left for reforestation. Therefore, in the future, tree planting will
concentrate on afforestation on marginal agricultural lands and reforestation in the felled sites.
The plantation area of non-coniferous species is expected to increase slightly but most of the
plantation forest will be coniferous plantation forest mainly with the species of Japanese
larch.
Table 14. Plantation forest area by tree species (2005)
Coniferous Non-
coniferous Total Korean
pine Japanese
larch Pitch pine Others Sub-total
Area (1,000 ha)
342 637 462 187 1,628 191 1,819
Share (%) 19 35 25 10 89 11 100
Source: Korea Forest Service.
Growing stock
Growing stock per ha was 79 m3 in 2005. The growing stock is estimated to be about 7.9 m
3
in 1945 when Korea was liberated from Japanese colonial rule. Thus, growing stock increased
about 10 times over the past six decades. Such a rapid growth in growing stock resulted from
the government-led large-scale reforestation plans, in particular, the successful
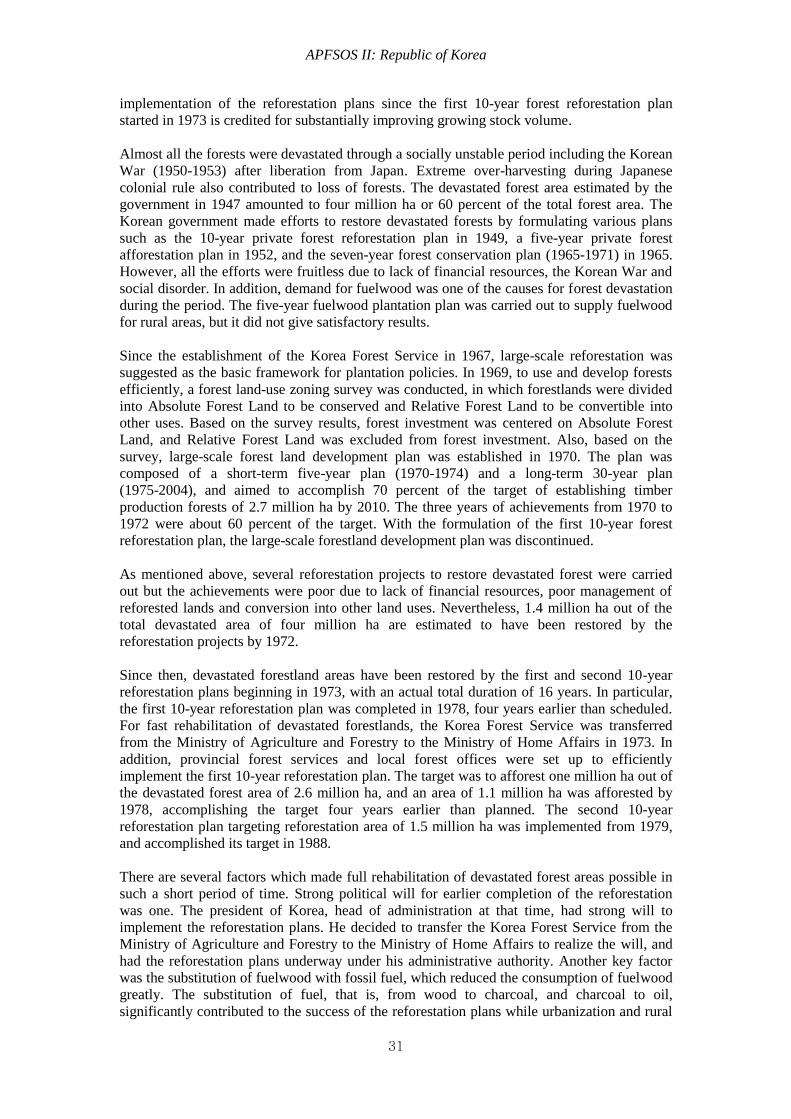
APFSOS II: Republic of Korea
31
implementation of the reforestation plans since the first 10-year forest reforestation plan
started in 1973 is credited for substantially improving growing stock volume.
Almost all the forests were devastated through a socially unstable period including the Korean
War (1950-1953) after liberation from Japan. Extreme over-harvesting during Japanese
colonial rule also contributed to loss of forests. The devastated forest area estimated by the
government in 1947 amounted to four million ha or 60 percent of the total forest area. The
Korean government made efforts to restore devastated forests by formulating various plans
such as the 10-year private forest reforestation plan in 1949, a five-year private forest
afforestation plan in 1952, and the seven-year forest conservation plan (1965-1971) in 1965.
However, all the efforts were fruitless due to lack of financial resources, the Korean War and
social disorder. In addition, demand for fuelwood was one of the causes for forest devastation
during the period. The five-year fuelwood plantation plan was carried out to supply fuelwood
for rural areas, but it did not give satisfactory results.
Since the establishment of the Korea Forest Service in 1967, large-scale reforestation was
suggested as the basic framework for plantation policies. In 1969, to use and develop forests
efficiently, a forest land-use zoning survey was conducted, in which forestlands were divided
into Absolute Forest Land to be conserved and Relative Forest Land to be convertible into
other uses. Based on the survey results, forest investment was centered on Absolute Forest
Land, and Relative Forest Land was excluded from forest investment. Also, based on the
survey, large-scale forest land development plan was established in 1970. The plan was
composed of a short-term five-year plan (1970-1974) and a long-term 30-year plan
(1975-2004), and aimed to accomplish 70 percent of the target of establishing timber
production forests of 2.7 million ha by 2010. The three years of achievements from 1970 to
1972 were about 60 percent of the target. With the formulation of the first 10-year forest
reforestation plan, the large-scale forestland development plan was discontinued.
As mentioned above, several reforestation projects to restore devastated forest were carried
out but the achievements were poor due to lack of financial resources, poor management of
reforested lands and conversion into other land uses. Nevertheless, 1.4 million ha out of the
total devastated area of four million ha are estimated to have been restored by the
reforestation projects by 1972.
Since then, devastated forestland areas have been restored by the first and second 10-year
reforestation plans beginning in 1973, with an actual total duration of 16 years. In particular,
the first 10-year reforestation plan was completed in 1978, four years earlier than scheduled.
For fast rehabilitation of devastated forestlands, the Korea Forest Service was transferred
from the Ministry of Agriculture and Forestry to the Ministry of Home Affairs in 1973. In
addition, provincial forest services and local forest offices were set up to efficiently
implement the first 10-year reforestation plan. The target was to afforest one million ha out of
the devastated forest area of 2.6 million ha, and an area of 1.1 million ha was afforested by
1978, accomplishing the target four years earlier than planned. The second 10-year
reforestation plan targeting reforestation area of 1.5 million ha was implemented from 1979,
and accomplished its target in 1988.
There are several factors which made full rehabilitation of devastated forest areas possible in
such a short period of time. Strong political will for earlier completion of the reforestation
was one. The president of Korea, head of administration at that time, had strong will to
implement the reforestation plans. He decided to transfer the Korea Forest Service from the
Ministry of Agriculture and Forestry to the Ministry of Home Affairs to realize the will, and
had the reforestation plans underway under his administrative authority. Another key factor
was the substitution of fuelwood with fossil fuel, which reduced the consumption of fuelwood
greatly. The substitution of fuel, that is, from wood to charcoal, and charcoal to oil,
significantly contributed to the success of the reforestation plans while urbanization and rural

APFSOS II: Republic of Korea
32
depopulation significantly reduced fuelwood consumption in rural areas.
Afforestation after the 1990s was limited to harvested forest areas and marginal agricultural
land and grassland, leading to a decrease in the annual area of afforestation. Prior to the first
10-year reforestation plan, 100,000 ha were afforested annually, and during the first 10-year
reforestation plan, this rose to 200,000 ha per year. It has now declined sharply to 20,000 ha
per year. Figure 6 shows the peak in afforested area of 454,000 ha in 1967. This was because,
with the launch of the Korea Forest Service, Pitch pine (Pinus rigida) and Black locust
(Robinia pseudoacacia) were planted in large areas in order to establish fuelwood forests.
Recently, forest policies have been changed from reforestation policy to forest tending policy,
and the forest tending area has increased rapidly as forest tending projects have been
implemented to create jobs, in particular, since the financial crisis of 1997.
Figure 6. Reforestation area by tree species, 1960-2005
Growing stock has been on the rise with the successful implementation of the government-led
reforestation projects. Growing stock was 68 million m3 in 1970, consisting of coniferous
forests of 38 million m3 and non-coniferous forests of 30 million m
3. The growing stock per
ha was 10 m3 in 1970. Growing stock increased to 506 million m
3 in 2005, consisting of
coniferous forests of 293 million m3 and non-coniferous forests of 213 million m
3. The
growing stock per ha was 79 m3 in 2005. Growing stock has increased by almost sevenfold
over the past 35 years.
Due to the continuous investments in reforestation and more intensive silviculture, growing
stock will be improved qualitatively and quantitatively. Growing stock will increase up to 727
million m3 or about 1.4 times the current level by 2020. The net annual increment, that is, the
annual growth minus the annual fellings, amounted to 17 million m3 in 2005. Fellings
(removals) refer to stumpage volume removal of obstacle trees, thinnings and harvest.
Removals as a result of forest damage are expected to happen but are unpredictable. Due to
increasing annual fellings and entering maturing stands, the net annual increment will decline
gradually to about 13 million m3 in 2020. As the net annual increment falls, the annual growth
rate of growing stock will drop from 3.5 percent to 1.8 percent in 2020.
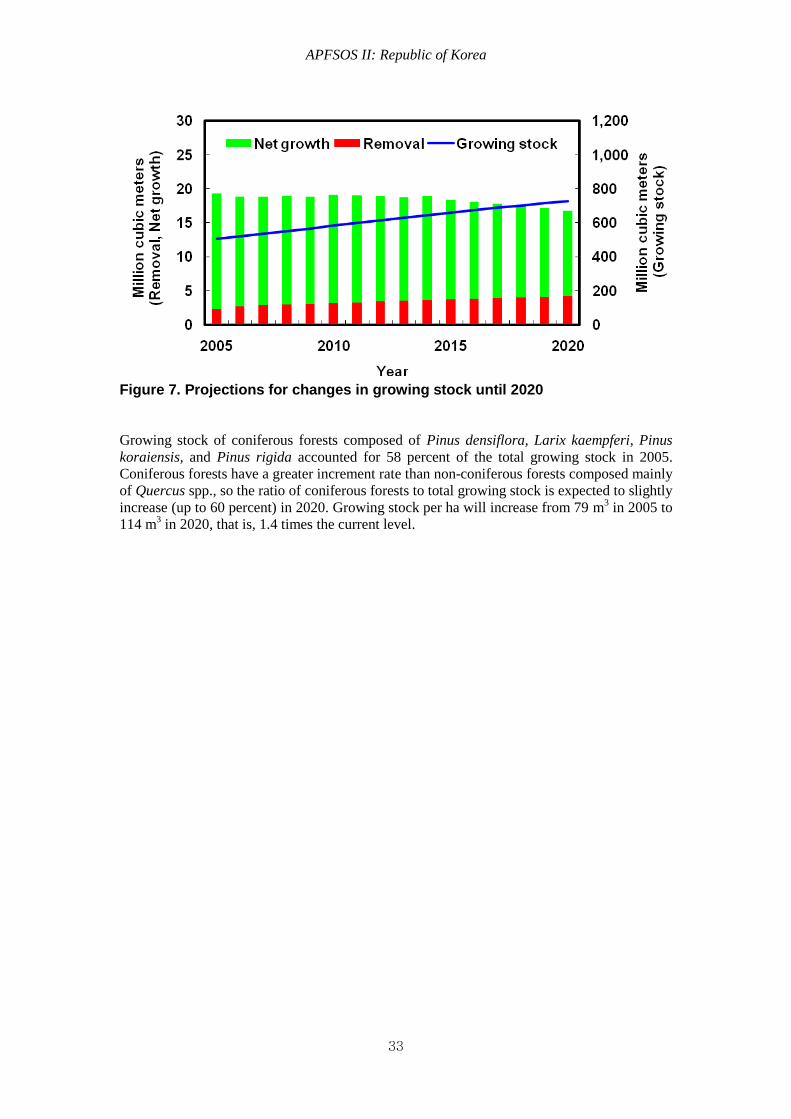
APFSOS II: Republic of Korea
33
Figure 7. Projections for changes in growing stock until 2020
Growing stock of coniferous forests composed of Pinus densiflora, Larix kaempferi, Pinus
koraiensis, and Pinus rigida accounted for 58 percent of the total growing stock in 2005.
Coniferous forests have a greater increment rate than non-coniferous forests composed mainly
of Quercus spp., so the ratio of coniferous forests to total growing stock is expected to slightly
increase (up to 60 percent) in 2020. Growing stock per ha will increase from 79 m3 in 2005 to
114 m3 in 2020, that is, 1.4 times the current level.

APFSOS II: Republic of Korea
34
Table 15. Projections for changes in growing stock
Observations Projections
2000 2005 2010 2015 2020
Forest area (1,000 ha) 6,422 6,394 6,377 6,373 6,382
Growing stock (million m
3)
Total 408 506 584 660 727
Coniferous forest
236 293 343 390 434
Non-coniferous forest
171 213 241 270 293
Growing stock per ha (m3) 64 79 92 104 114
Note: Bamboos are not included in growing stock and growing stock per ha.
Timber products
Lumber
Softwood lumber: Due to the economic growth and expansion of the construction market,
consumption of softwood lumber has risen rapidly by 5.4 percent per year over the past 35
years (1970 to 2005). It increased to 8.6 percent because of the domestic housing construction
boom in the 1980s, but it turned sluggish to 4.2 percent in the 1990s. During the financial
crisis, especially in 1998, softwood lumber consumption declined greatly to 2 million m3, but
it recovered to the previous level soon, and reached its peak of 4.6 million m3 in 2001.
Recently, it has hovered around 4 million m3 due to depression in the construction market.
Most softwood lumber consumption comes from lumber produced in domestic lumber mills.
As softwood lumber imports increased from the 1990s, the share of imported lumber has
increased gradually. About 10 percent of softwood lumber consumed in 2005 was imported
lumber.
Consumption of softwood lumber is expected to rise continuously due to the increase in
investment in construction, but at a much lower growth rate than in the past. Consumption of
softwood lumber is projected to increase by 1.4 percent a year by 2020, reaching about 5
million m3 in 2020.
Production of softwood lumber has increased significantly as its consumption increases.
Softwood lumber is mostly produced from imported softwood roundwood. Production of
softwood lumber has risen by 5.4 percent annually for the past 35 years (1970 to 2005). New
city construction and the two million house construction project, along with increased demand
for lumber exports to Japan have induced greater softwood lumber production and
consumption. However, as imports of lumber increased from the late 1990s along with a
slight decline in export demand, the growth rate of lumber production has slowed down.
Recently, due to reduced consumption, lumber production decreased from 4.3 million m3 in
2001 to 3.8 million m3 in 2005.
Production of softwood lumber will increase along with the increasing domestic consumption.
It will rise to 4.3 million m3 by 2020, recovering to the level of 2001. However, due to the
increase in production costs, production will not be able to catch up with the increasing
consumption. Accordingly, imports of lumber will increase significantly from 400,000 m3 in
2005 to about 700,000 m3 in 2020.
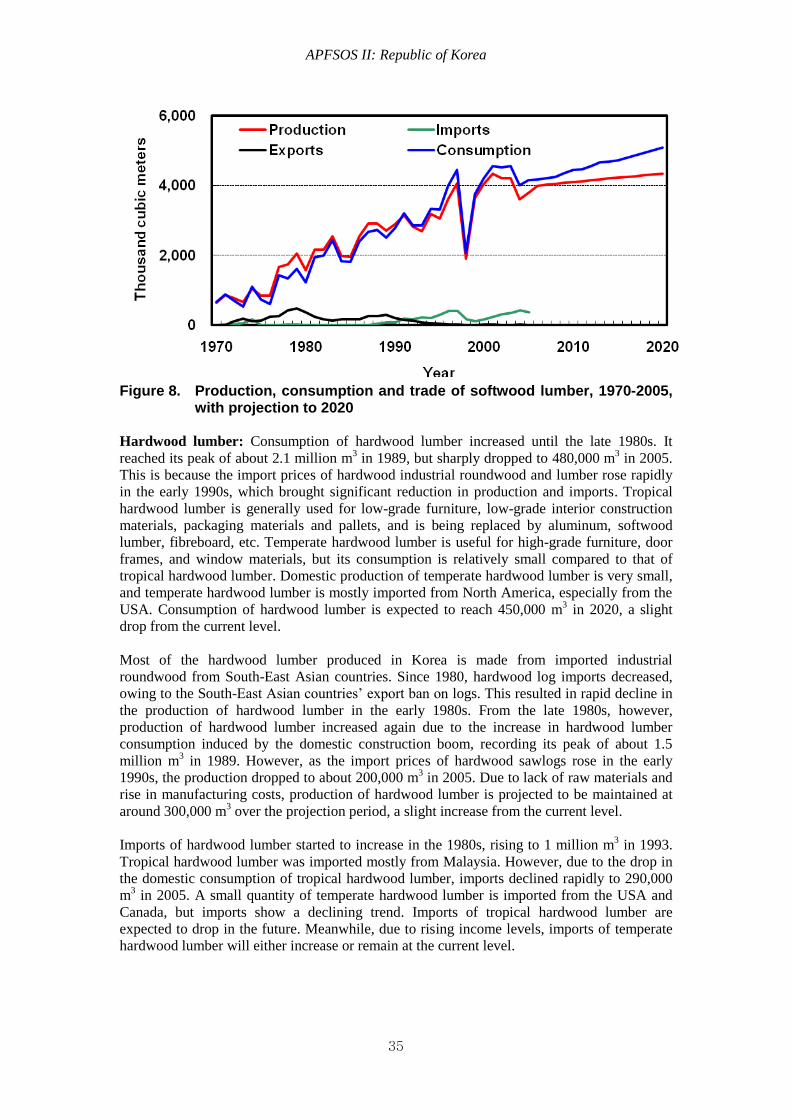
APFSOS II: Republic of Korea
35
Figure 8. Production, consumption and trade of softwood lumber, 1970-2005,
with projection to 2020
Hardwood lumber: Consumption of hardwood lumber increased until the late 1980s. It
reached its peak of about 2.1 million m3 in 1989, but sharply dropped to 480,000 m
3 in 2005.
This is because the import prices of hardwood industrial roundwood and lumber rose rapidly
in the early 1990s, which brought significant reduction in production and imports. Tropical
hardwood lumber is generally used for low-grade furniture, low-grade interior construction
materials, packaging materials and pallets, and is being replaced by aluminum, softwood
lumber, fibreboard, etc. Temperate hardwood lumber is useful for high-grade furniture, door
frames, and window materials, but its consumption is relatively small compared to that of
tropical hardwood lumber. Domestic production of temperate hardwood lumber is very small,
and temperate hardwood lumber is mostly imported from North America, especially from the
USA. Consumption of hardwood lumber is expected to reach 450,000 m3 in 2020, a slight
drop from the current level.
Most of the hardwood lumber produced in Korea is made from imported industrial
roundwood from South-East Asian countries. Since 1980, hardwood log imports decreased,
owing to the South-East Asian countries’ export ban on logs. This resulted in rapid decline in
the production of hardwood lumber in the early 1980s. From the late 1980s, however,
production of hardwood lumber increased again due to the increase in hardwood lumber
consumption induced by the domestic construction boom, recording its peak of about 1.5
million m3 in 1989. However, as the import prices of hardwood sawlogs rose in the early
1990s, the production dropped to about 200,000 m3 in 2005. Due to lack of raw materials and
rise in manufacturing costs, production of hardwood lumber is projected to be maintained at
around 300,000 m3 over the projection period, a slight increase from the current level.
Imports of hardwood lumber started to increase in the 1980s, rising to 1 million m3 in 1993.
Tropical hardwood lumber was imported mostly from Malaysia. However, due to the drop in
the domestic consumption of tropical hardwood lumber, imports declined rapidly to 290,000
m3 in 2005. A small quantity of temperate hardwood lumber is imported from the USA and
Canada, but imports show a declining trend. Imports of tropical hardwood lumber are
expected to drop in the future. Meanwhile, due to rising income levels, imports of temperate
hardwood lumber will either increase or remain at the current level.
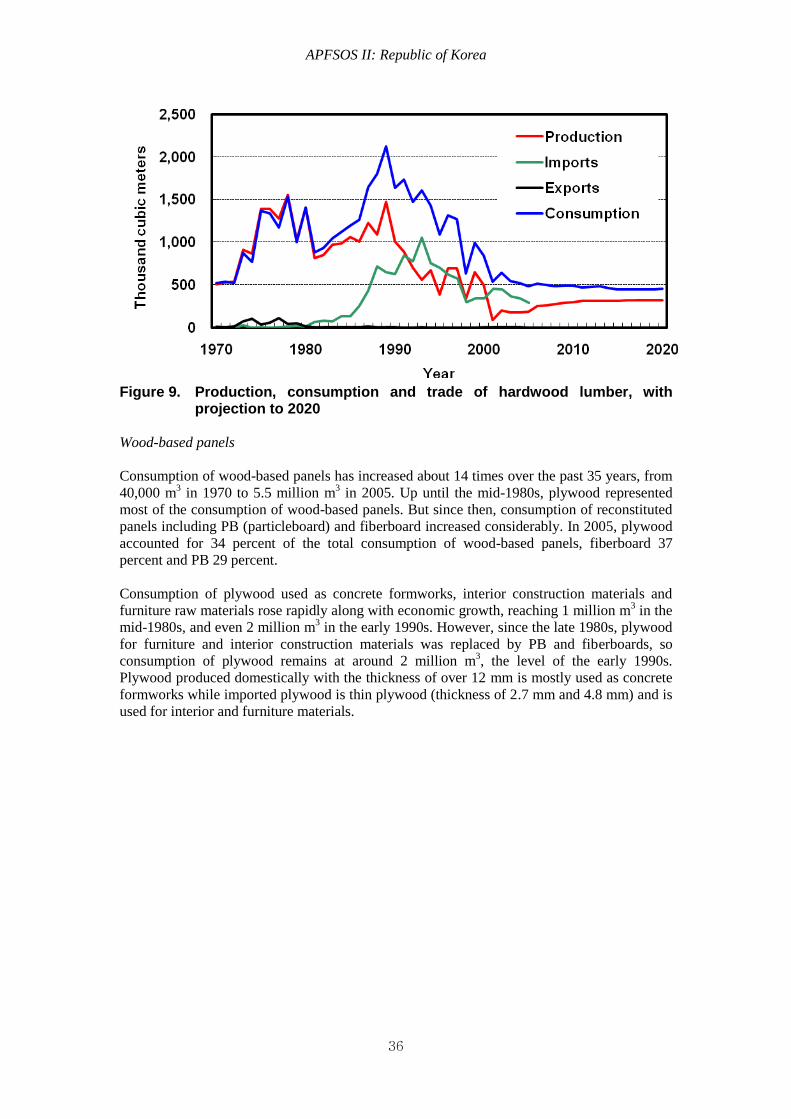
APFSOS II: Republic of Korea
36
Figure 9. Production, consumption and trade of hardwood lumber, with
projection to 2020
Wood-based panels
Consumption of wood-based panels has increased about 14 times over the past 35 years, from
40,000 m3 in 1970 to 5.5 million m
3 in 2005. Up until the mid-1980s, plywood represented
most of the consumption of wood-based panels. But since then, consumption of reconstituted
panels including PB (particleboard) and fiberboard increased considerably. In 2005, plywood
accounted for 34 percent of the total consumption of wood-based panels, fiberboard 37
percent and PB 29 percent.
Consumption of plywood used as concrete formworks, interior construction materials and
furniture raw materials rose rapidly along with economic growth, reaching 1 million m3 in the
mid-1980s, and even 2 million m3 in the early 1990s. However, since the late 1980s, plywood
for furniture and interior construction materials was replaced by PB and fiberboards, so
consumption of plywood remains at around 2 million m3, the level of the early 1990s.
Plywood produced domestically with the thickness of over 12 mm is mostly used as concrete
formworks while imported plywood is thin plywood (thickness of 2.7 mm and 4.8 mm) and is
used for interior and furniture materials.
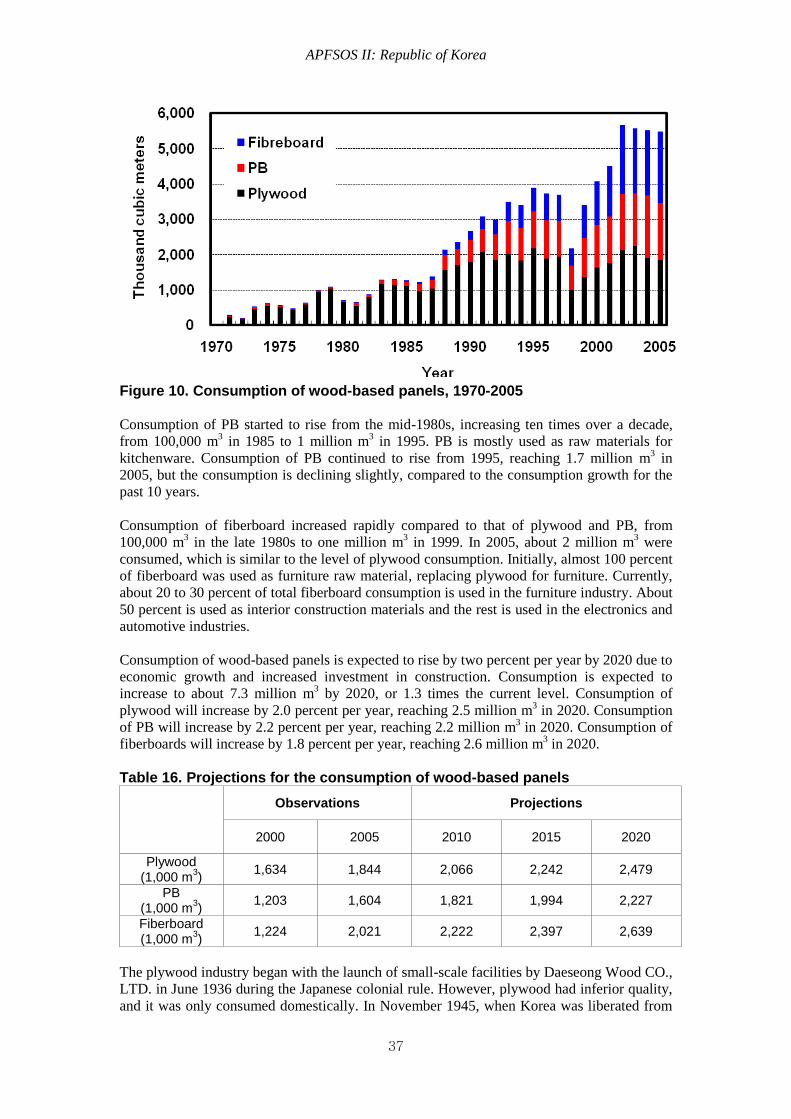
APFSOS II: Republic of Korea
37
Figure 10. Consumption of wood-based panels, 1970-2005
Consumption of PB started to rise from the mid-1980s, increasing ten times over a decade,
from 100,000 m3 in 1985 to 1 million m
3 in 1995. PB is mostly used as raw materials for
kitchenware. Consumption of PB continued to rise from 1995, reaching 1.7 million m3 in
2005, but the consumption is declining slightly, compared to the consumption growth for the
past 10 years.
Consumption of fiberboard increased rapidly compared to that of plywood and PB, from
100,000 m3 in the late 1980s to one million m
3 in 1999. In 2005, about 2 million m
3 were
consumed, which is similar to the level of plywood consumption. Initially, almost 100 percent
of fiberboard was used as furniture raw material, replacing plywood for furniture. Currently,
about 20 to 30 percent of total fiberboard consumption is used in the furniture industry. About
50 percent is used as interior construction materials and the rest is used in the electronics and
automotive industries.
Consumption of wood-based panels is expected to rise by two percent per year by 2020 due to
economic growth and increased investment in construction. Consumption is expected to
increase to about 7.3 million m3 by 2020, or 1.3 times the current level. Consumption of
plywood will increase by 2.0 percent per year, reaching 2.5 million m3 in 2020. Consumption
of PB will increase by 2.2 percent per year, reaching 2.2 million m3 in 2020. Consumption of
fiberboards will increase by 1.8 percent per year, reaching 2.6 million m3 in 2020.
Table 16. Projections for the consumption of wood-based panels
Observations Projections
2000 2005 2010 2015 2020
Plywood (1,000 m
3)
1,634 1,844 2,066 2,242 2,479
PB (1,000 m
3)
1,203 1,604 1,821 1,994 2,227
Fiberboard (1,000 m
3)
1,224 2,021 2,222 2,397 2,639
The plywood industry began with the launch of small-scale facilities by Daeseong Wood CO.,
LTD. in June 1936 during the Japanese colonial rule. However, plywood had inferior quality,
and it was only consumed domestically. In November 1945, when Korea was liberated from
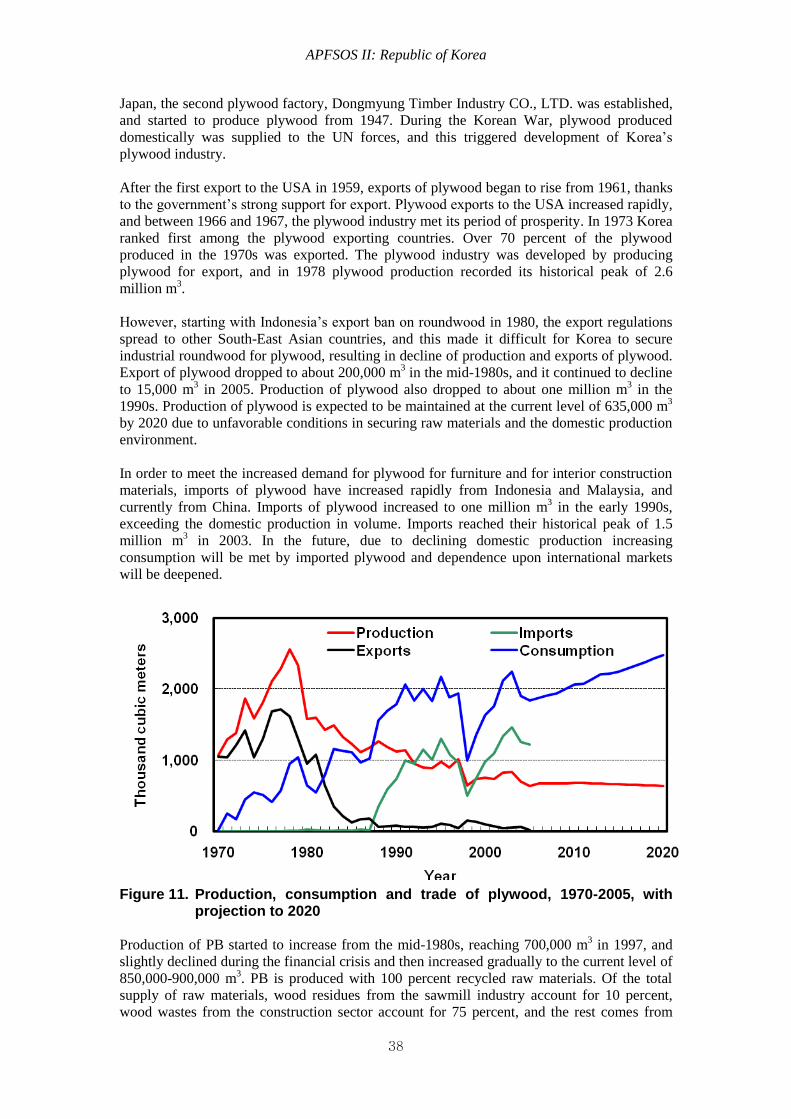
APFSOS II: Republic of Korea
38
Japan, the second plywood factory, Dongmyung Timber Industry CO., LTD. was established,
and started to produce plywood from 1947. During the Korean War, plywood produced
domestically was supplied to the UN forces, and this triggered development of Korea’s
plywood industry.
After the first export to the USA in 1959, exports of plywood began to rise from 1961, thanks
to the government’s strong support for export. Plywood exports to the USA increased rapidly,
and between 1966 and 1967, the plywood industry met its period of prosperity. In 1973 Korea
ranked first among the plywood exporting countries. Over 70 percent of the plywood
produced in the 1970s was exported. The plywood industry was developed by producing
plywood for export, and in 1978 plywood production recorded its historical peak of 2.6
million m3.
However, starting with Indonesia’s export ban on roundwood in 1980, the export regulations
spread to other South-East Asian countries, and this made it difficult for Korea to secure
industrial roundwood for plywood, resulting in decline of production and exports of plywood.
Export of plywood dropped to about 200,000 m3 in the mid-1980s, and it continued to decline
to 15,000 m3 in 2005. Production of plywood also dropped to about one million m
3 in the
1990s. Production of plywood is expected to be maintained at the current level of 635,000 m3
by 2020 due to unfavorable conditions in securing raw materials and the domestic production
environment.
In order to meet the increased demand for plywood for furniture and for interior construction
materials, imports of plywood have increased rapidly from Indonesia and Malaysia, and
currently from China. Imports of plywood increased to one million m3 in the early 1990s,
exceeding the domestic production in volume. Imports reached their historical peak of 1.5
million m3 in 2003. In the future, due to declining domestic production increasing
consumption will be met by imported plywood and dependence upon international markets
will be deepened.
Figure 11. Production, consumption and trade of plywood, 1970-2005, with
projection to 2020
Production of PB started to increase from the mid-1980s, reaching 700,000 m3 in 1997, and
slightly declined during the financial crisis and then increased gradually to the current level of
850,000-900,000 m3. PB is produced with 100 percent recycled raw materials. Of the total
supply of raw materials, wood residues from the sawmill industry account for 10 percent,
wood wastes from the construction sector account for 75 percent, and the rest comes from
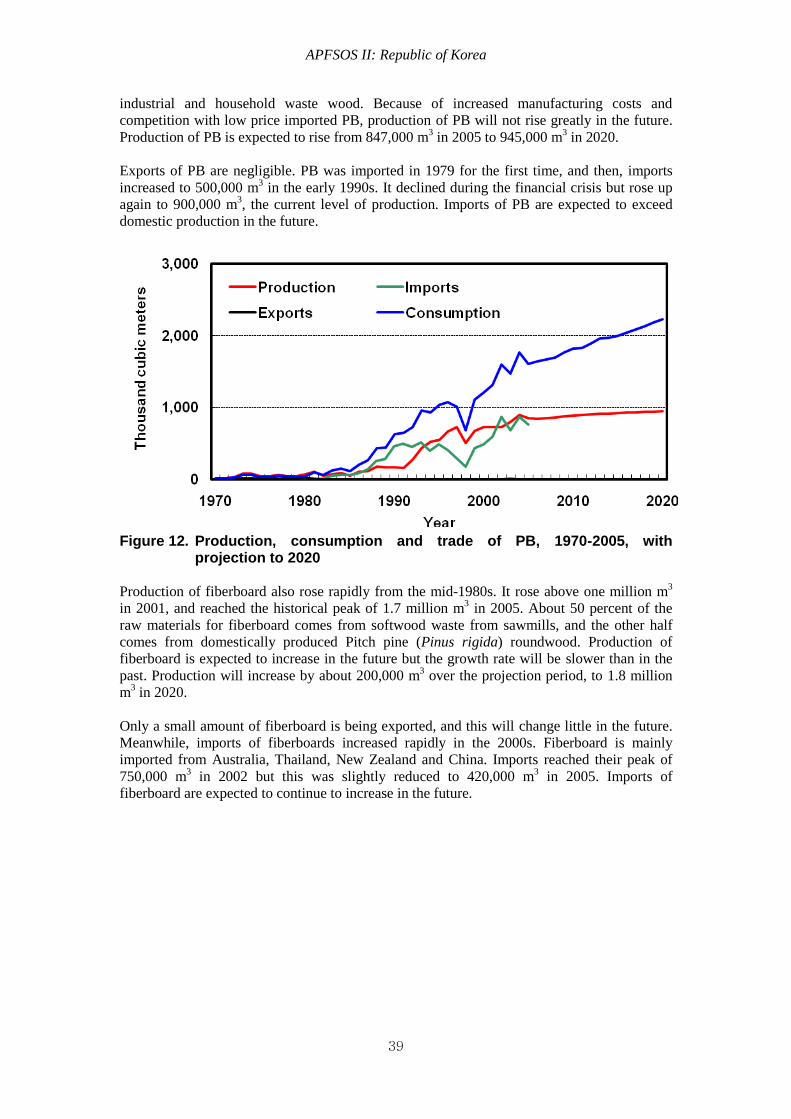
APFSOS II: Republic of Korea
39
industrial and household waste wood. Because of increased manufacturing costs and
competition with low price imported PB, production of PB will not rise greatly in the future.
Production of PB is expected to rise from 847,000 m3 in 2005 to 945,000 m
3 in 2020.
Exports of PB are negligible. PB was imported in 1979 for the first time, and then, imports
increased to 500,000 m3 in the early 1990s. It declined during the financial crisis but rose up
again to 900,000 m3, the current level of production. Imports of PB are expected to exceed
domestic production in the future.
Figure 12. Production, consumption and trade of PB, 1970-2005, with
projection to 2020
Production of fiberboard also rose rapidly from the mid-1980s. It rose above one million m3
in 2001, and reached the historical peak of 1.7 million m3 in 2005. About 50 percent of the
raw materials for fiberboard comes from softwood waste from sawmills, and the other half
comes from domestically produced Pitch pine (Pinus rigida) roundwood. Production of
fiberboard is expected to increase in the future but the growth rate will be slower than in the
past. Production will increase by about 200,000 m3 over the projection period, to 1.8 million
m3 in 2020.
Only a small amount of fiberboard is being exported, and this will change little in the future.
Meanwhile, imports of fiberboards increased rapidly in the 2000s. Fiberboard is mainly
imported from Australia, Thailand, New Zealand and China. Imports reached their peak of
750,000 m3 in 2002 but this was slightly reduced to 420,000 m
3 in 2005. Imports of
fiberboard are expected to continue to increase in the future.
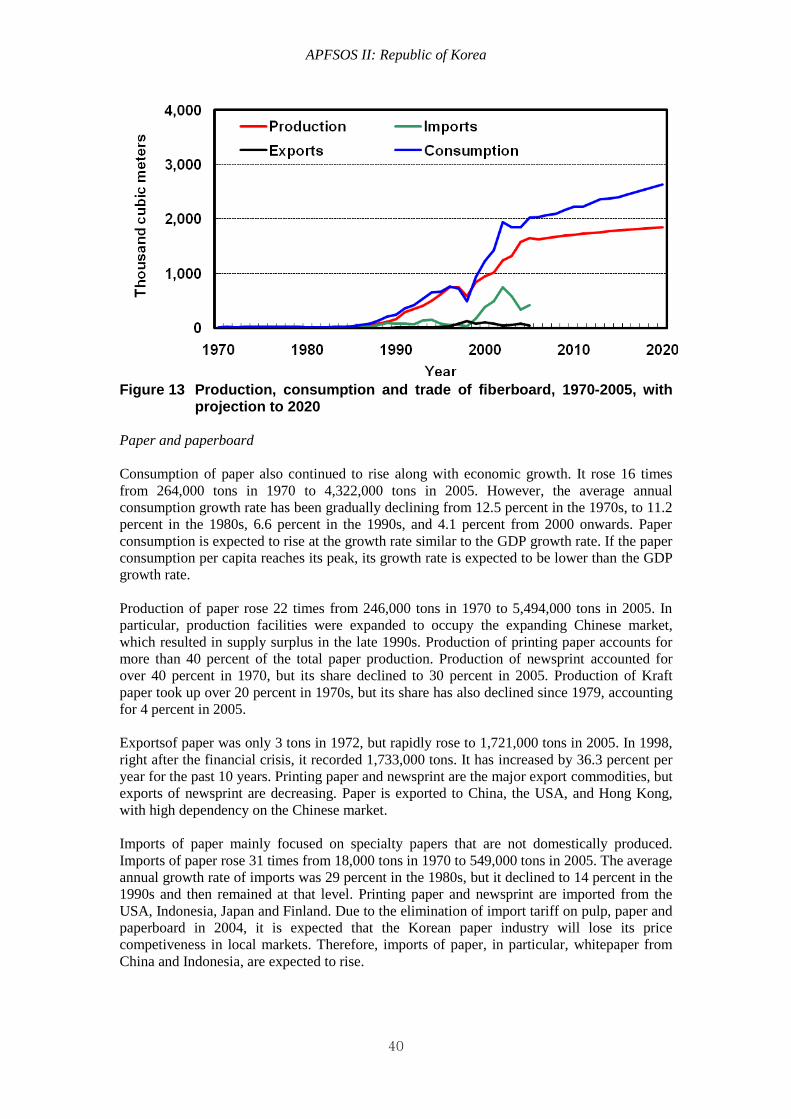
APFSOS II: Republic of Korea
40
Figure 13 Production, consumption and trade of fiberboard, 1970-2005, with
projection to 2020
Paper and paperboard
Consumption of paper also continued to rise along with economic growth. It rose 16 times
from 264,000 tons in 1970 to 4,322,000 tons in 2005. However, the average annual
consumption growth rate has been gradually declining from 12.5 percent in the 1970s, to 11.2
percent in the 1980s, 6.6 percent in the 1990s, and 4.1 percent from 2000 onwards. Paper
consumption is expected to rise at the growth rate similar to the GDP growth rate. If the paper
consumption per capita reaches its peak, its growth rate is expected to be lower than the GDP
growth rate.
Production of paper rose 22 times from 246,000 tons in 1970 to 5,494,000 tons in 2005. In
particular, production facilities were expanded to occupy the expanding Chinese market,
which resulted in supply surplus in the late 1990s. Production of printing paper accounts for
more than 40 percent of the total paper production. Production of newsprint accounted for
over 40 percent in 1970, but its share declined to 30 percent in 2005. Production of Kraft
paper took up over 20 percent in 1970s, but its share has also declined since 1979, accounting
for 4 percent in 2005.
Exportsof paper was only 3 tons in 1972, but rapidly rose to 1,721,000 tons in 2005. In 1998,
right after the financial crisis, it recorded 1,733,000 tons. It has increased by 36.3 percent per
year for the past 10 years. Printing paper and newsprint are the major export commodities, but
exports of newsprint are decreasing. Paper is exported to China, the USA, and Hong Kong,
with high dependency on the Chinese market.
Imports of paper mainly focused on specialty papers that are not domestically produced.
Imports of paper rose 31 times from 18,000 tons in 1970 to 549,000 tons in 2005. The average
annual growth rate of imports was 29 percent in the 1980s, but it declined to 14 percent in the
1990s and then remained at that level. Printing paper and newsprint are imported from the
USA, Indonesia, Japan and Finland. Due to the elimination of import tariff on pulp, paper and
paperboard in 2004, it is expected that the Korean paper industry will lose its price
competiveness in local markets. Therefore, imports of paper, in particular, whitepaper from
China and Indonesia, are expected to rise.
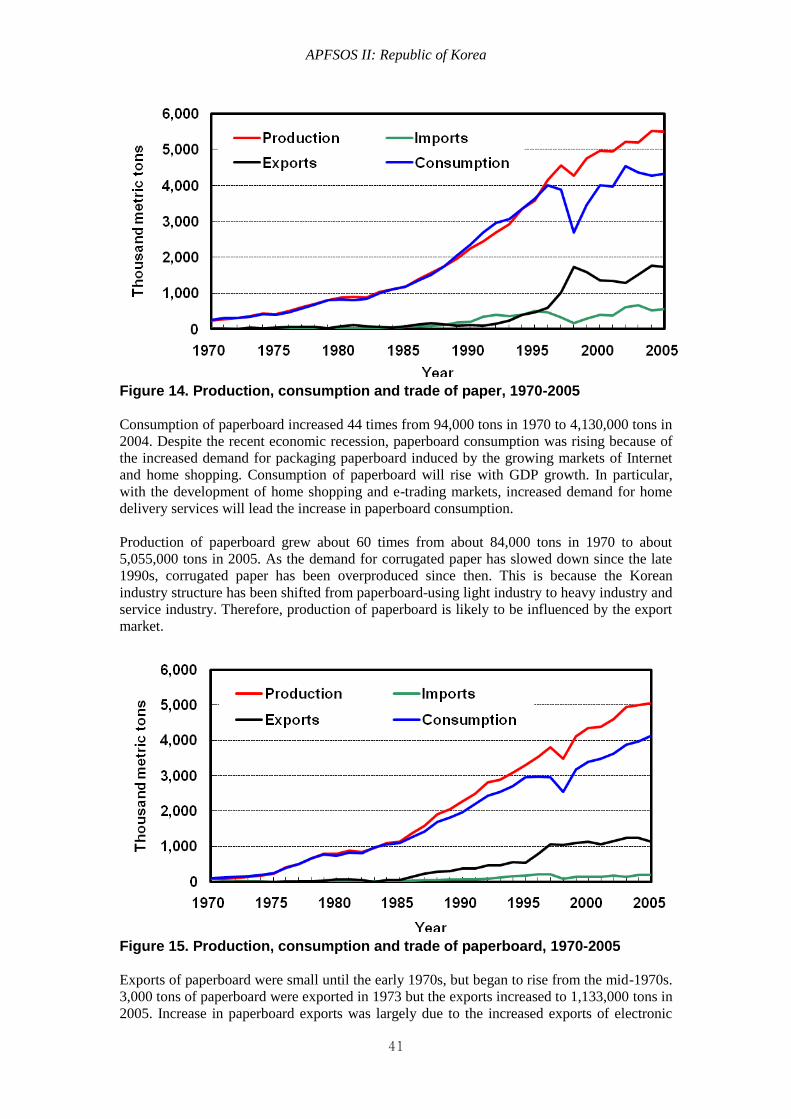
APFSOS II: Republic of Korea
41
Figure 14. Production, consumption and trade of paper, 1970-2005
Consumption of paperboard increased 44 times from 94,000 tons in 1970 to 4,130,000 tons in
2004. Despite the recent economic recession, paperboard consumption was rising because of
the increased demand for packaging paperboard induced by the growing markets of Internet
and home shopping. Consumption of paperboard will rise with GDP growth. In particular,
with the development of home shopping and e-trading markets, increased demand for home
delivery services will lead the increase in paperboard consumption.
Production of paperboard grew about 60 times from about 84,000 tons in 1970 to about
5,055,000 tons in 2005. As the demand for corrugated paper has slowed down since the late
1990s, corrugated paper has been overproduced since then. This is because the Korean
industry structure has been shifted from paperboard-using light industry to heavy industry and
service industry. Therefore, production of paperboard is likely to be influenced by the export
market.
Figure 15. Production, consumption and trade of paperboard, 1970-2005
Exports of paperboard were small until the early 1970s, but began to rise from the mid-1970s.
3,000 tons of paperboard were exported in 1973 but the exports increased to 1,133,000 tons in
2005. Increase in paperboard exports was largely due to the increased exports of electronic
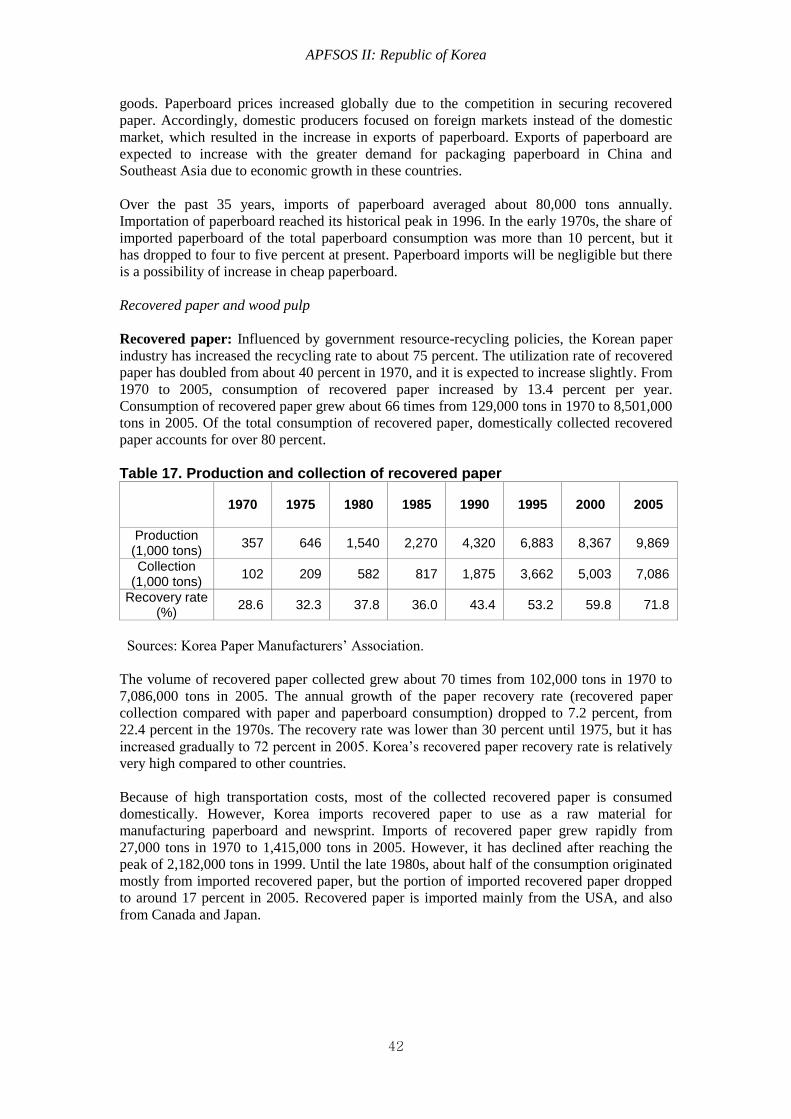
APFSOS II: Republic of Korea
42
goods. Paperboard prices increased globally due to the competition in securing recovered
paper. Accordingly, domestic producers focused on foreign markets instead of the domestic
market, which resulted in the increase in exports of paperboard. Exports of paperboard are
expected to increase with the greater demand for packaging paperboard in China and
Southeast Asia due to economic growth in these countries.
Over the past 35 years, imports of paperboard averaged about 80,000 tons annually.
Importation of paperboard reached its historical peak in 1996. In the early 1970s, the share of
imported paperboard of the total paperboard consumption was more than 10 percent, but it
has dropped to four to five percent at present. Paperboard imports will be negligible but there
is a possibility of increase in cheap paperboard.
Recovered paper and wood pulp
Recovered paper: Influenced by government resource-recycling policies, the Korean paper
industry has increased the recycling rate to about 75 percent. The utilization rate of recovered
paper has doubled from about 40 percent in 1970, and it is expected to increase slightly. From
1970 to 2005, consumption of recovered paper increased by 13.4 percent per year.
Consumption of recovered paper grew about 66 times from 129,000 tons in 1970 to 8,501,000
tons in 2005. Of the total consumption of recovered paper, domestically collected recovered
paper accounts for over 80 percent.
Table 17. Production and collection of recovered paper
1970 1975 1980 1985 1990 1995 2000 2005
Production (1,000 tons)
357 646 1,540 2,270 4,320 6,883 8,367 9,869
Collection (1,000 tons)
102 209 582 817 1,875 3,662 5,003 7,086
Recovery rate (%)
28.6 32.3 37.8 36.0 43.4 53.2 59.8 71.8
Sources: Korea Paper Manufacturers’ Association.
The volume of recovered paper collected grew about 70 times from 102,000 tons in 1970 to
7,086,000 tons in 2005. The annual growth of the paper recovery rate (recovered paper
collection compared with paper and paperboard consumption) dropped to 7.2 percent, from
22.4 percent in the 1970s. The recovery rate was lower than 30 percent until 1975, but it has
increased gradually to 72 percent in 2005. Korea’s recovered paper recovery rate is relatively
very high compared to other countries.
Because of high transportation costs, most of the collected recovered paper is consumed
domestically. However, Korea imports recovered paper to use as a raw material for
manufacturing paperboard and newsprint. Imports of recovered paper grew rapidly from
27,000 tons in 1970 to 1,415,000 tons in 2005. However, it has declined after reaching the
peak of 2,182,000 tons in 1999. Until the late 1980s, about half of the consumption originated
mostly from imported recovered paper, but the portion of imported recovered paper dropped
to around 17 percent in 2005. Recovered paper is imported mainly from the USA, and also
from Canada and Japan.
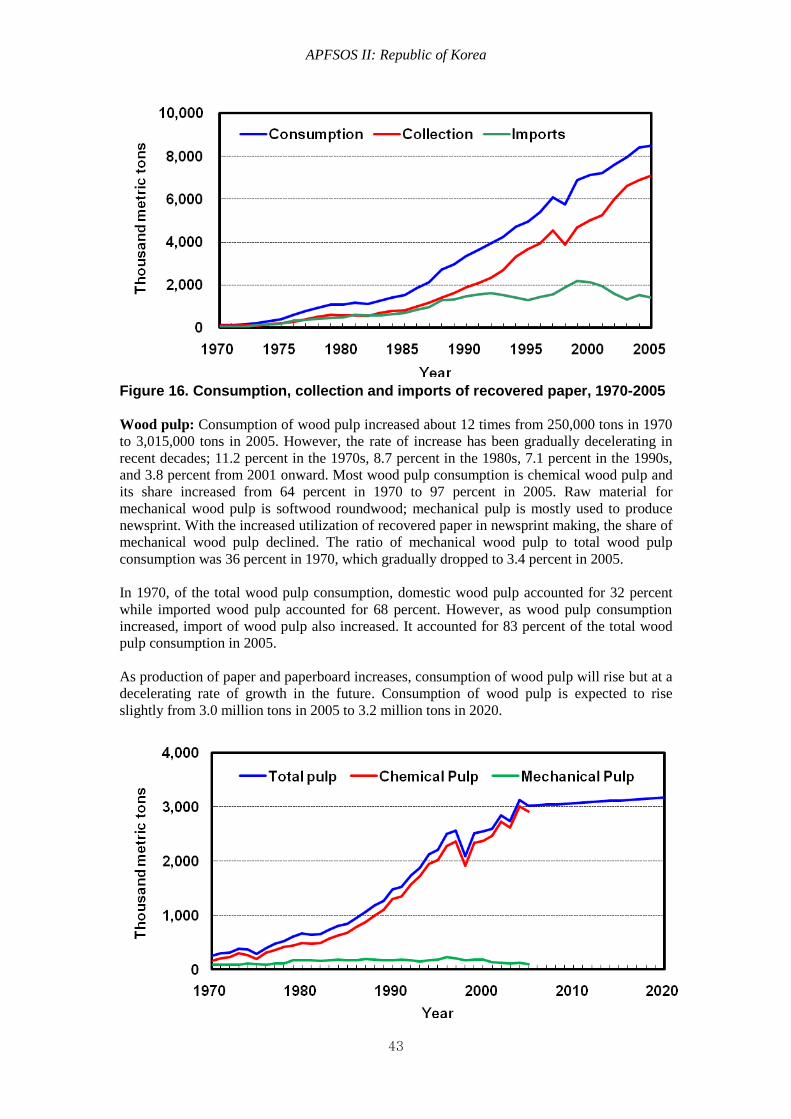
APFSOS II: Republic of Korea
43
Figure 16. Consumption, collection and imports of recovered paper, 1970-2005
Wood pulp: Consumption of wood pulp increased about 12 times from 250,000 tons in 1970
to 3,015,000 tons in 2005. However, the rate of increase has been gradually decelerating in
recent decades; 11.2 percent in the 1970s, 8.7 percent in the 1980s, 7.1 percent in the 1990s,
and 3.8 percent from 2001 onward. Most wood pulp consumption is chemical wood pulp and
its share increased from 64 percent in 1970 to 97 percent in 2005. Raw material for
mechanical wood pulp is softwood roundwood; mechanical pulp is mostly used to produce
newsprint. With the increased utilization of recovered paper in newsprint making, the share of
mechanical wood pulp declined. The ratio of mechanical wood pulp to total wood pulp
consumption was 36 percent in 1970, which gradually dropped to 3.4 percent in 2005.
In 1970, of the total wood pulp consumption, domestic wood pulp accounted for 32 percent
while imported wood pulp accounted for 68 percent. However, as wood pulp consumption
increased, import of wood pulp also increased. It accounted for 83 percent of the total wood
pulp consumption in 2005.
As production of paper and paperboard increases, consumption of wood pulp will rise but at a
decelerating rate of growth in the future. Consumption of wood pulp is expected to rise
slightly from 3.0 million tons in 2005 to 3.2 million tons in 2020.
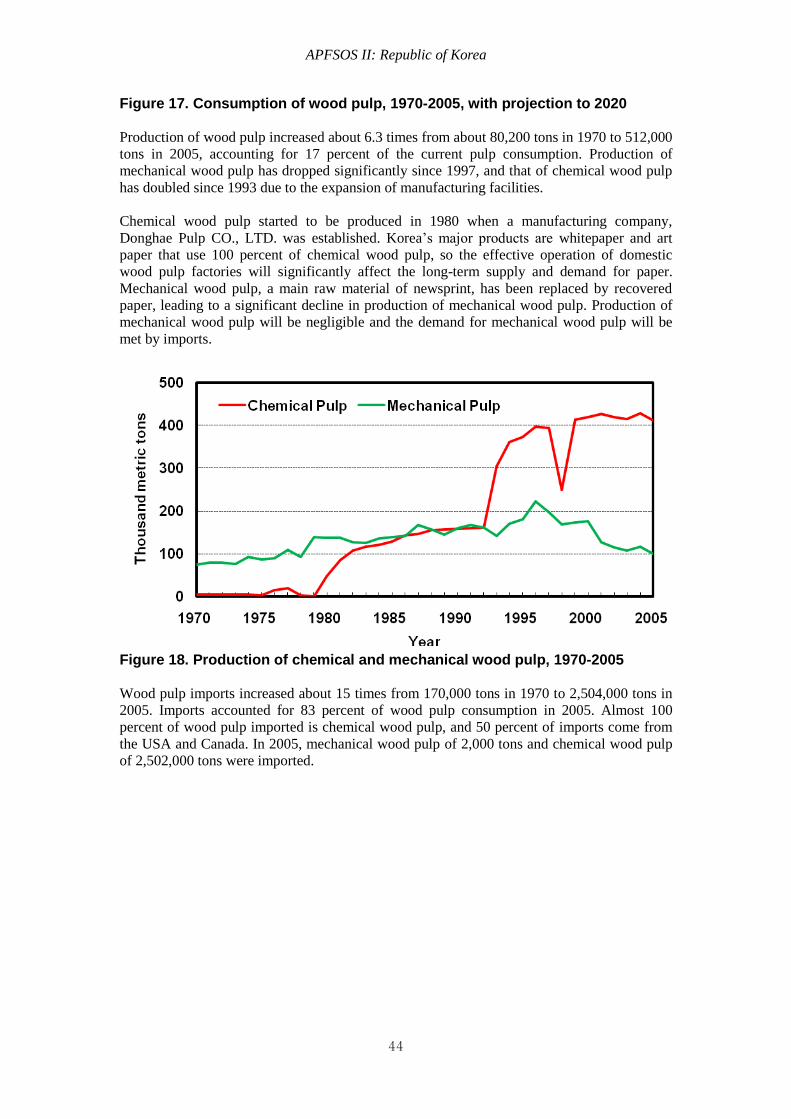
APFSOS II: Republic of Korea
44
Figure 17. Consumption of wood pulp, 1970-2005, with projection to 2020
Production of wood pulp increased about 6.3 times from about 80,200 tons in 1970 to 512,000
tons in 2005, accounting for 17 percent of the current pulp consumption. Production of
mechanical wood pulp has dropped significantly since 1997, and that of chemical wood pulp
has doubled since 1993 due to the expansion of manufacturing facilities.
Chemical wood pulp started to be produced in 1980 when a manufacturing company,
Donghae Pulp CO., LTD. was established. Korea’s major products are whitepaper and art
paper that use 100 percent of chemical wood pulp, so the effective operation of domestic
wood pulp factories will significantly affect the long-term supply and demand for paper.
Mechanical wood pulp, a main raw material of newsprint, has been replaced by recovered
paper, leading to a significant decline in production of mechanical wood pulp. Production of
mechanical wood pulp will be negligible and the demand for mechanical wood pulp will be
met by imports.
Figure 18. Production of chemical and mechanical wood pulp, 1970-2005
Wood pulp imports increased about 15 times from 170,000 tons in 1970 to 2,504,000 tons in
2005. Imports accounted for 83 percent of wood pulp consumption in 2005. Almost 100
percent of wood pulp imported is chemical wood pulp, and 50 percent of imports come from
the USA and Canada. In 2005, mechanical wood pulp of 2,000 tons and chemical wood pulp
of 2,502,000 tons were imported.
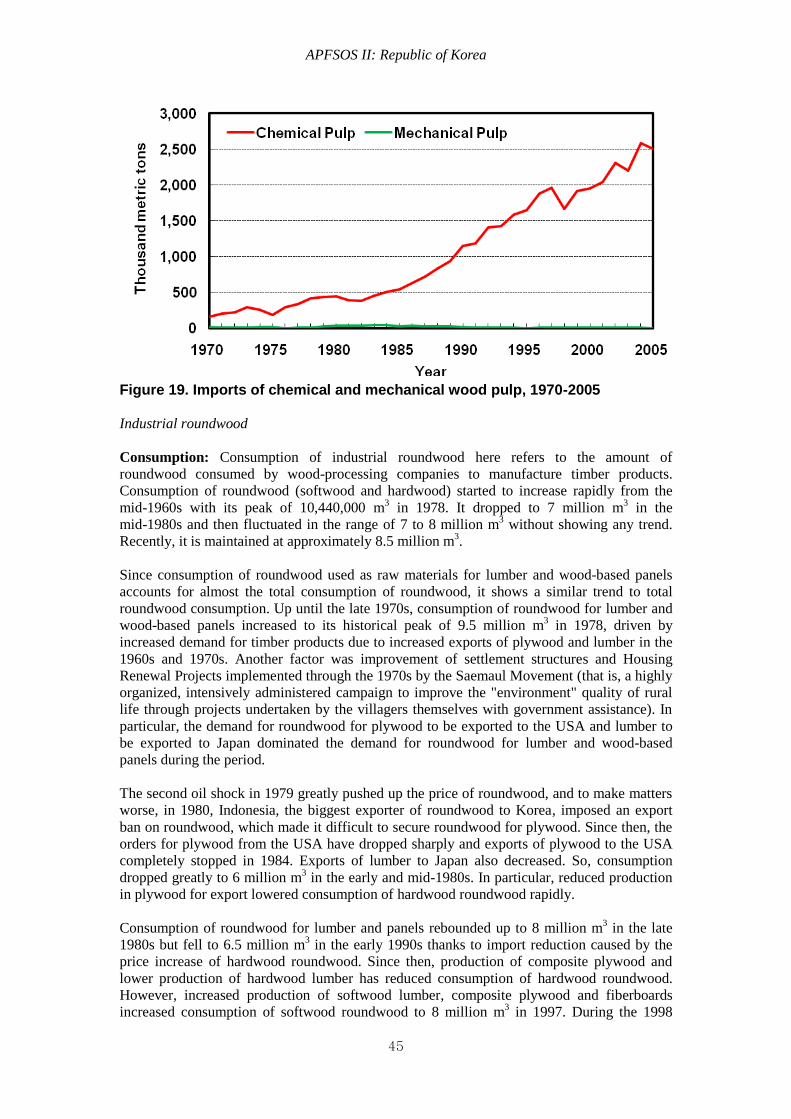
APFSOS II: Republic of Korea
45
Figure 19. Imports of chemical and mechanical wood pulp, 1970-2005
Industrial roundwood
Consumption: Consumption of industrial roundwood here refers to the amount of
roundwood consumed by wood-processing companies to manufacture timber products.
Consumption of roundwood (softwood and hardwood) started to increase rapidly from the
mid-1960s with its peak of 10,440,000 m3 in 1978. It dropped to 7 million m
3 in the
mid-1980s and then fluctuated in the range of 7 to 8 million m3 without showing any trend.
Recently, it is maintained at approximately 8.5 million m3.
Since consumption of roundwood used as raw materials for lumber and wood-based panels
accounts for almost the total consumption of roundwood, it shows a similar trend to total
roundwood consumption. Up until the late 1970s, consumption of roundwood for lumber and
wood-based panels increased to its historical peak of 9.5 million m3 in 1978, driven by
increased demand for timber products due to increased exports of plywood and lumber in the
1960s and 1970s. Another factor was improvement of settlement structures and Housing
Renewal Projects implemented through the 1970s by the Saemaul Movement (that is, a highly
organized, intensively administered campaign to improve the "environment" quality of rural
life through projects undertaken by the villagers themselves with government assistance). In
particular, the demand for roundwood for plywood to be exported to the USA and lumber to
be exported to Japan dominated the demand for roundwood for lumber and wood-based
panels during the period.
The second oil shock in 1979 greatly pushed up the price of roundwood, and to make matters
worse, in 1980, Indonesia, the biggest exporter of roundwood to Korea, imposed an export
ban on roundwood, which made it difficult to secure roundwood for plywood. Since then, the
orders for plywood from the USA have dropped sharply and exports of plywood to the USA
completely stopped in 1984. Exports of lumber to Japan also decreased. So, consumption
dropped greatly to 6 million m3 in the early and mid-1980s. In particular, reduced production
in plywood for export lowered consumption of hardwood roundwood rapidly.
Consumption of roundwood for lumber and panels rebounded up to 8 million m3 in the late
1980s but fell to 6.5 million m3 in the early 1990s thanks to import reduction caused by the
price increase of hardwood roundwood. Since then, production of composite plywood and
lower production of hardwood lumber has reduced consumption of hardwood roundwood.
However, increased production of softwood lumber, composite plywood and fiberboards
increased consumption of softwood roundwood to 8 million m3 in 1997. During the 1998
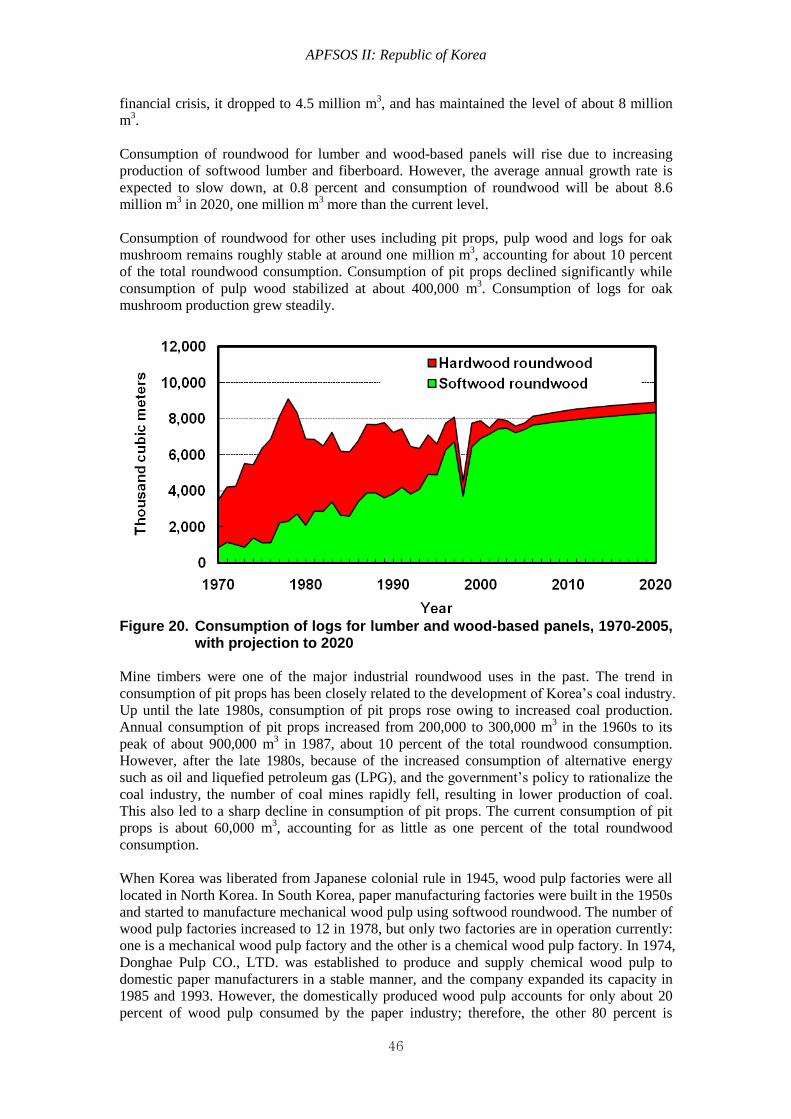
APFSOS II: Republic of Korea
46
financial crisis, it dropped to 4.5 million m3, and has maintained the level of about 8 million
m3.
Consumption of roundwood for lumber and wood-based panels will rise due to increasing
production of softwood lumber and fiberboard. However, the average annual growth rate is
expected to slow down, at 0.8 percent and consumption of roundwood will be about 8.6
million m3 in 2020, one million m
3 more than the current level.
Consumption of roundwood for other uses including pit props, pulp wood and logs for oak
mushroom remains roughly stable at around one million m3, accounting for about 10 percent
of the total roundwood consumption. Consumption of pit props declined significantly while
consumption of pulp wood stabilized at about 400,000 m3. Consumption of logs for oak
mushroom production grew steadily.
Figure 20. Consumption of logs for lumber and wood-based panels, 1970-2005,
with projection to 2020
Mine timbers were one of the major industrial roundwood uses in the past. The trend in
consumption of pit props has been closely related to the development of Korea’s coal industry.
Up until the late 1980s, consumption of pit props rose owing to increased coal production.
Annual consumption of pit props increased from 200,000 to 300,000 m3 in the 1960s to its
peak of about 900,000 m3 in 1987, about 10 percent of the total roundwood consumption.
However, after the late 1980s, because of the increased consumption of alternative energy
such as oil and liquefied petroleum gas (LPG), and the government’s policy to rationalize the
coal industry, the number of coal mines rapidly fell, resulting in lower production of coal.
This also led to a sharp decline in consumption of pit props. The current consumption of pit
props is about 60,000 m3, accounting for as little as one percent of the total roundwood
consumption.
When Korea was liberated from Japanese colonial rule in 1945, wood pulp factories were all
located in North Korea. In South Korea, paper manufacturing factories were built in the 1950s
and started to manufacture mechanical wood pulp using softwood roundwood. The number of
wood pulp factories increased to 12 in 1978, but only two factories are in operation currently:
one is a mechanical wood pulp factory and the other is a chemical wood pulp factory. In 1974,
Donghae Pulp CO., LTD. was established to produce and supply chemical wood pulp to
domestic paper manufacturers in a stable manner, and the company expanded its capacity in
1985 and 1993. However, the domestically produced wood pulp accounts for only about 20
percent of wood pulp consumed by the paper industry; therefore, the other 80 percent is
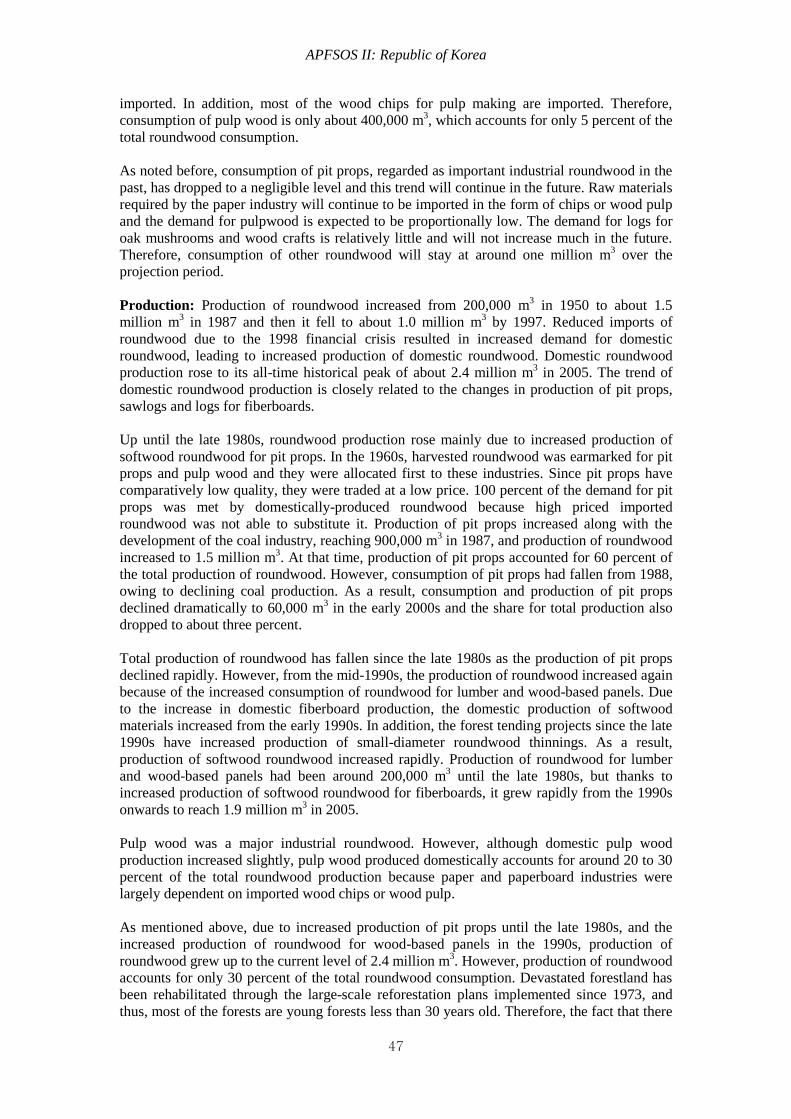
APFSOS II: Republic of Korea
47
imported. In addition, most of the wood chips for pulp making are imported. Therefore,
consumption of pulp wood is only about 400,000 m3, which accounts for only 5 percent of the
total roundwood consumption.
As noted before, consumption of pit props, regarded as important industrial roundwood in the
past, has dropped to a negligible level and this trend will continue in the future. Raw materials
required by the paper industry will continue to be imported in the form of chips or wood pulp
and the demand for pulpwood is expected to be proportionally low. The demand for logs for
oak mushrooms and wood crafts is relatively little and will not increase much in the future.
Therefore, consumption of other roundwood will stay at around one million m3 over the
projection period.
Production: Production of roundwood increased from 200,000 m3 in 1950 to about 1.5
million m3 in 1987 and then it fell to about 1.0 million m
3 by 1997. Reduced imports of
roundwood due to the 1998 financial crisis resulted in increased demand for domestic
roundwood, leading to increased production of domestic roundwood. Domestic roundwood
production rose to its all-time historical peak of about 2.4 million m3 in 2005. The trend of
domestic roundwood production is closely related to the changes in production of pit props,
sawlogs and logs for fiberboards.
Up until the late 1980s, roundwood production rose mainly due to increased production of
softwood roundwood for pit props. In the 1960s, harvested roundwood was earmarked for pit
props and pulp wood and they were allocated first to these industries. Since pit props have
comparatively low quality, they were traded at a low price. 100 percent of the demand for pit
props was met by domestically-produced roundwood because high priced imported
roundwood was not able to substitute it. Production of pit props increased along with the
development of the coal industry, reaching 900,000 m3 in 1987, and production of roundwood
increased to 1.5 million m3. At that time, production of pit props accounted for 60 percent of
the total production of roundwood. However, consumption of pit props had fallen from 1988,
owing to declining coal production. As a result, consumption and production of pit props
declined dramatically to 60,000 m3 in the early 2000s and the share for total production also
dropped to about three percent.
Total production of roundwood has fallen since the late 1980s as the production of pit props
declined rapidly. However, from the mid-1990s, the production of roundwood increased again
because of the increased consumption of roundwood for lumber and wood-based panels. Due
to the increase in domestic fiberboard production, the domestic production of softwood
materials increased from the early 1990s. In addition, the forest tending projects since the late
1990s have increased production of small-diameter roundwood thinnings. As a result,
production of softwood roundwood increased rapidly. Production of roundwood for lumber
and wood-based panels had been around 200,000 m3 until the late 1980s, but thanks to
increased production of softwood roundwood for fiberboards, it grew rapidly from the 1990s
onwards to reach 1.9 million m3 in 2005.
Pulp wood was a major industrial roundwood. However, although domestic pulp wood
production increased slightly, pulp wood produced domestically accounts for around 20 to 30
percent of the total roundwood production because paper and paperboard industries were
largely dependent on imported wood chips or wood pulp.
As mentioned above, due to increased production of pit props until the late 1980s, and the
increased production of roundwood for wood-based panels in the 1990s, production of
roundwood grew up to the current level of 2.4 million m3. However, production of roundwood
accounts for only 30 percent of the total roundwood consumption. Devastated forestland has
been rehabilitated through the large-scale reforestation plans implemented since 1973, and
thus, most of the forests are young forests less than 30 years old. Therefore, the fact that there
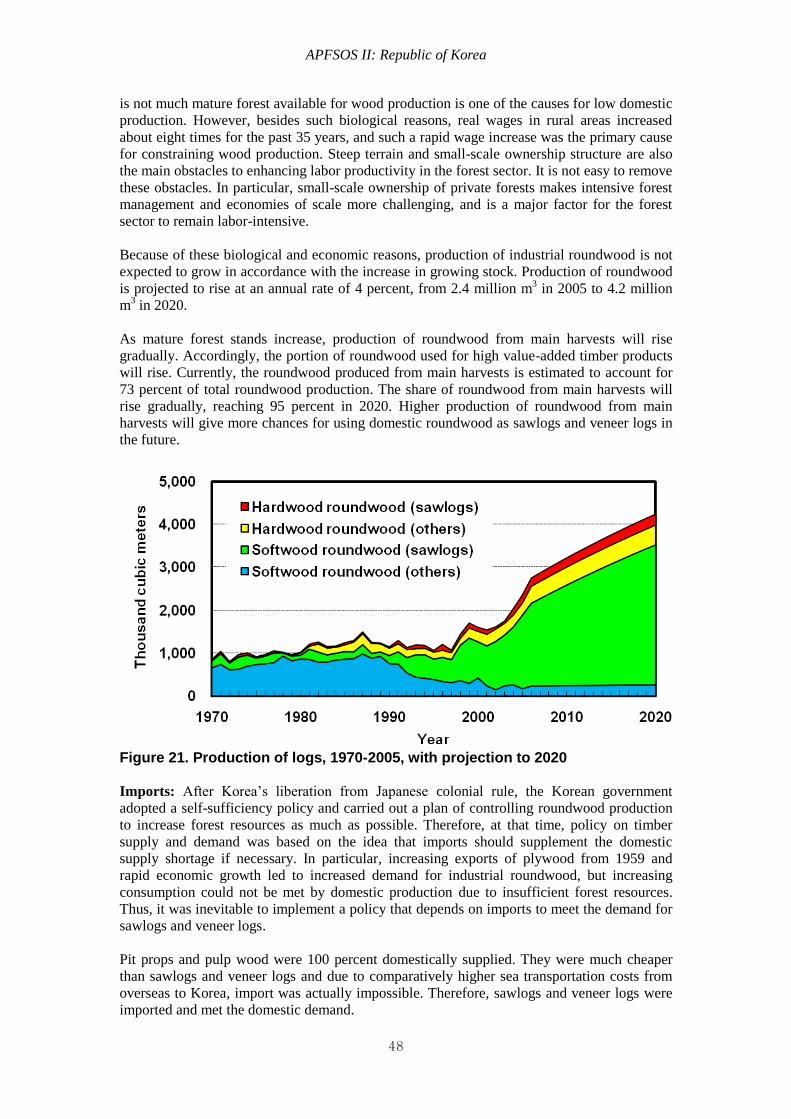
APFSOS II: Republic of Korea
48
is not much mature forest available for wood production is one of the causes for low domestic
production. However, besides such biological reasons, real wages in rural areas increased
about eight times for the past 35 years, and such a rapid wage increase was the primary cause
for constraining wood production. Steep terrain and small-scale ownership structure are also
the main obstacles to enhancing labor productivity in the forest sector. It is not easy to remove
these obstacles. In particular, small-scale ownership of private forests makes intensive forest
management and economies of scale more challenging, and is a major factor for the forest
sector to remain labor-intensive.
Because of these biological and economic reasons, production of industrial roundwood is not
expected to grow in accordance with the increase in growing stock. Production of roundwood
is projected to rise at an annual rate of 4 percent, from 2.4 million m3 in 2005 to 4.2 million
m3 in 2020.
As mature forest stands increase, production of roundwood from main harvests will rise
gradually. Accordingly, the portion of roundwood used for high value-added timber products
will rise. Currently, the roundwood produced from main harvests is estimated to account for
73 percent of total roundwood production. The share of roundwood from main harvests will
rise gradually, reaching 95 percent in 2020. Higher production of roundwood from main
harvests will give more chances for using domestic roundwood as sawlogs and veneer logs in
the future.
Figure 21. Production of logs, 1970-2005, with projection to 2020
Imports: After Korea’s liberation from Japanese colonial rule, the Korean government
adopted a self-sufficiency policy and carried out a plan of controlling roundwood production
to increase forest resources as much as possible. Therefore, at that time, policy on timber
supply and demand was based on the idea that imports should supplement the domestic
supply shortage if necessary. In particular, increasing exports of plywood from 1959 and
rapid economic growth led to increased demand for industrial roundwood, but increasing
consumption could not be met by domestic production due to insufficient forest resources.
Thus, it was inevitable to implement a policy that depends on imports to meet the demand for
sawlogs and veneer logs.
Pit props and pulp wood were 100 percent domestically supplied. They were much cheaper
than sawlogs and veneer logs and due to comparatively higher sea transportation costs from
overseas to Korea, import was actually impossible. Therefore, sawlogs and veneer logs were
imported and met the domestic demand.
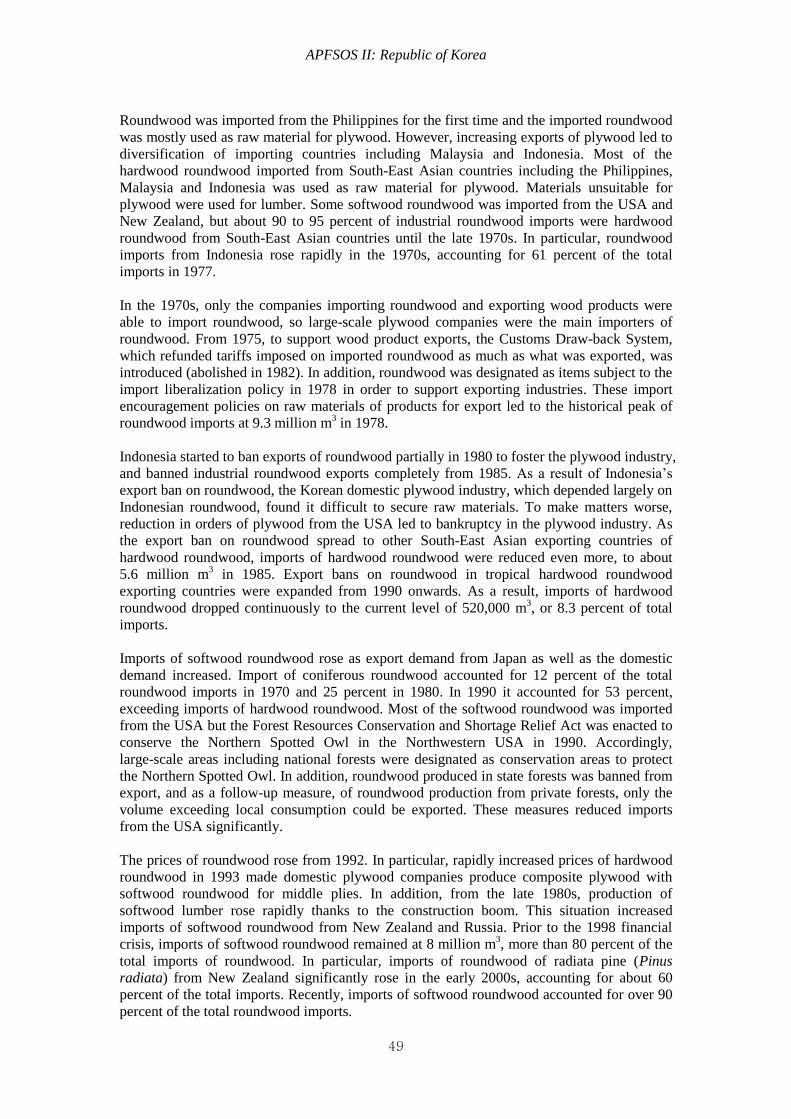
APFSOS II: Republic of Korea
49
Roundwood was imported from the Philippines for the first time and the imported roundwood
was mostly used as raw material for plywood. However, increasing exports of plywood led to
diversification of importing countries including Malaysia and Indonesia. Most of the
hardwood roundwood imported from South-East Asian countries including the Philippines,
Malaysia and Indonesia was used as raw material for plywood. Materials unsuitable for
plywood were used for lumber. Some softwood roundwood was imported from the USA and
New Zealand, but about 90 to 95 percent of industrial roundwood imports were hardwood
roundwood from South-East Asian countries until the late 1970s. In particular, roundwood
imports from Indonesia rose rapidly in the 1970s, accounting for 61 percent of the total
imports in 1977.
In the 1970s, only the companies importing roundwood and exporting wood products were
able to import roundwood, so large-scale plywood companies were the main importers of
roundwood. From 1975, to support wood product exports, the Customs Draw-back System,
which refunded tariffs imposed on imported roundwood as much as what was exported, was
introduced (abolished in 1982). In addition, roundwood was designated as items subject to the
import liberalization policy in 1978 in order to support exporting industries. These import
encouragement policies on raw materials of products for export led to the historical peak of
roundwood imports at 9.3 million m3 in 1978.
Indonesia started to ban exports of roundwood partially in 1980 to foster the plywood industry,
and banned industrial roundwood exports completely from 1985. As a result of Indonesia’s
export ban on roundwood, the Korean domestic plywood industry, which depended largely on
Indonesian roundwood, found it difficult to secure raw materials. To make matters worse,
reduction in orders of plywood from the USA led to bankruptcy in the plywood industry. As
the export ban on roundwood spread to other South-East Asian exporting countries of
hardwood roundwood, imports of hardwood roundwood were reduced even more, to about
5.6 million m3 in 1985. Export bans on roundwood in tropical hardwood roundwood
exporting countries were expanded from 1990 onwards. As a result, imports of hardwood
roundwood dropped continuously to the current level of 520,000 m3, or 8.3 percent of total
imports.
Imports of softwood roundwood rose as export demand from Japan as well as the domestic
demand increased. Import of coniferous roundwood accounted for 12 percent of the total
roundwood imports in 1970 and 25 percent in 1980. In 1990 it accounted for 53 percent,
exceeding imports of hardwood roundwood. Most of the softwood roundwood was imported
from the USA but the Forest Resources Conservation and Shortage Relief Act was enacted to
conserve the Northern Spotted Owl in the Northwestern USA in 1990. Accordingly,
large-scale areas including national forests were designated as conservation areas to protect
the Northern Spotted Owl. In addition, roundwood produced in state forests was banned from
export, and as a follow-up measure, of roundwood production from private forests, only the
volume exceeding local consumption could be exported. These measures reduced imports
from the USA significantly.
The prices of roundwood rose from 1992. In particular, rapidly increased prices of hardwood
roundwood in 1993 made domestic plywood companies produce composite plywood with
softwood roundwood for middle plies. In addition, from the late 1980s, production of
softwood lumber rose rapidly thanks to the construction boom. This situation increased
imports of softwood roundwood from New Zealand and Russia. Prior to the 1998 financial
crisis, imports of softwood roundwood remained at 8 million m3, more than 80 percent of the
total imports of roundwood. In particular, imports of roundwood of radiata pine (Pinus
radiata) from New Zealand significantly rose in the early 2000s, accounting for about 60
percent of the total imports. Recently, imports of softwood roundwood accounted for over 90
percent of the total roundwood imports.

APFSOS II: Republic of Korea
50
During the 1998 financial crisis, devaluation of the Korean currency reduced imports of
roundwood to 4.4 million m3. But a stable foreign exchange rate and recovered economic
growth increased imports to 7.7 million m3 in 2002. However, from 2003, increasing sea
transportation costs, lowered profitability in wood production in New Zealand due to
appreciation of the New Zealand dollar, and recession of the domestic construction sector
reduced roundwood imports to 6.3 million m3 in 2005.
Roundwood imports will continue to decline but import of hardwood roundwood is expected
to remain at the current level of 520,000 m3. Imports of softwood roundwood are projected to
decline to 5,091,000 m3 in 2020. The expected decreases in imports of roundwood are due to
increasing imports of processed timber products, increases in roundwood imports from China
and India, and imposition of high export tax on roundwood for exports of value-added
products in Russia.
Figure 22. Imports of logs, 1970-2005, with projection to 2020
Consumption, production and trade of timber products - roundwood equivalent
Table 18 summarizes consumption, production, and imports of primary timber products and
industrial roundwood in terms of roundwood equivalents in cubic metres. The total
roundwood equivalent for consumption of timber products amounted to 22.9 million m3 in
2005. Pulp wood consumption accounted for 46 percent of the total roundwood equivalent for
consumption, followed by lumber, plywood and wood-based panels. Consumption is
projected to rise by one percent every year for the next 15 years, reaching 26.5 million m3 in
2020, an increase of 3.6 million m3 from the current level. Over the projection period until
2020, the share of each product for the total wood consumption will change little, but as the
share of pulp wood drops, the share of other products will rise. Per capita roundwood
equivalent for timber product consumption is expected to rise slightly from 0.47 m3 in 2005 to
0.54 m3 in 2020.
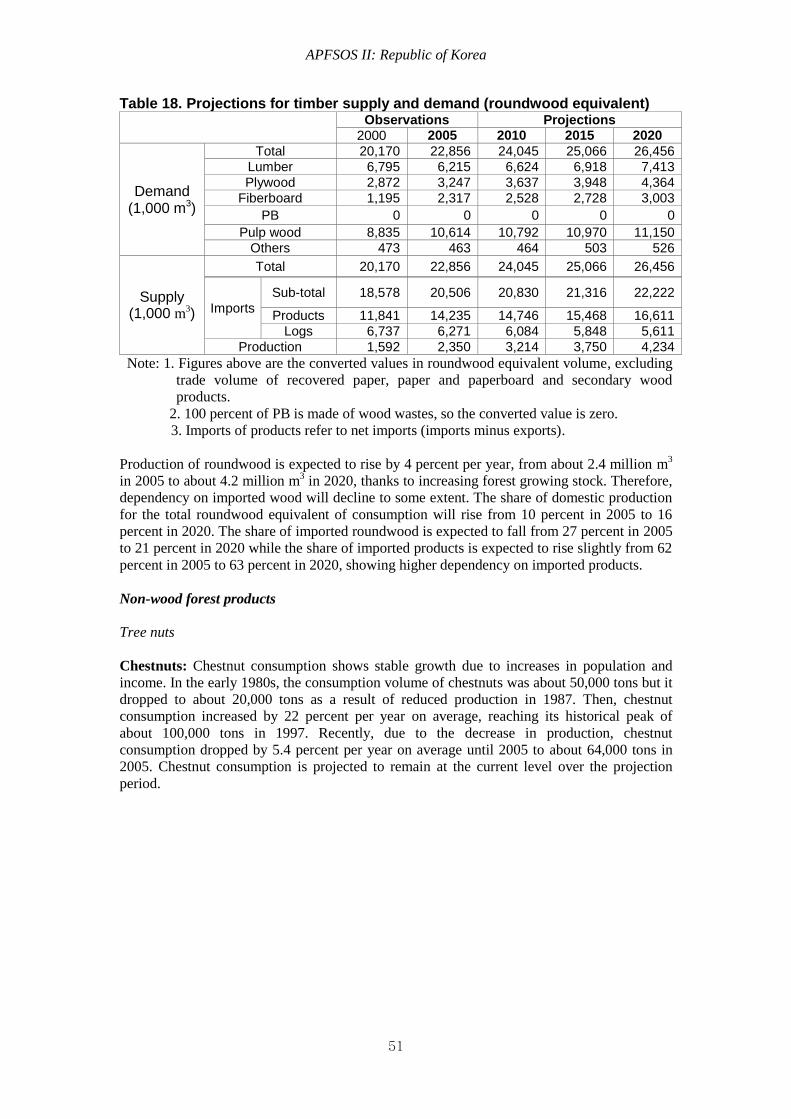
APFSOS II: Republic of Korea
51
Table 18. Projections for timber supply and demand (roundwood equivalent)
Observations Projections
2000 2005 2010 2015 2020
Demand (1,000 m3)
Total 20,170 22,856 24,045 25,066 26,456
Lumber 6,795 6,215 6,624 6,918 7,413
Plywood 2,872 3,247 3,637 3,948 4,364
Fiberboard 1,195 2,317 2,528 2,728 3,003
PB 0 0 0 0 0
Pulp wood 8,835 10,614 10,792 10,970 11,150
Others 473 463 464 503 526
Supply (1,000 m3)
Total 20,170 22,856 24,045 25,066 26,456
Imports
Sub-total 18,578 20,506 20,830 21,316 22,222
Products 11,841 14,235 14,746 15,468 16,611
Logs 6,737 6,271 6,084 5,848 5,611
Production 1,592 2,350 3,214 3,750 4,234
Note: 1. Figures above are the converted values in roundwood equivalent volume, excluding
trade volume of recovered paper, paper and paperboard and secondary wood
products.
2. 100 percent of PB is made of wood wastes, so the converted value is zero.
3. Imports of products refer to net imports (imports minus exports).
Production of roundwood is expected to rise by 4 percent per year, from about 2.4 million m3
in 2005 to about 4.2 million m3 in 2020, thanks to increasing forest growing stock. Therefore,
dependency on imported wood will decline to some extent. The share of domestic production
for the total roundwood equivalent of consumption will rise from 10 percent in 2005 to 16
percent in 2020. The share of imported roundwood is expected to fall from 27 percent in 2005
to 21 percent in 2020 while the share of imported products is expected to rise slightly from 62
percent in 2005 to 63 percent in 2020, showing higher dependency on imported products.
Non-wood forest products
Tree nuts
Chestnuts: Chestnut consumption shows stable growth due to increases in population and
income. In the early 1980s, the consumption volume of chestnuts was about 50,000 tons but it
dropped to about 20,000 tons as a result of reduced production in 1987. Then, chestnut
consumption increased by 22 percent per year on average, reaching its historical peak of
about 100,000 tons in 1997. Recently, due to the decrease in production, chestnut
consumption dropped by 5.4 percent per year on average until 2005 to about 64,000 tons in
2005. Chestnut consumption is projected to remain at the current level over the projection
period.

APFSOS II: Republic of Korea
52
Figure 23. Production, consumption and trade of chestnuts, 1980-2005, with
projection to 2020 (fresh chestnut equivalent)
Chestnut forests have been established on agricultural lands in order to earn a higher income
since the late 1960s. As the cultivated land increased, production of chestnuts grew to
130,000 tons in 1997. However, due to aging of chestnut forests, reduction in the cultivated
land area after 1990, and a labor shortage in cultivation and harvest, production declined
rapidly to 76,447 tons in 2005. Due to the aging of chestnut forests planted in the 1960s and
1970s, production in the Southern provinces is declining and the main production areas are
shifting towards the Central provinces. Production of chestnuts is also expected to remain at
the current level of 76,000 tons by 2020.
Chestnuts are processed and exported in various forms, with about 30 percent of the
production exported. Chestnut exports have continued to rise from 14,572 tons in 1970 to the
peak of 39,793 tons in 1988. Since then, exports have dropped steadily to about 20,000 tons in
2005.
0
10
20
30
40
50
1980 1985 1990 1995 2000 2005Year
Th
ou
san
d m
etr
ic t
on
s
Fresh chestnuts Peeled chestnutsFrozen chestnuts Processed chestnuts
Figure 24. Exports of chestnuts by product, 1985-2005 (fresh chestnut
equivalent)
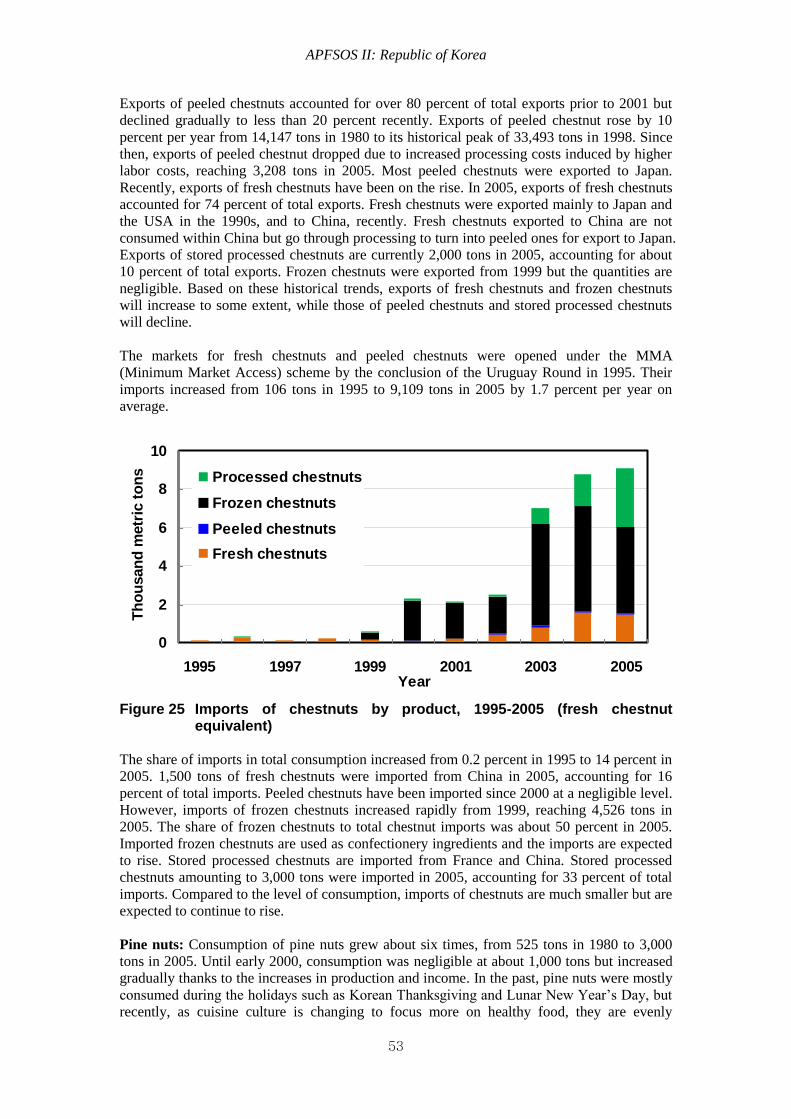
APFSOS II: Republic of Korea
53
Exports of peeled chestnuts accounted for over 80 percent of total exports prior to 2001 but
declined gradually to less than 20 percent recently. Exports of peeled chestnut rose by 10
percent per year from 14,147 tons in 1980 to its historical peak of 33,493 tons in 1998. Since
then, exports of peeled chestnut dropped due to increased processing costs induced by higher
labor costs, reaching 3,208 tons in 2005. Most peeled chestnuts were exported to Japan.
Recently, exports of fresh chestnuts have been on the rise. In 2005, exports of fresh chestnuts
accounted for 74 percent of total exports. Fresh chestnuts were exported mainly to Japan and
the USA in the 1990s, and to China, recently. Fresh chestnuts exported to China are not
consumed within China but go through processing to turn into peeled ones for export to Japan.
Exports of stored processed chestnuts are currently 2,000 tons in 2005, accounting for about
10 percent of total exports. Frozen chestnuts were exported from 1999 but the quantities are
negligible. Based on these historical trends, exports of fresh chestnuts and frozen chestnuts
will increase to some extent, while those of peeled chestnuts and stored processed chestnuts
will decline.
The markets for fresh chestnuts and peeled chestnuts were opened under the MMA
(Minimum Market Access) scheme by the conclusion of the Uruguay Round in 1995. Their
imports increased from 106 tons in 1995 to 9,109 tons in 2005 by 1.7 percent per year on
average.
0
2
4
6
8
10
1995 1997 1999 2001 2003 2005Year
Th
ou
san
d m
etr
ic t
on
s Processed chestnuts
Frozen chestnuts
Peeled chestnuts
Fresh chestnuts
Figure 25 Imports of chestnuts by product, 1995-2005 (fresh chestnut
equivalent)
The share of imports in total consumption increased from 0.2 percent in 1995 to 14 percent in
2005. 1,500 tons of fresh chestnuts were imported from China in 2005, accounting for 16
percent of total imports. Peeled chestnuts have been imported since 2000 at a negligible level.
However, imports of frozen chestnuts increased rapidly from 1999, reaching 4,526 tons in
2005. The share of frozen chestnuts to total chestnut imports was about 50 percent in 2005.
Imported frozen chestnuts are used as confectionery ingredients and the imports are expected
to rise. Stored processed chestnuts are imported from France and China. Stored processed
chestnuts amounting to 3,000 tons were imported in 2005, accounting for 33 percent of total
imports. Compared to the level of consumption, imports of chestnuts are much smaller but are
expected to continue to rise.
Pine nuts: Consumption of pine nuts grew about six times, from 525 tons in 1980 to 3,000
tons in 2005. Until early 2000, consumption was negligible at about 1,000 tons but increased
gradually thanks to the increases in production and income. In the past, pine nuts were mostly
consumed during the holidays such as Korean Thanksgiving and Lunar New Year’s Day, but
recently, as cuisine culture is changing to focus more on healthy food, they are evenly

APFSOS II: Republic of Korea
54
consumed throughout the year. Consumption of pine nuts will rise gradually to 3,689 tons in
2020, a 23 percent increase from the level of consumption in 2005.
Plantations of Korean pine were established from the 1960s and the plantation area annually
established reached the peak of 19,472 ha in 1974. However, in the 2000s, plantation
establishment dropped to 9,000 ha per year. As the plantation area grew, production of pine
nuts increased. The three-year cycle of good and bad harvests of pine nuts continued and
production was 2,680 tons in 2005, about double the level of the previous good harvest.
Production jumped considerably after 2002 because pine nuts from Korean pine plantations
established in national forests were supplied in the local market. Since pine nuts are harvested
from trees aged 15 years or older, production of pine nuts does not fall for the time being,
even though annual plantation areas decline. In 2020, production of pine nuts will reach 2,758
tons, a slight increase from the level in 2005.
A negligible amount of pine nuts is exported on an irregular basis. Like chestnuts, the market
for pine nuts was opened under the MMA scheme. Imports grew from 36 tons in 1995 to 320
tons in 2005, a 12 percent increase on average per year. Imports of pine nuts accounted for
about 11 percent of the total consumption in 2005. Until the early 2000s, pine nuts were
imported from China in the form of shelled pine nuts but recently, a substantial amount of
frozen pine nuts was imported. Frozen pine nuts were imported in 2002 for the first time and
238 tons were imported in 2005, accounting for 74 percent of total pine nut imports. This is
because imports of frozen pine nuts are free to trade but import procedures of shelled and
unshelled pine nuts are relatively complex. Consumption of pine nuts will rise rapidly
compared to production, so their imports are expected to rise to meet increasing consumption.
Figure 26. Production, consumption and trade of pine nuts, 1980-2005, with
projection to 2020 (peeled pine nut equivalent)
Jujubes: As improved jujubes were widely cultivated from the mid-1980s, their consumption
and production rose rapidly. Consumption of jujubes increased from 641 tons in 1980 to the
peak of 14,000 tons in 1996. However, due to reduced production, consumption remained
around 9,000 tons from 1998 to 2002, and recently fell slightly to 8,600 tons. Jujube
consumption is expected to be at 9,202 tons in 2020, a 4 percent increase from the level of
2005, due to the population growth and income increase. Production will increase gradually
along with consumption, reaching 8,583 tons in 2020.
Jujube exports are negligible. Like chestnuts and pine nuts, the jujube market was also opened
in 1995. 409 tons of jujubes, about 5 percent of consumption, were imported in 2005. Jujubes
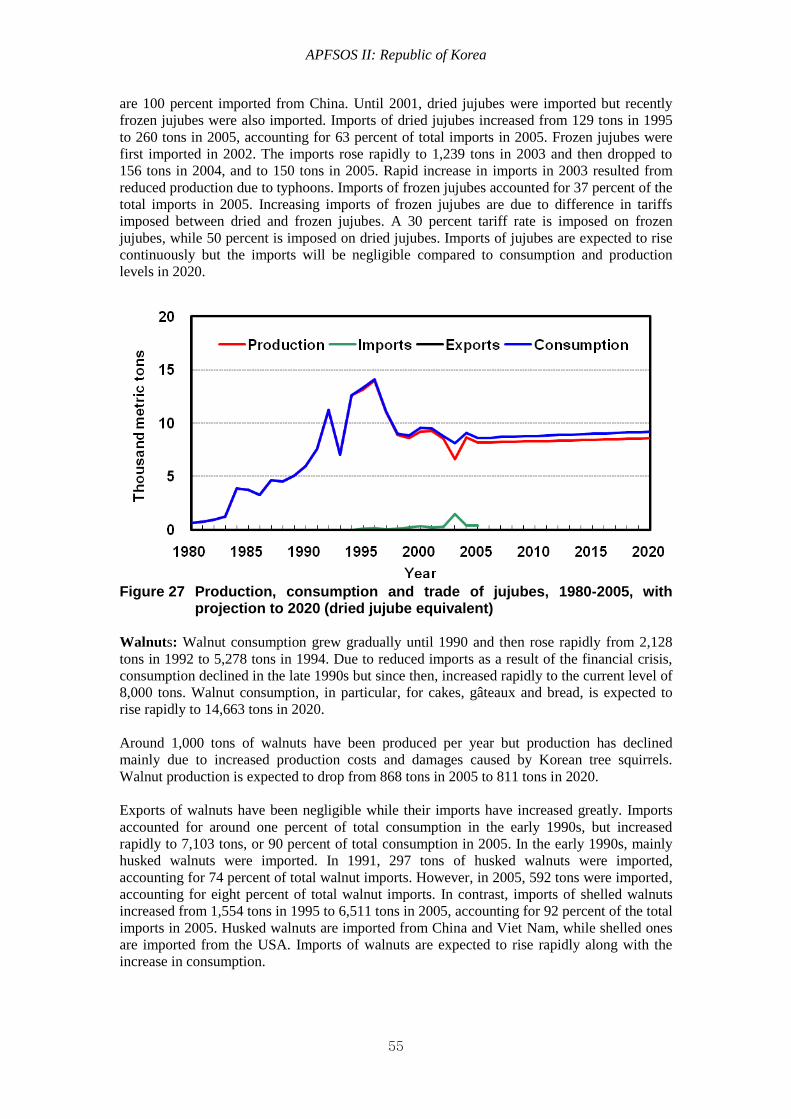
APFSOS II: Republic of Korea
55
are 100 percent imported from China. Until 2001, dried jujubes were imported but recently
frozen jujubes were also imported. Imports of dried jujubes increased from 129 tons in 1995
to 260 tons in 2005, accounting for 63 percent of total imports in 2005. Frozen jujubes were
first imported in 2002. The imports rose rapidly to 1,239 tons in 2003 and then dropped to
156 tons in 2004, and to 150 tons in 2005. Rapid increase in imports in 2003 resulted from
reduced production due to typhoons. Imports of frozen jujubes accounted for 37 percent of the
total imports in 2005. Increasing imports of frozen jujubes are due to difference in tariffs
imposed between dried and frozen jujubes. A 30 percent tariff rate is imposed on frozen
jujubes, while 50 percent is imposed on dried jujubes. Imports of jujubes are expected to rise
continuously but the imports will be negligible compared to consumption and production
levels in 2020.
Figure 27 Production, consumption and trade of jujubes, 1980-2005, with
projection to 2020 (dried jujube equivalent)
Walnuts: Walnut consumption grew gradually until 1990 and then rose rapidly from 2,128
tons in 1992 to 5,278 tons in 1994. Due to reduced imports as a result of the financial crisis,
consumption declined in the late 1990s but since then, increased rapidly to the current level of
8,000 tons. Walnut consumption, in particular, for cakes, gâteaux and bread, is expected to
rise rapidly to 14,663 tons in 2020.
Around 1,000 tons of walnuts have been produced per year but production has declined
mainly due to increased production costs and damages caused by Korean tree squirrels.
Walnut production is expected to drop from 868 tons in 2005 to 811 tons in 2020.
Exports of walnuts have been negligible while their imports have increased greatly. Imports
accounted for around one percent of total consumption in the early 1990s, but increased
rapidly to 7,103 tons, or 90 percent of total consumption in 2005. In the early 1990s, mainly
husked walnuts were imported. In 1991, 297 tons of husked walnuts were imported,
accounting for 74 percent of total walnut imports. However, in 2005, 592 tons were imported,
accounting for eight percent of total walnut imports. In contrast, imports of shelled walnuts
increased from 1,554 tons in 1995 to 6,511 tons in 2005, accounting for 92 percent of the total
imports in 2005. Husked walnuts are imported from China and Viet Nam, while shelled ones
are imported from the USA. Imports of walnuts are expected to rise rapidly along with the
increase in consumption.
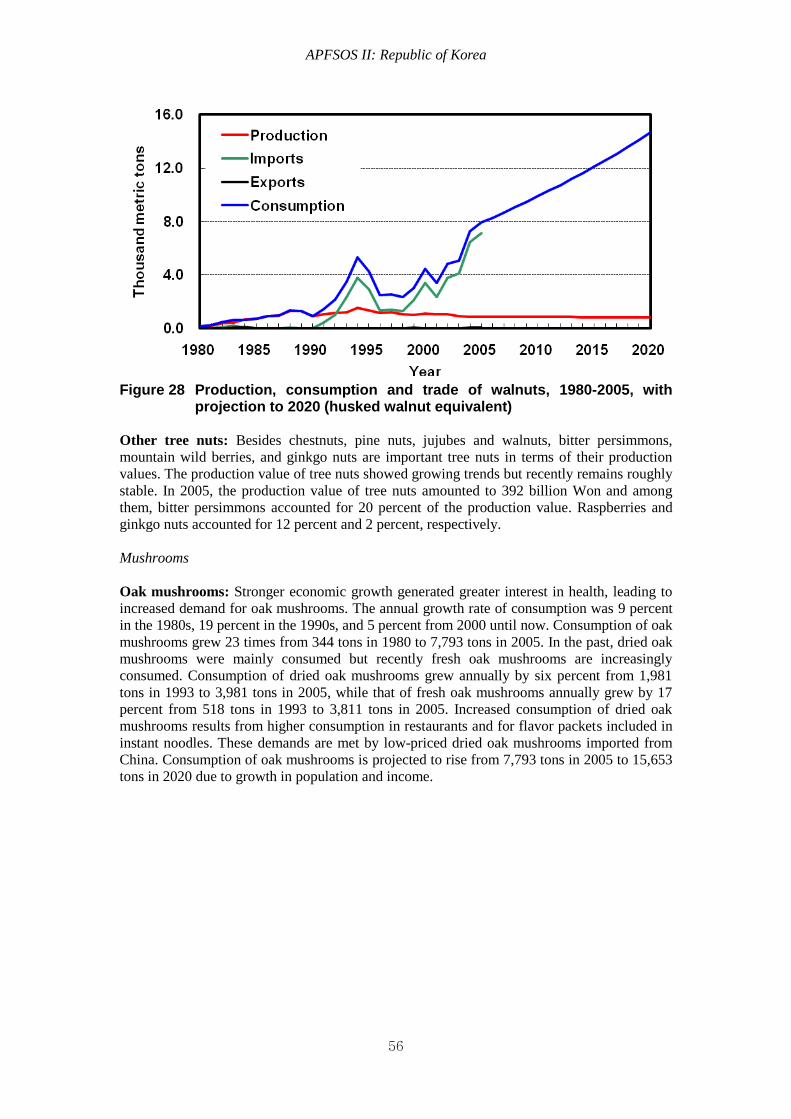
APFSOS II: Republic of Korea
56
Figure 28 Production, consumption and trade of walnuts, 1980-2005, with
projection to 2020 (husked walnut equivalent)
Other tree nuts: Besides chestnuts, pine nuts, jujubes and walnuts, bitter persimmons,
mountain wild berries, and ginkgo nuts are important tree nuts in terms of their production
values. The production value of tree nuts showed growing trends but recently remains roughly
stable. In 2005, the production value of tree nuts amounted to 392 billion Won and among
them, bitter persimmons accounted for 20 percent of the production value. Raspberries and
ginkgo nuts accounted for 12 percent and 2 percent, respectively.
Mushrooms
Oak mushrooms: Stronger economic growth generated greater interest in health, leading to
increased demand for oak mushrooms. The annual growth rate of consumption was 9 percent
in the 1980s, 19 percent in the 1990s, and 5 percent from 2000 until now. Consumption of oak
mushrooms grew 23 times from 344 tons in 1980 to 7,793 tons in 2005. In the past, dried oak
mushrooms were mainly consumed but recently fresh oak mushrooms are increasingly
consumed. Consumption of dried oak mushrooms grew annually by six percent from 1,981
tons in 1993 to 3,981 tons in 2005, while that of fresh oak mushrooms annually grew by 17
percent from 518 tons in 1993 to 3,811 tons in 2005. Increased consumption of dried oak
mushrooms results from higher consumption in restaurants and for flavor packets included in
instant noodles. These demands are met by low-priced dried oak mushrooms imported from
China. Consumption of oak mushrooms is projected to rise from 7,793 tons in 2005 to 15,653
tons in 2020 due to growth in population and income.
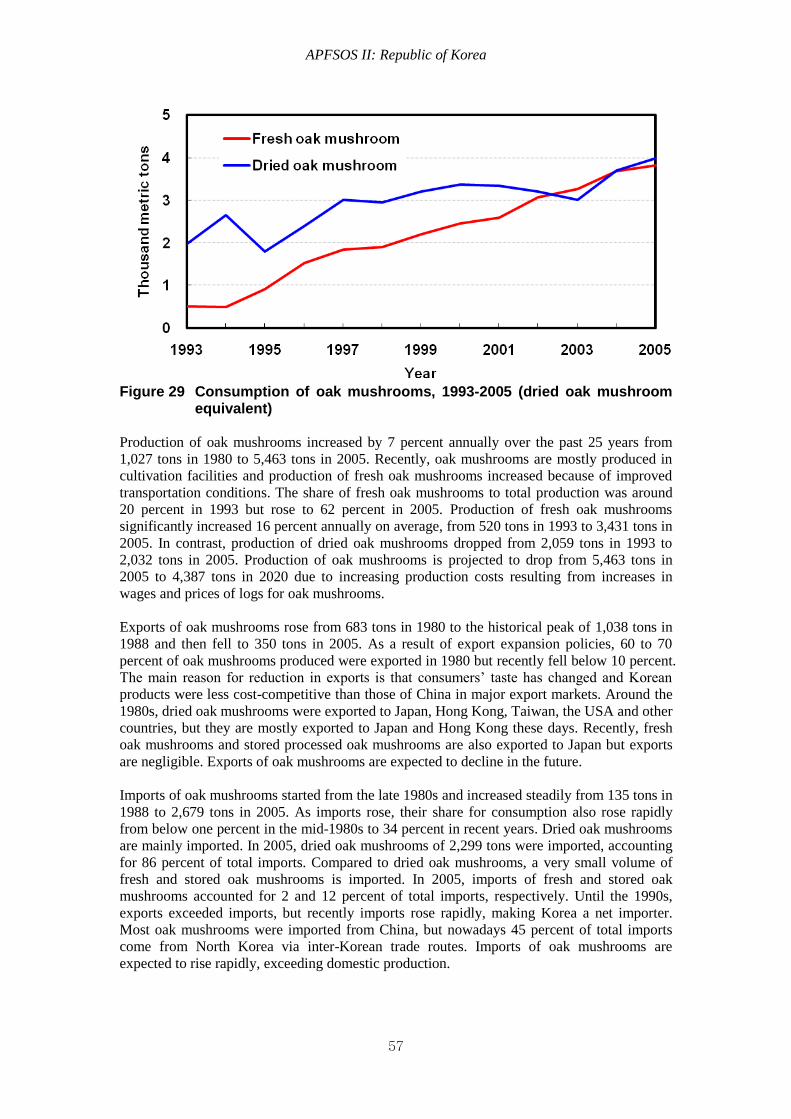
APFSOS II: Republic of Korea
57
Figure 29 Consumption of oak mushrooms, 1993-2005 (dried oak mushroom
equivalent)
Production of oak mushrooms increased by 7 percent annually over the past 25 years from
1,027 tons in 1980 to 5,463 tons in 2005. Recently, oak mushrooms are mostly produced in
cultivation facilities and production of fresh oak mushrooms increased because of improved
transportation conditions. The share of fresh oak mushrooms to total production was around
20 percent in 1993 but rose to 62 percent in 2005. Production of fresh oak mushrooms
significantly increased 16 percent annually on average, from 520 tons in 1993 to 3,431 tons in
2005. In contrast, production of dried oak mushrooms dropped from 2,059 tons in 1993 to
2,032 tons in 2005. Production of oak mushrooms is projected to drop from 5,463 tons in
2005 to 4,387 tons in 2020 due to increasing production costs resulting from increases in
wages and prices of logs for oak mushrooms.
Exports of oak mushrooms rose from 683 tons in 1980 to the historical peak of 1,038 tons in
1988 and then fell to 350 tons in 2005. As a result of export expansion policies, 60 to 70
percent of oak mushrooms produced were exported in 1980 but recently fell below 10 percent.
The main reason for reduction in exports is that consumers’ taste has changed and Korean
products were less cost-competitive than those of China in major export markets. Around the
1980s, dried oak mushrooms were exported to Japan, Hong Kong, Taiwan, the USA and other
countries, but they are mostly exported to Japan and Hong Kong these days. Recently, fresh
oak mushrooms and stored processed oak mushrooms are also exported to Japan but exports
are negligible. Exports of oak mushrooms are expected to decline in the future.
Imports of oak mushrooms started from the late 1980s and increased steadily from 135 tons in
1988 to 2,679 tons in 2005. As imports rose, their share for consumption also rose rapidly
from below one percent in the mid-1980s to 34 percent in recent years. Dried oak mushrooms
are mainly imported. In 2005, dried oak mushrooms of 2,299 tons were imported, accounting
for 86 percent of total imports. Compared to dried oak mushrooms, a very small volume of
fresh and stored oak mushrooms is imported. In 2005, imports of fresh and stored oak
mushrooms accounted for 2 and 12 percent of total imports, respectively. Until the 1990s,
exports exceeded imports, but recently imports rose rapidly, making Korea a net importer.
Most oak mushrooms were imported from China, but nowadays 45 percent of total imports
come from North Korea via inter-Korean trade routes. Imports of oak mushrooms are
expected to rise rapidly, exceeding domestic production.
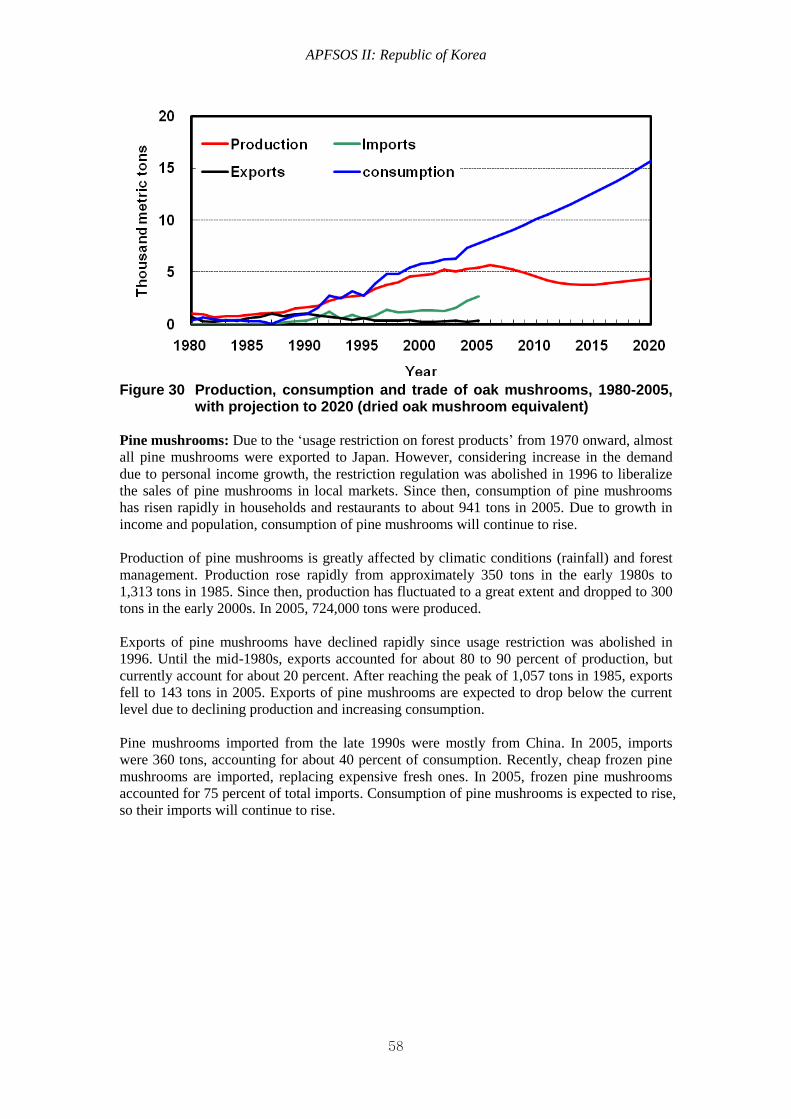
APFSOS II: Republic of Korea
58
Figure 30 Production, consumption and trade of oak mushrooms, 1980-2005,
with projection to 2020 (dried oak mushroom equivalent)
Pine mushrooms: Due to the ‘usage restriction on forest products’ from 1970 onward, almost
all pine mushrooms were exported to Japan. However, considering increase in the demand
due to personal income growth, the restriction regulation was abolished in 1996 to liberalize
the sales of pine mushrooms in local markets. Since then, consumption of pine mushrooms
has risen rapidly in households and restaurants to about 941 tons in 2005. Due to growth in
income and population, consumption of pine mushrooms will continue to rise.
Production of pine mushrooms is greatly affected by climatic conditions (rainfall) and forest
management. Production rose rapidly from approximately 350 tons in the early 1980s to
1,313 tons in 1985. Since then, production has fluctuated to a great extent and dropped to 300
tons in the early 2000s. In 2005, 724,000 tons were produced.
Exports of pine mushrooms have declined rapidly since usage restriction was abolished in
1996. Until the mid-1980s, exports accounted for about 80 to 90 percent of production, but
currently account for about 20 percent. After reaching the peak of 1,057 tons in 1985, exports
fell to 143 tons in 2005. Exports of pine mushrooms are expected to drop below the current
level due to declining production and increasing consumption.
Pine mushrooms imported from the late 1990s were mostly from China. In 2005, imports
were 360 tons, accounting for about 40 percent of consumption. Recently, cheap frozen pine
mushrooms are imported, replacing expensive fresh ones. In 2005, frozen pine mushrooms
accounted for 75 percent of total imports. Consumption of pine mushrooms is expected to rise,
so their imports will continue to rise.
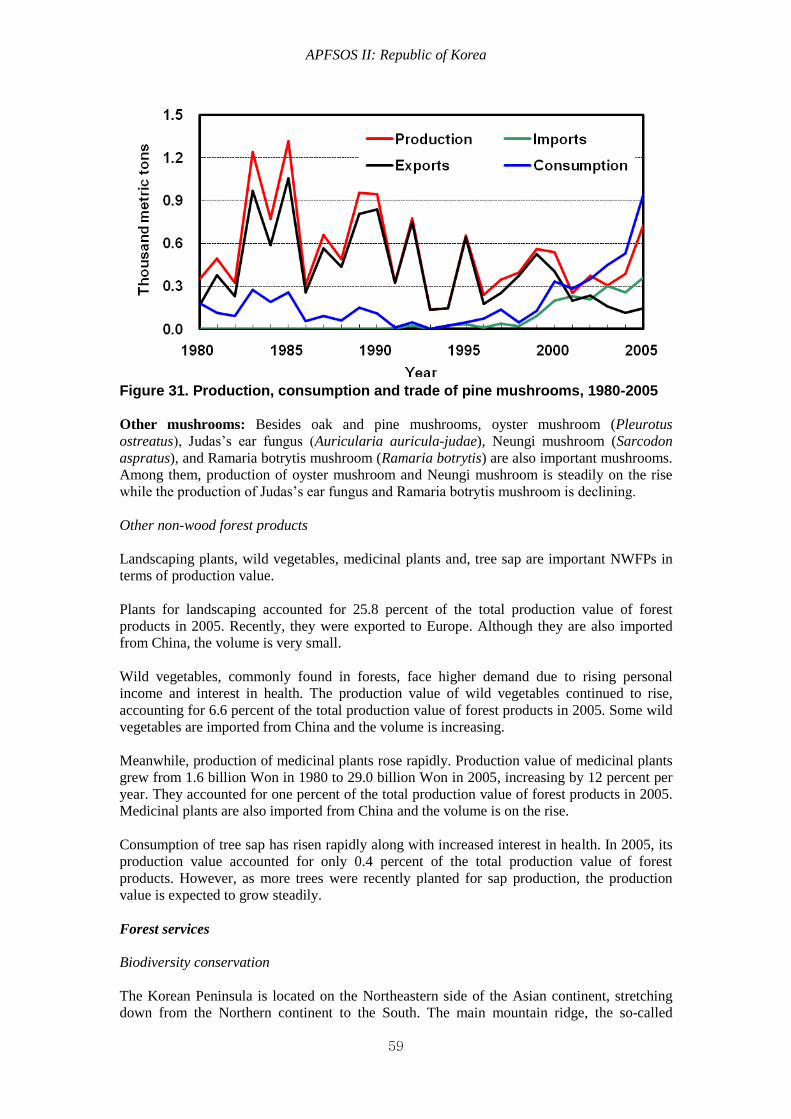
APFSOS II: Republic of Korea
59
Figure 31. Production, consumption and trade of pine mushrooms, 1980-2005
Other mushrooms: Besides oak and pine mushrooms, oyster mushroom (Pleurotus
ostreatus), Judas’s ear fungus (Auricularia auricula-judae), Neungi mushroom (Sarcodon
aspratus), and Ramaria botrytis mushroom (Ramaria botrytis) are also important mushrooms.
Among them, production of oyster mushroom and Neungi mushroom is steadily on the rise
while the production of Judas’s ear fungus and Ramaria botrytis mushroom is declining.
Other non-wood forest products
Landscaping plants, wild vegetables, medicinal plants and, tree sap are important NWFPs in
terms of production value.
Plants for landscaping accounted for 25.8 percent of the total production value of forest
products in 2005. Recently, they were exported to Europe. Although they are also imported
from China, the volume is very small.
Wild vegetables, commonly found in forests, face higher demand due to rising personal
income and interest in health. The production value of wild vegetables continued to rise,
accounting for 6.6 percent of the total production value of forest products in 2005. Some wild
vegetables are imported from China and the volume is increasing.
Meanwhile, production of medicinal plants rose rapidly. Production value of medicinal plants
grew from 1.6 billion Won in 1980 to 29.0 billion Won in 2005, increasing by 12 percent per
year. They accounted for one percent of the total production value of forest products in 2005.
Medicinal plants are also imported from China and the volume is on the rise.
Consumption of tree sap has risen rapidly along with increased interest in health. In 2005, its
production value accounted for only 0.4 percent of the total production value of forest
products. However, as more trees were recently planted for sap production, the production
value is expected to grow steadily.
Forest services
Biodiversity conservation
The Korean Peninsula is located on the Northeastern side of the Asian continent, stretching
down from the Northern continent to the South. The main mountain ridge, the so-called
APFSOS II: Republic of Korea
60
Baekdudaegan Mountains, also stretches from North to South with mountain ridges branched
to it. Korea shows wide variations in temperature and precipitation. Even though the
population density is very high, about 64 percent of the national territory is covered with
forests due to the characteristic complex topography. Therefore, forest ecosystems play
significant roles as a source of biodiversity and refuges for wildlife.
The total number of species recorded in Korea is 29,916: 1,528 vertebrates, 16,589
invertebrates, 4,662 higher plants, 3,609 lower plants, 1,625 fungi, 736 protists, and 1,167
prokaryotes (Ministry of Environment, 2007). As for higher plants, which are comparatively
well surveyed, species diversity in Korea is high compared to other temperate forests of
similar sizes.
Up until the mid-20th century, rapidly increased population led to deforestation and severe
hunting. Consequently, the growing stock was only 10 to 3 m3/ha, representing the status of
open forest. In addition, severe soil erosion took place. Since then, top predators such as tigers
(Panthera tigris altaica Temminck), Amur leopards (Panthera pardus orientalis Schlegel),
and wolves (Canis lupus coreanus Abe) have become extinct.
However, the growing stock had reached approximately 79 m3/ha in 2005 due to successful
forest restoration and rehabilitation since the 1970s, poverty reduction and fuel substitution of
fossil fuels for firewood. Throughout this time period, the dominant tree species in forests has
changed. As a pioneer species, single pine species Pinus densiflora S. and Z. covered over 60
percent of forest area in the mid-20th century. Afterwards, due to natural succession and
outbreaks of pests and diseases including the pine caterpillar (Dendrolimus spectabilis Butler),
pine gall-midge (Thecodiplosis japonensis Uchida and Inouye), and black pine bast scale
(Matsucoccus thunbergianae Miller and Park), its coverage declined to 25 percent in the late
20th century, yielding its place to oak forests.
With rehabilitation and restoration, forest biodiversity is being recovered. According to the
annual reports on “Wildlife Population Census in Korea” (National Institute of Environmental
Research, 2005), the population of the Japanese pygmy woodpecker (Dendrocopos kizuki
Temminck), pale thrush (Turdus pallidus Gmelin), brown-eared bulbul (Hypsipetes amaurotis
Temminck), great tit (Parus major L.) and other indicator species has increased. As for game
animals, the number of species dependent on water ecosystems or croplands such as the
mallard (Anas platyrhynchos L.), green-winged teal (Anas crecca L.), tree sparrow (Passer
montanus L.), and ring-necked pheasant (Phasianus colchicus L.) has decreased whereas the
Korean water deer (Hydropotes inermis Swinhoe) and Korean wild boar (Sus scrofa L.) have
increased. A favorable environment for biodiversity recovery has been created thanks to
forest restoration, enlarged Forest Protected Areas, intensified management, spread of
ecological management and economic growth, as well as public awareness in natural
conservation.
However, at the same time, through urbanization and industrialization, some forests have
been converted into agricultural land, residential areas, industrial complexes and roads,
significantly fragmenting forests. Agricultural ecosystems face the loss of biodiversity due to
broken relationships between humans and nature by using pesticides and fertilizers on farm
lands. In addition, forest fires, torrential rain showers, forest disasters, outbreaks of pests and
diseases, and occurrence of invasive species are becoming major threats to biodiversity along
with looming climatic change.
Forest Protected Area designated and managed by the government accounts for about 9
percent of total forest area. The Baekdudaegan Mountain System (BDMS) Protected Area and
the national parks account for about 90 percent of the total protected area (8.1 percent of total
forest area), followed by Forest Genetic Resources Protected Areas, Ecosystem and
Landscape Conservation Areas, Wet land Protected Areas and Natural Monuments.
APFSOS II: Republic of Korea
61
Mt. Jiri-san National Park was designated as a national park in 1967 as the first of its kind in
Korea. Since then, national parks have been designated in 20 different mountains and seas.
The total area of national parks covers about 6,579.85 km2, of which the land amounts to
3,824.57 km2. Of mountain-type national parks, Mt. Jiri-san National Park has the largest area
of about 472 km2, accounting for 12 percent of the total. The second and the third are Mt.
Seorak-san National Park and Mt. Sobaek-san National Park, covering 399 km2 and 322 km
2,
respectively. National parks within the Baekdudaegan Mountains, ranges of mountains
forming the backbone of the Korean peninsula, are comparatively large.
As the “Act on Protection of the Baekdudaegan Mountain System (BDMS)” was enacted in
December 2003, the BDMS protected area was designated in September 2005. It totals 2,634
km2, consisting of the core zones of 1,699 km
2 and buffer zones of 935 km
2. The BDMS
Protected Area is designed to connect the whole Baekdudaegan Mountain system which is
fragmented as islands of mountain-type national parks. Active conservation of biodiversity,
preventing degradation and ecological restoration on damaged forests, is underway along with
environmentally-friendly agricultural practices.
Biological hotspots, natural forest and protected forests for genetic resources are designated
and managed by the Korea Forest Service. In the initial stage, mostly Japanese yew (Taxus
cuspidata S. and Z.), and Geumgang pine (Pinus densiflora for. erecta Uyeki) populations
and virgin forests were designated. Recently, designated areas to secure ecosystem diversity
are increasing in order to protect old-growth forests as well as habitats for rare species.
Ecosystem and Landscape Conservation Areas amount to 14 sites and covered 255.60 km2 in
2006. Among them, forest areas comprise five sites, including Mt. Jiri-san, Mt. Daeam-san
and the Dong-gang River Watershed, covering 131.76 km2.
The De-militarized Zone (DMZ) between South and North Korea is a four kilometre-wide
strip. The region 10 to 20 kilometres south of the DMZ is designated as a Civilian Control
Zone (CCZ). Since 1953, these areas have been kept intact without people’s interference.
Therefore, lowland wetlands and rivers that would have been developed for cultivation or
housing land in other regions remain in their natural state in this area. The DMZ and CCZ are
serving as habitat and refuge for wild animals and plants including rare birds and insects.
Recently, active discussions and research are underway to protect the DMZ even after
reunification.
The five-year forest biodiversity basic plan (2008-2013) was formulated for effective
conservation of forest biodiversity and sustainable management. Major activities included are:
- Implementation of the ecosystem approach: spreading its concepts and practice guidelines;
- Systematic survey and monitoring of forest biodiversity;
- Effective designation, management and networking of Forest Protected Areas;
- Intensifying conservation of rare and endangered plant species and ex-situ conservation of
useful genetic resources;
- Effective control of threats to forest biodiversity including habitat destruction, natural
hazards, climate change and so forth; and
- Ecological restoration of degraded forest ecosystems.
Beside these activities, ecological forest management, recovering traditional harmonious
human-nature relationships and biodiversity conservation in non-protected areas are
encouraged to mitigate the loss of biodiversity.
Water storage capacity of forested watershed
Korea has prioritized forest management for water conservation since antiquity. For example,
kings of the Joseon Dynasty were well aware of the fact that forest management was critical
to properly control river-flows downstream until the early 19th century. The people also
APFSOS II: Republic of Korea
62
believed that upstream forests were closely linked to water resources. The “Imsu of Joseon” -
published in the early 20th century - included the example of establishing forests around rivers
to protect villages from flood damage. Another example is the “stream-bank-forest” in
Damyang, which has remained until the present day. The forest was built up along the
riversides in 1648. In addition, the relationship between forests and water resources was
addressed through the theory of geomancy. To conserve water resources, the smallest
residence unit, called “Dong,” was partitioned along the boundaries of catchments. Residents
dwelling in a “Dong” used the same water resources and established forests together along the
ridges from village entrances to upstream areas.
Korean forests grew densely until the late 19th century. The forests, however, were mostly
devastated during the 36-year Japanese colonial rule as well as the three-year Korean War.
For restoring the forest, numerous reforestation projects were planned and implemented from
post-Korean War to the 1970s. Unfortunately, most of the projects ended in failure, and
consequently the devastated forests had not been recovered until the 1970s. Therefore, several
landslides occurred in mountainous areas following heavy rains, and agriculture lands on the
lower region of the river were inundated by the flooding. Consequently, the top priority in
forest policies was to plant trees on mountains and to restore devastated forests.
The first and second 10-year government-led reforestation plans were implemented from
1973 and completed in 1989 with almost all devastated forests restored. The nationwide
reforestation within a short period was accomplished by national participation in tree planting,
the substitution of fuel from wooden materials to fossil fuel and, more importantly, by the
active support of the government.
As forest stock increased in the 1990s, the outflows of flood and soil were remarkably
reduced. However, due to inappropriate management of the forest, it became apparent that
water resources were wasted by the reforestation. For instance, Kim et al. (2003) reported that,
in the Central regions of Korea, the annual evapotranspiration was 590 mm out of the rainfall
of 1,215 mm on the forests, and particularly the evapotranspiration of April and May were 82
mm and 107 mm, respectively. They concluded that the shortage of water resources by
over-evapotranspiration might have resulted from improper forest management such as
large-scale plantation of coniferous trees, which consume much water, and a high density of
forest stock.
Forests are composed of trees and soil. Forest soil has a porous, sponge-like structure,
comprised of organic matter - such as rotten leaves, branches and stems - supplied by trees.
Forests are superior to grassland or agricultural land for absorbing rainfall because they have
well-developed soil for a long time ecologically.
Forest soil has higher infiltration capacity than other kinds of soil due to the surface layer with
many water-storable voids and the organic matter layer. For instance, the surface layer
consists of grape-shaped particles packed with inorganic substances and organic matters. The
layer has many voids created by rotten roots and possesses long tracks formed by small soil
animals such as earthworms, sow bugs and moles. Consequently, the maximum infiltration
capacity (or sequestration capacity) of the layer is over 250 mm/hr, and is very high compared
to 17 mm/hr for grassland, 5 mm/hr for cultivated land and 10 mm/hr for bare land. In the
organic matter layer, many voids are formed by the linkage of inorganic particles and organic
matter. Much water can be stored in these voids. In general, the water-storing capacity is
higher in mature forests than in young stands. Therefore, forests need to be taken care of for
at least 80 years for holding more water in the layers of forest soils.
Deciduous forest soils have a larger void volume for storing water than those of coniferous
forests. Organic matter is decomposed by microorganisms, and the most important factor
governing the decomposition is the carbon-nitrogen ratio. In general, if the carbon-nitrogen

APFSOS II: Republic of Korea
63
ratio is high, the proliferation of microorganisms is reduced due to a lack of nitrogen required
for the protein synthesis by microorganisms. The carbon-nitrogen ratio is higher in coniferous
forest soils than in deciduous. Thus, the decomposition of fallen leaves of coniferous forests is
slower than in deciduous forest soils. Furthermore, the fallen needles of coniferous trees
contain much lignin and chitin, which are difficult to decompose. During decomposition of
the needles, molds and actinomycetes form impermeable layers, and consequently the
penetration of rainfall is blocked. To facilitate the decomposition of coniferous trees, intensive
thinning and pruning of coniferous trees have to be conducted. Subsequently, small deciduous
trees are introduced to supply more organic matter and to foster more activity of small soil
animals and microorganisms.
Forests induce the adsorption and insolubility of various nutrients and ions included in the
forest soil during rainfall. By adsorption and insolubilization, the concentration of nutrients
and ions becomes lower, and thus the water is purified. Such water purification takes place
mostly within forest soil. For example, forests can reduce the concentration of nitrogen or
phosphorous, which are the main chemicals of water pollution, and raise the acidity (pH) of
acid rain. Forests reduced the average concentrations of nitrate-nitrogen and phosphorous
included in the rainfall from 14.3mg/ℓ to 1.7mg/ℓ and from 0.45mg/ℓ to 0.25mg/ℓ,
respectively. As the rain passes through the forest soil, the pH of acid rain increased from 4.6
to 6.7. In addition, various materials within rainfall are either sequestrated in roots or
adsorbed onto clay or corrosives, and the concentration of the materials in water becomes
lower.
In addition to such functions, forests reduce the frequency of landslides. The prevention of
soil loss greatly contributes to conservation of water quality downstream and purifies fresh
water in artificial dams. To increase the efficiency of the water purification function of forests,
more voids within a soil layer must be generated. As a result, rain can be easily absorbed into
forest soils and the contact time of rain with the soils can be elongated. Furthermore, the
water purification feature of forests is known throughout the whole forest ecosystem,
including in mineral soils, and thus a stable natural forest is an ideal forest for serving the
various functions mentioned above. In the case of coniferous forest plantations, proper
management can enhance such functions.
Water resources conservation scheme: The development of water resources has been led by
large-scale dam construction. However, as socio-economic conditions have changed,
construction of dams has encountered several problems. Alternatives to dam construction are
required to develop water resources. Constructing an environmentally friendly small- or
medium-sized dam for enhancement of ground water or reusing rainfall and sewage, is an
alternative. In addition, improvements in forest functions, such as flood control, mitigating
water shortages and water purification are considered as other ways to develop water
resources.
Public awareness that forests, called “green-dams”, must be properly managed to conserve
clean and abundant water resources has increased. Recently, the Korea Forest Service, in
collaboration with the Korea Water Resources Corporation, has implemented a green-dam
project to effectively manage upstream forests surrounding large-scale dams. The green-dam
project was completed in four forest regions surrounding large-scale dams in 2006, and for
the next decade, new green-dam projects will be implemented in 16 forest regions nationwide.
In addition, the Ministry of Environment has designated several regions with a circumference
of one kilometre around four major rivers as waterside districts, and established and managed
green infrastructure to conserve the water quality of the regions. This is a critical policy not
only in forest-related government agencies but also in the government ministries managing
water resources from the perspective of sharing water resource-forest relationships. The
management of water resources has a broad spectrum, and therefore cannot be delegated to a
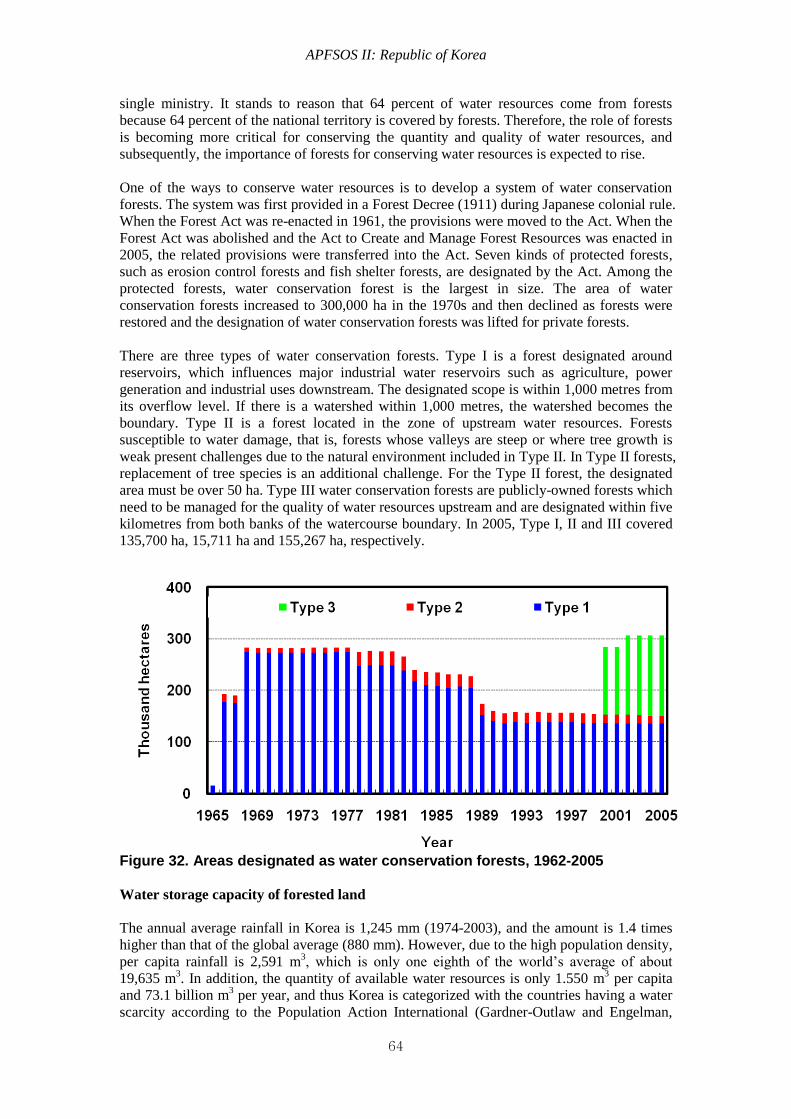
APFSOS II: Republic of Korea
64
single ministry. It stands to reason that 64 percent of water resources come from forests
because 64 percent of the national territory is covered by forests. Therefore, the role of forests
is becoming more critical for conserving the quantity and quality of water resources, and
subsequently, the importance of forests for conserving water resources is expected to rise.
One of the ways to conserve water resources is to develop a system of water conservation
forests. The system was first provided in a Forest Decree (1911) during Japanese colonial rule.
When the Forest Act was re-enacted in 1961, the provisions were moved to the Act. When the
Forest Act was abolished and the Act to Create and Manage Forest Resources was enacted in
2005, the related provisions were transferred into the Act. Seven kinds of protected forests,
such as erosion control forests and fish shelter forests, are designated by the Act. Among the
protected forests, water conservation forest is the largest in size. The area of water
conservation forests increased to 300,000 ha in the 1970s and then declined as forests were
restored and the designation of water conservation forests was lifted for private forests.
There are three types of water conservation forests. Type I is a forest designated around
reservoirs, which influences major industrial water reservoirs such as agriculture, power
generation and industrial uses downstream. The designated scope is within 1,000 metres from
its overflow level. If there is a watershed within 1,000 metres, the watershed becomes the
boundary. Type II is a forest located in the zone of upstream water resources. Forests
susceptible to water damage, that is, forests whose valleys are steep or where tree growth is
weak present challenges due to the natural environment included in Type II. In Type II forests,
replacement of tree species is an additional challenge. For the Type II forest, the designated
area must be over 50 ha. Type III water conservation forests are publicly-owned forests which
need to be managed for the quality of water resources upstream and are designated within five
kilometres from both banks of the watercourse boundary. In 2005, Type I, II and III covered
135,700 ha, 15,711 ha and 155,267 ha, respectively.
Figure 32. Areas designated as water conservation forests, 1962-2005
Water storage capacity of forested land
The annual average rainfall in Korea is 1,245 mm (1974-2003), and the amount is 1.4 times
higher than that of the global average (880 mm). However, due to the high population density,
per capita rainfall is 2,591 m3, which is only one eighth of the world’s average of about
19,635 m3. In addition, the quantity of available water resources is only 1.550 m
3 per capita
and 73.1 billion m3 per year, and thus Korea is categorized with the countries having a water
scarcity according to the Population Action International (Gardner-Outlaw and Engelman,
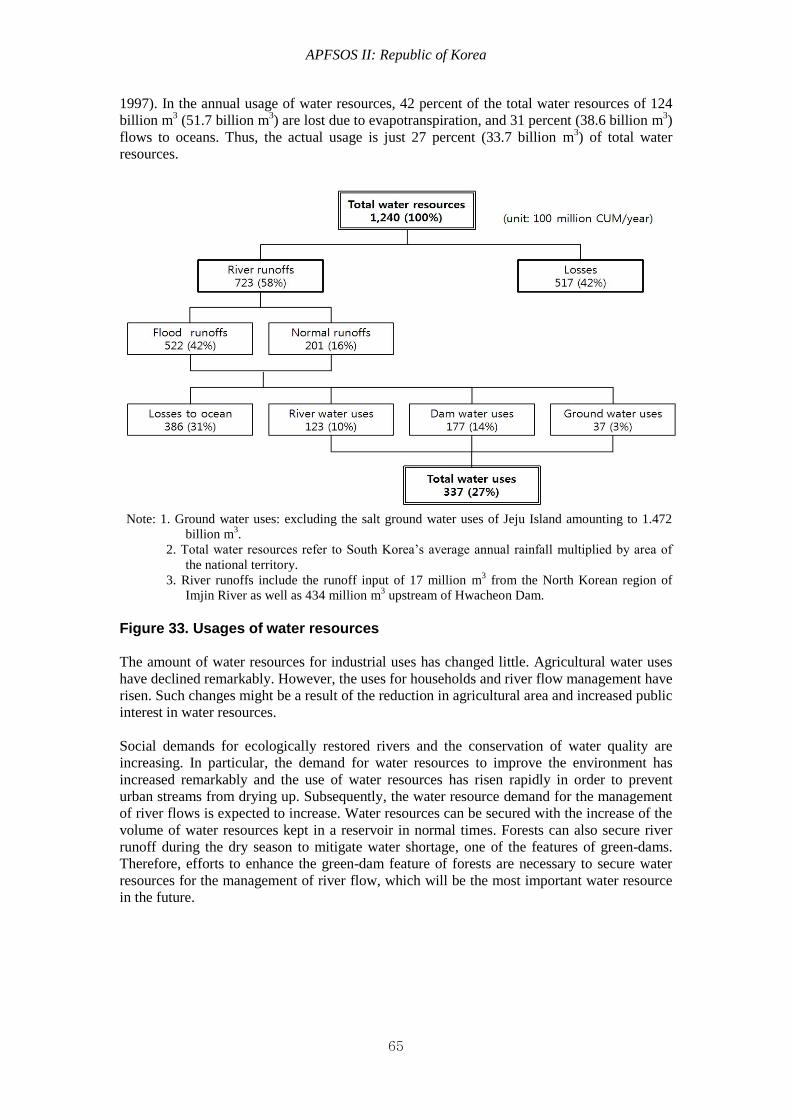
APFSOS II: Republic of Korea
65
1997). In the annual usage of water resources, 42 percent of the total water resources of 124
billion m3 (51.7 billion m
3) are lost due to evapotranspiration, and 31 percent (38.6 billion m
3)
flows to oceans. Thus, the actual usage is just 27 percent (33.7 billion m3) of total water
resources.
Note: 1. Ground water uses: excluding the salt ground water uses of Jeju Island amounting to 1.472
billion m3.
2. Total water resources refer to South Korea’s average annual rainfall multiplied by area of
the national territory.
3. River runoffs include the runoff input of 17 million m3 from the North Korean region of
Imjin River as well as 434 million m3 upstream of Hwacheon Dam.
Figure 33. Usages of water resources The amount of water resources for industrial uses has changed little. Agricultural water uses
have declined remarkably. However, the uses for households and river flow management have
risen. Such changes might be a result of the reduction in agricultural area and increased public
interest in water resources.
Social demands for ecologically restored rivers and the conservation of water quality are
increasing. In particular, the demand for water resources to improve the environment has
increased remarkably and the use of water resources has risen rapidly in order to prevent
urban streams from drying up. Subsequently, the water resource demand for the management
of river flows is expected to increase. Water resources can be secured with the increase of the
volume of water resources kept in a reservoir in normal times. Forests can also secure river
runoff during the dry season to mitigate water shortage, one of the features of green-dams.
Therefore, efforts to enhance the green-dam feature of forests are necessary to secure water
resources for the management of river flow, which will be the most important water resource
in the future.
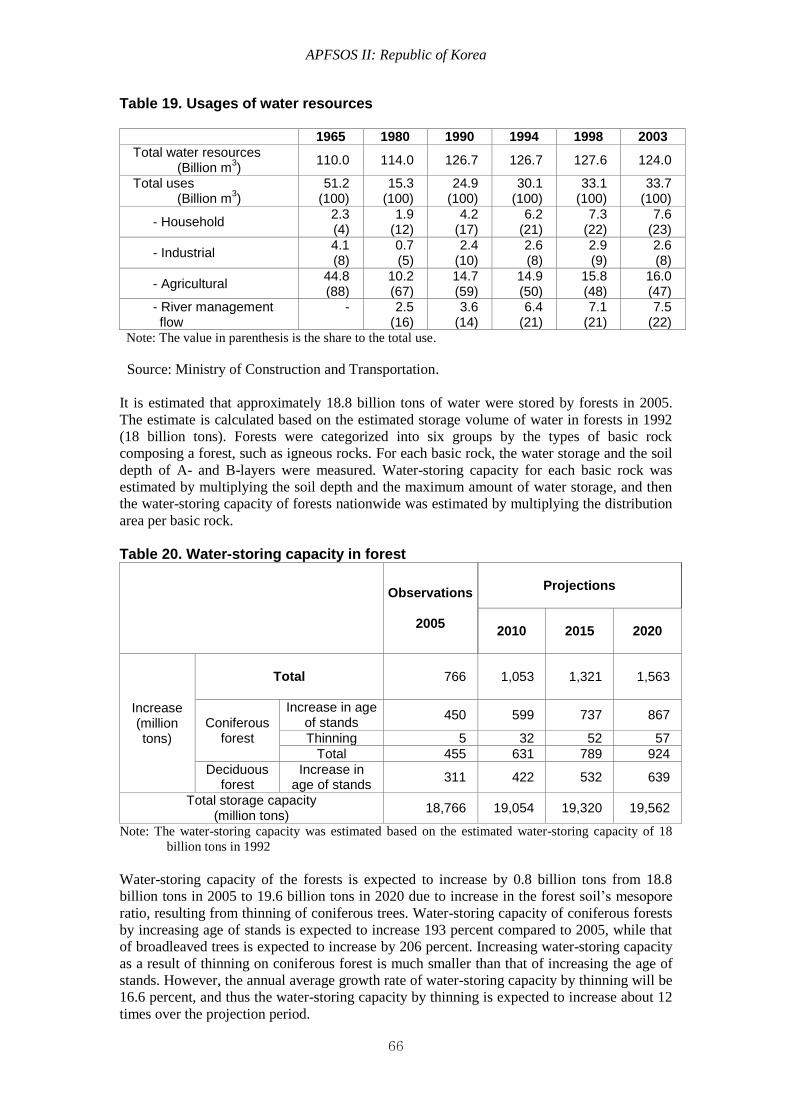
APFSOS II: Republic of Korea
66
Table 19. Usages of water resources
1965 1980 1990 1994 1998 2003
Total water resources (Billion m
3)
110.0 114.0 126.7 126.7 127.6 124.0
Total uses (Billion m
3)
51.2 (100)
15.3 (100)
24.9 (100)
30.1 (100)
33.1 (100)
33.7 (100)
- Household 2.3 (4)
1.9 (12)
4.2 (17)
6.2 (21)
7.3 (22)
7.6 (23)
- Industrial 4.1 (8)
0.7 (5)
2.4 (10)
2.6 (8)
2.9 (9)
2.6 (8)
- Agricultural 44.8 (88)
10.2 (67)
14.7 (59)
14.9 (50)
15.8 (48)
16.0 (47)
- River management flow
-
2.5 (16)
3.6 (14)
6.4 (21)
7.1 (21)
7.5 (22)
Note: The value in parenthesis is the share to the total use.
Source: Ministry of Construction and Transportation.
It is estimated that approximately 18.8 billion tons of water were stored by forests in 2005.
The estimate is calculated based on the estimated storage volume of water in forests in 1992
(18 billion tons). Forests were categorized into six groups by the types of basic rock
composing a forest, such as igneous rocks. For each basic rock, the water storage and the soil
depth of A- and B-layers were measured. Water-storing capacity for each basic rock was
estimated by multiplying the soil depth and the maximum amount of water storage, and then
the water-storing capacity of forests nationwide was estimated by multiplying the distribution
area per basic rock.
Table 20. Water-storing capacity in forest
Observations
2005
Projections
2010 2015 2020
Increase (million tons)
Total 766 1,053 1,321 1,563
Coniferous forest
Increase in age of stands
450 599 737 867
Thinning 5 32 52 57
Total 455 631 789 924
Deciduous forest
Increase in age of stands
311 422 532 639
Total storage capacity (million tons)
18,766 19,054 19,320 19,562
Note: The water-storing capacity was estimated based on the estimated water-storing capacity of 18
billion tons in 1992
Water-storing capacity of the forests is expected to increase by 0.8 billion tons from 18.8
billion tons in 2005 to 19.6 billion tons in 2020 due to increase in the forest soil’s mesopore
ratio, resulting from thinning of coniferous trees. Water-storing capacity of coniferous forests
by increasing age of stands is expected to increase 193 percent compared to 2005, while that
of broadleaved trees is expected to increase by 206 percent. Increasing water-storing capacity
as a result of thinning on coniferous forest is much smaller than that of increasing the age of
stands. However, the annual average growth rate of water-storing capacity by thinning will be
16.6 percent, and thus the water-storing capacity by thinning is expected to increase about 12
times over the projection period.
APFSOS II: Republic of Korea
67
Forest recreation
In general, forest recreation refers to outdoor recreational activities either based on or using
forests. For example, Johnson and Bowker (1999) defined forest recreations as “outdoor
recreational activities based on forests” while Rudis (1987) noted it as “outdoor recreational
activities in forests and the forest-generating water near forests.” Ohta et al. (1996) classified
it as “recreational activities in forests, such as forest bath, picking edible greens and
mushrooms, small stream fishing and mountain biking on forest paths” Based on these
definitions, the basic concept of forest recreation is “outdoor recreational activities based on
forests or by using them”.
Forest recreation resources: Korea has established a natural park system to diversify the
opportunities of forest recreation. The natural parks are classified into national, provincial and
town parks. Besides the natural park system, natural recreation forests, forest bathhouses and
forest sites are other types of recreational sites.
Natural Parks are designated by the Natural Park Law to protect the natural ecosystem and
landscape and to provide people with sustainable usages, thereby contributing to people’s
healthcare, recreation and emotional adjustment. Since Mt. Jiri National Park was designated
as the first National Park in Korea, another 20 national parks have been designated and
managed so far. Except for sea areas, national parks cover 390,000 ha, accounting for 3.9
percent of the total land area. Private property like a Buddhist temple is included in national
parks, making it difficult to manage the national parks. Mt. Geum-O was designated as the
first provincial park in 1970 and other 22 sites have also been designated as a provincial park.
The total area of the provincial parks covers about 75,000 ha. Town parks have been
designated in 31 sites with the first designation of Mt. Gangcheon and cover about 43,000 ha
(including sea areas).
Natural Recreation Forest is designed to contribute to increasing income of forest owners as
well as providing people with healthcare, recreation, emotional adjustment and natural
learning. In accordance with the Law on Forest Culture and Recreation, forests having
beautiful scenery with over 30 ha and being easily accessible were designated as Natural
Recreation Forest. The first one was designated on Mt. Yoomyung in 1989. Since then, the
number of natural recreation forests has increased steadily to about 123 sites, covering about
135,000 ha in 2006.
In addition, forest bathhouses, arboretums (botanical gardens), forest museums, and training
facilities are included in other types of forest recreation facilities. Broadly speaking, golf
courses, ski resorts, and hunting grounds could also be included in the recreation facilities. A
forest bathhouse is a recreation facility where Phytoncide or tree-emitted essential oils
beneficial to human beings can be sipped or touched. Forest bathhouses differ from natural
recreation forests because there are no accommodation facilities in a bathhouse. Forest
bathhouses were opened in six areas in 1994 and increased to 102 sites in 2006, covering
5,500 ha.
The prototype arboretum in Korea is the botanical garden in Changgyeonggung Palace
established in 1907. An experimental nursery was established for the testing and production
of tree seedlings in Gwangnung, Pocheon during Japanese colonial rule. A pilot tree garden
was also built with the nursery, the two constituting the first arboretum. Seoul National
University’s Gwanak Arboretum was established in 1967, followed by Cheonri-po Arboretum
in 1970. In 1999, the arboretum located at Gwangneung was expanded into a National
Arboretum and the Law of Establishment and Promotion of Arboretum was enacted in 2001.
Currently, 38 arboretums are being operated throughout the country. Table 21 summarizes the
forest recreation resources mentioned above. Natural parks, Natural Recreation Forests and
other forest recreation resources account for about 5.2, 1.4 and 0.1 percent of the national
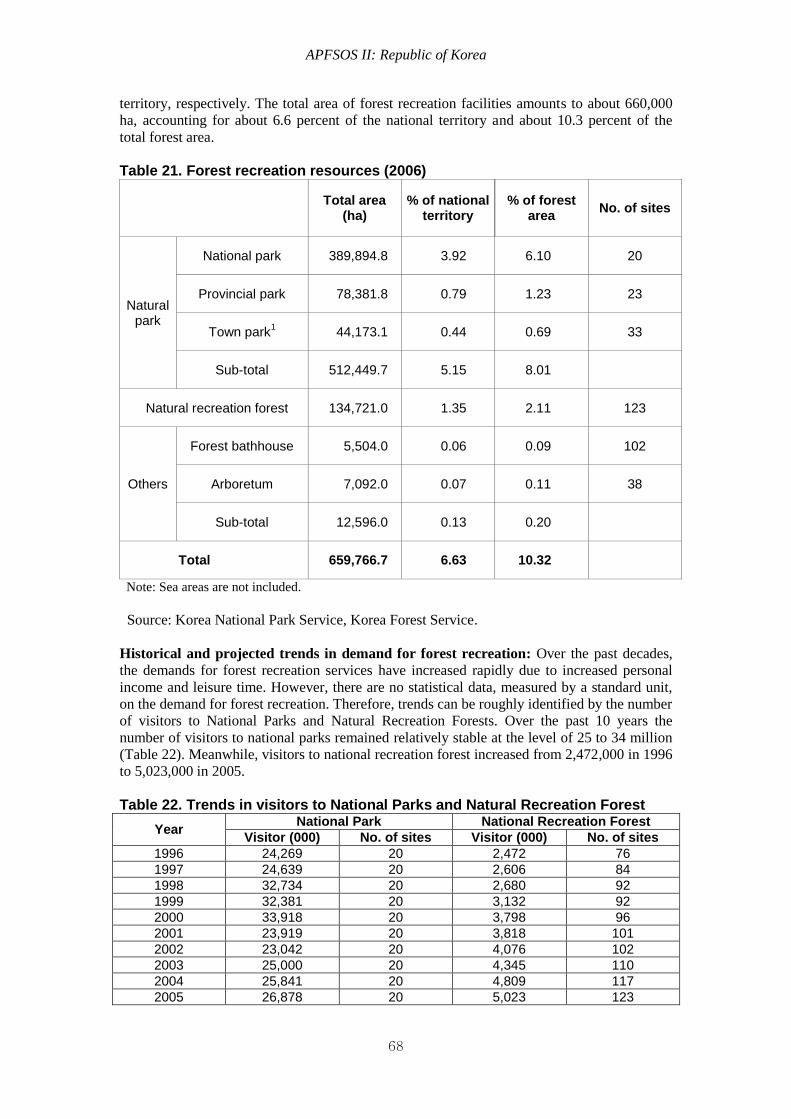
APFSOS II: Republic of Korea
68
territory, respectively. The total area of forest recreation facilities amounts to about 660,000
ha, accounting for about 6.6 percent of the national territory and about 10.3 percent of the
total forest area.
Table 21. Forest recreation resources (2006)
Total area
(ha) % of national
territory % of forest
area No. of sites
Natural park
National park
389,894.8 3.92 6.10 20
Provincial park 78,381.8 0.79 1.23 23
Town park1
44,173.1 0.44 0.69 33
Sub-total 512,449.7 5.15 8.01
Natural recreation forest 134,721.0 1.35 2.11 123
Others
Forest bathhouse 5,504.0 0.06 0.09 102
Arboretum 7,092.0 0.07 0.11 38
Sub-total 12,596.0 0.13 0.20
Total 659,766.7 6.63 10.32
Note: Sea areas are not included.
Source: Korea National Park Service, Korea Forest Service.
Historical and projected trends in demand for forest recreation: Over the past decades,
the demands for forest recreation services have increased rapidly due to increased personal
income and leisure time. However, there are no statistical data, measured by a standard unit,
on the demand for forest recreation. Therefore, trends can be roughly identified by the number
of visitors to National Parks and Natural Recreation Forests. Over the past 10 years the
number of visitors to national parks remained relatively stable at the level of 25 to 34 million
(Table 22). Meanwhile, visitors to national recreation forest increased from 2,472,000 in 1996
to 5,023,000 in 2005.
Table 22. Trends in visitors to National Parks and Natural Recreation Forest
Year National Park National Recreation Forest
Visitor (000) No. of sites Visitor (000) No. of sites
1996 24,269 20 2,472 76
1997 24,639 20 2,606 84
1998 32,734 20 2,680 92
1999 32,381 20 3,132 92
2000 33,918 20 3,798 96
2001 23,919 20 3,818 101
2002 23,042 20 4,076 102
2003 25,000 20 4,345 110
2004 25,841 20 4,809 117
2005 26,878 20 5,023 123

APFSOS II: Republic of Korea
69
Source: Korea National Park Service, Korea Forest Service.
In 2002, the Korea Forest Research Institute conducted a survey on forest recreation demand.
It randomly sampled 2,000 visitors to recreational sites in 16 cities and provinces. In the
survey, measurement units were categorized into visit day (VD) and visitor number
depending on the length of stay per visit. Visit day refers to a visitor staying over 8 hours per
visit and visitor number refers to a visitor staying less than eight hours. The results showed
that the total visit days amounted to 88,834,000 and the total visit numbers reached
844,446,000.
Demands for forest recreation will increase steadily as a result of increasing population,
personal income and investment in recreational facilities. Visit days will rise from
approximately 91 million in 2005 to about 139 million in 2020. Visitor numbers are projected
to increase from about one billion in 2005 to about 1.6 billion in 2020.
The demand for forest recreation is expected to rise not only quantitatively but also
qualitatively as recreational activities, experience-oriented and specialized, are introduced.
Traditional forest recreational activities such as mountain climbing, strolling and sight-seeing
have increased steadily and will continue to rise. In the future, however, forest recreational
activities will be expanded into mountain sports and recreational activities based on
forest-based therapy and forest culture and such recreational activities are expected to rise
rapidly.
Figure 34. Projections for forest recreation demand until 2020
Forest carbon sequestration
Due to the successful implementation of the reforestation projects throughout the 1970s and
1980s, the unstocked forestland, which amounted to 42 percent of the total forest area in 1960,
was reduced to two percent in 2005. As the rehabilitated forests enter into the growth stage,
the annual growth rate of growing stock amounts to around 3 to 4 percent, serving as the
source of net sequestration of greenhouse gases in the atmosphere.
In 2005, removals were about 42.5 Mt CO2 while the emissions from harvest were
approximately 5.2 Mt CO2,, or 12 percent of the removals. Therefore, the net removals are
estimated to be 37.3 Mt CO2. Sequestration by forests rose steadily in the late 1990 and then
remained at 40-45 Mt CO2 . The emissions are below 5 Mt CO2, but show an upward trend. As
one of the responses to the Convention on Climate Change, the forest sector of the Korean
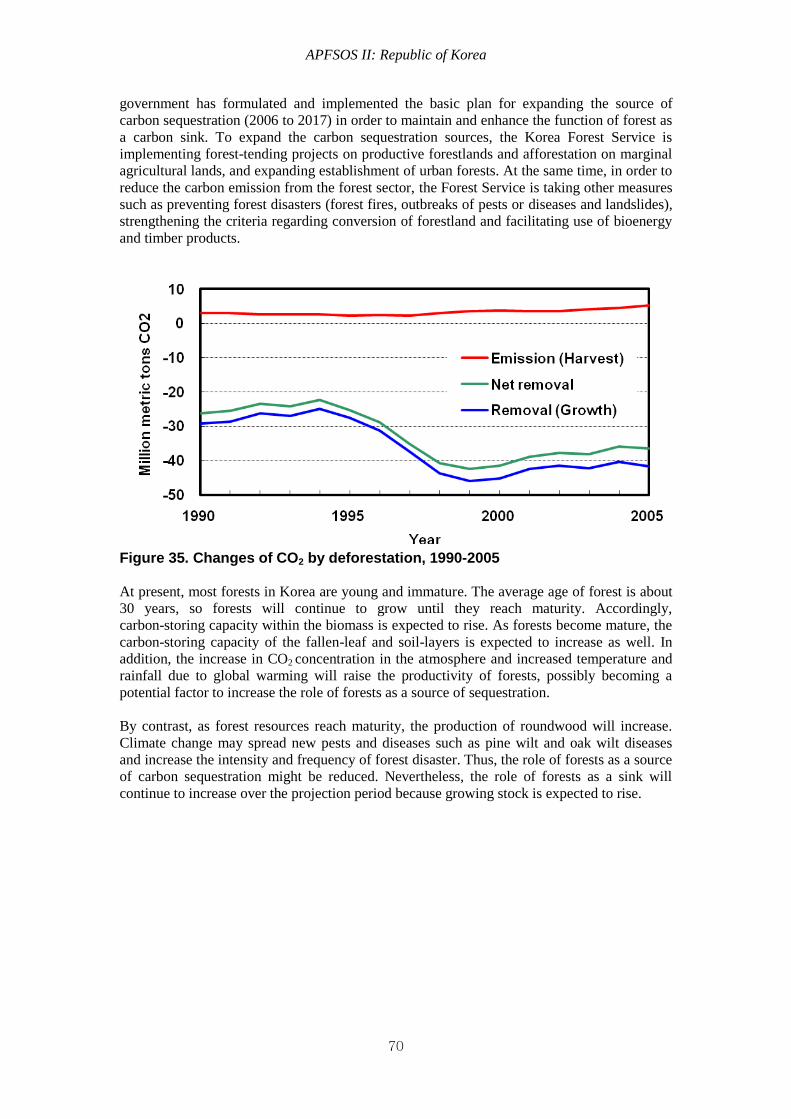
APFSOS II: Republic of Korea
70
government has formulated and implemented the basic plan for expanding the source of
carbon sequestration (2006 to 2017) in order to maintain and enhance the function of forest as
a carbon sink. To expand the carbon sequestration sources, the Korea Forest Service is
implementing forest-tending projects on productive forestlands and afforestation on marginal
agricultural lands, and expanding establishment of urban forests. At the same time, in order to
reduce the carbon emission from the forest sector, the Forest Service is taking other measures
such as preventing forest disasters (forest fires, outbreaks of pests or diseases and landslides),
strengthening the criteria regarding conversion of forestland and facilitating use of bioenergy
and timber products.
Figure 35. Changes of CO2 by deforestation, 1990-2005
At present, most forests in Korea are young and immature. The average age of forest is about
30 years, so forests will continue to grow until they reach maturity. Accordingly,
carbon-storing capacity within the biomass is expected to rise. As forests become mature, the
carbon-storing capacity of the fallen-leaf and soil-layers is expected to increase as well. In
addition, the increase in CO2 concentration in the atmosphere and increased temperature and
rainfall due to global warming will raise the productivity of forests, possibly becoming a
potential factor to increase the role of forests as a source of sequestration.
By contrast, as forest resources reach maturity, the production of roundwood will increase.
Climate change may spread new pests and diseases such as pine wilt and oak wilt diseases
and increase the intensity and frequency of forest disaster. Thus, the role of forests as a source
of carbon sequestration might be reduced. Nevertheless, the role of forests as a sink will
continue to increase over the projection period because growing stock is expected to rise.
APFSOS II: Republic of Korea
71
4. ALTERNATIVE SCENARIOS
Changes in population and income are the main exogenous factors affecting the forest sector.
In addition, in the medium and long term, expansion of markets as a result of signing
WTO/DDA and FTA negotiations or trade liberalization of forest products are expected to
influence the overall forest sector, including investment in forests, demand and supply, prices,
competitiveness and technology.
Population changes have an effect on the market size for forest products and services.
Changes in the population age structure can also change the consumption patterns by altering
income levels and consumer preferences. Population changes influence the extent of the
competition for land and the production costs as a result of workforce changes.
The total population has increased consistently over the past 50 years but rural population has
declined significantly due to population movement from rural areas to urban areas. A smaller
rural workforce has reduced the workforce in forestry, which was a major cause of higher
production costs and weaker competitiveness in the forest sector. In urban areas, larger
population resulted in increased demand for land for housing, industrial facilities and
infrastructure, leading to increased deforestation. Urbanization, along with aging population,
has also increased and will continue to increase demands for forest services, relative to forest
products. For meeting these demands, new options will be required for managing forests near
urban areas. In the future, these trends will continue and conflicts will be deepened between
rural people regarding forests as a productive resource and urban people placing more value
on non-market benefits.
Economic growth is the most important factor that influences future projections on the
demand for forest products and services. Economic growth, that is, higher disposable personal
income, leads to increased demand for forest products and services. The construction sector,
(a major end-use sector of wood products), shows a positive relationship with level of GDP
and its activities are most critical in determining the consumption level of wood products.
Growth of the construction sector along with rapid economic growth will expand forest
product markets. However, if the demand for forest resources exceeds the biological capacity
of forests, it may also reduce forest resources, negatively influencing the future generations’
use of forest resources.
WTO/DDA negotiations launched in 2001 are currently underway. In addition, there has been
a large increase in the number of bilateral free trade agreements (FTAs). In recent years,
Korea has also begun to negotiate a number of bilateral trade talks. Since the first bilateral
trade agreement with Chile, effective in 2004, Korea has already signed FTAs with Singapore,
EFTA, and ASEAN. Korea is currently negotiating and considering FTAs with a number of
other important trading partners, including the USA, Mexico, Japan, the EU and China.
Conclusion of the multilateral and bilateral trade agreement negotiations will further open the
forest product markets. Thus, restructuring of the forest sector will be inevitable to maintain
and enhance competitiveness, even in domestic markets. Therefore, market liberalization will
have profound impacts on the supply and demand of NWFPs with very high tariffs as well as
timber products. These impacts will spread to the whole forest sector.
This section analyzes impacts of changes in macroeconomic indicators such as population and
income and market liberalization on the forest sector. Three alternative scenarios were
designed for changes in population, changes in economic growth and investment in the
construction sector, and tariff reduction on forest products as a result of potential WTO/DDA
trade negotiation. In addition, the impact of these alternatives on changes in forest resources
and the supply and demand of forest products and services was examined and compared to the
base case scenario.

APFSOS II: Republic of Korea
72
Population changes
The growth rate of population has declined rapidly because of the government policy to
control fertility since the 1960s. As there are more opportunities for women to become
working members of society, the TFR decreased sharply from 4.53 in 1970 to 1.08 in 2005.
This declining TFR became one of the important social issues. To address these issues, both
central and local governments are taking measures to encourage childbirth. Therefore, future
population is expected to change depending on the success of various support programs to
encourage birth.
The Korea Institute for Health and Social Affairs made projections of future population
changes based on the changes in the TFR anticipated from the policy promoting childbirth
(Kim et al., 2003). It concluded that it would be most probable that the TFR will increase
from 1.17 in 2002 to 1.30 in 2007, 1.50 in 2012 and 1.70 in 2017 and then remain at the level
of 2017 until 2050. Based on the above changes in TFR, total population is projected to reach
the highest level of 52,423,000 in 2030 and then decrease to 50,071,000 in 2050. In this study,
these population projections were examined as the alternative scenario on population changes.
As shown in Table 23, the population projection under the alternative scenario is much higher
than that under the base case scenario and the timing to reach the peak is delayed a decade
later. In addition, the gap between the baseline and the alternative scenarios is becoming
wider over time.
Table 23. Comparison of population projections between alternative and baseline scenarios
2005
Projections
2010 2015 2020
Alternative scenario (A) (thousand)
48,138 49,399 50,392 51,384
Baseline scenario (B) (thousand)
48,138 48,875 49,277 49,326
Differences (A-B) (thousand)
- 524 1,115 2,058
Table 24 summarizes the effects of the alternative population scenario on major variables.
Population changes have the largest impacts on demand for forest recreation, NWFP markets
and forest area. The impacts of population changes increase gradually over time, reflecting
bigger gaps in the population between the base case and alternative scenarios. Higher
population increases the number of recreation visits by 1.7 to 6.5 percent and the visit days of
recreation by 0.6 to 2.4 percent. Higher population increases the consumption of pine nuts,
walnuts and oak mushrooms among NWFPs by 1.1 to 4.2 percent, with the increased
consumption met by imports. Higher population reduces the forest area by 0.3 to 1.3 percent.
Under the base case scenario, the forest area is projected to decline by 2015, and then increase
gradually. Under the alternative scenario, however, the forest area is projected to continue to
decline by 2020. Due to declining forest area, the growing stock falls, leading to a drop in
harvests and influencing the timber product market as a whole. However, the impact on the
timber product markets is negligible.
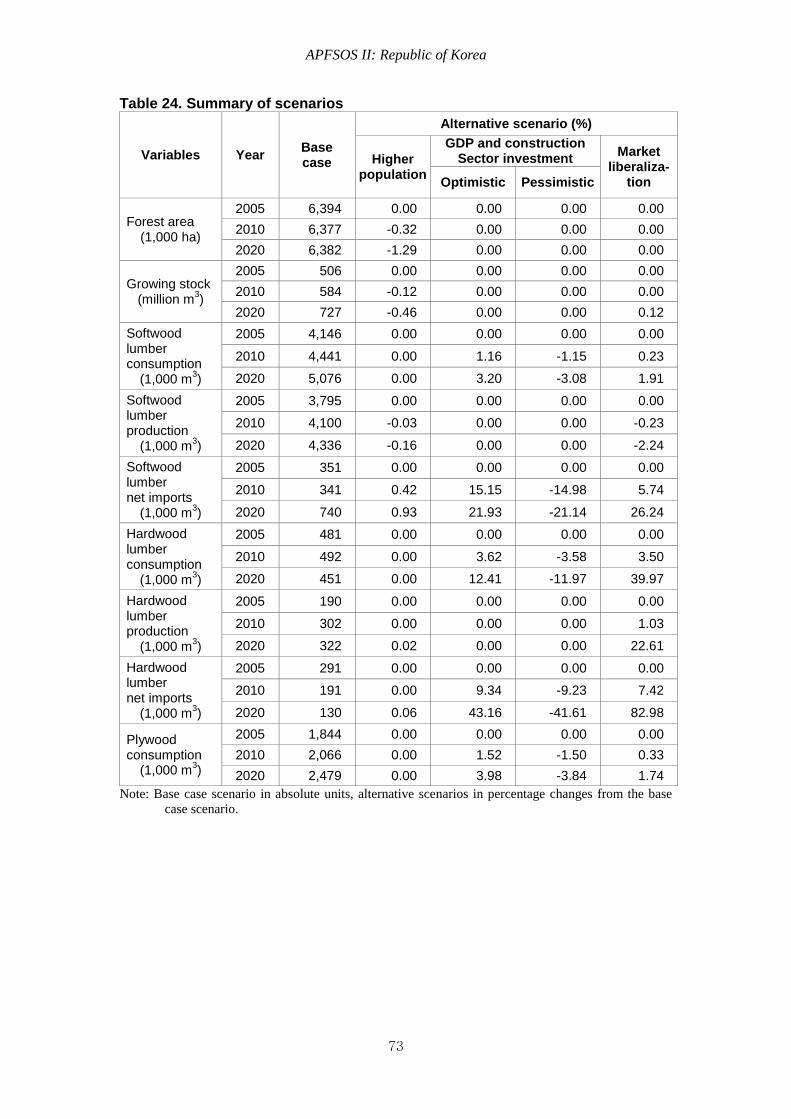
APFSOS II: Republic of Korea
73
Table 24. Summary of scenarios
Variables Year Base case
Alternative scenario (%)
Higher population
GDP and construction Sector investment
Market liberaliza-
tion Optimistic Pessimistic
Forest area (1,000 ha)
2005 6,394 0.00 0.00 0.00 0.00
2010 6,377 -0.32 0.00 0.00 0.00
2020 6,382 -1.29 0.00 0.00 0.00
Growing stock (million m
3)
2005 506 0.00 0.00 0.00 0.00
2010 584 -0.12 0.00 0.00 0.00
2020 727 -0.46 0.00 0.00 0.12
Softwood lumber consumption
(1,000 m3)
2005 4,146 0.00 0.00 0.00 0.00
2010 4,441 0.00 1.16 -1.15 0.23
2020 5,076 0.00 3.20 -3.08 1.91
Softwood lumber production
(1,000 m3)
2005 3,795 0.00 0.00 0.00 0.00
2010 4,100 -0.03 0.00 0.00 -0.23
2020 4,336 -0.16 0.00 0.00 -2.24
Softwood lumber net imports
(1,000 m3)
2005 351 0.00 0.00 0.00 0.00
2010 341 0.42 15.15 -14.98 5.74
2020 740 0.93 21.93 -21.14 26.24
Hardwood lumber consumption
(1,000 m3)
2005 481 0.00 0.00 0.00 0.00
2010 492 0.00 3.62 -3.58 3.50
2020 451 0.00 12.41 -11.97 39.97
Hardwood lumber production
(1,000 m3)
2005 190 0.00 0.00 0.00 0.00
2010 302 0.00 0.00 0.00 1.03
2020 322 0.02 0.00 0.00 22.61
Hardwood lumber net imports
(1,000 m3)
2005 291 0.00 0.00 0.00 0.00
2010 191 0.00 9.34 -9.23 7.42
2020 130 0.06 43.16 -41.61 82.98
Plywood consumption
(1,000 m3)
2005 1,844 0.00 0.00 0.00 0.00
2010 2,066 0.00 1.52 -1.50 0.33
2020 2,479 0.00 3.98 -3.84 1.74
Note: Base case scenario in absolute units, alternative scenarios in percentage changes from the base
case scenario.
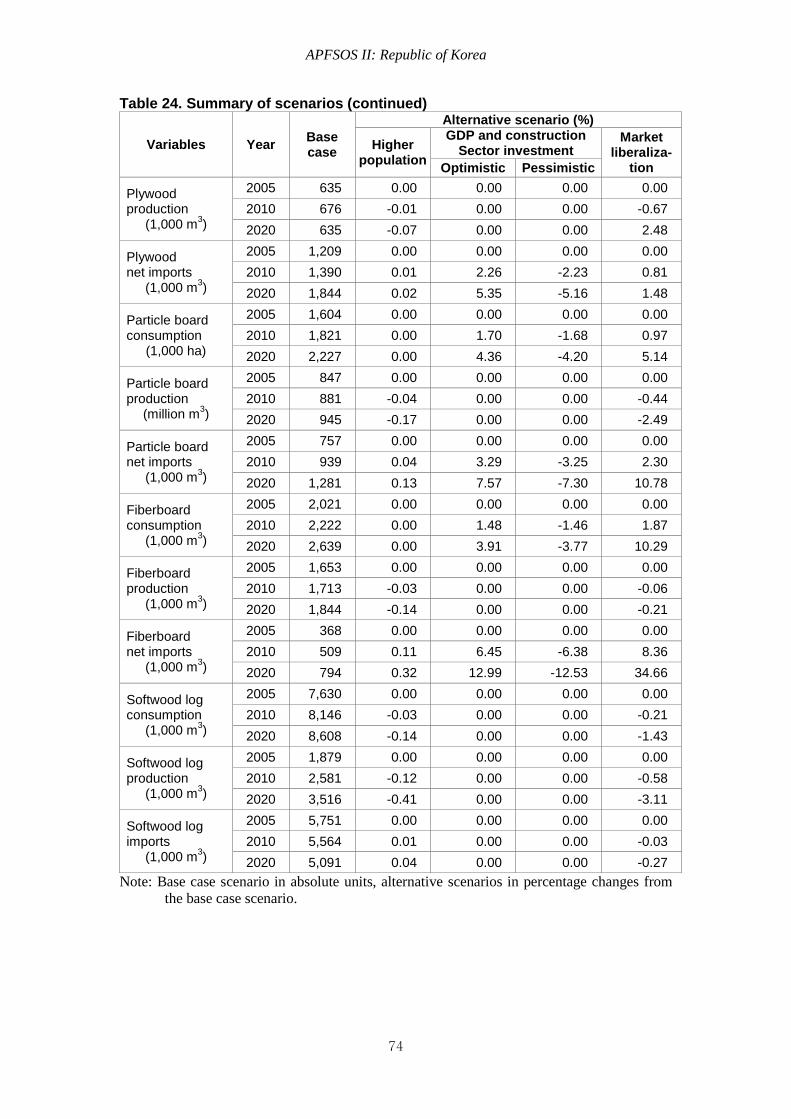
APFSOS II: Republic of Korea
74
Table 24. Summary of scenarios (continued)
Variables Year Base case
Alternative scenario (%)
Higher population
GDP and construction Sector investment
Market liberaliza-
tion Optimistic Pessimistic
Plywood production
(1,000 m3)
2005 635 0.00 0.00 0.00 0.00
2010 676 -0.01 0.00 0.00 -0.67
2020 635 -0.07 0.00 0.00 2.48
Plywood net imports
(1,000 m3)
2005 1,209 0.00 0.00 0.00 0.00
2010 1,390 0.01 2.26 -2.23 0.81
2020 1,844 0.02 5.35 -5.16 1.48
Particle board consumption
(1,000 ha)
2005 1,604 0.00 0.00 0.00 0.00
2010 1,821 0.00 1.70 -1.68 0.97
2020 2,227 0.00 4.36 -4.20 5.14
Particle board production
(million m3)
2005 847 0.00 0.00 0.00 0.00
2010 881 -0.04 0.00 0.00 -0.44
2020 945 -0.17 0.00 0.00 -2.49
Particle board net imports
(1,000 m3)
2005 757 0.00 0.00 0.00 0.00
2010 939 0.04 3.29 -3.25 2.30
2020 1,281 0.13 7.57 -7.30 10.78
Fiberboard consumption
(1,000 m3)
2005 2,021 0.00 0.00 0.00 0.00
2010 2,222 0.00 1.48 -1.46 1.87
2020 2,639 0.00 3.91 -3.77 10.29
Fiberboard production
(1,000 m3)
2005 1,653 0.00 0.00 0.00 0.00
2010 1,713 -0.03 0.00 0.00 -0.06
2020 1,844 -0.14 0.00 0.00 -0.21
Fiberboard net imports
(1,000 m3)
2005 368 0.00 0.00 0.00 0.00
2010 509 0.11 6.45 -6.38 8.36
2020 794 0.32 12.99 -12.53 34.66
Softwood log consumption
(1,000 m3)
2005 7,630 0.00 0.00 0.00 0.00
2010 8,146 -0.03 0.00 0.00 -0.21
2020 8,608 -0.14 0.00 0.00 -1.43
Softwood log production
(1,000 m3)
2005 1,879 0.00 0.00 0.00 0.00
2010 2,581 -0.12 0.00 0.00 -0.58
2020 3,516 -0.41 0.00 0.00 -3.11
Softwood log imports
(1,000 m3)
2005 5,751 0.00 0.00 0.00 0.00
2010 5,564 0.01 0.00 0.00 -0.03
2020 5,091 0.04 0.00 0.00 -0.27
Note: Base case scenario in absolute units, alternative scenarios in percentage changes from
the base case scenario.
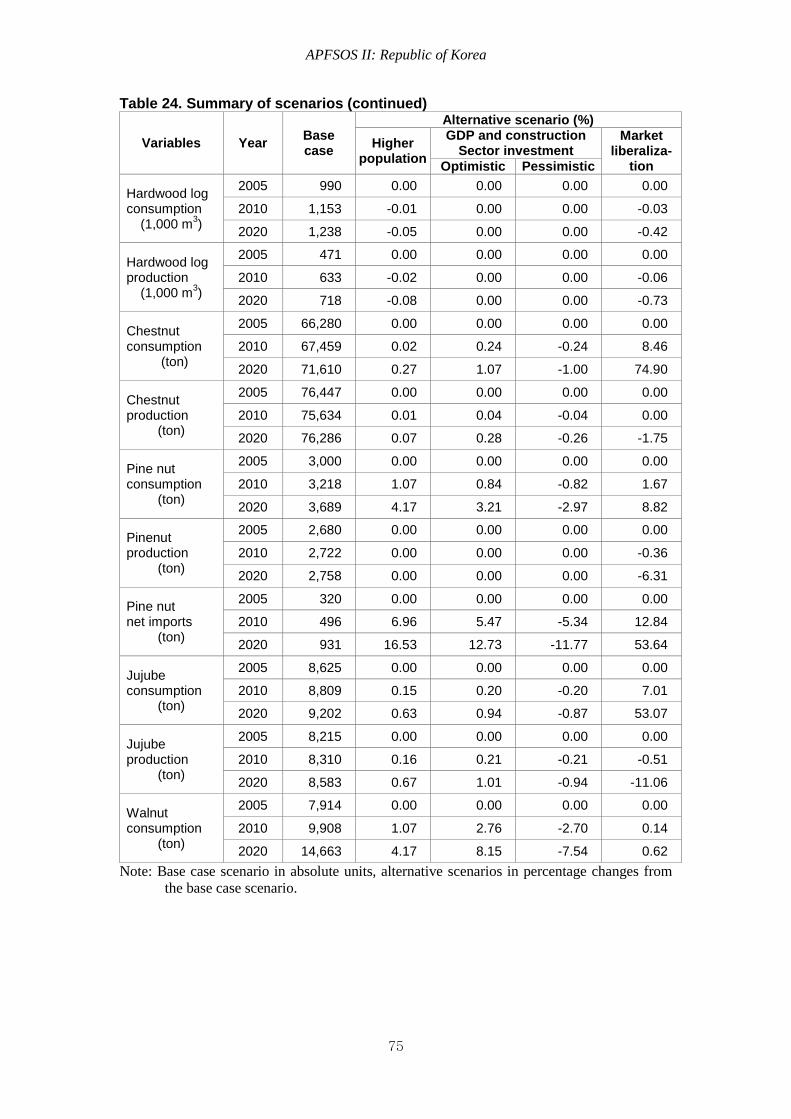
APFSOS II: Republic of Korea
75
Table 24. Summary of scenarios (continued)
Variables Year Base case
Alternative scenario (%)
Higher population
GDP and construction Sector investment
Market liberaliza-
tion Optimistic Pessimistic
Hardwood log consumption
(1,000 m3)
2005 990 0.00 0.00 0.00 0.00
2010 1,153 -0.01 0.00 0.00 -0.03
2020 1,238 -0.05 0.00 0.00 -0.42
Hardwood log production
(1,000 m3)
2005 471 0.00 0.00 0.00 0.00
2010 633 -0.02 0.00 0.00 -0.06
2020 718 -0.08 0.00 0.00 -0.73
Chestnut consumption
(ton)
2005 66,280 0.00 0.00 0.00 0.00
2010 67,459 0.02 0.24 -0.24 8.46
2020 71,610 0.27 1.07 -1.00 74.90
Chestnut production
(ton)
2005 76,447 0.00 0.00 0.00 0.00
2010 75,634 0.01 0.04 -0.04 0.00
2020 76,286 0.07 0.28 -0.26 -1.75
Pine nut consumption
(ton)
2005 3,000 0.00 0.00 0.00 0.00
2010 3,218 1.07 0.84 -0.82 1.67
2020 3,689 4.17 3.21 -2.97 8.82
Pinenut production
(ton)
2005 2,680 0.00 0.00 0.00 0.00
2010 2,722 0.00 0.00 0.00 -0.36
2020 2,758 0.00 0.00 0.00 -6.31
Pine nut net imports
(ton)
2005 320 0.00 0.00 0.00 0.00
2010 496 6.96 5.47 -5.34 12.84
2020 931 16.53 12.73 -11.77 53.64
Jujube consumption
(ton)
2005 8,625 0.00 0.00 0.00 0.00
2010 8,809 0.15 0.20 -0.20 7.01
2020 9,202 0.63 0.94 -0.87 53.07
Jujube production
(ton)
2005 8,215 0.00 0.00 0.00 0.00
2010 8,310 0.16 0.21 -0.21 -0.51
2020 8,583 0.67 1.01 -0.94 -11.06
Walnut consumption
(ton)
2005 7,914 0.00 0.00 0.00 0.00
2010 9,908 1.07 2.76 -2.70 0.14
2020 14,663 4.17 8.15 -7.54 0.62
Note: Base case scenario in absolute units, alternative scenarios in percentage changes from
the base case scenario.
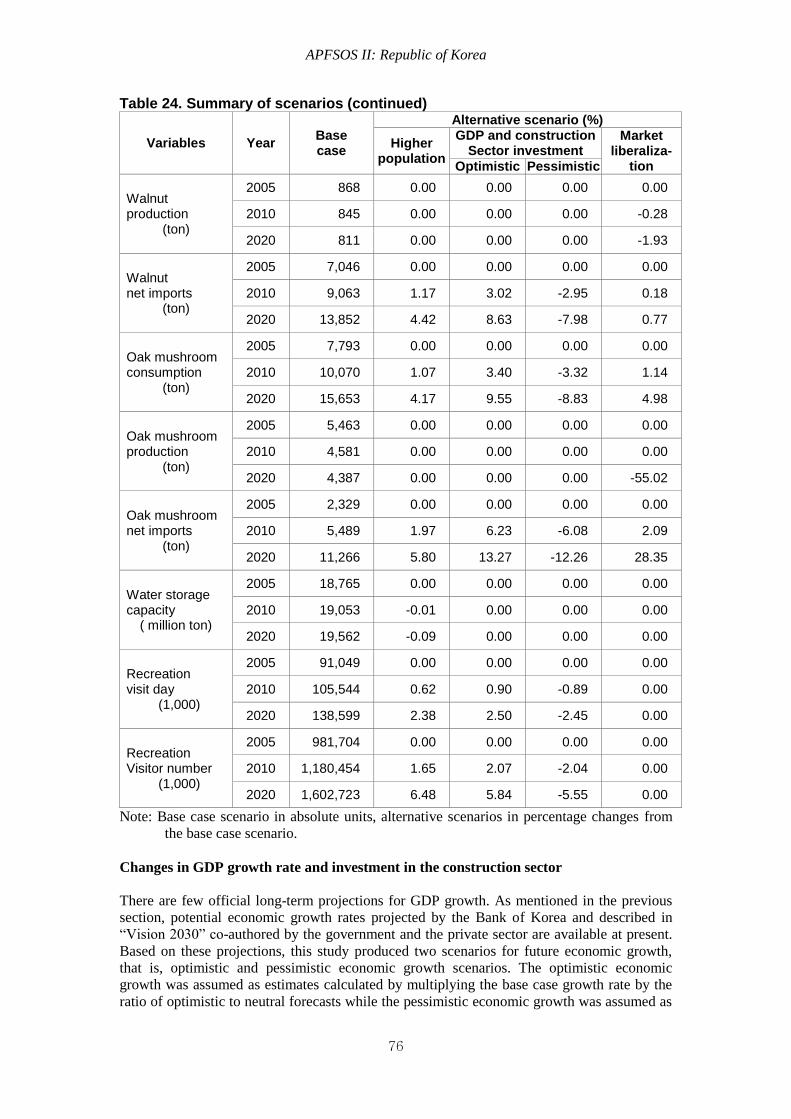
APFSOS II: Republic of Korea
76
Table 24. Summary of scenarios (continued)
Variables Year Base case
Alternative scenario (%)
Higher population
GDP and construction Sector investment
Market liberaliza-
tion Optimistic Pessimistic
Walnut production
(ton)
2005 868 0.00 0.00 0.00 0.00
2010 845 0.00 0.00 0.00 -0.28
2020 811 0.00 0.00 0.00 -1.93
Walnut net imports
(ton)
2005 7,046 0.00 0.00 0.00 0.00
2010 9,063 1.17 3.02 -2.95 0.18
2020 13,852 4.42 8.63 -7.98 0.77
Oak mushroom consumption
(ton)
2005 7,793 0.00 0.00 0.00 0.00
2010 10,070 1.07 3.40 -3.32 1.14
2020 15,653 4.17 9.55 -8.83 4.98
Oak mushroom production
(ton)
2005 5,463 0.00 0.00 0.00 0.00
2010 4,581 0.00 0.00 0.00 0.00
2020 4,387 0.00 0.00 0.00 -55.02
Oak mushroom net imports
(ton)
2005 2,329 0.00 0.00 0.00 0.00
2010 5,489 1.97 6.23 -6.08 2.09
2020 11,266 5.80 13.27 -12.26 28.35
Water storage capacity
( million ton)
2005 18,765 0.00 0.00 0.00 0.00
2010 19,053 -0.01 0.00 0.00 0.00
2020 19,562 -0.09 0.00 0.00 0.00
Recreation visit day
(1,000)
2005 91,049 0.00 0.00 0.00 0.00
2010 105,544 0.62 0.90 -0.89 0.00
2020 138,599 2.38 2.50 -2.45 0.00
Recreation Visitor number
(1,000)
2005 981,704 0.00 0.00 0.00 0.00
2010 1,180,454 1.65 2.07 -2.04 0.00
2020 1,602,723 6.48 5.84 -5.55 0.00
Note: Base case scenario in absolute units, alternative scenarios in percentage changes from
the base case scenario.
Changes in GDP growth rate and investment in the construction sector
There are few official long-term projections for GDP growth. As mentioned in the previous
section, potential economic growth rates projected by the Bank of Korea and described in
“Vision 2030” co-authored by the government and the private sector are available at present.
Based on these projections, this study produced two scenarios for future economic growth,
that is, optimistic and pessimistic economic growth scenarios. The optimistic economic
growth was assumed as estimates calculated by multiplying the base case growth rate by the
ratio of optimistic to neutral forecasts while the pessimistic economic growth was assumed as

APFSOS II: Republic of Korea
77
estimates calculated by multiplying the base case growth rate by the ratio of pessimistic to
neutral forecasts, for each interval of projection period (see Table 7).
The level of investment in the construction sector is another main variable used in the model,
thus, projections for the future investment level in the construction sector are also required to
make alternative projections, in particular, on the timber product markets. In general, a clear
linear relationship can be found between the level of GDP and the level of investment in the
construction sector, suggesting that the two variables are proportional to each other. Such a
linear relationship between the two variables can be seen from historical trends over the
period 1970 to 2004 also in Korea (Kwon and Choi, 2006). Therefore, scenarios for optimistic
and pessimistic levels of investment in the construction sector were set in the same manner as
alternative scenarios were set for GDP growth.
Table 25. Scenarios for annual growth rate of GDP and investment in the construction sector
GDP
Investment in the construction sector
2006-2010 2011-2020 2006-2020
Alternative scenario
Optimistic 5.5% 4.9% 2.4%
Pessimistic 4.3% 3.7% 1.8% Base case scenario 4.9% 4.3% 2.1%
Changes in real income and investments in the construction sector will result in changes in
consumption of forest products, leading to changes in real prices. Accordingly, changes in
real income and the investments in the construction sector will affect all projected variables.
Nevertheless, this study assumed that there would be no changes in real prices of forest
products over the projection period.
Table 24 shows the effect of alternative scenarios for the growth of GDP and investments in
the construction sector. The alternative scenarios greatly influence the timber and NWFP
markets and recreation demand. In all forest product markets, the optimistic scenario raises
consumption and net imports. The impacts of the pessimistic scenario are similar to that of the
optimistic scenario in terms of the scale, but in the opposite direction.
The optimistic scenario has the most significant impact on consumption of hardwood lumber.
The optimistic scenario raises consumption of lumber by 3.6 to 12.4 percent and consumption
of other timber products by about 1 to 4 percent by 2020. Imports of timber products rise
significantly with no change in production, which is because of the assumption that there is no
change in the real prices. However, higher consumption leads to increases in the real prices,
which raises domestic production, partially satisfying increased consumption.
In the NWFP markets, consumption of walnuts and pine nuts is most sensitive to GDP growth.
The optimistic scenario for growth of GDP increases consumption of walnuts by 2.8 to 8.2
percent and consumption of pine nuts by 0.8 to 3.2 percent. Similar to the timber product
market, imports are significantly influenced by the alternative scenario. Recreation visit days
and the number of recreation visits rise by 0.9 to 2.5 percent and 2.1 to 5.8 percent,
respectively, due to higher level of GDP.
Market liberalization
In the WTO/DDA trade negotiations, timber products are covered in Non-Agricultural Market
Access and NWFPs in the agricultural negotiations. Issues in market access include the
formula for tariff reductions, base rate of duty, sensitive products, and implementation period.
The views and positions of Members on the issues are very diverse based on their individual

APFSOS II: Republic of Korea
78
interests and specific circumstances. In this study, a scenario for market liberalization was
developed based on the draft modalities proposed by Chairs and informal and formal
proposals and statements presented by Members throughout negotiation meetings. It was
assumed that tariffs are reduced from 2010 according to the formulas for tariff reductions for
developed countries proposed by the Chairs, and tariffs for timber products are eliminated by
2020 and for NWFPs by 2030.
The final bound rates for timber products are calculated using the Swiss formula. Tariffs are
reduced to the final bound rate of the year 2014 in five equal rate reductions and then
eliminated in equal annual tariff reductions by 2020. Table 26 shows the tariff reduction
scenario for timber products.
Table 26. Tariff reduction scenario for timber products
Base rate (%) Final bound rate (%)
2014 2020
Sawnwood 10.0 4.4 0.0
Plywood 13.0 6.4 0.0
PB and fiberboard 8.0 6.2 0.0
Note: 1. Current applied rates for softwood logs, paper and paperboard are zero.
2. Current applied rate for plywood with the thickness of 6 mm or lower is 8 percent
but the share of plywood 6 to 12 mm thick is so high that 13 percent is assumed as
the base rate.
Table 27. Tariff reduction scenario for non-timber forest products
Base rate (%) Final bound rate (%)
2014 2020 2030
Chestnut 219.4 59.2 37.0 0.0
Pine nut 566.8 153.0 95.6 0.0
Jujube 611.5 165.1 103.2 0.0
Walnut 45.0 18.0 11.3 0.0
Oak mushroom 90.0 24.3 15.2 0.0
The final bound rates for NWFPs are calculated in each band using the tiered formula for
developed countries. The tariffs are reduced in equal annual installments for the final rates of
the year 2014 and then eliminated in equal annual tariff reduction by 2030. Table 27 shows
the tariff reduction scenario for major NWFPs.
Table 24 summarizes the impacts of market liberalization. Market liberalization scenarios
have significant impacts on the forest product markets. In particular, since the markets for
chestnuts, pine nuts and jujubes were opened with very high tariff rates as a result of the UR
agricultural negotiations, the impacts on NWFP markets are much greater than on timber
markets.
Market liberalization most significantly influences the hardwood lumber market. However, its
market scale is relatively small compared to other product markets so the impact is not so
great in terms of volume traded. Consumption of fiberboard and PB is also greatly influenced.
Consumption of fiberboard and PB rises by 1.9 to 10.3 percent and by 1.0 to 5.1 percent,
respectively. Tariff reductions generally reduce domestic production of products. However,
domestic production of hardwood lumber rises because the impact of drops in the real price of
hardwood logs due to lower demand is much greater than the impact of drop in real price of
hardwood lumber on the domestic production of hardwood lumber. Imports of products rise
rapidly, further intensifying the dependency on overseas markets. Market liberalization
reduces the domestic production of products except for hardwood lumber, resulting in
reductions of consumption, production and imports of softwood logs. However, the impact on
the log markets is much lower than on the product markets.

APFSOS II: Republic of Korea
79
In the NWFP markets, market liberalization has larger impacts on consumption than on
production except for oak mushrooms. In particular, the chestnut market is most significantly
influenced by market liberalization. Consumption of chestnuts rises two times by 2020,
coupled with declining production, resulting in Korea’s switch from net exporter to net
importer of chestnuts. Consumption of jujubes also rises rapidly. Production of all tree nuts is
reduced by market liberalization, intensifying dependency on imports. In the oak mushroom
market, market liberalization has greater impacts on production rather than consumption.
Thus, unlike other NWFPs, imports rise due to declining domestic production.

APFSOS II: Republic of Korea
80
5. CONCLUSION AND RECOMMENDATIONS
Major results
The forest area declined by 218,000 ha from 6,612,000 ha in 1970 to 6,394,000 ha in 2005.
Rapid economic growth along with industrialization and urbanization led to increased demand
for land for housing, plants and roads. To meet these increased demands, forestlands were
converted to other land uses. The forestlands continue to decline due to the construction of
roads, buildings, and golf courses in recent years. However, the annual net conversion area of
forestland is gradually decreasing. Recently, marginal agricultural land and abandoned
grasslands within forests have been converted back to forestlands due to natural regeneration
of vegetation.
The forests were devastated when Korea was liberated from the Japanese colonial rule in
1945. At that time, growing stock per ha was around 8 m3. Through the chaos period after
liberation and the Korean War, almost all forests were devastated. The growing stock per ha
was merely 10 m3 even until 1970. Therefore, the most urgent task was to rehabilitate
degraded forests. The government’s large-scale reforestation plans were launched from 1973.
Almost all forestlands were recovered by the end of the 1980s due to the successful
implementation of the reforestation projects. Accordingly, the growing stock has continued to
increase, amounting to 79 m3 in 2005.
Rapid economic growth, population increase and growth of the construction sector resulted in
increased demand for timber products. Consumption of all timber products except hardwood
lumber has increased rapidly.
Consumption of softwood lumber has increased by 5.4 percent per over the past 35 years,
reaching 4.0 million m3 in 2005. Production of softwood lumber rose along with consumption,
reaching 3.8 million m3 in 2005. Imports of softwood lumber have increased since the 1990s.
In 2005, Korea imported 400,000 m3 of softwood lumber, or 10 percent of the total
consumption. Consumption of hardwood lumber was 2.1 million m3 in 1989 but continued to
drop to 480,000 m3 by 2005. Production of hardwood lumber declined from 1.5 million m
3 in
1989 to 200,000 m3 in 2005. Reduction in consumption and production of hardwood lumber
resulted from difficulties in securing hardwood logs from overseas. Imports of hardwood
lumber started to increase from 1980. It reached its peak at 1.0 million m3 in 1993 and then
continued to decline to 290,000 m3 in 2005.
Consumption of wood-based panels increased by 15.1 percent per year from around 40,000
m3 in 1970 to 5.5 million m
3 in 2005. Until the mid-1980s, plywood accounted for most of the
consumption of wood-based panels. However, as it was replaced by PB and fiberboard in the
furniture industry, consumption of plywood dropped to 2.0 million m3, the level of the early
1990s. In contrast, consumption of PB and fiberboard has risen rapidly since the mid-1980s.
In 2005, of the total wood-based panel consumption of 5.5 million m3; plywood accounted for
34 percent, fiberboard 37 percent and PB 29 percent. Production of plywood increased to 2.6
million m3 by 1978. Most of the plywood produced was exported until the late 1970s.
However, production has fallen to the current level of 635,000 m3 due to the difficulty in
securing hardwood roundwood. Production of PB started to increase from the mid-1980s,
currently amounting to between 850,000 to 900,000 m3. Production of fiberboard also started
to increase after the mid-1980s, reaching the peak at 1.7 million m3 in 2005.
Due to increased production of paper and paperboard, consumption of pulp increased about
12 times from 250,000 tons in 1970 to 3,015,000 tons in 2005. However, the growth rate has
been declining. Consumption of chemical pulp continued to rise rapidly while consumption of
mechanical pulp declined rapidly. Growth in pulp consumption led to rapid increase in pulp
imports. As a result, the share of imported pulp of the total pulp consumption has increased
APFSOS II: Republic of Korea
81
from 68 percent in 1970 to 83 percent in 2005.
Due to increased production of timber products, consumption of roundwood has also
increased. Consumption of industrial roundwood rose to its historical peak of about 10 million
m3 in 1978 and then dropped to 7 million m
3 in the mid-1980s. Afterwards, it fluctuated in the
range of 7 to 8 million m3, maintaining the level of around 8.5 million m
3 now. Domestic
wood supply was insufficient to meet the increasing demand due to immature forest resources.
Therefore, the demand for roundwood for lumber and plywood had to be met by imports from
overseas. Imports of roundwood have increased rapidly, accounting for half of the total
roundwood consumption in the 1950s. The share rose to 70 percent at the end of 1960s and
dependency on imported roundwood further deepened in the 1970s according to expanding
economic scale driven by economic growth and increasing exports of plywood to the USA. In
the late 1970s, the share of imports increased to 90 percent of total roundwood consumption.
The supply structure which has largely depended on imported wood was very vulnerable to
the changes in roundwood export policies of exporting countries. The plywood industry
collapsed due to the export ban on roundwood from Indonesia in 1980. As the export
regulation policies on roundwood spread to other exporting countries in South-East Asia,
imports of hardwood roundwood dropped rapidly. As the USA imposed a partial export ban
on logs from 1992, imports of softwood roundwood from the USA dropped as well and Korea
had no choice but to change the supplier countries to New Zealand and Russia. Domestic
wood-processing companies lost international competitiveness because of an increase in
manufacturing costs caused by difficulties in securing raw materials and higher wages. Since
1990, imports of timber products have increased rapidly, amounting to about 70 percent of the
total wood consumption in roundwood equivalent.
In 2005, the estimated total roundwood equivalent for consumption was 22.9 million m3.
About 2.4 million m3 is supplied from domestic forests and 20.5 million m
3 are imported from
overseas. Of roundwood equivalent of imports, 6.3 million m3 are industrial roundwood and
the rest, 14.2 million m3, is primary processed products including lumber, wood-based panels
and pulp. Imports of logs account for about 27 percent of total roundwood equivalent for
consumption and thus most of the consumption is met by imports of products.
Consumption of most NWFPs also grew steadily due to increases in population and income.
Consumption and production of chestnuts and jujubes has declined since the mid-1990s.
Consumption and production of pine nuts increased steadily. Except for chestnuts, exports of
tree nuts are negligible. About 30 percent of chestnut production is exported. Imports of
chestnuts, pine nuts and jujubes have gradually increased since markets were opened by
conclusion of the UR negotiation. However, the share of imports for consumption is not high;
14 percent for chestnuts, 11 percent for pine nuts and 5 percent for jujubes. Consumption of
walnuts rose rapidly but production somewhat declined and was relatively small. Thus,
imports of walnuts increased significantly, accounting for 90 percent of consumption.
Consumption of oak mushrooms rose rapidly along with production growth. The growth rate
of consumption exceeded that of production, leading to steady growth in imports to fill the
shortfall between production and consumption.
Demand for environmental services provided by forests rapidly increased. Social demand for
conservation of biodiversity and conservation of forest soil and water has increasingly
attracted people’s attention. Increased disposable income and leisure time, improved
infrastructure in rural areas, and an increase in the number of self-driving vehicles has
accelerated the demand for forest recreation. Recently, with greater interest in global warming,
interest in forests’ carbon storage function has risen. As forest resources were expanded
quantitatively and improved qualitatively, potential for supply of their environmental services
was enhanced greatly. Various policies to expand the supply of forest services are being
implemented as well.
APFSOS II: Republic of Korea
82
Population will continue to rise until 2020. GDP growth and investment in the construction
sector are also projected to increase over the next 15 years. However, the growth rate will be
lower than in the past. Population will reach its peak in 2018 and then is projected to decline
by 2020. The annual growth of GDP is expected to drop from 4.5 percent to 4.3 percent in
2020. The growth rate of investment in the construction sector is projected to be lower than
the GDP growth rate and will increase by 2.1 percent per year over the projection period.
Based on these projections for exogenous factors, the forest area is projected to decline until
the mid-2010s and then increase through 2020. The forest area will decline gradually,
reaching the lowest point until the mid-2010s, and then rise to 6,382,000 ha in 2020. However,
if the government’s birth encouragement policy succeeds, the forest area is projected to
decline until 2020. In any scenario, the annual conversion area of forestlands will continue to
decline while the area converted from marginal agricultural and grasslands to forests is
expected to increase gradually.
Over the projection period, the growing stock will continue to increase due to the annual
increment exceeding the annual removals. The forest growing stock is projected to rise from
506 million m3 in 2005 to 727 million m
3in 2020. The growing stock per ha will increase
from 79 m3 in 2005 to 114 m
3 in 2020. The increment will continue to rise due to the existing
age class structure of forests. However, the annual increment will reach its peak in the mid
2010s, and then drop. The removals will gradually increase as more forest stands reach the
felling age, so the annual growth rate of the growing stock will be lower than in the past.
Consumption of timber products is expected to show stable growth. Among timber products,
consumption of wood-based panels will increase rapidly, while consumption of pulp will
increase relatively slowly. Over the next 15 years, the annual growth rate in consumption is
projected to be 1.2 percent for lumber, 2.0 percent for wood-based panels, and 0.3 percent for
pulp. The annual growth rate in production will be 1.1 percent for lumber, and 0.6 percent for
wood-based panels. Thus, imports will increase rapidly to meet the increasing share of
consumption through 2020.
The total roundwood equivalent of consumption of timber products is expected to rise by 1.0
percent per year over the next 15 years, to 26.5 million m3 in 2020. The share of pulp will
drop and the share of lumber and wood-based panels will rise accordingly. The volume of
logs from domestic forests is projected to increase by 1.8 million m3 between 2005 and 2020,
reaching 4.2 million m3 in 2020 due to increasing growing stock. The ratio of log production
to the roundwood equivalent of consumption will increase from 10 percent in 2005 to 16
percent in 2020, somewhat easing dependency on imports. Nevertheless, due to relatively
high dependency, the domestic market will be extremely sensitive to the changes in the
overseas market.
Future trends in consumption and production of NWFPs will vary by product. Consumption
and production of chestnuts are expected to remain stable at the current level. Consumption
and production of jujubes are expected to increase slightly from the current level.
Consumption of pine nuts and walnuts are projected to increase rapidly. However, production
of pine nuts will increase slightly while production of walnuts will somewhat drop.
Consumption of oak mushrooms is projected to rise rapidly but their production is projected
to somewhat decline.
Demand for forest services will increase even more and become diversified. Supply of forest
services will also rise due to increasing forest resources. To expand the supply of forest
services, the government has formulated and been implementing various plans including a
basic plan for forest biodiversity, projects for construction of green-dams and basic plans for
forest recreation and expansion of carbon sinks. These government policies will have
significant impacts on the supply of forest services in the future.

APFSOS II: Republic of Korea
83
Implications for sustainable forest management
Criteria and indicators for SFM could be used as a tool to monitor and assess sustainability of
forests at the national level. The Montreal Process, in which Korea participates, adopted
criteria and indicators (C&I) for SFM in 1995 and requires member countries to assess
implementation of SFM and report it voluntarily. The Montreal Process has seven criteria:
conservation of biological diversity (criterion 1); maintenance of productive capacity of forest
ecosystems (criterion 2); maintenance of ecosystem health and vitality (criterion 3);
conservation and maintenance of soil and water resources (criterion 4); maintenance of forest
contribution to global carbon cycles (criterion 5); maintenance and enhancement of long-term
multiple socio-economic benefits to meet the needs of societies (criterion 6); and legal,
institutional and economic frameworks for forest conservation and sustainable management
(criterion 7). The framework has 67 indicators. The indicators are used to measure an aspect
of the criterion either quantitatively or qualitatively over time. Here, some of the 67 indicators
were chosen to broadly review development of SFM and the forest sector’s contribution to
sustainable development.
Forest health can be measured using a number of indicators of vitality, such as forest fires,
attacks by pests and pathogens or other related indicators. Forest fires have recently increased
in frequency and damage from forest fires is getting larger in scale. Damage from pests and
diseases is also increasing. Damage from pine wilt diseases, pine needle gall midge and black
pine bast scale are steadily expanding. In addition, oak wilt disease attacks are occurring in
more regions following discovery in 2004. Forest fires and pests and diseases will continue to
occur, damaging the health and vitality of the forest ecosystem. However, it is almost
impossible to predict the occurrence of forest damage from forest fires, and forest pests and
diseases. Therefore, taking precautionary measures are critical to prevent the negative effects
on future forest resources.
In 2005, coniferous forests accounted for 43 percent, broadleaved forests 27 percent, and
mixed forest 30 percent. If mixed forest area is divided evenly into each forest type,
coniferous forest area accounts for 57 percent because the government policy focused on
establishing coniferous species plantations in the past. Recently, plantation area of
non-coniferous species is expanding and thus coniferous forest area is projected to decline
slightly, accounting for 55 percent in 2020. If proper management practices are not done in
coniferous plantations, the current even-aged coniferous forests will decline due to invasion
of broadleaved species. Korean forests are mostly rehabilitated secondary forests with the
initial and intermediate stages of ecological succession. Therefore, mature forests of over 60
years of age are rare. The existing age-class structure of mostly 30 years will change into the
one of 40 to 50 years. Accordingly, the area of mature forest will increase. Reduction in
coniferous forest area and increases in the mature forests will have positive impacts on the
conservation of biodiversity. The area of protected forests is also expect to increase,
positively affecting the conservation of biodiversity
Forest resources will greatly expand in quantity. In addition, the quality of forest resources
will be improved if the government-led intensive management is implemented as planned.
Projections for changes in forest area will be sensitively influenced by the government’s
policy on population and marginal agricultural lands. However, if the current trends in
population changes are sustained and policy on agricultural lands changes little, the forest
area will slightly decline from the current level of 6,394,000 ha to 6,372,000 ha by the
mid-2010s, and then slightly increase to 6,382,000 ha by 2020. The ratio of removals to
increment was about 19 percent in 2005 and is expected to increase to 30 percent in 2020.
However, growing stock will continue to increase due to increment exceeding removal.
Growing stock will increase from 506 million m3 in 2005 to 727 million m
3in 2020 and
growing stock per ha will grow from 79 m3 in 2005 to 114 m
3 in 2020. Therefore, the
APFSOS II: Republic of Korea
84
production capacity of the forest ecosystem will be either maintained or somewhat enhanced.
Production of roundwood will increase until 2020 because of expanded forest resources.
However, due to the increased production cost, production will not increase as much as
growing stock increase. Production of NWFPs is expected to remain roughly stable at the
current level. Owing to increase in the age of stand and intensive management, soil will be
developed further, leading to an increase in the forests’ water storage capacity from 18.8
billion tons in 2005 to 19.6 billion tons in 2020. Because of the continued investment
increases in forest recreation resources, expanding forest recreation opportunities will fulfill
increasing demand for recreation. Forests will play a more important role as a carbon sink due
to the expansion of forest resources. Therefore, socio-economic benefits provided by forests
will continue to rise.
In conclusion, if preventive measures are taken to prevent forest damage that degrades the
health and vitality of forests, and a system is introduced to achieve social consensus for
harmony between forest conservation and development, sustainability of forests will be
enhanced and the forest sector will further contribute to sustainable development.
Policy recommendations
The existing age-class structure tilted to a single tree age will change little over the projection
period. Such a structure is not desirable in conserving biodiversity and maintaining forest
sustainability. Long-term efforts are required to realign into a uniform age-class structure
through conserving old natural forests and adopting various felling ages and silvicultural
systems for the production forest.
Over the past decades, reforestation-oriented measures have been taken to recover degraded
forestlands as early as possible. Thus, follow-up management for reforested areas has not
been appropriately conducted. Investment in forestry has been dependent almost completely
on the government budget, so difficulties in securing a budget was a major cause of a failure
to invest in forest management. This situation has made forest resources extremely vulnerable
to the outbreak of pests and diseases as well as forest fires and is mentioned as one of the
reasons for recent increases in forest damage. In order to maintain the health of forests, policy
support must be strengthened for forest-tending projects implemented to curb the
unemployment problem arising in the aftermath of the financial crisis in 1977. Small-diameter
thinned logs are produced in substantial quantities from the forest-tending projects but they
are left within forests without being industrially utilized because of high harvesting and
transportation costs. Therefore, measures are urgently required to expand government support
for continuous implementation of intensive management and also to expand the use of
small-diameter thinned logs.
Smaller removal than increment and increases in the resources available for timber supply
present potential to increase sustainable roundwood supply. The high production cost is one
the biggest obstacles for roundwood production. The average forest area owned by private
individuals is so small that it is difficult to realize economies of scale in forest management.
In addition, there is a major lack of infrastructure such as forest roads and mechanization.
Thus, in order to realize such supply potentials to the actual market supply, technology
innovation must take place to enhance labor productivity in timber growing, harvesting and
processing. Since imported timbers are used most for raw materials in the wood-processing
industry, large-scale timber-processing companies are located near ports. Due to the location
of the wood-processing industry, it is highly costly to harvest trees and transport them to the
processing industry, which further weakens the competitiveness of Korean industry. It is
imperative to gradually locate the wood-processing industry in areas expected to produce
timber, enhancing the utilization of domestic wood and contributing to activation of the local
economy.
APFSOS II: Republic of Korea
85
Consumption of NWFPs will increase due to higher income levels and market liberalization
and thus competition in price and quality between domestic and imported goods will be even
fiercer in the domestic market. Production structure must be realigned by arranging the
cultivated land being neglected or extensively managed and by establishing infrastructure
including operation paths and mechanization. In addition, structural improvements must be
triggered to enhance competitiveness by selectively supporting and fostering forward-looking
forest professionals. Safety management systems must be in place by securing consumer trust
and by introducing quality management systems based on stringent quality management and
branding.
Demand for forest services will increase even more in the near future. However, a system
based on market mechanisms must be introduced in order to provide the desirable level of
forest services demanded by society. Private forest owners have about 70 percent of total
forest area. None of them will produce goods and services without any market value even
though those goods and services have social values. Forests are not common properties.
Private individuals have the right to use their own lands at their disposal. Thus, one solution is
to introduce a system in which beneficiaries pay the price for the environmental service
provided by forests in order to make them produce the socially desirable level of forest
services.
Up until now, environmental services provided by forests tend to be recognized as being
external to the market structure. Increased demand for environmental services of forests has
been met by merely depending on the government’s legal measures such as designation of
conservation areas and imposing regulations on land uses, or by depending on the voluntary
will of private forest owners to protect them. However, dependence on the government’s
legally binding power to maintain environmental functions is not effective because of
inefficient implementation and difficulties in securing consistent budgets. It is more
problematic that private forest owners might neglect management of their forests, possibly
losing environmental services that society intended to get. Thus, it is more effective to
introduce economic incentives in order to optimally produce environmental services provided
by forests. Economic incentives can solve the problem of public goods like forest services
through market mechanism. In addition, they have the advantage of promoting SFM as well
as by optimally producing forest services and increasing social welfare. Payment schemes for
environmental services can be a solution. The payment scheme makes users benefiting from
forest services pay the price directly, thereby generating additional revenues for forest
management, and inducing private forest owners to have an interest in producing
economically valuable environmental services. Since consumers have to pay the price for the
benefits they get, the scheme also induces rationality to reduce reckless consumption in using
forest resources.
Finally, in the conflict structure between economic development and environmental
conservation, harmony of the two must be pursued and social consensus systems must be
established to resolve and prevent conflicts. Recently, the conflict structure surrounding
forests has been expressed in various ways. Some argue that functions provided by forests
must be divided into two categories, those of economic function and environmental services,
and that forests must be dichotomously managed as economic forests and environmental
forests. At the same time, there are conflicts between the general public, putting priority on
environmental services in utilizing forest resources, and others, mostly forest owners,
focusing on the economic function. Sometimes, there are conflicts between policies on
economy and the environment. Thus, institutions and processes must be in place to manage
conflicts surrounding forests. While the 20th century was the era of the government, the 21
st
century will be that of governance. A framework of coexistence should be established through
constraint and cooperation among the government, markets and NGOs and a mechanism must
be created to manage conflicts that are multifaceted, diversified and democratized. To that
end, a capacity building program needs to be developed for environmental organizations in

APFSOS II: Republic of Korea
86
the center of conflicts and tensions so that they can participate in decision-making processes
and propose forest policy alternatives. Furthermore, in order to forge consensus and
cooperation throughout society, participation and cooperation among local people and NGOs
must be expanded and participation opportunities for local residents in planning process must
also be encouraged.
APFSOS II: Republic of Korea
87
6. REFERENCES
Bae, J.S. and K.B. Lee. 2006. Success Factors in Korea’s Reforestation –Substitution of
Household Fuel Wood and Large Scale Reforestation-. Korea Forest Research Institute
Research Report 06-17. pp.78. (in Korean)
Bae, J.S., K.B. Lee, and J. Ohgino. 2007. Reforestation Policies in 1970’s –First 10-Year
Reforestation Plan and Slash and Burn Field Restoration Project-. Korea Forest Research
Institute Research Report 07-11. pp.92. (in Korean)
Bae, J.S., Y.S. Kang, B.W. Rho, and R.W. Joo. 2001. History of Changes in Forest
Ownership in the Modern and Recent Times in Korea. Korea Forest Research Institute
Technical Report No. 182. pp.478. (in Korean)
Bank of Korea, Research Bureau. 2005. Causes for Weakened Growth Potentials of Korea’s
Economy and Future Prospects. Bank of Korea Monthly Statistics 682: 23-58. (in Korean)
FAO. 2006. Global Forest Resources Assessment 2005.
FAO. 2007. State of the World's Forests 2005. pp. 153.
Gardner-Outlaw, T and R. Engelman. 1997. Sustaining Water, Easing Scarcity: A second
update. Population Action International. pp.20.
Government-Private Collaborative Working Group. 2006. Korea’s VISION 2030. pp. 138. (in
Korean)
Johnson, C. Y. and J. M. Bowker. 1999. On-site wildland activity choices among African
Americans and white Americans in the rural south : Implication for Management. J. of Park
and Recreation Administration 17(1):21-39.
Joo, R.W. 1997. An Assessment of Domestic Timber Production Potential in the Republic of
Korea. FRI Journal of Forest Science 56: 100-107. (in Korean)
Joo, R.W., C.S. Kim, S.Y. Lee, B.H. Jung, and K.D. Kim. 2006. Changes in Forest Resources
and Trends in Supply and Demand of Forest Products; Time Series Statistical Data
1970-2005. Korea Forest Research Institute Technical Report No. 276. pp.200. (in Korean)
Joo, R.W., C.S. Kim, S.Y. Lee, J.S. Bae, B.H. Jung, K.H. Lee, K.H. Kim, E.G Kim, K. Choi,
S.Y. Han, Y.C. Youn, J. Ohgino, K.B. Lee, H.J. Kim, and K.D. Kim. 2007. Development of
an Integrated Model to Project Long-Term Supply and Demand of Forest Resources. 2006
Research Business Report (Forest Management, 5-3). pp.294-483. Korea Forest Research
Institute. (in Korean) Joo, R.W., S.Y. Lee, and H.S. Jeon. 1998. Future Projection of Trends in Logs, Sawnwood
and Plywood Markets in the Republic of Korea. FRI Journal of Forest Science 58: 93-103.
(in Korean)
Jung, B.H., E.G. Kim, and S.Y. Lee. 2003. An Analysis of Korean Consumer and Preferences
for Oak-Mushroom. Korean Journal of Forest Economics. 11(2):15-22.
Jung, B.H., S.Y. Lee, and R.W. Joo. 2005. Issues on Agricultural Negotiations of WTO/DDA
and Strategies for Non-timber Forest Products. Korea Forest Research Institute’s Research
Technical Report No. 254. pp.116. (in Korean)
Jung, B.H., S.Y. Lee, R.W. Joo, and E.G. Kim. 2004. Distribution Structure and Supply and
Demand of Major Non-timber Forest Products. Korea Forest Research Institute Research
Report 04-09. pp.113. (in Korean)
Kim, S.K. A.J. Jo, Y.K. Kim, O.H. Kang, M.J. Kim, H.K. Kwag, Y.J. Lee, S.H. Jo, J.H. Park,
and W.D. Sun. 2003. Development of population policies and Pan-government driven
system to control low fertility. Policy paper 2003-26. Korea Institute for Health and Social
Affairs. Ministry of Health and Welfare. (in Korean)
Kim, C.S. and R.W. Joo. 2004. Underlying Causes of Decrease in Imported Timber Price for
the First Half of 2004. Korean Journal of Forest Economics 12(1): 1-11. (in Korean)
Kim, E.G., B.H. Jung, and D.H. Kim. 2000. A Study on the Distribution Channels and Farm
Marketing System of Non-Timber Forest Products. Korean Journal of Forest Economics
8(1):11-27.
Kim, J.J., B.I. Yoo, S.I. Kim, T.I. Kim, R.W. Joo, and R.H. Yoo. 2003. Korea’s Forest
Recreational Status and Demand Projections. Korea Forest Research Institute Research
Report 03-10. pp.248. (in Korean).
APFSOS II: Republic of Korea
88
Kim, J.S., K.H. Kim, and Y.H. Jeong. 2003. Effects of Forest Tending for Augmentation of
Water Resources in the International Year of Fresh Water. Journal of Korean Forest Society
92(3): 161-167. (in Korean)
Korea Forest Policy Society. 1968. 30-year History of Forest Conservation and Reforestation.
pp.717. (in Korean)
Korea Forest Service. 1997. Korea’s 50-Year Forest Policy History. pp.1011. (in Korean)
Korea Forest Service. 1999. Comprehensive Management Plan for Watershed Conservation
in Five Major Rivers (Phase II). pp.577. (in Korean)
Kwon, O.H. and Choi, M.S. 2006. Future Prediction 2015, Future Market of Korean
Construction Industry. Construction & Economy Research Institute of Korea. pp.244. (in
Korean)
Lee, C.Y., K.H. Kim, and H.K. Won. 1992. A Study on Quantification of Environmental and
Social Beneficial Functions of Forests(Ⅱ) -Watershed Conservation-. Ministry of Science
and Technology. pp. 63-82. (in Korean)
Lee, S.Y. and R.W. Joo. 2005. Recent Trends in WTO/DDA Negotiations on Timber Products
Trade. Korea Forest Research Institute Technical Report 248. pp.137. (in Korean) Ministry of Environment. 2007. Environmental Statistics Yearbook 2007. pp. 704. (in
Korean)
National Institute of Environment Research. 2005. Widlife Survey. NIER No. 2006-16-761.
pp. 135. (in Korean)
Ohta et al. 1996. Forestry Encyclopedia. Zen, Inc. (in Japanese)
Park, J.R., Y.K. Park, J.W. Choi, and G.D. Kim. 2000. Crisis of Construction Industry and
Pending Recommendations. Samsung Economic Research Institute CEO Information 270.
pp.25. (in Korean)
Rudis, V. A. 1987. Recreational Use of Forested Areas by Alabama Residents. USDA Forest
Service Southern Forest Experiment Station Research Paper So-237.
Shon, C.H. and C.S. Jang. 2001. Supply and Demand Trends of Domestic Chestnut and
Midterm Forecasting. Korean Journal of Forest Economics 9(1):59-69. (in Korean)
Son, Y.M., K.H. Lee, S.D. Kwan, and W.K. Lee. 2005. Systems to Evaluate and Predict
Forest Resources of Major Tree Species. Korea Forest Research Institute Research Report
04-01. pp.125. (in Korean)
Song, B.M. and J.H. Ryu. 1999. A Study on the Conversion Status of Forest by the Change of
Forest Land Use System in Korea. Korean Journal of Forest Economics. 7(2): 32-51. (in
Korean)
Yang, I., S.Y. Lee, R.W. Joo and Y.C. Youn. 2007. Factor Affecting Lumber Conversion
Rate of Sawmill Industry in South Korea. Journal of Korean Forest.Society.96(2): 197-202.
Youn, Y.C. and E.G. Kim. 1993. A Study on Long-Term Projections on Production of and
Demand for Major Non-timber Forest Products and Policy Recommendations. Korea Forest
Service. pp.213. (in Korean)