Embed Size (px)
Citation preview

REPUBLIC OF KENYA
Annual Water Sector Review 2014/2015 –2015/16
Ministry of Water and Irrigation
Nairobi November 2016
2 MINISTRY OF WATER AND IRRIGATION
This report was compiled by the AWSR Taskforce in the Ministry of Water and Irrigation. Its members are:
Eng. Fidelis Kyengo Mr Thomas Simani Mr Nguma Kani Mr Daniel Kimani Mrs Elishiba Mutegi Mr David Thiong’o Mr Naftali Abuya Mr David Bosuben Mr Elly Yaluk Ms Georgia Musau Mrs Dorris Kirui-Kubasu Eng. Patrick Onyango
Published by the Ministry of Water and Irrigation
PO Box 49720 00100 – Nairobi, Kenya
www.water.go.ke
ANNUAL WATER SECTOR REVIEW 2014/2015 - 2015/2016 3
TABLE OF CONTENTS
LIST OF FIGURES ............................................................................................................................................................. 4
LIST OF TABLES................................................................................................................................................................ 5
LIST OF ABBREVIATIONS .............................................................................................................................................. 6
FOREWORD ....................................................................................................................................................................... 7
ACKNOWLEDGEMENT .................................................................................................................................................. 9
REMARKS BY COUNTY GOVERNMENTS .............................................................................................................. 10
EXECUTIVE SUMMARY ............................................................................................................................................... 12
1. INTRODUCTION ................................................................................................................................................. 16
2. WATER SECTOR ALIGNMENT, COORDINATION, CAPACITY BUILDING AND RESEARCH ....... 21
2.1 Alignment ................................................................................................................................................. 21
2.2 Coordination ........................................................................................................................................... 26
2.3 Capacity building and research ....................................................................................................... 36
3. WATER SECTOR FINANCIAL OUT-TURN ................................................................................................... 40
3.1 Overview ................................................................................................................................................... 40
3.2 Sector funding in 2014/2015 –2015/16 ........................................................................................ 42
3.3 Pending bills ............................................................................................................................................ 52
3.4 Key challenges and recommendations ........................................................................................ 53
4. PERFORMANCE PROGRESS OF THE SUB-SECTORS .............................................................................. 54
4.1 Water Resources .................................................................................................................................... 54
4.2 Water Services......................................................................................................................................... 66
4.3 Land Reclamation .................................................................................................................................. 89
4.4 Water Storage and Flood Control ................................................................................................... 94
4.5 Irrigation and Drainage ...................................................................................................................... 100
5. CROSS-CUTTING ISSUES .............................................................................................................................. 108
6. CONCLUSION ................................................................................................................................................... 113
ANNEXES ...................................................................................................................................................................... 115
4 MINISTRY OF WATER AND IRRIGATION
LIST OF FIGURES
Figure 1.1: Institutional set-up of the water sector created by the Water Act 2002 .................................... 17 Figure 1.2: Institutional set-up of the water sector created by the Water Act 2016 .................................... 17 Figure 1.3: Structure of the MWI .................................................................................................................................. 18 Figure 2.1: Share of investments by CSOs in 2014/15 ........................................................................................... 30 Figure 3.1: Growth in original sector budget from 2006/07 to 2015/16 ......................................................... 40 Figure 3.2: Actual budget receipts from 2006/07 to 2015/16 ............................................................................. 41 Figure 3.3: Sources of sector funding at national level for 2015/16.................................................................. 42 Figure 3.4: Recurrent and development budgets at national level for 2015/16 ........................................... 43 Figure 3.5: Analysis of disbursement of DP funds at national level in 2015/16 ............................................ 44 Figure 3.6: Analysis of donor loans and grants at national level for 2015/16 ................................................ 44 Figure 3.7: Trends in loans and grants releases to the sector from 2010/11 to 2015/16 ............................ 45 Figure 3.8: Trend of donor disbursements to the sector ...................................................................................... 45 Figure 3.9: Sub-sector funding ..................................................................................................................................... 46 Figure 3.10: Total budget (revised) allocation by sub-sector from 2012/13 to 2015/16 ............................... 47 Figure 3.11: Development budget (revised) by sub-sector from 2012/13 to 2015/16 .................................. 47 Figure 3.12: Sources of actual funding for WSIs in 2015/16 ................................................................................... 49 Figure 3.13: Sources of actual funding for WSIs from national government in 2015/2016 ......................... 49 Figure 3.14: Six-year trend of funding to sector institutions ................................................................................. 50 Figure 3.15: Seven-year trend of internally generated funds (IGF) vs GoK funding ....................................... 51 Figure 3.16: Funding trend to the pro-poor basket (WSTF) ................................................................................... 52 Figure 4.1: Water permits ............................................................................................................................................... 59 Figure 4.2: Effluent discharge permits ....................................................................................................................... 60 Figure 4.3: Marsabit County aquifers .......................................................................................................................... 62 Figure 4.4: Turkana County aquifers ........................................................................................................................... 62 Figure 4.5: Underserved population in urban areas .............................................................................................. 68 Figure 4.6: Investment per capita by WSBs in urban areas in 2014/15 ............................................................ 68 Figure 4.7: Population with access to safe water nationally................................................................................ 69 Figure 4.8a: Urban coverage according to WSBs additional population served ............................................. 70 Figure 4.8b: Trend in urban water and sewerage coverage according to WASREB ....................................... 71 Figure 4.9: Rural population with access to safe water ......................................................................................... 71 Figure 4.10: Population with access to improved sanitation nationally ............................................................ 72 Figure 4.11: Urban population with access to improved sanitation ................................................................... 72 Figure 4.12: Rural population with access to improved sanitation ..................................................................... 73 Figure 4.13: National sewerage coverage ................................................................................................................... 74 Figure 4.14a: Urban sewerage coverage trends according to WASREB (actual connections) ....................... 75 Figure 4.14b: Urban sewerage trend according to additional population covered in WSBs (design
capacity sewerage systems) ..................................................................................................................... 75 Figure 4.15: Additional people covered through WSTF since 2008 in urban areas ........................................ 76 Figure 4.16: Investment in urban water services by WSB ....................................................................................... 81 Figure 4.17: O&M coverage and NRW level in urban utilities ................................................................................ 86 Figure 4.18: Trend of average tariff compared with tariff necessary for sustainability ................................. 86 Figure 4.19: Kenya land degradation map .................................................................................................................. 89
ANNUAL WATER SECTOR REVIEW 2014/2015 - 2015/2016 5
LIST OF TABLES Table 2.1: Key PC targets for the MWI 2015/16 ...................................................................................................... 24 Table 2.2: Sector coordination platforms................................................................................................................. 27 Table 2.3: Overview of beneficiaries of water supply and sanitation infrastructure projects ................. 30 Table 2.4: 2015 sector undertakings.......................................................................................................................... 34 Table 2.5: Training programmes at KEWI and number of students graduating .......................................... 37 Table 2.6: Research projects of KEWI in FY 2014/15–2015/16 ........................................................................... 38 Table 2.7: Outreach activities of KEWI 2014/15 and 2015/16 ........................................................................... 39 Table 3.1: Required investment as per SIP ............................................................................................................... 41 Table 3.2: Projects and programmes managed by the Ministry of Water and Irrigation for the financial
years 2014/15–2015/16 ............................................................................................................................. 46 Table 3.3: Actual funding of WSBs in 2014/15–2015/16 ..................................................................................... 48 Table 3.4: Summary of actual water sector institution funding in 2014/15–2015/16 ................................ 48 Table 3.5: Internally generated funds, by sector institution ............................................................................. 50 Table 3.6: Summary of pending bills (KSh millions) ............................................................................................. 52 Table 4.1: Summary of activities implemented by WRMA for the years 2014/2015 and 2015/16 ......... 56 Table 4.2 Revenues generated in FY 2014/15 ....................................................................................................... 57 Table 4.3: Summary of targets and achievements by category ........................................................................ 57 Table 4.4: Summary of the activities implemented by the regional offices .................................................. 58 Table 4.5: Water resources monitoring instruments ............................................................................................ 61 Table 4.6: List of upgraded stations ........................................................................................................................... 61 Table 4.7: Investment by WSBs in urban and rural areas in water services .................................................. 69 Table 4.8: Additional people covered by the WSTF since 2008 ........................................................................ 76 Table 4.9: County development budgets for FY 2013/14 and water-related development budgets
(KSh millions)................................................................................................................................................. 78 Table 4.10: Investments by counties in 2015/16 ...................................................................................................... 80 Table 4.11: Water services in counties in FY 2015/16 ............................................................................................. 82 Table 4.12: Counties and urban areas with sewerage services in FY 2015/16 ................................................ 83 Table 4.13: Challenges faced by counties in water services provision and way forward ............................ 87 Table 4.14: Land reclamation achievements at national level ............................................................................ 90 Table 4.15: Land reclamation achievements at county level ............................................................................... 91 Table 4.16: CETRAD achievements .............................................................................................................................. 92 Table 4.17: Summary of progress on reclaimed land from 2013/14 to 2015/16 ............................................ 92 Table 4.18: Progress achieved in multi-purpose dam development ................................................................. 94 Table 4.19: NWCPC activities in flood control in 2014/15 ..................................................................................... 96 Table 4.20: RDA water storage activities in 2015/16 ............................................................................................... 97 Table 4.21: Flood control and mitigation activities carried by NWCPC ............................................................ 98 Table 4.22: Achievements made by NWCPC in flood control and mitigation in 2015/16........................... 98 Table 4.23: Overall sub-sector performance ........................................................................................................... 102 Table 4.24: New irrigation and drainage projects in 2014/15 ............................................................................ 102 Table 4.25: New irrigation and drainage projects in 2015/16 ............................................................................ 103 Table 4.26: Capacity building in irrigation ............................................................................................................... 104 Table 4.27: Actual investments done in the sub-sector ....................................................................................... 107 Table 4.28: Funding of irrigation in FY 2014/15 and FY 2015/16 ...................................................................... 107 Table 5.1: PC targets for mainstreaming cross-cutting areas .......................................................................... 108
6 MINISTRY OF WATER AND IRRIGATION
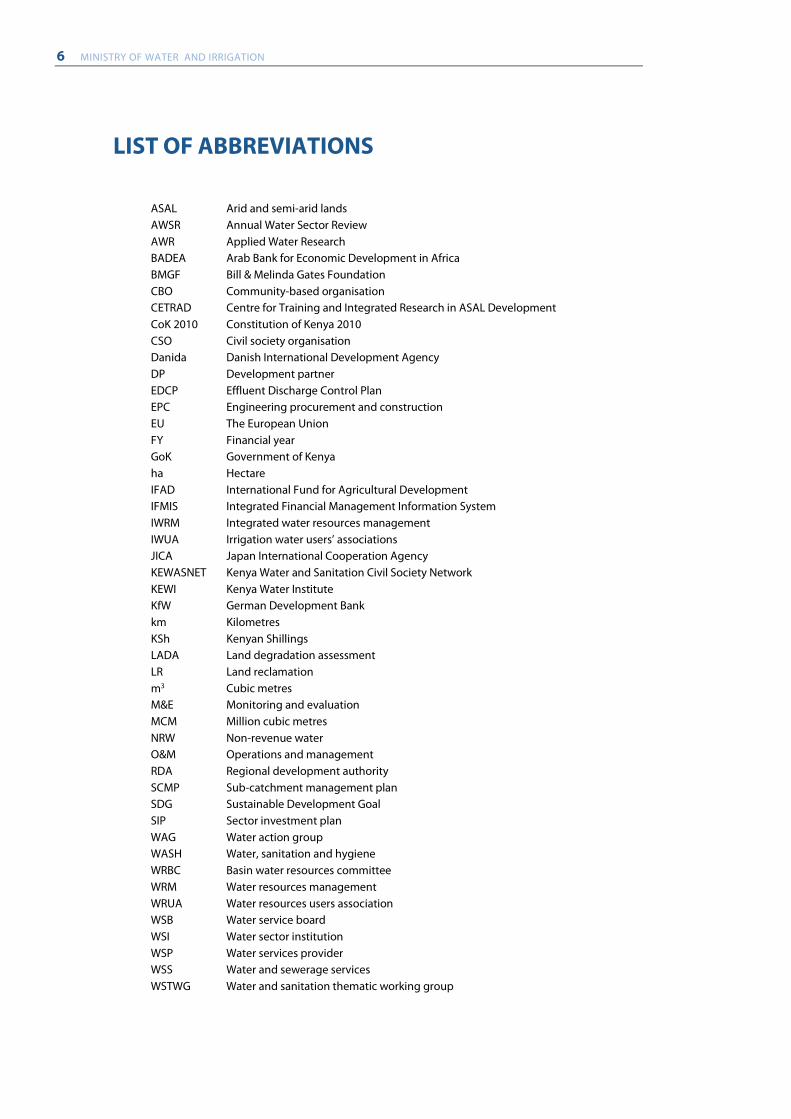
LIST OF ABBREVIATIONS
ASAL Arid and semi-arid lands AWSR Annual Water Sector Review AWR Applied Water Research BADEA Arab Bank for Economic Development in Africa BMGF Bill & Melinda Gates Foundation CBO Community-based organisation CETRAD Centre for Training and Integrated Research in ASAL Development CoK 2010 Constitution of Kenya 2010 CSO Civil society organisation Danida Danish International Development Agency DP Development partner EDCP Effluent Discharge Control Plan EPC Engineering procurement and construction EU The European Union FY Financial year GoK Government of Kenya ha Hectare IFAD International Fund for Agricultural Development IFMIS Integrated Financial Management Information System IWRM Integrated water resources management IWUA Irrigation water users’ associations JICA Japan International Cooperation Agency KEWASNET Kenya Water and Sanitation Civil Society Network KEWI Kenya Water Institute KfW German Development Bank km Kilometres KSh Kenyan Shillings LADA Land degradation assessment LR Land reclamation m3 Cubic metres M&E Monitoring and evaluation MCM Million cubic metres NRW Non-revenue water O&M Operations and management RDA Regional development authority SCMP Sub-catchment management plan SDG Sustainable Development Goal SIP Sector investment plan WAG Water action group WASH Water, sanitation and hygiene WRBC Basin water resources committee WRM Water resources management WRUA Water resources users association WSB Water service board WSI Water sector institution WSP Water services provider WSS Water and sewerage services WSTWG Water and sanitation thematic working group
ANNUAL WATER SECTOR REVIEW 2014/2015 - 2015/2016 7
FOREWORD The Ministry of Water and Irrigation (MWI) has been implementing water sector reforms since 2003, based on the legal framework set out by the Water Act 2002 and guided by the Sessional Paper No. 1 of 1999, which provided the policy direction. The core areas of the MWI are water resources management (water conservation and catchment areas protection), water services provision (water supply, sewerage services, on-site sanitation and faecal sludge management), support to land reclamation in the arid and semi-arid lands (ASAL), water storage, flood mitigation and irrigation development. The water sector started drafting a new water bill in 2011 to align the sector to the Constitution of Kenya
2010 (CoK 2010). The Water Bill (National Assembly Bill No.7 of 2014) was approved by the National Assembly in August 2016 after the final mediation process with the Senate. It was given assent by the President on 13th September 2016 and was gazetted as the Water Act 2016. The reforms under the Water Act 2002, which started in 2003, have brought great gains in the water sector. Among these gains are: the separation of policy-making from regulation and water services provision from water resources management; decentralisation of key functions from the national level to the regional level; establishment of autonomous sector institutions; creation of private-sector-like managed public utilities; and a stronger pro-poor focus. The reforms enabled the water sector to adopt the Human Right to Water as a guiding principle in 2006. With the alignment of the water sector to CoK 2010, the reforms made in the sector shall be safeguarded. The Ministry has established structures and platforms for increased stakeholder and consumer participation in decision-making and implementation processes, in an effort to combat sector challenges. The sector is still facing a number of significant challenges. These include rapid population growth and the high rate of urbanisation and industrialisation, which are creating increasing demand for water services in urban areas and pose a big threat to water resources management. Other challenges relate to inadequate sector data for rural areas, the poor performance of many utilities, high levels of non-revenue water (NRW) in many utilities (above 40%), poor governance practices, non-viable utilities, rampant informal service provision, inadequate enforcement of water resources regulations and a lack of clear mandates for actors in the storage sub-sector. In addition, the inadequate performance of the storage sub-sector has led to low national storage capacity and many incomplete water storage dams. There are also problems of unclear ownership of multi-purpose dams, which hinders their sustainability, insufficient sector coordination with the counties and sector planning that is not based on priorities and sector investment plans (SIPs). The sector is still experiencing low self-financing capacity and is dependent on government and development partner funds for investments. The improvement of service coverage in the sector is impeded by under-investment in water services. There is a growing annual investment gap which needs to be bridged in order to achieve universal access by 2030.
8 MINISTRY OF WATER AND IRRIGATION
Further sector reforms under the Water Act 2016 will focus on sustaining the gains of the reforms, improving water storage, strengthening regulation, creating viable utilities and improving sector planning. Sector coordination with the counties under devolved water services provision will be enhanced. Asset development and investment planning, which is currently done by the eight water service boards (WSBs), will undergo major reforms. The Ministry is putting measures in place to improve the sector performance based on the opportunities brought by the Water Act 2016. The sector is striving to ring fence all its revenues to contribute to the sustainability of the sector. All levies and fees charged on the use of public assets will be abolished to enhance sector financing and sustainability. With regard to water resources management, enforcement of water resource regulations should be strengthened to drastically reduce illegal abstractions, pollution, destruction of water catchment areas and emerging climate change threats. Data management in water resources will be improved to avail high-quality, reliable data for future planning and equitable allocation of water resources. The aim of the sector is to gradually achieve universal access by 2030. This can only be achieved through greater investment in water services. The Water Services Regulatory Board shall be empowered to guide the sector to achieve this. The Ministry is therefore focusing on resource mobilisation, innovative financing mechanisms and investment planning. The Water Sector Trust Fund (WSTF) has continued to be strengthened as the sector pro-poor financing institution. This is to enhance the financing of the development and management of water services in marginalised and underserved areas. The pro-poor initiatives by the WSTF will ensure the progressive realisation of the human right to safe drinking water and sanitation for all, in a non-discriminatory manner. The WSTF has reached over 2,500,000 people with safe water supply and over 350,000 people with improved sanitation since 2008. The sector is therefore striving to introduce integrated investment planning. The self-financing potential of the sector will be further developed. This should go hand-in-hand with an improvement in the quality of services provided to consumers to enhance their willingness to pay for the provided services. The Ministry, counties, sector institutions, development partners and civil society organisations should continue to work together to ensure that sector planning, financing and implementation are done in line with the sector objectives and according to set timelines. To this effect, the Ministry continues to provide the necessary national policy direction, legal framework and coordination platforms that will guide the sector towards the achievement of Vision 2030 water sector objectives.
Hon. Eugene L. Wamalwa Cabinet Secretary Ministry of Water and Irrigation
ANNUAL WATER SECTOR REVIEW 2014/2015 - 2015/2016 9
ACKNOWLEDGEMENT The Ministry has been publishing the Annual Water Sector Review report since 2006. This current report provides an overview of the progress made by the water sector in the financial years 2014/2015 and 2015/16. We are happy to present the annual sector review within Kenya Water Week, which brings together key stakeholders to review the sector’s progress and to agree on the way forward in improving the water sector. The deliberations during Kenya Water Week should focus on the achievement of Vision 2030 water sector objectives, Sustainable Development Goals (SDGs) and key indicators set by the sector. The Ministry puts a lot of effort into the preparation of this Annual Water Sector Review report to ensure that it meets the information needs of all key stakeholders. The report enables stakeholders to focus on areas where there are priority needs. We offer our sincere gratitude to the review task force team at the Ministry, which has collected data and compiled this report. We thank the departments in the Ministry, county governments and all the water sector institutions for providing the required information used to prepare the report. We also thank the Kenya Water and Sanitation Civil Society Network (KEWASNET) for coordinating data collection from various civil society organisations. Our sincere appreciation goes to our development partners who have continued over the years to support this review process. The counties became one of the key stakeholders in the water sector following the devolution of water services through CoK 2010. It is our hope that with the establishment of Kenyan Water Week, the county governments will be active in the preparation of this annual sector review report. The CoK 2010, Vision 2030 and SDGs compel the Ministry to strengthen its commitment towards the gradual realisation of universal access. This requires the state, sector institutions, civil society organisations and consumers to deliver on their obligations. A bottom-up planning process in the water sector, based on set standards for the national and county governments, is to be established. An enhanced planning approach will allow the sector to invest its resources more efficiently. Stakeholders should actively support the sector’s development and use this review as an opportunity to monitor and steer the sector’s progress. The active involvement of stakeholders can considerably enhance transparency and accountability in the sector. We wish you all a successful annual water conference and Water Week, with fruitful results.
Prof. Fred H. Segor Eng. Patrick N. Mwangi Principal Secretary Principal Secretary State Department of National Water Services State Department of Irrigation
10 MINISTRY OF WATER AND IRRIGATION
REMARKS BY COUNTY GOVERNMENTS The Constitution introduces fundamental changes to the water and sanitation sector. It places county governments at the centre of delivery of water and sanitation services, with the national government largely retaining policy formulation and regulation of the water and sanitation sector. The Fourth Schedule to the Constitution of Kenya Part 1 outlines the function of the National Government as “22. Protection of the environment and natural resources with a view to establishing a durable and sustainable system of development, including and in particular (c) Water protection, securing sufficient residual water, hydraulic engineering and the safety of dams; and…” While Part 2 outlines the county functions to include implementation of specific national government policies on natural resources and environmental conservation, including: (a) soil and water conservation …… It goes further to devolve county public works and services, including – (a) storm water management in built-up areas and (b) water and sanitation services. In the water sector, counties have prioritized most of their activities in:
• Ensuring commercial viability and financial sustainability of formalised WSPs within their area of jurisdiction and identifying suitable options to ensure adequate and cost-effective service delivery through the concentration of water supply and sanitation (WSS) services under licensed, commercial water service providers (WSPs) at county or cross-county level,
• Purchase of water rigs for sinking boreholes, • Construction of earth dams, water dams and water pans to increase water supply, • Rehabilitation of existing boreholes, • Drilling of new boreholes, • Purchase of water bowsers to ferry clean and safe water to residents who live far from
water sources, • Procurement of plastic water tanks for secondary and primary schools and for villages, • Piping and extension of water services, • De-silting of dams, • Upgrading of sewerage systems, e.g. upgrading of Kapsabet sewerage plant.
Throughout the counties, an additional 1,521 operational boreholes have been drilled, and 973 water pans and 52 mini-dams constructed. This is proof that counties are actually able to handle huge waterworks. These efforts by county governments have been able to increase water connectivity to an additional 500,000 households from the previous 1.6 million households. This is an average increase of 4.79%. This is no mean feat and counties should be supported to continue implementing the water provision mandate.
ANNUAL WATER SECTOR REVIEW 2014/2015 - 2015/2016 11
Unlike water and sanitation services (where the national government’s role is limited to policy and national regulation), the Constitution mandates the national government to not only set policies relating to environmental protection but to also engage in environmental protection that specifically includes “water protection, securing sufficient residual water, hydraulic engineering and the safety of dams”. The national government thus has both policy/regulatory powers as well as some implementation powers in the management and conservation of water resources. While it is clear from the Fourth Schedule that the national government has extensive powers over water resource management, water storage and catchment protection, the Constitution also envisages a role for county governments. Specific examples here include protection of springs and smaller water bodies at the county level. Given that county governments have constitutional powers to coordinate the participation of communities in terms of governance, all activities by water resource users associations (WRUAs) should be coordinated under county governments. Accordingly, the functions and the structures of WRMA must be rationalised to reflect the role and powers of county governments in water resource management.
HE Benjamin Cheboi Chairman Water, Forestry and Mining Council of Governors
12 MINISTRY OF WATER AND IRRIGATION
EXECUTIVE SUMMARY A major achievement during the financial year 2015/16 was the reading and approval of the Water Bill 2014 by both the National Assembly and Senate. The Water Bill 2014 was approved by both houses in August 2016. The Bill was subsequently enacted into law on 13 September 2016 and gazetted as the Water Act 2016. The Water Act 2016 has created a new legal and institutional framework for the water sector, which is aligned to CoK 2010. The Ministry and water sector players are now commencing its implementation. In addition, the Trans-boundary Water Management Policy has also been approved by the Cabinet, while the Irrigation Policy and Bill 2015 were submitted to Cabinet. A key challenge during the review period in relation to water sector alignment, transition and coordination was the delay in the enactment of the Water Bill 2014 after its approval by the National Assembly in August 2015. In addition, 33 counties did not submit the requested data and information required for the preparation of this annual sector review report. The sector has been operating under the old legal framework of the Water Act 2002. This has brought occasional conflicts between the role of counties and WSBs with regard to the provision of water services and infrastructure development. Conflict has particularly been experienced in the areas of investment planning and project implementation. Most of these issues can now be resolved following the enactment of the Water Act 2016. The eight WSBs are to be reorganised (if possible, to at least one Water Works Development Agency of the national government) to align them to CoK 2010. The new mandates are to be mainly focused on the implementation of national public works, as outlined in the Water Act 2016, and the preparation of integrated sector investment plans, supported with financing plans, covering all 47 counties and national government with regard to the required investments to achieve universal access by 2030. The agency should also provide capacity-building support to counties in the area of investment planning and water services provision, based on the demands of the counties. With regard to capacity building in the water sector, the Kenya Water Institute (KEWI) provided training to 335 artisans in 2014/15 and 1,066 artisans in 2015/16 in various water courses. It also conducted a number of research projects for the sector. The financial out-turn for the sector focuses on revised budgets and the actual disbursed funds based on the approved budgetary provisions. It broadly covers funds from national government and development partners (DPs), and internally generated funds which are monitored at the national level. The funds from counties and civil society organisations (CSOs) are documented separately. This is due to different finance monitoring systems for the water sector at county level. The CSO works are mainly based in the counties, while the monitoring of their funds is done separately by the respective CSO. The received actual budget for the water sector for the financial year (FY) 2014/15, at national level, was KSh 31.80 billion (development: KSh 28 billion and recurrent: KSh 3.80 billion). The received actual budget for the water sector at the national level in 2015/16 was KSh 33.55 billion (development: KSh 29.50 billion and recurrent KSh 4.05 billion). KSh 10 billion was received from development partners and KSh 18 from the Government of Kenya (GoK) in FY 2014/15. In FY 2015/16, KSh 27.4 billion came from DPs and KSh 6 billion from GoK. More GoK funds were received in 2014/15 because of the transfer of irrigation development to the ministry responsible for water. Funds received by the
ANNUAL WATER SECTOR REVIEW 2014/2015 - 2015/2016 13
sector as loans amounted to KSh 8.3 billion while grants amounted to KSh 1.7 billion in FY 2014/15. These funds were KSh 22.4 billion and KSh 5.0 billion, respectively, in FY 2015/16. Internally-generated funds within the sector were about KSh 3.6 billion in FY 2014/15 and about KSh 3.2 billion in FY 2015/16. Thus the total water sector investment in 2014/2015 at national level was approximately KSh 28 billion, which is about 10% of the required annual sector investment as per the Sector Investment Plan (SIP) of May 2014. The total water sector investment budget in 2015/16 was KSh 29.5 billion, which is about 10% of the required annual investment. A big financing gap still exists in the annual development budgets for the water sector. This requires urgent, innovative, resource mobilisation strategies. If it is not bridged rapidly, the sector may not achieve its Vision 2030 objective for universal access. Customers can contribute to the full cost of providing water services in urban areas so long as the services provided are reliable and of good quality. Operating costs can also be fully covered by consumers in rural areas to increase sector self-financing. Between FY 2014/15 and FY 2015/16 the water resources sub-sector developed and implemented 56 sub-catchment management plans with water resource users associations (WRUAs), established 21 sub-surface and sand dams, established, rehabilitated or upgraded 198 water resources monitoring stations and 10 water quality monitoring stations, established three basin flood management plans and conducted 12 abstraction and pollution surveys. Most abstraction and pollution surveys were not carried out due to lack of resources. A total of 32 effluent discharge permits had been issued by FY 2015/16. The Water Resource Management Authority (WRMA) raised revenues totalling KSh 815.2 million in FY 2014/15 and Ksh 851 million in 2015/16. The revenues were raised mainly from water use charges, water permits, laboratory use and sale of data. With regard to water services provision (water supply, sewerage and on-site sanitation services), good progress was made only in the development of water supply in urban areas in the financial years 2014/15 and 2015/16. Overall progress was diminished by high population growth and inadequate investment. Only a few projects were completed during FY 2014/15 and FY 2015/16 with many projects still under implementation. From data and information submitted by WSBs and WSTF, about KSh 14.265 billion (WSBs: KSh 12.315 billion; WSTF: KSh 1,950 billion) was invested in water, sewerage and on-site sanitation projects in FY 2014/15. By comparison, in FY2015/16, the equivalent investments made totalled approximately KSh 19.501 billion (WSBs: KSh 17.702 billion, WSTF: KSh 1.799 billion). These investments cover a combination of rehabilitation of existing infrastructure and implementation of new infrastructure. National water coverage increased by about 1%, from 55.9% to 56.9%, in FY 2014/15. There was an increase of 1.1% in 2015/16, bringing it to 58.0%. Water supply coverage in urban areas increased from 67% in 2014/15 to 68.3% in 2015/16. Rural water supply coverage increased by 0.8% from 49.4% to 50.2% in 2015/16. The national on-site sanitation coverage decreased by 0.5% from 66.9% in FY 2014/15 to 66.4% in FY 2015/16. The urban on-site sanitation coverage decreased by 0.7% from 72.1 % to 69.4% in FY 2015/16. Rural on-site sanitation coverage decreased by 0.4% from 64.5% to 64.1% in FY 2015/16. The national sewerage coverage was about 10.2% in FY 2014/15 and 10.5% in FY 2015/16. The number of people connected by utilities to sewerage was at 15% in FY 2014/15 according to WASREB. However, the urban sewerage coverage according to WSBs, based on design capacities, was 23.9% in FY 2014/15 and 24.7% in FY 2015/16. Rural sewerage coverage is still at 0%. Kenya is among the worst performing countries in Africa with regard to access to sewerage services. The
14 MINISTRY OF WATER AND IRRIGATION
investment in water supply and sewerage is not coping with population growth and the demand for services. More investment is urgently required to move the sector towards the 2030 objective of universal access. The Land Reclamation sub-sector was involved in dissemination of the Land Reclamation Bill and Policy, capacity building with the Centre for Training and Integrated Research in ASAL Development (CETRAD), reclamation of land in ASAL, and water pan and small dam construction. Water pans were built in collaboration with the Ministry of Devolution. The mandate for land reclamation has been devolved to counties but the county governments have not fully conceptualised and taken over these services. Land reclamation activities were done in Turkana, West Pokot and Garissa counties. A total of 4,193 hectares (ha.) of degraded land was reclaimed between FY 2013/14 and FY 2015/16. The major challenge is the absence of a policy and legal framework aligned to CoK 2010. Within the Water Storage and Flood Control sub-sector, activities were done to enhance the water storage capacity of the country and mitigate the threat of floods. The country has 180 million m3 of water storage capacity (comprising 3,800 small dams and 26 large dams). The required capacity is 3.4 billion m3. Water storage per capita is to be increased from 5 m3 to 16 m3 in 2030. The sub-sector however still lacks the policy, clear mandates, an investment plan and a financing strategy to steer investments towards this objective. Investment in storage infrastructure development is done without adequate coordination of the different agencies such as the National Water Conservation and Pipeline Corporation (NWCPC), regional authorities, WSBs, the Ministry of Devolution and counties. This is not effective, and the mandate should be legally transferred to one water sector institution. It is questionable why regional authorities in a different ministry (the Ministry of Devolution) are implementing large multipurpose storage projects for the water sector. Due to the confusion in mandates and therefore the lack of accountability, most storage facilities have been stuck at the feasibility stage with a lot of litigation delaying implementation. No tangible progress was realised in 2014/15 and 2015/16 with regard to large multi-purpose dam development. With regard to flood control, 9.65 km of dykes were raised along the rivers Nzoia and Nyando, while 3.26 km of new dykes were built in Homa Bay, Migori and Turkana counties to control the perennial flooding problem. Additional flood control works were done in Narok and Baringo counties. Within the Irrigation and Drainage sub-sector, a total 85,745 acres of land was brought under production for food security and employment creation in FY 2014/15 and FY 2015/16. This consisted of community irrigation projects (3,285 acres), NIB projects (61,460 acres), Turkana and Kerio Valley Basin (9,250 acres) and county projects (11,750 acres). The annual sector target of 100,000 acres has never been achieved. The major obstacle in the irrigation sub-sector is the lack of a policy and legislation, aligned to CoK 2010, to provide the legal framework for irrigation development in the country. A draft 2015 bill and policy are still at the cabinet level. Irrigation Development was allocated a huge part of the water sector budget in 2014/15 but the progress was, in general, not satisfactory.
ANNUAL WATER SECTOR REVIEW 2014/2015 - 2015/2016 15
The Ministry and sector institutions were able to implement activities on cross-cutting issues like good governance, HIV/AIDs, and gender and youth mainstreaming in the water sector, which are also documented in this report. In conclusion, the Ministry of Water and Irrigation has been actively following up on the core challenges identified in previous review reports. However, there are some constant impediments to progress in the sector, which include inadequate annual investment, weak governance, unclear mandates in the water storage and flood control sub-sector, and inadequate monitoring. Although strong action plans are in place, implementation and monitoring have not been adequate. The water sector, therefore, is still lagging with regard to the achievement of the Vision 2030 objective of universal access. The existing impediments urgently need to be remedied. The Ministry should, therefore, undertake the followings measures:
1. Ensure that the water sector is aligned to the Water Act 2016, 2. Establish a national investment and finance plan in accordance with the Water Act
2016, 3. Organise an annual review of the implementation of investment plan with DPs and
WSIs, 4. Establish a Water Works Development Agency, 5. Introduce appropriate measures to enhance self-financing within the sector, 6. Improve coordination within the sector with the counties, 7. Harmonise sector information systems at county and national level to ensure
uniformity, accuracy and quality in data collection and annual reporting, 8. Ensure the progressive realisation of the human right to safe water and sanitation for
all, 9. Promote efficiency in the sector by clustering all economically unviable utilities and
combining the eight WSBs to at least one national agency, 10. Enhance good governance in the water sector at all levels to improve overall
performance and achieve value for money, 11. Establish an aligned legal framework and policy for irrigation development and land
reclamation, 12. Ensure that the mandate for water storage and flood control is placed within one
water sector institution and is not fragmented among multiple ministries.
16 MINISTRY OF WATER AND IRRIGATION
1. INTRODUCTION
1.1 Background The Ministry of Water and Irrigation (MWI) was established by the Organisation of Government, Executive Order No.1 of May 2016. It was separated from the former Ministry of Environment, Water and Natural Resources (MEWNR). The Irrigation sub-sector was moved from the Ministry of Agriculture, Livestock and Fisheries to the MWI. The mandates of the MWI are:
1. Water resources management policy 2. Water and sewerage services policy management 3. Wastewater treatment and disposal policy 4. Water catchment area conservation , control and protection 5. Water quality and pollution control 6. Sanitation management 7. Management of public water schemes and community water projects 8. National irrigation policy and management 9. Water storage and flood control 10. Land reclamation/dams and dykes 11. Management of irrigation schemes 12. Mapping, designating and developing areas ideal for irrigation schemes
The MWI has to fulfil its mandates under the Constitution of Kenya 2010 (CoK 2010). The Ministry, therefore, started to align the water sector to the CoK 2010 in 2011 by drafting an aligned Water Policy and Bill. The Bill was published as Kenya Gazette No. 27 (National Assembly Bill No.7 of 2014) on 31 March 2014. The Bill was brought to the National Assembly in April 2014. By the end of 2014 it had gone through the 1st and 2nd readings and the parliamentary committee stage, with a wide stakeholder consultation. It went through the 3rd reading on 7 July2015 and was approved by the National Assembly. The Bill was then forwarded to the Senate in August 2015 since it touched on the mandates of the county governments for further scrutiny before its final enactment. It was enacted into law on 16 October 2016 and gazetted as the Water Act 2016. It repealed the Water Act 2002, which has been the legal framework for the water sector since 2002. An aligned Irrigation Bill 2015 and policy has been drafted and forwarded to the Cabinet. Some transitional processes were initiated and implemented to align the water sector to CoK 2010 in preparation of the new legal framework for the sector. The county governments took over the ownership of all existing water utilities, in line with devolution. The counties are in charge of water supply, sewerage and sanitation services. Most county governments do not have adequate capacity and resources to implement major investments in water supply, sewerage and sanitation services. WSBs are therefore continuing, during the transitional period, to implement long-term large infrastructure investments for water supply and sewerage. The counties are expected, in future, to prepare county water services investment and financing plans, which cover water supply, sewerage and sanitation. These will then be aggregated at the national level into a water sector investment and financing plan. The existing institutional framework created by the Water Act 2002, which has been used during the transition period, is shown in Figure 1.1.
ANNUAL WATER SECTOR REVIEW 2014/2015 - 2015/2016 17
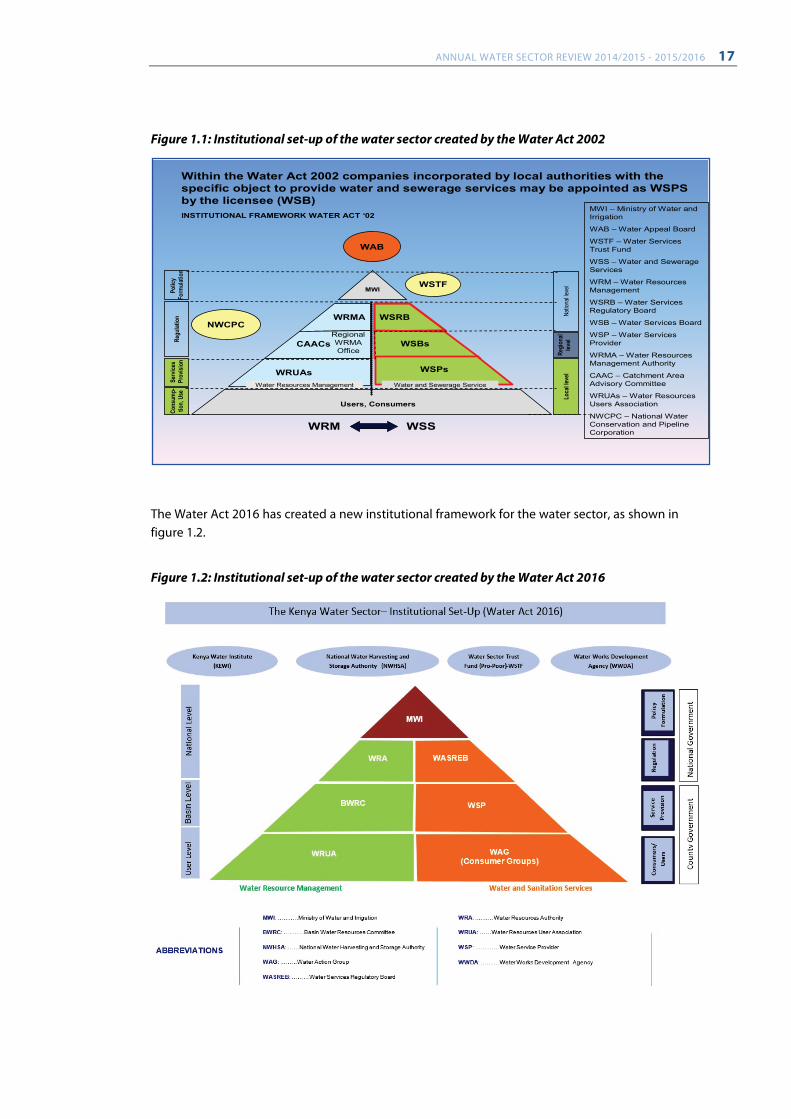
Figure 1.1: Institutional set-up of the water sector created by the Water Act 2002
The Water Act 2016 has created a new institutional framework for the water sector, as shown in figure 1.2.
Figure 1.2: Institutional set-up of the water sector created by the Water Act 2016
Within the Water Act 2002 companies incorporated by local authorities with the specific object to provide water and sewerage services may be appointed as WSPS by the licensee (WSB)INSTITUTIONAL FRAMEWORK WATER ACT ‘02
MWIPolic
y Fo
rmula
tion
Regu
latio
nSe
rvice
sPr
ovisi
on
Natio
nal le
vel
Regi
onal
level
Loca
l leve
l
Cons
ump-
tion,
Use
Water and Sewerage ServiceWater Resources Management
WSTF
WAB
WSRBWRMA
WSBsCAACs
WSPs
Users, Consumers
WRUAs
Regional WRMA Office
NWCPC
WSSWRM
MWI – Ministry of Water and Irrigation
WAB – Water Appeal Board
WSTF – Water Services Trust Fund
WSS – Water and Sewerage Services
WRM – Water Resources Management
WSRB – Water Services Regulatory Board
WSB – Water Services Board
WSP – Water Services Provider
WRMA – Water Resources Management Authority
CAAC – Catchment Area Advisory Committee
WRUAs – Water Resources Users Association
NWCPC – National Water Conservation and Pipeline Corporation
18 MINISTRY OF WATER AND IRRIGATION
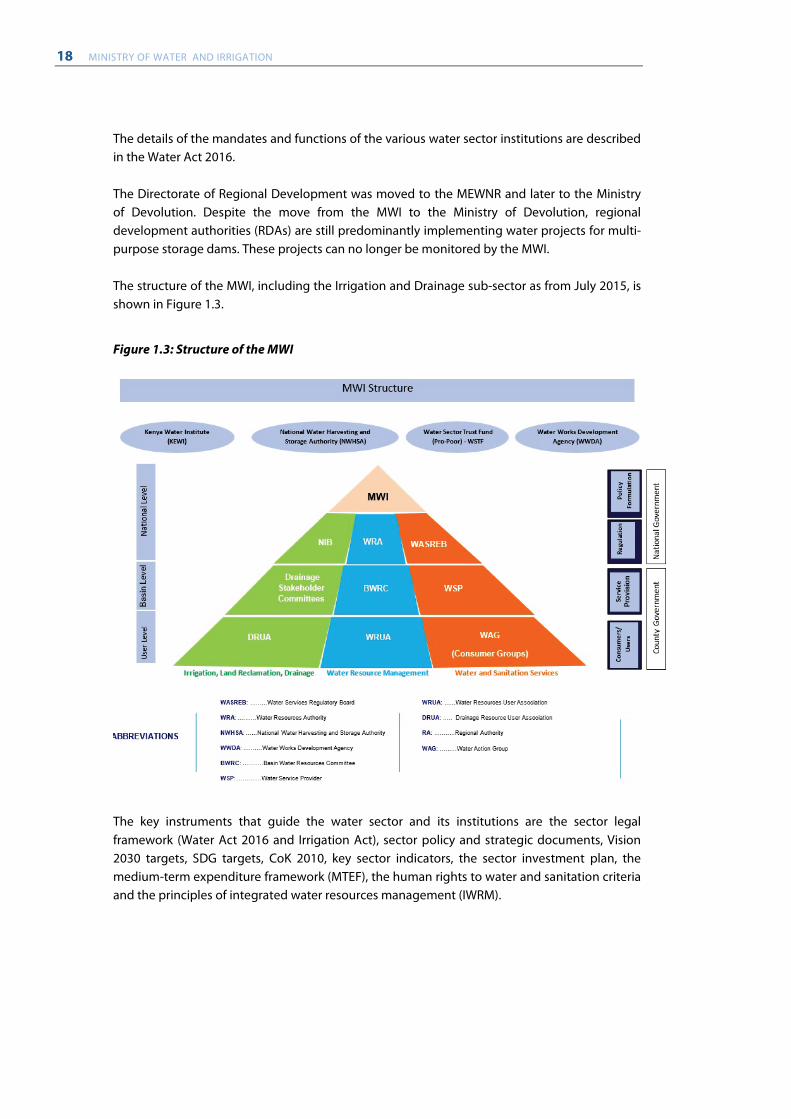
The details of the mandates and functions of the various water sector institutions are described in the Water Act 2016. The Directorate of Regional Development was moved to the MEWNR and later to the Ministry of Devolution. Despite the move from the MWI to the Ministry of Devolution, regional development authorities (RDAs) are still predominantly implementing water projects for multi-purpose storage dams. These projects can no longer be monitored by the MWI. The structure of the MWI, including the Irrigation and Drainage sub-sector as from July 2015, is shown in Figure 1.3.
Figure 1.3: Structure of the MWI
The key instruments that guide the water sector and its institutions are the sector legal framework (Water Act 2016 and Irrigation Act), sector policy and strategic documents, Vision 2030 targets, SDG targets, CoK 2010, key sector indicators, the sector investment plan, the medium-term expenditure framework (MTEF), the human rights to water and sanitation criteria and the principles of integrated water resources management (IWRM).
ANNUAL WATER SECTOR REVIEW 2014/2015 - 2015/2016 19
1.2 Purpose of the review The Annual Water Sector Review evaluates the progress of the sector based on the key sector indicators and targets set in policy and strategy documents within the prevailing legal framework. It outlines progress on the implementation of Vision 2030 flagship projects. The review has the following objectives:
• Secure political will for the water sector, • Inform stakeholders and the public on the progress towards gradual realisation of
rights to water services, Vision 2030 water sector objectives and changes within the sector, annually,
• Create a dialogue platform for sector stakeholders to review annual progress, • Identify the challenges faced by the sector and provide recommendations geared
towards improving the sector, • Increase transparency and good governance in the water sector, • Improve monitoring of sector performance based on key indicators, SIP and targets in
strategy documents, • Improve investment planning, resource mobilisation and funding in the sector.
The Annual Water Sector Review report is not a study document but uses the information and data which is available in the sector at the national and county level. It enables decision makers and development partners to plan and make informed decisions that should move the sector forward towards realising its objectives. The report gives information on legal and institutional development which is aligned to CoK 2010, budget allocation, actual investment, people served, the status of water services provision, water resources management, water storage, land reclamation, flood mitigation and irrigation schemes and projects. It should guide the sector towards targeted sector investment planning and how to get value for money by reaching more people with low per capita annual investment costs.
1.3 Scope of the review The review covers information and data from the sub-sectors (figure 1.3) in the MWI, water sector institutions, counties, civil society organisations and contributions from the development partners. It gives a country-wide perspective on the progress made in the financial years 2014/15 and 2015/16. Water sector activities done by the regional development authorities have not been included in this review because they are now under the Ministry of Devolution.
1.4 Reporting methodology The review task force, under the stewardship of the Water Sector Coordination Unit of the MWI, prepares questionnaires for counties, water sector institutions and relevant departments. KEWASNET prepares the questionnaires for civil society organisations (CSO). The questionnaires are then sent out to the counties (through the Council of Governors and county executive committees), water sector institutions, relevant departments of the MWI and CSOs for data compilation. They are given a period of one month to place the information and data in the
20 MINISTRY OF WATER AND IRRIGATION
questionnaires. Verification of data is done after one month through field visits by members of the task force to areas with specific problems. Collected data is analysed against key sector indicators and strategic sector documents. The results are presented in both table and chart formats in the annual review report. The questionnaires for civil society organisations are developed by KEWASNET in consultation with the task force team, counties and civil society organisations. They are then sent to the respective organisations for data and information compilation. The completed questionnaires are then sent back to KEWASNET after one month for analysis and documentation. Verification is done, where necessary, with the respective organisation and county government where the projects are implemented. A summary of the key water sector information from CSO is integrated into the Annual Water Sector Review report.
1.5 Limitations of the review report i. Some sector institutions, especially the National Irrigation Board (NIB) and the National
Water Conservation and Pipeline Corporation (NWCPC), and counties do not submit data and information on time, thus causing delays in report preparation,
ii. Some sector institutions have not taken the annual review seriously (e.g., NIB, NWCPC) and do not give it the importance it deserves,
iii. Data submission from counties is still a challenge, iv. Data collection and verification from civil society organisations is a new process and
experience is still lacking, v. Weak data collection and management practice in some of the water sector
institutions and in the counties limits the availability and accuracy of data, vi. Inadequate budget monitoring and investment planning tools constrain reporting on
investments or expenditures vis-à-vis the actual funds received by the sector, vii. Inadequate financial resources at the national level limit the opportunity for follow-up
field visits to verify data and improve accuracy and quality.
ANNUAL WATER SECTOR REVIEW 2014/2015 - 2015/2016 21
2. WATER SECTOR ALIGNMENT, COORDINATION, CAPACITY BUILDING AND RESEARCH
2.1 Alignment
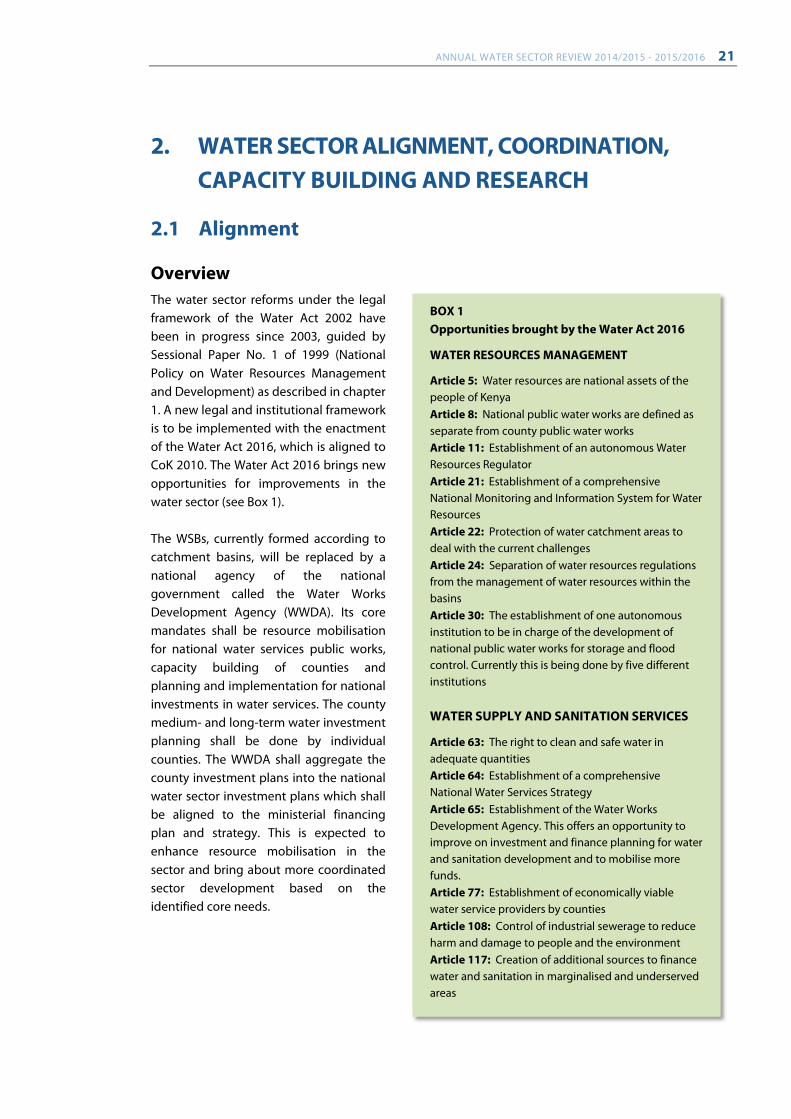
Overview The water sector reforms under the legal framework of the Water Act 2002 have been in progress since 2003, guided by Sessional Paper No. 1 of 1999 (National Policy on Water Resources Management and Development) as described in chapter 1. A new legal and institutional framework is to be implemented with the enactment of the Water Act 2016, which is aligned to CoK 2010. The Water Act 2016 brings new opportunities for improvements in the water sector (see Box 1). The WSBs, currently formed according to catchment basins, will be replaced by a national agency of the national government called the Water Works Development Agency (WWDA). Its core mandates shall be resource mobilisation for national water services public works, capacity building of counties and planning and implementation for national investments in water services. The county medium- and long-term water investment planning shall be done by individual counties. The WWDA shall aggregate the county investment plans into the national water sector investment plans which shall be aligned to the ministerial financing plan and strategy. This is expected to enhance resource mobilisation in the sector and bring about more coordinated sector development based on the identified core needs.
BOX 1 Opportunities brought by the Water Act 2016
WATER RESOURCES MANAGEMENT
Article 5: Water resources are national assets of the people of Kenya Article 8: National public water works are defined as separate from county public water works Article 11: Establishment of an autonomous Water Resources Regulator Article 21: Establishment of a comprehensive National Monitoring and Information System for Water Resources Article 22: Protection of water catchment areas to deal with the current challenges Article 24: Separation of water resources regulations from the management of water resources within the basins Article 30: The establishment of one autonomous institution to be in charge of the development of national public water works for storage and flood control. Currently this is being done by five different institutions
WATER SUPPLY AND SANITATION SERVICES
Article 63: The right to clean and safe water in adequate quantities Article 64: Establishment of a comprehensive National Water Services Strategy Article 65: Establishment of the Water Works Development Agency. This offers an opportunity to improve on investment and finance planning for water and sanitation development and to mobilise more funds. Article 77: Establishment of economically viable water service providers by counties Article 108: Control of industrial sewerage to reduce harm and damage to people and the environment Article 117: Creation of additional sources to finance water and sanitation in marginalised and underserved areas
22 MINISTRY OF WATER AND IRRIGATION
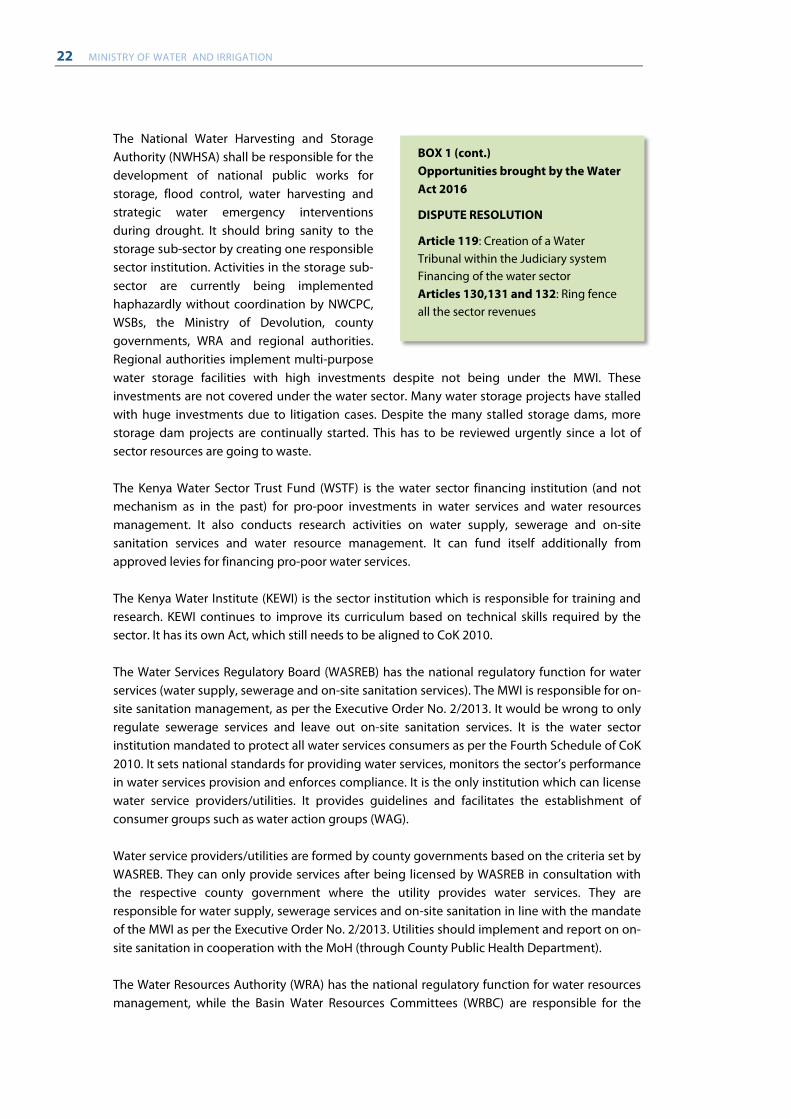
The National Water Harvesting and Storage Authority (NWHSA) shall be responsible for the development of national public works for storage, flood control, water harvesting and strategic water emergency interventions during drought. It should bring sanity to the storage sub-sector by creating one responsible sector institution. Activities in the storage sub-sector are currently being implemented haphazardly without coordination by NWCPC, WSBs, the Ministry of Devolution, county governments, WRA and regional authorities. Regional authorities implement multi-purpose water storage facilities with high investments despite not being under the MWI. These investments are not covered under the water sector. Many water storage projects have stalled with huge investments due to litigation cases. Despite the many stalled storage dams, more storage dam projects are continually started. This has to be reviewed urgently since a lot of sector resources are going to waste. The Kenya Water Sector Trust Fund (WSTF) is the water sector financing institution (and not mechanism as in the past) for pro-poor investments in water services and water resources management. It also conducts research activities on water supply, sewerage and on-site sanitation services and water resource management. It can fund itself additionally from approved levies for financing pro-poor water services. The Kenya Water Institute (KEWI) is the sector institution which is responsible for training and research. KEWI continues to improve its curriculum based on technical skills required by the sector. It has its own Act, which still needs to be aligned to CoK 2010. The Water Services Regulatory Board (WASREB) has the national regulatory function for water services (water supply, sewerage and on-site sanitation services). The MWI is responsible for on-site sanitation management, as per the Executive Order No. 2/2013. It would be wrong to only regulate sewerage services and leave out on-site sanitation services. It is the water sector institution mandated to protect all water services consumers as per the Fourth Schedule of CoK 2010. It sets national standards for providing water services, monitors the sector’s performance in water services provision and enforces compliance. It is the only institution which can license water service providers/utilities. It provides guidelines and facilitates the establishment of consumer groups such as water action groups (WAG). Water service providers/utilities are formed by county governments based on the criteria set by WASREB. They can only provide services after being licensed by WASREB in consultation with the respective county government where the utility provides water services. They are responsible for water supply, sewerage services and on-site sanitation in line with the mandate of the MWI as per the Executive Order No. 2/2013. Utilities should implement and report on on-site sanitation in cooperation with the MoH (through County Public Health Department). The Water Resources Authority (WRA) has the national regulatory function for water resources management, while the Basin Water Resources Committees (WRBC) are responsible for the
BOX 1 (cont.) Opportunities brought by the Water Act 2016
DISPUTE RESOLUTION
Article 119: Creation of a Water Tribunal within the Judiciary system Financing of the water sector Articles 130,131 and 132: Ring fence all the sector revenues
ANNUAL WATER SECTOR REVIEW 2014/2015 - 2015/2016 23
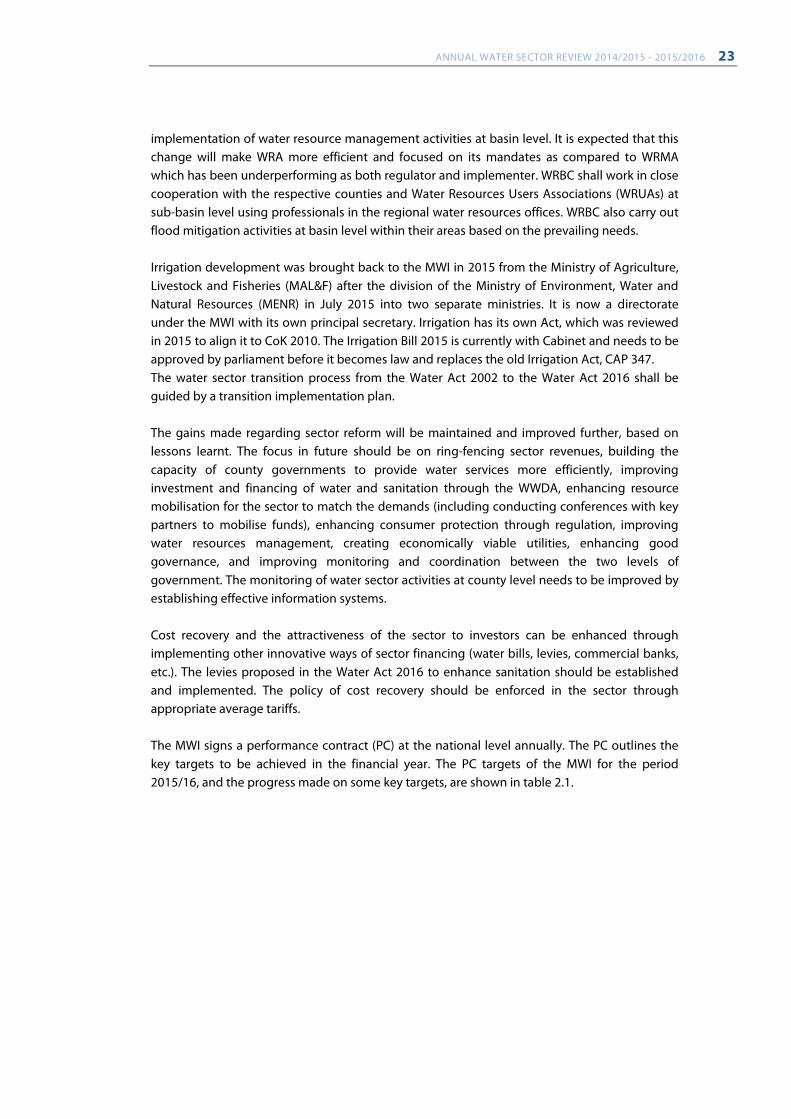
implementation of water resource management activities at basin level. It is expected that this change will make WRA more efficient and focused on its mandates as compared to WRMA which has been underperforming as both regulator and implementer. WRBC shall work in close cooperation with the respective counties and Water Resources Users Associations (WRUAs) at sub-basin level using professionals in the regional water resources offices. WRBC also carry out flood mitigation activities at basin level within their areas based on the prevailing needs. Irrigation development was brought back to the MWI in 2015 from the Ministry of Agriculture, Livestock and Fisheries (MAL&F) after the division of the Ministry of Environment, Water and Natural Resources (MENR) in July 2015 into two separate ministries. It is now a directorate under the MWI with its own principal secretary. Irrigation has its own Act, which was reviewed in 2015 to align it to CoK 2010. The Irrigation Bill 2015 is currently with Cabinet and needs to be approved by parliament before it becomes law and replaces the old Irrigation Act, CAP 347. The water sector transition process from the Water Act 2002 to the Water Act 2016 shall be guided by a transition implementation plan. The gains made regarding sector reform will be maintained and improved further, based on lessons learnt. The focus in future should be on ring-fencing sector revenues, building the capacity of county governments to provide water services more efficiently, improving investment and financing of water and sanitation through the WWDA, enhancing resource mobilisation for the sector to match the demands (including conducting conferences with key partners to mobilise funds), enhancing consumer protection through regulation, improving water resources management, creating economically viable utilities, enhancing good governance, and improving monitoring and coordination between the two levels of government. The monitoring of water sector activities at county level needs to be improved by establishing effective information systems. Cost recovery and the attractiveness of the sector to investors can be enhanced through implementing other innovative ways of sector financing (water bills, levies, commercial banks, etc.). The levies proposed in the Water Act 2016 to enhance sanitation should be established and implemented. The policy of cost recovery should be enforced in the sector through appropriate average tariffs. The MWI signs a performance contract (PC) at the national level annually. The PC outlines the key targets to be achieved in the financial year. The PC targets of the MWI for the period 2015/16, and the progress made on some key targets, are shown in table 2.1.
24 MINISTRY OF WATER AND IRRIGATION
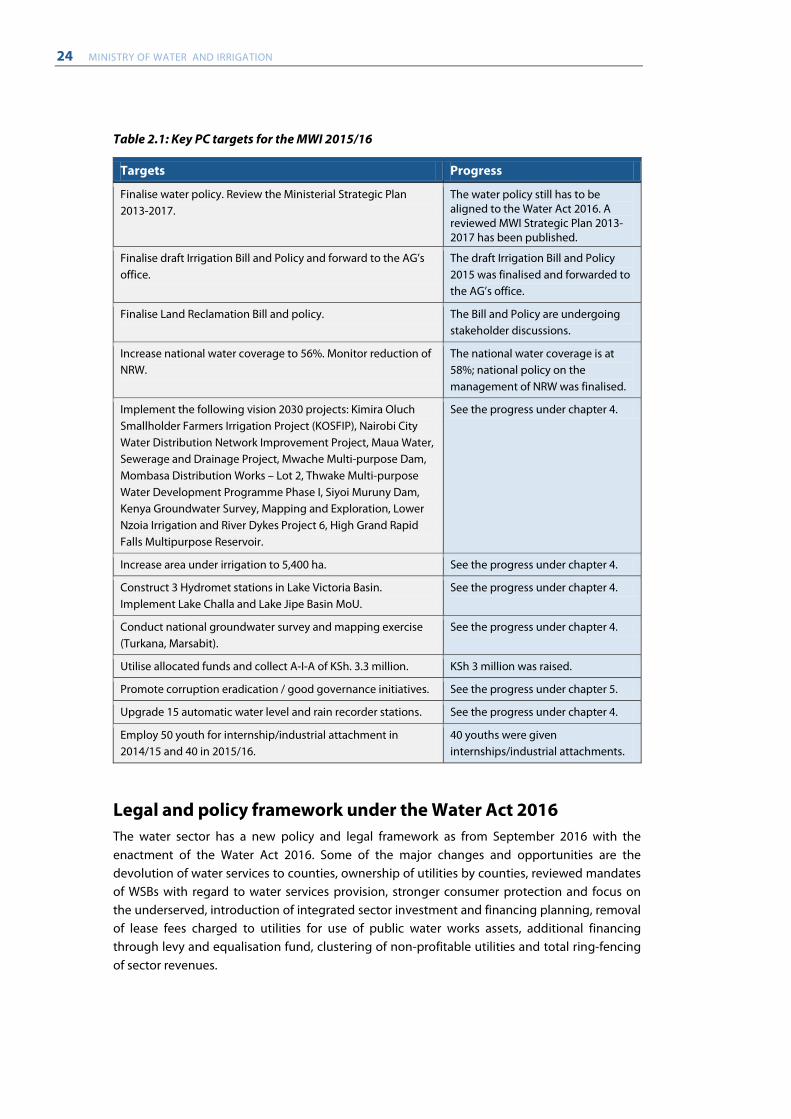
Table 2.1: Key PC targets for the MWI 2015/16
Targets Progress
Finalise water policy. Review the Ministerial Strategic Plan 2013-2017.
The water policy still has to be aligned to the Water Act 2016. A reviewed MWI Strategic Plan 2013-2017 has been published.
Finalise draft Irrigation Bill and Policy and forward to the AG’s office.
The draft Irrigation Bill and Policy 2015 was finalised and forwarded to the AG’s office.
Finalise Land Reclamation Bill and policy. The Bill and Policy are undergoing stakeholder discussions.
Increase national water coverage to 56%. Monitor reduction of NRW.
The national water coverage is at 58%; national policy on the management of NRW was finalised.
Implement the following vision 2030 projects: Kimira Oluch Smallholder Farmers Irrigation Project (KOSFIP), Nairobi City Water Distribution Network Improvement Project, Maua Water, Sewerage and Drainage Project, Mwache Multi-purpose Dam, Mombasa Distribution Works – Lot 2, Thwake Multi-purpose Water Development Programme Phase I, Siyoi Muruny Dam, Kenya Groundwater Survey, Mapping and Exploration, Lower Nzoia Irrigation and River Dykes Project 6, High Grand Rapid Falls Multipurpose Reservoir.
See the progress under chapter 4.
Increase area under irrigation to 5,400 ha. See the progress under chapter 4.
Construct 3 Hydromet stations in Lake Victoria Basin. Implement Lake Challa and Lake Jipe Basin MoU.
See the progress under chapter 4.
Conduct national groundwater survey and mapping exercise (Turkana, Marsabit).
See the progress under chapter 4.
Utilise allocated funds and collect A-I-A of KSh. 3.3 million. KSh 3 million was raised.
Promote corruption eradication / good governance initiatives. See the progress under chapter 5.
Upgrade 15 automatic water level and rain recorder stations. See the progress under chapter 4.
Employ 50 youth for internship/industrial attachment in 2014/15 and 40 in 2015/16.
40 youths were given internships/industrial attachments.
Legal and policy framework under the Water Act 2016 The water sector has a new policy and legal framework as from September 2016 with the enactment of the Water Act 2016. Some of the major changes and opportunities are the devolution of water services to counties, ownership of utilities by counties, reviewed mandates of WSBs with regard to water services provision, stronger consumer protection and focus on the underserved, introduction of integrated sector investment and financing planning, removal of lease fees charged to utilities for use of public water works assets, additional financing through levy and equalisation fund, clustering of non-profitable utilities and total ring-fencing of sector revenues.
ANNUAL WATER SECTOR REVIEW 2014/2015 - 2015/2016 25
The irrigation sub-sector needs a different legal framework. The Irrigation Bill 2015 and policy have been drafted and are under stakeholder discussions. Next steps:
• Awareness creation on the new legal framework brought by the Water Act 2016, • Updating the sector transition plan (From Water Act 2002 to Water Act 2016), • Establishment of WWDA, • Establishment of a strategy for sector-integrated investment and finance planning, • Establishment of levies to enhance sector self-financing for water and sanitation, • Assigning one sector institution (NWHSA) the mandate of developing national water
storage infrastructure to avoid the current overlaps in the mandate, • Supporting counties to develop water acts which are aligned to the Water Act 2016, • Establishment of county utilities, with clustering where necessary, • Establishment of coordination platforms with counties for sector investment
planning, financing planning and annual sector reviews.
The Sector Transition Plan (from Water Act 2002 to Water Act 2016) The MWI will update the Transition Plan of 2012 to reflect the implementation process of the Water Act 2016 and its corresponding policy. The counties should protect, support and strengthen utilities to provide quality and reliable services. The utilities should be managed professionally and be well-governed, based on principles of financial viability and sustainability among others. WASREB will provide guidelines and support to County governments to enforce professional management of utilities. The WSBs are supporting infrastructure development and capacity building in counties within their respective areas of jurisdiction during the transition. The counties will in future prepare county water investment plans and budgets. The WSBs will continue to build their capacity on this. The available data within the WSBs and existing urban utilities will facilitate the process of planning and budgeting for water services at the county level.
Next steps: Consensus building should be carried out with the counties on further reforms in the water sector, with the following specific objectives:
• Creating uniform water sector information systems at national and county level, • Conducting uniform annual water sector reviews with counties, • Facilitating integrated planning for investments and financing in the water sector to
improve water supply, sewerage and on-site sanitation services, • Making the sector more attractive to investors and mobilising more funds for
investment in infrastructure development, • Setting adequate budgets for water services provision at county level, which can
create impacts based on sector strategy objectives, • Improving utility performance by enforcing professional management (BOD and
management), • Creating economically viable utilities with low production costs,
26 MINISTRY OF WATER AND IRRIGATION
• Building capacity at county level in order to create sustainable water sector structures.
2.2 Coordination
Overview The MWI has the overall mandate for water sector coordination. This responsibility covers the coordination of all sector activities and resources. Coordination of activities is carried out through dialogue and reporting platforms. The effective coordination of the sector increases the participation of the stakeholders and enhances accountability of the duty bearers. The availability of sector information promotes transparency. The existing sector coordination platforms are shown in table 2.2. The membership and terms of reference (TOR) of the various dialogue and reporting platforms need to be reviewed to make them more effective and active. Membership should consist of Water Sector Institutions (WSIs), Council of Governors and DP representatives with great influence in the sectors. CSOs could be represented by KEWASNET to make the membership lean but effective. The five thematic groups should be led by the directors in the MWI. The dialogue and reporting platforms should produce constructive outputs which can guide the water sector to make progress. Some of the critical sector issues which need the attention of the dialogue platforms are:
• Implementation of the Water Act 2016, • Sustainable water sector financing to achieve Vision 2030 objectives and SDGs, • Investment planning in the sector based on SIPs to close the huge annual investment
gaps, • Promotion of good governance, • Clustering of unviable utilities and reduction of non-revenue water levels, • Reduction of pollution in water resources, • Increasing sewerage coverage nationally, • Improving on-site sanitation and faecal sludge management, • Improving water services in rural areas, • Increasing storage capacity and mitigate perennial floods and drought.
ANNUAL WATER SECTOR REVIEW 2014/2015 - 2015/2016 27
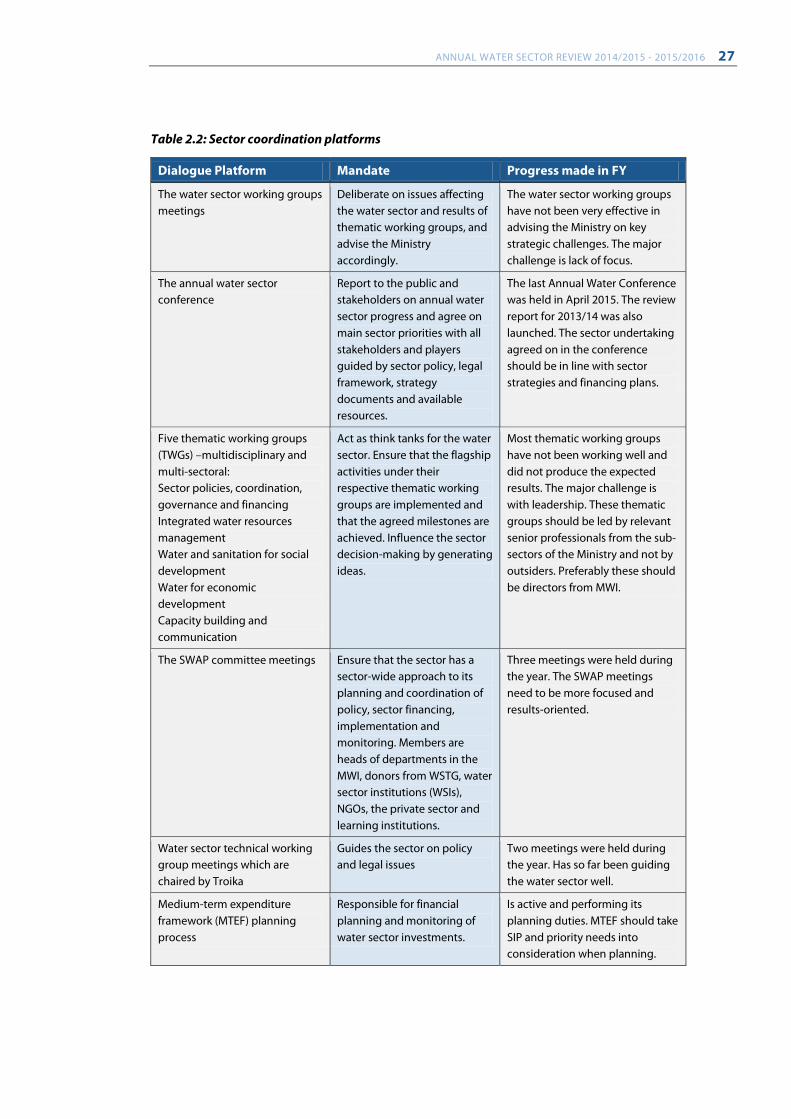
Table 2.2: Sector coordination platforms
Dialogue Platform Mandate Progress made in FY
The water sector working groups meetings
Deliberate on issues affecting the water sector and results of thematic working groups, and advise the Ministry accordingly.
The water sector working groups have not been very effective in advising the Ministry on key strategic challenges. The major challenge is lack of focus.
The annual water sector conference
Report to the public and stakeholders on annual water sector progress and agree on main sector priorities with all stakeholders and players guided by sector policy, legal framework, strategy documents and available resources.
The last Annual Water Conference was held in April 2015. The review report for 2013/14 was also launched. The sector undertaking agreed on in the conference should be in line with sector strategies and financing plans.
Five thematic working groups (TWGs) –multidisciplinary and multi-sectoral: Sector policies, coordination, governance and financing Integrated water resources management Water and sanitation for social development Water for economic development Capacity building and communication
Act as think tanks for the water sector. Ensure that the flagship activities under their respective thematic working groups are implemented and that the agreed milestones are achieved. Influence the sector decision-making by generating ideas.
Most thematic working groups have not been working well and did not produce the expected results. The major challenge is with leadership. These thematic groups should be led by relevant senior professionals from the sub-sectors of the Ministry and not by outsiders. Preferably these should be directors from MWI.
The SWAP committee meetings Ensure that the sector has a sector-wide approach to its planning and coordination of policy, sector financing, implementation and monitoring. Members are heads of departments in the MWI, donors from WSTG, water sector institutions (WSIs), NGOs, the private sector and learning institutions.
Three meetings were held during the year. The SWAP meetings need to be more focused and results-oriented.
Water sector technical working group meetings which are chaired by Troika
Guides the sector on policy and legal issues
Two meetings were held during the year. Has so far been guiding the water sector well.
Medium-term expenditure framework (MTEF) planning process
Responsible for financial planning and monitoring of water sector investments.
Is active and performing its planning duties. MTEF should take SIP and priority needs into consideration when planning.
28 MINISTRY OF WATER AND IRRIGATION
Next steps: • Review the membership and TOR of the various dialogue and information platforms in
order to make them more effective and results-oriented, • The dialogue and information platforms should work strictly in line with the sector
legal framework, policy and strategy documents including SIP.
Sector consultations, planning and monitoring framework Sector consultations, planning and monitoring are done based on established dialogue platforms, information systems, performance reporting and the medium-term planning process. The key sector strategic documents with their specific targets and indicators are used for planning and reporting. During the year under review, the Ministry, together with the Council of Governors, established the Intergovernmental Water Sector Coordination Framework. The Inter-governmental Relations Act No. 2 of 2012 in section 13(2) enables the cabinet secretary responsible for intergovernmental relations to convene consultative fora on sectoral issues of common interest to the national and county governments. This forum will enable the two levels of government to work together and build synergies that will help the sector manage water resources sustainably and enhance water services provision. The goal of the water sector framework is to steer the attainment of a robust and sustainable water sector in Kenya, through the coordination and attainment of policy goals and standards in the sector. It also will be the liaison between the national government and the county governments through the provision of a platform for dialogue and engagement with critical stakeholders in the sector. The following sector information systems were improved during the years under review:
• The Water Regulation Information System (WARIS) was upgraded to Version 3.0., which is web based,
• MajiData (an information database for low-income urban areas) is being updated and upgraded to cover more information and improve its compatibility with WARIS,
• The UPC information system and SafiSan of the WSTF was upgraded to allow data transmission from field projects directly to the main database at WSTF using Android software,
• The Water Resources Information System is running on three separate modules: water permitting, hydro-metrological data and water resource management. The three modules are not yet linked together in one information system,
• The Integrated Financial Management Information System (IFMIS) was adopted by the water sector for tendering, procurement and paying for services.
Next steps:
• Including sewerage and on-site sanitation indicators in the performance contract of MWI,
• Improving data used for sector financing and investment planning (county and national level),
• Improving the Water Resources Information System, • Developing a water services information system for rural areas,
ANNUAL WATER SECTOR REVIEW 2014/2015 - 2015/2016 29
• Improving coordination between the national government and the county governments.
Key challenges and recommendations Challenges
• Missing a water sector information system for rural areas, • Integrated bottom-up sector investment planning still missing in the sector, • Inadequate monitoring of sector investments at county level and in some WSIs.
Recommendations • Establish a water sector information system for rural areas, • Establish a conference regarding resource mobilisation from investors, based on the
sector investment plan, • Build the capacity of counties regarding sector planning, information systems and
annual sector reviews, • Establish a sector conference for resources mobilisation with key development
partners
Coordination of civil society organisations’ contribution The Kenya Water and Sanitation Civil Society Network (KEWASNET) was founded in 2007 to enable civil society organisations (CSOs) which work within the water sector to work in a more coordinated manner. KEWASNET, therefore, coordinates the activities of CSOs working in the sector. They are responsible for the preparation of an annual review report of CSO activities in the sector, which is incorporated into the overall annual sector review report. KEWASNET has developed a CSO sector contribution report for the second consecutive year. The report contributes to improving monitoring and reporting by non-state actors, and to enhancing sector coordination to support an effective sector-wide approach towards sustainable water management. For the FY 2014/15, the CSO sector contribution report provided information about the water, sanitation and hygiene (WASH) and water resources management (WRM) projects of 93 CSOs, community-based organisations (CBOs) and other non-state actors from 28 counties. More than 150 CSOs working in the country were not willing to submit their information despite being requested to do so. To increase the reliability of the results, the information was triangulated by comparing costs per beneficiary and per project outputs (e.g., per water point, training intervention or sanitation facility). Inconsistent information was verified with the respective organisations and corrected wherever required. Information from a sample of 16 organisations was validated through field visits and the revision of available project documents. The CSO report for 2015/16 is still being worked on.
CSO investments in FY 2014/15 The 93 participating CSOs reported having invested KSh 1.6 billion in the water sector for the financial year 2014/15. This showed a significant reduction of investments in comparison to FY 2013/14 where 48 CSOs reported an investment of KSh 1.75 billion. Most of the money was
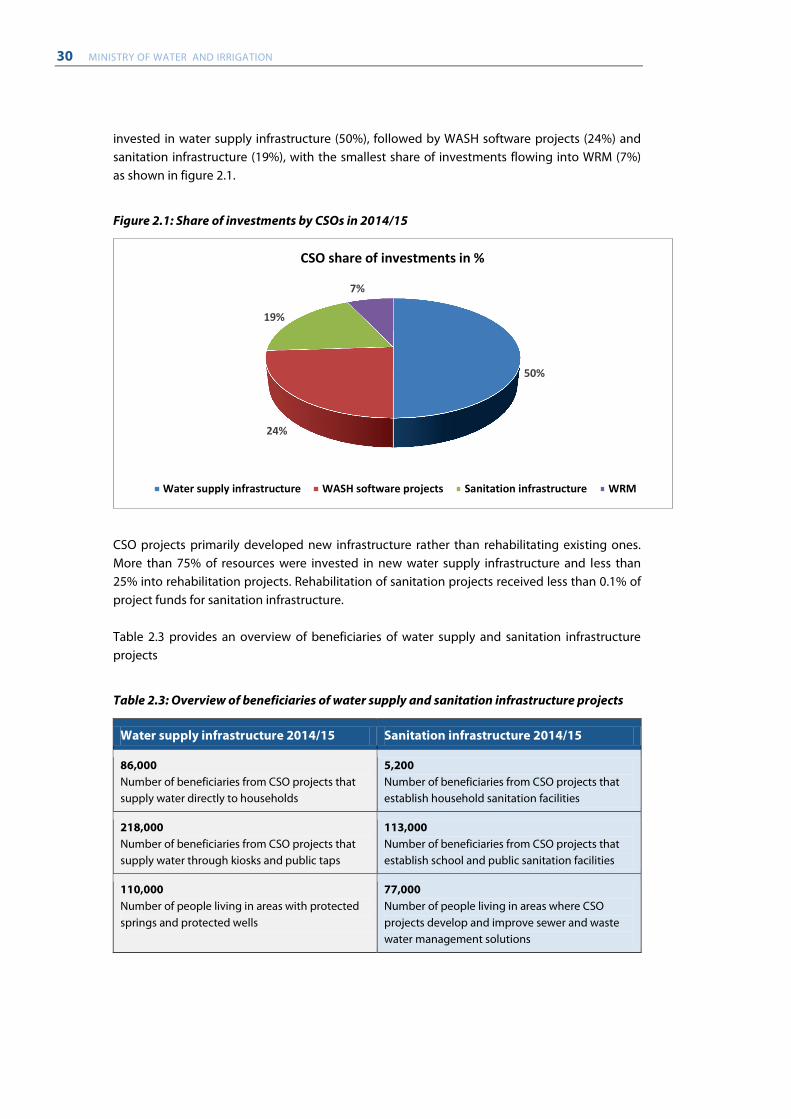
30 MINISTRY OF WATER AND IRRIGATION
invested in water supply infrastructure (50%), followed by WASH software projects (24%) and sanitation infrastructure (19%), with the smallest share of investments flowing into WRM (7%) as shown in figure 2.1.
Figure 2.1: Share of investments by CSOs in 2014/15
CSO projects primarily developed new infrastructure rather than rehabilitating existing ones. More than 75% of resources were invested in new water supply infrastructure and less than 25% into rehabilitation projects. Rehabilitation of sanitation projects received less than 0.1% of project funds for sanitation infrastructure. Table 2.3 provides an overview of beneficiaries of water supply and sanitation infrastructure projects
Table 2.3: Overview of beneficiaries of water supply and sanitation infrastructure projects
Water supply infrastructure 2014/15 Sanitation infrastructure 2014/15
86,000 Number of beneficiaries from CSO projects that supply water directly to households
5,200 Number of beneficiaries from CSO projects that establish household sanitation facilities
218,000 Number of beneficiaries from CSO projects that supply water through kiosks and public taps
113,000 Number of beneficiaries from CSO projects that establish school and public sanitation facilities
110,000 Number of people living in areas with protected springs and protected wells
77,000 Number of people living in areas where CSO projects develop and improve sewer and waste water management solutions
50%
24%
19%
7%
CSO share of investments in %
Water supply infrastructure WASH software projects Sanitation infrastructure WRM
ANNUAL WATER SECTOR REVIEW 2014/2015 - 2015/2016 31
Beyond the support for infrastructure development, CSOs facilitated sector development between different stakeholders, raised awareness about rights and responsibilities, and supported the development of required capacities for sustainable water management through software projects of sector stakeholders. According to the reports of the participating CSOs, approximately KSh 387 million was invested to reach more than 1.5 million Kenyans. Approximately two-thirds of these investments went into training activities related to hygiene and sanitation practices, management and monitoring skills for sector organisations, and operation and maintenance of water systems. More than 30% of resources were used for campaigns with a focus on governance topics (e.g., human rights, equity and inclusion) and on awareness-raising for WASH practices. The report analyses a limited data set of 16 WRM projects from 11 organisations, with a total budget of approximately KSh 105 million. More than half of this budget was spent to build capacities of WRUAs and to enhance groundwater, wetlands and river basin management. Approximately 45% of the funds were used to develop infrastructure in support of agricultural activities. With regards to beneficiaries, two very different types of calculations were used. Half of the projects only indicated direct participants of training and project activities as beneficiaries, whereas the other half of the projects considered all people living in the project area as beneficiaries.
Sustainability of the projects completed by CSOs The sustainability of the commissioned projects is enhanced by:
• Ensuring that only projects prioritised by the beneficiaries are implemented, • Building the capacity of the beneficiaries and enhancing project ownership, • Ensuring that a management and sustainable operations concept is established with
all the key stakeholders and is in place before project implementation, • Putting in place incentives for beneficiaries to manage and operate the projects, • Integrating key policy makers and sector institutions during the project preparation
phase. Observations and conclusions for CSOs
• With CSOs contributing about 5% of the sector budget and with an outreach to more than 1.5 million Kenyans, they play an important role in enhancing water and sanitation coverage and WRM practices, especially in rural areas.
• More than half of the reported beneficiaries comprise people benefiting from capacity development, advocacy and awareness raising projects.
• CSO projects could perform better with regards to government engagement and compliance with required permits, standards and approvals.
• Operations monitoring and maintenance have long been identified as the key to sustainable water and sanitation service provision. Unfortunately, the results of the survey and data validation indicate that CSOs often do not provide adequate follow-up to their projects.
• CSOs, as well as the government, are investing very little money in water resources (the small 7% share of investments in WRM by CSOs is similar to the share of investments reported in the Annual Water Sector Review, at 5%). Due to the expected impacts of climate change, more engagement and investments in water
32 MINISTRY OF WATER AND IRRIGATION
resources management are required to progress towards more sustainable management of Kenya’s scarce water resources that form the backbone for water services.
• There is a need to advocate for increased allocation of resources for sustained water services and WRM development by state and non-state actors alike, in line with aims set in the SDGs.
• Finally, there are a lot of CSOs with governance issues, as reflected in the large number who are not willing or able to provide data and information for accountability.
Sector undertakings One of the outputs of the sector coordination is the selection of priority areas and undertakings in the water sector each year. This is done during the annual water sector conferences. Sector undertakings are prioritised sector activities needed for the realisation of key strategic milestones. Respective sector institutions are charged with the responsibility for implementing the undertakings. Progress made in the key sector undertakings over the last five years is summarised below:
1. Implement a restructuring plan for the MWI and the NWCPC, and transfer of staff and assets: Staff transfer to various water sector institutions (WSIs) was completed, Asset inventory and transfer to counties is still ongoing but nearing completion.
2. Finalise and adopt the Land Reclamation Policy and legal and institutional framework, and ensure scaling-up of land reclamation: The Bill and Policy are currently with the Cabinet, An aligned institutional legal framework is not yet in place.
3. Prepare a water harvesting plan, with water storage for multipurpose use and irrigation: National Water Harvesting and Storage Management Policy has been prepared, Catchment Management Strategy (2015-2022) has been prepared.
4. Undertake mapping of the poor and ensure scaling-up of pro-poor sanitation and water coverage in line with the Pro-Poor Implementation Plan (PPIP): Was completed and mapped in the MajiData database by WSTF, MajiData has been improved and updated in 2016.
5. Monitor and ensure reduction of non-revenue water (NRW) levels to 20%: WASREB is monitoring NRW levels in water service providers using WARIS, Non-revenue water levels are still above 40% in many utilities, WASREB has developed technical manuals and guidelines for NRW management, The MWI has developed a national policy on management of NRW.
6. Strengthen the regulatory and institutional framework in the WSS sub-sector: An autonomous and functional regulator has been established in the WSS sub-
sector, Annual public reporting through IMPACT report has been in place since 2006.
Corporate governance has been included in the performance indicators from 2014/2015.
ANNUAL WATER SECTOR REVIEW 2014/2015 - 2015/2016 33
7. Improve governance in the sector by implementing the corporate governance guidelines in all WSIs: All the WSIs have corporate governance guidelines and are evaluated by WASREB
on this performance indicator, However, poor governance in the sector is caused by inadequate implementation
and enforcement of good corporate guidelines by management and boards of directors.
8. Initiate the development of a national water resources master plan: This was developed and launched in 2014.
9. Adopt low-cost technology or renewable energy in the water sector: The WSTF has introduced low-cost, on-site sanitation system technologies in
urban areas, The sector has introduced a sanitation system that produces biogas resources, The sector has adopted gravity flow water supply systems, The sector is promoting small hydropower systems for water service providers, The sector has adopted low-cost irrigation systems.
10. Improve data management and investment planning in WSS and WRM: 16 key sector indicators for monitoring were developed in 2007, Information systems have been developed (WARIS, MajiData, WRIMS, IFMIS,
PROMIS, WASBIT, MTP process), WARIS and MajiData databases were updated and improved in 2015, The sector also uses Kenya National Bureau of Statistics (KNBS) census and survey
data. 11. Account for all the country’s water resources, water availability per capita and
abstractions: Accounting of water resources is done by the WRMA through water permitting
and allocation. 12. Undertake climate change adaptation activities:
A climate change policy has been established by the MEWNR, The WRMA is implementing early warning systems, controlled abstraction and
catchment management strategies to deal with climate change issues, The National Climate Change Action Plan is being implemented by the MEWNR
and the MWI. 13. Strengthen coordination, communication and monitoring and evaluation (M&E):
Dialogue and coordination platforms have been developed for the sector, Information systems for performance reporting have been developed, A coordination platform for the MWI and county governments is being
considered. 14. Operationalise the irrigation and drainage policy, and develop the institutional
framework that allows expanding the area under irrigation by up to 40,000 ha per year: The National Irrigation and Drainage Policy and Bill 2015 has been prepared, A legal and institutional framework aligned to CoK 2010 is not yet in place (Bill is
at cabinet level), Only 17% of the potential land available has been put under irrigation. Annual
targets are not being met.
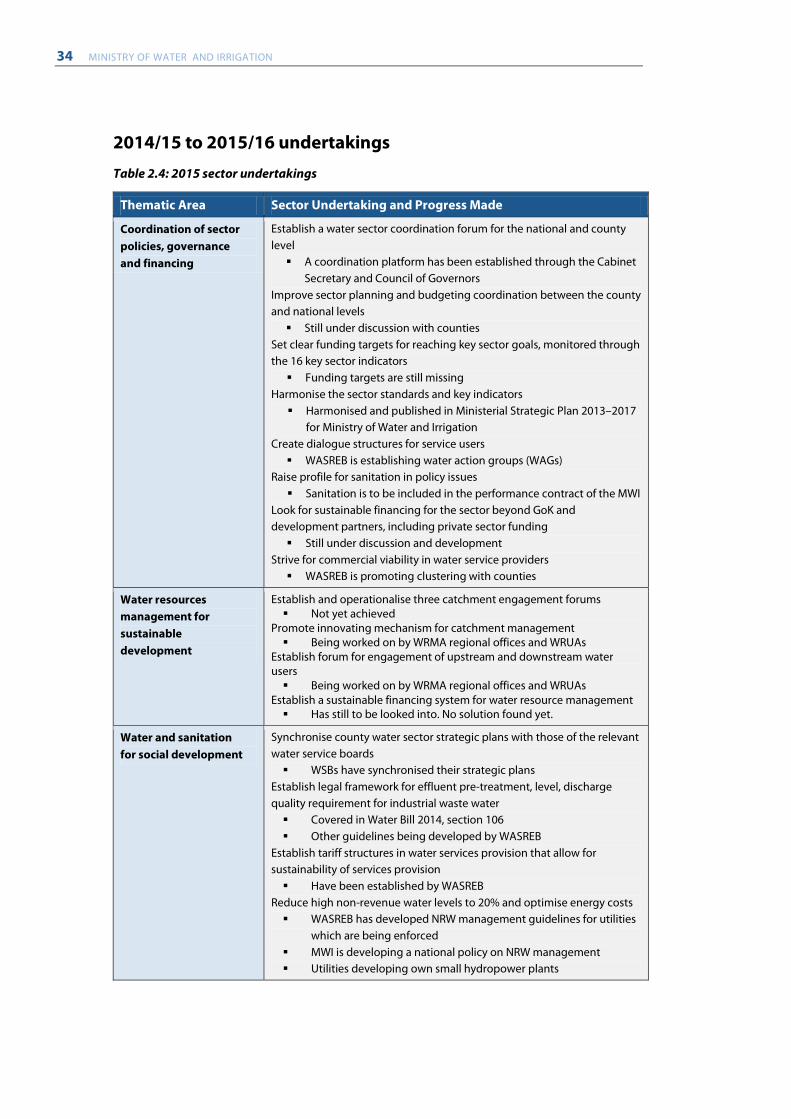
34 MINISTRY OF WATER AND IRRIGATION
2014/15 to 2015/16 undertakings
Table 2.4: 2015 sector undertakings
Thematic Area Sector Undertaking and Progress Made
Coordination of sector policies, governance and financing
Establish a water sector coordination forum for the national and county level A coordination platform has been established through the Cabinet
Secretary and Council of Governors Improve sector planning and budgeting coordination between the county and national levels Still under discussion with counties
Set clear funding targets for reaching key sector goals, monitored through the 16 key sector indicators Funding targets are still missing
Harmonise the sector standards and key indicators Harmonised and published in Ministerial Strategic Plan 2013–2017
for Ministry of Water and Irrigation Create dialogue structures for service users WASREB is establishing water action groups (WAGs)
Raise profile for sanitation in policy issues Sanitation is to be included in the performance contract of the MWI
Look for sustainable financing for the sector beyond GoK and development partners, including private sector funding Still under discussion and development
Strive for commercial viability in water service providers WASREB is promoting clustering with counties
Water resources management for sustainable development
Establish and operationalise three catchment engagement forums Not yet achieved
Promote innovating mechanism for catchment management Being worked on by WRMA regional offices and WRUAs
Establish forum for engagement of upstream and downstream water users Being worked on by WRMA regional offices and WRUAs
Establish a sustainable financing system for water resource management Has still to be looked into. No solution found yet.
Water and sanitation for social development
Synchronise county water sector strategic plans with those of the relevant water service boards WSBs have synchronised their strategic plans
Establish legal framework for effluent pre-treatment, level, discharge quality requirement for industrial waste water Covered in Water Bill 2014, section 106 Other guidelines being developed by WASREB
Establish tariff structures in water services provision that allow for sustainability of services provision Have been established by WASREB
Reduce high non-revenue water levels to 20% and optimise energy costs WASREB has developed NRW management guidelines for utilities
which are being enforced MWI is developing a national policy on NRW management Utilities developing own small hydropower plants
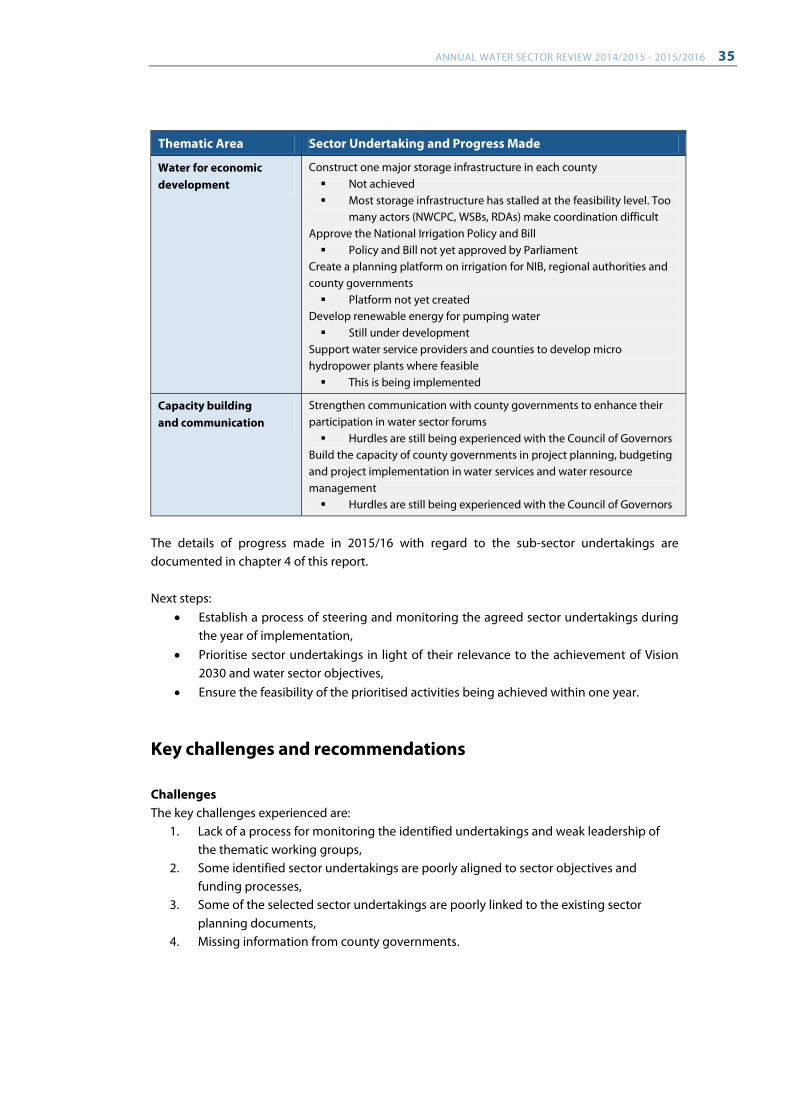
ANNUAL WATER SECTOR REVIEW 2014/2015 - 2015/2016 35
Thematic Area Sector Undertaking and Progress Made
Water for economic development
Construct one major storage infrastructure in each county Not achieved Most storage infrastructure has stalled at the feasibility level. Too
many actors (NWCPC, WSBs, RDAs) make coordination difficult Approve the National Irrigation Policy and Bill Policy and Bill not yet approved by Parliament
Create a planning platform on irrigation for NIB, regional authorities and county governments Platform not yet created
Develop renewable energy for pumping water Still under development
Support water service providers and counties to develop micro hydropower plants where feasible This is being implemented
Capacity building and communication
Strengthen communication with county governments to enhance their participation in water sector forums Hurdles are still being experienced with the Council of Governors
Build the capacity of county governments in project planning, budgeting and project implementation in water services and water resource management Hurdles are still being experienced with the Council of Governors
The details of progress made in 2015/16 with regard to the sub-sector undertakings are documented in chapter 4 of this report. Next steps:
• Establish a process of steering and monitoring the agreed sector undertakings during the year of implementation,
• Prioritise sector undertakings in light of their relevance to the achievement of Vision 2030 and water sector objectives,
• Ensure the feasibility of the prioritised activities being achieved within one year.
Key challenges and recommendations Challenges The key challenges experienced are:
1. Lack of a process for monitoring the identified undertakings and weak leadership of the thematic working groups,
2. Some identified sector undertakings are poorly aligned to sector objectives and funding processes,
3. Some of the selected sector undertakings are poorly linked to the existing sector planning documents,
4. Missing information from county governments.
36 MINISTRY OF WATER AND IRRIGATION
Recommendations 1. The Ministry should enforce the alignment of sector undertakings to the sector policy,
strategies and financing plan, 2. The water sector coordination unit, in collaboration with the planning department of
the Ministry, should ensure the undertakings are integrated and continuously monitored,
3. Selection of the sector undertakings should integrate relevant non-state actors with the capacity to support the implementation processes,
4. The sector coordination unit and the Ministry should give guidance during the conference to ensure that only feasible sector undertakings are agreed on and the undertakings are aligned to sector planning documents,
5. The Ministry should communicate in a timely way to the implementing agencies and jointly monitor implementation progress,
6. Counties, NIB and NWCPC should cooperate and provide the required information for the annual sector review,
7. The Sector Coordination Unit and the Ministry should guide stakeholders in the selection of undertakings to be in line with sector planning documents and financing plan. Implementation should be monitored and reported on a quarterly basis.
2.3 Capacity building and research
Introduction Capacity building and research for the water sector is carried out by KEWI. Training for the water sector was started in 1960 within a unit in the Hydraulics Department of Public Works. The objective was to train water supply operators. In 1970, the unit was upgraded to a training section under the same department. In 1974 the department was transformed to a fully-fledged Ministry of Water Development and the training section was changed to the Water Development Staff Training School. In 1985, the Institute became a national water training institution and was renamed the Kenya Water Institute (KEWI). In 2001, Parliament passed an Act to establish KEWI. According to the KEWI Act (No.11 of 2001), the Institute is a semi-autonomous corporate body serving the entire water sector in Kenya. The Applied Water Research (AWR) department was merged with the training department to form the new KEWI in 2003. The KEWI Act 2001 is currently being reviewed to align KEWI to the requirements of CoK 2010.
Training programmes conducted in 2014/15 and 2015/16 KEWI offers various training courses on water management at certificate and diploma level. The trainings are intended to produce artisans for the water sector. Table 2.5 shows the courses and number of graduates who were trained in FY 2014/15 and FY 2015/16.
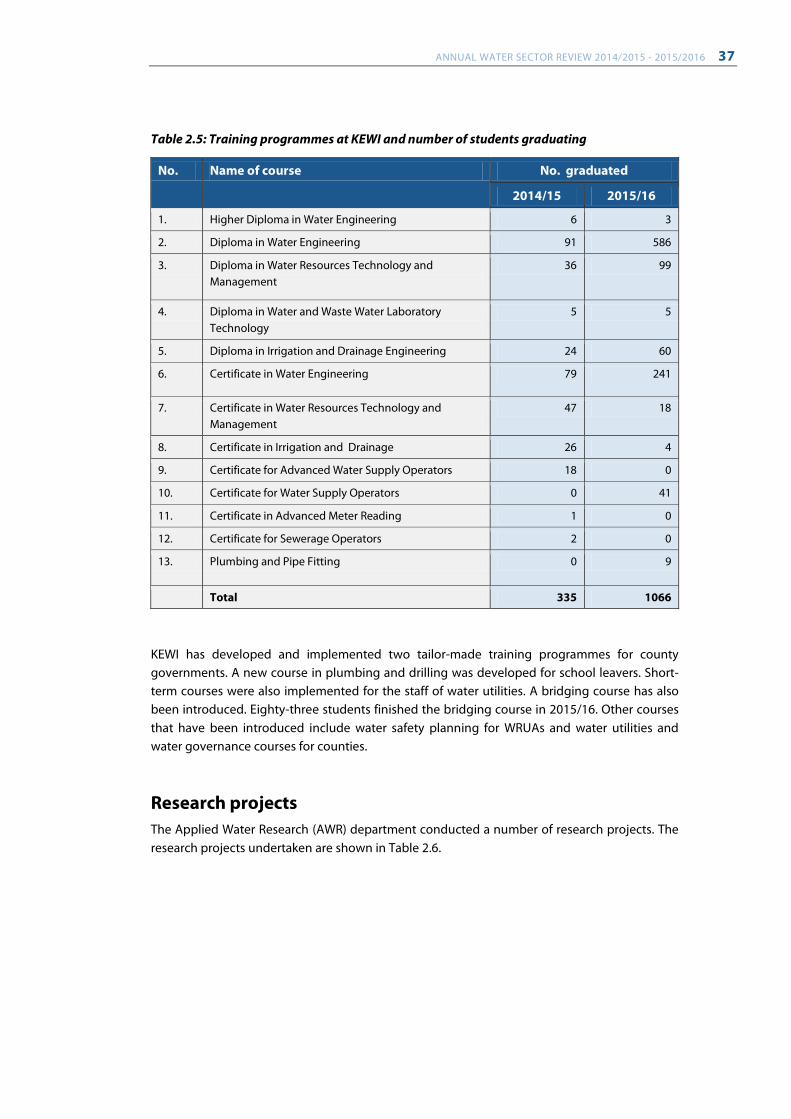
ANNUAL WATER SECTOR REVIEW 2014/2015 - 2015/2016 37
Table 2.5: Training programmes at KEWI and number of students graduating
No. Name of course No. graduated
2014/15 2015/16
1. Higher Diploma in Water Engineering 6 3
2. Diploma in Water Engineering 91 586
3. Diploma in Water Resources Technology and Management
36 99
4. Diploma in Water and Waste Water Laboratory Technology
5 5
5. Diploma in Irrigation and Drainage Engineering 24 60
6. Certificate in Water Engineering 79 241
7. Certificate in Water Resources Technology and Management
47 18
8. Certificate in Irrigation and Drainage 26 4
9. Certificate for Advanced Water Supply Operators 18 0
10. Certificate for Water Supply Operators 0 41
11. Certificate in Advanced Meter Reading 1 0
12. Certificate for Sewerage Operators 2 0
13. Plumbing and Pipe Fitting 0 9
Total 335 1066
KEWI has developed and implemented two tailor-made training programmes for county governments. A new course in plumbing and drilling was developed for school leavers. Short-term courses were also implemented for the staff of water utilities. A bridging course has also been introduced. Eighty-three students finished the bridging course in 2015/16. Other courses that have been introduced include water safety planning for WRUAs and water utilities and water governance courses for counties.
Research projects The Applied Water Research (AWR) department conducted a number of research projects. The research projects undertaken are shown in Table 2.6.
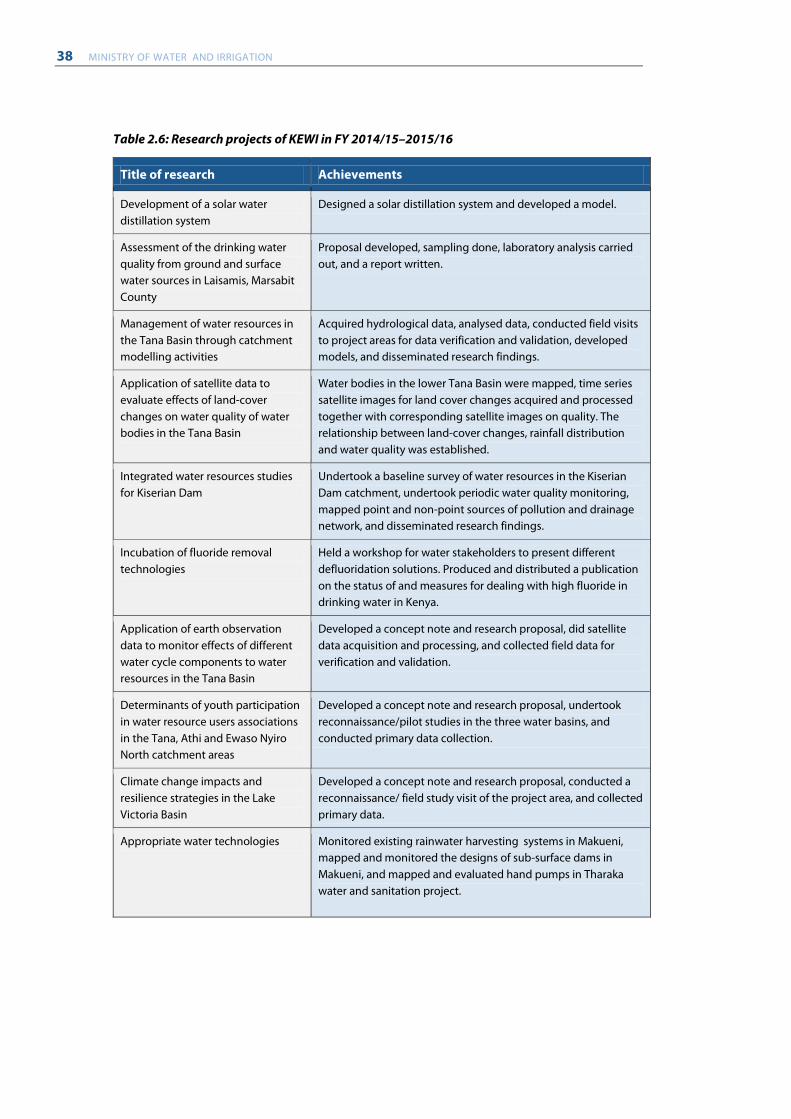
38 MINISTRY OF WATER AND IRRIGATION
Table 2.6: Research projects of KEWI in FY 2014/15–2015/16
Title of research Achievements
Development of a solar water distillation system
Designed a solar distillation system and developed a model.
Assessment of the drinking water quality from ground and surface water sources in Laisamis, Marsabit County
Proposal developed, sampling done, laboratory analysis carried out, and a report written.
Management of water resources in the Tana Basin through catchment modelling activities
Acquired hydrological data, analysed data, conducted field visits to project areas for data verification and validation, developed models, and disseminated research findings.
Application of satellite data to evaluate effects of land-cover changes on water quality of water bodies in the Tana Basin
Water bodies in the lower Tana Basin were mapped, time series satellite images for land cover changes acquired and processed together with corresponding satellite images on quality. The relationship between land-cover changes, rainfall distribution and water quality was established.
Integrated water resources studies for Kiserian Dam
Undertook a baseline survey of water resources in the Kiserian Dam catchment, undertook periodic water quality monitoring, mapped point and non-point sources of pollution and drainage network, and disseminated research findings.
Incubation of fluoride removal technologies
Held a workshop for water stakeholders to present different defluoridation solutions. Produced and distributed a publication on the status of and measures for dealing with high fluoride in drinking water in Kenya.
Application of earth observation data to monitor effects of different water cycle components to water resources in the Tana Basin
Developed a concept note and research proposal, did satellite data acquisition and processing, and collected field data for verification and validation.
Determinants of youth participation in water resource users associations in the Tana, Athi and Ewaso Nyiro North catchment areas
Developed a concept note and research proposal, undertook reconnaissance/pilot studies in the three water basins, and conducted primary data collection.
Climate change impacts and resilience strategies in the Lake Victoria Basin
Developed a concept note and research proposal, conducted a reconnaissance/ field study visit of the project area, and collected primary data.
Appropriate water technologies Monitored existing rainwater harvesting systems in Makueni, mapped and monitored the designs of sub-surface dams in Makueni, and mapped and evaluated hand pumps in Tharaka water and sanitation project.
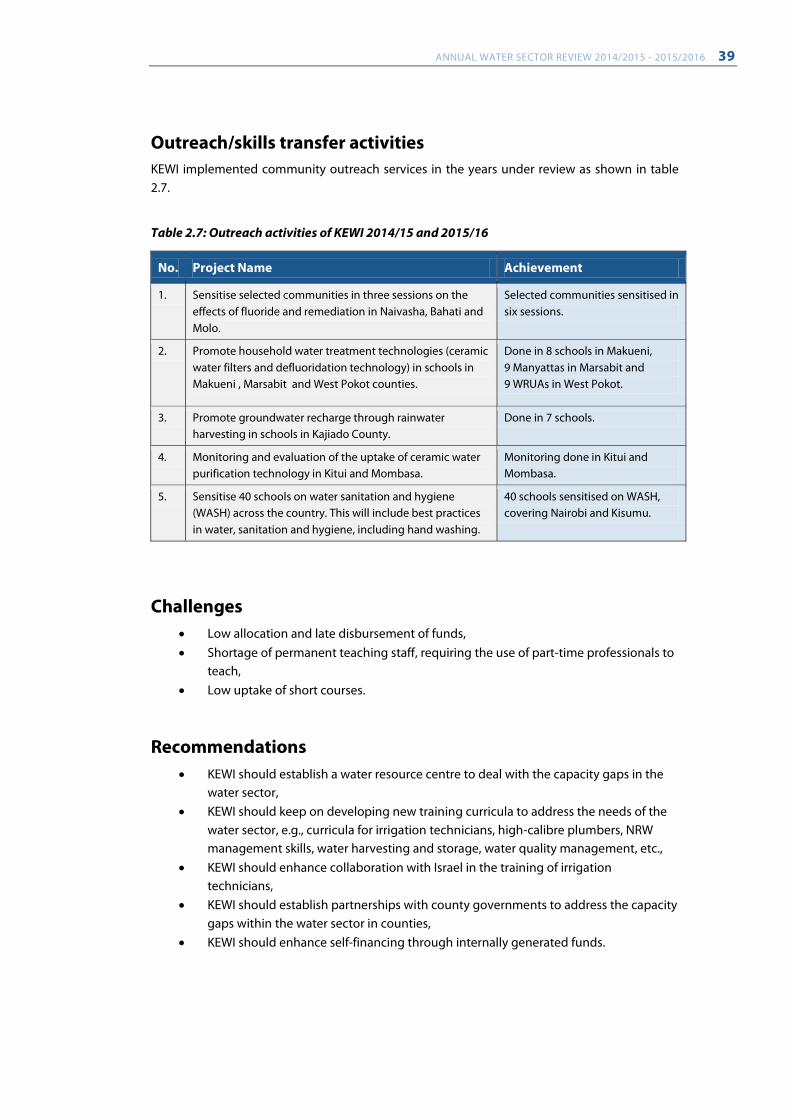
ANNUAL WATER SECTOR REVIEW 2014/2015 - 2015/2016 39
Outreach/skills transfer activities KEWI implemented community outreach services in the years under review as shown in table 2.7.
Table 2.7: Outreach activities of KEWI 2014/15 and 2015/16
No. Project Name Achievement
1. Sensitise selected communities in three sessions on the effects of fluoride and remediation in Naivasha, Bahati and Molo.
Selected communities sensitised in six sessions.
2. Promote household water treatment technologies (ceramic water filters and defluoridation technology) in schools in Makueni , Marsabit and West Pokot counties.
Done in 8 schools in Makueni, 9 Manyattas in Marsabit and 9 WRUAs in West Pokot.
3. Promote groundwater recharge through rainwater harvesting in schools in Kajiado County.
Done in 7 schools.
4. Monitoring and evaluation of the uptake of ceramic water purification technology in Kitui and Mombasa.
Monitoring done in Kitui and Mombasa.
5. Sensitise 40 schools on water sanitation and hygiene (WASH) across the country. This will include best practices in water, sanitation and hygiene, including hand washing.
40 schools sensitised on WASH, covering Nairobi and Kisumu.
Challenges • Low allocation and late disbursement of funds, • Shortage of permanent teaching staff, requiring the use of part-time professionals to
teach, • Low uptake of short courses.
Recommendations • KEWI should establish a water resource centre to deal with the capacity gaps in the
water sector, • KEWI should keep on developing new training curricula to address the needs of the
water sector, e.g., curricula for irrigation technicians, high-calibre plumbers, NRW management skills, water harvesting and storage, water quality management, etc.,
• KEWI should enhance collaboration with Israel in the training of irrigation technicians,
• KEWI should establish partnerships with county governments to address the capacity gaps within the water sector in counties,
• KEWI should enhance self-financing through internally generated funds.
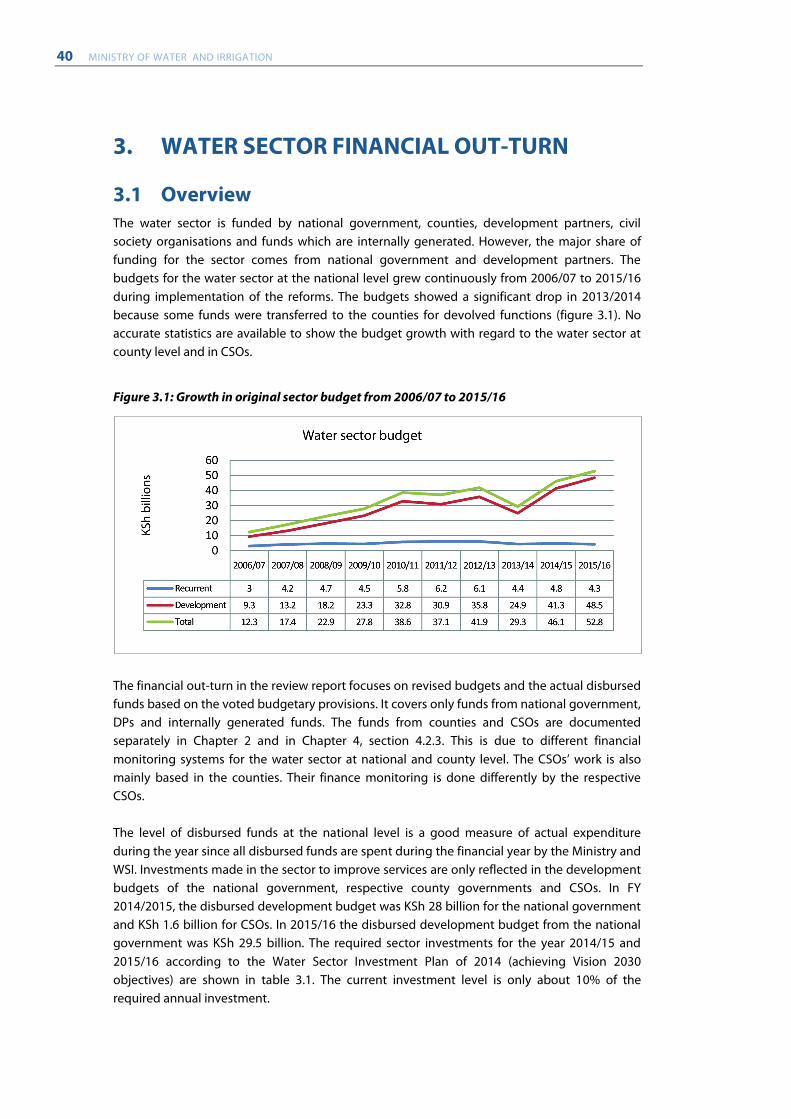
40 MINISTRY OF WATER AND IRRIGATION
3. WATER SECTOR FINANCIAL OUT-TURN
3.1 Overview The water sector is funded by national government, counties, development partners, civil society organisations and funds which are internally generated. However, the major share of funding for the sector comes from national government and development partners. The budgets for the water sector at the national level grew continuously from 2006/07 to 2015/16 during implementation of the reforms. The budgets showed a significant drop in 2013/2014 because some funds were transferred to the counties for devolved functions (figure 3.1). No accurate statistics are available to show the budget growth with regard to the water sector at county level and in CSOs.
Figure 3.1: Growth in original sector budget from 2006/07 to 2015/16
The financial out-turn in the review report focuses on revised budgets and the actual disbursed funds based on the voted budgetary provisions. It covers only funds from national government, DPs and internally generated funds. The funds from counties and CSOs are documented separately in Chapter 2 and in Chapter 4, section 4.2.3. This is due to different financial monitoring systems for the water sector at national and county level. The CSOs’ work is also mainly based in the counties. Their finance monitoring is done differently by the respective CSOs. The level of disbursed funds at the national level is a good measure of actual expenditure during the year since all disbursed funds are spent during the financial year by the Ministry and WSI. Investments made in the sector to improve services are only reflected in the development budgets of the national government, respective county governments and CSOs. In FY 2014/2015, the disbursed development budget was KSh 28 billion for the national government and KSh 1.6 billion for CSOs. In 2015/16 the disbursed development budget from the national government was KSh 29.5 billion. The required sector investments for the year 2014/15 and 2015/16 according to the Water Sector Investment Plan of 2014 (achieving Vision 2030 objectives) are shown in table 3.1. The current investment level is only about 10% of the required annual investment.
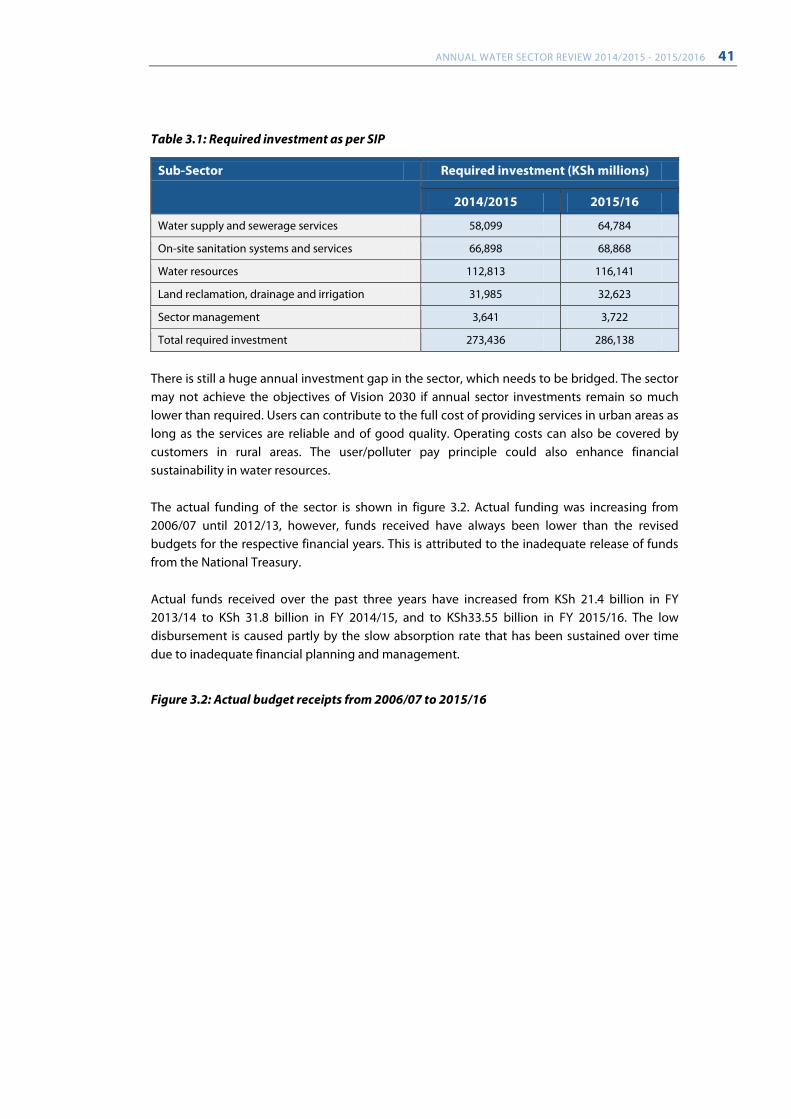
ANNUAL WATER SECTOR REVIEW 2014/2015 - 2015/2016 41
Table 3.1: Required investment as per SIP
Sub-Sector Required investment (KSh millions)
2014/2015 2015/16
Water supply and sewerage services 58,099 64,784
On-site sanitation systems and services 66,898 68,868
Water resources 112,813 116,141
Land reclamation, drainage and irrigation 31,985 32,623
Sector management 3,641 3,722
Total required investment 273,436 286,138
There is still a huge annual investment gap in the sector, which needs to be bridged. The sector may not achieve the objectives of Vision 2030 if annual sector investments remain so much lower than required. Users can contribute to the full cost of providing services in urban areas as long as the services are reliable and of good quality. Operating costs can also be covered by customers in rural areas. The user/polluter pay principle could also enhance financial sustainability in water resources. The actual funding of the sector is shown in figure 3.2. Actual funding was increasing from 2006/07 until 2012/13, however, funds received have always been lower than the revised budgets for the respective financial years. This is attributed to the inadequate release of funds from the National Treasury. Actual funds received over the past three years have increased from KSh 21.4 billion in FY 2013/14 to KSh 31.8 billion in FY 2014/15, and to KSh33.55 billion in FY 2015/16. The low disbursement is caused partly by the slow absorption rate that has been sustained over time due to inadequate financial planning and management.
Figure 3.2: Actual budget receipts from 2006/07 to 2015/16
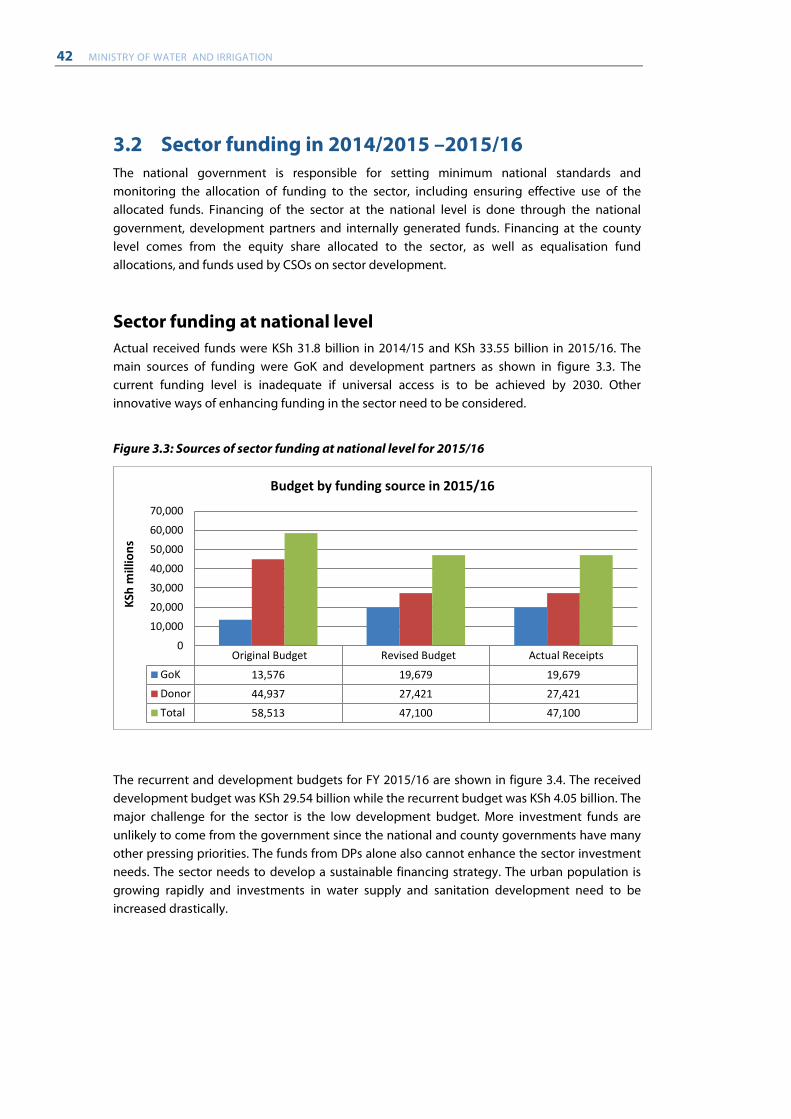
42 MINISTRY OF WATER AND IRRIGATION
3.2 Sector funding in 2014/2015 –2015/16 The national government is responsible for setting minimum national standards and monitoring the allocation of funding to the sector, including ensuring effective use of the allocated funds. Financing of the sector at the national level is done through the national government, development partners and internally generated funds. Financing at the county level comes from the equity share allocated to the sector, as well as equalisation fund allocations, and funds used by CSOs on sector development.
Sector funding at national level Actual received funds were KSh 31.8 billion in 2014/15 and KSh 33.55 billion in 2015/16. The main sources of funding were GoK and development partners as shown in figure 3.3. The current funding level is inadequate if universal access is to be achieved by 2030. Other innovative ways of enhancing funding in the sector need to be considered.
Figure 3.3: Sources of sector funding at national level for 2015/16
The recurrent and development budgets for FY 2015/16 are shown in figure 3.4. The received development budget was KSh 29.54 billion while the recurrent budget was KSh 4.05 billion. The major challenge for the sector is the low development budget. More investment funds are unlikely to come from the government since the national and county governments have many other pressing priorities. The funds from DPs alone also cannot enhance the sector investment needs. The sector needs to develop a sustainable financing strategy. The urban population is growing rapidly and investments in water supply and sanitation development need to be increased drastically.
Original Budget Revised Budget Actual Receipts
GoK 13,576 19,679 19,679Donor 44,937 27,421 27,421Total 58,513 47,100 47,100
0
10,000
20,000
30,000
40,000
50,000
60,000
70,000
KSh
mill
ions
Budget by funding source in 2015/16
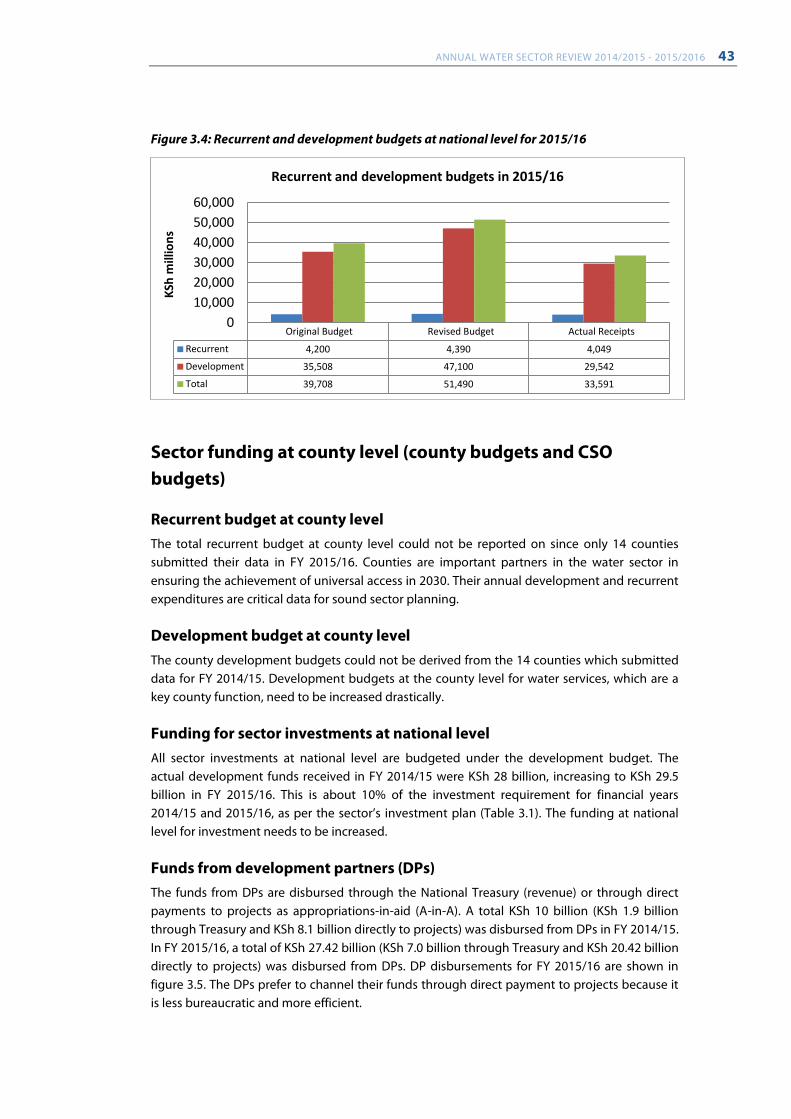
ANNUAL WATER SECTOR REVIEW 2014/2015 - 2015/2016 43
Figure 3.4: Recurrent and development budgets at national level for 2015/16
Sector funding at county level (county budgets and CSO budgets)
Recurrent budget at county level The total recurrent budget at county level could not be reported on since only 14 counties submitted their data in FY 2015/16. Counties are important partners in the water sector in ensuring the achievement of universal access in 2030. Their annual development and recurrent expenditures are critical data for sound sector planning.
Development budget at county level The county development budgets could not be derived from the 14 counties which submitted data for FY 2014/15. Development budgets at the county level for water services, which are a key county function, need to be increased drastically.
Funding for sector investments at national level All sector investments at national level are budgeted under the development budget. The actual development funds received in FY 2014/15 were KSh 28 billion, increasing to KSh 29.5 billion in FY 2015/16. This is about 10% of the investment requirement for financial years 2014/15 and 2015/16, as per the sector’s investment plan (Table 3.1). The funding at national level for investment needs to be increased.
Funds from development partners (DPs) The funds from DPs are disbursed through the National Treasury (revenue) or through direct payments to projects as appropriations-in-aid (A-in-A). A total KSh 10 billion (KSh 1.9 billion through Treasury and KSh 8.1 billion directly to projects) was disbursed from DPs in FY 2014/15. In FY 2015/16, a total of KSh 27.42 billion (KSh 7.0 billion through Treasury and KSh 20.42 billion directly to projects) was disbursed from DPs. DP disbursements for FY 2015/16 are shown in figure 3.5. The DPs prefer to channel their funds through direct payment to projects because it is less bureaucratic and more efficient.
Original Budget Revised Budget Actual Receipts
Recurrent 4,200 4,390 4,049
Development 35,508 47,100 29,542
Total 39,708 51,490 33,591
010,00020,00030,00040,00050,00060,000
KSh
mill
ions
Recurrent and development budgets in 2015/16
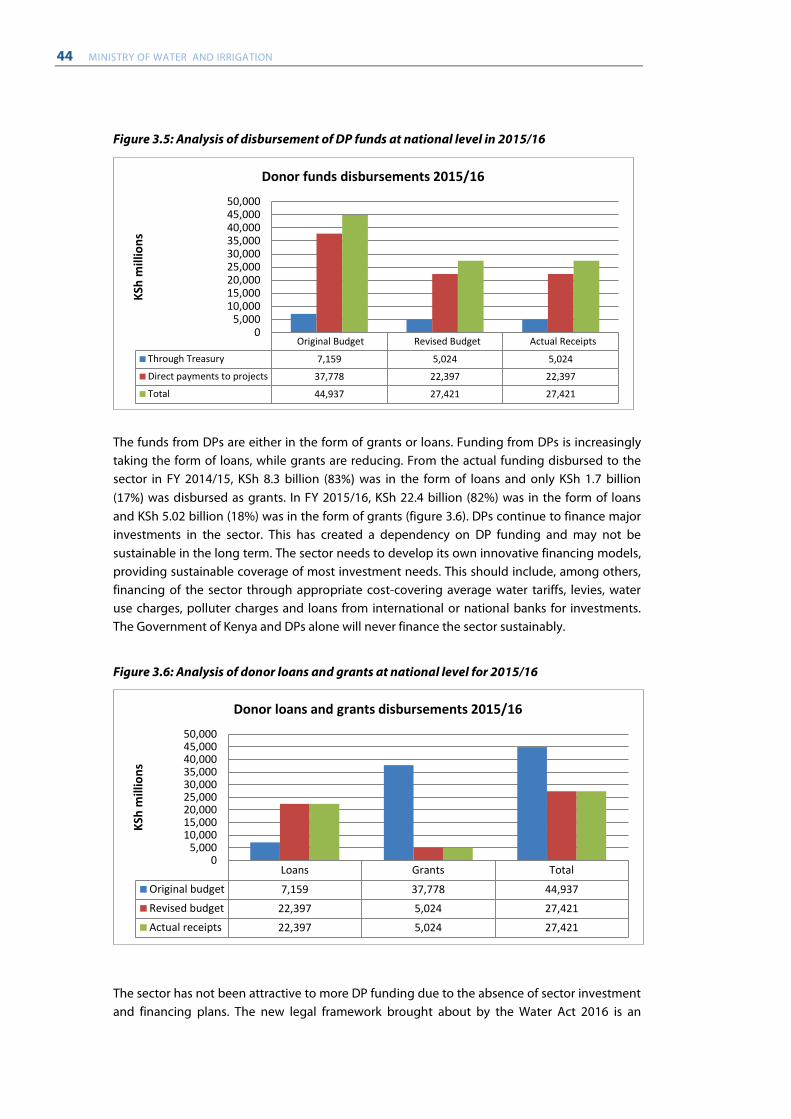
44 MINISTRY OF WATER AND IRRIGATION
Figure 3.5: Analysis of disbursement of DP funds at national level in 2015/16
The funds from DPs are either in the form of grants or loans. Funding from DPs is increasingly taking the form of loans, while grants are reducing. From the actual funding disbursed to the sector in FY 2014/15, KSh 8.3 billion (83%) was in the form of loans and only KSh 1.7 billion (17%) was disbursed as grants. In FY 2015/16, KSh 22.4 billion (82%) was in the form of loans and KSh 5.02 billion (18%) was in the form of grants (figure 3.6). DPs continue to finance major investments in the sector. This has created a dependency on DP funding and may not be sustainable in the long term. The sector needs to develop its own innovative financing models, providing sustainable coverage of most investment needs. This should include, among others, financing of the sector through appropriate cost-covering average water tariffs, levies, water use charges, polluter charges and loans from international or national banks for investments. The Government of Kenya and DPs alone will never finance the sector sustainably.
Figure 3.6: Analysis of donor loans and grants at national level for 2015/16
The sector has not been attractive to more DP funding due to the absence of sector investment and financing plans. The new legal framework brought about by the Water Act 2016 is an
Original Budget Revised Budget Actual Receipts
Through Treasury 7,159 5,024 5,024
Direct payments to projects 37,778 22,397 22,397
Total 44,937 27,421 27,421
05,000
10,00015,00020,00025,00030,00035,00040,00045,00050,000
KSh
mill
ions
Donor funds disbursements 2015/16
Loans Grants Total
Original budget 7,159 37,778 44,937Revised budget 22,397 5,024 27,421Actual receipts 22,397 5,024 27,421
05,000
10,00015,00020,00025,00030,00035,00040,00045,00050,000
KSh
mill
ions
Donor loans and grants disbursements 2015/16
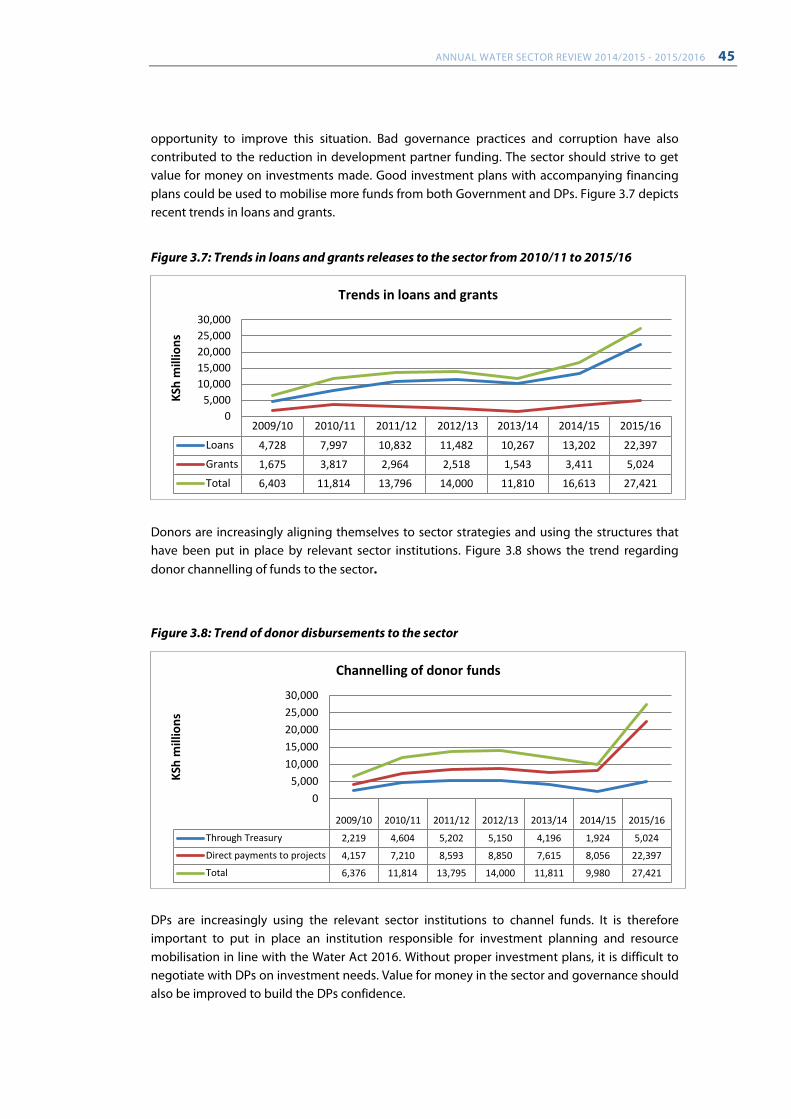
ANNUAL WATER SECTOR REVIEW 2014/2015 - 2015/2016 45
opportunity to improve this situation. Bad governance practices and corruption have also contributed to the reduction in development partner funding. The sector should strive to get value for money on investments made. Good investment plans with accompanying financing plans could be used to mobilise more funds from both Government and DPs. Figure 3.7 depicts recent trends in loans and grants.
Figure 3.7: Trends in loans and grants releases to the sector from 2010/11 to 2015/16
Donors are increasingly aligning themselves to sector strategies and using the structures that have been put in place by relevant sector institutions. Figure 3.8 shows the trend regarding donor channelling of funds to the sector.
Figure 3.8: Trend of donor disbursements to the sector
DPs are increasingly using the relevant sector institutions to channel funds. It is therefore important to put in place an institution responsible for investment planning and resource mobilisation in line with the Water Act 2016. Without proper investment plans, it is difficult to negotiate with DPs on investment needs. Value for money in the sector and governance should also be improved to build the DPs confidence.
2009/10 2010/11 2011/12 2012/13 2013/14 2014/15 2015/16
Loans 4,728 7,997 10,832 11,482 10,267 13,202 22,397Grants 1,675 3,817 2,964 2,518 1,543 3,411 5,024Total 6,403 11,814 13,796 14,000 11,810 16,613 27,421
05,000
10,00015,00020,00025,00030,000
KSh
mill
ions
Trends in loans and grants
2009/10 2010/11 2011/12 2012/13 2013/14 2014/15 2015/16
Through Treasury 2,219 4,604 5,202 5,150 4,196 1,924 5,024
Direct payments to projects 4,157 7,210 8,593 8,850 7,615 8,056 22,397
Total 6,376 11,814 13,795 14,000 11,811 9,980 27,421
05,000
10,00015,00020,00025,00030,000
KSh
mill
ions
Channelling of donor funds
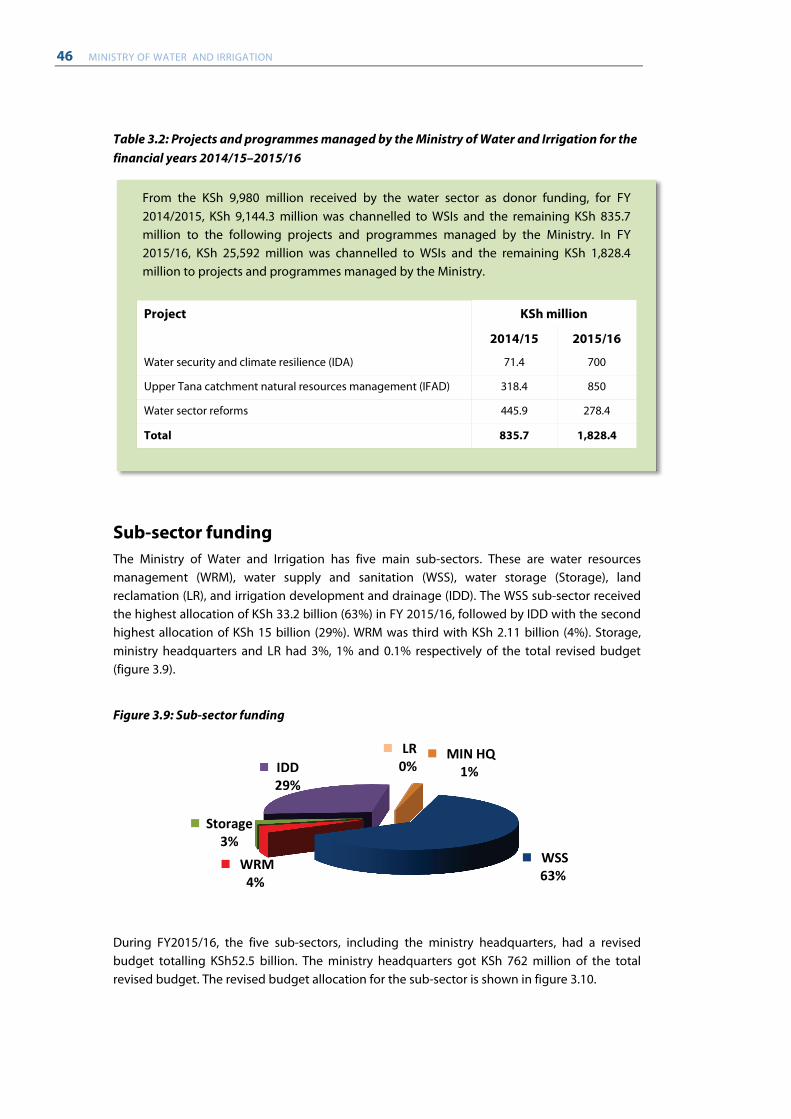
46 MINISTRY OF WATER AND IRRIGATION
Table 3.2: Projects and programmes managed by the Ministry of Water and Irrigation for the financial years 2014/15–2015/16
Sub-sector funding The Ministry of Water and Irrigation has five main sub-sectors. These are water resources management (WRM), water supply and sanitation (WSS), water storage (Storage), land reclamation (LR), and irrigation development and drainage (IDD). The WSS sub-sector received the highest allocation of KSh 33.2 billion (63%) in FY 2015/16, followed by IDD with the second highest allocation of KSh 15 billion (29%). WRM was third with KSh 2.11 billion (4%). Storage, ministry headquarters and LR had 3%, 1% and 0.1% respectively of the total revised budget (figure 3.9).
Figure 3.9: Sub-sector funding
During FY2015/16, the five sub-sectors, including the ministry headquarters, had a revised budget totalling KSh52.5 billion. The ministry headquarters got KSh 762 million of the total revised budget. The revised budget allocation for the sub-sector is shown in figure 3.10.
WSS 63%
WRM 4%
Storage 3%
IDD 29%
LR 0%
MIN HQ 1%
From the KSh 9,980 million received by the water sector as donor funding, for FY 2014/2015, KSh 9,144.3 million was channelled to WSIs and the remaining KSh 835.7 million to the following projects and programmes managed by the Ministry. In FY 2015/16, KSh 25,592 million was channelled to WSIs and the remaining KSh 1,828.4 million to projects and programmes managed by the Ministry.
Project KSh million
2014/15 2015/16
Water security and climate resilience (IDA) 71.4 700
Upper Tana catchment natural resources management (IFAD) 318.4 850
Water sector reforms 445.9 278.4
Total 835.7 1,828.4
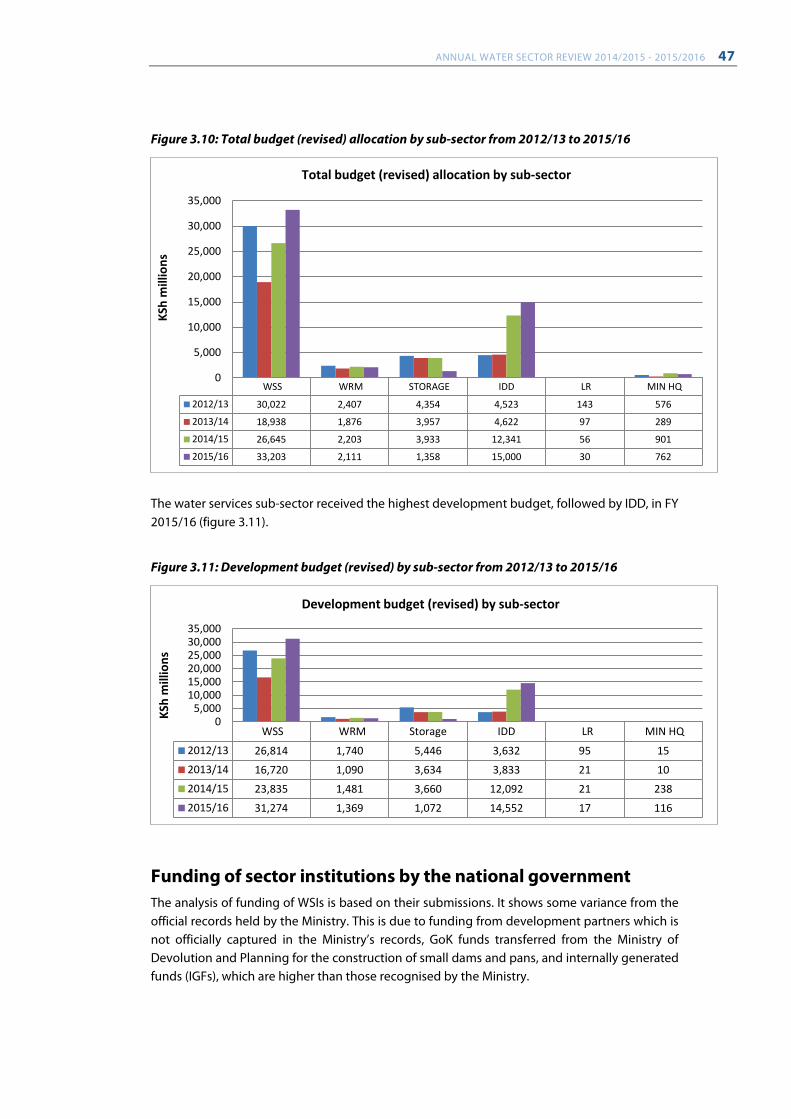
ANNUAL WATER SECTOR REVIEW 2014/2015 - 2015/2016 47
Figure 3.10: Total budget (revised) allocation by sub-sector from 2012/13 to 2015/16
The water services sub-sector received the highest development budget, followed by IDD, in FY 2015/16 (figure 3.11).
Figure 3.11: Development budget (revised) by sub-sector from 2012/13 to 2015/16
Funding of sector institutions by the national government The analysis of funding of WSIs is based on their submissions. It shows some variance from the official records held by the Ministry. This is due to funding from development partners which is not officially captured in the Ministry’s records, GoK funds transferred from the Ministry of Devolution and Planning for the construction of small dams and pans, and internally generated funds (IGFs), which are higher than those recognised by the Ministry.
WSS WRM STORAGE IDD LR MIN HQ
2012/13 30,022 2,407 4,354 4,523 143 576
2013/14 18,938 1,876 3,957 4,622 97 289
2014/15 26,645 2,203 3,933 12,341 56 901
2015/16 33,203 2,111 1,358 15,000 30 762
0
5,000
10,000
15,000
20,000
25,000
30,000
35,000
KSh
mill
ions
Total budget (revised) allocation by sub-sector
WSS WRM Storage IDD LR MIN HQ
2012/13 26,814 1,740 5,446 3,632 95 152013/14 16,720 1,090 3,634 3,833 21 102014/15 23,835 1,481 3,660 12,092 21 2382015/16 31,274 1,369 1,072 14,552 17 116
05,000
10,00015,00020,00025,00030,00035,000
KSh
mill
ions
Development budget (revised) by sub-sector
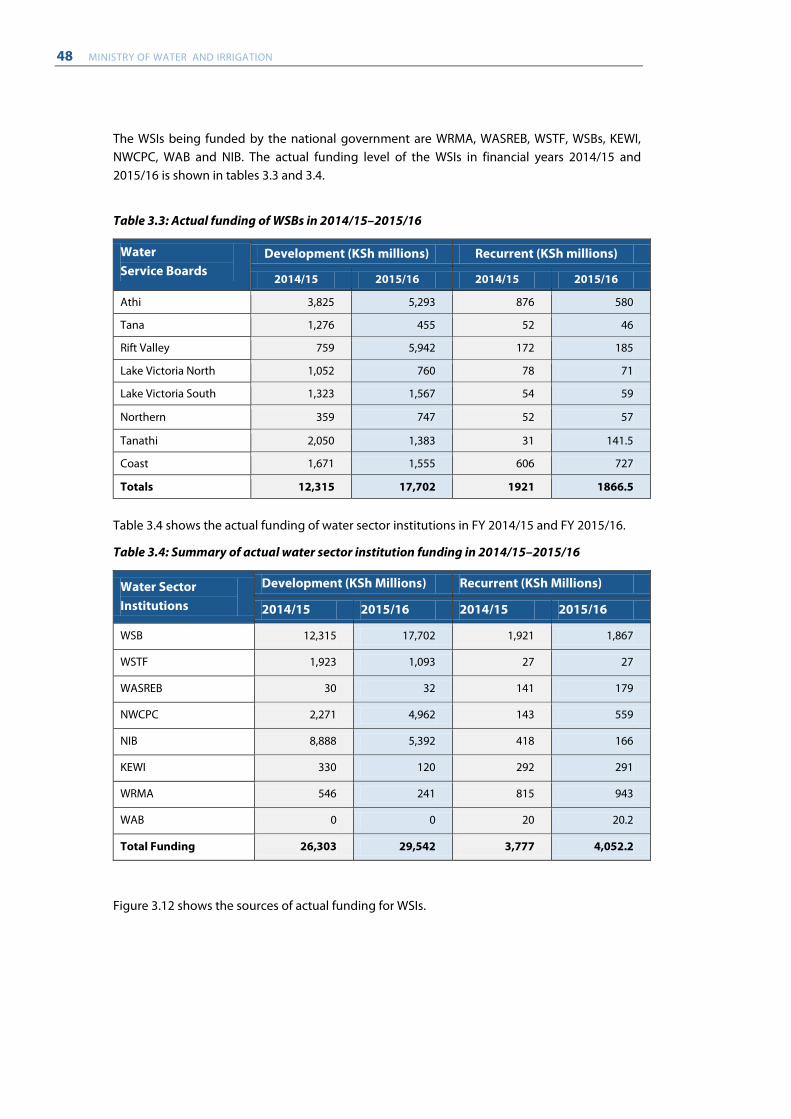
48 MINISTRY OF WATER AND IRRIGATION
The WSIs being funded by the national government are WRMA, WASREB, WSTF, WSBs, KEWI, NWCPC, WAB and NIB. The actual funding level of the WSIs in financial years 2014/15 and 2015/16 is shown in tables 3.3 and 3.4.
Table 3.3: Actual funding of WSBs in 2014/15–2015/16
Water Service Boards
Development (KSh millions) Recurrent (KSh millions)
2014/15 2015/16 2014/15 2015/16
Athi 3,825 5,293 876 580
Tana 1,276 455 52 46
Rift Valley 759 5,942 172 185
Lake Victoria North 1,052 760 78 71
Lake Victoria South 1,323 1,567 54 59
Northern 359 747 52 57
Tanathi 2,050 1,383 31 141.5
Coast 1,671 1,555 606 727
Totals 12,315 17,702 1921 1866.5
Table 3.4 shows the actual funding of water sector institutions in FY 2014/15 and FY 2015/16.
Table 3.4: Summary of actual water sector institution funding in 2014/15–2015/16
Water Sector Institutions
Development (KSh Millions) Recurrent (KSh Millions)
2014/15 2015/16 2014/15 2015/16
WSB 12,315 17,702 1,921 1,867
WSTF 1,923 1,093 27 27
WASREB 30 32 141 179
NWCPC 2,271 4,962 143 559
NIB 8,888 5,392 418 166
KEWI 330 120 292 291
WRMA 546 241 815 943
WAB 0 0 20 20.2
Total Funding 26,303 29,542 3,777 4,052.2
Figure 3.12 shows the sources of actual funding for WSIs.
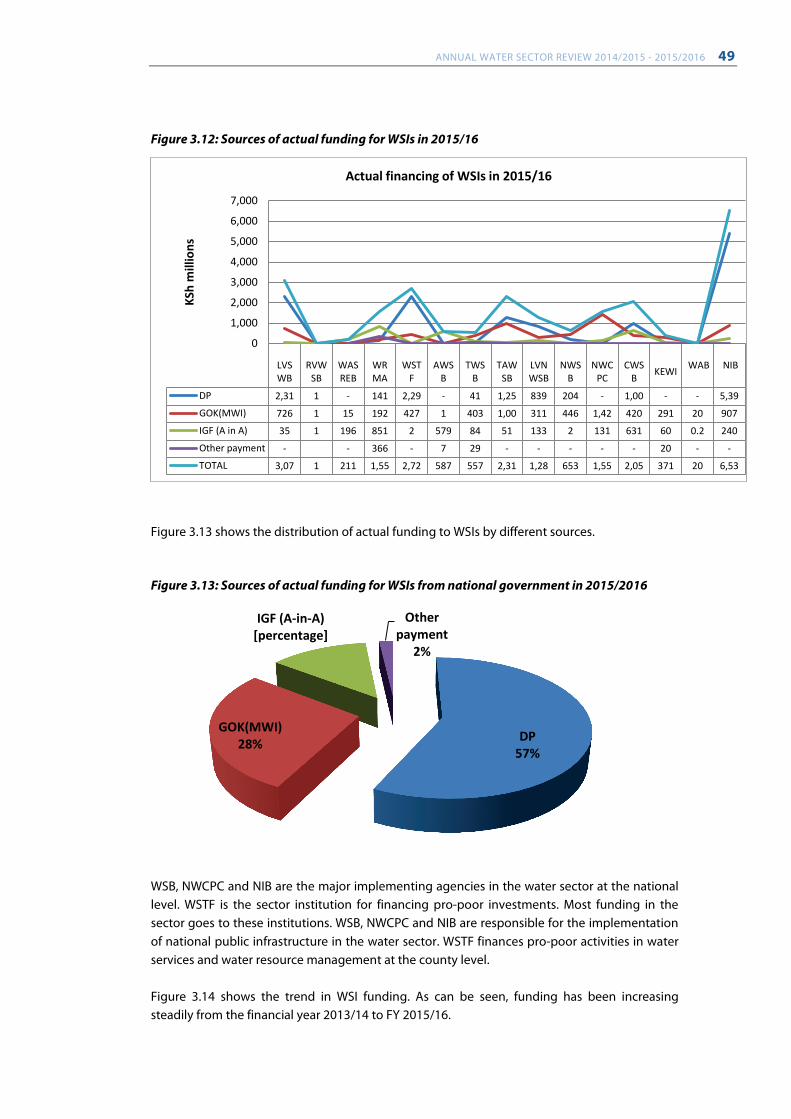
ANNUAL WATER SECTOR REVIEW 2014/2015 - 2015/2016 49
Figure 3.12: Sources of actual funding for WSIs in 2015/16
Figure 3.13 shows the distribution of actual funding to WSIs by different sources.
Figure 3.13: Sources of actual funding for WSIs from national government in 2015/2016
WSB, NWCPC and NIB are the major implementing agencies in the water sector at the national level. WSTF is the sector institution for financing pro-poor investments. Most funding in the sector goes to these institutions. WSB, NWCPC and NIB are responsible for the implementation of national public infrastructure in the water sector. WSTF finances pro-poor activities in water services and water resource management at the county level. Figure 3.14 shows the trend in WSI funding. As can be seen, funding has been increasing steadily from the financial year 2013/14 to FY 2015/16.
LVSWB
RVWSB
WASREB
WRMA
WSTF
AWSB
TWSB
TAWSB
LVNWSB
NWSB
NWCPC
CWSB KEWI WAB NIB
DP 2,31 1 - 141 2,29 - 41 1,25 839 204 - 1,00 - - 5,39
GOK(MWI) 726 1 15 192 427 1 403 1,00 311 446 1,42 420 291 20 907
IGF (A in A) 35 1 196 851 2 579 84 51 133 2 131 631 60 0.2 240
Other payment - - 366 - 7 29 - - - - - 20 - -
TOTAL 3,07 1 211 1,55 2,72 587 557 2,31 1,28 653 1,55 2,05 371 20 6,53
0
1,000
2,000
3,000
4,000
5,000
6,000
7,000KS
h m
illio
ns
Actual financing of WSIs in 2015/16
DP 57%
GOK(MWI) 28%
IGF (A-in-A) [percentage]
Other payment
2%
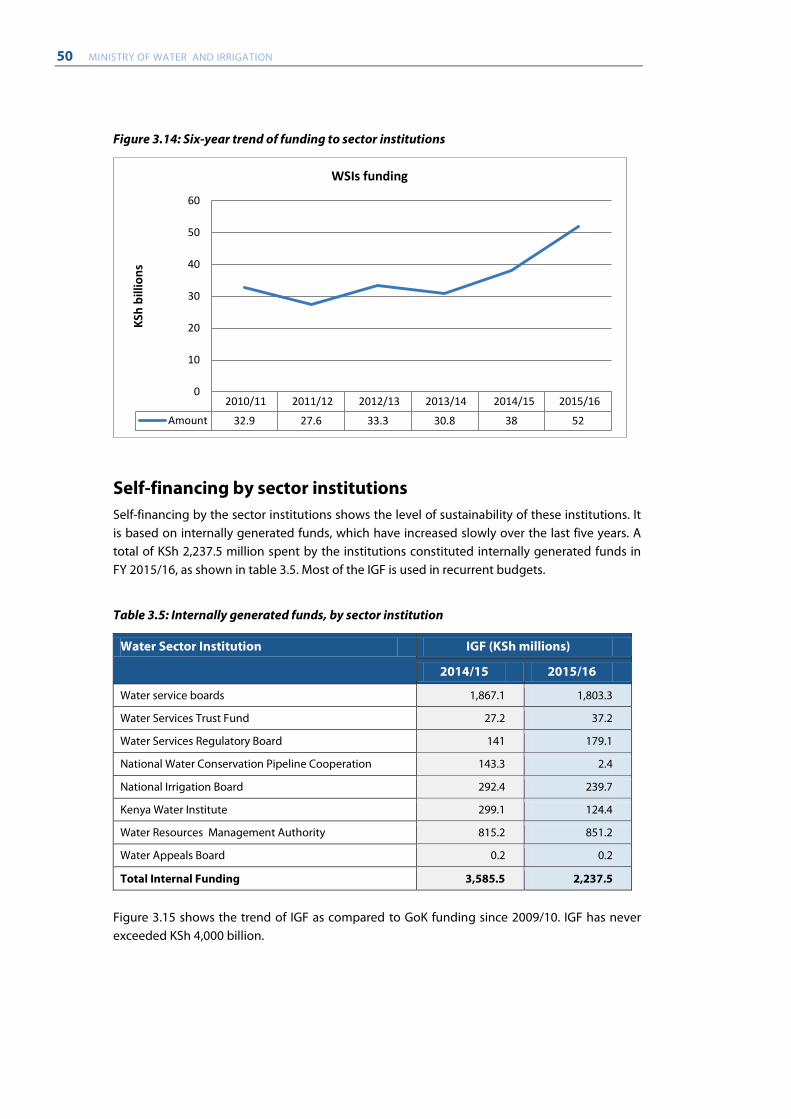
50 MINISTRY OF WATER AND IRRIGATION
Figure 3.14: Six-year trend of funding to sector institutions
Self-financing by sector institutions Self-financing by the sector institutions shows the level of sustainability of these institutions. It is based on internally generated funds, which have increased slowly over the last five years. A total of KSh 2,237.5 million spent by the institutions constituted internally generated funds in FY 2015/16, as shown in table 3.5. Most of the IGF is used in recurrent budgets.
Table 3.5: Internally generated funds, by sector institution
Water Sector Institution IGF (KSh millions)
2014/15 2015/16
Water service boards 1,867.1 1,803.3
Water Services Trust Fund 27.2 37.2
Water Services Regulatory Board 141 179.1
National Water Conservation Pipeline Cooperation 143.3 2.4
National Irrigation Board 292.4 239.7
Kenya Water Institute 299.1 124.4
Water Resources Management Authority 815.2 851.2
Water Appeals Board 0.2 0.2
Total Internal Funding 3,585.5 2,237.5
Figure 3.15 shows the trend of IGF as compared to GoK funding since 2009/10. IGF has never exceeded KSh 4,000 billion.
2010/11 2011/12 2012/13 2013/14 2014/15 2015/16
Amount 32.9 27.6 33.3 30.8 38 52
0
10
20
30
40
50
60
KSh
billi
ons
WSIs funding
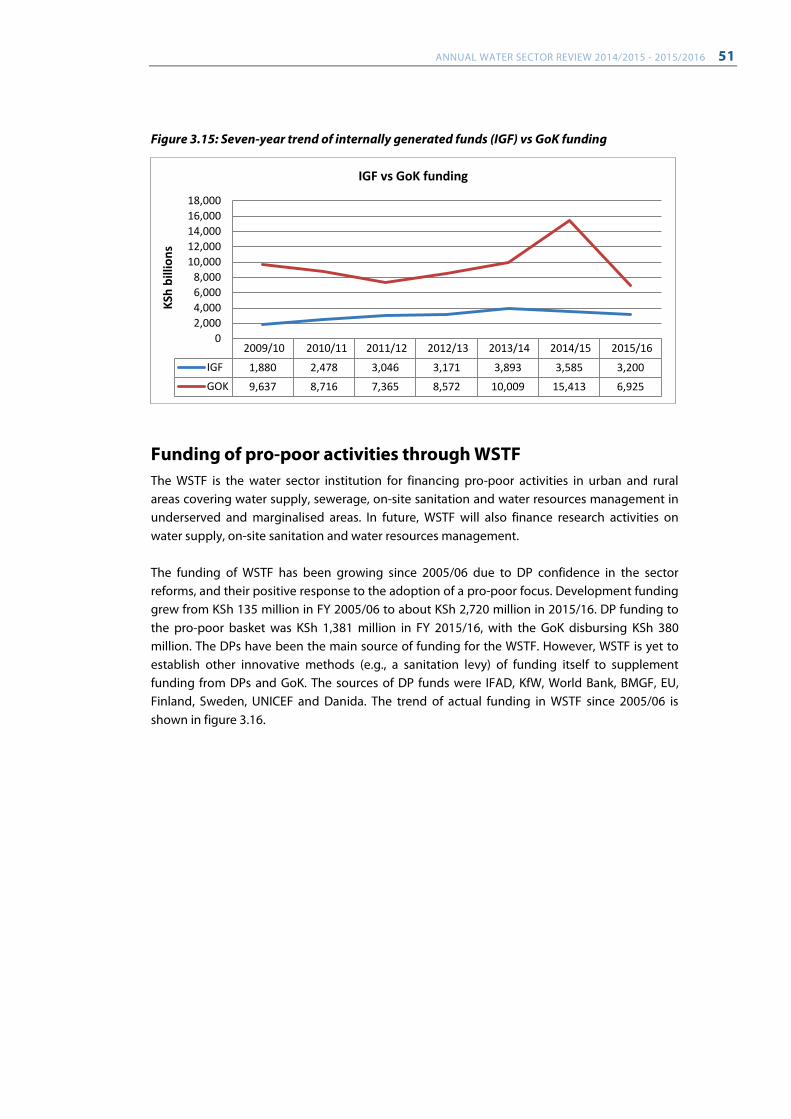
ANNUAL WATER SECTOR REVIEW 2014/2015 - 2015/2016 51
Figure 3.15: Seven-year trend of internally generated funds (IGF) vs GoK funding
Funding of pro-poor activities through WSTF The WSTF is the water sector institution for financing pro-poor activities in urban and rural areas covering water supply, sewerage, on-site sanitation and water resources management in underserved and marginalised areas. In future, WSTF will also finance research activities on water supply, on-site sanitation and water resources management. The funding of WSTF has been growing since 2005/06 due to DP confidence in the sector reforms, and their positive response to the adoption of a pro-poor focus. Development funding grew from KSh 135 million in FY 2005/06 to about KSh 2,720 million in 2015/16. DP funding to the pro-poor basket was KSh 1,381 million in FY 2015/16, with the GoK disbursing KSh 380 million. The DPs have been the main source of funding for the WSTF. However, WSTF is yet to establish other innovative methods (e.g., a sanitation levy) of funding itself to supplement funding from DPs and GoK. The sources of DP funds were IFAD, KfW, World Bank, BMGF, EU, Finland, Sweden, UNICEF and Danida. The trend of actual funding in WSTF since 2005/06 is shown in figure 3.16.
2009/10 2010/11 2011/12 2012/13 2013/14 2014/15 2015/16
IGF 1,880 2,478 3,046 3,171 3,893 3,585 3,200GOK 9,637 8,716 7,365 8,572 10,009 15,413 6,925
02,0004,0006,0008,000
10,00012,00014,00016,00018,000
KSh
billi
ons
IGF vs GoK funding
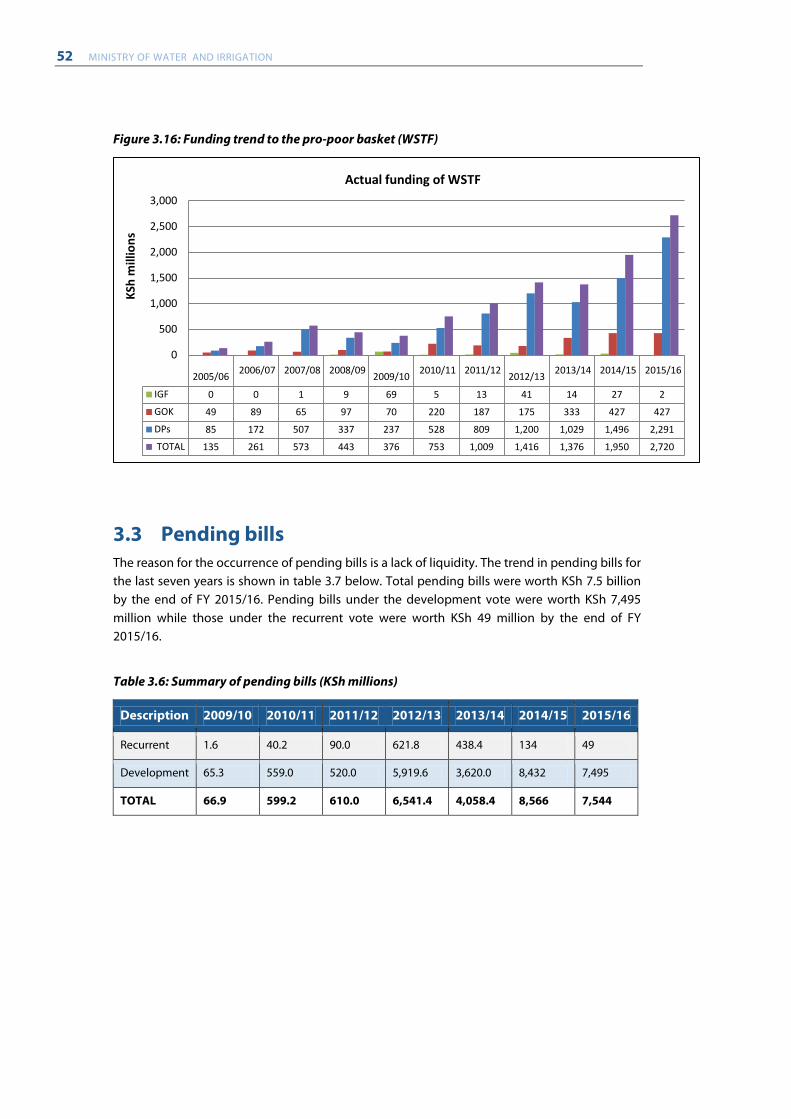
52 MINISTRY OF WATER AND IRRIGATION
Figure 3.16: Funding trend to the pro-poor basket (WSTF)
3.3 Pending bills The reason for the occurrence of pending bills is a lack of liquidity. The trend in pending bills for the last seven years is shown in table 3.7 below. Total pending bills were worth KSh 7.5 billion by the end of FY 2015/16. Pending bills under the development vote were worth KSh 7,495 million while those under the recurrent vote were worth KSh 49 million by the end of FY 2015/16.
Table 3.6: Summary of pending bills (KSh millions)
Description 2009/10 2010/11 2011/12 2012/13 2013/14 2014/15 2015/16
Recurrent 1.6 40.2 90.0 621.8 438.4 134 49
Development 65.3 559.0 520.0 5,919.6 3,620.0 8,432 7,495
TOTAL 66.9 599.2 610.0 6,541.4 4,058.4 8,566 7,544
2005/06 2006/07 2007/08 2008/09 2009/10 2010/11 2011/12 2012/13 2013/14 2014/15 2015/16
IGF 0 0 1 9 69 5 13 41 14 27 2
GOK 49 89 65 97 70 220 187 175 333 427 427
DPs 85 172 507 337 237 528 809 1,200 1,029 1,496 2,291
TOTAL 135 261 573 443 376 753 1,009 1,416 1,376 1,950 2,720
0
500
1,000
1,500
2,000
2,500
3,000
KSh
mill
ions
Actual funding of WSTF
ANNUAL WATER SECTOR REVIEW 2014/2015 - 2015/2016 53
3.4 Key challenges and recommendations
Challenges i. Inadequate investment planning and budget monitoring tools,
ii. Absence of a financing policy and model, iii. Weak monitoring and evaluation of projects at national and county level, iv. Delay in disbursement of funds, v. Inadequate monitoring of funds by sector institutions.
Recommendations i. Develop national standards and tools for integrated sector investment planning,
ii. Establish a sector financing policy and model, iii. Establish innovative ways of increasing self-financing in sector institutions, iv. Eliminate the annual financial losses caused by high NRW levels and bad governance, v. Support counties to establish planning, budgeting, monitoring and evaluation
systems, vi. Enhance resource mobilisation in the sector to reduce the huge investment gap,
vii. Enforce good governance at all levels to achieve value for money in the sector.
54 MINISTRY OF WATER AND IRRIGATION
4. PERFORMANCE PROGRESS OF THE SUB-SECTORS
4.1 Water Resources
Overview Every water resource is vested in and held by the national government in trust for the people of Kenya. The CoK 2010 classifies all water resources, including territorial seas, under Article 62 as public land. The water resources sub-sector is responsible for managing and regulating the use of all water resources in the country, including trans-boundary and territorial seawater resources. It implements these functions both at national and basin level through the Water Resources Management Authority (WRMA) headquarters and its six regional offices, respectively, in collaboration with water resources user associations (WRUAs). The water resources management functions are outlined in the CoK 2010, in the fourth schedule part 1, sections 2,11,22(c), 32 and part 2, section 10 (a), 11(a) and 12, and in the new Water Act 2016 part 3 (12).
Regulation of the management and use of water resources The Water Resources Management Authority (WRMA) is a state corporation in the water resources sub-sector of the Ministry and has the following key functions:
a. To formulate and enforce standards, procedures and regulations for the management and use of water resources and flood mitigation,
b. To regulate the management and use of water resources, c. To enforce regulations made under the newly promulgated Water Act 2016, d. To receive water permit applications for water abstraction, water use and recharge,
and determine, issue and vary water permits, and enforce the conditions of those permits,
e. To collect water permit fees and water use charges, f. To determine and set permit and water use fees, g. To provide information and advice to the Cabinet Secretary for the formulation of
policy on national water resource management, water storage and flood control strategies,
h. To coordinate with other regional, national and international bodies for better regulation of the management and use of water resources,
i. To advise the Cabinet Secretary generally on the management and use of water resources.
The WRMA has six regional offices that operate at the catchment level, defined by the major drainage systems. The six major catchment areas are Athi, Ewaso Nyiro North, Tana, Rift Valley, Lake Victoria North and Lake Victoria South. Twenty-seven sub-regional offices have also been established to run specific river sub-basins under the supervision of regional offices.
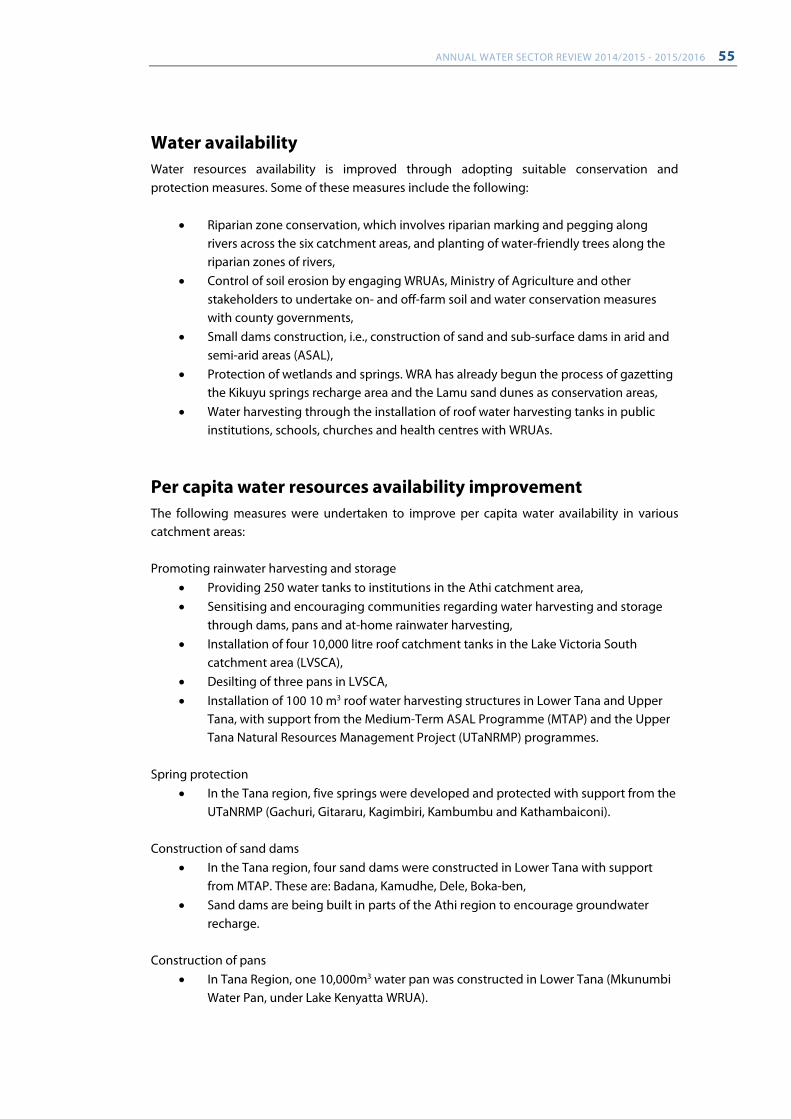
ANNUAL WATER SECTOR REVIEW 2014/2015 - 2015/2016 55
Water availability Water resources availability is improved through adopting suitable conservation and protection measures. Some of these measures include the following:
• Riparian zone conservation, which involves riparian marking and pegging along rivers across the six catchment areas, and planting of water-friendly trees along the riparian zones of rivers,
• Control of soil erosion by engaging WRUAs, Ministry of Agriculture and other stakeholders to undertake on- and off-farm soil and water conservation measures with county governments,
• Small dams construction, i.e., construction of sand and sub-surface dams in arid and semi-arid areas (ASAL),
• Protection of wetlands and springs. WRA has already begun the process of gazetting the Kikuyu springs recharge area and the Lamu sand dunes as conservation areas,
• Water harvesting through the installation of roof water harvesting tanks in public institutions, schools, churches and health centres with WRUAs.
Per capita water resources availability improvement The following measures were undertaken to improve per capita water availability in various catchment areas: Promoting rainwater harvesting and storage
• Providing 250 water tanks to institutions in the Athi catchment area, • Sensitising and encouraging communities regarding water harvesting and storage
through dams, pans and at-home rainwater harvesting, • Installation of four 10,000 litre roof catchment tanks in the Lake Victoria South
catchment area (LVSCA), • Desilting of three pans in LVSCA, • Installation of 100 10 m3 roof water harvesting structures in Lower Tana and Upper
Tana, with support from the Medium-Term ASAL Programme (MTAP) and the Upper Tana Natural Resources Management Project (UTaNRMP) programmes.
Spring protection
• In the Tana region, five springs were developed and protected with support from the UTaNRMP (Gachuri, Gitararu, Kagimbiri, Kambumbu and Kathambaiconi).
Construction of sand dams
• In the Tana region, four sand dams were constructed in Lower Tana with support from MTAP. These are: Badana, Kamudhe, Dele, Boka-ben,
• Sand dams are being built in parts of the Athi region to encourage groundwater recharge.
Construction of pans
• In Tana Region, one 10,000m3 water pan was constructed in Lower Tana (Mkunumbi Water Pan, under Lake Kenyatta WRUA).
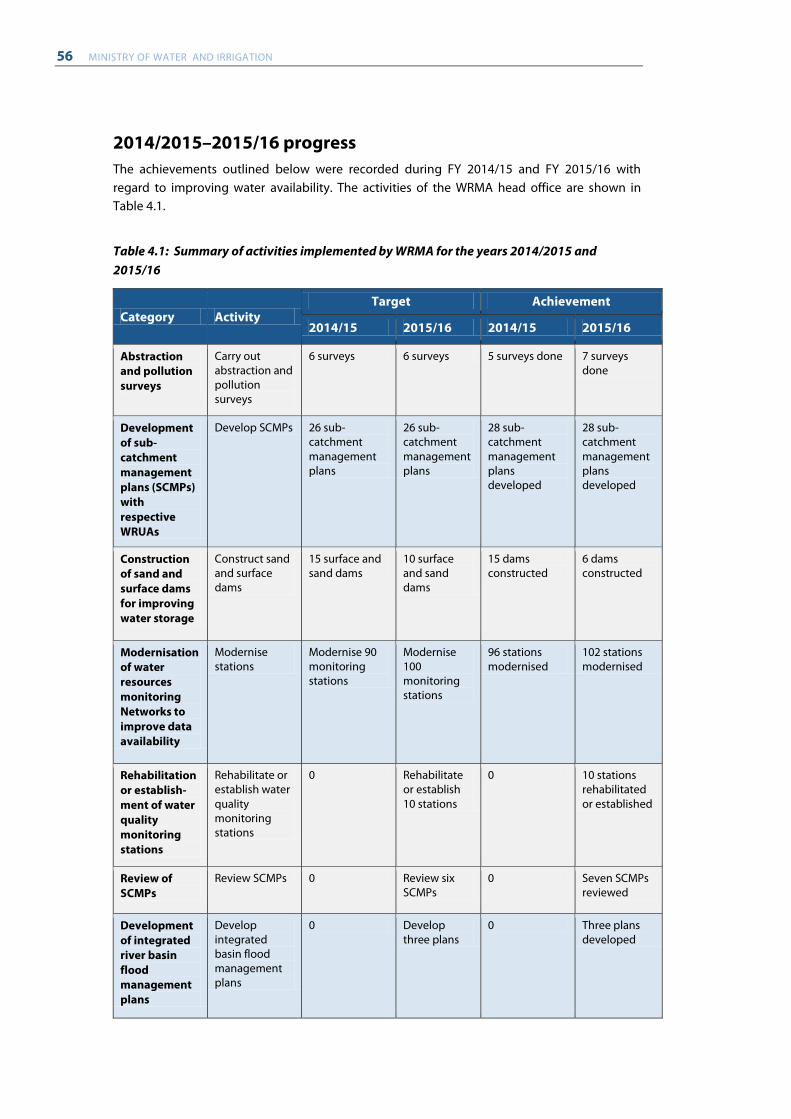
56 MINISTRY OF WATER AND IRRIGATION
2014/2015–2015/16 progress The achievements outlined below were recorded during FY 2014/15 and FY 2015/16 with regard to improving water availability. The activities of the WRMA head office are shown in Table 4.1.
Table 4.1: Summary of activities implemented by WRMA for the years 2014/2015 and 2015/16
Category Activity Target Achievement
2014/15 2015/16 2014/15 2015/16
Abstraction and pollution surveys
Carry out abstraction and pollution surveys
6 surveys 6 surveys 5 surveys done 7 surveys done
Development of sub-catchment management plans (SCMPs) with respective WRUAs
Develop SCMPs 26 sub-catchment management plans
26 sub-catchment management plans
28 sub-catchment management plans developed
28 sub-catchment management plans developed
Construction of sand and surface dams for improving water storage
Construct sand and surface dams
15 surface and sand dams
10 surface and sand dams
15 dams constructed
6 dams constructed
Modernisation of water resources monitoring Networks to improve data availability
Modernise stations
Modernise 90 monitoring stations
Modernise 100 monitoring stations
96 stations modernised
102 stations modernised
Rehabilitation or establish-ment of water quality monitoring stations
Rehabilitate or establish water quality monitoring stations
0 Rehabilitate or establish 10 stations
0 10 stations rehabilitated or established
Review of SCMPs
Review SCMPs 0 Review six SCMPs
0 Seven SCMPs reviewed
Development of integrated river basin flood management plans
Develop integrated basin flood management plans
0 Develop three plans
0 Three plans developed
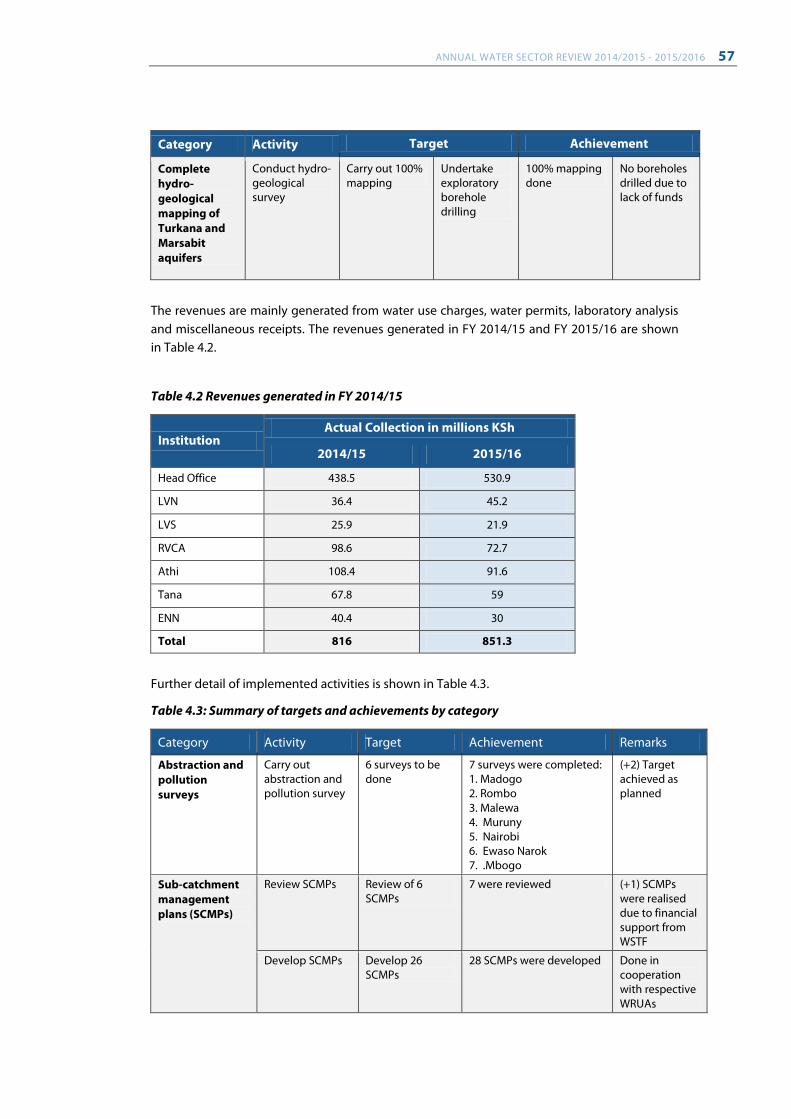
ANNUAL WATER SECTOR REVIEW 2014/2015 - 2015/2016 57
Category Activity Target Achievement
Complete hydro-geological mapping of Turkana and Marsabit aquifers
Conduct hydro-geological survey
Carry out 100% mapping
Undertake exploratory borehole drilling
100% mapping done
No boreholes drilled due to lack of funds
The revenues are mainly generated from water use charges, water permits, laboratory analysis and miscellaneous receipts. The revenues generated in FY 2014/15 and FY 2015/16 are shown in Table 4.2.
Table 4.2 Revenues generated in FY 2014/15
Institution Actual Collection in millions KSh
2014/15 2015/16
Head Office 438.5 530.9
LVN 36.4 45.2
LVS 25.9 21.9
RVCA 98.6 72.7
Athi 108.4 91.6
Tana 67.8 59
ENN 40.4 30
Total 816 851.3
Further detail of implemented activities is shown in Table 4.3.
Table 4.3: Summary of targets and achievements by category
Category Activity Target Achievement Remarks
Abstraction and pollution surveys
Carry out abstraction and pollution survey
6 surveys to be done
7 surveys were completed: 1. Madogo 2. Rombo 3. Malewa 4. Muruny 5. Nairobi 6. Ewaso Narok 7. .Mbogo
(+2) Target achieved as planned
Sub-catchment management plans (SCMPs)
Review SCMPs Review of 6 SCMPs
7 were reviewed (+1) SCMPs were realised due to financial support from WSTF
Develop SCMPs Develop 26 SCMPs
28 SCMPs were developed Done in cooperation with respective WRUAs
58 MINISTRY OF WATER AND IRRIGATION
Construction of sand and surface dams
Construct sand and surface dams
Construct 10 surface and sand dams
Six surface and sand dams were constructed: 1. Boka Ben sand dam 2. Lagha Kamuthe 3. Mkunumbi water pan 4. Lagha Dele sand dam 5. Lagha Badana sand dam 6. Nyadera Kachien water pan
(-4) Negative variance due to non-disbursement of funds
Rehabilitation of water monitoring stations by upgrading 100 RGS to telemetric stations
Rehabilitate stations and upgrade to telemetric stations
Rehabilitate and upgrade 100 monitoring stations
102 monitoring stations were rehabilitated, of which ten were upgraded to telemetric stations
Improving water resources data availability
Hydro-geological mapping of Turkana and Marsabit aquifers
Undertake exploration and monitor drilling of boreholes in the Turkana and Marsabit aquifers
Drill 10 exploratory borehole sites (five in Turkana and five in Marsabit)
None were drilled Drilling not done due to non-disbursement of funds
Flood management
Development of integrated river basin flood management plans
Develop three river basin flood management plans
Three integrated river basin flood management plans were done, namely Awach, Kano, Engare, Narok and Yala
Target achieved as planned
The activities which were undertaken by the Water Resources Management Authority regional offices are summarised in Table 4.4.
Table 4.4: Summary of the activities implemented by the regional offices
Activities Athi Tana LVN LVS RV ENN
1 Established new river gauging stations for river flow measurements and water level monitoring
2 1 1 - 1 1
2 Developed sub catchment management plans 1 13 1 7 3 8
3 Upgraded surface water monitoring stations for river flow measurements and water level monitoring
3 5 1 4 1 -
4 Carried out water abstraction surveys 1 1 2 1 2 1
5 Carried out pollution surveys 1 1 2 1 2 1
6 Reviewed sub catchment management plans 1 4 - 1 1 3
7 Developed integrated flood management plans - - 1 1 1 -
8 Rehabilitated river gauging stations 16 7 2 4 1 2
Water resources data availability The following measures were undertaken to improve water resources data availability in both quantitative and qualitative terms:
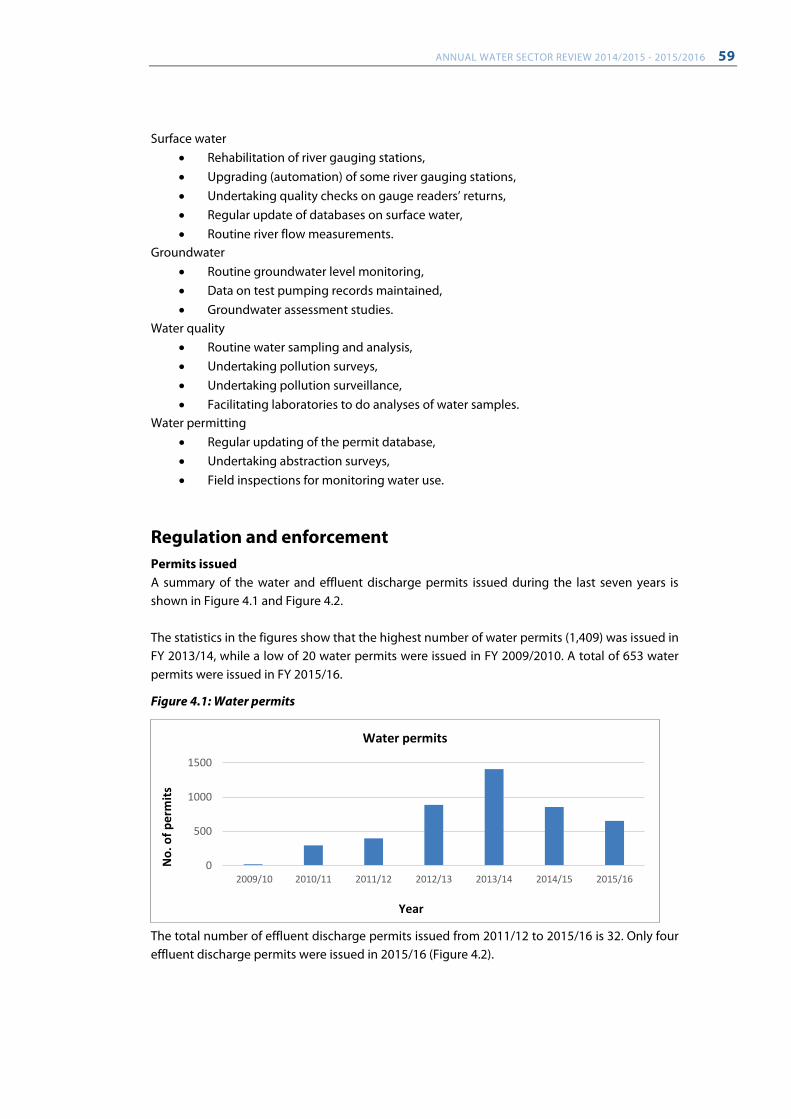
ANNUAL WATER SECTOR REVIEW 2014/2015 - 2015/2016 59
Surface water • Rehabilitation of river gauging stations, • Upgrading (automation) of some river gauging stations, • Undertaking quality checks on gauge readers’ returns, • Regular update of databases on surface water, • Routine river flow measurements.
Groundwater • Routine groundwater level monitoring, • Data on test pumping records maintained, • Groundwater assessment studies.
Water quality • Routine water sampling and analysis, • Undertaking pollution surveys, • Undertaking pollution surveillance, • Facilitating laboratories to do analyses of water samples.
Water permitting • Regular updating of the permit database, • Undertaking abstraction surveys, • Field inspections for monitoring water use.
Regulation and enforcement Permits issued A summary of the water and effluent discharge permits issued during the last seven years is shown in Figure 4.1 and Figure 4.2. The statistics in the figures show that the highest number of water permits (1,409) was issued in FY 2013/14, while a low of 20 water permits were issued in FY 2009/2010. A total of 653 water permits were issued in FY 2015/16.
Figure 4.1: Water permits
The total number of effluent discharge permits issued from 2011/12 to 2015/16 is 32. Only four effluent discharge permits were issued in 2015/16 (Figure 4.2).
0
500
1000
1500
2009/10 2010/11 2011/12 2012/13 2013/14 2014/15 2015/16
No.
of p
erm
its
Year
Water permits
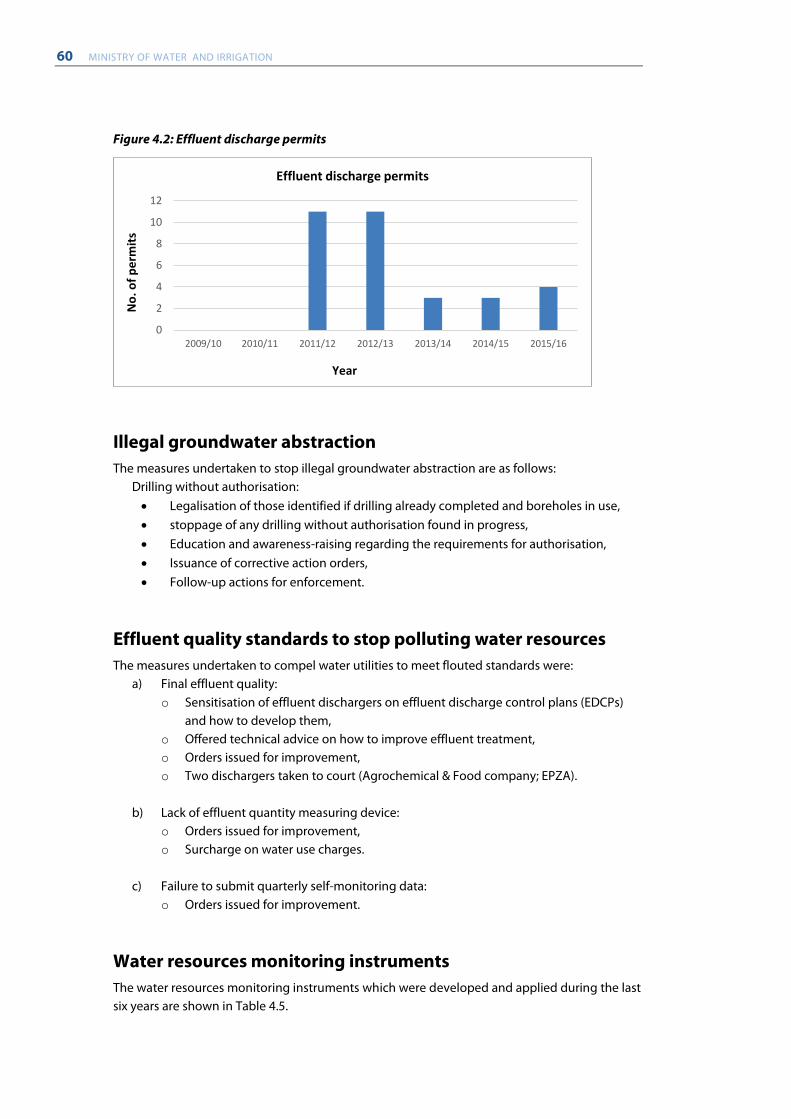
60 MINISTRY OF WATER AND IRRIGATION
Figure 4.2: Effluent discharge permits
Illegal groundwater abstraction The measures undertaken to stop illegal groundwater abstraction are as follows:
Drilling without authorisation: • Legalisation of those identified if drilling already completed and boreholes in use, • stoppage of any drilling without authorisation found in progress, • Education and awareness-raising regarding the requirements for authorisation, • Issuance of corrective action orders, • Follow-up actions for enforcement.
Effluent quality standards to stop polluting water resources The measures undertaken to compel water utilities to meet flouted standards were:
a) Final effluent quality: o Sensitisation of effluent dischargers on effluent discharge control plans (EDCPs)
and how to develop them, o Offered technical advice on how to improve effluent treatment, o Orders issued for improvement, o Two dischargers taken to court (Agrochemical & Food company; EPZA).
b) Lack of effluent quantity measuring device: o Orders issued for improvement, o Surcharge on water use charges.
c) Failure to submit quarterly self-monitoring data:
o Orders issued for improvement.
Water resources monitoring instruments The water resources monitoring instruments which were developed and applied during the last six years are shown in Table 4.5.
0
2
4
6
8
10
12
2009/10 2010/11 2011/12 2012/13 2013/14 2014/15 2015/16
No.
of p
erm
its
Year
Effluent discharge permits
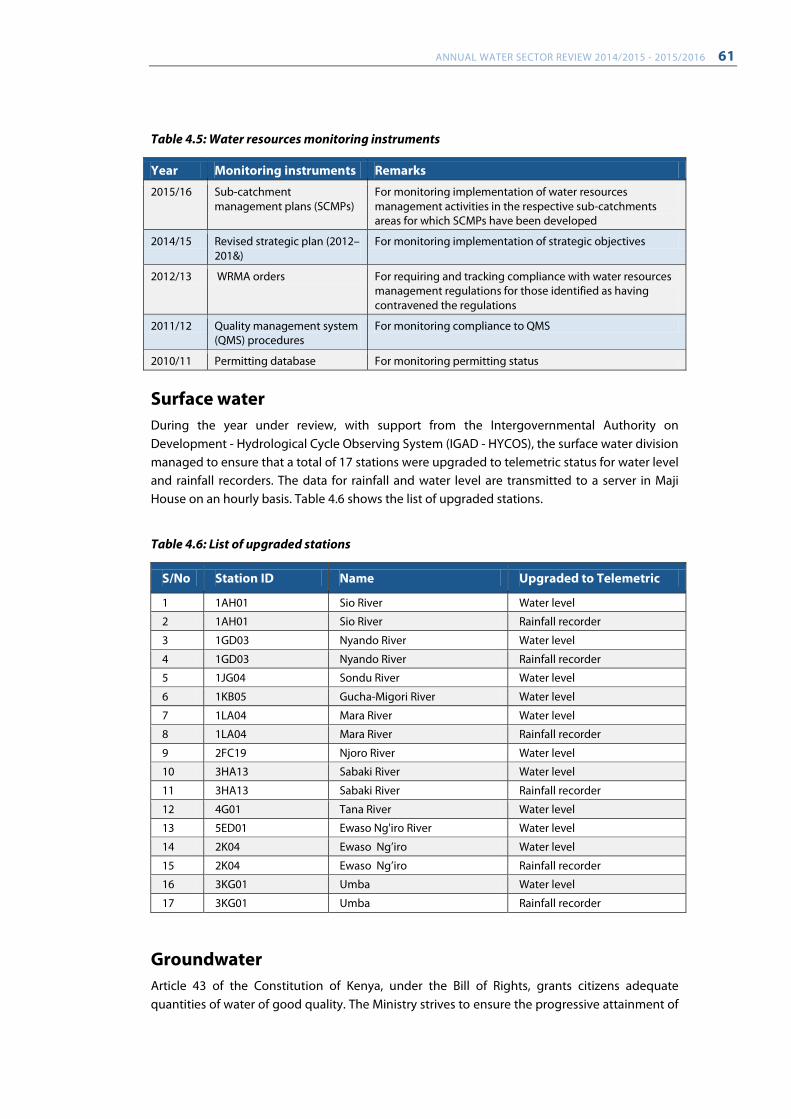
ANNUAL WATER SECTOR REVIEW 2014/2015 - 2015/2016 61
Table 4.5: Water resources monitoring instruments
Year Monitoring instruments Remarks
2015/16 Sub-catchment management plans (SCMPs)
For monitoring implementation of water resources management activities in the respective sub-catchments areas for which SCMPs have been developed
2014/15 Revised strategic plan (2012–201&)
For monitoring implementation of strategic objectives
2012/13 WRMA orders For requiring and tracking compliance with water resources management regulations for those identified as having contravened the regulations
2011/12 Quality management system (QMS) procedures
For monitoring compliance to QMS
2010/11 Permitting database For monitoring permitting status
Surface water During the year under review, with support from the Intergovernmental Authority on Development - Hydrological Cycle Observing System (IGAD - HYCOS), the surface water division managed to ensure that a total of 17 stations were upgraded to telemetric status for water level and rainfall recorders. The data for rainfall and water level are transmitted to a server in Maji House on an hourly basis. Table 4.6 shows the list of upgraded stations.
Table 4.6: List of upgraded stations
S/No Station ID Name Upgraded to Telemetric
1 1AH01 Sio River Water level
2 1AH01 Sio River Rainfall recorder
3 1GD03 Nyando River Water level
4 1GD03 Nyando River Rainfall recorder
5 1JG04 Sondu River Water level
6 1KB05 Gucha-Migori River Water level
7 1LA04 Mara River Water level
8 1LA04 Mara River Rainfall recorder
9 2FC19 Njoro River Water level
10 3HA13 Sabaki River Water level
11 3HA13 Sabaki River Rainfall recorder
12 4G01 Tana River Water level
13 5ED01 Ewaso Ng'iro River Water level
14 2K04 Ewaso Ng’iro Water level
15 2K04 Ewaso Ng’iro Rainfall recorder
16 3KG01 Umba Water level
17 3KG01 Umba Rainfall recorder
Groundwater Article 43 of the Constitution of Kenya, under the Bill of Rights, grants citizens adequate quantities of water of good quality. The Ministry strives to ensure the progressive attainment of
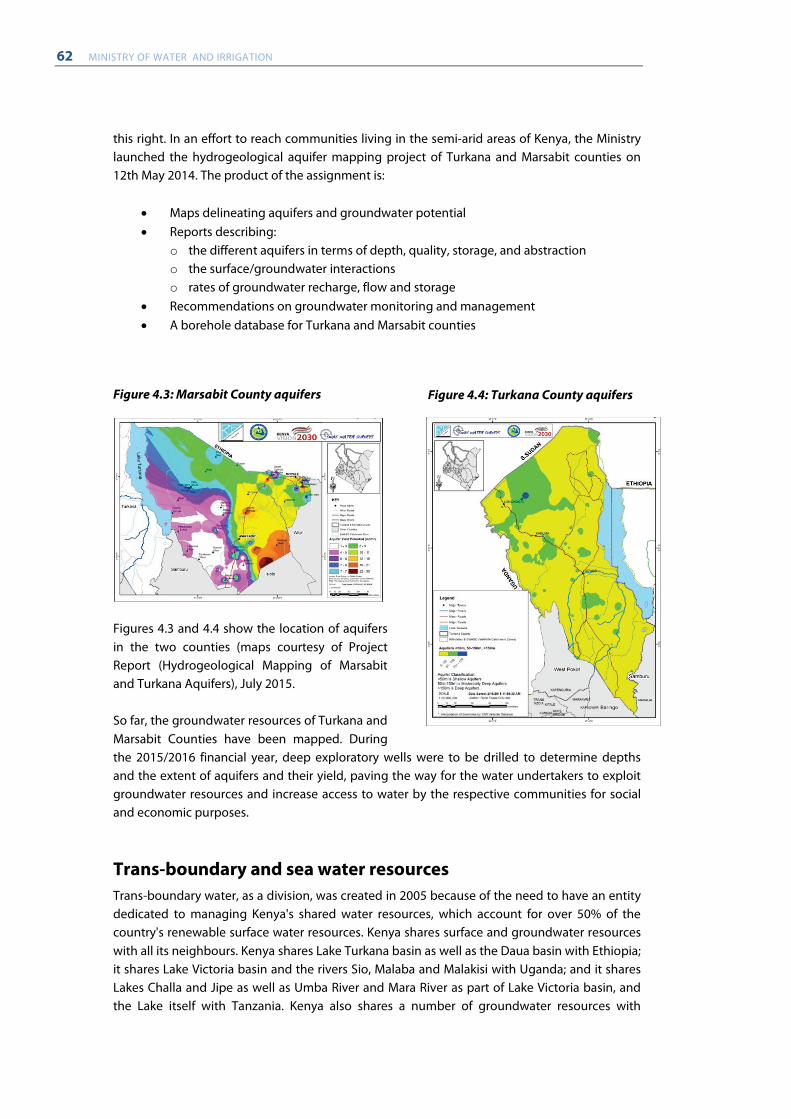
62 MINISTRY OF WATER AND IRRIGATION
this right. In an effort to reach communities living in the semi-arid areas of Kenya, the Ministry launched the hydrogeological aquifer mapping project of Turkana and Marsabit counties on 12th May 2014. The product of the assignment is:
• Maps delineating aquifers and groundwater potential • Reports describing:
o the different aquifers in terms of depth, quality, storage, and abstraction o the surface/groundwater interactions o rates of groundwater recharge, flow and storage
• Recommendations on groundwater monitoring and management • A borehole database for Turkana and Marsabit counties
Figure 4.3: Marsabit County aquifers
Figures 4.3 and 4.4 show the location of aquifers in the two counties (maps courtesy of Project Report (Hydrogeological Mapping of Marsabit and Turkana Aquifers), July 2015. So far, the groundwater resources of Turkana and Marsabit Counties have been mapped. During the 2015/2016 financial year, deep exploratory wells were to be drilled to determine depths and the extent of aquifers and their yield, paving the way for the water undertakers to exploit groundwater resources and increase access to water by the respective communities for social and economic purposes.
Trans-boundary and sea water resources Trans-boundary water, as a division, was created in 2005 because of the need to have an entity dedicated to managing Kenya's shared water resources, which account for over 50% of the country's renewable surface water resources. Kenya shares surface and groundwater resources with all its neighbours. Kenya shares Lake Turkana basin as well as the Daua basin with Ethiopia; it shares Lake Victoria basin and the rivers Sio, Malaba and Malakisi with Uganda; and it shares Lakes Challa and Jipe as well as Umba River and Mara River as part of Lake Victoria basin, and the Lake itself with Tanzania. Kenya also shares a number of groundwater resources with
Figure 4.4: Turkana County aquifers
ANNUAL WATER SECTOR REVIEW 2014/2015 - 2015/2016 63
virtually all her neighbours. These resources, being considered shared resources, are managed as international watercourses by use of international instruments. Access to the shared resources is achieved through negotiations by use of international law, conventions and other such instruments. Marine resources are regulated by the United Nation's International Convention on the Law of The Sea (UNCLOS). The 1982 United Nations Convention on the Law of the Sea, which forms the basis of the modern legal framework for ocean governance, defines the rights and responsibilities of nations in their use of the world's oceans. This is by establishing guidelines for the sustainable use and management of marine natural resources. UNCLOS further sets out principles and norms for the conduct of relations among States on maritime issues. It is in this sense that the Convention contributes immensely to the maintenance of global peace and security. Kenya, during the 24th UNCLOS meeting held in New York (June 2014), presented a proposal for an extension of the area of its exclusive economic zone from 200 nautical miles (NM) to 350 NM as provided for by the Convention. Project for sustainable development in Lake Turkana and its river basins – (a joint project between Ethiopia, Kenya and UNEP) Under the auspices of UNEP and a consortium of other stakeholders, the Republic of Kenya and the Federal Democratic Republic of Ethiopia have negotiated a programme called Support to Sustainable Development in Lake Turkana and its Rivers Basins: Environmental Assessment, Establishment of Management Mechanism and Sustainable Livelihood. This is principally a joint project between the two riparian states and the United Nations Environment Programme, whose thrust is to support the exchange of data and information with a view to instituting scientifically sound management of the shared water resources of the Turkana ecosystem. Kenya has secured the support of the state departments of Foreign Affairs and International Trade, Environment and Natural Resources, and Culture and National Heritage. The project document is ready for signature by the parties. In the meantime, the Government has nominated both the ministerial steering committee and a technical committee.
Cooperative frameworks for the management of Daua River Basin (Kenya, Ethiopia and Somalia) The Daua River Basin is shared by Kenya, Ethiopia and Somalia. It has its source in the Ethiopian Highlands called Aleta Wendo, flowing south forming a border with Kenya, later flowing east to join Genale Dorya to form the Jubba River, and then flowing south through Somalia and emptying into the Indian Ocean. The River basin is characterised by downstream seasonal flooding around Mandera Town, Mandera County. The Ministry of Water and Irrigation has developed a proposal together with the Mandera County Government that seeks to harness the Daua floods by constructing a multipurpose dam in Mandera to support domestic water supply, livestock rearing, irrigated agriculture and hydropower generation. Under IGAD sponsored discussions, the three governments are set to negotiate and develop a tripartite agreement that will see the water resources of the basin developed to benefit communities living within the basin. This process began in the 2014/2015 financial year with three preliminary trilateral consultations held between the parties, excluding Somalia. Efforts to bring Somalia to the table n board are ongoing, and a number of meetings have been lined up.
64 MINISTRY OF WATER AND IRRIGATION
MOU roll-out on Lakes Challa and Jipe and Umba River Basin (Kenya and Tanzania) Under the auspices of the Lake Victoria Basin Commission, The Republic of Kenya and the United Republic of Tanzania have jointly negotiated and signed an MOU on Lakes Challa and Jipe and Umba River. The two countries intend to operationalise the provisions of the MOU through launching the joint committees that have since been formed by the riparian countries. The committee is to jointly identify shared projects and become a clearing house for individual country-specific projects for the sustainable management and development of the shared basins. At the same time, a hydrogeological study of Lake Chala has commenced, as a collaborative effort between the University of Nairobi, the Water Resources Management Authority and the Department of Transboundary Water Resources.
Water rights Responsibilities of the Water Rights Division are as follows: offer public guidance in the interpretation of the Water Act and other related regulations; receive and process applications for water contractors and professionals licences; and facilitate water resource conflict resolution. During the period under review, the division managed to register 105 professional engineers, hydrogeologists, hydrologists and chemists and facilitated the registration and gazettement of 571 waterworks contractors. In the process, the division managed to raise revenues in excess of KSh 2.9 billion in 2014/2015 and a lesser value of KSh 1.8 billion in the year 2015/2016. The division helped resolve conflicts and carried out a number of prosecutions.
Key challenges and recommendations The major challenges experienced in the period under review were:
a) Inadequate funding o The 6 WRMA regional offices faced inadequate funding thus affecting their ability
to manage water resources, control water quality and pollution, and carry out inspection of completed works to enable issuance of water use permits,
o The high number of newly formed WRUAs had insufficient funding to develop and implement the SCMPs.
b) Water resources data collection
o There was limited funding, hence minimal data was collected at monitoring stations,
o The operation and maintenance of monitoring stations was inadequate, due to limited funding,
o Low levels of monitoring, evaluation and collection of water resource data, resulted in poor data management,
o There was inadequate data on groundwater. c) Water pollution
o There is inadequate facilitation and capacity to enforce pollution control, many rivers are polluted, compliance with effluent discharge standards is low and there is inadequate support from other institutions in pollution control, e.g., county governments,
ANNUAL WATER SECTOR REVIEW 2014/2015 - 2015/2016 65
o Some poorly operating wastewater treatment plants in urban areas are polluting rivers with untreated effluent.
d) Monitoring water use
o There is inadequate funding for enforcement and control of illegal abstractions.
e) Availability of water in dry periods o Due to limited storage, water in rivers was inadequate to meet the demand e.g.,
for irrigation and public water supply.
f) Regulation and enforcement o Incidences of illegal abstractions were high and, at times, over-abstraction of
water resources occurred, o Security organs were reluctant to provide security officers during enforcement
exercises.
g) Capacity building o There was poor visibility and low awareness of water resources management sub-
sector mandate, activities and outcomes, o Staff capacity is inadequate to carry out technical functions.
h) Catchment degradation
o Destruction of water catchment towers and areas. o Encroachment of catchment areas.
Other challenges experienced during the period under review were:
• The interference by some county governments on shared water resources e.g., setting conditions for the transfer of water resources from one county to another,
• A trans-boundary waters department is required for focused attention on shared waters, as these constitute over 50% of Kenya's renewable water resources,
• Securing joint management agreements for shared water resources is a process that takes time to be realised,
• There is a need to constitute and train trans-boundary waters national negotiating teams,
• Water research funding needs to be factored into the budget. Recommendations
• Establish an adequate database for groundwater resources, • The Ministry, in collaboration with the WRA, needs to develop and sign data contracts
with WRUAs and other agencies as a robust bottom-up data- and information-gathering mechanism. In addition, a water resource management information system (WRMIS) should be fast-tracked and its full use enforced and strengthened,
• WRUAs, as agents for grass-roots water resources management, should be formed in all watersheds and empowered to register all water users, to rein in illegal abstractors and to ensure all abstractors have metered connections and their water use is monitored. Besides this, abstraction surveys should periodically be conducted and monitoring strengthened,
66 MINISTRY OF WATER AND IRRIGATION
• The Ministry and WRA headquarters should support and ensure annual and comprehensive reporting, and create awareness regarding water resources management, its significance and the various activities and their expected outcomes and impacts,
• WRA should communicate its activities to the public for awareness creation, • Revamp water research to realise its full potential for optimal benefit to the sector.
4.2 Water Services Overview Access to adequate sanitation and safe water supply is a human right enshrined in CoK 2010 and the Water Act 2016. The Kenyan water sector adopted human rights criteria in 2006 and started implementing these immediately. Water services are crucial for the social and economic development of the country. The provision of water services has been devolved as a function of county governments as per Schedule Four of the CoK 2010. Water services include water supply, sewerage and on-site sanitation services including faecal sludge management. The MWI is responsible for policy formulation, coordination and resource mobilisation at the national level. The MWI is also responsible for on-site sanitation management according to executive order no. 2 of 2013. The water services boards (in future the Water Works Development Agency) are responsible for the development of national infrastructure for water services which may cover one or more counties. Counties are responsible for county infrastructure for water services. Utilities, as agents of county governments, are responsible for water services provision within the respective counties. County governments can form one or more utilities following the regulatory guidelines as per the Water Act 2016. In FY 2014/15, water supply coverage improved by 1.0% nationally from 55.9% to 56.9%. Sewerage services improved by 0.8% from 9.4% to 10.2% while the overall on-site sanitation coverage decreased by 1.6% from 68.5% to 66.9%. In FY 2015/16, water supply coverage improved by 1.1% nationally from 56.9% to 58.0%. Sewerage services increased by 0.3% from 10.2% to 10.5% while the overall onsite sanitation coverage decreased by 0.5 % from 66.9% to 66.4%.
4.2.1 Regulation of water services The Water Services Regulatory Board (WASREB) is the national institution within the water sector charged with the responsibility of regulating water services. This is done in line with consumer rights protection, as per Article 46, and social rights protection, as per Article 43 of CoK 2010. The powers and functions of WASREB include, among others, prescribing national standards for provision of water services, tariff setting, setting licence conditions, accrediting water service providers, enforcement of compliance, maintaining a national database and information system for water services, reporting to the public annually, establishing consumer groups and monitoring the progressive realisation of the rights to water services. No other institution can license a water service provider except WASREB according to the Water Act 2016. County governments are expected to enforce regulatory guidelines and rules.
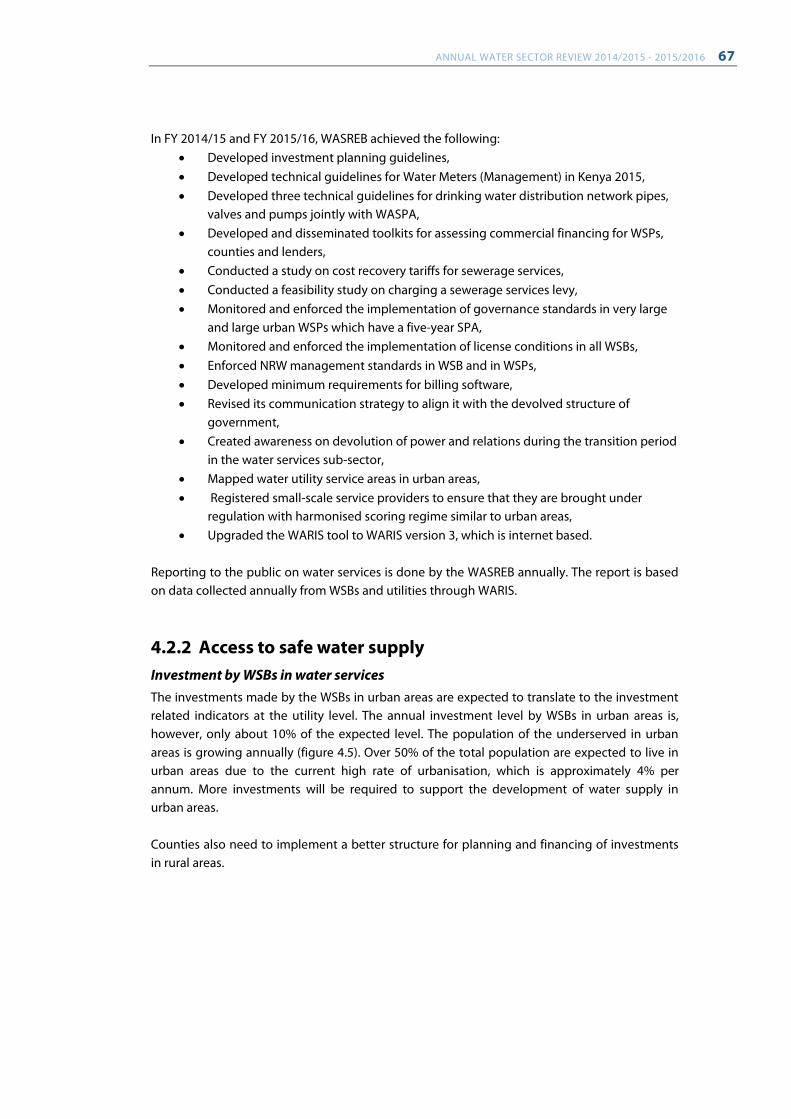
ANNUAL WATER SECTOR REVIEW 2014/2015 - 2015/2016 67
In FY 2014/15 and FY 2015/16, WASREB achieved the following: • Developed investment planning guidelines, • Developed technical guidelines for Water Meters (Management) in Kenya 2015, • Developed three technical guidelines for drinking water distribution network pipes,
valves and pumps jointly with WASPA, • Developed and disseminated toolkits for assessing commercial financing for WSPs,
counties and lenders, • Conducted a study on cost recovery tariffs for sewerage services, • Conducted a feasibility study on charging a sewerage services levy, • Monitored and enforced the implementation of governance standards in very large
and large urban WSPs which have a five-year SPA, • Monitored and enforced the implementation of license conditions in all WSBs, • Enforced NRW management standards in WSB and in WSPs, • Developed minimum requirements for billing software, • Revised its communication strategy to align it with the devolved structure of
government, • Created awareness on devolution of power and relations during the transition period
in the water services sub-sector, • Mapped water utility service areas in urban areas, • Registered small-scale service providers to ensure that they are brought under
regulation with harmonised scoring regime similar to urban areas, • Upgraded the WARIS tool to WARIS version 3, which is internet based.
Reporting to the public on water services is done by the WASREB annually. The report is based on data collected annually from WSBs and utilities through WARIS.
4.2.2 Access to safe water supply Investment by WSBs in water services The investments made by the WSBs in urban areas are expected to translate to the investment related indicators at the utility level. The annual investment level by WSBs in urban areas is, however, only about 10% of the expected level. The population of the underserved in urban areas is growing annually (figure 4.5). Over 50% of the total population are expected to live in urban areas due to the current high rate of urbanisation, which is approximately 4% per annum. More investments will be required to support the development of water supply in urban areas. Counties also need to implement a better structure for planning and financing of investments in rural areas.
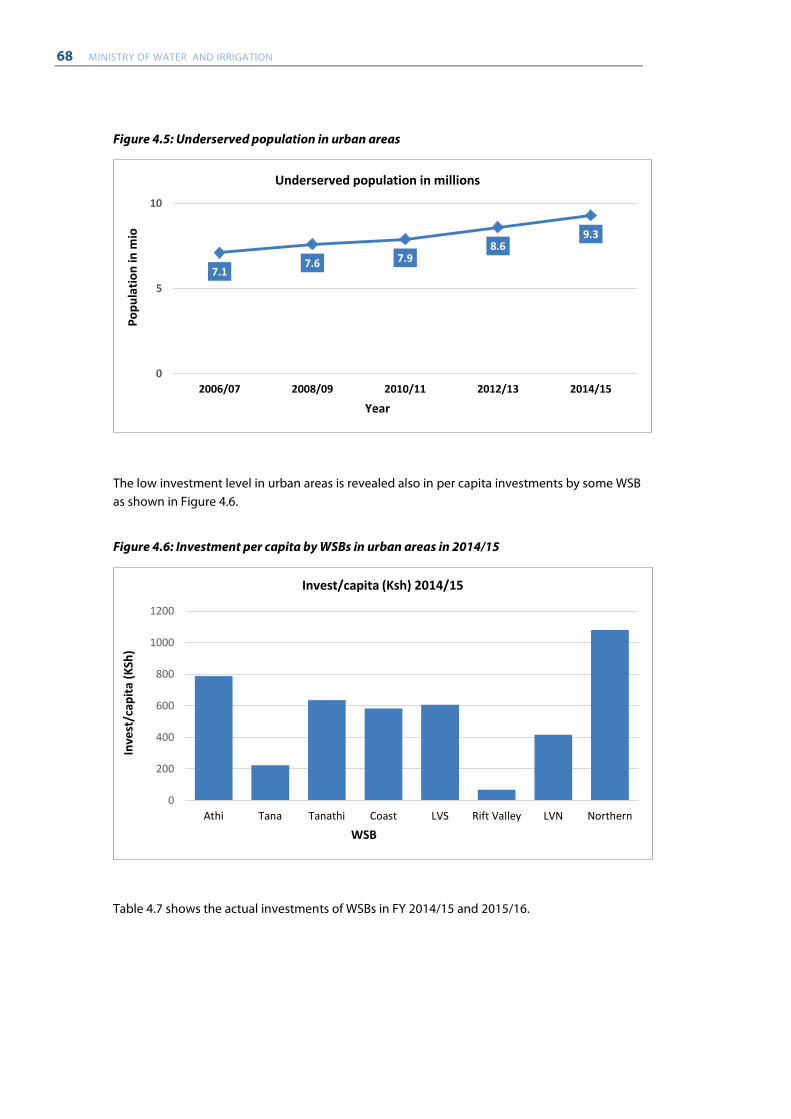
68 MINISTRY OF WATER AND IRRIGATION
Figure 4.5: Underserved population in urban areas
The low investment level in urban areas is revealed also in per capita investments by some WSB as shown in Figure 4.6.
Figure 4.6: Investment per capita by WSBs in urban areas in 2014/15
Table 4.7 shows the actual investments of WSBs in FY 2014/15 and 2015/16.
7.1 7.6 7.9
8.6 9.3
0
5
10
2006/07 2008/09 2010/11 2012/13 2014/15
Popu
latio
n in
mio
Year
Underserved population in millions
0
200
400
600
800
1000
1200
Athi Tana Tanathi Coast LVS Rift Valley LVN Northern
Inve
st/c
apita
(KSh
)
WSB
Invest/capita (Ksh) 2014/15
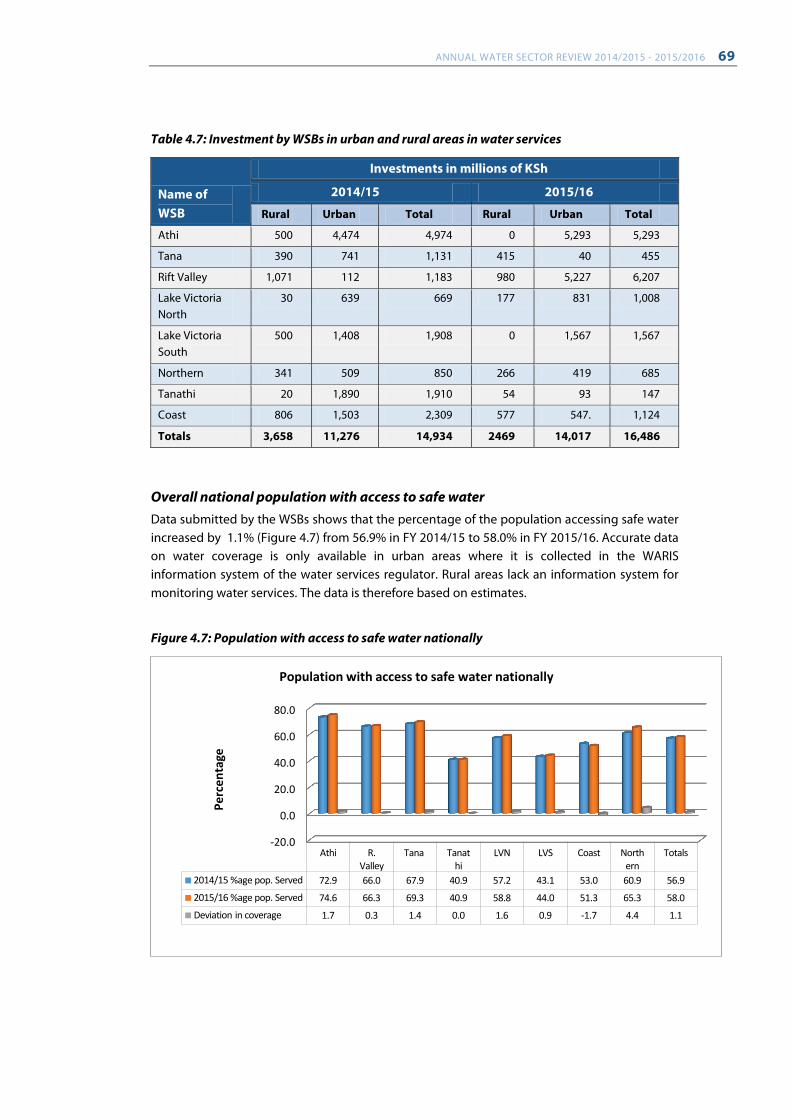
ANNUAL WATER SECTOR REVIEW 2014/2015 - 2015/2016 69
Table 4.7: Investment by WSBs in urban and rural areas in water services
Name of WSB
Investments in millions of KSh
2014/15 2015/16
Rural Urban Total Rural Urban Total
Athi 500 4,474 4,974 0 5,293 5,293
Tana 390 741 1,131 415 40 455
Rift Valley 1,071 112 1,183 980 5,227 6,207
Lake Victoria North
30 639 669 177 831 1,008
Lake Victoria South
500 1,408 1,908 0 1,567 1,567
Northern 341 509 850 266 419 685
Tanathi 20 1,890 1,910 54 93 147
Coast 806 1,503 2,309 577 547. 1,124
Totals 3,658 11,276 14,934 2469 14,017 16,486
Overall national population with access to safe water Data submitted by the WSBs shows that the percentage of the population accessing safe water increased by 1.1% (Figure 4.7) from 56.9% in FY 2014/15 to 58.0% in FY 2015/16. Accurate data on water coverage is only available in urban areas where it is collected in the WARIS information system of the water services regulator. Rural areas lack an information system for monitoring water services. The data is therefore based on estimates.
Figure 4.7: Population with access to safe water nationally
-20.0
0.0
20.0
40.0
60.0
80.0
Athi R. Valley
Tana Tanathi
LVN LVS Coast Northern
Totals
2014/15 %age pop. Served 72.9 66.0 67.9 40.9 57.2 43.1 53.0 60.9 56.9
2015/16 %age pop. Served 74.6 66.3 69.3 40.9 58.8 44.0 51.3 65.3 58.0
Deviation in coverage 1.7 0.3 1.4 0.0 1.6 0.9 -1.7 4.4 1.1
Perc
enta
ge
Population with access to safe water nationally
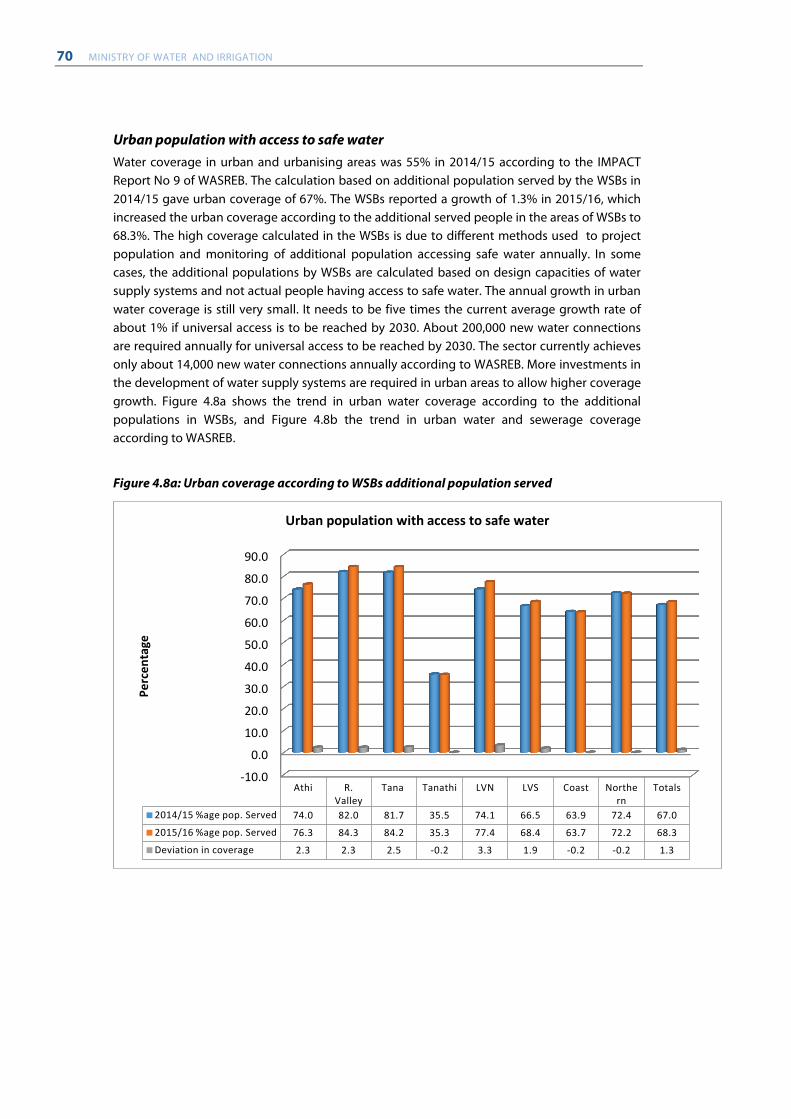
70 MINISTRY OF WATER AND IRRIGATION
Urban population with access to safe water Water coverage in urban and urbanising areas was 55% in 2014/15 according to the IMPACT Report No 9 of WASREB. The calculation based on additional population served by the WSBs in 2014/15 gave urban coverage of 67%. The WSBs reported a growth of 1.3% in 2015/16, which increased the urban coverage according to the additional served people in the areas of WSBs to 68.3%. The high coverage calculated in the WSBs is due to different methods used to project population and monitoring of additional population accessing safe water annually. In some cases, the additional populations by WSBs are calculated based on design capacities of water supply systems and not actual people having access to safe water. The annual growth in urban water coverage is still very small. It needs to be five times the current average growth rate of about 1% if universal access is to be reached by 2030. About 200,000 new water connections are required annually for universal access to be reached by 2030. The sector currently achieves only about 14,000 new water connections annually according to WASREB. More investments in the development of water supply systems are required in urban areas to allow higher coverage growth. Figure 4.8a shows the trend in urban water coverage according to the additional populations in WSBs, and Figure 4.8b the trend in urban water and sewerage coverage according to WASREB.
Figure 4.8a: Urban coverage according to WSBs additional population served
-10.0
0.0
10.0
20.0
30.0
40.0
50.0
60.0
70.0
80.0
90.0
Athi R. Valley
Tana Tanathi LVN LVS Coast Northern
Totals
2014/15 %age pop. Served 74.0 82.0 81.7 35.5 74.1 66.5 63.9 72.4 67.0
2015/16 %age pop. Served 76.3 84.3 84.2 35.3 77.4 68.4 63.7 72.2 68.3
Deviation in coverage 2.3 2.3 2.5 -0.2 3.3 1.9 -0.2 -0.2 1.3
Perc
enta
ge
Urban population with access to safe water
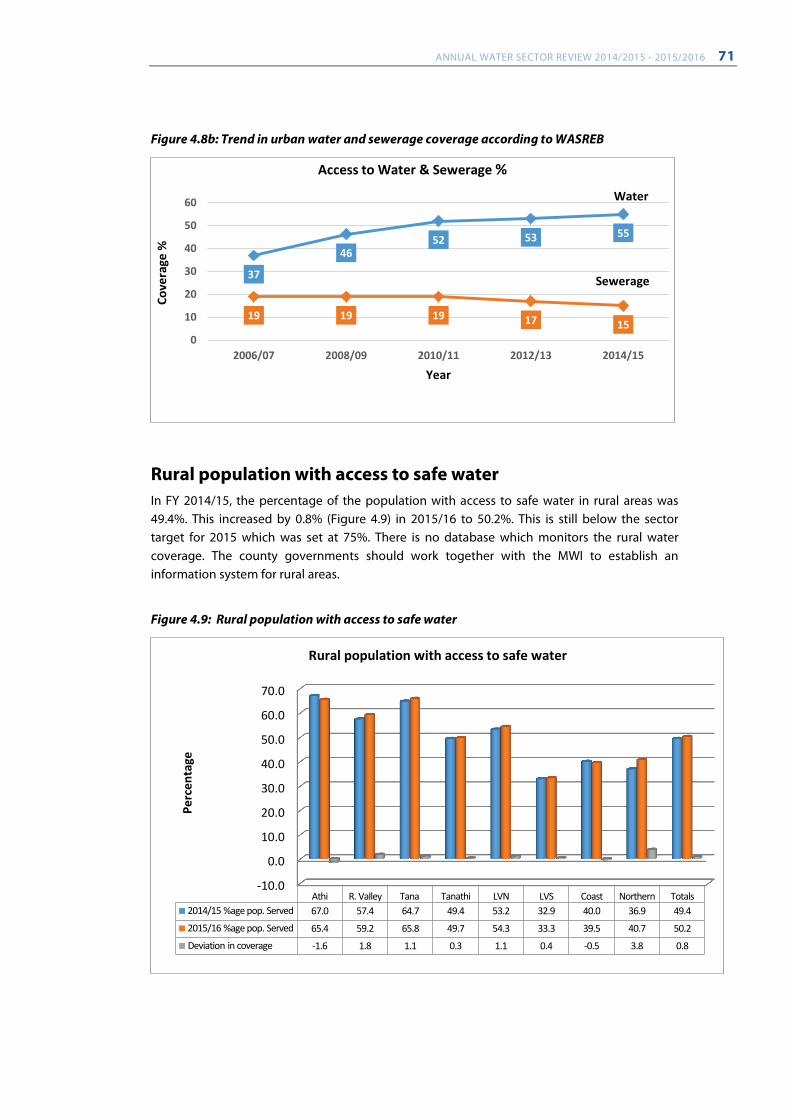
ANNUAL WATER SECTOR REVIEW 2014/2015 - 2015/2016 71
Figure 4.8b: Trend in urban water and sewerage coverage according to WASREB
Rural population with access to safe water In FY 2014/15, the percentage of the population with access to safe water in rural areas was 49.4%. This increased by 0.8% (Figure 4.9) in 2015/16 to 50.2%. This is still below the sector target for 2015 which was set at 75%. There is no database which monitors the rural water coverage. The county governments should work together with the MWI to establish an information system for rural areas.
Figure 4.9: Rural population with access to safe water
37
46 52 53 55
19 19 19 17 15 0
10
20
30
40
50
60
2006/07 2008/09 2010/11 2012/13 2014/15
Cove
rage
%
Year
Access to Water & Sewerage %
Water
Sewerage
-10.0
0.0
10.0
20.0
30.0
40.0
50.0
60.0
70.0
Athi R. Valley Tana Tanathi LVN LVS Coast Northern Totals 2014/15 %age pop. Served 67.0 57.4 64.7 49.4 53.2 32.9 40.0 36.9 49.4
2015/16 %age pop. Served 65.4 59.2 65.8 49.7 54.3 33.3 39.5 40.7 50.2
Deviation in coverage -1.6 1.8 1.1 0.3 1.1 0.4 -0.5 3.8 0.8
Perc
enta
ge
Rural population with access to safe water
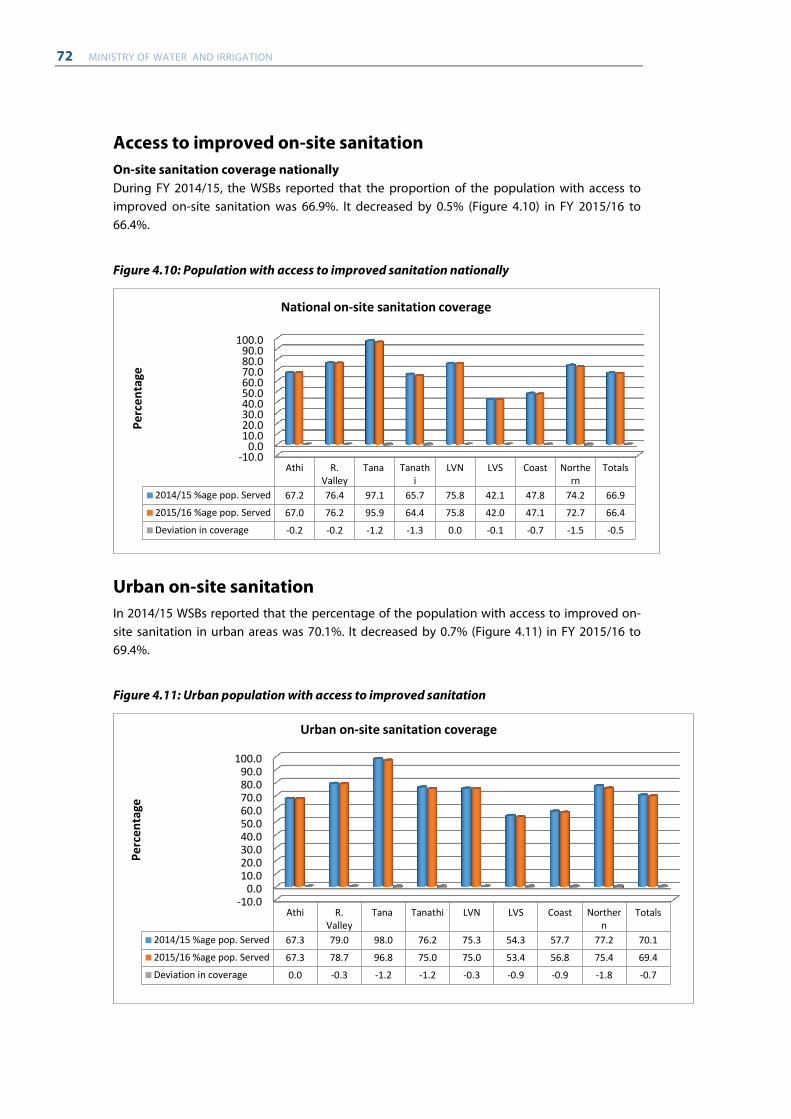
72 MINISTRY OF WATER AND IRRIGATION
Access to improved on-site sanitation On-site sanitation coverage nationally During FY 2014/15, the WSBs reported that the proportion of the population with access to improved on-site sanitation was 66.9%. It decreased by 0.5% (Figure 4.10) in FY 2015/16 to 66.4%.
Figure 4.10: Population with access to improved sanitation nationally
Urban on-site sanitation In 2014/15 WSBs reported that the percentage of the population with access to improved on-site sanitation in urban areas was 70.1%. It decreased by 0.7% (Figure 4.11) in FY 2015/16 to 69.4%.
Figure 4.11: Urban population with access to improved sanitation
-10.00.0
10.020.030.040.050.060.070.080.090.0
100.0
Athi R.Valley
Tana Tanathi
LVN LVS Coast Northern
Totals
2014/15 %age pop. Served 67.2 76.4 97.1 65.7 75.8 42.1 47.8 74.2 66.9
2015/16 %age pop. Served 67.0 76.2 95.9 64.4 75.8 42.0 47.1 72.7 66.4
Deviation in coverage -0.2 -0.2 -1.2 -1.3 0.0 -0.1 -0.7 -1.5 -0.5
Perc
enta
ge
National on-site sanitation coverage
-10.00.0
10.020.030.040.050.060.070.080.090.0
100.0
Athi R.Valley
Tana Tanathi LVN LVS Coast Northern
Totals
2014/15 %age pop. Served 67.3 79.0 98.0 76.2 75.3 54.3 57.7 77.2 70.1
2015/16 %age pop. Served 67.3 78.7 96.8 75.0 75.0 53.4 56.8 75.4 69.4
Deviation in coverage 0.0 -0.3 -1.2 -1.2 -0.3 -0.9 -0.9 -1.8 -0.7
Perc
enta
ge
Urban on-site sanitation coverage
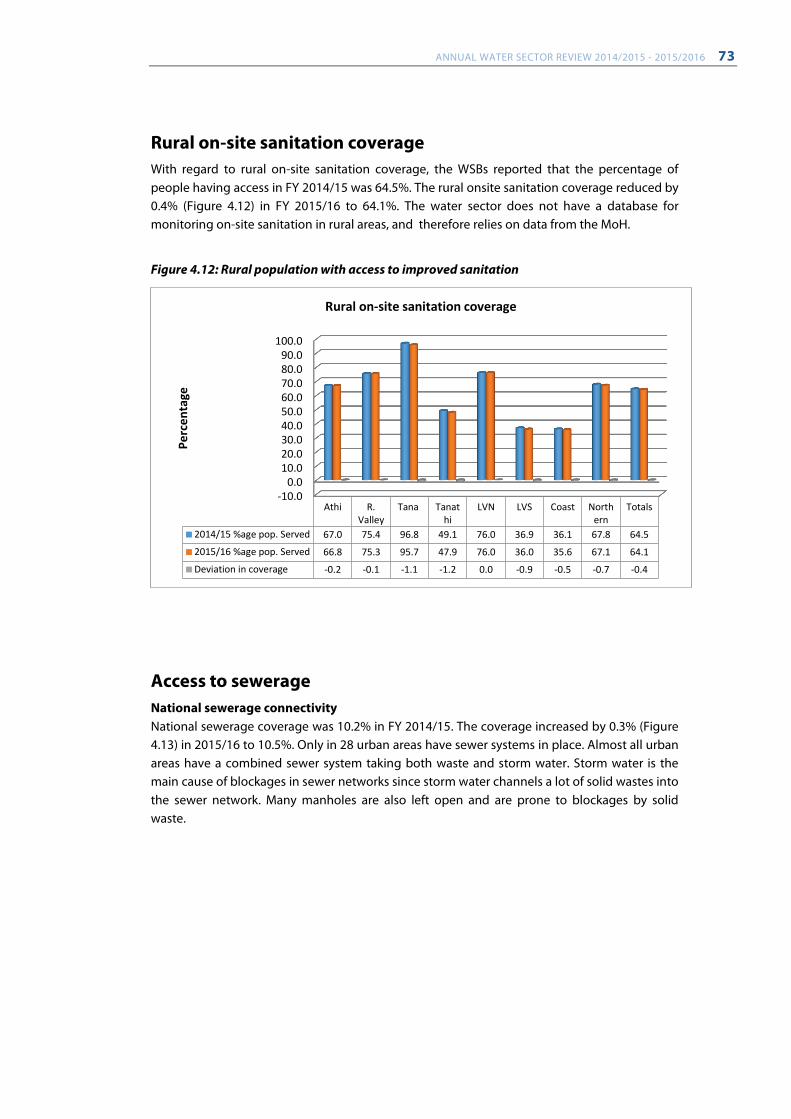
ANNUAL WATER SECTOR REVIEW 2014/2015 - 2015/2016 73
Rural on-site sanitation coverage With regard to rural on-site sanitation coverage, the WSBs reported that the percentage of people having access in FY 2014/15 was 64.5%. The rural onsite sanitation coverage reduced by 0.4% (Figure 4.12) in FY 2015/16 to 64.1%. The water sector does not have a database for monitoring on-site sanitation in rural areas, and therefore relies on data from the MoH.
Figure 4.12: Rural population with access to improved sanitation
Access to sewerage National sewerage connectivity National sewerage coverage was 10.2% in FY 2014/15. The coverage increased by 0.3% (Figure 4.13) in 2015/16 to 10.5%. Only in 28 urban areas have sewer systems in place. Almost all urban areas have a combined sewer system taking both waste and storm water. Storm water is the main cause of blockages in sewer networks since storm water channels a lot of solid wastes into the sewer network. Many manholes are also left open and are prone to blockages by solid waste.
-10.00.0
10.020.030.040.050.060.070.080.090.0
100.0
Athi R.Valley
Tana Tanathi
LVN LVS Coast Northern
Totals
2014/15 %age pop. Served 67.0 75.4 96.8 49.1 76.0 36.9 36.1 67.8 64.5
2015/16 %age pop. Served 66.8 75.3 95.7 47.9 76.0 36.0 35.6 67.1 64.1
Deviation in coverage -0.2 -0.1 -1.1 -1.2 0.0 -0.9 -0.5 -0.7 -0.4
Perc
enta
ge
Rural on-site sanitation coverage
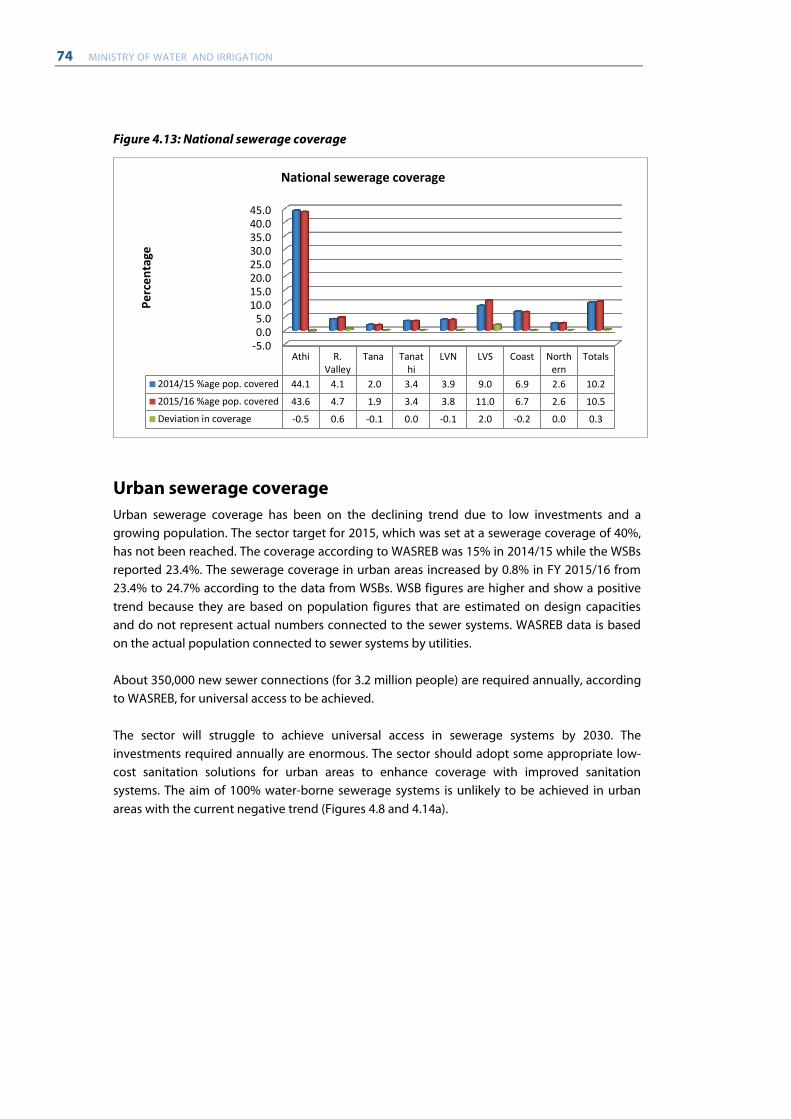
74 MINISTRY OF WATER AND IRRIGATION
Figure 4.13: National sewerage coverage
Urban sewerage coverage Urban sewerage coverage has been on the declining trend due to low investments and a growing population. The sector target for 2015, which was set at a sewerage coverage of 40%, has not been reached. The coverage according to WASREB was 15% in 2014/15 while the WSBs reported 23.4%. The sewerage coverage in urban areas increased by 0.8% in FY 2015/16 from 23.4% to 24.7% according to the data from WSBs. WSB figures are higher and show a positive trend because they are based on population figures that are estimated on design capacities and do not represent actual numbers connected to the sewer systems. WASREB data is based on the actual population connected to sewer systems by utilities. About 350,000 new sewer connections (for 3.2 million people) are required annually, according to WASREB, for universal access to be achieved. The sector will struggle to achieve universal access in sewerage systems by 2030. The investments required annually are enormous. The sector should adopt some appropriate low-cost sanitation solutions for urban areas to enhance coverage with improved sanitation systems. The aim of 100% water-borne sewerage systems is unlikely to be achieved in urban areas with the current negative trend (Figures 4.8 and 4.14a).
-5.00.05.0
10.015.020.025.030.035.040.045.0
Athi R.Valley
Tana Tanathi
LVN LVS Coast Northern
Totals
2014/15 %age pop. covered 44.1 4.1 2.0 3.4 3.9 9.0 6.9 2.6 10.2
2015/16 %age pop. covered 43.6 4.7 1.9 3.4 3.8 11.0 6.7 2.6 10.5
Deviation in coverage -0.5 0.6 -0.1 0.0 -0.1 2.0 -0.2 0.0 0.3
Perc
enta
ge
National sewerage coverage
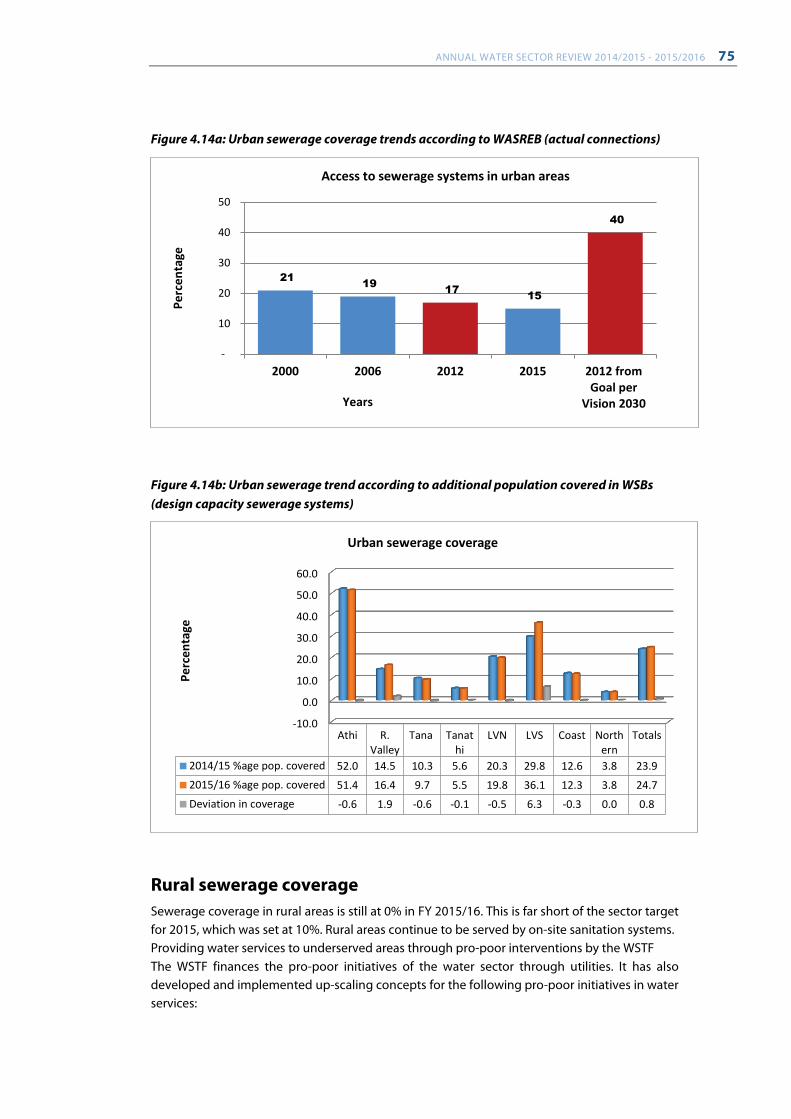
ANNUAL WATER SECTOR REVIEW 2014/2015 - 2015/2016 75
Figure 4.14a: Urban sewerage coverage trends according to WASREB (actual connections)
Figure 4.14b: Urban sewerage trend according to additional population covered in WSBs (design capacity sewerage systems)
Rural sewerage coverage Sewerage coverage in rural areas is still at 0% in FY 2015/16. This is far short of the sector target for 2015, which was set at 10%. Rural areas continue to be served by on-site sanitation systems. Providing water services to underserved areas through pro-poor interventions by the WSTF The WSTF finances the pro-poor initiatives of the water sector through utilities. It has also developed and implemented up-scaling concepts for the following pro-poor initiatives in water services:
21 19 17 15
40
-
10
20
30
40
50
2000 2006 2012 2015 2012 fromGoal per
Vision 2030
Perc
enta
ge
Years
Access to sewerage systems in urban areas
-10.0
0.0
10.0
20.0
30.0
40.0
50.0
60.0
Athi R.Valley
Tana Tanathi
LVN LVS Coast Northern
Totals
2014/15 %age pop. covered 52.0 14.5 10.3 5.6 20.3 29.8 12.6 3.8 23.92015/16 %age pop. covered 51.4 16.4 9.7 5.5 19.8 36.1 12.3 3.8 24.7Deviation in coverage -0.6 1.9 -0.6 -0.1 -0.5 6.3 -0.3 0.0 0.8
Perc
enta
ge
Urban sewerage coverage
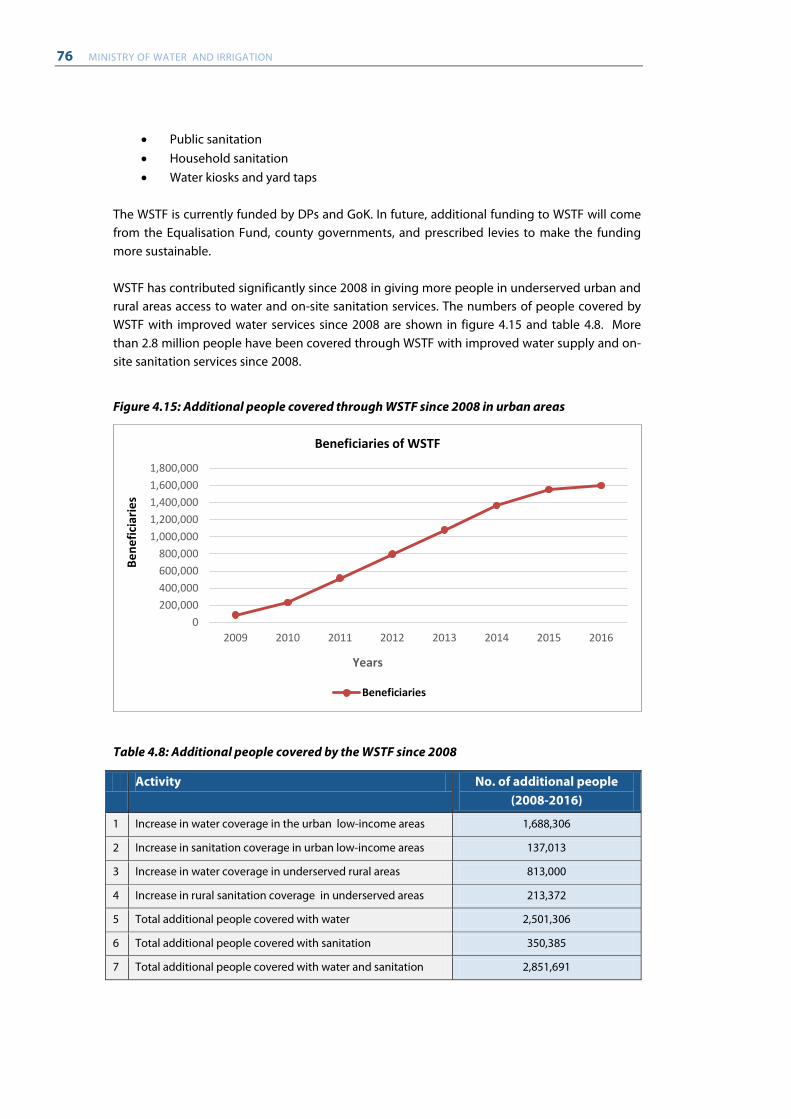
76 MINISTRY OF WATER AND IRRIGATION
• Public sanitation • Household sanitation • Water kiosks and yard taps
The WSTF is currently funded by DPs and GoK. In future, additional funding to WSTF will come from the Equalisation Fund, county governments, and prescribed levies to make the funding more sustainable. WSTF has contributed significantly since 2008 in giving more people in underserved urban and rural areas access to water and on-site sanitation services. The numbers of people covered by WSTF with improved water services since 2008 are shown in figure 4.15 and table 4.8. More than 2.8 million people have been covered through WSTF with improved water supply and on-site sanitation services since 2008.
Figure 4.15: Additional people covered through WSTF since 2008 in urban areas
Table 4.8: Additional people covered by the WSTF since 2008
Activity No. of additional people (2008-2016)
1 Increase in water coverage in the urban low-income areas 1,688,306
2 Increase in sanitation coverage in urban low-income areas 137,013
3 Increase in water coverage in underserved rural areas 813,000
4 Increase in rural sanitation coverage in underserved areas 213,372
5 Total additional people covered with water 2,501,306
6 Total additional people covered with sanitation 350,385
7 Total additional people covered with water and sanitation 2,851,691
0200,000400,000600,000800,000
1,000,0001,200,0001,400,0001,600,0001,800,000
2009 2010 2011 2012 2013 2014 2015 2016
Bene
ficia
ries
Years
Beneficiaries of WSTF
Beneficiaries
ANNUAL WATER SECTOR REVIEW 2014/2015 - 2015/2016 77
Key challenges and recommendations Challenges
1. Non-payment of regulatory levy by some utilities, 2. Enforcement of the license conditions to the WSBs under devolution faces obstacles, 3. Emerging trend of resistance to implement approved water tariffs by some county
governments, 4. Poor performance of many utilities, 5. Informal service provision still rampant in urban areas, 6. Under-investment in water services, 7. Inadequate tariffs which do not cover all costs, 8. Poor management of non-revenue water by utilities, 9. Non-viable utilities which do not operate on economies of scale to ensure
sustainability of service provision, 10. Inadequate financing and investment planning for water services, 11. Interference in the tariff process by some counties, 12. Challenges and cost of securing wayleaves for projects because of encroachment by
communities and private developers, 13. Late disbursement of GoK counterpart funds has hindered the implementation of
DP-funded projects, 14. Delay in acquisition of tax exemptions from National Treasury for tax-exempt
projects, 15. Attempts by Kenya Revenue Authority to tax water services, 16. Court injunctions that delay the implementation of projects, 17. Conflicts over the implementation of water services projects between counties and
WSBs. Recommendations
1. Enforce penalties on utilities that fail to submit the regulatory levy 2. Cluster all non-viable small utilities, 3. Improve governance and management in utilities, 4. Implement the Water Act 2016 to streamline water services, 5. Improve financial and asset management in utilities, 6. Focus on formalisation of water services in underserved areas, 7. Establish appropriate financing mechanisms and national investment planning for
the water services, 8. Bridge the huge annual investment gap in water services, which is hindering
progress towards achieving universal access, 9. Reduce non-revenue water in utilities to levels below 25%, 10. Improve the water production capacities of utilities, 11. Increase the service coverage in sanitation, using appropriate low-cost technologies, 12. Set appropriate average tariffs which contribute to cost coverage in utilities, 13. Ring fence all the sector income, 14. Finalise the devolution and transfer of assets.
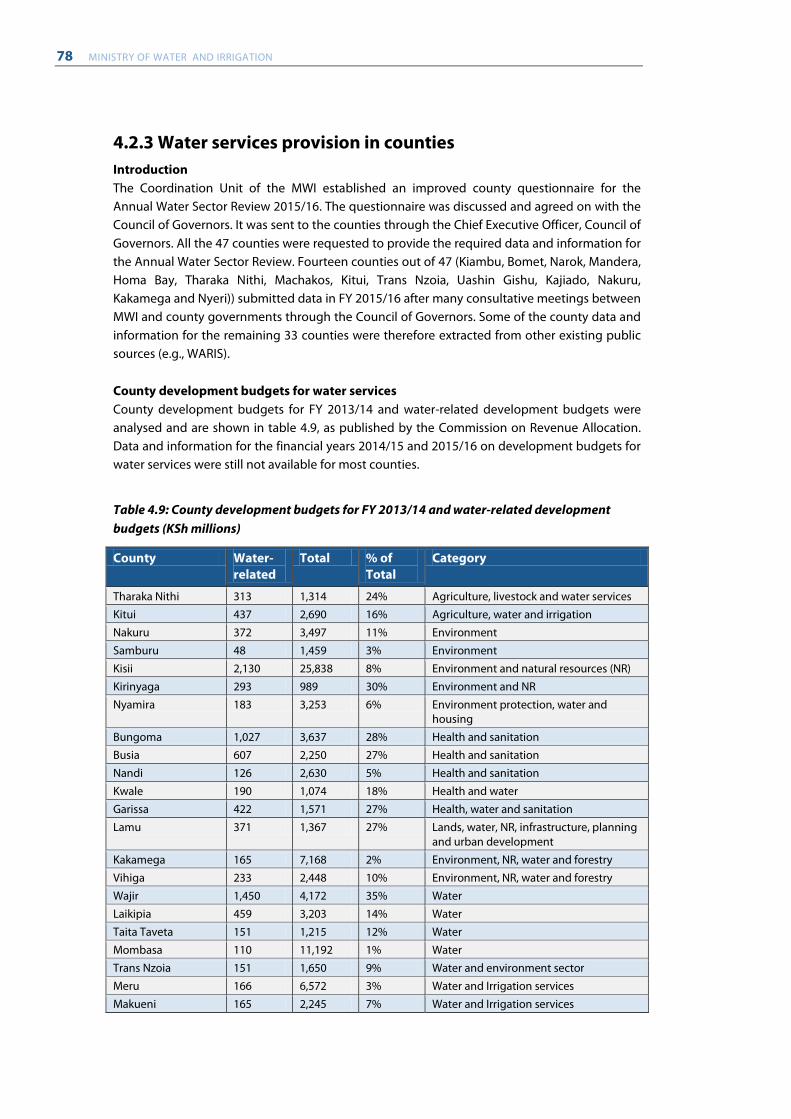
78 MINISTRY OF WATER AND IRRIGATION
4.2.3 Water services provision in counties Introduction The Coordination Unit of the MWI established an improved county questionnaire for the Annual Water Sector Review 2015/16. The questionnaire was discussed and agreed on with the Council of Governors. It was sent to the counties through the Chief Executive Officer, Council of Governors. All the 47 counties were requested to provide the required data and information for the Annual Water Sector Review. Fourteen counties out of 47 (Kiambu, Bomet, Narok, Mandera, Homa Bay, Tharaka Nithi, Machakos, Kitui, Trans Nzoia, Uashin Gishu, Kajiado, Nakuru, Kakamega and Nyeri)) submitted data in FY 2015/16 after many consultative meetings between MWI and county governments through the Council of Governors. Some of the county data and information for the remaining 33 counties were therefore extracted from other existing public sources (e.g., WARIS). County development budgets for water services County development budgets for FY 2013/14 and water-related development budgets were analysed and are shown in table 4.9, as published by the Commission on Revenue Allocation. Data and information for the financial years 2014/15 and 2015/16 on development budgets for water services were still not available for most counties.
Table 4.9: County development budgets for FY 2013/14 and water-related development budgets (KSh millions)
County Water- related
Total % of Total
Category
Tharaka Nithi 313 1,314 24% Agriculture, livestock and water services
Kitui 437 2,690 16% Agriculture, water and irrigation
Nakuru 372 3,497 11% Environment
Samburu 48 1,459 3% Environment
Kisii 2,130 25,838 8% Environment and natural resources (NR)
Kirinyaga 293 989 30% Environment and NR
Nyamira 183 3,253 6% Environment protection, water and housing
Bungoma 1,027 3,637 28% Health and sanitation
Busia 607 2,250 27% Health and sanitation
Nandi 126 2,630 5% Health and sanitation
Kwale 190 1,074 18% Health and water
Garissa 422 1,571 27% Health, water and sanitation
Lamu 371 1,367 27% Lands, water, NR, infrastructure, planning and urban development
Kakamega 165 7,168 2% Environment, NR, water and forestry
Vihiga 233 2,448 10% Environment, NR, water and forestry
Wajir 1,450 4,172 35% Water
Laikipia 459 3,203 14% Water
Taita Taveta 151 1,215 12% Water
Mombasa 110 11,192 1% Water
Trans Nzoia 151 1,650 9% Water and environment sector
Meru 166 6,572 3% Water and Irrigation services
Makueni 165 2,245 7% Water and Irrigation services
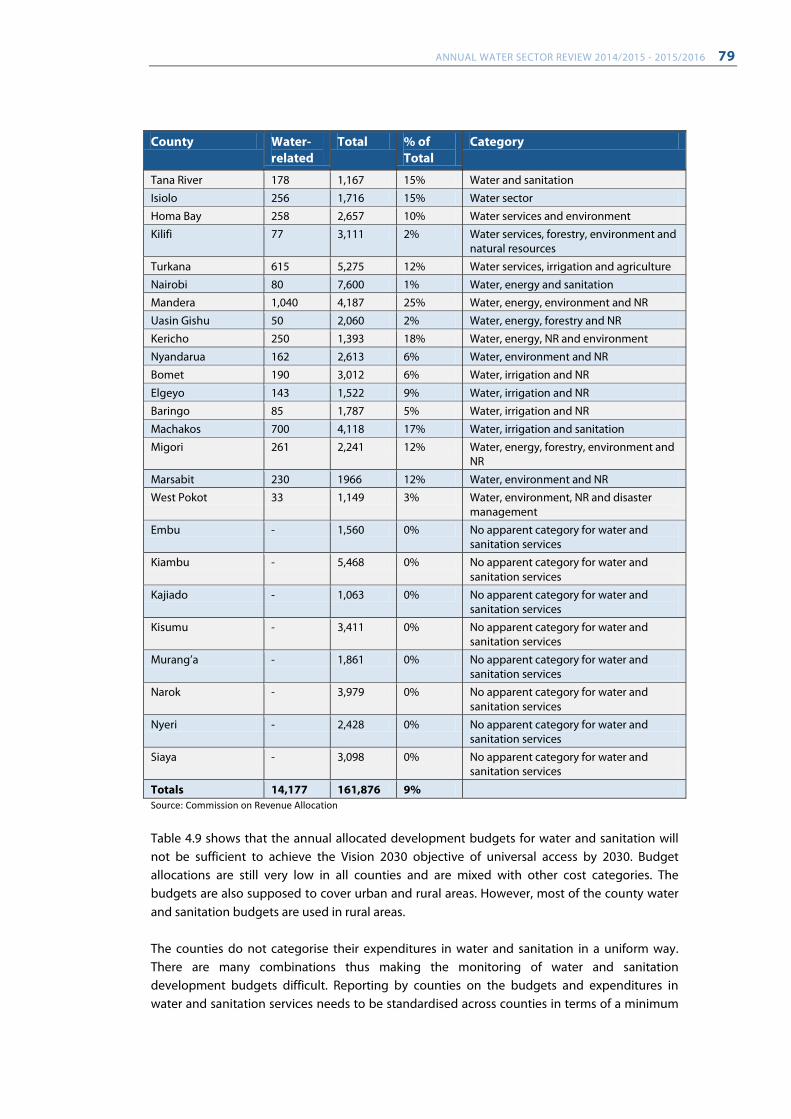
ANNUAL WATER SECTOR REVIEW 2014/2015 - 2015/2016 79
County Water- related
Total % of Total
Category
Tana River 178 1,167 15% Water and sanitation
Isiolo 256 1,716 15% Water sector
Homa Bay 258 2,657 10% Water services and environment
Kilifi 77 3,111 2% Water services, forestry, environment and natural resources
Turkana 615 5,275 12% Water services, irrigation and agriculture
Nairobi 80 7,600 1% Water, energy and sanitation
Mandera 1,040 4,187 25% Water, energy, environment and NR
Uasin Gishu 50 2,060 2% Water, energy, forestry and NR
Kericho 250 1,393 18% Water, energy, NR and environment
Nyandarua 162 2,613 6% Water, environment and NR
Bomet 190 3,012 6% Water, irrigation and NR
Elgeyo 143 1,522 9% Water, irrigation and NR
Baringo 85 1,787 5% Water, irrigation and NR
Machakos 700 4,118 17% Water, irrigation and sanitation
Migori 261 2,241 12% Water, energy, forestry, environment and NR
Marsabit 230 1966 12% Water, environment and NR
West Pokot 33 1,149 3% Water, environment, NR and disaster management
Embu - 1,560 0% No apparent category for water and sanitation services
Kiambu - 5,468 0% No apparent category for water and sanitation services
Kajiado - 1,063 0% No apparent category for water and sanitation services
Kisumu - 3,411 0% No apparent category for water and sanitation services
Murang’a - 1,861 0% No apparent category for water and sanitation services
Narok - 3,979 0% No apparent category for water and sanitation services
Nyeri - 2,428 0% No apparent category for water and sanitation services
Siaya - 3,098 0% No apparent category for water and sanitation services
Totals 14,177 161,876 9% Source: Commission on Revenue Allocation Table 4.9 shows that the annual allocated development budgets for water and sanitation will not be sufficient to achieve the Vision 2030 objective of universal access by 2030. Budget allocations are still very low in all counties and are mixed with other cost categories. The budgets are also supposed to cover urban and rural areas. However, most of the county water and sanitation budgets are used in rural areas. The counties do not categorise their expenditures in water and sanitation in a uniform way. There are many combinations thus making the monitoring of water and sanitation development budgets difficult. Reporting by counties on the budgets and expenditures in water and sanitation services needs to be standardised across counties in terms of a minimum
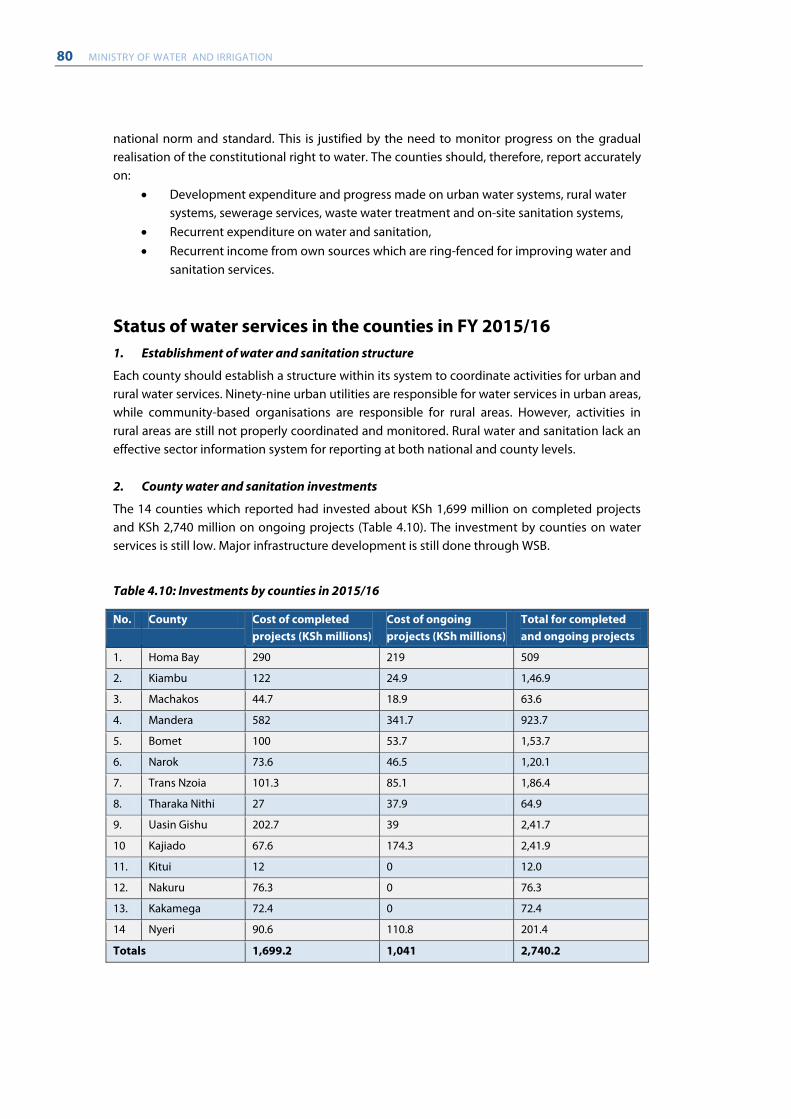
80 MINISTRY OF WATER AND IRRIGATION
national norm and standard. This is justified by the need to monitor progress on the gradual realisation of the constitutional right to water. The counties should, therefore, report accurately on:
• Development expenditure and progress made on urban water systems, rural water systems, sewerage services, waste water treatment and on-site sanitation systems,
• Recurrent expenditure on water and sanitation, • Recurrent income from own sources which are ring-fenced for improving water and
sanitation services.
Status of water services in the counties in FY 2015/16 1. Establishment of water and sanitation structure
Each county should establish a structure within its system to coordinate activities for urban and rural water services. Ninety-nine urban utilities are responsible for water services in urban areas, while community-based organisations are responsible for rural areas. However, activities in rural areas are still not properly coordinated and monitored. Rural water and sanitation lack an effective sector information system for reporting at both national and county levels. 2. County water and sanitation investments
The 14 counties which reported had invested about KSh 1,699 million on completed projects and KSh 2,740 million on ongoing projects (Table 4.10). The investment by counties on water services is still low. Major infrastructure development is still done through WSB.
Table 4.10: Investments by counties in 2015/16
No. County Cost of completed projects (KSh millions)
Cost of ongoing projects (KSh millions)
Total for completed and ongoing projects
1. Homa Bay 290 219 509
2. Kiambu 122 24.9 1,46.9
3. Machakos 44.7 18.9 63.6
4. Mandera 582 341.7 923.7
5. Bomet 100 53.7 1,53.7
6. Narok 73.6 46.5 1,20.1
7. Trans Nzoia 101.3 85.1 1,86.4
8. Tharaka Nithi 27 37.9 64.9
9. Uasin Gishu 202.7 39 2,41.7
10 Kajiado 67.6 174.3 2,41.9
11. Kitui 12 0 12.0
12. Nakuru 76.3 0 76.3
13. Kakamega 72.4 0 72.4
14 Nyeri 90.6 110.8 201.4
Totals 1,699.2 1,041 2,740.2
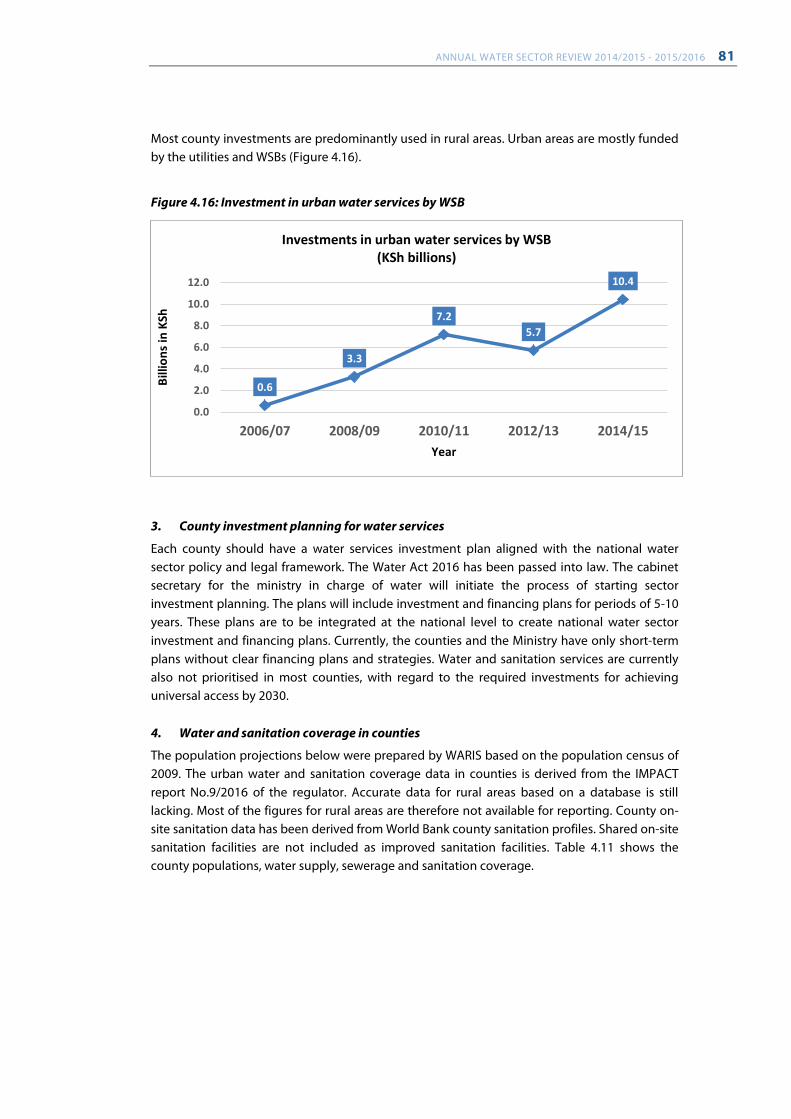
ANNUAL WATER SECTOR REVIEW 2014/2015 - 2015/2016 81
Most county investments are predominantly used in rural areas. Urban areas are mostly funded by the utilities and WSBs (Figure 4.16).
Figure 4.16: Investment in urban water services by WSB
3. County investment planning for water services
Each county should have a water services investment plan aligned with the national water sector policy and legal framework. The Water Act 2016 has been passed into law. The cabinet secretary for the ministry in charge of water will initiate the process of starting sector investment planning. The plans will include investment and financing plans for periods of 5-10 years. These plans are to be integrated at the national level to create national water sector investment and financing plans. Currently, the counties and the Ministry have only short-term plans without clear financing plans and strategies. Water and sanitation services are currently also not prioritised in most counties, with regard to the required investments for achieving universal access by 2030. 4. Water and sanitation coverage in counties
The population projections below were prepared by WARIS based on the population census of 2009. The urban water and sanitation coverage data in counties is derived from the IMPACT report No.9/2016 of the regulator. Accurate data for rural areas based on a database is still lacking. Most of the figures for rural areas are therefore not available for reporting. County on-site sanitation data has been derived from World Bank county sanitation profiles. Shared on-site sanitation facilities are not included as improved sanitation facilities. Table 4.11 shows the county populations, water supply, sewerage and sanitation coverage.
0.6
3.3
7.2 5.7
10.4
0.0
2.0
4.0
6.0
8.0
10.0
12.0
2006/07 2008/09 2010/11 2012/13 2014/15
Billi
ons
in K
Sh
Year
Investments in urban water services by WSB (KSh billions)
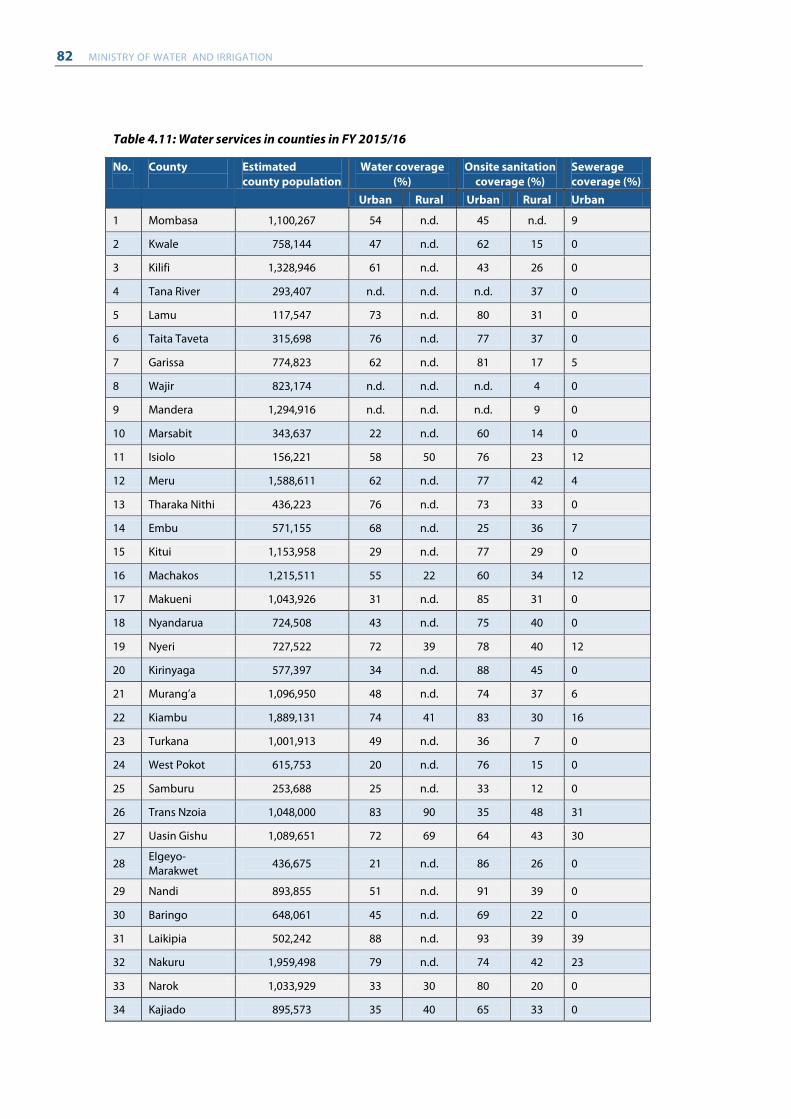
82 MINISTRY OF WATER AND IRRIGATION
Table 4.11: Water services in counties in FY 2015/16
No.
County
Estimated county population
Water coverage (%)
Onsite sanitation coverage (%)
Sewerage coverage (%)
Urban Rural Urban Rural Urban
1 Mombasa 1,100,267 54 n.d. 45 n.d. 9
2 Kwale 758,144 47 n.d. 62 15 0
3 Kilifi 1,328,946 61 n.d. 43 26 0
4 Tana River 293,407 n.d. n.d. n.d. 37 0
5 Lamu 117,547 73 n.d. 80 31 0
6 Taita Taveta 315,698 76 n.d. 77 37 0
7 Garissa 774,823 62 n.d. 81 17 5
8 Wajir 823,174 n.d. n.d. n.d. 4 0
9 Mandera 1,294,916 n.d. n.d. n.d. 9 0
10 Marsabit 343,637 22 n.d. 60 14 0
11 Isiolo 156,221 58 50 76 23 12
12 Meru 1,588,611 62 n.d. 77 42 4
13 Tharaka Nithi 436,223 76 n.d. 73 33 0
14 Embu 571,155 68 n.d. 25 36 7
15 Kitui 1,153,958 29 n.d. 77 29 0
16 Machakos 1,215,511 55 22 60 34 12
17 Makueni 1,043,926 31 n.d. 85 31 0
18 Nyandarua 724,508 43 n.d. 75 40 0
19 Nyeri 727,522 72 39 78 40 12
20 Kirinyaga 577,397 34 n.d. 88 45 0
21 Murang’a 1,096,950 48 n.d. 74 37 6
22 Kiambu 1,889,131 74 41 83 30 16
23 Turkana 1,001,913 49 n.d. 36 7 0
24 West Pokot 615,753 20 n.d. 76 15 0
25 Samburu 253,688 25 n.d. 33 12 0
26 Trans Nzoia 1,048,000 83 90 35 48 31
27 Uasin Gishu 1,089,651 72 69 64 43 30
28 Elgeyo-Marakwet 436,675 21 n.d. 86 26 0
29 Nandi 893,855 51 n.d. 91 39 0
30 Baringo 648,061 45 n.d. 69 22 0
31 Laikipia 502,242 88 n.d. 93 39 39
32 Nakuru 1,959,498 79 n.d. 74 42 23
33 Narok 1,033,929 33 30 80 20 0
34 Kajiado 895,573 35 40 65 33 0
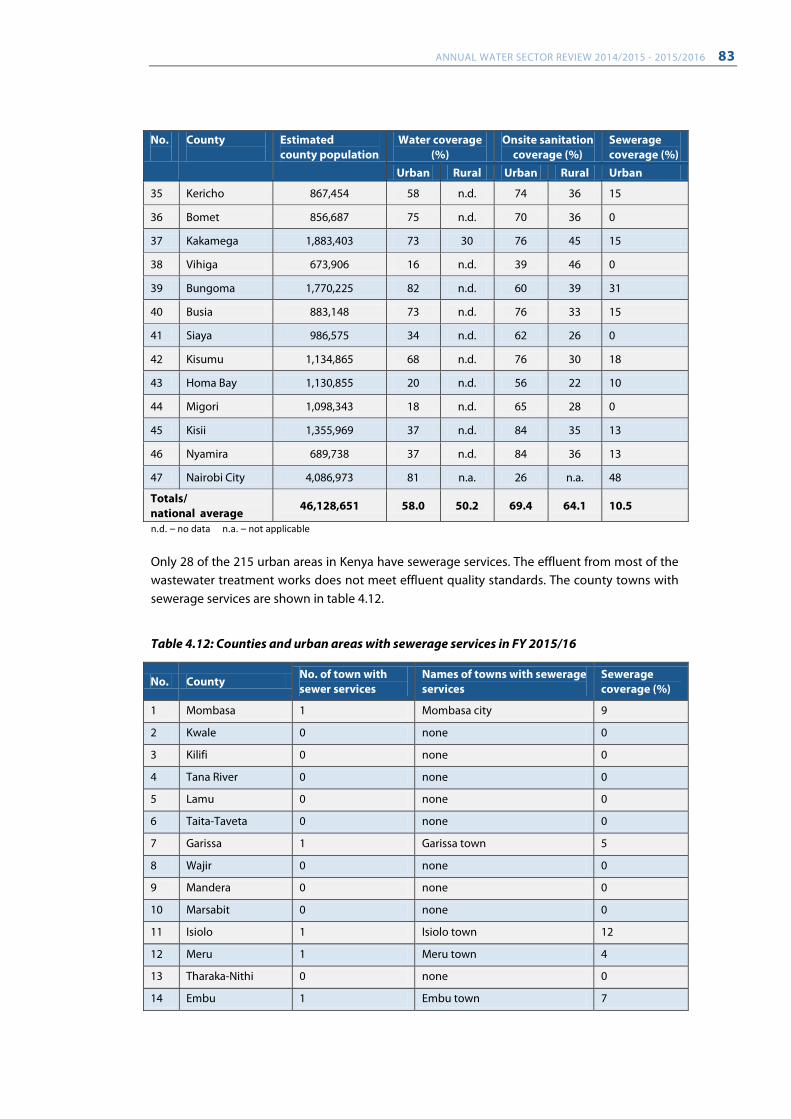
ANNUAL WATER SECTOR REVIEW 2014/2015 - 2015/2016 83
No.
County
Estimated county population
Water coverage (%)
Onsite sanitation coverage (%)
Sewerage coverage (%)
Urban Rural Urban Rural Urban
35 Kericho 867,454 58 n.d. 74 36 15
36 Bomet 856,687 75 n.d. 70 36 0
37 Kakamega 1,883,403 73 30 76 45 15
38 Vihiga 673,906 16 n.d. 39 46 0
39 Bungoma 1,770,225 82 n.d. 60 39 31
40 Busia 883,148 73 n.d. 76 33 15
41 Siaya 986,575 34 n.d. 62 26 0
42 Kisumu 1,134,865 68 n.d. 76 30 18
43 Homa Bay 1,130,855 20 n.d. 56 22 10
44 Migori 1,098,343 18 n.d. 65 28 0
45 Kisii 1,355,969 37 n.d. 84 35 13
46 Nyamira 689,738 37 n.d. 84 36 13
47 Nairobi City 4,086,973 81 n.a. 26 n.a. 48
Totals/ national average
46,128,651 58.0 50.2 69.4 64.1 10.5
n.d. – no data n.a. – not applicable Only 28 of the 215 urban areas in Kenya have sewerage services. The effluent from most of the wastewater treatment works does not meet effluent quality standards. The county towns with sewerage services are shown in table 4.12.
Table 4.12: Counties and urban areas with sewerage services in FY 2015/16
No. County No. of town with sewer services
Names of towns with sewerage services
Sewerage coverage (%)
1 Mombasa 1 Mombasa city 9
2 Kwale 0 none 0
3 Kilifi 0 none 0
4 Tana River 0 none 0
5 Lamu 0 none 0
6 Taita-Taveta 0 none 0
7 Garissa 1 Garissa town 5
8 Wajir 0 none 0
9 Mandera 0 none 0
10 Marsabit 0 none 0
11 Isiolo 1 Isiolo town 12
12 Meru 1 Meru town 4
13 Tharaka-Nithi 0 none 0
14 Embu 1 Embu town 7
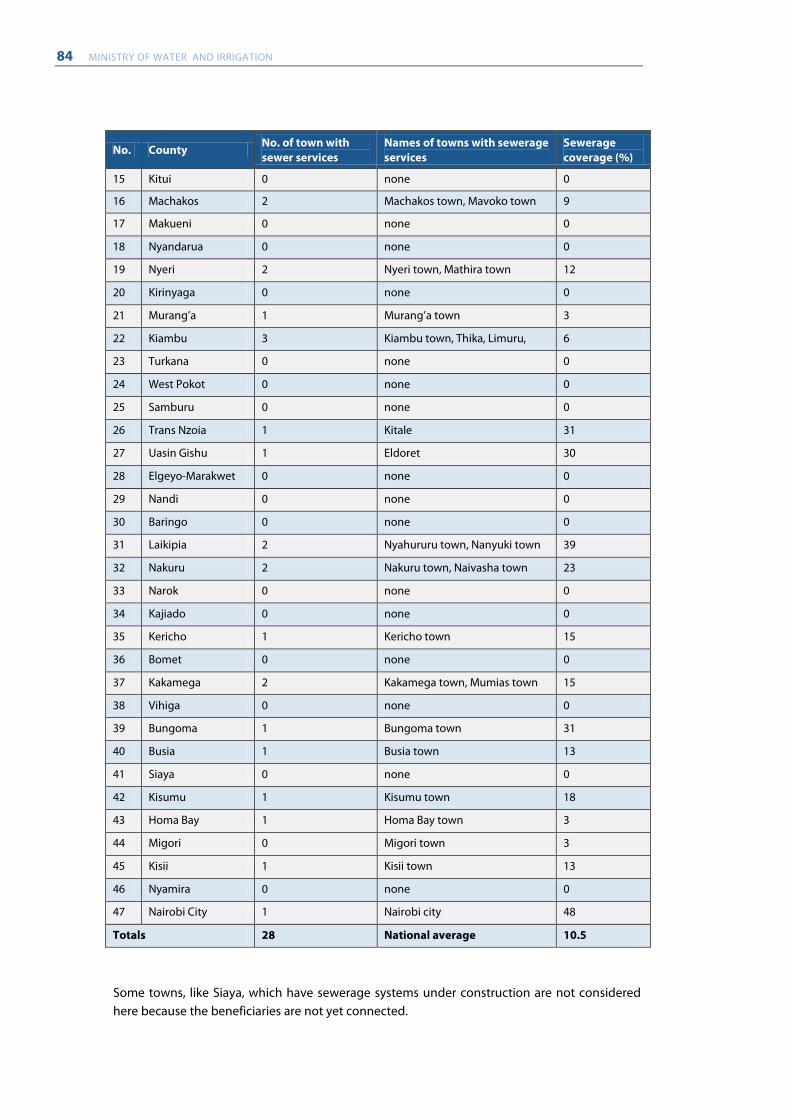
84 MINISTRY OF WATER AND IRRIGATION
No. County No. of town with sewer services
Names of towns with sewerage services
Sewerage coverage (%)
15 Kitui 0 none 0
16 Machakos 2 Machakos town, Mavoko town 9
17 Makueni 0 none 0
18 Nyandarua 0 none 0
19 Nyeri 2 Nyeri town, Mathira town 12
20 Kirinyaga 0 none 0
21 Murang’a 1 Murang’a town 3
22 Kiambu 3 Kiambu town, Thika, Limuru, 6
23 Turkana 0 none 0
24 West Pokot 0 none 0
25 Samburu 0 none 0
26 Trans Nzoia 1 Kitale 31
27 Uasin Gishu 1 Eldoret 30
28 Elgeyo-Marakwet 0 none 0
29 Nandi 0 none 0
30 Baringo 0 none 0
31 Laikipia 2 Nyahururu town, Nanyuki town 39
32 Nakuru 2 Nakuru town, Naivasha town 23
33 Narok 0 none 0
34 Kajiado 0 none 0
35 Kericho 1 Kericho town 15
36 Bomet 0 none 0
37 Kakamega 2 Kakamega town, Mumias town 15
38 Vihiga 0 none 0
39 Bungoma 1 Bungoma town 31
40 Busia 1 Busia town 13
41 Siaya 0 none 0
42 Kisumu 1 Kisumu town 18
43 Homa Bay 1 Homa Bay town 3
44 Migori 0 Migori town 3
45 Kisii 1 Kisii town 13
46 Nyamira 0 none 0
47 Nairobi City 1 Nairobi city 48
Totals 28 National average 10.5
Some towns, like Siaya, which have sewerage systems under construction are not considered here because the beneficiaries are not yet connected.
ANNUAL WATER SECTOR REVIEW 2014/2015 - 2015/2016 85
5. Formalising water services provision in counties
The counties should enact water laws which are in line with the national water policy and the Water Act 2016. The formalisation of water services in counties has the following two aspects:
• Formation and registration of a water service provider in line with national regulatory guidelines,
• Provision of water services in line with national regulatory guidelines. No person should be allowed to be a water service provider without a license issued by the Water Services Regulatory Board. The counties should enforce the national regulatory guideline to protect consumers. These regulations should also be applied to water tankers and exhausters to protect consumers and the environment. All water schemes serving over 5,000 people should be brought under regulation by:
• Integrating them into the existing registered utilities, • Engaging water user associations (WUA) to manage them at sub-county level under
the supervision of the main utility. Community management of water supply should only be allowed for small water points like wells with hand pumps and protected springs. They should also have some regulatory guidelines. 6. Ensuring the sustainability of water services in counties
The counties are responsible for water services provision in a sustainable way. This requires that the counties should do the following:
• Establish and register viable utilities with low production costs and which do not require subsidies from the county government to cover O&M costs,
• Enforce the practice of good governance in all utilities to improve performance, • Support utilities to manage and reduce NRW level to around 25% by providing the
required investments and good management, • Support utilities to achieve 100% metering at production, zone and consumer levels, • Ensure that all water services revenues are ring fenced and not used outside the
water sector, • Ensure that utilities aim to achieve full cost recovery through average tariffs, • Invest adequately in water services based on water sector investment plans for
achieving Vision 2030 objectives, • Look for innovative ways of enhancing self-financing in the water sector at county
level, • Focus on implementing gravity schemes while phasing out pumping schemes, • Empower WUAs to manage small rural schemes under the supervision of utilities.
Figure 4.17 and Figure 4.18 show that most urban utilities are not covering O&M costs with the high levels of NRW and low average tariffs. This is affecting the sustainability of water services provision.
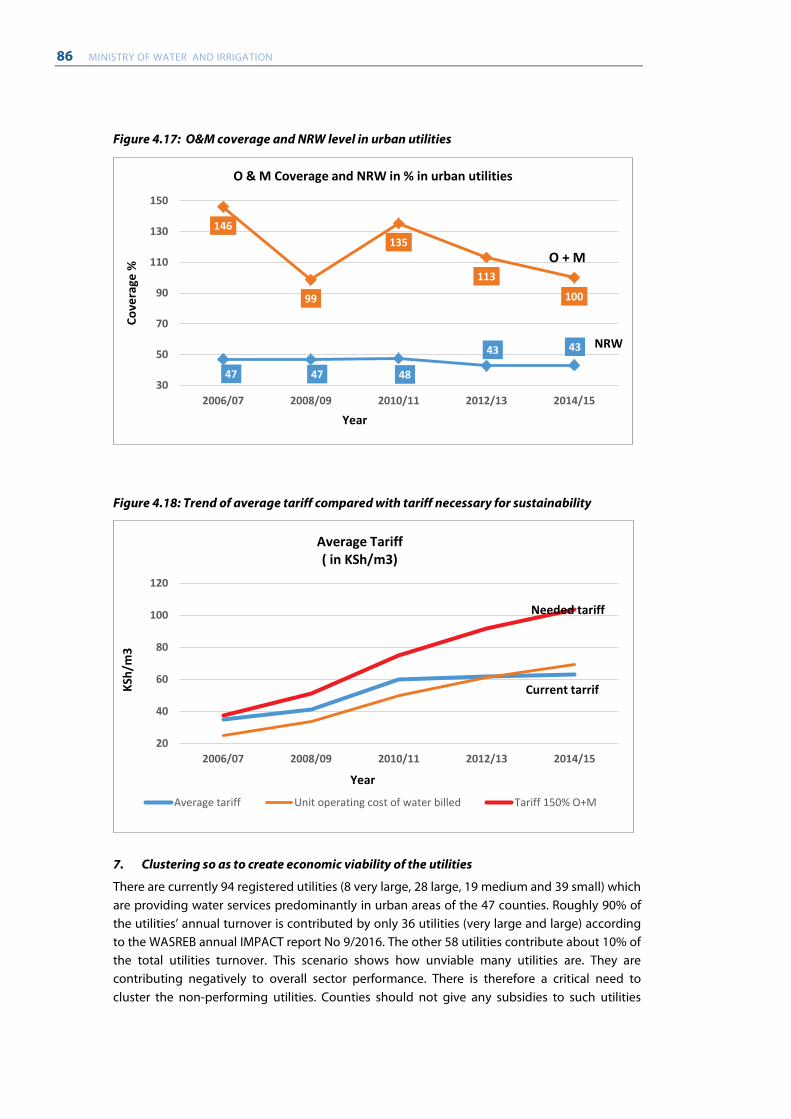
86 MINISTRY OF WATER AND IRRIGATION
Figure 4.17: O&M coverage and NRW level in urban utilities
Figure 4.18: Trend of average tariff compared with tariff necessary for sustainability
7. Clustering so as to create economic viability of the utilities
There are currently 94 registered utilities (8 very large, 28 large, 19 medium and 39 small) which are providing water services predominantly in urban areas of the 47 counties. Roughly 90% of the utilities’ annual turnover is contributed by only 36 utilities (very large and large) according to the WASREB annual IMPACT report No 9/2016. The other 58 utilities contribute about 10% of the total utilities turnover. This scenario shows how unviable many utilities are. They are contributing negatively to overall sector performance. There is therefore a critical need to cluster the non-performing utilities. Counties should not give any subsidies to such utilities
47 47 48
43 43
146
99
135
113
100
30
50
70
90
110
130
150
2006/07 2008/09 2010/11 2012/13 2014/15
Cove
rage
%
Year
O & M Coverage and NRW in % in urban utilities
O + M
NRW
20
40
60
80
100
120
2006/07 2008/09 2010/11 2012/13 2014/15
KSh/
m3
Year
Average Tariff ( in KSh/m3)
Average tariff Unit operating cost of water billed Tariff 150% O+M
Needed tariff
Current tarrif
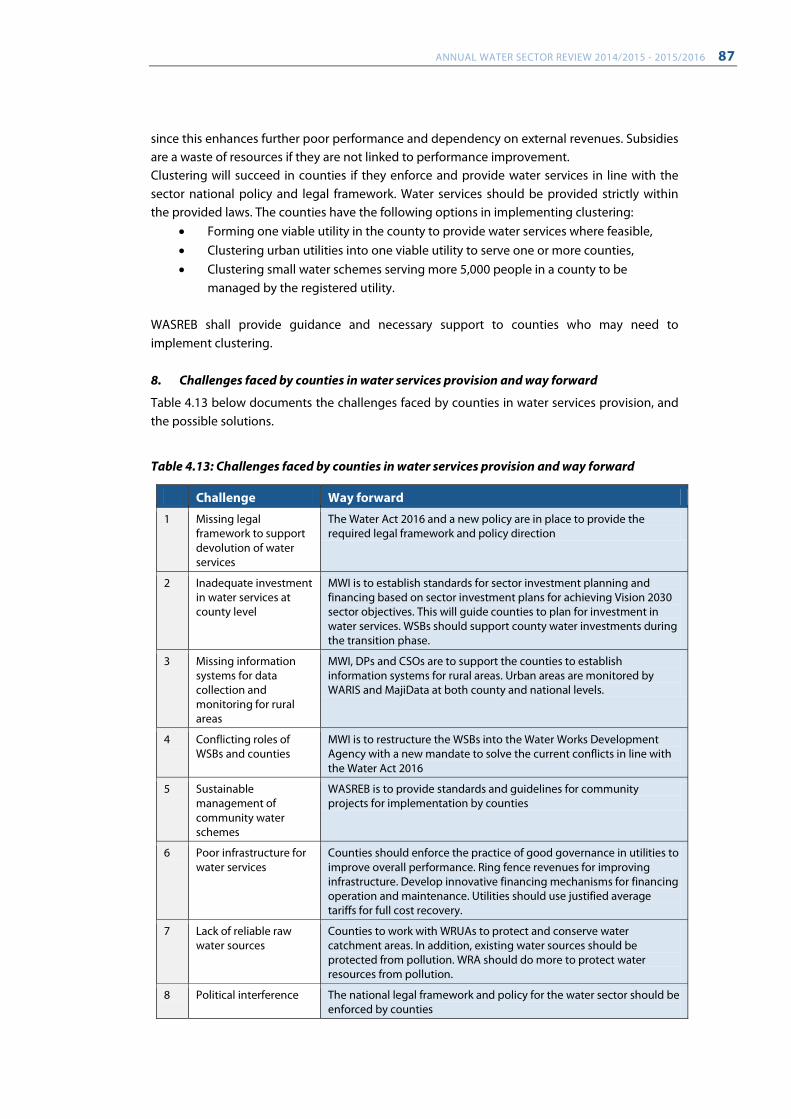
ANNUAL WATER SECTOR REVIEW 2014/2015 - 2015/2016 87
since this enhances further poor performance and dependency on external revenues. Subsidies are a waste of resources if they are not linked to performance improvement. Clustering will succeed in counties if they enforce and provide water services in line with the sector national policy and legal framework. Water services should be provided strictly within the provided laws. The counties have the following options in implementing clustering:
• Forming one viable utility in the county to provide water services where feasible, • Clustering urban utilities into one viable utility to serve one or more counties, • Clustering small water schemes serving more 5,000 people in a county to be
managed by the registered utility. WASREB shall provide guidance and necessary support to counties who may need to implement clustering. 8. Challenges faced by counties in water services provision and way forward
Table 4.13 below documents the challenges faced by counties in water services provision, and the possible solutions.
Table 4.13: Challenges faced by counties in water services provision and way forward
Challenge Way forward
1 Missing legal framework to support devolution of water services
The Water Act 2016 and a new policy are in place to provide the required legal framework and policy direction
2 Inadequate investment in water services at county level
MWI is to establish standards for sector investment planning and financing based on sector investment plans for achieving Vision 2030 sector objectives. This will guide counties to plan for investment in water services. WSBs should support county water investments during the transition phase.
3 Missing information systems for data collection and monitoring for rural areas
MWI, DPs and CSOs are to support the counties to establish information systems for rural areas. Urban areas are monitored by WARIS and MajiData at both county and national levels.
4 Conflicting roles of WSBs and counties
MWI is to restructure the WSBs into the Water Works Development Agency with a new mandate to solve the current conflicts in line with the Water Act 2016
5 Sustainable management of community water schemes
WASREB is to provide standards and guidelines for community projects for implementation by counties
6 Poor infrastructure for water services
Counties should enforce the practice of good governance in utilities to improve overall performance. Ring fence revenues for improving infrastructure. Develop innovative financing mechanisms for financing operation and maintenance. Utilities should use justified average tariffs for full cost recovery.
7 Lack of reliable raw water sources
Counties to work with WRUAs to protect and conserve water catchment areas. In addition, existing water sources should be protected from pollution. WRA should do more to protect water resources from pollution.
8 Political interference The national legal framework and policy for the water sector should be enforced by counties
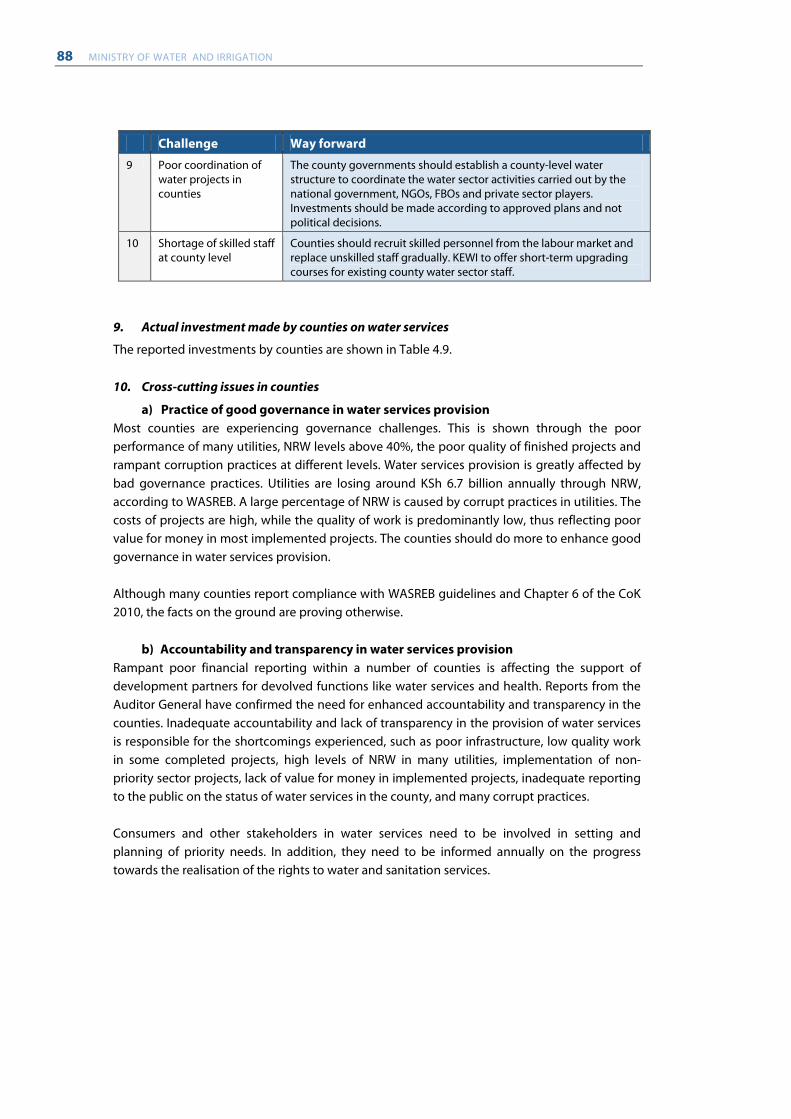
88 MINISTRY OF WATER AND IRRIGATION
Challenge Way forward
9 Poor coordination of water projects in counties
The county governments should establish a county-level water structure to coordinate the water sector activities carried out by the national government, NGOs, FBOs and private sector players. Investments should be made according to approved plans and not political decisions.
10 Shortage of skilled staff at county level
Counties should recruit skilled personnel from the labour market and replace unskilled staff gradually. KEWI to offer short-term upgrading courses for existing county water sector staff.
9. Actual investment made by counties on water services
The reported investments by counties are shown in Table 4.9. 10. Cross-cutting issues in counties
a) Practice of good governance in water services provision Most counties are experiencing governance challenges. This is shown through the poor performance of many utilities, NRW levels above 40%, the poor quality of finished projects and rampant corruption practices at different levels. Water services provision is greatly affected by bad governance practices. Utilities are losing around KSh 6.7 billion annually through NRW, according to WASREB. A large percentage of NRW is caused by corrupt practices in utilities. The costs of projects are high, while the quality of work is predominantly low, thus reflecting poor value for money in most implemented projects. The counties should do more to enhance good governance in water services provision. Although many counties report compliance with WASREB guidelines and Chapter 6 of the CoK 2010, the facts on the ground are proving otherwise.
b) Accountability and transparency in water services provision Rampant poor financial reporting within a number of counties is affecting the support of development partners for devolved functions like water services and health. Reports from the Auditor General have confirmed the need for enhanced accountability and transparency in the counties. Inadequate accountability and lack of transparency in the provision of water services is responsible for the shortcomings experienced, such as poor infrastructure, low quality work in some completed projects, high levels of NRW in many utilities, implementation of non-priority sector projects, lack of value for money in implemented projects, inadequate reporting to the public on the status of water services in the county, and many corrupt practices. Consumers and other stakeholders in water services need to be involved in setting and planning of priority needs. In addition, they need to be informed annually on the progress towards the realisation of the rights to water and sanitation services.
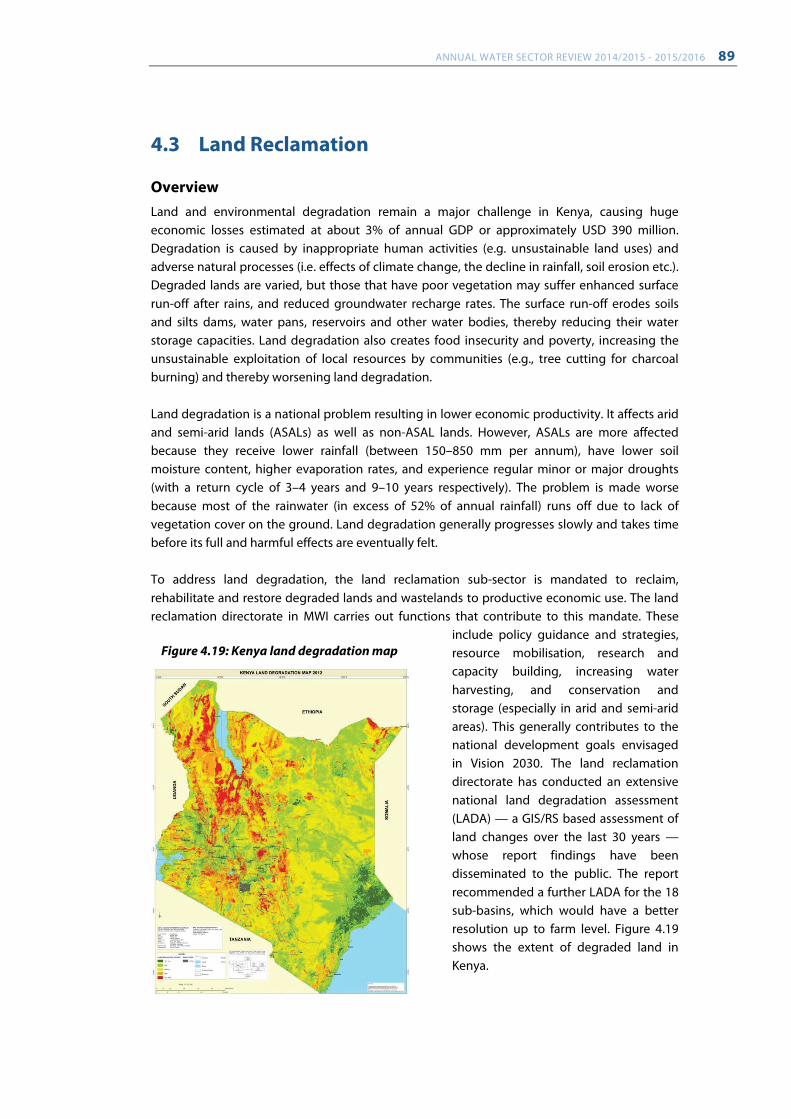
ANNUAL WATER SECTOR REVIEW 2014/2015 - 2015/2016 89
4.3 Land Reclamation
Overview Land and environmental degradation remain a major challenge in Kenya, causing huge economic losses estimated at about 3% of annual GDP or approximately USD 390 million. Degradation is caused by inappropriate human activities (e.g. unsustainable land uses) and adverse natural processes (i.e. effects of climate change, the decline in rainfall, soil erosion etc.). Degraded lands are varied, but those that have poor vegetation may suffer enhanced surface run-off after rains, and reduced groundwater recharge rates. The surface run-off erodes soils and silts dams, water pans, reservoirs and other water bodies, thereby reducing their water storage capacities. Land degradation also creates food insecurity and poverty, increasing the unsustainable exploitation of local resources by communities (e.g., tree cutting for charcoal burning) and thereby worsening land degradation. Land degradation is a national problem resulting in lower economic productivity. It affects arid and semi-arid lands (ASALs) as well as non-ASAL lands. However, ASALs are more affected because they receive lower rainfall (between 150–850 mm per annum), have lower soil moisture content, higher evaporation rates, and experience regular minor or major droughts (with a return cycle of 3–4 years and 9–10 years respectively). The problem is made worse because most of the rainwater (in excess of 52% of annual rainfall) runs off due to lack of vegetation cover on the ground. Land degradation generally progresses slowly and takes time before its full and harmful effects are eventually felt. To address land degradation, the land reclamation sub-sector is mandated to reclaim, rehabilitate and restore degraded lands and wastelands to productive economic use. The land reclamation directorate in MWI carries out functions that contribute to this mandate. These
include policy guidance and strategies, resource mobilisation, research and capacity building, increasing water harvesting, and conservation and storage (especially in arid and semi-arid areas). This generally contributes to the national development goals envisaged in Vision 2030. The land reclamation directorate has conducted an extensive national land degradation assessment (LADA) — a GIS/RS based assessment of land changes over the last 30 years — whose report findings have been disseminated to the public. The report recommended a further LADA for the 18 sub-basins, which would have a better resolution up to farm level. Figure 4.19 shows the extent of degraded land in Kenya.
Figure 4.19: Kenya land degradation map
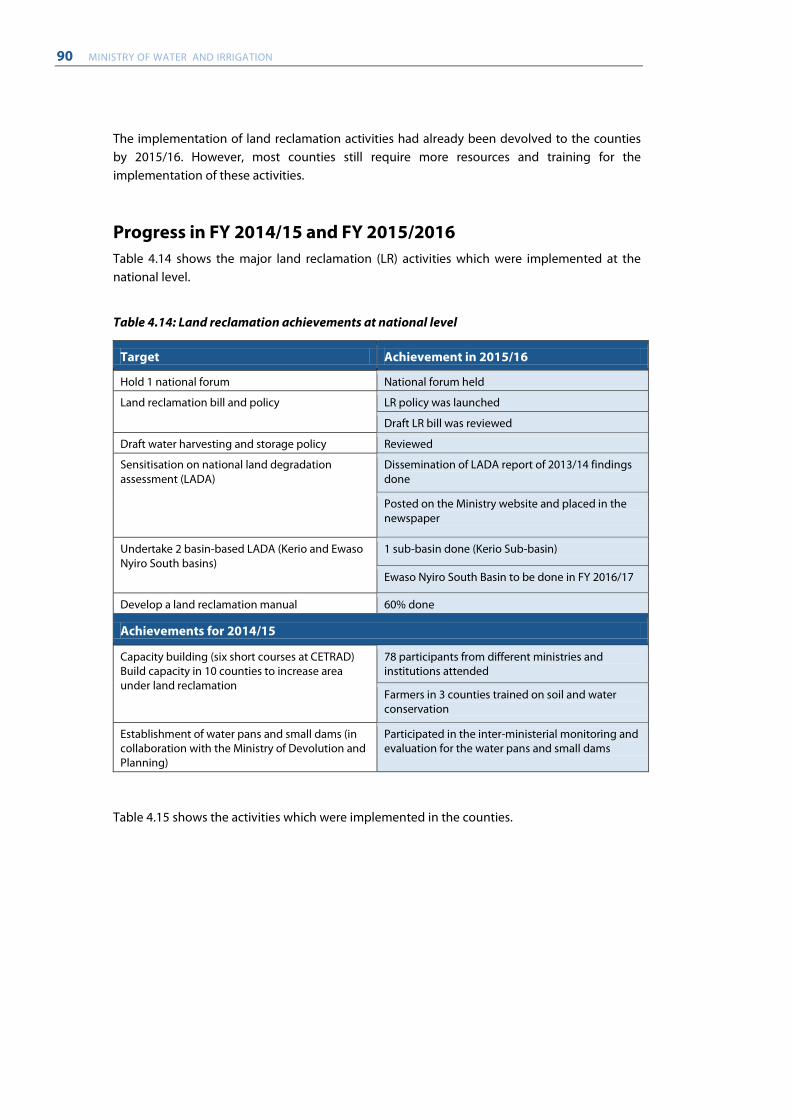
90 MINISTRY OF WATER AND IRRIGATION
The implementation of land reclamation activities had already been devolved to the counties by 2015/16. However, most counties still require more resources and training for the implementation of these activities.
Progress in FY 2014/15 and FY 2015/2016 Table 4.14 shows the major land reclamation (LR) activities which were implemented at the national level.
Table 4.14: Land reclamation achievements at national level
Target Achievement in 2015/16
Hold 1 national forum National forum held
Land reclamation bill and policy LR policy was launched
Draft LR bill was reviewed
Draft water harvesting and storage policy Reviewed
Sensitisation on national land degradation assessment (LADA)
Dissemination of LADA report of 2013/14 findings done
Posted on the Ministry website and placed in the newspaper
Undertake 2 basin-based LADA (Kerio and Ewaso Nyiro South basins)
1 sub-basin done (Kerio Sub-basin)
Ewaso Nyiro South Basin to be done in FY 2016/17
Develop a land reclamation manual 60% done
Achievements for 2014/15
Capacity building (six short courses at CETRAD) Build capacity in 10 counties to increase area under land reclamation
78 participants from different ministries and institutions attended
Farmers in 3 counties trained on soil and water conservation
Establishment of water pans and small dams (in collaboration with the Ministry of Devolution and Planning)
Participated in the inter-ministerial monitoring and evaluation for the water pans and small dams
Table 4.15 shows the activities which were implemented in the counties.
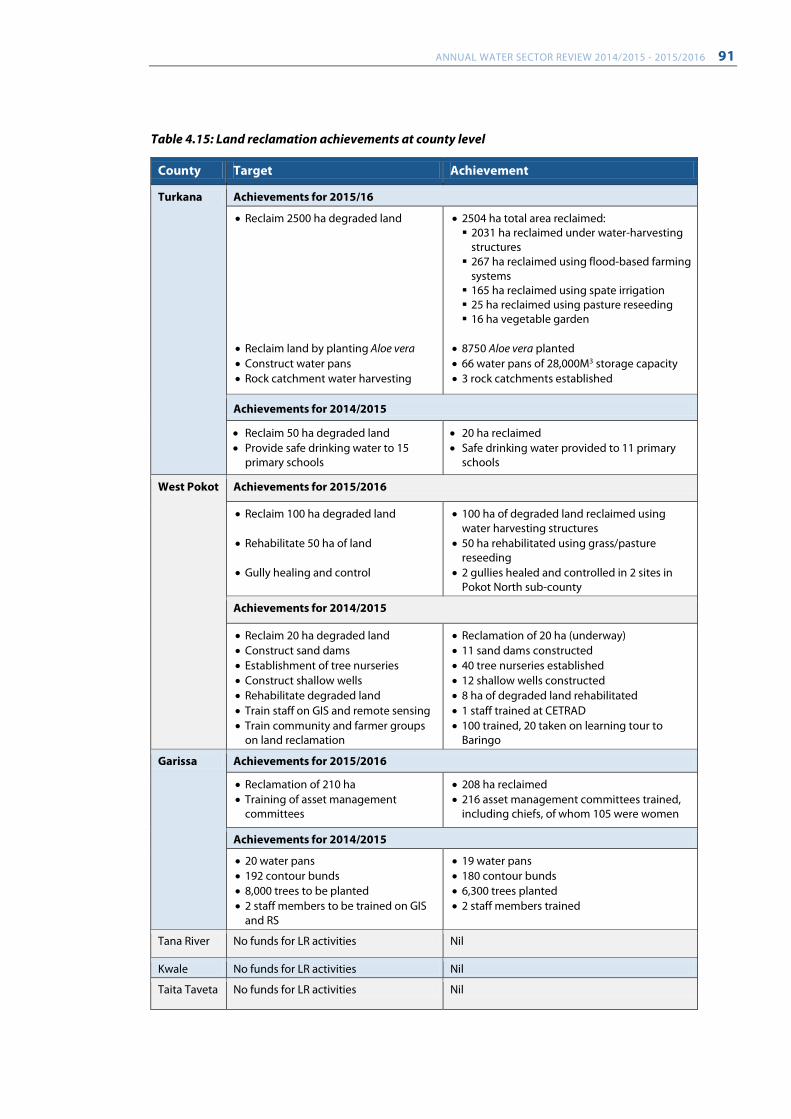
ANNUAL WATER SECTOR REVIEW 2014/2015 - 2015/2016 91
Table 4.15: Land reclamation achievements at county level
County Target Achievement
Turkana Achievements for 2015/16
• Reclaim 2500 ha degraded land • Reclaim land by planting Aloe vera • Construct water pans • Rock catchment water harvesting
• 2504 ha total area reclaimed: 2031 ha reclaimed under water-harvesting
structures 267 ha reclaimed using flood-based farming
systems 165 ha reclaimed using spate irrigation 25 ha reclaimed using pasture reseeding 16 ha vegetable garden
• 8750 Aloe vera planted • 66 water pans of 28,000M3 storage capacity • 3 rock catchments established
Achievements for 2014/2015
• Reclaim 50 ha degraded land • Provide safe drinking water to 15
primary schools
• 20 ha reclaimed • Safe drinking water provided to 11 primary
schools
West Pokot Achievements for 2015/2016
• Reclaim 100 ha degraded land • Rehabilitate 50 ha of land • Gully healing and control
• 100 ha of degraded land reclaimed using water harvesting structures
• 50 ha rehabilitated using grass/pasture reseeding
• 2 gullies healed and controlled in 2 sites in Pokot North sub-county
Achievements for 2014/2015
• Reclaim 20 ha degraded land • Construct sand dams • Establishment of tree nurseries • Construct shallow wells • Rehabilitate degraded land • Train staff on GIS and remote sensing • Train community and farmer groups
on land reclamation
• Reclamation of 20 ha (underway) • 11 sand dams constructed • 40 tree nurseries established • 12 shallow wells constructed • 8 ha of degraded land rehabilitated • 1 staff trained at CETRAD • 100 trained, 20 taken on learning tour to
Baringo
Garissa Achievements for 2015/2016
• Reclamation of 210 ha • Training of asset management
committees
• 208 ha reclaimed • 216 asset management committees trained,
including chiefs, of whom 105 were women
Achievements for 2014/2015
• 20 water pans • 192 contour bunds • 8,000 trees to be planted • 2 staff members to be trained on GIS
and RS
• 19 water pans • 180 contour bunds • 6,300 trees planted • 2 staff members trained
Tana River No funds for LR activities Nil
Kwale No funds for LR activities Nil
Taita Taveta No funds for LR activities Nil
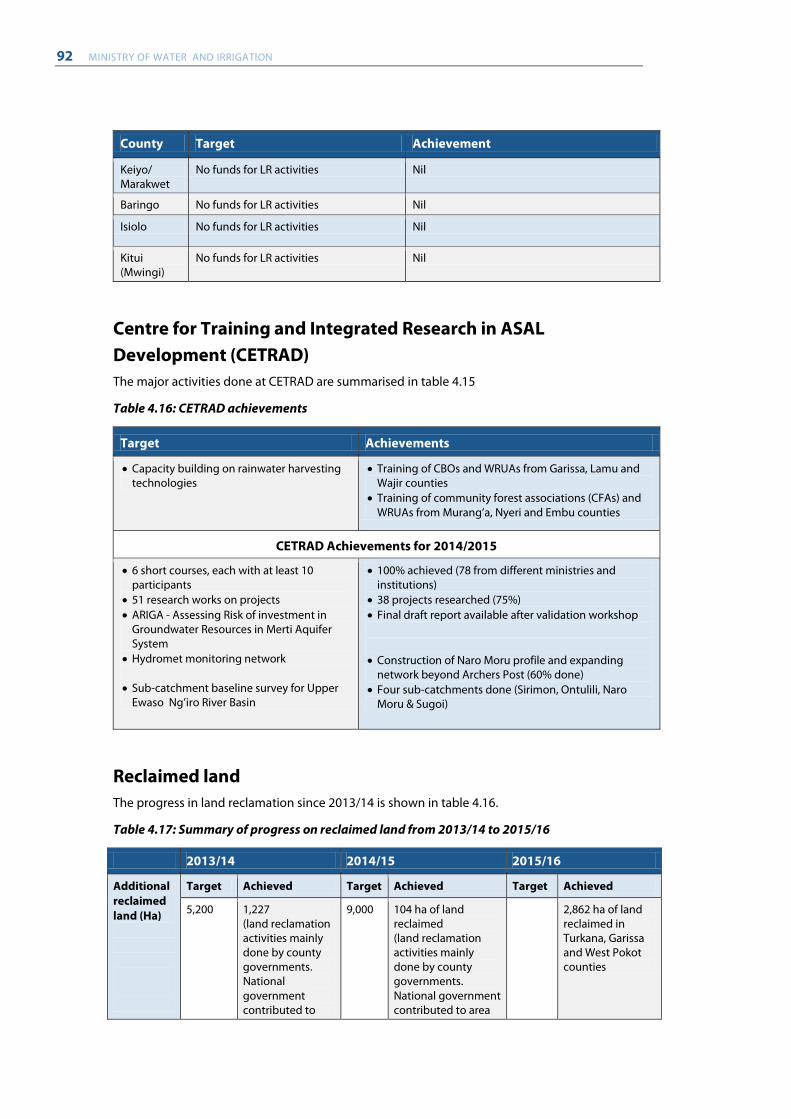
92 MINISTRY OF WATER AND IRRIGATION
County Target Achievement
Keiyo/ Marakwet
No funds for LR activities Nil
Baringo No funds for LR activities Nil
Isiolo No funds for LR activities Nil
Kitui (Mwingi)
No funds for LR activities Nil
Centre for Training and Integrated Research in ASAL Development (CETRAD) The major activities done at CETRAD are summarised in table 4.15
Table 4.16: CETRAD achievements
Target Achievements
• Capacity building on rainwater harvesting technologies
• Training of CBOs and WRUAs from Garissa, Lamu and Wajir counties
• Training of community forest associations (CFAs) and WRUAs from Murang’a, Nyeri and Embu counties
CETRAD Achievements for 2014/2015
• 6 short courses, each with at least 10 participants
• 51 research works on projects • ARIGA - Assessing Risk of investment in
Groundwater Resources in Merti Aquifer System
• Hydromet monitoring network • Sub-catchment baseline survey for Upper
Ewaso Ng’iro River Basin
• 100% achieved (78 from different ministries and institutions)
• 38 projects researched (75%) • Final draft report available after validation workshop
• Construction of Naro Moru profile and expanding
network beyond Archers Post (60% done) • Four sub-catchments done (Sirimon, Ontulili, Naro
Moru & Sugoi)
Reclaimed land The progress in land reclamation since 2013/14 is shown in table 4.16.
Table 4.17: Summary of progress on reclaimed land from 2013/14 to 2015/16
2013/14 2014/15 2015/16
Additional reclaimed land (Ha)
Target Achieved Target Achieved Target Achieved
5,200 1,227 (land reclamation activities mainly done by county governments. National government contributed to
9,000 104 ha of land reclaimed (land reclamation activities mainly done by county governments. National government contributed to area
2,862 ha of land reclaimed in Turkana, Garissa and West Pokot counties
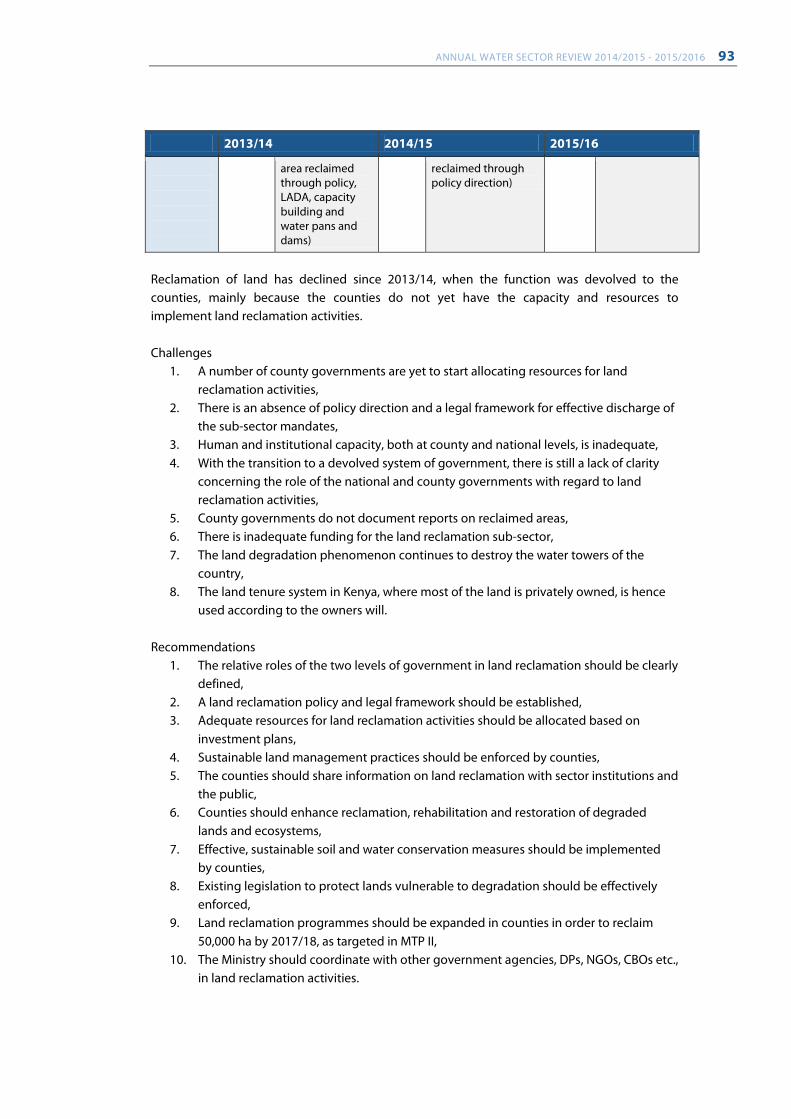
ANNUAL WATER SECTOR REVIEW 2014/2015 - 2015/2016 93
2013/14 2014/15 2015/16
area reclaimed through policy, LADA, capacity building and water pans and dams)
reclaimed through policy direction)
Reclamation of land has declined since 2013/14, when the function was devolved to the counties, mainly because the counties do not yet have the capacity and resources to implement land reclamation activities. Challenges
1. A number of county governments are yet to start allocating resources for land reclamation activities,
2. There is an absence of policy direction and a legal framework for effective discharge of the sub-sector mandates,
3. Human and institutional capacity, both at county and national levels, is inadequate, 4. With the transition to a devolved system of government, there is still a lack of clarity
concerning the role of the national and county governments with regard to land reclamation activities,
5. County governments do not document reports on reclaimed areas, 6. There is inadequate funding for the land reclamation sub-sector, 7. The land degradation phenomenon continues to destroy the water towers of the
country, 8. The land tenure system in Kenya, where most of the land is privately owned, is hence
used according to the owners will. Recommendations
1. The relative roles of the two levels of government in land reclamation should be clearly defined,
2. A land reclamation policy and legal framework should be established, 3. Adequate resources for land reclamation activities should be allocated based on
investment plans, 4. Sustainable land management practices should be enforced by counties, 5. The counties should share information on land reclamation with sector institutions and
the public, 6. Counties should enhance reclamation, rehabilitation and restoration of degraded
lands and ecosystems, 7. Effective, sustainable soil and water conservation measures should be implemented
by counties, 8. Existing legislation to protect lands vulnerable to degradation should be effectively
enforced, 9. Land reclamation programmes should be expanded in counties in order to reclaim
50,000 ha by 2017/18, as targeted in MTP II, 10. The Ministry should coordinate with other government agencies, DPs, NGOs, CBOs etc.,
in land reclamation activities.
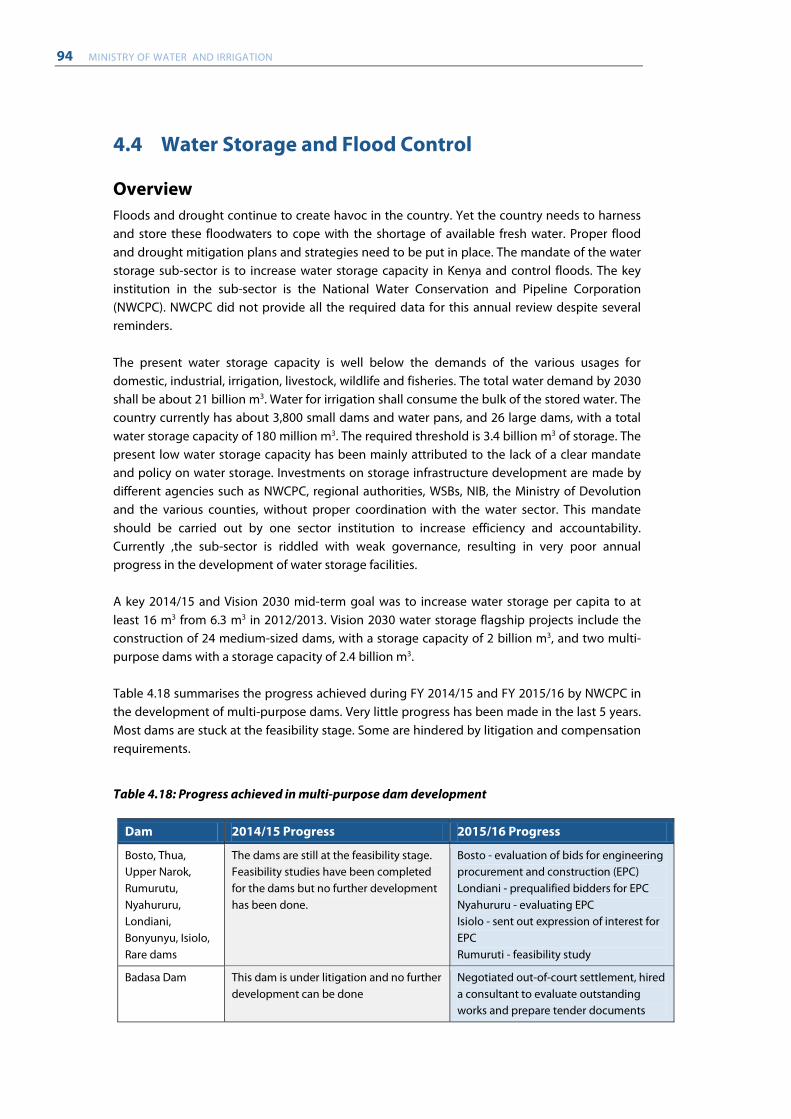
94 MINISTRY OF WATER AND IRRIGATION
4.4 Water Storage and Flood Control
Overview Floods and drought continue to create havoc in the country. Yet the country needs to harness and store these floodwaters to cope with the shortage of available fresh water. Proper flood and drought mitigation plans and strategies need to be put in place. The mandate of the water storage sub-sector is to increase water storage capacity in Kenya and control floods. The key institution in the sub-sector is the National Water Conservation and Pipeline Corporation (NWCPC). NWCPC did not provide all the required data for this annual review despite several reminders. The present water storage capacity is well below the demands of the various usages for domestic, industrial, irrigation, livestock, wildlife and fisheries. The total water demand by 2030 shall be about 21 billion m3. Water for irrigation shall consume the bulk of the stored water. The country currently has about 3,800 small dams and water pans, and 26 large dams, with a total water storage capacity of 180 million m3. The required threshold is 3.4 billion m3 of storage. The present low water storage capacity has been mainly attributed to the lack of a clear mandate and policy on water storage. Investments on storage infrastructure development are made by different agencies such as NWCPC, regional authorities, WSBs, NIB, the Ministry of Devolution and the various counties, without proper coordination with the water sector. This mandate should be carried out by one sector institution to increase efficiency and accountability. Currently ,the sub-sector is riddled with weak governance, resulting in very poor annual progress in the development of water storage facilities. A key 2014/15 and Vision 2030 mid-term goal was to increase water storage per capita to at least 16 m3 from 6.3 m3 in 2012/2013. Vision 2030 water storage flagship projects include the construction of 24 medium-sized dams, with a storage capacity of 2 billion m3, and two multi-purpose dams with a storage capacity of 2.4 billion m3. Table 4.18 summarises the progress achieved during FY 2014/15 and FY 2015/16 by NWCPC in the development of multi-purpose dams. Very little progress has been made in the last 5 years. Most dams are stuck at the feasibility stage. Some are hindered by litigation and compensation requirements.
Table 4.18: Progress achieved in multi-purpose dam development
Dam 2014/15 Progress 2015/16 Progress
Bosto, Thua, Upper Narok, Rumurutu, Nyahururu, Londiani, Bonyunyu, Isiolo, Rare dams
The dams are still at the feasibility stage. Feasibility studies have been completed for the dams but no further development has been done.
Bosto - evaluation of bids for engineering procurement and construction (EPC) Londiani - prequalified bidders for EPC Nyahururu - evaluating EPC Isiolo - sent out expression of interest for EPC Rumuruti - feasibility study
Badasa Dam This dam is under litigation and no further development can be done
Negotiated out-of-court settlement, hired a consultant to evaluate outstanding works and prepare tender documents
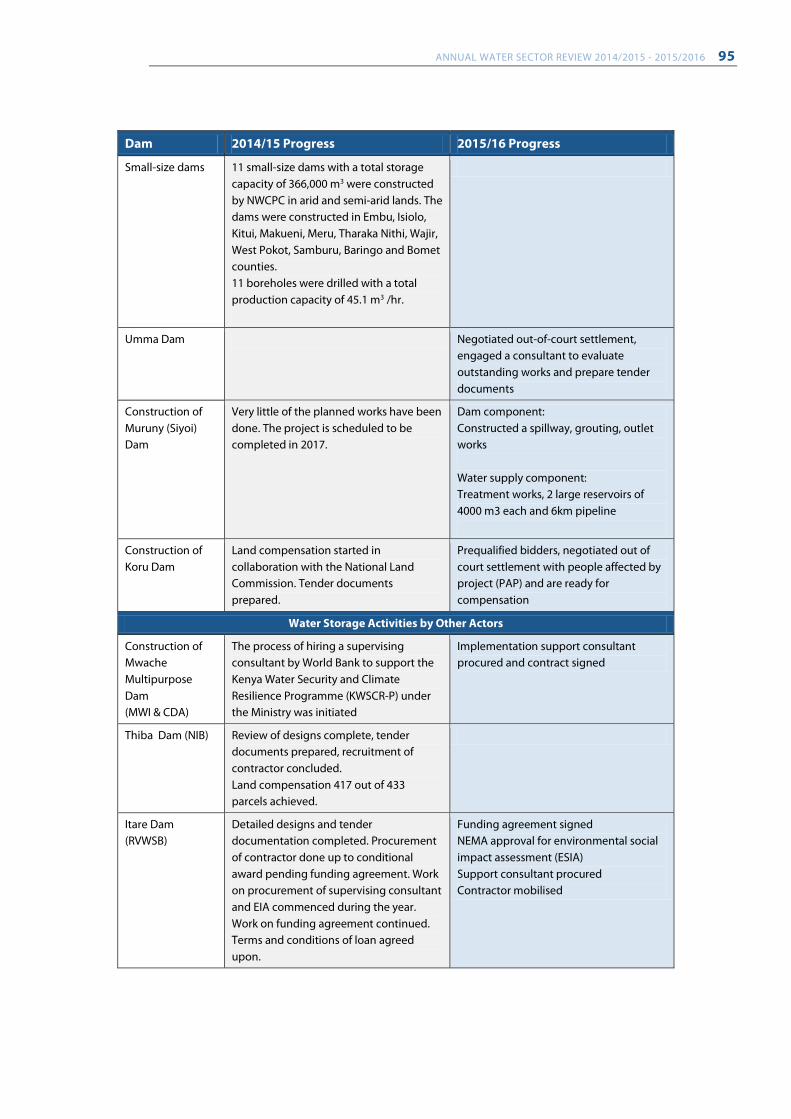
ANNUAL WATER SECTOR REVIEW 2014/2015 - 2015/2016 95
Dam 2014/15 Progress 2015/16 Progress
Small-size dams 11 small-size dams with a total storage capacity of 366,000 m3 were constructed by NWCPC in arid and semi-arid lands. The dams were constructed in Embu, Isiolo, Kitui, Makueni, Meru, Tharaka Nithi, Wajir, West Pokot, Samburu, Baringo and Bomet counties. 11 boreholes were drilled with a total production capacity of 45.1 m3 /hr.
Umma Dam Negotiated out-of-court settlement, engaged a consultant to evaluate outstanding works and prepare tender documents
Construction of Muruny (Siyoi) Dam
Very little of the planned works have been done. The project is scheduled to be completed in 2017.
Dam component: Constructed a spillway, grouting, outlet works Water supply component: Treatment works, 2 large reservoirs of 4000 m3 each and 6km pipeline
Construction of Koru Dam
Land compensation started in collaboration with the National Land Commission. Tender documents prepared.
Prequalified bidders, negotiated out of court settlement with people affected by project (PAP) and are ready for compensation
Water Storage Activities by Other Actors
Construction of Mwache Multipurpose Dam (MWI & CDA)
The process of hiring a supervising consultant by World Bank to support the Kenya Water Security and Climate Resilience Programme (KWSCR-P) under the Ministry was initiated
Implementation support consultant procured and contract signed
Thiba Dam (NIB) Review of designs complete, tender documents prepared, recruitment of contractor concluded. Land compensation 417 out of 433 parcels achieved.
Itare Dam (RVWSB)
Detailed designs and tender documentation completed. Procurement of contractor done up to conditional award pending funding agreement. Work on procurement of supervising consultant and EIA commenced during the year. Work on funding agreement continued. Terms and conditions of loan agreed upon.
Funding agreement signed NEMA approval for environmental social impact assessment (ESIA) Support consultant procured Contractor mobilised
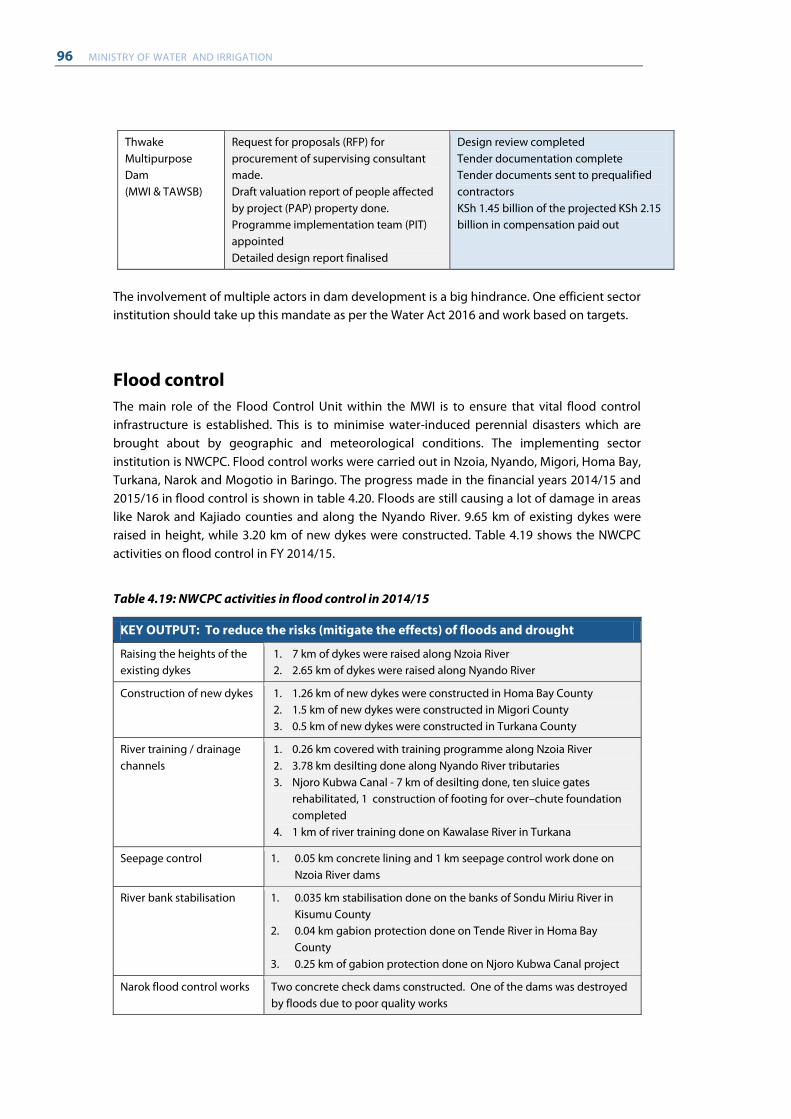
96 MINISTRY OF WATER AND IRRIGATION
The involvement of multiple actors in dam development is a big hindrance. One efficient sector institution should take up this mandate as per the Water Act 2016 and work based on targets.
Flood control The main role of the Flood Control Unit within the MWI is to ensure that vital flood control infrastructure is established. This is to minimise water-induced perennial disasters which are brought about by geographic and meteorological conditions. The implementing sector institution is NWCPC. Flood control works were carried out in Nzoia, Nyando, Migori, Homa Bay, Turkana, Narok and Mogotio in Baringo. The progress made in the financial years 2014/15 and 2015/16 in flood control is shown in table 4.20. Floods are still causing a lot of damage in areas like Narok and Kajiado counties and along the Nyando River. 9.65 km of existing dykes were raised in height, while 3.20 km of new dykes were constructed. Table 4.19 shows the NWCPC activities on flood control in FY 2014/15.
Table 4.19: NWCPC activities in flood control in 2014/15
KEY OUTPUT: To reduce the risks (mitigate the effects) of floods and drought
Raising the heights of the existing dykes
1. 7 km of dykes were raised along Nzoia River 2. 2.65 km of dykes were raised along Nyando River
Construction of new dykes 1. 1.26 km of new dykes were constructed in Homa Bay County 2. 1.5 km of new dykes were constructed in Migori County 3. 0.5 km of new dykes were constructed in Turkana County
River training / drainage channels
1. 0.26 km covered with training programme along Nzoia River 2. 3.78 km desilting done along Nyando River tributaries 3. Njoro Kubwa Canal - 7 km of desilting done, ten sluice gates
rehabilitated, 1 construction of footing for over–chute foundation completed
4. 1 km of river training done on Kawalase River in Turkana
Seepage control 1. 0.05 km concrete lining and 1 km seepage control work done on Nzoia River dams
River bank stabilisation 1. 0.035 km stabilisation done on the banks of Sondu Miriu River in Kisumu County
2. 0.04 km gabion protection done on Tende River in Homa Bay County
3. 0.25 km of gabion protection done on Njoro Kubwa Canal project
Narok flood control works Two concrete check dams constructed. One of the dams was destroyed by floods due to poor quality works
Thwake Multipurpose Dam (MWI & TAWSB)
Request for proposals (RFP) for procurement of supervising consultant made. Draft valuation report of people affected by project (PAP) property done. Programme implementation team (PIT) appointed Detailed design report finalised
Design review completed Tender documentation complete Tender documents sent to prequalified contractors KSh 1.45 billion of the projected KSh 2.15 billion in compensation paid out
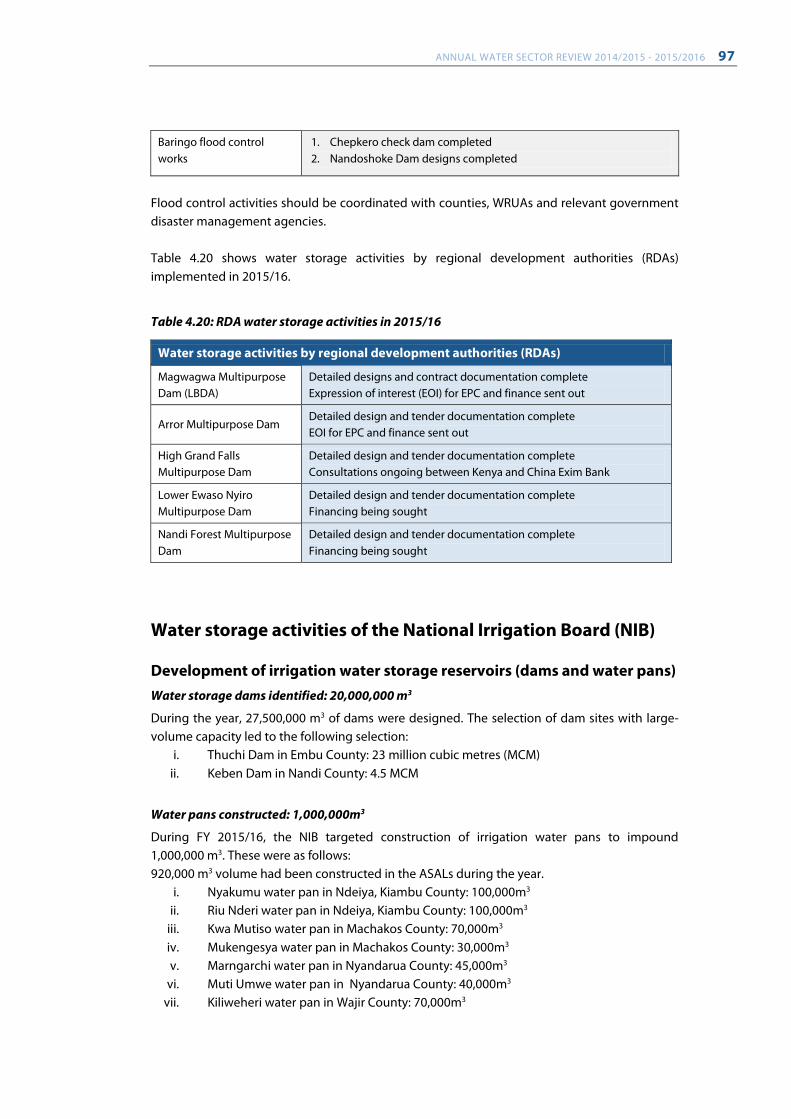
ANNUAL WATER SECTOR REVIEW 2014/2015 - 2015/2016 97
Baringo flood control works
1. Chepkero check dam completed 2. Nandoshoke Dam designs completed
Flood control activities should be coordinated with counties, WRUAs and relevant government disaster management agencies. Table 4.20 shows water storage activities by regional development authorities (RDAs) implemented in 2015/16.
Table 4.20: RDA water storage activities in 2015/16
Water storage activities by regional development authorities (RDAs)
Magwagwa Multipurpose Dam (LBDA)
Detailed designs and contract documentation complete Expression of interest (EOI) for EPC and finance sent out
Arror Multipurpose Dam Detailed design and tender documentation complete EOI for EPC and finance sent out
High Grand Falls Multipurpose Dam
Detailed design and tender documentation complete Consultations ongoing between Kenya and China Exim Bank
Lower Ewaso Nyiro Multipurpose Dam
Detailed design and tender documentation complete Financing being sought
Nandi Forest Multipurpose Dam
Detailed design and tender documentation complete Financing being sought
Water storage activities of the National Irrigation Board (NIB)
Development of irrigation water storage reservoirs (dams and water pans) Water storage dams identified: 20,000,000 m3
During the year, 27,500,000 m3 of dams were designed. The selection of dam sites with large-volume capacity led to the following selection:
i. Thuchi Dam in Embu County: 23 million cubic metres (MCM) ii. Keben Dam in Nandi County: 4.5 MCM
Water pans constructed: 1,000,000m3
During FY 2015/16, the NIB targeted construction of irrigation water pans to impound 1,000,000 m3. These were as follows: 920,000 m3 volume had been constructed in the ASALs during the year.
i. Nyakumu water pan in Ndeiya, Kiambu County: 100,000m3 ii. Riu Nderi water pan in Ndeiya, Kiambu County: 100,000m3
iii. Kwa Mutiso water pan in Machakos County: 70,000m3 iv. Mukengesya water pan in Machakos County: 30,000m3 v. Marngarchi water pan in Nyandarua County: 45,000m3
vi. Muti Umwe water pan in Nyandarua County: 40,000m3 vii. Kiliweheri water pan in Wajir County: 70,000m3
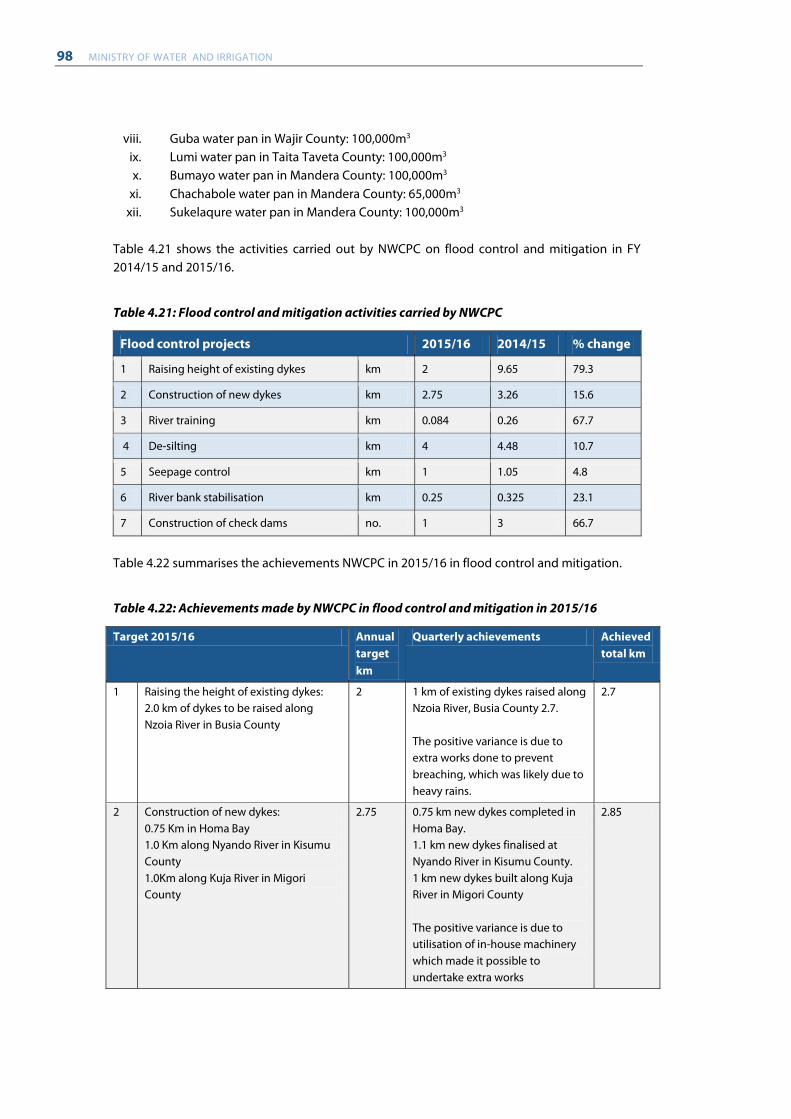
98 MINISTRY OF WATER AND IRRIGATION
viii. Guba water pan in Wajir County: 100,000m3 ix. Lumi water pan in Taita Taveta County: 100,000m3 x. Bumayo water pan in Mandera County: 100,000m3
xi. Chachabole water pan in Mandera County: 65,000m3 xii. Sukelaqure water pan in Mandera County: 100,000m3
Table 4.21 shows the activities carried out by NWCPC on flood control and mitigation in FY 2014/15 and 2015/16.
Table 4.21: Flood control and mitigation activities carried by NWCPC
Flood control projects 2015/16 2014/15 % change
1 Raising height of existing dykes km 2 9.65 79.3
2 Construction of new dykes km 2.75 3.26 15.6
3 River training km 0.084 0.26 67.7
4 De-silting km 4 4.48 10.7
5 Seepage control km 1 1.05 4.8
6 River bank stabilisation km 0.25 0.325 23.1
7 Construction of check dams no. 1 3 66.7
Table 4.22 summarises the achievements NWCPC in 2015/16 in flood control and mitigation.
Table 4.22: Achievements made by NWCPC in flood control and mitigation in 2015/16
Target 2015/16 Annual target km
Quarterly achievements Achieved total km
1 Raising the height of existing dykes: 2.0 km of dykes to be raised along Nzoia River in Busia County
2 1 km of existing dykes raised along Nzoia River, Busia County 2.7. The positive variance is due to extra works done to prevent breaching, which was likely due to heavy rains.
2.7
2 Construction of new dykes: 0.75 Km in Homa Bay 1.0 Km along Nyando River in Kisumu County 1.0Km along Kuja River in Migori County
2.75 0.75 km new dykes completed in Homa Bay. 1.1 km new dykes finalised at Nyando River in Kisumu County. 1 km new dykes built along Kuja River in Migori County The positive variance is due to utilisation of in-house machinery which made it possible to undertake extra works
2.85
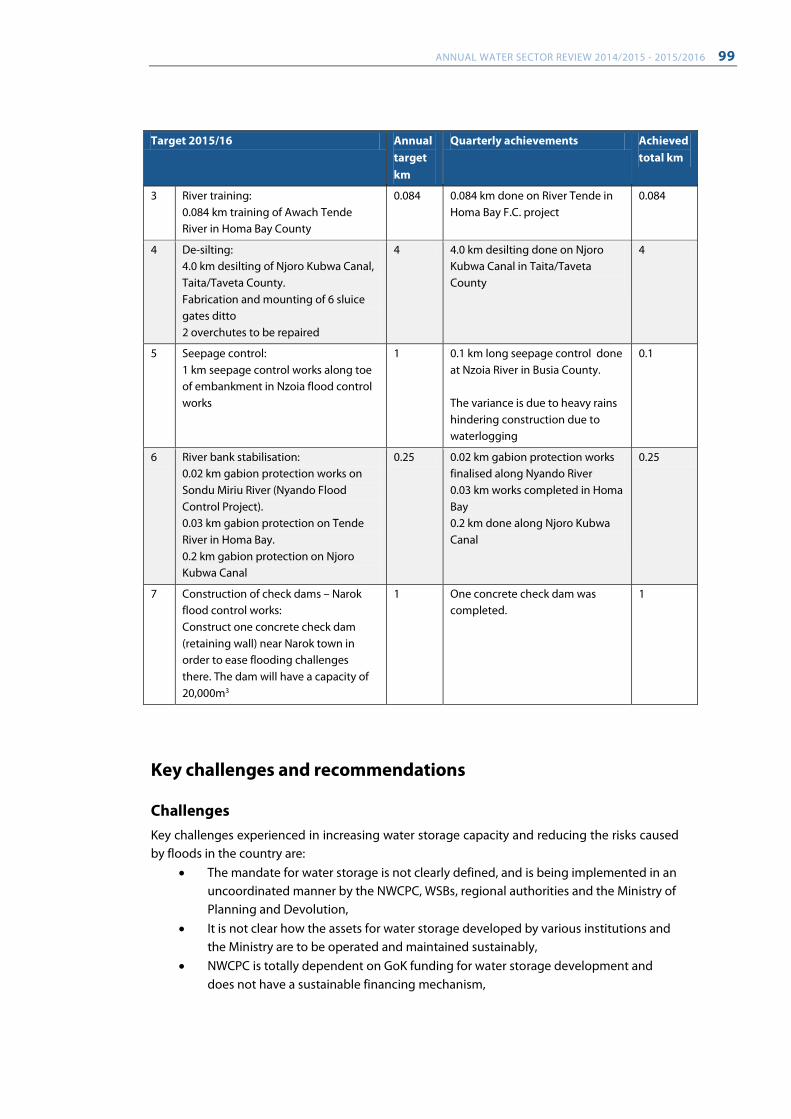
ANNUAL WATER SECTOR REVIEW 2014/2015 - 2015/2016 99
Target 2015/16 Annual target km
Quarterly achievements Achieved total km
3 River training: 0.084 km training of Awach Tende River in Homa Bay County
0.084 0.084 km done on River Tende in Homa Bay F.C. project
0.084
4 De-silting: 4.0 km desilting of Njoro Kubwa Canal, Taita/Taveta County. Fabrication and mounting of 6 sluice gates ditto 2 overchutes to be repaired
4 4.0 km desilting done on Njoro Kubwa Canal in Taita/Taveta County
4
5 Seepage control: 1 km seepage control works along toe of embankment in Nzoia flood control works
1 0.1 km long seepage control done at Nzoia River in Busia County. The variance is due to heavy rains hindering construction due to waterlogging
0.1
6 River bank stabilisation: 0.02 km gabion protection works on Sondu Miriu River (Nyando Flood Control Project). 0.03 km gabion protection on Tende River in Homa Bay. 0.2 km gabion protection on Njoro Kubwa Canal
0.25 0.02 km gabion protection works finalised along Nyando River 0.03 km works completed in Homa Bay 0.2 km done along Njoro Kubwa Canal
0.25
7 Construction of check dams – Narok flood control works: Construct one concrete check dam (retaining wall) near Narok town in order to ease flooding challenges there. The dam will have a capacity of 20,000m3
1 One concrete check dam was completed.
1
Key challenges and recommendations
Challenges Key challenges experienced in increasing water storage capacity and reducing the risks caused by floods in the country are:
• The mandate for water storage is not clearly defined, and is being implemented in an uncoordinated manner by the NWCPC, WSBs, regional authorities and the Ministry of Planning and Devolution,
• It is not clear how the assets for water storage developed by various institutions and the Ministry are to be operated and maintained sustainably,
• NWCPC is totally dependent on GoK funding for water storage development and does not have a sustainable financing mechanism,
100 MINISTRY OF WATER AND IRRIGATION
• Water storage development has social challenges leading to land-use conflicts with communities within the potential sites,
• Climate change, disaster management and environmental degradation (e.g., erosion risks) are not taken on board sufficiently in the policy framework and in implementation,
• Water availability and water services provision has not kept pace with rapid growth in urbanisation, industrial production, tourism and recreation services, agricultural and livestock production, among others,
• The sub-sector lacks comprehensive investment and financing planning for water storage and flood mitigation infrastructure, with total dependency on funds from GoK and DP,
• There are inadequate strategies for rainwater harvesting and storage, • There is a slow response when dealing with identified bottlenecks.
Recommendations • Prepare a financing and investment plan for the sub-sector, • Prepare and implement catchment management plans for all water storage projects, • Constitute a dam safety unit and build its capacity within one responsible sector institution, • Implement a redefined role and mandate for the water storage sub-sector as proposed in the • Water Act 2016, • Put in place proper governance structures for the water storage sub-sector, • Provide appropriate training and general capacity building in dam design technology, • Prioritise storage facilities and develop them to completion before starting new ones, • Look into other innovative ways of financing storage structures.
4.5 Irrigation and Drainage
Overview The mandate of the Irrigation and Drainage department is to promote the development of sustainable farmer-owned and -managed irrigation and drainage projects. This is done through a community participation approach and coordination of stakeholders, with the aim of contributing to poverty alleviation, food security and employment creation. The role of the Ministry focuses on policy matters, collaboration and coordination of irrigation and drainage issues at the international, national and regional levels. The head office of the Ministry also provides administrative and technical backstopping to the field offices. The Directorate of Irrigation and Drainage places crucial importance on the development of irrigation infrastructure. This is aimed at reducing dependence on rain-fed agriculture. This would significantly improve food security, creating employment and increasing the production of high-value crops for the export market. This is being realised through reviving all stalled state irrigation schemes through the NIB and stimulating growth of smallholder- and community-owned and managed irrigation schemes countrywide to expand irrigation acreage.
ANNUAL WATER SECTOR REVIEW 2014/2015 - 2015/2016 101
A conducive environment is being pursued through establishing a favourable policy and legal framework to encourage private investment in irrigated agriculture. The National Water Master Plan, 2013 estimates the national irrigation coverage at 153,800 hectares (17%). Investment in the irrigation sub-sector has increased eightfold over the last three years because of the economic stimulus package and the expanded irrigation programme. This has facilitated rehabilitation and expansion of irrigation schemes throughout the country. (MTP 2013-2017) Sub-sector goals and progress
• Expand land under irrigation by 40,000 ha per year, in line with Vision 2030, of which at least 800 ha (2,000 acres) will be implemented for each constituency,
• Increase agricultural water harvesting and storage and contribute to achieving a national average of 60 m3 rising to 600 m3 by the year 2030, with water storage per capita up from the current 5.3 m3,
• Improve the overall performance and service delivery of the sector, • Create capacity for utilisation of research, innovation and technology, • Promote participation of various stakeholders in planning, implementation and
management of irrigation • Promote and adopt an integrated approach to sustainable irrigation development.
National Irrigation Board The National Irrigation Board (NIB) is a government parastatal established in 1966 by an Act of Parliament, Chapter 347 of the Laws of Kenya, and whose mandate is the development, promotion and management of all national irrigation schemes in the country. Chapter 347 is overdue for repealing in order to align the irrigation sub-sector to CoK 2010. A draft Irrigation Bill 2015 and policy is under public discussion. Vision 2030 Mid-Term Goal (2007-2012)
To increase the area under both irrigation and drainage from 140,000 ha to over 300,000 ha as follows:
• Increase the area under irrigation from 110,000 ha to 210,000 ha • Increase the area under drainage or water management from 30,000 ha to 90,000 ha
The Second Medium Term Plan, 2013–2017, under Vision 2030, is focused on intensification and expansion of irrigation. To expand irrigation coverage, the area under irrigation shall be expanded from 119,000 to 159,000 hectares in smallholder programmes as well as in large schemes; namely, Bura, Hola, Kano, Bunyala, Pekerra and Mwea. One of the main flagship projects to be implemented is on ASAL development which is aimed at irrigation expansion. In this programme, 404,800 hectares will be put under irrigation by 2017, mainly in the arid and semi-arid areas of Turkana and Tana Delta.
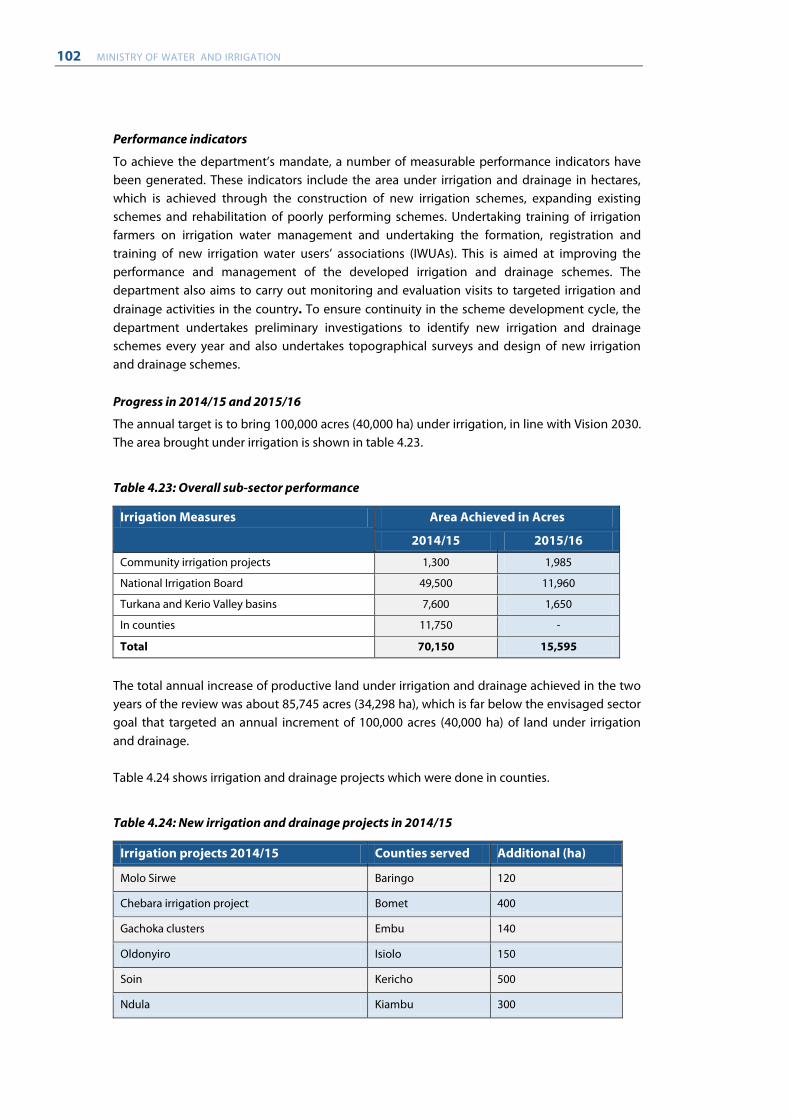
102 MINISTRY OF WATER AND IRRIGATION
Performance indicators
To achieve the department’s mandate, a number of measurable performance indicators have been generated. These indicators include the area under irrigation and drainage in hectares, which is achieved through the construction of new irrigation schemes, expanding existing schemes and rehabilitation of poorly performing schemes. Undertaking training of irrigation farmers on irrigation water management and undertaking the formation, registration and training of new irrigation water users’ associations (IWUAs). This is aimed at improving the performance and management of the developed irrigation and drainage schemes. The department also aims to carry out monitoring and evaluation visits to targeted irrigation and drainage activities in the country. To ensure continuity in the scheme development cycle, the department undertakes preliminary investigations to identify new irrigation and drainage schemes every year and also undertakes topographical surveys and design of new irrigation and drainage schemes. Progress in 2014/15 and 2015/16
The annual target is to bring 100,000 acres (40,000 ha) under irrigation, in line with Vision 2030. The area brought under irrigation is shown in table 4.23.
Table 4.23: Overall sub-sector performance
The total annual increase of productive land under irrigation and drainage achieved in the two years of the review was about 85,745 acres (34,298 ha), which is far below the envisaged sector goal that targeted an annual increment of 100,000 acres (40,000 ha) of land under irrigation and drainage. Table 4.24 shows irrigation and drainage projects which were done in counties.
Table 4.24: New irrigation and drainage projects in 2014/15
Irrigation projects 2014/15 Counties served Additional (ha)
Molo Sirwe Baringo 120
Chebara irrigation project Bomet 400
Gachoka clusters Embu 140
Oldonyiro Isiolo 150
Soin Kericho 500
Ndula Kiambu 300
Irrigation Measures Area Achieved in Acres
2014/15 2015/16
Community irrigation projects 1,300 1,985
National Irrigation Board 49,500 11,960
Turkana and Kerio Valley basins 7,600 1,650
In counties 11,750 -
Total 70,150 15,595
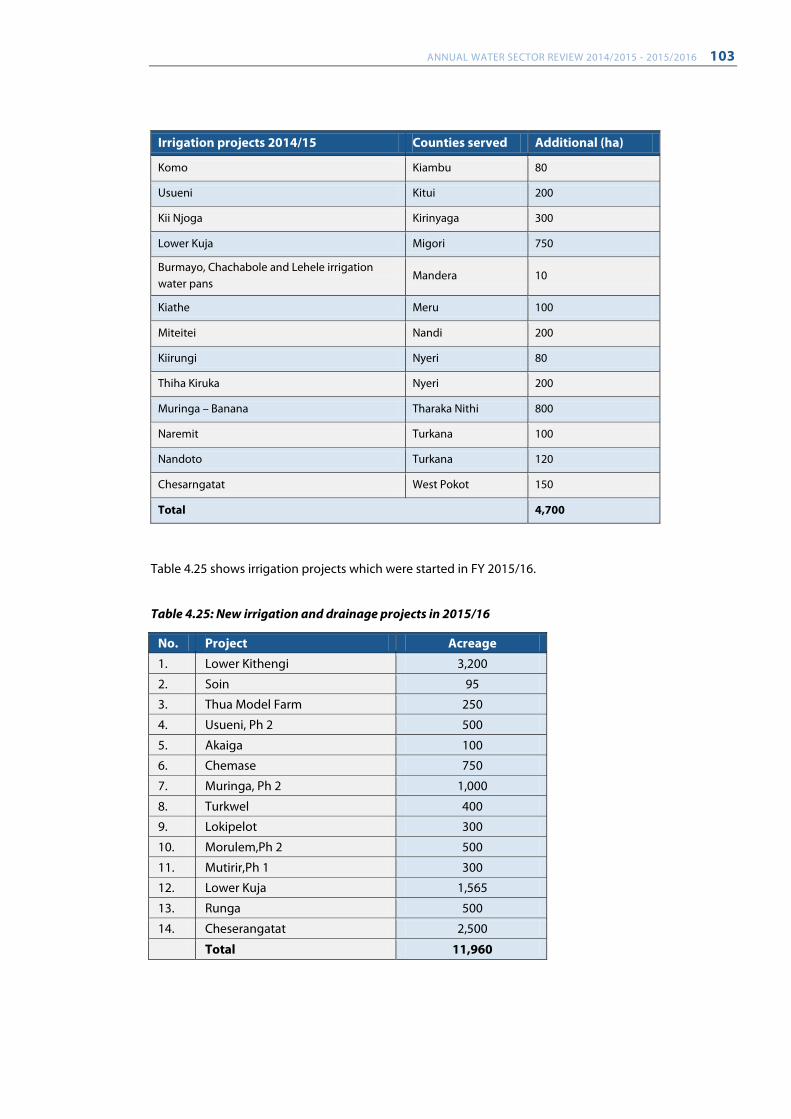
ANNUAL WATER SECTOR REVIEW 2014/2015 - 2015/2016 103
Irrigation projects 2014/15 Counties served Additional (ha)
Komo Kiambu 80
Usueni Kitui 200
Kii Njoga Kirinyaga 300
Lower Kuja Migori 750
Burmayo, Chachabole and Lehele irrigation water pans
Mandera 10
Kiathe Meru 100
Miteitei Nandi 200
Kiirungi Nyeri 80
Thiha Kiruka Nyeri 200
Muringa – Banana Tharaka Nithi 800
Naremit Turkana 100
Nandoto Turkana 120
Chesarngatat West Pokot 150
Total 4,700
Table 4.25 shows irrigation projects which were started in FY 2015/16.
Table 4.25: New irrigation and drainage projects in 2015/16
No. Project Acreage 1. Lower Kithengi 3,200
2. Soin 95
3. Thua Model Farm 250
4. Usueni, Ph 2 500
5. Akaiga 100
6. Chemase 750
7. Muringa, Ph 2 1,000
8. Turkwel 400
9. Lokipelot 300
10. Morulem,Ph 2 500
11. Mutirir,Ph 1 300
12. Lower Kuja 1,565
13. Runga 500
14. Cheserangatat 2,500
Total 11,960
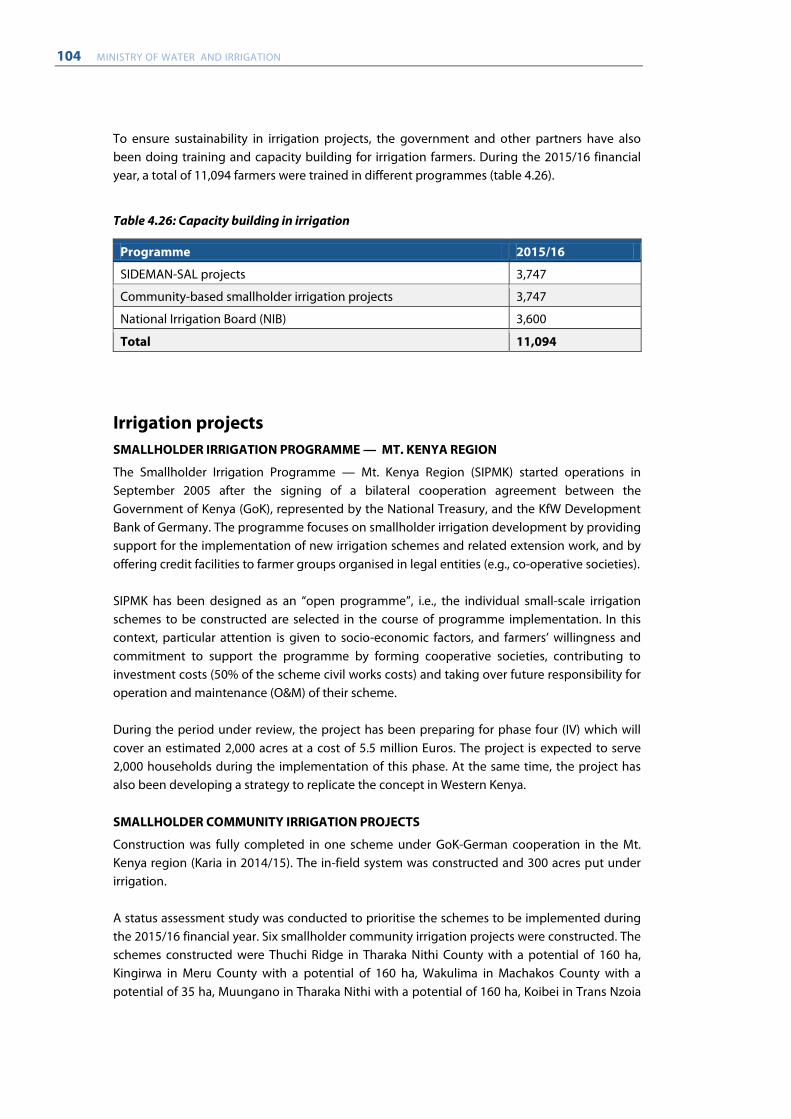
104 MINISTRY OF WATER AND IRRIGATION
To ensure sustainability in irrigation projects, the government and other partners have also been doing training and capacity building for irrigation farmers. During the 2015/16 financial year, a total of 11,094 farmers were trained in different programmes (table 4.26).
Table 4.26: Capacity building in irrigation
Programme 2015/16
SIDEMAN-SAL projects 3,747
Community-based smallholder irrigation projects 3,747
National Irrigation Board (NIB) 3,600
Total 11,094
Irrigation projects SMALLHOLDER IRRIGATION PROGRAMME — MT. KENYA REGION
The Smallholder Irrigation Programme — Mt. Kenya Region (SIPMK) started operations in September 2005 after the signing of a bilateral cooperation agreement between the Government of Kenya (GoK), represented by the National Treasury, and the KfW Development Bank of Germany. The programme focuses on smallholder irrigation development by providing support for the implementation of new irrigation schemes and related extension work, and by offering credit facilities to farmer groups organised in legal entities (e.g., co-operative societies). SIPMK has been designed as an “open programme”, i.e., the individual small-scale irrigation schemes to be constructed are selected in the course of programme implementation. In this context, particular attention is given to socio-economic factors, and farmers’ willingness and commitment to support the programme by forming cooperative societies, contributing to investment costs (50% of the scheme civil works costs) and taking over future responsibility for operation and maintenance (O&M) of their scheme. During the period under review, the project has been preparing for phase four (IV) which will cover an estimated 2,000 acres at a cost of 5.5 million Euros. The project is expected to serve 2,000 households during the implementation of this phase. At the same time, the project has also been developing a strategy to replicate the concept in Western Kenya. SMALLHOLDER COMMUNITY IRRIGATION PROJECTS
Construction was fully completed in one scheme under GoK-German cooperation in the Mt. Kenya region (Karia in 2014/15). The in-field system was constructed and 300 acres put under irrigation. A status assessment study was conducted to prioritise the schemes to be implemented during the 2015/16 financial year. Six smallholder community irrigation projects were constructed. The schemes constructed were Thuchi Ridge in Tharaka Nithi County with a potential of 160 ha, Kingirwa in Meru County with a potential of 160 ha, Wakulima in Machakos County with a potential of 35 ha, Muungano in Tharaka Nithi with a potential of 160 ha, Koibei in Trans Nzoia
ANNUAL WATER SECTOR REVIEW 2014/2015 - 2015/2016 105
County with a potential of 44 ha and Kamusinga in Bungoma County with a potential of 80 ha. These schemes put a total of 1,447.5 acres under irrigation. SUSTAINABLE SMALLHOLDER IRRIGATION DEVELOPMENT AND MANAGEMENT IN SEMI-ARID LANDS (SIDEMAN-SAL) PROJECT
The purpose of this project was to create resilience against drought and improve food insecurity through participatory smallholder community irrigation development and management, and appropriate farming systems. The project period was 36 months (August 2012–July 2015) and the funding sources were JICA (80%), GoK (10%) and the beneficiaries (10%). The project was designed to construct smallholder community irrigation facilities through the participation of IWUAs, improve IWUA capacity for effective sustainable O&M and appropriate farming systems, enhance the capacity of technical staff for participatory irrigation development, and improve the smallholder irrigation and drainage development (SHIDD) guideline. Thirteen pilot sites were selected in semi-arid areas of the country. Implementation was planned over two phases, starting with Batch-1 of eight sites to be followed by a similar number of sites in Batch-2. Both Batch-1 and Batch-2 sites were selected in the same sub-counties so that the capacity of the technical officers at sub-county level would be enhanced continuously throughout the project period. Construction of 10 irrigation schemes under the JICA programme — SIDEMAN-SAL — was ongoing and at various stages of implementation. Some schemes were substantially completed. In FY 2014/15, 1,000 acres of land was put under irrigation and in FY 2015/16 the acreage put under irrigation from SIDEMAN-SAL was 537.5 acres. GALANA/KULALU FOOD SECURITY PROJECT (10,000 ACRES) The Galana-Kulalu Food Security Project (GKFSP) lies within the ADC Galana/Kulalu ranches in Kilifi and Tana River counties. The size of the ranches is 1.7 million acres but the irrigation potential is estimated at 1.2 million acres The objective of the project is to improve food security and contribute to employment and wealth creation. The implementation plan is to develop a 10,000-acre model farm. The implementation period shall cover 30 months (18 months for civil works, 12 months for operation). The overall project cost is estimated at KSh 14.5 billion. At completion, the project is expected to produce 40 million bags of maize annually. Various enterprises shall be established, covering a total area of 1.4 million acres, distributed as follows: maize – 525,253 acres, sugarcane – 311,731 acres, fruits – 134,143 acres, dairy production – 109,116 acres, and game and beef ranching – 295,752 acres. Phased implementation was recommended for the project, with Phase 1 covering the development of the model farm, where modern irrigation technologies would be
106 MINISTRY OF WATER AND IRRIGATION
demonstrated for replication to other areas; and Phase 2 covering the development of a 400,000-acre pilot farm after the construction of a 2-billion-m3 dam. The construction of the model farm is at 70% completion. Implementation has been progressing slowly and the work is behind schedule, with infrastructure scheduled to be completed by September 2016. A total of 24 centre pivot irrigation units will be installed with each irrigating 165 acres. Of these, 20 have been supplied and 15 centre pivots with a capacity to irrigate 2,500 acres have been installed and are operational. Four more centre pivots with a capacity of 660 acres have been installed, one is undergoing installation and one is under shipment. The pipeline to 19 centre pivots has been constructed. The drip irrigation component was to cover an area of 5,265 acres. The contractor has so far supplied drip lines capable of covering 2,000 acres. Sedimentation pans with a volume of 45,000 m3 will be used for removal of suspended sediments. Two of the pans have been marked out and one is under construction at 70% complete. Five out of 23 pumps rated at 600 m3 discharge, and a delivery head of 112 m3, have already been installed and tested. Three more pumps are in transit. Two other pumps of similar capacity are on standby. Work on the second pumping station has started and is 50% complete. Of the 10,000 acres of the model farm, 2500 acres was under crop in the third cropping season, which commenced on 1st April 2016. This area is being irrigated by 15 centre pivots (CP), each covering 165 acres. A technical team is a back-stopping production and post-harvesting activities. Maize yields harvested from 455 acres yielded an average of 31 bags per acre. Various research trials by NIB and the contractor have been initiated, including variety selection, variety spacing, and soil fertility improvement – test manure application and aflatoxin control activities. The planned trials include irrigation water regime determination, sequential/alternative crops/plants evaluation, soil fertility improvement, wheat production under irrigation (proposal submitted), irrigation system versus soil fertility improvement, fodder crops adaptation and seed production (proposal being developed) and sugar beet production under irrigation.
Investments in the irrigation sub-sector Major investments were made in the Galana Kulalu, Bura and Mwea irrigation projects as shown in table 4.27. These are major flagship projects under Vision 2030. However, they are yet to reduce their dependence on rain-fed agriculture, make a significant improvement in food security, create employment or increase the production of high-value crops for the export market. With the level of the funding given to the sub-sector, higher achievements should have been attained. Table 4.28 shows the investments made in the irrigation sub-sector in FY 2014/15 and FY 2015/16.
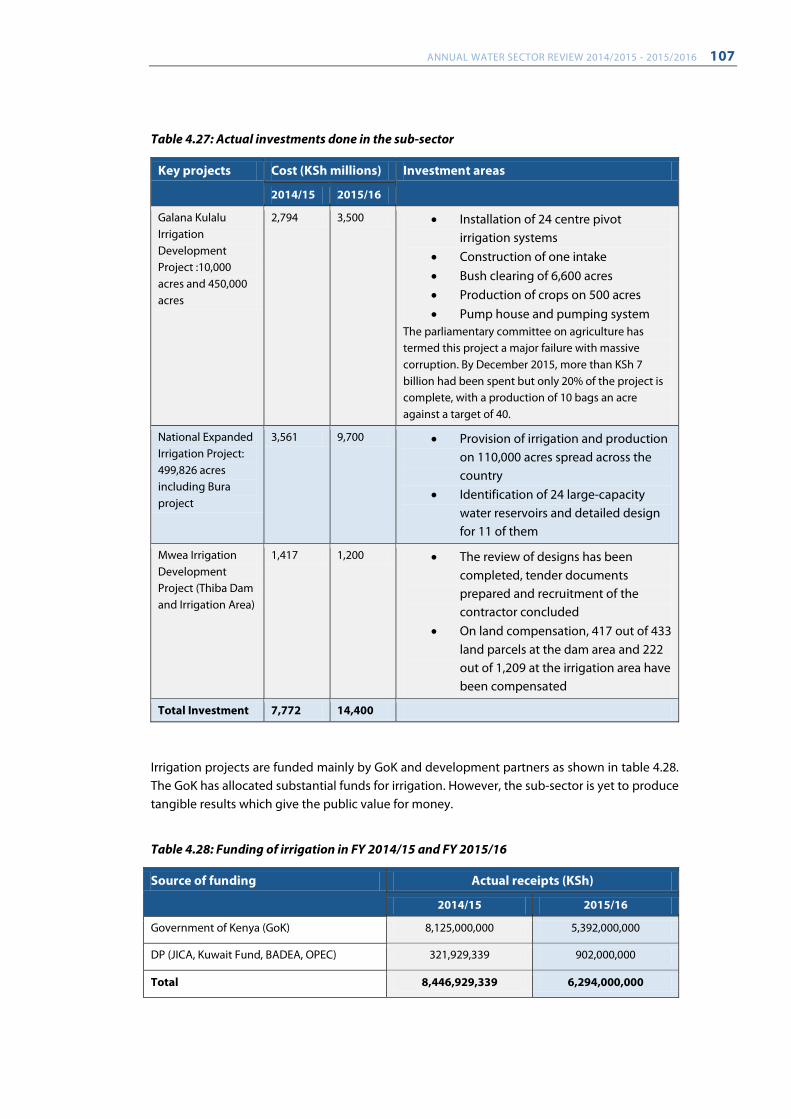
ANNUAL WATER SECTOR REVIEW 2014/2015 - 2015/2016 107
Table 4.27: Actual investments done in the sub-sector
Key projects Cost (KSh millions) Investment areas
2014/15 2015/16
Galana Kulalu Irrigation Development Project :10,000 acres and 450,000 acres
2,794 3,500 • Installation of 24 centre pivot irrigation systems
• Construction of one intake • Bush clearing of 6,600 acres • Production of crops on 500 acres • Pump house and pumping system
The parliamentary committee on agriculture has termed this project a major failure with massive corruption. By December 2015, more than KSh 7 billion had been spent but only 20% of the project is complete, with a production of 10 bags an acre against a target of 40.
National Expanded Irrigation Project: 499,826 acres including Bura project
3,561 9,700 • Provision of irrigation and production on 110,000 acres spread across the country
• Identification of 24 large-capacity water reservoirs and detailed design for 11 of them
Mwea Irrigation Development Project (Thiba Dam and Irrigation Area)
1,417 1,200 • The review of designs has been completed, tender documents prepared and recruitment of the contractor concluded
• On land compensation, 417 out of 433 land parcels at the dam area and 222 out of 1,209 at the irrigation area have been compensated
Total Investment 7,772 14,400
Irrigation projects are funded mainly by GoK and development partners as shown in table 4.28. The GoK has allocated substantial funds for irrigation. However, the sub-sector is yet to produce tangible results which give the public value for money.
Table 4.28: Funding of irrigation in FY 2014/15 and FY 2015/16
Source of funding Actual receipts (KSh)
2014/15 2015/16
Government of Kenya (GoK) 8,125,000,000 5,392,000,000
DP (JICA, Kuwait Fund, BADEA, OPEC) 321,929,339 902,000,000
Total 8,446,929,339 6,294,000,000
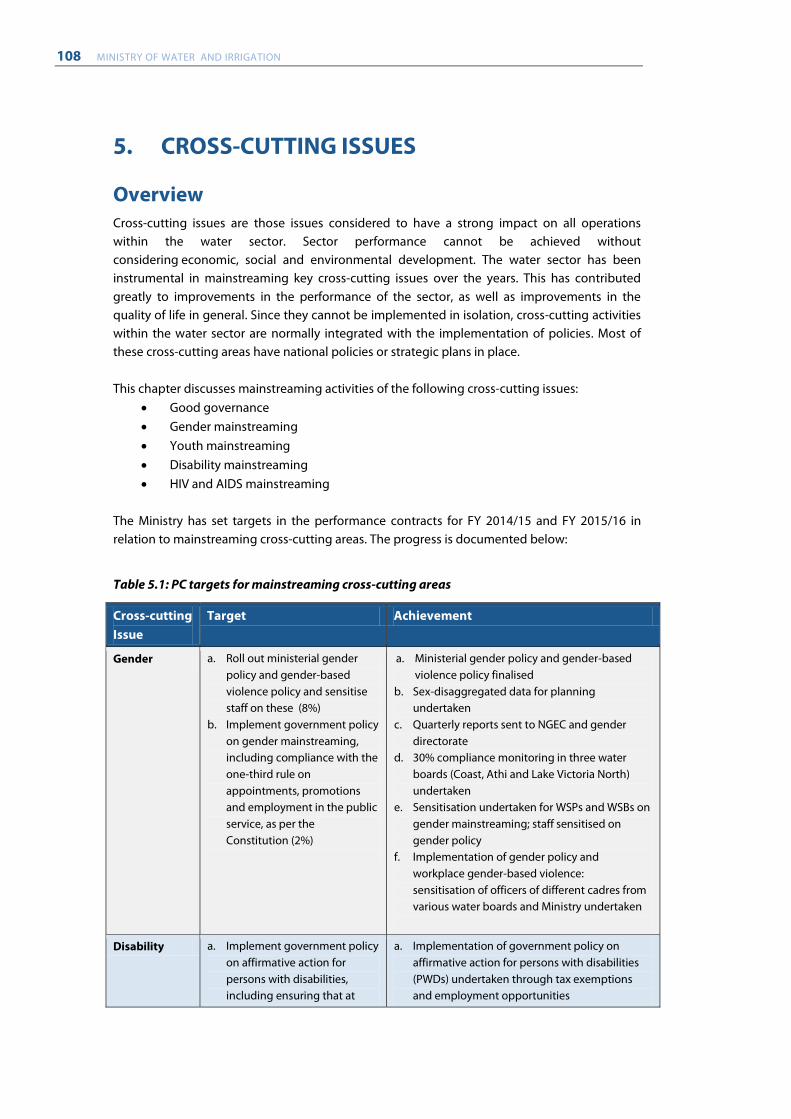
108 MINISTRY OF WATER AND IRRIGATION
5. CROSS-CUTTING ISSUES
Overview Cross-cutting issues are those issues considered to have a strong impact on all operations within the water sector. Sector performance cannot be achieved without considering economic, social and environmental development. The water sector has been instrumental in mainstreaming key cross-cutting issues over the years. This has contributed greatly to improvements in the performance of the sector, as well as improvements in the quality of life in general. Since they cannot be implemented in isolation, cross-cutting activities within the water sector are normally integrated with the implementation of policies. Most of these cross-cutting areas have national policies or strategic plans in place. This chapter discusses mainstreaming activities of the following cross-cutting issues:
• Good governance • Gender mainstreaming • Youth mainstreaming • Disability mainstreaming • HIV and AIDS mainstreaming
The Ministry has set targets in the performance contracts for FY 2014/15 and FY 2015/16 in relation to mainstreaming cross-cutting areas. The progress is documented below:
Table 5.1: PC targets for mainstreaming cross-cutting areas
Cross-cutting Issue
Target Achievement
Gender a. Roll out ministerial gender policy and gender-based violence policy and sensitise staff on these (8%)
b. Implement government policy on gender mainstreaming, including compliance with the one-third rule on appointments, promotions and employment in the public service, as per the Constitution (2%)
a. Ministerial gender policy and gender-based violence policy finalised
b. Sex-disaggregated data for planning undertaken
c. Quarterly reports sent to NGEC and gender directorate
d. 30% compliance monitoring in three water boards (Coast, Athi and Lake Victoria North) undertaken
e. Sensitisation undertaken for WSPs and WSBs on gender mainstreaming; staff sensitised on gender policy
f. Implementation of gender policy and workplace gender-based violence: sensitisation of officers of different cadres from various water boards and Ministry undertaken
Disability a. Implement government policy on affirmative action for persons with disabilities, including ensuring that at
a. Implementation of government policy on affirmative action for persons with disabilities (PWDs) undertaken through tax exemptions and employment opportunities
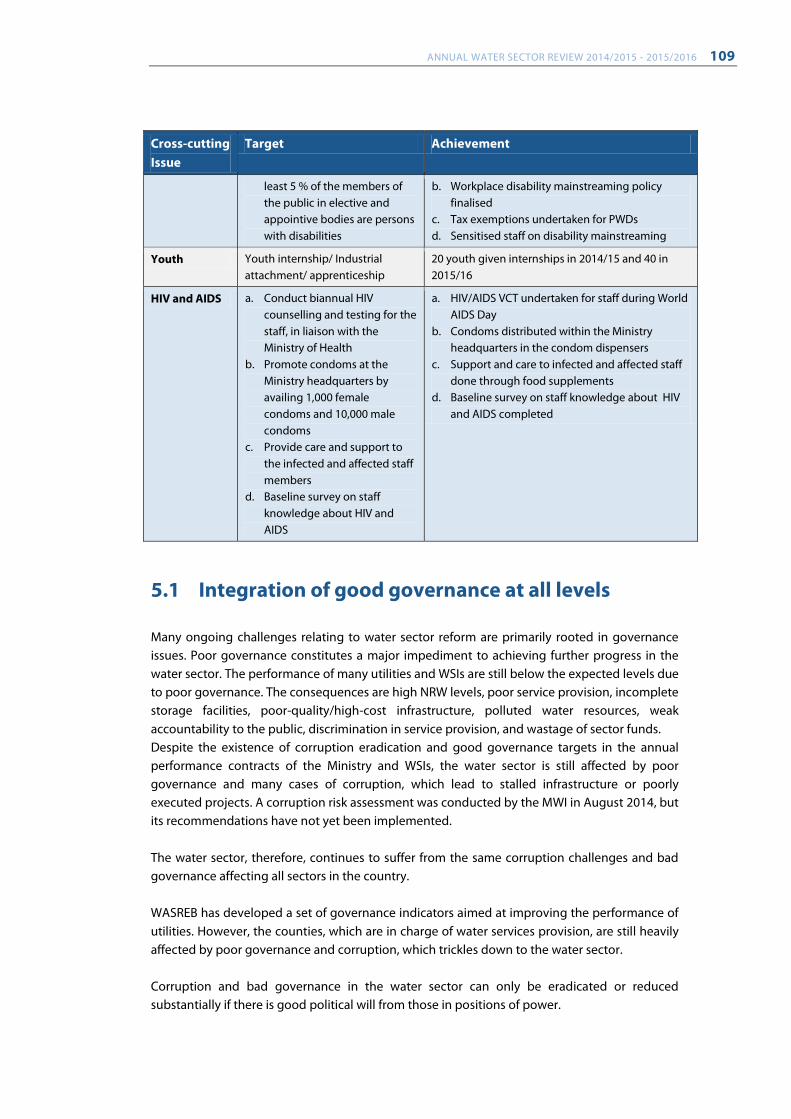
ANNUAL WATER SECTOR REVIEW 2014/2015 - 2015/2016 109
Cross-cutting Issue
Target Achievement
least 5 % of the members of the public in elective and appointive bodies are persons with disabilities
b. Workplace disability mainstreaming policy finalised
c. Tax exemptions undertaken for PWDs d. Sensitised staff on disability mainstreaming
Youth Youth internship/ Industrial attachment/ apprenticeship
20 youth given internships in 2014/15 and 40 in 2015/16
HIV and AIDS a. Conduct biannual HIV counselling and testing for the staff, in liaison with the Ministry of Health
b. Promote condoms at the Ministry headquarters by availing 1,000 female condoms and 10,000 male condoms
c. Provide care and support to the infected and affected staff members
d. Baseline survey on staff knowledge about HIV and AIDS
a. HIV/AIDS VCT undertaken for staff during World AIDS Day
b. Condoms distributed within the Ministry headquarters in the condom dispensers
c. Support and care to infected and affected staff done through food supplements
d. Baseline survey on staff knowledge about HIV and AIDS completed
5.1 Integration of good governance at all levels Many ongoing challenges relating to water sector reform are primarily rooted in governance issues. Poor governance constitutes a major impediment to achieving further progress in the water sector. The performance of many utilities and WSIs are still below the expected levels due to poor governance. The consequences are high NRW levels, poor service provision, incomplete storage facilities, poor-quality/high-cost infrastructure, polluted water resources, weak accountability to the public, discrimination in service provision, and wastage of sector funds. Despite the existence of corruption eradication and good governance targets in the annual performance contracts of the Ministry and WSIs, the water sector is still affected by poor governance and many cases of corruption, which lead to stalled infrastructure or poorly executed projects. A corruption risk assessment was conducted by the MWI in August 2014, but its recommendations have not yet been implemented. The water sector, therefore, continues to suffer from the same corruption challenges and bad governance affecting all sectors in the country. WASREB has developed a set of governance indicators aimed at improving the performance of utilities. However, the counties, which are in charge of water services provision, are still heavily affected by poor governance and corruption, which trickles down to the water sector. Corruption and bad governance in the water sector can only be eradicated or reduced substantially if there is good political will from those in positions of power.
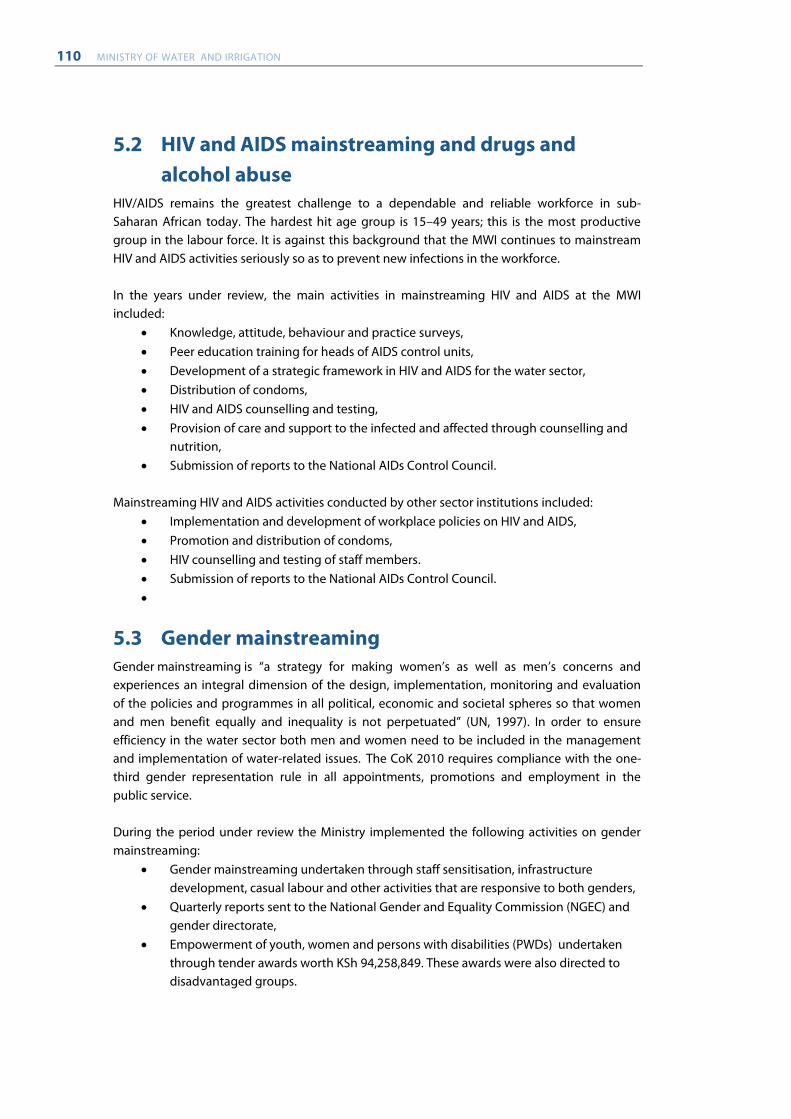
110 MINISTRY OF WATER AND IRRIGATION
5.2 HIV and AIDS mainstreaming and drugs and alcohol abuse
HIV/AIDS remains the greatest challenge to a dependable and reliable workforce in sub-Saharan African today. The hardest hit age group is 15–49 years; this is the most productive group in the labour force. It is against this background that the MWI continues to mainstream HIV and AIDS activities seriously so as to prevent new infections in the workforce. In the years under review, the main activities in mainstreaming HIV and AIDS at the MWI included:
• Knowledge, attitude, behaviour and practice surveys, • Peer education training for heads of AIDS control units, • Development of a strategic framework in HIV and AIDS for the water sector, • Distribution of condoms, • HIV and AIDS counselling and testing, • Provision of care and support to the infected and affected through counselling and
nutrition, • Submission of reports to the National AIDs Control Council.
Mainstreaming HIV and AIDS activities conducted by other sector institutions included:
• Implementation and development of workplace policies on HIV and AIDS, • Promotion and distribution of condoms, • HIV counselling and testing of staff members. • Submission of reports to the National AIDs Control Council. •
5.3 Gender mainstreaming Gender mainstreaming is “a strategy for making women’s as well as men’s concerns and experiences an integral dimension of the design, implementation, monitoring and evaluation of the policies and programmes in all political, economic and societal spheres so that women and men benefit equally and inequality is not perpetuated” (UN, 1997). In order to ensure efficiency in the water sector both men and women need to be included in the management and implementation of water-related issues. The CoK 2010 requires compliance with the one-third gender representation rule in all appointments, promotions and employment in the public service. During the period under review the Ministry implemented the following activities on gender mainstreaming:
• Gender mainstreaming undertaken through staff sensitisation, infrastructure development, casual labour and other activities that are responsive to both genders,
• Quarterly reports sent to the National Gender and Equality Commission (NGEC) and gender directorate,
• Empowerment of youth, women and persons with disabilities (PWDs) undertaken through tender awards worth KSh 94,258,849. These awards were also directed to disadvantaged groups.
ANNUAL WATER SECTOR REVIEW 2014/2015 - 2015/2016 111
The following activities were implemented in FY 2014/15 • A baseline survey of the various WRUAs across the country was conducted, including
identifying the involvement of men, women and the youth in their management, • The challenges that prevent women and youth from participating in the running of
WRUAs were highlighted, • A ministerial gender policy for the Ministry of Environment, Water and Natural
Resources was developed that gives direction on the integration of gender in projects and programmes and the engagement of both men and women in the Ministry’s activities,
• DA workplace policy on gender-based violence for the Ministry of Environment, Water and Natural Resources was developed that clearly explains ways of handling GBV at the workplace,
• A baseline survey on affirmative action in the Ministry’s departments and MDAS was conducted to check for the operationalisation of the two-thirds gender rule,
• The Ministry participated in the 59th session of the commission on the status of women,
• Different cadres of staff at the headquarters and the field offices were sensitised on gender issues,
• Gender focal points from selected water service providers were sensitised on the use and importance of the gender toolkit,
• Quarterly reports were sent to NGEC and gender directorate, • 30% compliance monitoring was undertaken in three water boards (Coast, Athi and
Lake Victoria North). The main activities of other sector institutions on gender mainstreaming included the following:
• Awareness creation and training on gender mainstreaming, • Priority given to women in tendering processes, • Sensitisation undertaken for WSPs and WSBs on gender mainstreaming; staff
sensitised on gender policy. •
5.4 Youth mainstreaming Youth mainstreaming is vital in preparing and empowering youth who will be the leaders of tomorrow. By engaging the youth early enough, they will have the potential to add value in society and bring new ideas to the sector. Youth mainstreaming, however, is not yet fully and consistently implemented by the MWI and sector institutions. Most of the sector institutions only engaged youth on internship and industrial attachments. Some institutions gave a few procurement tenders to the youth. This, however, is not enough and the sector needs to do more to engage the youth in the corporate world. In FY 2015/16 the Ministry engaged 40 qualified youth members by offering them attachments.
5.5 Disability mainstreaming In 2003 the Kenyan Government enacted the Disability Act, which was aimed at promoting the rights of people with disabilities to full participation, with equality, in social life and
112 MINISTRY OF WATER AND IRRIGATION
development. The water sector is yet to fully implement disability mainstreaming with a few of the institutions employing persons with disability and awarding tenders to people with disability. In most cases, disability mainstreaming tends to be absorbed into the other cross-cutting issues and therefore mainstreaming disability is, most of the time, not implemented or ignored. Sector institutions need to be actively involved in mainstreaming disability.
5.6 Key challenges and recommendations in cross-cutting issues
Challenges • Inadequate funding for mainstreaming cross-cutting issues in the sector, • Weak monitoring and reporting on cross-cutting interventions, • Lack of key expertise to spearhead cross-cutting issues, • Insufficient support from sector heads in supporting mainstreaming activities of
cross-cutting issues. Recommendations
• The sector institutions should take the lead in cross-cutting issues and not leave it to NGOs and development partners to take the lead,
• The sector institutions should develop realistic work plans and budgets for mainstreaming activities and should be realised by the end of a financial year,
• A comprehensively-structured monitoring system on the distinct cross-cutting areas should be put in place to ensure more informative reporting on impacts,
• The Ministry, in collaboration with selected training institutions, should develop sensitisation and training programmes on key cross-cutting areas, in order to build skills and know-how.
ANNUAL WATER SECTOR REVIEW 2014/2015 - 2015/2016 113
6. CONCLUSION The Annual Water Sector Review report is a document for reporting to the public and stakeholders. It is prepared in a participatory process by MWI, sector institutions, counties and CSOs. Public reporting is required by law as a right of the stakeholders. The review process is also a means to advocate on important sector issues which could bring the sector to the next level. This annual review report has additionally covered the sector activities which are implemented by counties and CSOs. However, data from counties are still not easily available to inform this report. The MWI is working with the Council of Governors to solve this and create Kenyan Water Week. This report should meet the information needs of most sector stakeholders. Annual sector investment is becoming very important for the water sector due to the growing investment gap, which has created stagnation in the growth of water services coverage and in the development of water storage infrastructures. This report has therefore documented investments at the national and county level in detail. The contribution to sector investment by CSOs has also been documented, based on the information received from KEWASNET for 2014/15. The report has addressed the problem of inconsistent reporting by using as much data as is available from the approved sector information systems such as WARIS at WASREB. The performance review has also focused on key performance indicators in the water sector. The sector’s investment planning and monitoring should be based on a sector investment plan. This is currently not being done. As a result, the sector continues to suffer from underinvestment. The rising demand for water and sanitation services from a rapidly growing population and the high rate of urbanisation is creating an urgent need for adequate planning based on targeted investments. Water storage also not shows a lack of improvement. The sector should strive to get value for invested money at all level by enforcing good governance. The Ministry of Water and Irrigation has identified the existing challenges and proposed recommendations in this review report. Most of these are challenges that the sector has been experiencing for a long time. The sector stakeholders should all work together to eliminate them. The Ministry should therefore:
• Implement legal frameworks in the Water Act 2016, • Facilitate a new legal framework for the irrigation sub-sector, which is aligned to CoK
2010, • Enforce good governance in the water sector at all levels, • Monitor investment based on a sector investment plan, • Mobilise more funds based on established investment plans for the sector, • Enhance the self-financing potential of the sector in water services and water
resources management, • Work to bridge the current huge investment gap in the sector, • Coordinate with relevant institutions to have in place well-informed and
comprehensive investment and financing plans, • Strengthen sector structures for improved engagement with counties and CSOs to
strengthen their contribution to sector development and the annual review,
114 MINISTRY OF WATER AND IRRIGATION
• Support the counties to improve the performance of utilities, • Enhance formalised service provision in rural and urban areas, in line with human
rights, • Put the mandate of water storage under one institution for efficiency, accountability
and sustainable operation and maintenance as per the Water Act 2016.
ANNUAL WATER SECTOR REVIEW 2014/2015 - 2015/2016 115
ANNEXES
Water Services
Access to water
Access to improved on-site sanitation
Access to sewerage
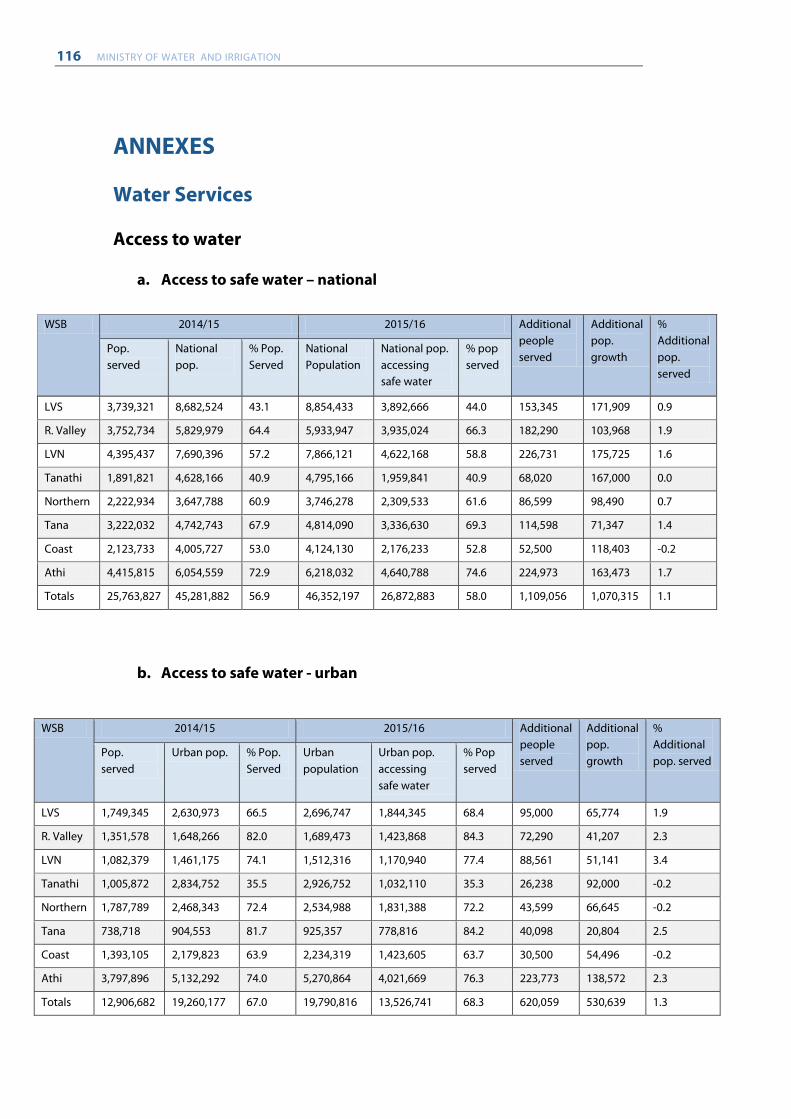
116 MINISTRY OF WATER AND IRRIGATION
ANNEXES
Water Services
Access to water
a. Access to safe water – national
WSB 2014/15 2015/16 Additional people served
Additional pop. growth
% Additional pop. served
Pop. served
National pop.
% Pop. Served
National Population
National pop. accessing safe water
% pop served
LVS 3,739,321 8,682,524 43.1 8,854,433 3,892,666 44.0 153,345 171,909 0.9
R. Valley 3,752,734 5,829,979 64.4 5,933,947 3,935,024 66.3 182,290 103,968 1.9
LVN 4,395,437 7,690,396 57.2 7,866,121 4,622,168 58.8 226,731 175,725 1.6
Tanathi 1,891,821 4,628,166 40.9 4,795,166 1,959,841 40.9 68,020 167,000 0.0
Northern 2,222,934 3,647,788 60.9 3,746,278 2,309,533 61.6 86,599 98,490 0.7
Tana 3,222,032 4,742,743 67.9 4,814,090 3,336,630 69.3 114,598 71,347 1.4
Coast 2,123,733 4,005,727 53.0 4,124,130 2,176,233 52.8 52,500 118,403 -0.2
Athi 4,415,815 6,054,559 72.9 6,218,032 4,640,788 74.6 224,973 163,473 1.7
Totals 25,763,827 45,281,882 56.9 46,352,197 26,872,883 58.0 1,109,056 1,070,315 1.1
b. Access to safe water - urban
WSB 2014/15 2015/16 Additional people served
Additional pop. growth
% Additional pop. served
Pop. served
Urban pop. % Pop. Served
Urban population
Urban pop. accessing safe water
% Pop served
LVS 1,749,345 2,630,973 66.5 2,696,747 1,844,345 68.4 95,000 65,774 1.9
R. Valley 1,351,578 1,648,266 82.0 1,689,473 1,423,868 84.3 72,290 41,207 2.3
LVN 1,082,379 1,461,175 74.1 1,512,316 1,170,940 77.4 88,561 51,141 3.4
Tanathi 1,005,872 2,834,752 35.5 2,926,752 1,032,110 35.3 26,238 92,000 -0.2
Northern 1,787,789 2,468,343 72.4 2,534,988 1,831,388 72.2 43,599 66,645 -0.2
Tana 738,718 904,553 81.7 925,357 778,816 84.2 40,098 20,804 2.5
Coast 1,393,105 2,179,823 63.9 2,234,319 1,423,605 63.7 30,500 54,496 -0.2
Athi 3,797,896 5,132,292 74.0 5,270,864 4,021,669 76.3 223,773 138,572 2.3
Totals 12,906,682 19,260,177 67.0 19,790,816 13,526,741 68.3 620,059 530,639 1.3
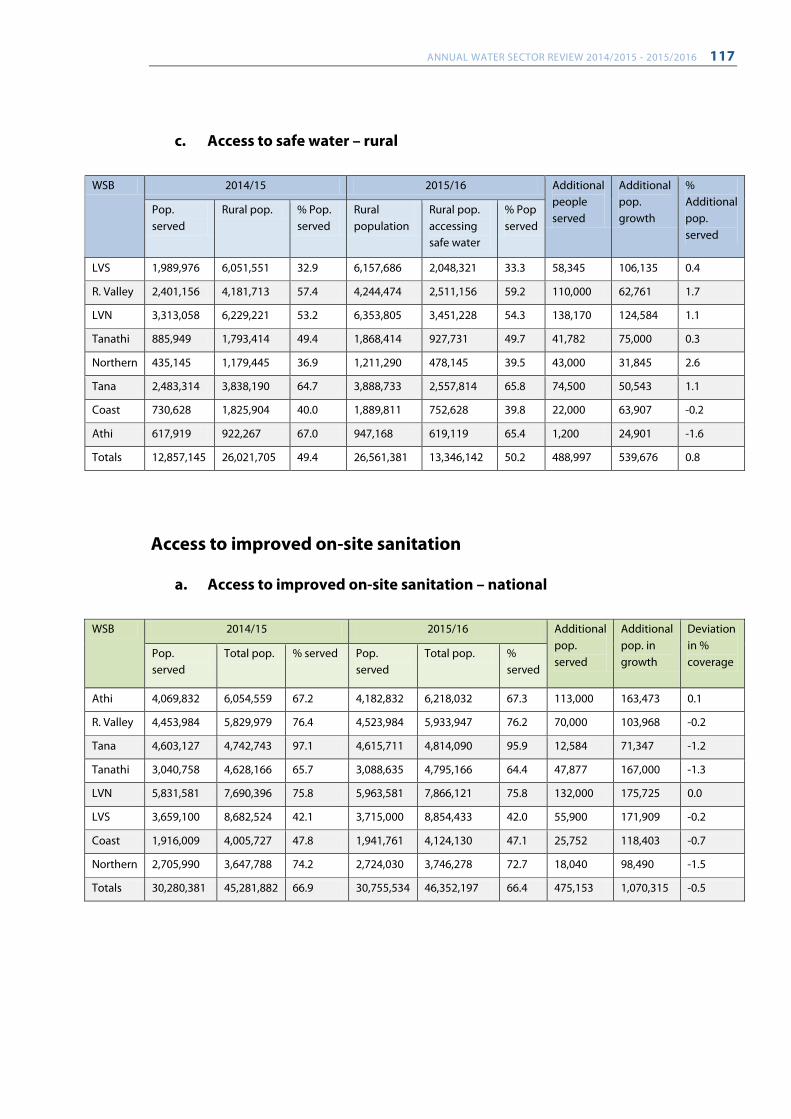
ANNUAL WATER SECTOR REVIEW 2014/2015 - 2015/2016 117
c. Access to safe water – rural
WSB 2014/15 2015/16 Additional people served
Additional pop. growth
% Additional pop. served
Pop. served
Rural pop. % Pop. served
Rural population
Rural pop. accessing safe water
% Pop served
LVS 1,989,976 6,051,551 32.9 6,157,686 2,048,321 33.3 58,345 106,135 0.4
R. Valley 2,401,156 4,181,713 57.4 4,244,474 2,511,156 59.2 110,000 62,761 1.7
LVN 3,313,058 6,229,221 53.2 6,353,805 3,451,228 54.3 138,170 124,584 1.1
Tanathi 885,949 1,793,414 49.4 1,868,414 927,731 49.7 41,782 75,000 0.3
Northern 435,145 1,179,445 36.9 1,211,290 478,145 39.5 43,000 31,845 2.6
Tana 2,483,314 3,838,190 64.7 3,888,733 2,557,814 65.8 74,500 50,543 1.1
Coast 730,628 1,825,904 40.0 1,889,811 752,628 39.8 22,000 63,907 -0.2
Athi 617,919 922,267 67.0 947,168 619,119 65.4 1,200 24,901 -1.6
Totals 12,857,145 26,021,705 49.4 26,561,381 13,346,142 50.2 488,997 539,676 0.8
Access to improved on-site sanitation
a. Access to improved on-site sanitation – national
WSB 2014/15 2015/16 Additional pop. served
Additional pop. in growth
Deviation in % coverage
Pop. served
Total pop. % served Pop. served
Total pop. % served
Athi 4,069,832 6,054,559 67.2 4,182,832 6,218,032 67.3 113,000 163,473 0.1
R. Valley 4,453,984 5,829,979 76.4 4,523,984 5,933,947 76.2 70,000 103,968 -0.2
Tana 4,603,127 4,742,743 97.1 4,615,711 4,814,090 95.9 12,584 71,347 -1.2
Tanathi 3,040,758 4,628,166 65.7 3,088,635 4,795,166 64.4 47,877 167,000 -1.3
LVN 5,831,581 7,690,396 75.8 5,963,581 7,866,121 75.8 132,000 175,725 0.0
LVS 3,659,100 8,682,524 42.1 3,715,000 8,854,433 42.0 55,900 171,909 -0.2
Coast 1,916,009 4,005,727 47.8 1,941,761 4,124,130 47.1 25,752 118,403 -0.7
Northern 2,705,990 3,647,788 74.2 2,724,030 3,746,278 72.7 18,040 98,490 -1.5
Totals 30,280,381 45,281,882 66.9 30,755,534 46,352,197 66.4 475,153 1,070,315 -0.5
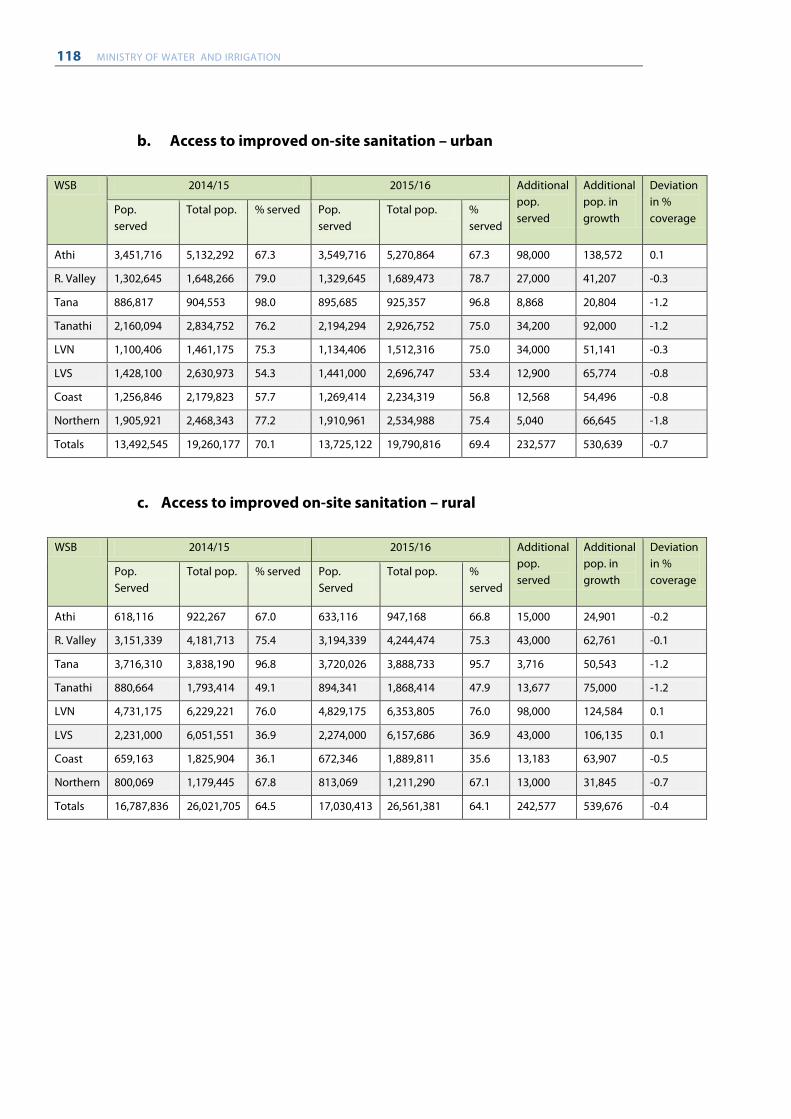
118 MINISTRY OF WATER AND IRRIGATION
b. Access to improved on-site sanitation – urban
WSB 2014/15 2015/16 Additional pop. served
Additional pop. in growth
Deviation in % coverage
Pop. served
Total pop. % served Pop. served
Total pop. % served
Athi 3,451,716 5,132,292 67.3 3,549,716 5,270,864 67.3 98,000 138,572 0.1
R. Valley 1,302,645 1,648,266 79.0 1,329,645 1,689,473 78.7 27,000 41,207 -0.3
Tana 886,817 904,553 98.0 895,685 925,357 96.8 8,868 20,804 -1.2
Tanathi 2,160,094 2,834,752 76.2 2,194,294 2,926,752 75.0 34,200 92,000 -1.2
LVN 1,100,406 1,461,175 75.3 1,134,406 1,512,316 75.0 34,000 51,141 -0.3
LVS 1,428,100 2,630,973 54.3 1,441,000 2,696,747 53.4 12,900 65,774 -0.8
Coast 1,256,846 2,179,823 57.7 1,269,414 2,234,319 56.8 12,568 54,496 -0.8
Northern 1,905,921 2,468,343 77.2 1,910,961 2,534,988 75.4 5,040 66,645 -1.8
Totals 13,492,545 19,260,177 70.1 13,725,122 19,790,816 69.4 232,577 530,639 -0.7
c. Access to improved on-site sanitation – rural
WSB 2014/15 2015/16 Additional pop. served
Additional pop. in growth
Deviation in % coverage
Pop. Served
Total pop. % served Pop. Served
Total pop. % served
Athi 618,116 922,267 67.0 633,116 947,168 66.8 15,000 24,901 -0.2
R. Valley 3,151,339 4,181,713 75.4 3,194,339 4,244,474 75.3 43,000 62,761 -0.1
Tana 3,716,310 3,838,190 96.8 3,720,026 3,888,733 95.7 3,716 50,543 -1.2
Tanathi 880,664 1,793,414 49.1 894,341 1,868,414 47.9 13,677 75,000 -1.2
LVN 4,731,175 6,229,221 76.0 4,829,175 6,353,805 76.0 98,000 124,584 0.1
LVS 2,231,000 6,051,551 36.9 2,274,000 6,157,686 36.9 43,000 106,135 0.1
Coast 659,163 1,825,904 36.1 672,346 1,889,811 35.6 13,183 63,907 -0.5
Northern 800,069 1,179,445 67.8 813,069 1,211,290 67.1 13,000 31,845 -0.7
Totals 16,787,836 26,021,705 64.5 17,030,413 26,561,381 64.1 242,577 539,676 -0.4
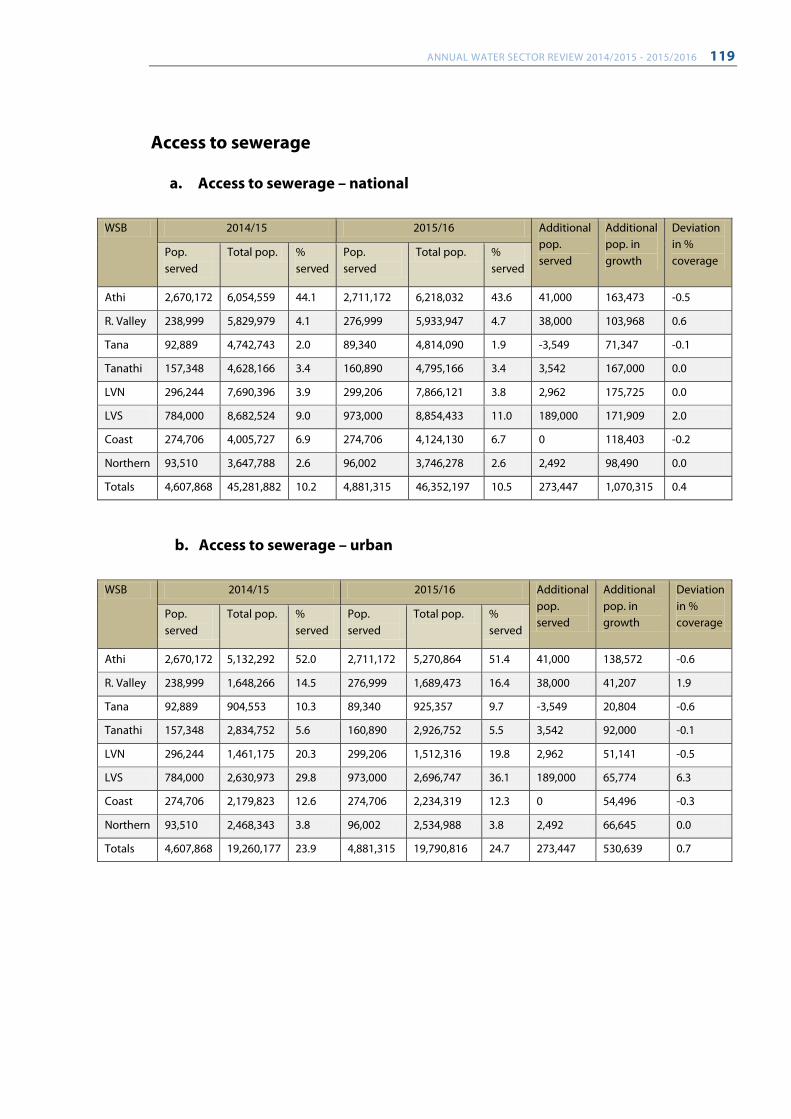
ANNUAL WATER SECTOR REVIEW 2014/2015 - 2015/2016 119
Access to sewerage
a. Access to sewerage – national
WSB 2014/15 2015/16 Additional pop. served
Additional pop. in growth
Deviation in % coverage
Pop. served
Total pop. % served
Pop. served
Total pop. % served
Athi 2,670,172 6,054,559 44.1 2,711,172 6,218,032 43.6 41,000 163,473 -0.5
R. Valley 238,999 5,829,979 4.1 276,999 5,933,947 4.7 38,000 103,968 0.6
Tana 92,889 4,742,743 2.0 89,340 4,814,090 1.9 -3,549 71,347 -0.1
Tanathi 157,348 4,628,166 3.4 160,890 4,795,166 3.4 3,542 167,000 0.0
LVN 296,244 7,690,396 3.9 299,206 7,866,121 3.8 2,962 175,725 0.0
LVS 784,000 8,682,524 9.0 973,000 8,854,433 11.0 189,000 171,909 2.0
Coast 274,706 4,005,727 6.9 274,706 4,124,130 6.7 0 118,403 -0.2
Northern 93,510 3,647,788 2.6 96,002 3,746,278 2.6 2,492 98,490 0.0
Totals 4,607,868 45,281,882 10.2 4,881,315 46,352,197 10.5 273,447 1,070,315 0.4
b. Access to sewerage – urban
WSB 2014/15 2015/16 Additional pop. served
Additional pop. in growth
Deviation in % coverage
Pop. served
Total pop. % served
Pop. served
Total pop. % served
Athi 2,670,172 5,132,292 52.0 2,711,172 5,270,864 51.4 41,000 138,572 -0.6
R. Valley 238,999 1,648,266 14.5 276,999 1,689,473 16.4 38,000 41,207 1.9
Tana 92,889 904,553 10.3 89,340 925,357 9.7 -3,549 20,804 -0.6
Tanathi 157,348 2,834,752 5.6 160,890 2,926,752 5.5 3,542 92,000 -0.1
LVN 296,244 1,461,175 20.3 299,206 1,512,316 19.8 2,962 51,141 -0.5
LVS 784,000 2,630,973 29.8 973,000 2,696,747 36.1 189,000 65,774 6.3
Coast 274,706 2,179,823 12.6 274,706 2,234,319 12.3 0 54,496 -0.3
Northern 93,510 2,468,343 3.8 96,002 2,534,988 3.8 2,492 66,645 0.0
Totals 4,607,868 19,260,177 23.9 4,881,315 19,790,816 24.7 273,447 530,639 0.7